iii working paper 18 - the transition to the knowledge ... · the transition to the knowledge...
TRANSCRIPT

The transition to the knowledge
economy, labour market
institutions, and income inequality
in advanced democracies
David Hope and Angelo Martelli
Working paper 18
November 2017
III Working paper 18 David Hope and Angelo Martelli
2
LSE International Inequalities Institute
The International Inequalities Institute (III) based at the London School of Economics
and Political Science (LSE) aims to be the world’s leading centre for interdisciplinary
research on inequalities and create real impact through policy solutions that tackle the
issue. The Institute provides a genuinely interdisciplinary forum unlike any other,
bringing together expertise from across the School and drawing on the thinking of
experts from every continent across the globe to produce high quality research and
innovation in the field of inequalities.
For further information on the work of the Institute, please contact the Institute
Manager, Liza Ryan at [email protected].
International Inequalities Institute
The London School of Economics and Political Science
Houghton Street
London
WC2A 2AE
Email: [email protected]
Web site: www.lse.ac.uk/III
@LSEInequalities
LSE Inequalities
© David Hope and Angelo Martelli. All rights reserved.
Short sections of text, not to exceed two paragraphs, may be quoted without explicit
permission provided that full credit, including notice, is given to the source.
III Working paper 18 David Hope and Angelo Martelli
3
Abstract
The transition from Fordism to the knowledge economy in the advanced democracies
was underpinned by the ICT revolution. The introduction and rapid diffusion of ICT
pushed up wages for college-educated workers with complementary skills and allowed
top managers and CEOs to reap greater rewards for their talents. Despite these
common pressures, income inequality did not rise to the same extent everywhere; the
Anglo-Saxon countries stand out as being particularly unequal. To shed new light on
this puzzle, we carry out a panel data analysis of 18 OECD countries between 1970
and 2007. The analysis stands apart from the existing empirical literature by taking a
comparative perspective. We look at the extent to which the relationship between the
knowledge economy and income inequality is influenced by national labour market
institutions. We find that the expansion of knowledge employment is positively
associated with both the 90–10 wage ratio and the income share of the top 1%, but
that these effects are mitigated by the presence of strong labour market institutions,
such as coordinated wage bargaining, strict employment protection legislation and
high bargaining coverage. The study provides robust evidence against the argument
that industrial relations systems are no longer important safeguards of wage solidarity
in the knowledge economy.
Keywords: knowledge economy, income inequality, labour market institutions,
industrial relations systems
III Working paper 18 David Hope and Angelo Martelli
4
1. Introduction The last forty years has seen a pervasive rise in income inequality across the
advanced democracies of Western Europe, North America and the Asia–Pacific region
(Kenworthy and Pontusson 2005; OECD 2011, 2015), especially at the very top of the
income distribution (Alvaredo et al. 2013; Atkinson, Piketty, and Saez 2011; Piketty
2014). This has occurred alongside major structural change, which has seen these
economies transition from Fordism—an economic system built around the mass
production and mass consumption of standardized consumer goods—to the
knowledge economy, where the service sectors dominate economic activity and
human capital is central to economic prosperity (Iversen and Soskice 2015; Wren
2013b).
The two phenomena are intimately linked. The information and communications
technology (ICT) revolution that underpinned the transition to the knowledge economy
increased the demand for college-educated workers with complementary skills, which
led to a rise in the wage premia for more educated workers (Acemoglu and Autor 2011;
Goldin and Katz 2008; Katz and Autor 1999). The ICT revolution and globalization also
allowed highly-talented managers, CEOs and entrepreneurs to apply their talent to a
much wider pool of resources and to reach a substantially larger audience than
possible in previous generations. The rapidly rising compensation of the top 1% in the
knowledge economy therefore reflects both the increasing complexity of their work
and their enhanced ability to reap the rewards of their talents (Brynjolfsson and
McAfee 2014; Kaplan and Rauh 2013; Mankiw 2013).
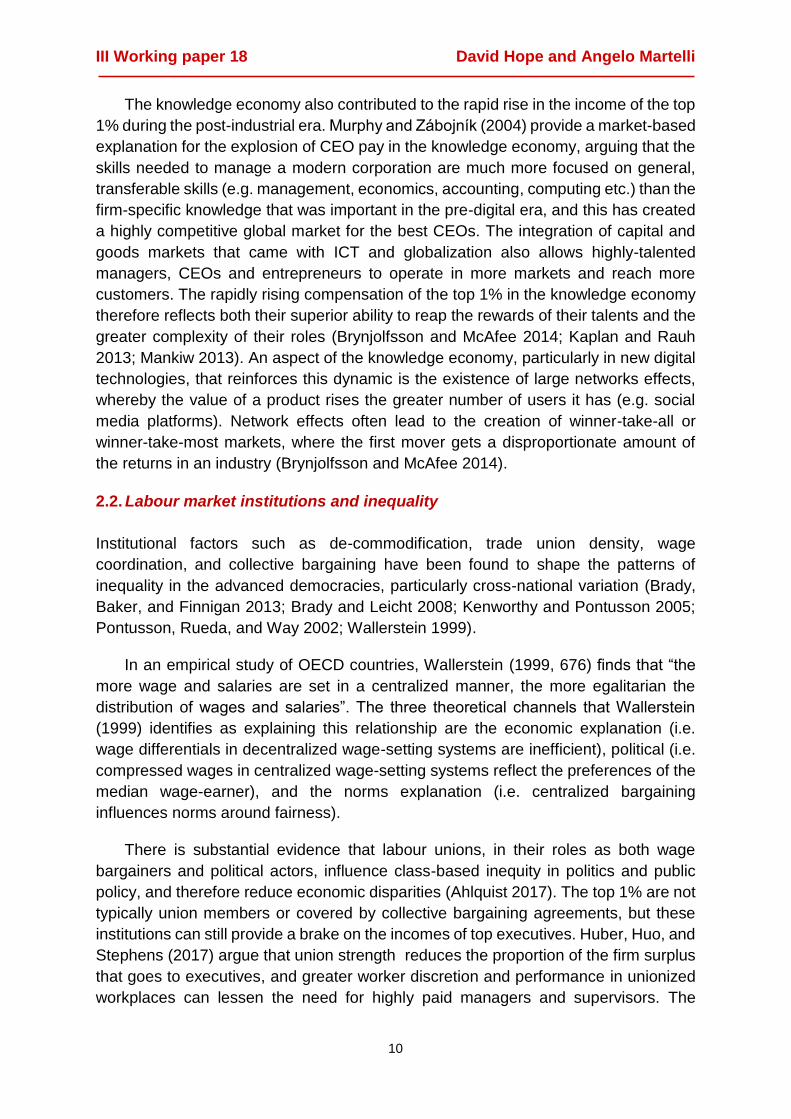
The transition to the knowledge economy began in earnest after the crisis of
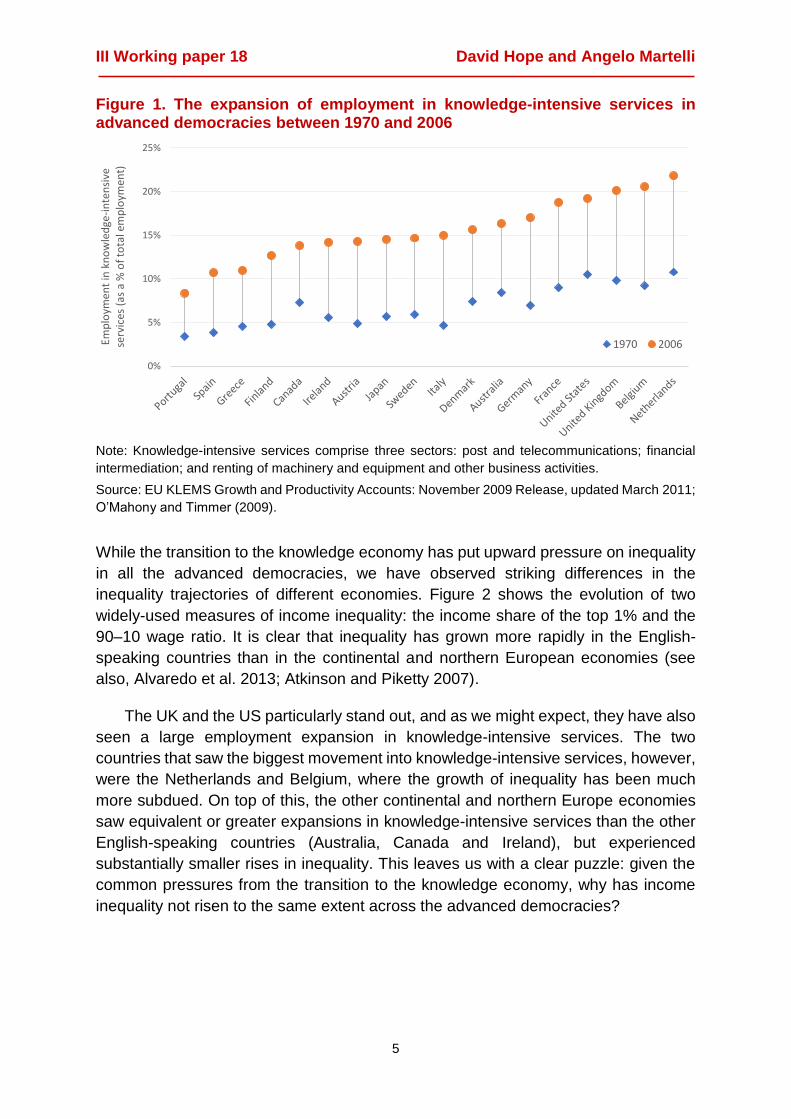
Fordism in the 1970s. Figure 1 shows the employment expansion in knowledge-
intensive service sectors between 1970 and 2006. Knowledge-intensive services
include finance, insurance, business services and telecommunications. These
‘dynamic service sectors’ have been selected by Wren (2013a, 13) as they are ICT
intensive, high productivity and increasingly traded internationally. The expansion of
knowledge-intensive services since 1970 is ubiquitous across the advanced
democracies and represents a substantial shift in economic structure.
III Working paper 18 David Hope and Angelo Martelli
5
Figure 1. The expansion of employment in knowledge-intensive services in advanced democracies between 1970 and 2006
Note: Knowledge-intensive services comprise three sectors: post and telecommunications; financial
intermediation; and renting of machinery and equipment and other business activities.
Source: EU KLEMS Growth and Productivity Accounts: November 2009 Release, updated March 2011;
O’Mahony and Timmer (2009).
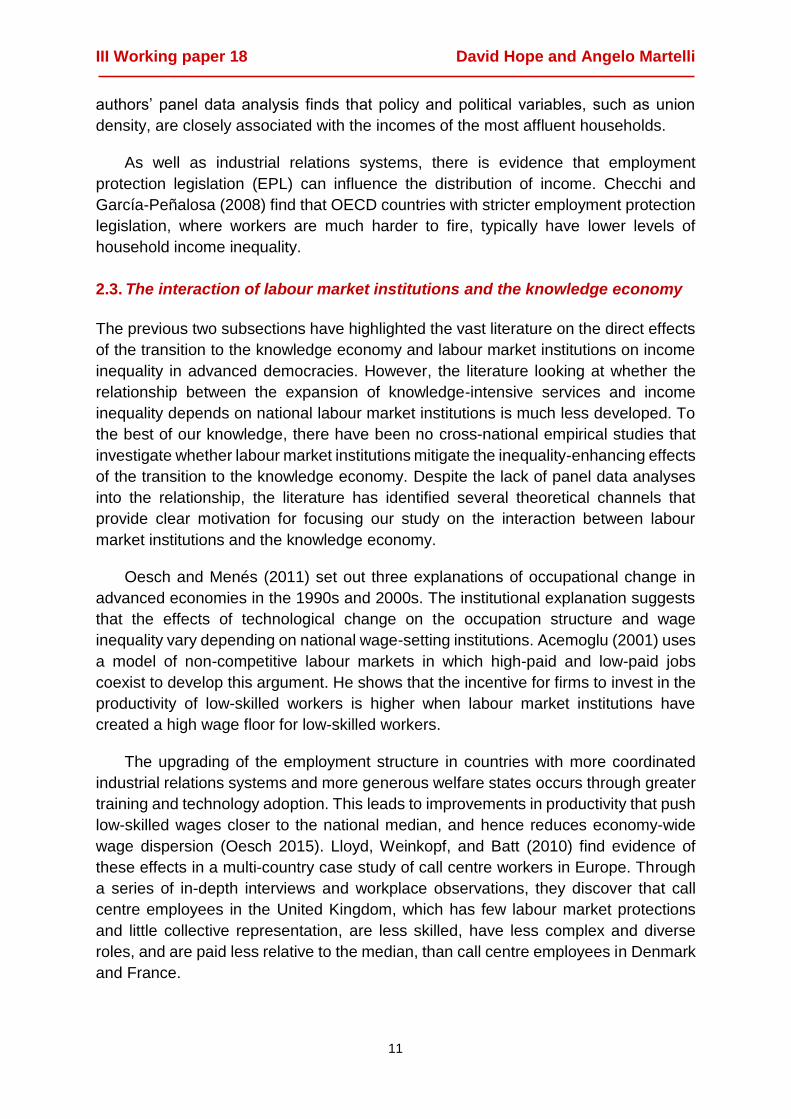
While the transition to the knowledge economy has put upward pressure on inequality
in all the advanced democracies, we have observed striking differences in the
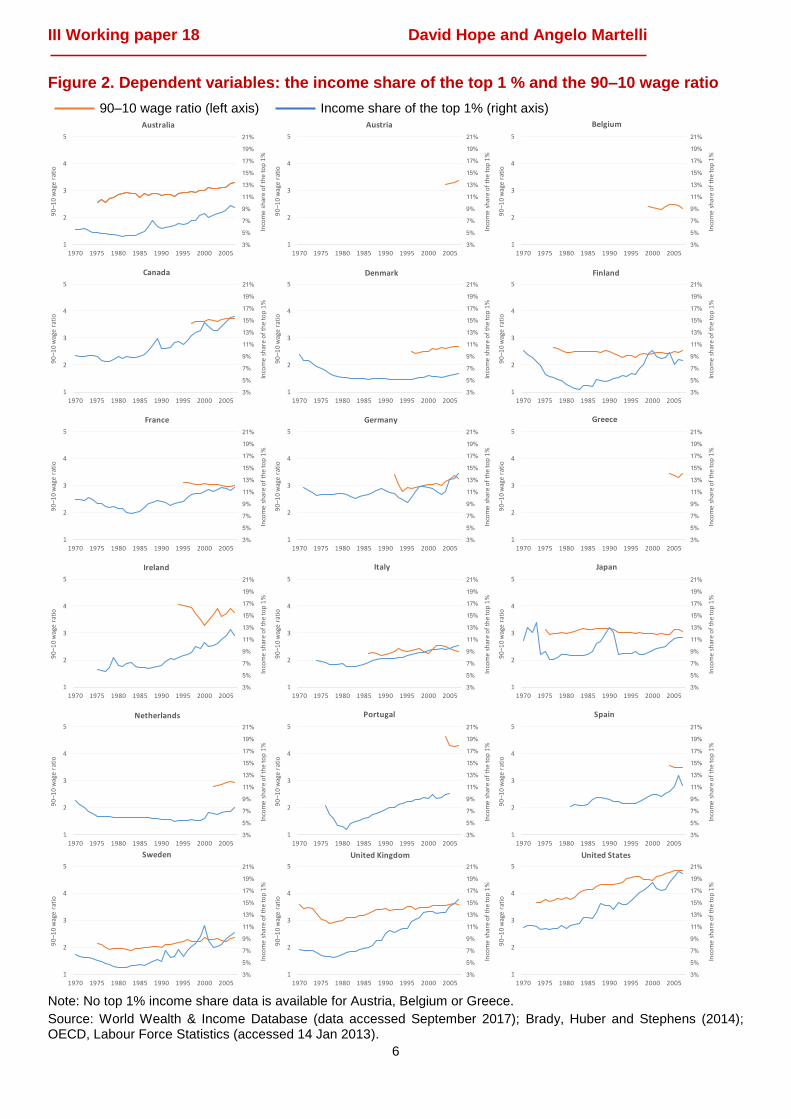
inequality trajectories of different economies. Figure 2 shows the evolution of two
widely-used measures of income inequality: the income share of the top 1% and the
90–10 wage ratio. It is clear that inequality has grown more rapidly in the English-
speaking countries than in the continental and northern European economies (see
also, Alvaredo et al. 2013; Atkinson and Piketty 2007).
The UK and the US particularly stand out, and as we might expect, they have also
seen a large employment expansion in knowledge-intensive services. The two
countries that saw the biggest movement into knowledge-intensive services, however,
were the Netherlands and Belgium, where the growth of inequality has been much
more subdued. On top of this, the other continental and northern Europe economies
saw equivalent or greater expansions in knowledge-intensive services than the other
English-speaking countries (Australia, Canada and Ireland), but experienced
substantially smaller rises in inequality. This leaves us with a clear puzzle: given the
common pressures from the transition to the knowledge economy, why has income
inequality not risen to the same extent across the advanced democracies?
0%
5%
10%
15%
20%
25%
Emp
loym
ent
in k
no
wle
dge
-in
ten
sive
se
rvic
es (
as a
% o
f to
tal e
mp
loym
ent)
1970 2006
III Working paper 18 David Hope and Angelo Martelli
6
Figure 2. Dependent variables: the income share of the top 1 % and the 90–10 wage ratio
90–10 wage ratio (left axis) Income share of the top 1% (right axis)
Note: No top 1% income share data is available for Austria, Belgium or Greece.
Source: World Wealth & Income Database (data accessed September 2017); Brady, Huber and Stephens (2014); OECD, Labour Force Statistics (accessed 14 Jan 2013).
III Working paper 18 David Hope and Angelo Martelli
7
Despite the wealth of theoretical and empirical evidence on how labour markets and
inequality have been affected by technological progress, there are only a few cross-
country empirical analyses that estimate the effects of the transition to the knowledge
economy on income inequality in the advanced democracies (Huber, Huo, and
Stephens 2017; Kwon and Roberts 2015; Kwon 2014; Rohrbach 2009). These studies
use a range of different measures of the knowledge economy and income inequality,
but typically find that the expansion of employment in knowledge-intensive sectors is
positively associated with income inequality.1 This emerging empirical literature has
advanced our understanding of the relationship between technological and structural
change and income inequality, but cannot account for why some advanced
democracies have managed to simultaneously expand employment in knowledge-
intensive services and maintain relatively high wage solidarity across the workforce,
while others have not.
The analysis in this paper aims to shed new light on this puzzle by taking a
comparative perspective. There is a large body of empirical work in comparative
political economy that finds that labour market institutions, such as coordinated wage
bargaining, trade unions and employment protection legislation, help restrain
dispersion in the distribution of income (Bradley et al. 2003; Checchi and Garcia 2010;
Martelli 2017; Pontusson 2005; Pontusson, Rueda, and Way 2002; Roberts and Kwon
2017; Rueda and Pontusson 2000; Wallerstein 1999). There has yet to be a cross-
country empirical study, however, that investigates whether labour market institutions
can diminish the effects of the transition to the knowledge economy on income
inequality.
We fill this gap in the literature by carrying out a panel data econometric analysis
using an unbalanced dataset that covers 18 OECD countries from 1970 to 2007. We
investigate whether the effect of the knowledge economy on inequality varies across
countries with different labour market institutions. The results show that the expansion
of dynamic services increases income inequality, but that this effect is mitigated by the
presence of coordinated wage setting, strict employment protection legislation, and
high bargaining coverage. In contrast, trade union density does not significantly affect
the relationship between knowledge employment and income inequality.
Our results show that industrial relations systems have played a significant part in
keeping income inequality in check in continental and northern Europe during the
transition to the knowledge economy. This stands in contrast to the recent comparative
political economy literature that argues that industrial relations systems have been
superseded by redistribution and education spending as the key safeguards against
income inequality in the knowledge economy (Iversen and Soskice 2015; Martin and
Thelen 2007; Thelen 2014).
1 The exception to this is Huber, Huo, and Stephens (2017), who find a significant negative effect of
knowledge-intensive services on top incomes. This finding and the issues around the measurement of
the knowledge economy will be discussed further in Section 3.
III Working paper 18 David Hope and Angelo Martelli
8
2. The knowledge economy, labour market institutions, and income inequality
The post-industrial era has been marked by a dramatic increase in income inequality
within the advanced democracies. The richest households in society have typically
pulled away from the rest (Alvaredo et al. 2013; Atkinson, Piketty, and Saez 2011;
Piketty 2014) and incomes have become more dispersed across the spectrum
(Kenworthy and Pontusson 2005; OECD 2011, 2015). Identifying the factors driving
income inequality has therefore been at the top of the agenda for many scholars and
policy makers, especially in the wake of the global financial crisis. A large theoretical
and empirical literature has identified many potential explanations for the changes
observed in inequality in the advanced democracies.
Goldin and Katz (2007, 2008) suggest that educational investment (i.e. the supply
of skills) has not kept pace with technological advancement (i.e. the demand for skills)
in the US, which has put upward pressure on the wages of skilled workers. Huber and
Stephens (2014) find evidence supporting the Goldin–Katz hypothesis in a wider panel
data analysis of OECD economies. The supply and demand of skills is likely to be less
important for explaining the diverging income of the top 1%, however, where tax policy,
changes in the bargaining power of managers and employees, the greater
individualisation of pay, and capital income are found to be more salient (Alvaredo et
al. 2013).
Other scholars have highlighted the rise in international trade liberalizations
(Milanovic and Squire 2005), finding that trade tariffs reductions led to increased
inequality. Cross-country studies on inequality and globalization have found that
measures of trade and capital account integration, such as southern import
penetration and outward investment flows, have significant positive effects on within-
country inequality, but are less pertinent to explaining cross-country differences
(Alderson and Nielsen 2002). Although, Lee, Nielsen, and Alderson (2007) find that
these globalization effects are mitigated in countries with larger public sectors.
The growth in financial sectors and the financial labour force has been identified
as another important driver of greater wage disparities and the concentration of
income in the most affluent households (Flaherty 2015; Godechot 2016; Jacob Assa
2012; Kus 2012). Summarising this literature, Kwon and Roberts (2017) argue that the
financialization of the advanced democracies shifted economic resources away from
rank-and-file production workers to financial workers and the households at the top of
the income distribution.
Despite the wide-ranging explanations put forward for changes in income
inequality, technological change and labour market institutions remain the two
dominant factors in the political economy literature (Autor, Levy, and Murnane 2003;
Iversen and Soskice 2015; Katz and Autor 1999; Pontusson, Rueda, and Way 2002;
Rueda and Pontusson 2000; Wallerstein 1999). These two factors are the focus of our
III Working paper 18 David Hope and Angelo Martelli
9
paper. In the remainder of the literature review, we look at the direct effects of
technological change and labour market institutions on income inequality, before
turning to the potential interaction effect between the two factors that is at the heart of
the empirical analysis in this paper.
2.1. The knowledge economy and inequality The advanced democracies have undergone a major technologically-driven structural
transformation since the 1970s. The Fordist system of the post-WWII era was built on
the dual pillars of mass production and mass consumption, and was supported by
collective bargaining, a generous welfare state, and Keynesian demand management
policies. This system collapsed under the weight of short-term factors, such as
industrial conflict and oil price shocks, and longer term factors, such as globalization,
de-unionization and technological change (Hope and Soskice 2016). The knowledge
economy that arose in its place is distinct from what went before in a number of ways.
Manufacturing has receded in importance and service sectors now dominate
economic activity. Complementarities in production between skilled and semi-skilled
workers have been replaced by complementarities between skilled workers and new
information and communications technologies. These changes have brought about a
huge increase in skill and education levels of big segments of the labour force,
facilitated through the rapid expansion of higher education (Iversen and Soskice
2015). The welfare state, collective bargaining and labour unions have generally
declined in importance over time, but there are still salient and theoretically interesting
differences in political–economic institutions among the advanced democracies in the
knowledge economy (Iversen and Soskice 2012; Pontusson 2005; Schneider and
Paunescu 2012).
The information and communication technology (ICT) revolution that underpinned
the transition to the knowledge economy has been found to be one a key driver behind
the upward trend of earnings inequality. Chen, Förster, and Llena-nozal (2013) carry
out a cross-national study into the drivers of inequality in OECD countries and find that
technological change (measured by ICT intensity, R&D expenditure and patents)
significantly widens wage dispersion and accounts for more of the within-country
variation in inequality than trade or financial factors.
The diffusion of ICT throughout the advanced democracies created a sharp upturn
in demand for college-educated workers, because their high-level, general skills are
complements in production to ICT. The additional demand for skilled workers that
came with these new technologies led to a rise in the relative wages of more educated
workers (Acemoglu and Autor 2011; Goldin and Katz 2008; Katz and Autor 1999). The
losers from technological change have typically been those workers in the middle of
the skill distribution, whose jobs focus on routine tasks that can be easily be replicated
by computers or machines (Autor and Dorn 2013; Autor, Katz, and Kearney 2006;
Autor, Levy, and Murnane 2003; Goos and Manning 2007; Goos, Manning, and
Salomons 2009, 2014; Michaels, Natraj, and Van Reenen 2014).
III Working paper 18 David Hope and Angelo Martelli
10
The knowledge economy also contributed to the rapid rise in the income of the top
1% during the post-industrial era. Murphy and Zabojnik (2004) provide a market-based
explanation for the explosion of CEO pay in the knowledge economy, arguing that the
skills needed to manage a modern corporation are much more focused on general,
transferable skills (e.g. management, economics, accounting, computing etc.) than the
firm-specific knowledge that was important in the pre-digital era, and this has created
a highly competitive global market for the best CEOs. The integration of capital and
goods markets that came with ICT and globalization also allows highly-talented
managers, CEOs and entrepreneurs to operate in more markets and reach more
customers. The rapidly rising compensation of the top 1% in the knowledge economy
therefore reflects both their superior ability to reap the rewards of their talents and the
greater complexity of their roles (Brynjolfsson and McAfee 2014; Kaplan and Rauh
2013; Mankiw 2013). An aspect of the knowledge economy, particularly in new digital
technologies, that reinforces this dynamic is the existence of large networks effects,
whereby the value of a product rises the greater number of users it has (e.g. social
media platforms). Network effects often lead to the creation of winner-take-all or
winner-take-most markets, where the first mover gets a disproportionate amount of
the returns in an industry (Brynjolfsson and McAfee 2014).
2.2. Labour market institutions and inequality
Institutional factors such as de-commodification, trade union density, wage
coordination, and collective bargaining have been found to shape the patterns of
inequality in the advanced democracies, particularly cross-national variation (Brady,
Baker, and Finnigan 2013; Brady and Leicht 2008; Kenworthy and Pontusson 2005;
Pontusson, Rueda, and Way 2002; Wallerstein 1999).
In an empirical study of OECD countries, Wallerstein (1999, 676) finds that “the
more wage and salaries are set in a centralized manner, the more egalitarian the
distribution of wages and salaries”. The three theoretical channels that Wallerstein
(1999) identifies as explaining this relationship are the economic explanation (i.e.
wage differentials in decentralized wage-setting systems are inefficient), political (i.e.
compressed wages in centralized wage-setting systems reflect the preferences of the
median wage-earner), and the norms explanation (i.e. centralized bargaining
influences norms around fairness).
There is substantial evidence that labour unions, in their roles as both wage
bargainers and political actors, influence class-based inequity in politics and public
policy, and therefore reduce economic disparities (Ahlquist 2017). The top 1% are not
typically union members or covered by collective bargaining agreements, but these
institutions can still provide a brake on the incomes of top executives. Huber, Huo, and
Stephens (2017) argue that union strength reduces the proportion of the firm surplus
that goes to executives, and greater worker discretion and performance in unionized
workplaces can lessen the need for highly paid managers and supervisors. The
III Working paper 18 David Hope and Angelo Martelli
11
authors’ panel data analysis finds that policy and political variables, such as union
density, are closely associated with the incomes of the most affluent households.
As well as industrial relations systems, there is evidence that employment
protection legislation (EPL) can influence the distribution of income. Checchi and
García-Peñalosa (2008) find that OECD countries with stricter employment protection
legislation, where workers are much harder to fire, typically have lower levels of
household income inequality.
2.3. The interaction of labour market institutions and the knowledge economy
The previous two subsections have highlighted the vast literature on the direct effects
of the transition to the knowledge economy and labour market institutions on income
inequality in advanced democracies. However, the literature looking at whether the
relationship between the expansion of knowledge-intensive services and income
inequality depends on national labour market institutions is much less developed. To
the best of our knowledge, there have been no cross-national empirical studies that
investigate whether labour market institutions mitigate the inequality-enhancing effects
of the transition to the knowledge economy. Despite the lack of panel data analyses
into the relationship, the literature has identified several theoretical channels that
provide clear motivation for focusing our study on the interaction between labour
market institutions and the knowledge economy.
Oesch and Menés (2011) set out three explanations of occupational change in
advanced economies in the 1990s and 2000s. The institutional explanation suggests
that the effects of technological change on the occupation structure and wage
inequality vary depending on national wage-setting institutions. Acemoglu (2001) uses
a model of non-competitive labour markets in which high-paid and low-paid jobs
coexist to develop this argument. He shows that the incentive for firms to invest in the
productivity of low-skilled workers is higher when labour market institutions have
created a high wage floor for low-skilled workers.
The upgrading of the employment structure in countries with more coordinated
industrial relations systems and more generous welfare states occurs through greater
training and technology adoption. This leads to improvements in productivity that push
low-skilled wages closer to the national median, and hence reduces economy-wide
wage dispersion (Oesch 2015). Lloyd, Weinkopf, and Batt (2010) find evidence of
these effects in a multi-country case study of call centre workers in Europe. Through
a series of in-depth interviews and workplace observations, they discover that call
centre employees in the United Kingdom, which has few labour market protections
and little collective representation, are less skilled, have less complex and diverse
roles, and are paid less relative to the median, than call centre employees in Denmark
and France.
III Working paper 18 David Hope and Angelo Martelli
12
EPL protects labour market insiders, those with secure employment often working
in core sectors of the economy (Rueda 2005). Martelli (2017) argues that EPL
insulates workers in the middle of the income distribution from the routinization
associated with technological change and finds evidence that EPL contains the wage
effects associated with job polarization.
Labour market institutions can also restrain the incomes of the most affluent
households in the knowledge economy. In liberal market economies, such as the
Anglo-Saxon economies, labour markets are largely deregulated, bargaining takes
place at the firm level, and managers have full discretion over hiring and firing. These
highly fluid labour markets provide employers with little incentive to make long-run
investments in training or employment (Hall and Soskice 2001). As liberal market
economies shifted further toward shareholder value maximization strategies with the
transition to the knowledge economy and the associated expansion of the financial
sector, this gave management a clear motivation to reduce costs and push up short-
term profitability through mass layoffs, outsourcing and cuts in the wages of rank-and-
file employees (Fligstein and Shin 2007; Lin and Tomaskovic-Devey 2013). This
dramatically changed the bargaining power between management and workers in
these economies, shifting compensation towards top managers and CEOs, whose
incomes were often tied into the value of corporate shares (Goldstein 2012). In
contrast, the more coordinated economies of continental Europe and Scandinavia did
not have labour market institutions or corporate governance structures conducive to
firm strategies centred on short-term profits, so were better able to rein in the incomes
of the richest in society (Roberts and Kwon 2017).
3. Data and measures Our empirical analysis uses an unbalanced panel dataset covering 18 OECD countries
from 1970 to 2007. The countries included in the sample—Australia, Austria, Belgium,
Canada, Denmark, Finland, France, Germany, Greece, Ireland, Italy, Japan, the
Netherlands, Portugal, Spain, Sweden, the UK and the US—vary markedly in their
industrial relations systems (Pontusson 2005), and more broadly, in the organization
of their political economies (Hall and Soskice 2001; Schneider and Paunescu 2012;
Thelen 2014).
3.1. Dependent variable
We use two measures of income inequality as our dependent variables. The first is
the income share of the top 1% from the World Wealth and Income Database
(Alvaredo et al. 2016). The second is the 90–10 wage ratio, which is the ratio of gross
earnings received by a worker at the 90th earnings percentile to that received by a
worker at the 10th percentile. This is taken from the OECD Labour Force Statistics
(Brady, Huber, and Stephens 2014). Both our income inequality measures are before
taxes and transfers (i.e. prior to government redistribution), which is appropriate for a
III Working paper 18 David Hope and Angelo Martelli
13
study looking at the effects of the knowledge economy and labour market institutions
on wage dispersion.
The income share of the top 1% and the 90–10 wage ratio have been used in
many previous cross-national studies on the determinants of income inequality (e.g.
Huber, Huo, and Stephens 2017; Roberts and Kwon 2017; Rueda and Pontusson
2000; Wallerstein 1999). We chose these measures as our dependent variables for
two reasons. First, they have superior data availability over other measures of income
inequality, especially over time, which is crucial for panel data analysis; and second,
they allow us to test the effects of our key independent variables on different parts of
the income distribution. The top 1% income share looks solely at the most affluent
people in society. It is calculated using tax returns, and because it avoids top coding,
it captures income growth at the very top of the income distribution much better than
traditional measures based on household surveys (Atkinson, Piketty, and Saez 2011).
In contrast, the 90–10 wage ratio better captures income inequality across the whole
workforce and is fairly closely correlated with other widely-used measures of
inequality, such as the Gini coefficient (Gottschalk and Smeeding 1997; Rueda and
Pontusson 2000). It has clear advantages over the Gini coefficient for our study,
however, as it is less liable to measurement error, because it does not incorporate the
hard to measure tails of the income distribution, and it is insensitive to “wage
differentials among observationally equivalent workers”, which is essential to
accurately estimate the effect of labour market institutions on income inequality
(Wallerstein 1999).
The data availability, and therefore the samples, vary slightly for the two
measures. The sample for the regression models using the top 1% income share
covers 15 countries (no data is available from the World Wealth and Income Database
for Austria, Belgium or Greece) and 541 country-year observations. The sample for
the regression models using the 90–10 wage ratio covers all 18 countries, but as this
measure typically has shorter time series, the sample only has 322 country-year
observations.
3.2. Key independent variables The previous studies that estimate the effects of the knowledge economy on income
inequality have used a range of different measures. Kwon and Roberts (2015) utilize
the International Labour Organization’s measure of knowledge employment (as a
percentage of the total labour force), which categorises workers based on their
occupations. Knowledge employees are the combination of managers, professionals,
technicians and associate professionals. In contrast, Rohrbach (2009) and Huber,
Huo, and Stephens (2017) construct measures of employment in knowledge sectors
(using OECD STAN and EUKLEMS data respectively) by adding up employment in
sectors they deem to be knowledge-intensive. The definitions chosen by these authors
differ. Rohrbach (2009) includes high-tech manufacturing industries in her definition,
whereas Huber, Huo, and Stephens (2017) focus solely on services. Huber, Huo, and
III Working paper 18 David Hope and Angelo Martelli
14
Stephens (2017) definition includes sectors that are traditionally dominated by
government provision, such as public administration, health and education.2
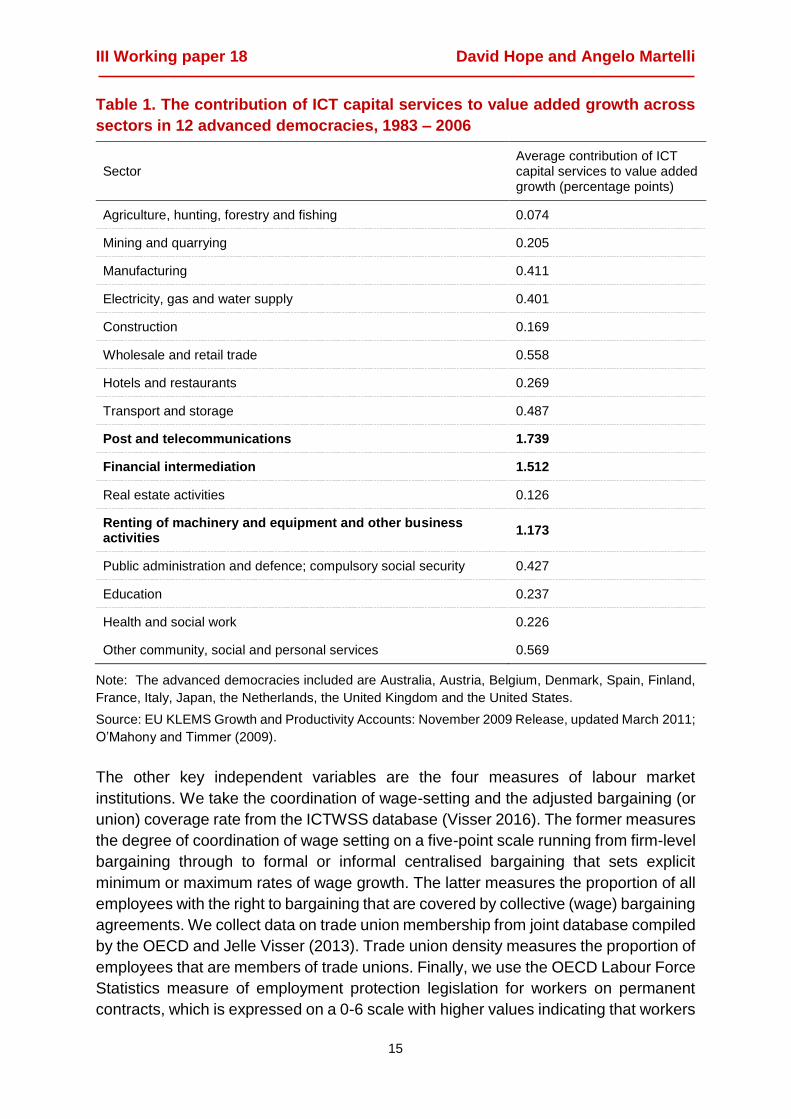
The measure of the knowledge economy used in our study follows Wren’s (2013a)
definition of dynamic services, which combines the sectors that have seen the greatest
diffusion of new information and communications technologies. Table 1 shows the
average contribution to value added growth of ICT capital services across sectors for
12 advanced democracies between 1983 and 2006. Three sectors stand out as having
significantly higher ICT contributions: post and telecommunications, financial
intermediation (covering finance and insurance), and renting of machinery and
equipment and other business activities (which is dominated by business services
such as legal, technical, computer, and advertising services). Our measure of
knowledge-intensive services adds up employment in these three sectors and
expresses it as a percentage of total employment.
Our knowledge-intensive service sectors have other characteristics that set them
apart from the other service sectors. Wren (2013a) finds that they typically have higher
productivity growth and are more likely to be traded internationally. This is no
coincidence. The ICT revolution has drastically reduced the cost of performing routine
programmable tasks (Nordhaus 2007), which has pushed up productivity in ICT-
intensive sectors (Dahl, Kongsted, and Sørensen 2011; Spiezia 2012; Stiroh 2002). It
has also lowered many of the technical barriers to trade in services, because digitized
information can be almost costlessly stored and transported across the globe (Choi
2010; Freund and Weinhold 2002).
We believe Wren’s (2013a) measure of the knowledge employment is superior to
the measures used in the previous panel data studies on the determinants of income
inequality for three main reasons. First, these sectors have seen dramatic employment
expansion across the advanced democracies since the collapse of the Fordist system
(see Figure 1). Second, the knowledge-intensive sectors are selected through a
transparent data-driven procedure (see Table 1). Lastly, the theoretical and empirical
literature summarised in the previous section identifies ICT as the central mechanism
that connects the transition to the knowledge economy to changes in the income
distribution (e.g. Acemoglu and Autor 2011; Goos, Manning, and Salomons 2014;
Michaels, Natraj, and Van Reenen 2014).
2 This is likely why Huber, Huo, and Stephens (2017) find a negative effect of knowledge employment
on income inequality, which contrasts with the other studies (Kwon and Roberts 2015; Roy Kwon 2016;
Rohrbach 2009), because the empirical literature suggests that greater public sector employment can
reduce income inequality, especially in coordinated market economies (Pontusson 2005; Pontusson,
Rueda, and Way 2002; Rueda and Pontusson 2000).
III Working paper 18 David Hope and Angelo Martelli
15
Table 1. The contribution of ICT capital services to value added growth across
sectors in 12 advanced democracies, 1983 – 2006
Sector Average contribution of ICT capital services to value added growth (percentage points)
Agriculture, hunting, forestry and fishing 0.074
Mining and quarrying 0.205
Manufacturing 0.411
Electricity, gas and water supply 0.401
Construction 0.169
Wholesale and retail trade 0.558
Hotels and restaurants 0.269
Transport and storage 0.487
Post and telecommunications 1.739
Financial intermediation 1.512
Real estate activities 0.126
Renting of machinery and equipment and other business activities
1.173
Public administration and defence; compulsory social security 0.427
Education 0.237
Health and social work 0.226
Other community, social and personal services 0.569
Note: The advanced democracies included are Australia, Austria, Belgium, Denmark, Spain, Finland,
France, Italy, Japan, the Netherlands, the United Kingdom and the United States.
Source: EU KLEMS Growth and Productivity Accounts: November 2009 Release, updated March 2011;
O’Mahony and Timmer (2009).
The other key independent variables are the four measures of labour market
institutions. We take the coordination of wage-setting and the adjusted bargaining (or
union) coverage rate from the ICTWSS database (Visser 2016). The former measures
the degree of coordination of wage setting on a five-point scale running from firm-level
bargaining through to formal or informal centralised bargaining that sets explicit
minimum or maximum rates of wage growth. The latter measures the proportion of all
employees with the right to bargaining that are covered by collective (wage) bargaining
agreements. We collect data on trade union membership from joint database compiled
by the OECD and Jelle Visser (2013). Trade union density measures the proportion of
employees that are members of trade unions. Finally, we use the OECD Labour Force
Statistics measure of employment protection legislation for workers on permanent
contracts, which is expressed on a 0-6 scale with higher values indicating that workers
III Working paper 18 David Hope and Angelo Martelli
16
are harder to dismiss. Previous cross-country comparative studies have found that
these labour market institutions reduce wage dispersion in the advanced democracies,
both below the 90th percentile (Checchi and García-Peñalosa 2008; Kwon and Roberts
forthcoming; Martelli 2017; Pontusson, Rueda, and Way 2002; Roberts and Kwon
2017; Wallerstein 1999) and between the top 1% and the rest (Flaherty 2015; Huber,
Huo, and Stephens 2017; Roberts and Kwon 2017).
3.3. Control variables
In our models with controls, we include a selection of additional variables that have
been found to be drivers of income inequality in the theoretical and empirical literature.
The variables cover the broad areas of education, partisanship, financialization,
globalization and the economy.
Goldin and Katz (2007, 2008) argue that the post-industrial era in the United
States has been marked by both a rise in the demand for higher education and a
slowdown in educational expansion. The excess demand for educated labour created
by education losing the race against technology creates upward pressure on the
wages of more educated workers. The Goldin–Katz hypothesis has been found to hold
across the advanced democracies (Huber and Stephens 2014). We include two
measures of education in our analysis to account for both the expenditure on
education and the human capital of the workforce. The first is education expenditure
as a percentage of gross national income from the World Bank Development
Indicators, and the second is the human capital index from the Penn World Tables
(Feenstra, Inklaar, and Timmer 2015).
The partisanship variable we use is the share of parliamentary seats of secular
parties of the centre and right as a proportional of all seats of the governing parties.
The measure is cumulative since 1946 until the year of observation, and hence, higher
values indicate the prolonged incumbency of these parties. Huber, Huo, and Stephens
(2017) and Brady and Leicht (2008) find that right party power drives up income
inequality.
Many panel data studies find that higher levels of financialization are associated
with greater income inequality in the advanced democracies (Flaherty 2015; Godechot
2016; Kus 2012; Roberts and Kwon 2017). Finance is one of the sub-sectors within
our measure of knowledge-intensive services (see Section 3.2). To ensure that
financialization is not driving our main results, we therefore control for stock market
capitalisation as a percentage of GDP (from Roine, Vlachos, and Waldenström 2009)
and private credit as a percentage of GDP (from the Financial Development and
Structure Dataset; Beck, Demirgüç-Kunt, and Levine 2000, 2009; Čihak et al. 2012).
These measures control for aspects of the growth of the financial sector over the post-
Fordist era that affect inequality through different channels to those hypothesised for
the broader knowledge-intensive services sector (as set out in the literature review),
III Working paper 18 David Hope and Angelo Martelli
17
such as the increased use of stock options in the compensation packages of top
managers and CEOs and the dramatic rise in household borrowing.
Another secular trend that has taken place alongside the transition to the
knowledge economy is globalization. Goods and capital markets have become
considerably more integrated over time, which has had knock on effects for inequality.
We control for three different aspects of globalization: exposure to trade, outward
investment flows and import competition from China. Exposure to trade is measured
by total trade (exports plus imports) as a percentage of GDP and is taken from the
OECD Annual National Accounts. It is common to control for trade openness in cross-
country studies into the determinants of income inequality (Huber, Huo, and Stephens
2017; Huber and Stephens 2014). Investment outflows are measured by outward
foreign direct investment as a percentage of GDP. Alderson and Nielsen (2002) and
Lee, Nielsen, and Alderson (2007) find that higher outward investment flows lead to
greater income inequality. The rise of China as a global exporting powerhouse has
been one of the major features of the post-industrial era. Empirical studies have found
that Chinese import competition has adverse consequences on labour markets and is
positively associated with income inequality in the advanced democracies (Autor,
Dorn, and Hanson 2013; Van Reenen 2011; Thewissen and van Vliet 2017). We
measure Chinese import penetration by the value of manufactured goods (SITC Rev
1. 5-8) imports from China as a percentage of GDP (calculated using data from the
UN COMTRADE database and the OECD National Accounts).
Lastly, we control for conditions in the labour market using the unemployment rate
as a percentage of the civilian labour force (from the OECD Labour Force Statistics)
and for the level of economic development using GDP per head at current prices and
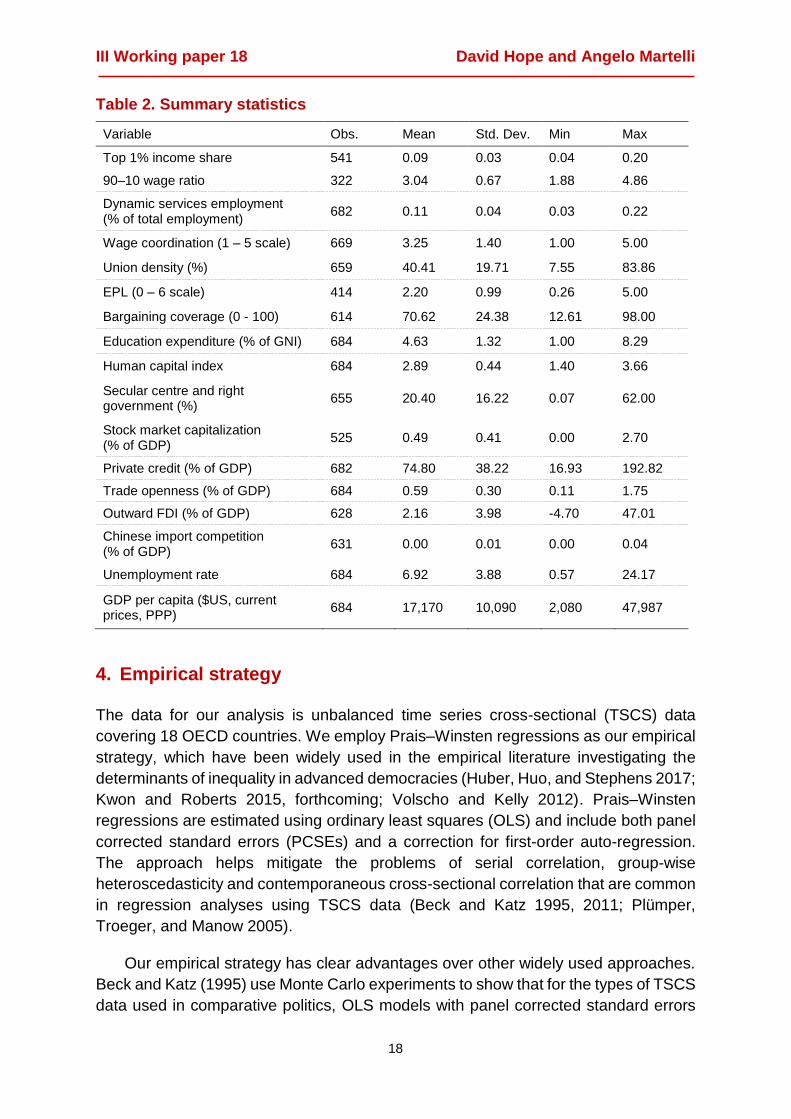
current PPPs (from the OECD Annual National Accounts). The summary statistics for
the two dependent variables, the key independent variables and the control variables
are shown in Table 2 (for a complete list of variable definitions and sources, see Table
A1 in the Appendix). The small amount of missing values across the dataset have
been linearly interpolated.
III Working paper 18 David Hope and Angelo Martelli
18
Table 2. Summary statistics
Variable Obs. Mean Std. Dev. Min Max
Top 1% income share 541 0.09 0.03 0.04 0.20
90–10 wage ratio 322 3.04 0.67 1.88 4.86
Dynamic services employment (% of total employment)
682 0.11 0.04 0.03 0.22
Wage coordination (1 – 5 scale) 669 3.25 1.40 1.00 5.00
Union density (%) 659 40.41 19.71 7.55 83.86
EPL (0 – 6 scale) 414 2.20 0.99 0.26 5.00
Bargaining coverage (0 - 100) 614 70.62 24.38 12.61 98.00
Education expenditure (% of GNI) 684 4.63 1.32 1.00 8.29
Human capital index 684 2.89 0.44 1.40 3.66
Secular centre and right government (%)
655 20.40 16.22 0.07 62.00
Stock market capitalization (% of GDP)
525 0.49 0.41 0.00 2.70
Private credit (% of GDP) 682 74.80 38.22 16.93 192.82
Trade openness (% of GDP) 684 0.59 0.30 0.11 1.75
Outward FDI (% of GDP) 628 2.16 3.98 -4.70 47.01
Chinese import competition (% of GDP)
631 0.00 0.01 0.00 0.04
Unemployment rate 684 6.92 3.88 0.57 24.17
GDP per capita ($US, current prices, PPP)
684 17,170 10,090 2,080 47,987
4. Empirical strategy
The data for our analysis is unbalanced time series cross-sectional (TSCS) data
covering 18 OECD countries. We employ Prais–Winsten regressions as our empirical
strategy, which have been widely used in the empirical literature investigating the
determinants of inequality in advanced democracies (Huber, Huo, and Stephens 2017;
Kwon and Roberts 2015, forthcoming; Volscho and Kelly 2012). Prais–Winsten
regressions are estimated using ordinary least squares (OLS) and include both panel
corrected standard errors (PCSEs) and a correction for first-order auto-regression.
The approach helps mitigate the problems of serial correlation, group-wise
heteroscedasticity and contemporaneous cross-sectional correlation that are common
in regression analyses using TSCS data (Beck and Katz 1995, 2011; Plümper,
Troeger, and Manow 2005).
Our empirical strategy has clear advantages over other widely used approaches.
Beck and Katz (1995) use Monte Carlo experiments to show that for the types of TSCS
data used in comparative politics, OLS models with panel corrected standard errors
III Working paper 18 David Hope and Angelo Martelli
19
provide more accurate estimates of standard errors than feasible generalized least
squares estimation, and entail little loss of efficiency. We deal with serial correlation
by including a correction for first-order autocorrelation, which is preferable to the
alternative approach of adding a lagged dependent variable, which would absorb
much of substantively interesting variation in our TSCS data and risk biasing the
coefficient estimates on our main independent variables (Huber, Huo, and Stephens
2017; Plümper, Troeger, and Manow 2005).
Given that our unit of analysis in our TSCS data is countries, we also include
country fixed effects in our regressions, which control for unobserved, time-invariant,
country-specific factors that influence inequality. Country fixed effects help guard
against omitted variable bias and are commonly employed in Prais–Winsten
regression models (Huber, Huo, and Stephens 2017; Kwon and Roberts forthcoming).
For the reasons outlined, we believe our empirical strategy is the most appropriate for
our TSCS data, but as a robustness check, alternative specifications are also tested.
Tables A2 to A4 in the Appendix shows the results of Prais-Winsten regressions with
country fixed effects and decade dummies, as well as fixed and random effects
estimators.
The equations estimated in the empirical analysis are:
(1) 𝑦𝑖𝑡 = 𝛽0 + 𝛽1𝑋𝑖𝑡 + 𝛽2𝑊𝑖𝑡 + 𝛽3𝑋𝑖𝑡 ∗ 𝑊𝑖𝑡 +𝛿𝑖 + 휀𝑖𝑡
(2) 𝑦𝑖𝑡 = 𝛽0 + 𝛽1𝑋𝑖𝑡 + 𝛽2𝑊𝑖𝑡 + 𝛽3𝑋𝑖𝑡 ∗ 𝑊𝑖𝑡 +∑𝛽𝑘 𝑍𝑖𝑡𝑘 + 𝛿𝑖 + 휀𝑖𝑡.
In both sets of models, yit refers to our measures in income inequality: the income
share of the top 1% and the 90–10 wage ratio. The main independent variables in the
analysis are 𝑋𝑖𝑡, the share of total employment in knowledge-intensive services, and
𝑊𝑖𝑡, our measures of labour market institutions. The interaction of our main
independent variables, 𝑋𝑖𝑡 ∗ 𝑊𝑖𝑡, is crucial for testing the main hypotheses of the paper.
Our four labour market institutions are tested in separate regression models; all of
which also include country-fixed effects, 𝛿𝑖, and an intercept term, 𝛽0. The second set
of models also include a vector of 𝑘 control variables, represented by 𝑍𝑖𝑡𝑘.
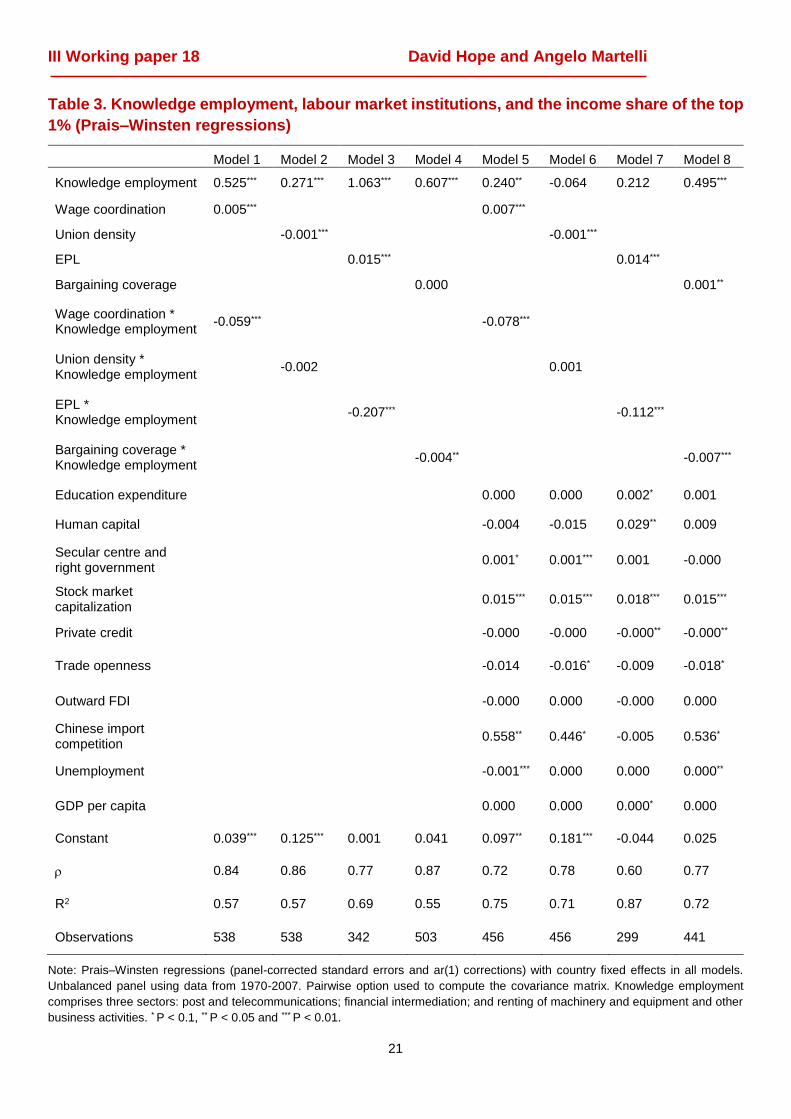
5. Results The results for the top 1% income share are shown in Table 3. Models 1 to 4 show the
results from the baseline regressions, which simply include our main independent
variables and an interaction term, as well as country-fixed effects. In all four models,
knowledge employment is positively associated with the income share of the top 1%
and significant at the 99% level. The interaction effects between knowledge
employment and the four labour market institutions are all negative, but the effects are
only statistically significant for wage coordination, employment protection legislation
and bargaining coverage (but not union density). The baseline results tentatively
III Working paper 18 David Hope and Angelo Martelli
20
support the hypothesis that the presence of strong labour market institutions reduces
the effect of the transition to the knowledge economy on top incomes shares.
Models 5 to 8 in Table 3 introduce a full set of control variables. These models
take account of other important drivers of inequality, covering human capital,
government partisanship, financialization, globalization, and the state of the economy.
The results show that the effects of the expansion of knowledge employment on the
income share of the top 1% is conditional on the strength of labour market institutions.
The interaction effects for all the labour market institutions aside from union density
are significant, negative, and of a similar magnitude to the baseline regressions. Only
two of the control variables are statistically significant across three or more of the
models: stock market capitalization and Chinese import competition.
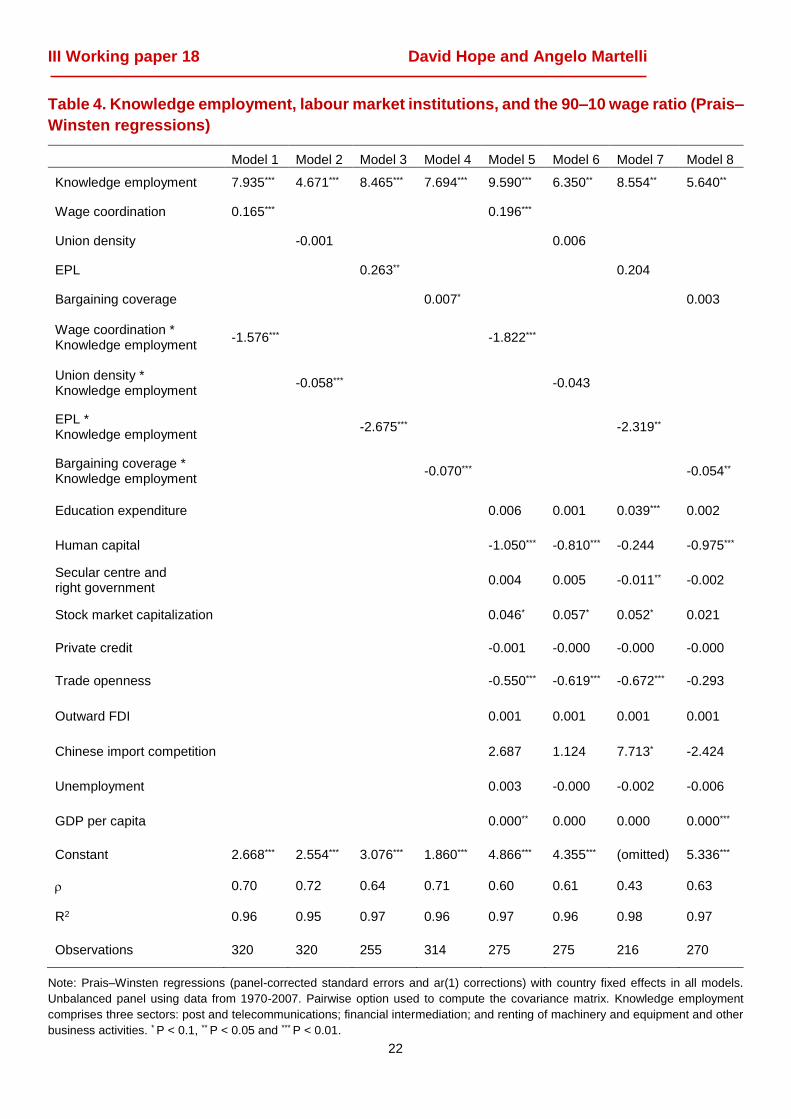
The results in Table 4 show the same eight regression models, but with the 90–
10 wage ratio as the dependent variable. The same patterns emerge for the main
independent variables. In all eight regression models, knowledge employment is
positively associated with the 90–10 wage ratio and highly statistically significant. The
interaction effects are also negative and significant in the baseline models and the
models with controls for wage coordination, employment protection legislation and
bargaining coverage. Table 4 therefore provides evidence that the presence of strong
labour market institutions helps mitigate the wage dispersion across the labour force
that comes with the transition to the knowledge economy.
From Models 5 to 8 in Table 4, we can see that different control variables exert
consistent, statistically significant effects on the 90–10 wage ratio than did on the
income share of the top 1%. Human capital and trade openness are both consistently
negatively associated with the 90–10 wage ratio.
III Working paper 18 David Hope and Angelo Martelli
21
Table 3. Knowledge employment, labour market institutions, and the income share of the top
1% (Prais–Winsten regressions)
Model 1 Model 2 Model 3 Model 4 Model 5 Model 6 Model 7 Model 8
Knowledge employment 0.525*** 0.271*** 1.063*** 0.607*** 0.240** -0.064 0.212 0.495***
Wage coordination 0.005*** 0.007***
Union density -0.001*** -0.001***
EPL 0.015*** 0.014***
Bargaining coverage
0.000 0.001**
Wage coordination * Knowledge employment
-0.059***
-0.078***
Union density * Knowledge employment
-0.002
0.001
EPL * Knowledge employment
-0.207***
-0.112***
Bargaining coverage * Knowledge employment
-0.004**
-0.007***
Education expenditure 0.000 0.000 0.002* 0.001
Human capital -0.004 -0.015 0.029** 0.009
Secular centre and right government
0.001* 0.001*** 0.001 -0.000
Stock market capitalization
0.015*** 0.015*** 0.018*** 0.015***
Private credit -0.000 -0.000 -0.000** -0.000**
Trade openness -0.014 -0.016* -0.009 -0.018*
Outward FDI -0.000 0.000 -0.000 0.000
Chinese import competition
0.558** 0.446* -0.005 0.536*
Unemployment -0.001*** 0.000 0.000 0.000**
GDP per capita 0.000 0.000 0.000* 0.000
Constant 0.039*** 0.125*** 0.001 0.041 0.097** 0.181*** -0.044 0.025
0.84 0.86 0.77 0.87 0.72 0.78 0.60 0.77
R2 0.57 0.57 0.69 0.55 0.75 0.71 0.87 0.72
Observations 538 538 342 503 456 456 299 441
Note: Prais–Winsten regressions (panel-corrected standard errors and ar(1) corrections) with country fixed effects in all models.
Unbalanced panel using data from 1970-2007. Pairwise option used to compute the covariance matrix. Knowledge employment
comprises three sectors: post and telecommunications; financial intermediation; and renting of machinery and equipment and other
business activities. * P < 0.1, ** P < 0.05 and *** P < 0.01.
III Working paper 18 David Hope and Angelo Martelli
22
Table 4. Knowledge employment, labour market institutions, and the 90–10 wage ratio (Prais–
Winsten regressions)
Model 1 Model 2 Model 3 Model 4 Model 5 Model 6 Model 7 Model 8
Knowledge employment 7.935*** 4.671*** 8.465*** 7.694*** 9.590*** 6.350** 8.554** 5.640**
Wage coordination 0.165***
0.196***
Union density
-0.001
0.006
EPL 0.263**
0.204
Bargaining coverage 0.007*
0.003
Wage coordination * Knowledge employment
-1.576*** -1.822***
Union density * Knowledge employment
-0.058***
-0.043
EPL * Knowledge employment
-2.675***
-2.319**
Bargaining coverage * Knowledge employment
-0.070***
-0.054**
Education expenditure 0.006 0.001 0.039*** 0.002
Human capital -1.050*** -0.810*** -0.244 -0.975***
Secular centre and right government
0.004 0.005 -0.011** -0.002
Stock market capitalization 0.046* 0.057* 0.052* 0.021
Private credit -0.001 -0.000 -0.000 -0.000
Trade openness -0.550*** -0.619*** -0.672*** -0.293
Outward FDI 0.001 0.001 0.001 0.001
Chinese import competition 2.687 1.124 7.713* -2.424
Unemployment 0.003 -0.000 -0.002 -0.006
GDP per capita 0.000** 0.000 0.000 0.000***
Constant 2.668*** 2.554*** 3.076*** 1.860*** 4.866*** 4.355*** (omitted) 5.336***
0.70 0.72 0.64 0.71 0.60 0.61 0.43 0.63
R2 0.96 0.95 0.97 0.96 0.97 0.96 0.98 0.97
Observations 320 320 255 314 275 275 216 270
Note: Prais–Winsten regressions (panel-corrected standard errors and ar(1) corrections) with country fixed effects in all models.
Unbalanced panel using data from 1970-2007. Pairwise option used to compute the covariance matrix. Knowledge employment
comprises three sectors: post and telecommunications; financial intermediation; and renting of machinery and equipment and other
business activities. * P < 0.1, ** P < 0.05 and *** P < 0.01.
III Working paper 18 David Hope and Angelo Martelli
23
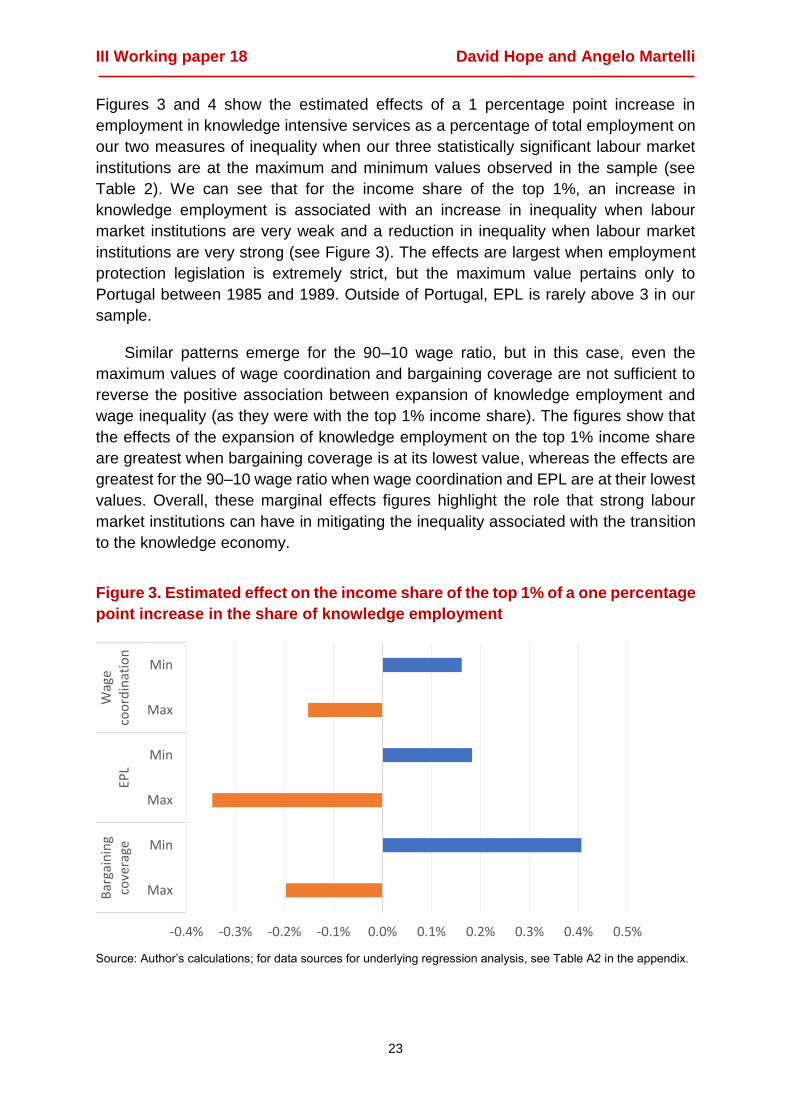
Figures 3 and 4 show the estimated effects of a 1 percentage point increase in
employment in knowledge intensive services as a percentage of total employment on
our two measures of inequality when our three statistically significant labour market
institutions are at the maximum and minimum values observed in the sample (see
Table 2). We can see that for the income share of the top 1%, an increase in
knowledge employment is associated with an increase in inequality when labour
market institutions are very weak and a reduction in inequality when labour market
institutions are very strong (see Figure 3). The effects are largest when employment
protection legislation is extremely strict, but the maximum value pertains only to
Portugal between 1985 and 1989. Outside of Portugal, EPL is rarely above 3 in our
sample.
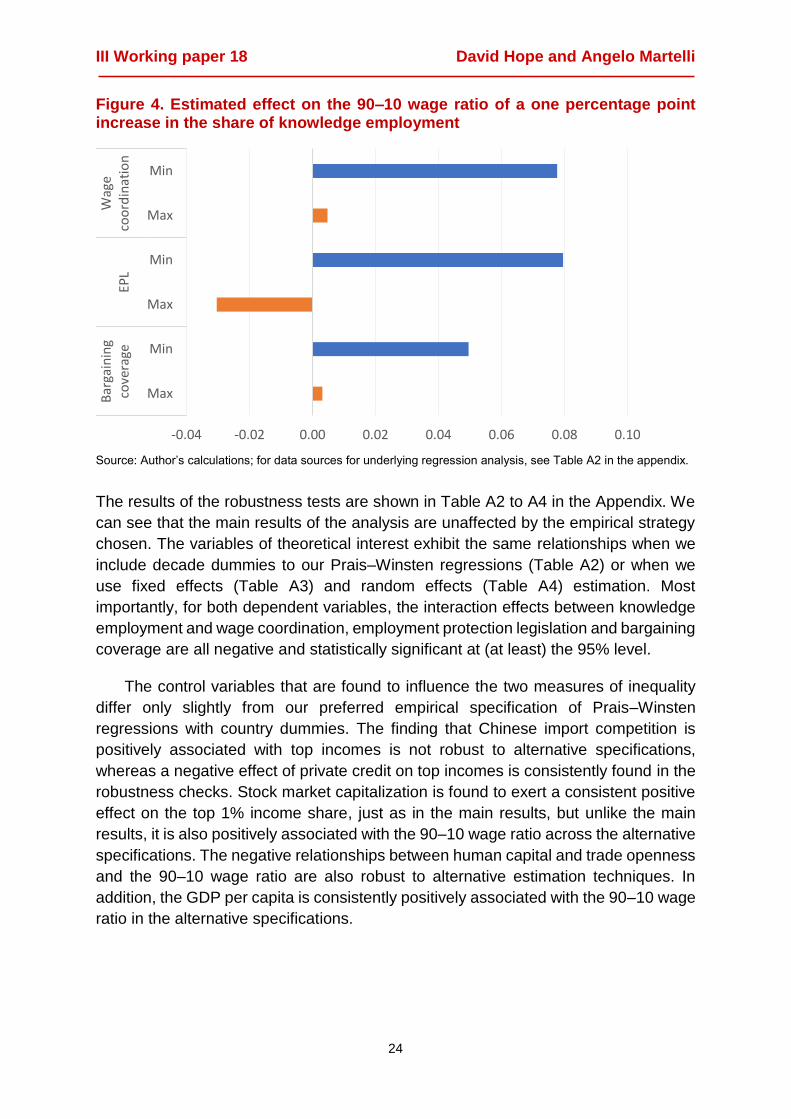
Similar patterns emerge for the 90–10 wage ratio, but in this case, even the
maximum values of wage coordination and bargaining coverage are not sufficient to
reverse the positive association between expansion of knowledge employment and
wage inequality (as they were with the top 1% income share). The figures show that
the effects of the expansion of knowledge employment on the top 1% income share
are greatest when bargaining coverage is at its lowest value, whereas the effects are
greatest for the 90–10 wage ratio when wage coordination and EPL are at their lowest
values. Overall, these marginal effects figures highlight the role that strong labour
market institutions can have in mitigating the inequality associated with the transition
to the knowledge economy.
Figure 3. Estimated effect on the income share of the top 1% of a one percentage
point increase in the share of knowledge employment
Source: Author’s calculations; for data sources for underlying regression analysis, see Table A2 in the appendix.
-0.4% -0.3% -0.2% -0.1% 0.0% 0.1% 0.2% 0.3% 0.4% 0.5%
Max
Min
Max
Min
Max
Min
Bar
gain
ing
cove
rage
EPL
Wag
eco
ord
inat
ion
III Working paper 18 David Hope and Angelo Martelli
24
Figure 4. Estimated effect on the 90–10 wage ratio of a one percentage point increase in the share of knowledge employment
Source: Author’s calculations; for data sources for underlying regression analysis, see Table A2 in the appendix.
The results of the robustness tests are shown in Table A2 to A4 in the Appendix. We
can see that the main results of the analysis are unaffected by the empirical strategy
chosen. The variables of theoretical interest exhibit the same relationships when we
include decade dummies to our Prais–Winsten regressions (Table A2) or when we
use fixed effects (Table A3) and random effects (Table A4) estimation. Most
importantly, for both dependent variables, the interaction effects between knowledge
employment and wage coordination, employment protection legislation and bargaining
coverage are all negative and statistically significant at (at least) the 95% level.
The control variables that are found to influence the two measures of inequality
differ only slightly from our preferred empirical specification of Prais–Winsten
regressions with country dummies. The finding that Chinese import competition is
positively associated with top incomes is not robust to alternative specifications,
whereas a negative effect of private credit on top incomes is consistently found in the
robustness checks. Stock market capitalization is found to exert a consistent positive
effect on the top 1% income share, just as in the main results, but unlike the main
results, it is also positively associated with the 90–10 wage ratio across the alternative
specifications. The negative relationships between human capital and trade openness
and the 90–10 wage ratio are also robust to alternative estimation techniques. In
addition, the GDP per capita is consistently positively associated with the 90–10 wage
ratio in the alternative specifications.
-0.04 -0.02 0.00 0.02 0.04 0.06 0.08 0.10
Max
Min
Max
Min
Max
Min
Bar
gain
ing
cove
rage
EPL
Wag
eco
ord
inat
ion
III Working paper 18 David Hope and Angelo Martelli
25
6. Discussion and conclusion
The ICT revolution and the transition to the knowledge economy in the advanced
democracies has created winners and losers. Workers with university education and
the most affluent households have reaped much of the gains, often at the expense of
those workers lower down the income distribution with jobs that can be easily
substituted by machines and computers. The dominant narrative in the emerging
comparative political economy literature on the knowledge economy is that the
complementarities between skilled and semi-skilled workers that underpinned
industrial relations systems in the Fordist era have been so undermined by the ICT
revolution that strong labour market institutions are no longer the main guarantor of
wage solidarity across the labour force (Iversen and Soskice 2015; Martin and Thelen
2007; Thelen 2014).
Our empirical analysis of 18 advanced democracies between 1970 and 2007
challenges that argument by showing that the presence of strong labour market
institutions played an important role in mitigating the upward pressure on income
inequality from the transition to the knowledge economy. We find that the effects of
expanding knowledge employment on both the income share of the top 1% and the
90–10 wage ratio are moderated by more coordinated wage bargaining, stricter
employment protection legislation and higher bargaining coverage. Our results
complement the wider empirical literature that finds that industrial relations systems
and the power of organized labour can limit wage dispersion across the workforce
(Pontusson, Rueda, and Way 2002; Wallerstein 1999) and constrain the income
growth of the most affluent households in society (Huber, Huo, and Stephens 2017).
However, we go beyond the previous literature by showing that labour market
institutions effects in the post-industrial era operated through their capacity to
counteract the pressures on wage solidarity arising from the rapid expansion of
knowledge-intensive service sectors.
While the results for the main independent variables were consistent across the
two measures of inequality, the control variables that exhibited consistent, statistically
significant effects across specifications varied markedly between the two measures.
The capitalization of the stock market was positively associated with rising top
incomes, which supports the voluminous empirical literature on the effects of
financialization on income inequality (Flaherty 2015; Godechot 2016; Kus 2012;
Roberts and Kwon 2017), and reflects the increasing use of stock options as CEO
compensation over the post-Fordist period in both liberal and coordinated market
economies (Huber, Huo, and Stephens 2017). The finding that Chinese import
competition pushes up the incomes of the top 1% is striking and warrants further
investigation, as the focus of most of the previous empirical studies have been on the
adverse effects on the bottom and middle of the income distribution (Autor, Dorn, and
Hanson 2013; Thewissen and van Vliet 2017). Turning to the results for the 90–10
wage ratio, we see that trade openness and human capital are negatively associated
III Working paper 18 David Hope and Angelo Martelli
26
with wage dispersion. The trade openness finding suggests that different aspects of
globalization have different effects on wage inequality, and that exposure to
international trade actually reduces wage inequality across the bottom 90% of the
income distribution. The human capital finding supports the Goldin–Katz (2007, 2008)
hypothesis and the theory of skills-biased technological change (Acemoglu and Autor
2011; Katz and Autor 1999).
The analysis presented in this paper has several important limitations that point to
fruitful avenues for future work. The Prais–Winsten regression models pin down the
importance of labour market institutions for mitigating the inequality effects of the
transition to the knowledge economy, but have a limited amount to say about the
underlying mechanisms. Our cross-country comparative analysis would therefore be
nicely complemented by micro-level empirical analyses or qualitative case study
analyses into how labour market institutions have interacted with the expansion of
knowledge employment to ensure greater wage solidarity in Scandinavia and some
parts of continental Europe than elsewhere. The extent to which producer groups have
adapted their strategies and forms of coordination in the knowledge economy is also
hard to ascertain from the high-level, national measures of labour market institutions
used in this study, and requires further investigation. Lastly, the empirical analysis is
constrained by the time series availability of the income inequality measures and the
unavailability of comparable data on knowledge employment past 2007. If and when
this data becomes available, an updated empirical analysis should be carried out.
This paper makes an important contribution to the growing body of comparative
work that looks at how national institutions can condition the effects of structural
changes in the economy on income inequality in advanced democracies (Iversen and
Soskice 2015; Kwon and Roberts forthcoming; Roberts and Kwon 2017; Thelen 2014).
We provide evidence against the argument that labour market institutions are
redundant in the knowledge economy; in fact, we find that they can alleviate the
upward pressure on income inequality arising from the continued shift of workers in
advanced democracies into high-value added, ICT intensive, service sectors.
III Working paper 18 David Hope and Angelo Martelli
27
References Acemoglu, Daron. 2001. “Good Jobs versus Bad Jobs.” Journal of Labor Economics
19(1): 1–21. http://www.jstor.org/stable/10.1086/209978.
Acemoglu, Daron, and David Autor. 2011. “Skills, Tasks and Technologies: Implications for Employment and Earnings.” In Handbook of Labor Economics, eds. Orley Ashenfelter and David Card. Amsterdam: Elsevier, 1043–1171.
Ahlquist, John S. 2017. “Labor Unions, Political Representation, and Economic Inequality.” Annual Review of Political Science 20(1): 409–32.
Alderson, Arthur S., and François Nielsen. 2002. “Globalization and the Great U-Turn: Income Inequality Trends in 16 OECD Countries.” American Journal of Sociology 107(5): 1244–99. http://www.journals.uchicago.edu/doi/10.1086/341329.
Alvaredo, Facundo et al. 2016. “World Wealth and Income Database.”
Alvaredo, Facundo, Anthony B Atkinson, Thomas Piketty, and Emmanuel Saez. 2013. “The Top 1 Percent in International and Historical Perspective.” Journal of Economic Perspectives 27(3): 3–20.
Atkinson, A. B., and T. Piketty, eds. Top Incomes over the Twentieth Century: A Contrast between Continental European and English-Speaking Countries. Oxford: Oxford University Press.
Atkinson, Anthony B., Thomas Piketty, and Emmanuel Saez. 2011. “Top Incomes in the Long Run of History.” Journal of Economic Literature 49(1): 3–71.
Autor, David, and David Dorn. 2013. “The Growth of Low-Skill Service Jobs and the Polarization of the US Labor Market.” The American Economic Review 103(5): 1553–97.
Autor, David H., Lawrence F. Katz, and Melissa S. Kearney. 2006. “The Polarization of the U.S. Labor Market.” American Economic Review 92(2): 189–94.
Autor, David H, David Dorn, and Gordon H Hanson. 2013. “The China Syndrome: Local Labor Market Effects of Import Competition in the United States.” The American Economic Review 103(6): 2121–68.
Autor, David H, Frank Levy, and Richard J. Murnane. 2003. “The Skill Content of Recent Technological Change: An Empirical Exploration.” The Quarterly Journal of Economics 118(4): 1279–1333.
Beck, Nathaniel, and Jonathan N Katz. 2011. “Modeling Dynamics in Time-Series–Cross-Section Political Economy Data.” Annual Review of Political Science 14(1): 331–52. https://doi.org/10.1146/annurev-polisci-071510-103222.
Beck, Nathaniel, and Jonathan N. Katz. 1995. “What to Do (and Not to Do) with Time-Series Cross-Section Data.” The American Political Science Review 89(3): 634–47. http://www.jstor.org/stable/2082979.
III Working paper 18 David Hope and Angelo Martelli
28
Beck, Thorsten, Asli Demirgüç-Kunt, and Ross Levine. 2000. “A New Database on the Structure and Development of the Financial Sector.” The World Bank Economic Review 14(3): 597–605.
———. 2009. “Financial Institutions and Markets across Countries and over Time: Data and Analysis.” World Bank Policy Research Working Paper No. 4943.
Bradley, David et al. 2003. “Distribution and Redistribution in Postindustrial Democracies.” World Politics 55(2): 193–228.
Brady, D, R S Baker, and R Finnigan. 2013. “When Unionization Disappears.” American Sociological Review 78(5): 872–96.
Brady, David, Evelyne Huber, and John D. Stephens. 2014. Comparative Welfare States Data Set.
Brady, David, and Kevin T Leicht. 2008. “Party to Inequality: Right Party Power and Income Inequality in Affluent Western Democracies.” Research in Social Stratification and Mobility 26(1): 77–106.
Brynjolfsson, Erik, and Andrew McAfee. 2014. The Second Machine Age: Work, Progress, and Prosperity in a Time of Brilliant Technologies. New York: W. W. Norton & Company.
Checchi, Daniele, and Cecilia García-Peñalosa. 2008. “Labour Market Institutions and Income Inequality.” Economic Policy 23(56): 602–49.
Checchi, Daniele, and Cecilia Garcia. 2010. “Labour Market Institutions and the Personal Distribution of Income in the OECD.” Economica 77(307): 413–50. http://www.jstor.org/stable/40865111.
Chen, Wen-hao, Michael Förster, and Ana Llena-nozal. 2013. “Globalisation, Technological Progress and Changes in Regulations and Institutions – Which Impact on the Rise of Earnings Inequality in OECD Countries?” LIS Working Paper Series (597).
Choi, Changkyu. 2010. “The Effect of the Internet on Service Trade.” Economics Letters 109(2): 102–4.
Čihak, Martin, Asli Demirgüç-Kunt, Erik Feyen, and Ross Levine. 2012. “Benchmarking Financial Systems around the World.” World Bank Policy Research Working Paper No. 6175.
Dahl, Christian M, Hans Christian Kongsted, and Anders Sørensen. 2011. “ICT and Productivity Growth in the 1990s: Panel Data Evidence on Europe.” Empirical Economics 40(1): 141–64.
Feenstra, Robert C, Robert Inklaar, and Marcel P Timmer. 2015. “The Next Generation of the Penn World Table.” American Economic Review 105(10): 3150–82.
III Working paper 18 David Hope and Angelo Martelli
29
Flaherty, Eoin. 2015. “Top Incomes under Finance-Driven Capitalism, 1990-2010: Power Resources and Regulatory Orders.” Socio-Economic Review 13(3): 417–47.
Fligstein, Neil, and Taekjin Shin. 2007. “Shareholder Value and the Transformation of the U.S. Economy, 1984-2000.” Sociological Forum 22(4): 399–424. http://www.jstor.org/stable/20110226.
Freund, Caroline, and Diana Weinhold. 2002. “The Internet and International Trade in Services.” The American Economic Review 92(2): 236–40.
Godechot, Olivier. 2016. “Financialization Is Marketization! A Study of the Respective Impacts of Various Dimensions of Financialization on the Increase in Global Inequality.” Sociological Science 3: 595–519.
Goldin, Claudia, and Lawrence F Katz. 2007. “Long-Run Changes in the Wage Structure: Narrowing, Widening, Polarizing.” Brookings Papers on Economic Activity 2: 135–65.
Goldin, Claudia, and Lawrence F. Katz. 2008. The Race Between Education and Technology. Cambridge: Harvard University Press.
Goldstein, Adam. 2012. “Revenge of the Managers: Labor Cost-Cutting and the Paradoxical Resurgence of Managerialism in the Shareholder Value Era, 1984 to 2001.” American Sociological Review 77(2): 268–94.
Goos, Maarten, and Alan Manning. 2007. “Lousy and Lovely Jobs: The Rising Polarization of Work in Britain.” Review of Economics and Statistics 89(1): 118–33.
Goos, Maarten, Alan Manning, and Anna Salomons. 2009. “Job Polarization in Europe.” American Economic Review: Papers & Proceedings 99(2): 58–63.
———. 2014. “Explaining Job Polarization: Routine-Biased Technological Change and Offshoring.” American Economic Review 104(8): 2509–26.
Gottschalk, Peter, and Timothy M Smeeding. 1997. “Cross-National Comparisons of Earnings and Income Inequality.” Journal of Economic Literature 35(2): 633–87.
Hall, Peter A., and David Soskice. 2001. “An Introduction to Varieties of Capitalism.” In Varieties of Capitalism: The Institutional Foundations of Comparative Advantage, eds. Peter A. Hall and David Soskice. Oxford: Oxford University Press, 1–68.
Hope, David, and David Soskice. 2016. “Growth Models, Varieties of Capitalism, and Macroeconomics.” Politics & Society 44(2): 209–26.
Huber, Evelyne, Jingjing Huo, and John D. Stephens. 2017. “Power, Policy, and Top Income Shares.” Socio-Economic Review 0(0): 1–23.
III Working paper 18 David Hope and Angelo Martelli
30
Huber, Evelyne, and John D Stephens. 2014. “Income Inequality and Redistribution in Post- Industrial Democracies: Demographic, Economic and Political Determinants.” Socio-Economic Review 12: 245–67.
Iversen, Torben, and David Soskice. 2012. “Modern Capitalism and the Advanced Nation State: Understanding the Causes of the Crisis.” In Coping with Crisis: Government Reactions to the Great Recession, eds. Nancy Bermeo and Jonas Pontusson. New York: Russell Sage Foundation, 35–64.
———. 2015. “Democratic Limits to Redistribution: Inclusionary versus Exclusionary Coalitions in the Knowledge Economy.” World Politics 67(2): 185–225.
Jacob Assa. 2012. “Financialization and Its Consequences: The OECD Experience.” Finance Research 1(1): 35–39. http://researchpub.org/journal/fr/number/vol1-no1/vol1-no1-4.pdf.
Kaplan, Steven N, and Joshua Rauh. 2013. “It’s the Market: The Broad-Based Rise in the Return to Top Talent.” The Journal of Economic Perspectives 27(3): 35–55. http://www.jstor.org/stable/41955544.
Katz, L. F., and D H. Autor. 1999. “Changes in the Wage Structure and Earnings Inequality.” In Handbook of Labor Economics, eds. O. Ashenfelter and D. E. Card. Amsterdam: Elsevier B.V., 1463–1555.
Kenworthy, Lane, and Jonas Pontusson. 2005. “Rising Inequality and the Politics of Redistribution in Affluent Countries.” Perspectives on Politics 3(3): 449–71. http://www.journals.cambridge.org/abstract_S1537592705050292.
Kus, Basak. 2012. “Financialisation and Income Inequality in OECD Nations: 1995-2007.” The Economic and Social Review 43(4): 477–95.
Kwon, R. 2014. “Employment Transitions and the Cycle of Income Inequality in Postindustrial Societies.” International Journal of Comparative Sociology 55(5): 404–28.
Kwon, R., and A. Roberts. 2015. “Financialization and Income Inequality in the New Economy.” Sociology of Development 1(4): 442–62.
———. Forthcoming. “Whither the Middle Class? Financialization, Labor Institutions, and the Gap Between Top- and Middle-Income Earners in Advanced Industrial Societies.” Sociology of Development.
Kwon, Roy. 2016. “A New Kuznetsian Dynamic: The Knowledge Economy and Income Inequality in the United States, 1917-2008.” Sociological Quarterly 57(1): 174–204.
Lee, Cheol-Sung, François Nielsen, and Arthur S Alderson. 2007. “Income Inequality, Global Economy and the State.” Social Forces 86(1): 77–111.
Lin, Ken-Hou, and Donald Tomaskovic-Devey. 2013. “Financialization and U.S. Income Inequality, 1970–2008.” American Journal of Sociology 118(5): 1284–1329. http://www.journals.uchicago.edu/doi/10.1086/669499.
III Working paper 18 David Hope and Angelo Martelli
31
Lloyd, Caroline, Claudia Weinkopf, and Rosemary Batt. 2010. “Restructuring Customer Service: Labor Market Institutions and Call Center Workers In Europe and the United States.” In Low-Wage Work in the Wealthy World, eds. J. Gautié and J. Schmitt. New York: Russell Sage Foundation, 421–66.
Mackie, Thomas, and Richard Rose. 1991. The International Almanac of Electoral History. Washington D.C.: Congressional Quarterly.
Mankiw, N. Gregory. 2013. “Defending the One Percent.” Journal of Economic Perspectives 27(3): 21–34. http://pubs.aeaweb.org/doi/10.1257/jep.27.3.21.
Martelli, Angelo. 2017. “Essays on the Political Economy of Employment Polarization: Global Forces and Domestic Institutions.”
Martin, Cathie Jo, and Kathleen Thelen. 2007. “The State and Coordinated Capitalism: Contributions of the Public Sector to Social Solidarity in Postindustrial Societies.” World Politics 60(1): 1–36.
Michaels, Guy, Ashwini Natraj, and John Van Reenen. 2014. “Has ICT Polarized Skill Demand? Evidence from Eleven Countries over Twenty-Five Years.” Review of Economics and Statistics 96(1): 60–77.
Milanovic, Branko, and Lyn Squire. 2005. “Does Tariff Liberalization Increase Wage Inequality? Some Empirical Evidence.” NBER Working Paper 11046.
Murphy, Kevin J, and Ján Zabojnik. 2004. “CEO Pay and Appointments: A Market-Based Explanation for Recent Trends.” The American Economic Review 94(2): 192–96.
Nordhaus, William D. 2007. “Two Centuries of Productivity Growth in Computing.” The Journal of Economic History 67(1): 128–59.
O’Mahony, Mary, and Marcel P Timmer. 2009. “Output, Input and Productivity Measures at the Industry Level: The EU KLEMS Database*.” The Economic Journal 119(538): F374--F403.
OECD. 2011. Divided We Stand: Why Inequality Keeps Rising. Paris: OECD Publishing.
———. 2015. In It Together: Why Less Inequality Benefits All. Paris: OECD Publishing.
Oesch, Daniel. 2015. “Welfare Regimes and Change in the Employment Structure: Britain, Denmark and Germany since 1990.” Journal of European Social Policy 25(1): 94–110. https://doi.org/10.1177/0958928714556972.
Oesch, Daniel, and Jorge Rodriguez Menés. 2011. “Upgrading or Polarization? Occupational Change in Britain, Germany, Spain and Switzerland, 1990–2008.” Socio-Economic Review 9(3): 503–31. http://dx.doi.org/10.1093/ser/mwq029.
Piketty, Thomas. 2014. Capital in the Twenty-First Century. Cambridge, Massachusetts, and London, England: Harvard University Press.
III Working paper 18 David Hope and Angelo Martelli
32
Plümper, Thomas, Vera E. Troeger, and Philip Manow. 2005. “Panel Data Analysis in Comparative Politics: Linking Method to Theory.” European Journal of Political Research 44(2): 327–54. http://dx.doi.org/10.1111/j.1475-6765.2005.00230.x.
Pontusson, Jonas. 2005. Inequality and Prosperity: Social Europe vs. Liberal America. Ithaca and London: The Century Foundation / Cornell University Press.
Pontusson, Jonas, David Rueda, and Christopher R Way. 2002. “Comparative Political Economy of Wage Distribution: The Role of Partisanship and Labour Market Institutions.” British Journal of Political Science 32(2): 281–308. http://www.jstor.org/stable/4092219.
Van Reenen, John. 2011. “Wage Inequality, Technology and Trade: 21st Century Evidence.” Labour Economics 18(6): 730–41.
Roberts, Anthony, and Roy Kwon. 2017. “Finance, Inequality and the Varieties of Capitalism in Post-Industrial Democracies.” Socio-Economic Review 15(3): 511–38. http://dx.doi.org/10.1093/ser/mwx021.
Rohrbach, Daniela. 2009. “Sector Bias and Sector Dualism.” International Journal of Comparative Sociology 50(5–6): 510–36.
Roine, Jesper, Jonas Vlachos, and Daniel Waldenström. 2009. “The Long-Run Determinants of Inequality: What Can We Learn from Top Income Data?” Journal of Public Economics 93(7): 974–88.
Rueda, David. 2005. “Insider-Outsider Politics in Industrialized Democracies: The Challenge to Social Democratic Parties.” American Political Science Review 99(1): 61–74.
Rueda, David, and Jonas Pontusson. 2000. “Wage Inequality and Varieties of Capitalism.” World Politics 52(3): 350–83.
Schneider, Martin R, and Mihai Paunescu. 2012. “Changing Varieties of Capitalism and Revealed Comparative Advantages from 1990 to 2005: A Test of the Hall and Soskice Claims.” Socio-Economic Review 10: 731–53.
Spiezia, Vincenzo. 2012. “ICT Investments and Productivity: Measuring the Contribution of ICTs to Growth.” OECD Journal. Economic Studies 2012(1): 199–211.
Stiroh, Kevin J. 2002. “Information Technology and the U.S. Productivity Revival: What Do the Industry Data Say?” The American Economic Review 92(5): 1559–76.
Thelen, Kathleen. 2014. Varieties of Liberalization and the New Politics of Social Solidarity. New York: Cambridge University Press.
Thewissen, Stefan, and Olaf van Vliet. 2017. “Competing with the Dragon: Employment Effects of Chinese Trade Competition in 17 Sectors Across 18 OECD Countries.” Political Science Research and Methods, 1-18.
III Working paper 18 David Hope and Angelo Martelli
33
Visser, J. 2013. ICTWSS Database Version 3.0. Amsterdam: Amsterdam Institute for Advanced Labour Studies AIAS (September 2016).
———. 2016. ICTWSS Database Version 5.1. Amsterdam: Amsterdam Institute for Advanced Labour Studies AIAS.
Volscho, Thomas W., and Nathan J. Kelly. 2012. “The Rise of the Super-Rich Power Resources, Taxes, Financial Markets, and the Dynamics of the Top 1 Percent, 1949 to 2008.” American Sociological Review 77(5): 679–99.
Wallerstein, Michael. 1999. “Wage-Setting Institutions and Pay Inequality in Advanced Industrial Societies.” American Journal of Political Science 43(3): 649–80.
Wren, Anne. 2013a. “Introduction: The Political Economy of Post-Industrial Societies.” In The Political Economy of the Service Transition, ed. Anne Wren. Oxford: Oxford University Press, 1–70.
———, ed. 2013b. The Political Economy of the Service Transition. Oxford: Oxford University Press.
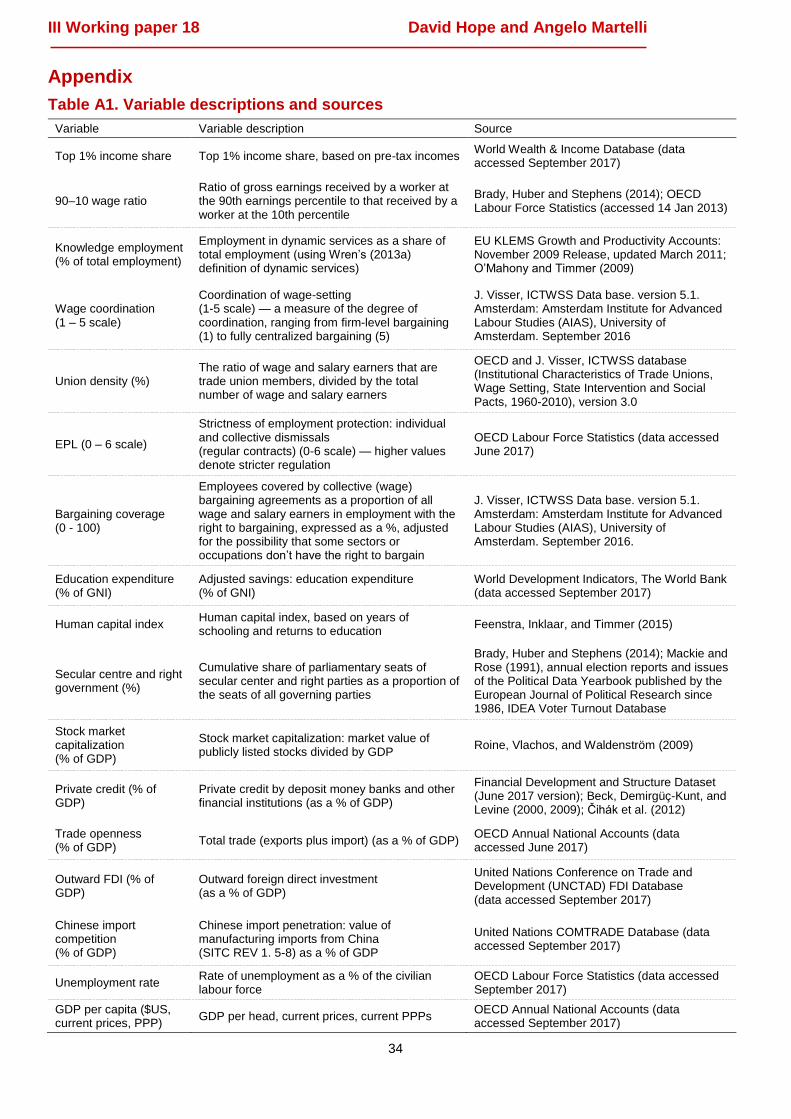
III Working paper 18 David Hope and Angelo Martelli
34
Appendix
Table A1. Variable descriptions and sources
Variable Variable description Source
Top 1% income share Top 1% income share, based on pre-tax incomes World Wealth & Income Database (data accessed September 2017)
90–10 wage ratio Ratio of gross earnings received by a worker at the 90th earnings percentile to that received by a worker at the 10th percentile
Brady, Huber and Stephens (2014); OECD Labour Force Statistics (accessed 14 Jan 2013)
Knowledge employment (% of total employment)
Employment in dynamic services as a share of total employment (using Wren’s (2013a) definition of dynamic services)
EU KLEMS Growth and Productivity Accounts: November 2009 Release, updated March 2011; O’Mahony and Timmer (2009)
Wage coordination (1 – 5 scale)
Coordination of wage-setting (1-5 scale) — a measure of the degree of coordination, ranging from firm-level bargaining (1) to fully centralized bargaining (5)
J. Visser, ICTWSS Data base. version 5.1. Amsterdam: Amsterdam Institute for Advanced Labour Studies (AIAS), University of Amsterdam. September 2016
Union density (%) The ratio of wage and salary earners that are trade union members, divided by the total number of wage and salary earners
OECD and J. Visser, ICTWSS database (Institutional Characteristics of Trade Unions, Wage Setting, State Intervention and Social Pacts, 1960-2010), version 3.0
EPL (0 – 6 scale)
Strictness of employment protection: individual and collective dismissals (regular contracts) (0-6 scale) — higher values denote stricter regulation
OECD Labour Force Statistics (data accessed June 2017)
Bargaining coverage (0 - 100)
Employees covered by collective (wage) bargaining agreements as a proportion of all wage and salary earners in employment with the right to bargaining, expressed as a %, adjusted for the possibility that some sectors or occupations don’t have the right to bargain
J. Visser, ICTWSS Data base. version 5.1. Amsterdam: Amsterdam Institute for Advanced Labour Studies (AIAS), University of Amsterdam. September 2016.
Education expenditure (% of GNI)
Adjusted savings: education expenditure (% of GNI)
World Development Indicators, The World Bank (data accessed September 2017)
Human capital index Human capital index, based on years of schooling and returns to education
Feenstra, Inklaar, and Timmer (2015)
Secular centre and right government (%)
Cumulative share of parliamentary seats of secular center and right parties as a proportion of the seats of all governing parties
Brady, Huber and Stephens (2014); Mackie and Rose (1991), annual election reports and issues of the Political Data Yearbook published by the European Journal of Political Research since 1986, IDEA Voter Turnout Database
Stock market capitalization (% of GDP)
Stock market capitalization: market value of publicly listed stocks divided by GDP
Roine, Vlachos, and Waldenström (2009)
Private credit (% of GDP)
Private credit by deposit money banks and other financial institutions (as a % of GDP)
Financial Development and Structure Dataset (June 2017 version); Beck, Demirgüç-Kunt, and Levine (2000, 2009); Čihak et al. (2012)
Trade openness (% of GDP)
Total trade (exports plus import) (as a % of GDP) OECD Annual National Accounts (data accessed June 2017)
Outward FDI (% of GDP)
Outward foreign direct investment (as a % of GDP)
United Nations Conference on Trade and Development (UNCTAD) FDI Database (data accessed September 2017)
Chinese import competition (% of GDP)
Chinese import penetration: value of manufacturing imports from China (SITC REV 1. 5-8) as a % of GDP
United Nations COMTRADE Database (data accessed September 2017)
Unemployment rate Rate of unemployment as a % of the civilian labour force
OECD Labour Force Statistics (data accessed September 2017)
GDP per capita ($US, current prices, PPP)
GDP per head, current prices, current PPPs OECD Annual National Accounts (data accessed September 2017)
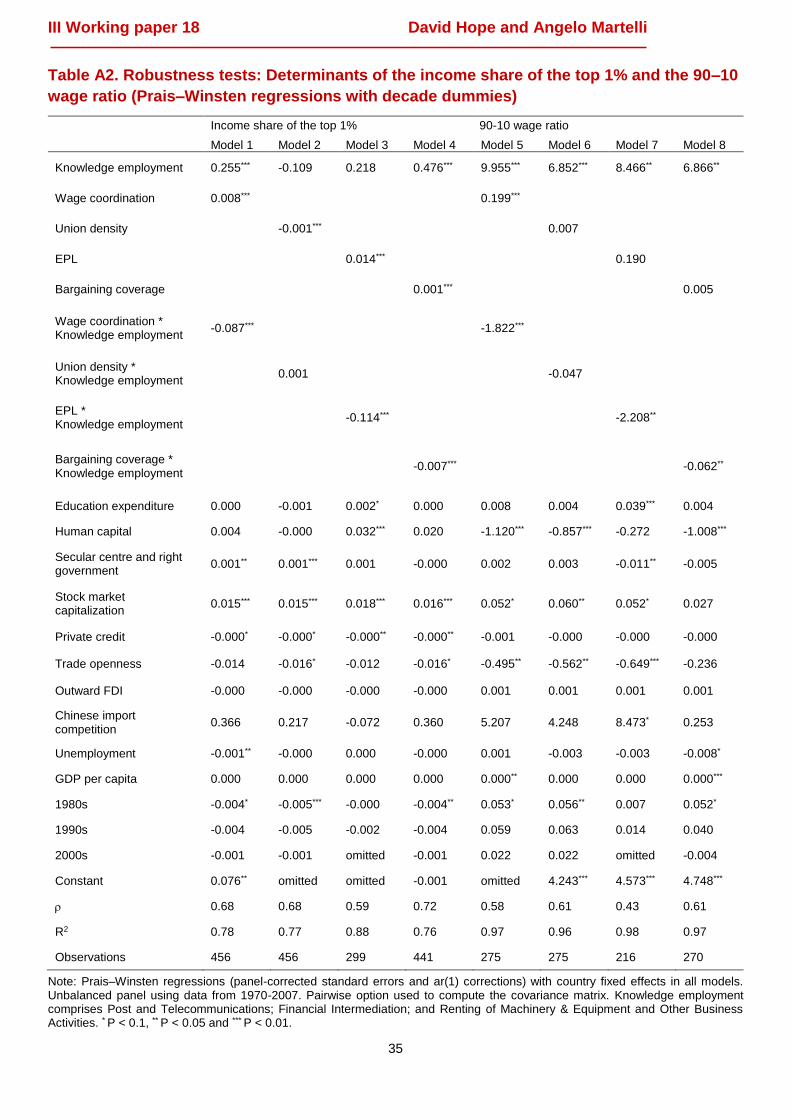
III Working paper 18 David Hope and Angelo Martelli
35
Table A2. Robustness tests: Determinants of the income share of the top 1% and the 90–10
wage ratio (Prais–Winsten regressions with decade dummies)
Income share of the top 1% 90-10 wage ratio
Model 1 Model 2 Model 3 Model 4 Model 5 Model 6 Model 7 Model 8
Knowledge employment 0.255*** -0.109 0.218 0.476*** 9.955*** 6.852*** 8.466** 6.866**
Wage coordination 0.008*** 0.199***
Union density -0.001*** 0.007
EPL 0.014*** 0.190
Bargaining coverage 0.001*** 0.005
Wage coordination * Knowledge employment
-0.087*** -1.822***
Union density * Knowledge employment
0.001 -0.047
EPL * Knowledge employment
-0.114*** -2.208**
Bargaining coverage * Knowledge employment
-0.007*** -0.062**
Education expenditure 0.000 -0.001 0.002* 0.000 0.008 0.004 0.039*** 0.004
Human capital 0.004 -0.000 0.032*** 0.020 -1.120*** -0.857*** -0.272 -1.008***
Secular centre and right government
0.001** 0.001*** 0.001 -0.000 0.002 0.003 -0.011** -0.005
Stock market capitalization
0.015*** 0.015*** 0.018*** 0.016*** 0.052* 0.060** 0.052* 0.027
Private credit -0.000* -0.000* -0.000** -0.000** -0.001 -0.000 -0.000 -0.000
Trade openness -0.014 -0.016* -0.012 -0.016* -0.495** -0.562** -0.649*** -0.236
Outward FDI -0.000 -0.000 -0.000 -0.000 0.001 0.001 0.001 0.001
Chinese import competition
0.366 0.217 -0.072 0.360 5.207 4.248 8.473* 0.253
Unemployment -0.001** -0.000 0.000 -0.000 0.001 -0.003 -0.003 -0.008*
GDP per capita 0.000 0.000 0.000 0.000 0.000** 0.000 0.000 0.000***
1980s -0.004* -0.005*** -0.000 -0.004** 0.053* 0.056** 0.007 0.052*
1990s -0.004 -0.005 -0.002 -0.004 0.059 0.063 0.014 0.040
2000s -0.001 -0.001 omitted -0.001 0.022 0.022 omitted -0.004
Constant 0.076** omitted omitted -0.001 omitted 4.243*** 4.573*** 4.748***
0.68 0.68 0.59 0.72 0.58 0.61 0.43 0.61
R2 0.78 0.77 0.88 0.76 0.97 0.96 0.98 0.97
Observations 456 456 299 441 275 275 216 270
Note: Prais–Winsten regressions (panel-corrected standard errors and ar(1) corrections) with country fixed effects in all models. Unbalanced panel using data from 1970-2007. Pairwise option used to compute the covariance matrix. Knowledge employment comprises Post and Telecommunications; Financial Intermediation; and Renting of Machinery & Equipment and Other Business Activities. * P < 0.1, ** P < 0.05 and *** P < 0.01.
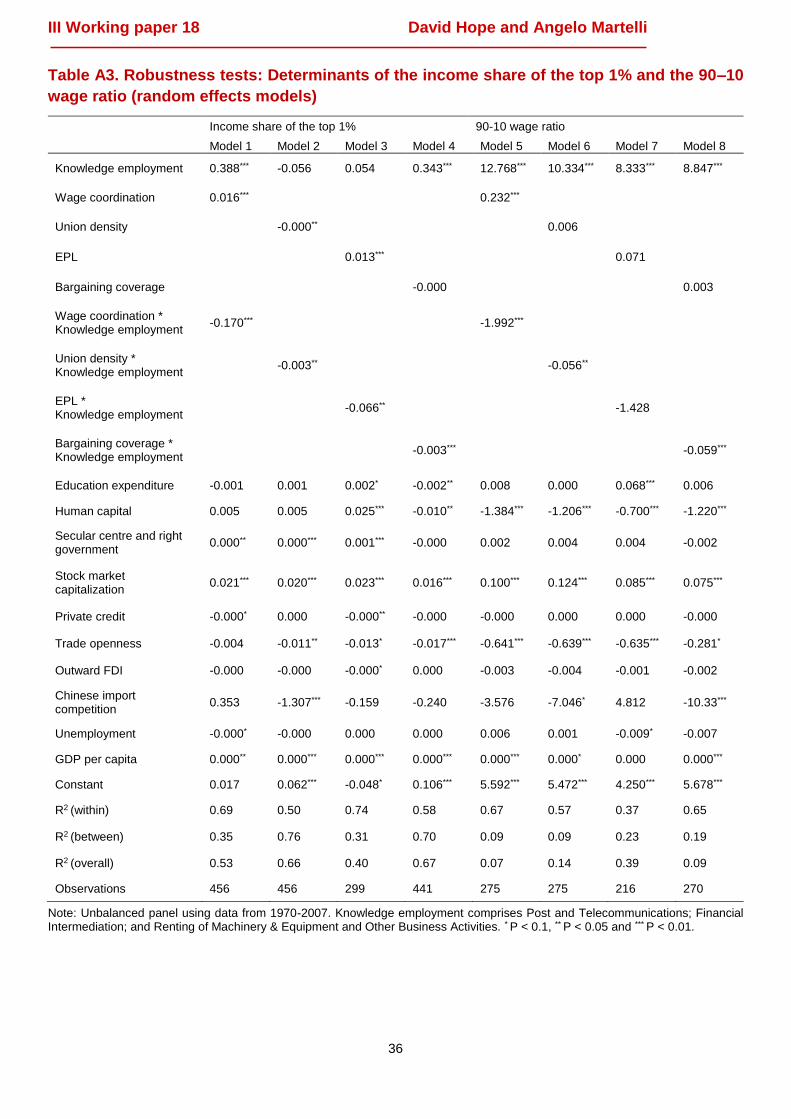
III Working paper 18 David Hope and Angelo Martelli
36
Table A3. Robustness tests: Determinants of the income share of the top 1% and the 90–10
wage ratio (random effects models)
Income share of the top 1% 90-10 wage ratio
Model 1 Model 2 Model 3 Model 4 Model 5 Model 6 Model 7 Model 8
Knowledge employment 0.388*** -0.056 0.054 0.343*** 12.768*** 10.334*** 8.333*** 8.847***
Wage coordination 0.016*** 0.232***
Union density -0.000** 0.006
EPL 0.013*** 0.071
Bargaining coverage -0.000 0.003
Wage coordination * Knowledge employment
-0.170*** -1.992***
Union density * Knowledge employment
-0.003** -0.056**
EPL * Knowledge employment
-0.066** -1.428
Bargaining coverage * Knowledge employment
-0.003*** -0.059***
Education expenditure -0.001 0.001 0.002* -0.002** 0.008 0.000 0.068*** 0.006
Human capital 0.005 0.005 0.025*** -0.010** -1.384*** -1.206*** -0.700*** -1.220***
Secular centre and right government
0.000** 0.000*** 0.001*** -0.000 0.002 0.004 0.004 -0.002
Stock market capitalization
0.021*** 0.020*** 0.023*** 0.016*** 0.100*** 0.124*** 0.085*** 0.075***
Private credit -0.000* 0.000 -0.000** -0.000 -0.000 0.000 0.000 -0.000
Trade openness -0.004 -0.011** -0.013* -0.017*** -0.641*** -0.639*** -0.635*** -0.281*
Outward FDI -0.000 -0.000 -0.000* 0.000 -0.003 -0.004 -0.001 -0.002
Chinese import competition
0.353 -1.307*** -0.159 -0.240 -3.576 -7.046* 4.812 -10.33***
Unemployment -0.000* -0.000 0.000 0.000 0.006 0.001 -0.009* -0.007
GDP per capita 0.000** 0.000*** 0.000*** 0.000*** 0.000*** 0.000* 0.000 0.000***
Constant 0.017 0.062*** -0.048* 0.106*** 5.592*** 5.472*** 4.250*** 5.678***
R2 (within) 0.69 0.50 0.74 0.58 0.67 0.57 0.37 0.65
R2 (between) 0.35 0.76 0.31 0.70 0.09 0.09 0.23 0.19
R2 (overall) 0.53 0.66 0.40 0.67 0.07 0.14 0.39 0.09
Observations 456 456 299 441 275 275 216 270
Note: Unbalanced panel using data from 1970-2007. Knowledge employment comprises Post and Telecommunications; Financial Intermediation; and Renting of Machinery & Equipment and Other Business Activities. * P < 0.1, ** P < 0.05 and *** P < 0.01.
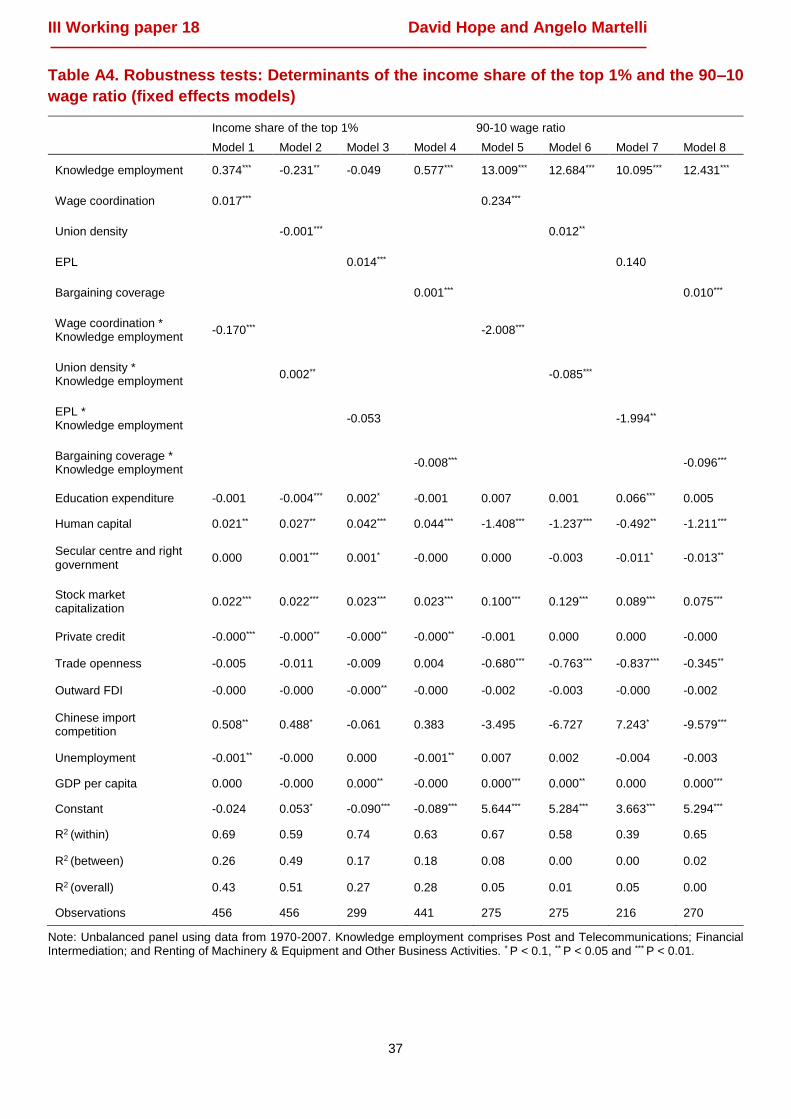
III Working paper 18 David Hope and Angelo Martelli
37
Table A4. Robustness tests: Determinants of the income share of the top 1% and the 90–10
wage ratio (fixed effects models)
Income share of the top 1% 90-10 wage ratio
Model 1 Model 2 Model 3 Model 4 Model 5 Model 6 Model 7 Model 8
Knowledge employment 0.374*** -0.231** -0.049 0.577*** 13.009*** 12.684*** 10.095*** 12.431***
Wage coordination 0.017*** 0.234***
Union density -0.001*** 0.012**
EPL 0.014*** 0.140
Bargaining coverage 0.001*** 0.010***
Wage coordination * Knowledge employment
-0.170*** -2.008***
Union density * Knowledge employment
0.002** -0.085***
EPL * Knowledge employment
-0.053 -1.994**
Bargaining coverage * Knowledge employment
-0.008*** -0.096***
Education expenditure -0.001 -0.004*** 0.002* -0.001 0.007 0.001 0.066*** 0.005
Human capital 0.021** 0.027** 0.042*** 0.044*** -1.408*** -1.237*** -0.492** -1.211***
Secular centre and right government
0.000 0.001*** 0.001* -0.000 0.000 -0.003 -0.011* -0.013**
Stock market capitalization
0.022*** 0.022*** 0.023*** 0.023*** 0.100*** 0.129*** 0.089*** 0.075***
Private credit -0.000*** -0.000** -0.000** -0.000** -0.001 0.000 0.000 -0.000
Trade openness -0.005 -0.011 -0.009 0.004 -0.680*** -0.763*** -0.837*** -0.345**
Outward FDI -0.000 -0.000 -0.000** -0.000 -0.002 -0.003 -0.000 -0.002
Chinese import competition
0.508** 0.488* -0.061 0.383 -3.495 -6.727 7.243* -9.579***
Unemployment -0.001** -0.000 0.000 -0.001** 0.007 0.002 -0.004 -0.003
GDP per capita 0.000 -0.000 0.000** -0.000 0.000*** 0.000** 0.000 0.000***
Constant -0.024 0.053* -0.090*** -0.089*** 5.644*** 5.284*** 3.663*** 5.294***
R2 (within) 0.69 0.59 0.74 0.63 0.67 0.58 0.39 0.65
R2 (between) 0.26 0.49 0.17 0.18 0.08 0.00 0.00 0.02
R2 (overall) 0.43 0.51 0.27 0.28 0.05 0.01 0.05 0.00
Observations 456 456 299 441 275 275 216 270
Note: Unbalanced panel using data from 1970-2007. Knowledge employment comprises Post and Telecommunications; Financial Intermediation; and Renting of Machinery & Equipment and Other Business Activities. * P < 0.1, ** P < 0.05 and *** P < 0.01.