ijppm development of an individual work performance ... work performance - ijppm.pdf · development...
TRANSCRIPT
Development of an individualwork performance questionnaire
Linda KoopmansLife Style, Body@Work, TNO, Leiden,
The Netherlands and Department of Public and Occupational Health,VU University Medical Center, Amsterdam,
The Netherlands
Claire Bernaards and Vincent HildebrandtLife Style, TNO, Leiden, The Netherlands
Stef van BuurenLife Style, TNO, Leiden, The Netherlands and
Department of Methodology and Statistics, Utrecht University,Utrecht, The Netherlands
Allard J. van der BeekDepartment of Public and Occupational Health,
VU University Medical Center, Amsterdam, The Netherlands, and
Henrica C.W. de VetDepartment of Epidemiology and Biostatistics,
VU University Medical Center, Amsterdam, The Netherlands
Abstract
Purpose – The purpose of the current study is to develop a generic and short questionnaire tomeasure work performance at the individual level – the Individual Work Performance Questionnaire(IWPQ). The IWPQ was based on a four-dimensional conceptual framework, in which individual workperformance consisted of task performance, contextual performance, adaptive performance, andcounterproductive work behavior.Design/methodology/approach – After pilot-testing, the 47-item IWPQ was field-tested amongsta representative sample of 1,181 Dutch blue, pink, and white collar workers. Factor analysis was usedto examine whether the four-dimensional conceptual framework could be confirmed. Rasch analysiswas used to examine the functioning of the items in more detail. Finally, it was examined whethergeneric scales could be constructed.Findings – A generic, three-dimensional conceptual framework was identified, in which individualwork performance consisted of task performance, contextual performance, and counterproductivework behavior. Generic, short scales could be constructed that fitted the Rasch model.Research limitations/implications – A generic, short questionnaire can be used to measureindividual work performance across occupational sectors. In future versions of the IWPQ, moredifficult items should be added to improve discriminative ability at the high ranges of the scale.Originality/value – This study shows that, using Rasch analysis, a generic and short questionnairecan be used to measure individual work performance.
Keywords Performance, Performance measurement, Individual work performance,Job performance, Measurement, Rasch analysis, Performance management, The Netherlands
Paper type Research paper
IntroductionIndividual work performance (IWP) is a relevant and often used outcome measure ofstudies in the occupational setting. In the past decades, a great deal of research in fields
The current issue and full text archive of this journal is available atwww.emeraldinsight.com/1741-0401.htm
Received 19 March 2012Revised 19 July 2012Accepted 2 August 2012
International Journal of Productivityand Performance ManagementVol. 62 No. 1, 2013pp. 6-28r Emerald Group Publishing Limited1741-0401DOI 10.1108/17410401311285273
6
IJPPM62,1
such as management, occupational health, and industrial-organizational psychologyhas been devoted to discovering the predictors and effects of IWP. Only later didattention arise for defining the construct of IWP and understanding its underlyingstructure (e.g. Rotundo and Sackett, 2002; Dalal, 2005). After all, a clear definition andtheoretical framework of IWP is a prerequisite for valid measurement of the construct.
IWP was defined by Campbell (1990, p. 704) as “behaviors or actions that arerelevant to the goals of the organization.” Thus, IWP focusses on behaviors or actionsof employees, rather than the results of these actions. In addition, behaviors should beunder the control of the individual, thus excluding behaviors that are constrained bythe environment (Rotundo and Sackett, 2002). In order to measure IWP, it is importantto determine its underlying structure. Traditionally, the main focus of the IWPconstruct has been on task performance, which can be defined as the proficiency withwhich individuals perform the core substantive or technical tasks central to his or herjob (Campbell, 1990, pp. 708-9). Behaviors used to describe task performance ofteninclude work quantity and quality, job skills, and job knowledge (e.g. Rotundo andSackett, 2002; Campbell, 1990).
Although it has long been recognized that IWP is a multidimensional construct(Campbell, 1990; Austin and Villanova, 1992), only more recently has the role ofemployee behaviors beyond task performance received full attention (e.g. Rotundo andSackett, 2002; Dalal, 2005; Borman and Motowidlo, 1993). It is now generally agreedupon that, in addition to task performance, the IWP domain consists of contextualperformance and counterproductive work behavior (CWB) (e.g. Rotundo and Sackett,2002; Viswesvaran and Ones, 2000). Contextual performance can be defined as behaviorsthat support the organizational, social, and psychological environment in which thetechnical core must function (Borman and Motowidlo, 1993, p. 73). Behaviors used todescribe contextual performance include, for example demonstrating effort, facilitatingpeer and team performance, cooperating, and communicating (Rotundo and Sackett,2002; Campbell, 1990). CWB can be defined as behavior that harms the well-beingof the organization (Rotundo and Sackett, 2002, p. 69). It includes behaviors such asabsenteeism, off-task behavior, theft, and substance abuse (Koopmans et al., 2011).
A recent review by Koopmans et al. (2011) has identified the new and upcomingdimension of adaptive performance in IWP frameworks (e.g. Pulakos et al., 2000; Sinclairand Tucker, 2006; Griffin et al., 2007). This dimension focusses on the growinginterdependency and uncertainty of work systems and the corresponding change in thenature of IWP. Adaptive performance can be defined as the extent to which an individualadapts to changes in the work role or environment (Griffin et al., 2007, p. 331).
Numerous scales have been developed to measure the dimensions of IWP. Forexample, Williams and Anderson (1991) developed a short and generic taskperformance scale, which measured behaviors such as adequately completing assignedduties, fulfilling prescribed responsibilities, and performing tasks that are expected ofthe employee. Scales used to assess contextual performance are those developed by, forexample, Podsakoff and MacKenzie (1989) or Van Scotter and Motowidlo (1996). Theformer focusses on measuring altruism, conscientiousness, sportsmanship, courtesy,and civic virtue. The latter focusses on measuring interpersonal facilitation and jobdedication. Scales used to assess CWB were developed by, for example, Bennett andRobinson (2000) or Spector et al. (2006). The former authors focus on measuringorganizational and interpersonal deviance. The latter authors focus on measuringsabotage (e.g. damaging company equipment), withdrawal (e.g. taking longer breaks),production deviance (e.g. doing work incorrectly), theft (e.g. stealing company
7
Workperformance
questionnaire
property), and abuse (e.g. making fun of someone at work). A scale developed tomeasure adaptive performance is the job adaptability index ( JAI) by Pulakos et al.(2000). It measures, for example, whether employees are able to solve problemscreatively, to deal with uncertain or unpredictable work situations, and to learn newtasks, technologies, and procedures.
Several limitations can be observed in the scales developed to measure dimensionsof IWP. Most strikingly, none of these scales measure all dimensions of IWP together.As a result, they fail to incorporate the complete range of individual behaviors at work.This requires the researcher to search for, compare, and combine different scales to geta complete picture of IWP.
The task of deciding which scale(s) to use, is complicated by the fact that scalesoften operationalize the same dimension differently. This entrusts the researcher withthe difficult task of deciding which operationalization is most appropriate and relevantfor his or her study population. The different operationalizations are partly due todifferent conceptualizations of the dimensions, and partly due to specific populationsbeing used to develop and refine the scales. For example, the task performance scale byWilliams and Anderson (1991) was based on a sample of employees with a technical/professional background, and the contextual performance scales by Podsakoff andMacKenzie (1989) and Van Scotter and Motowidlo (1996) were based on a sample ofpetrochemical employees and US Airforce mechanics, respectively.
The use of separate scales to measure the dimensions of IWP has given rise to anotherproblem, namely that of antithetical items (Dalal, 2005). That is, items overlapping incontent can be found in scales measuring different dimensions. This is especially the casefor contextual performance and CWB scales. Many contextual performance scales includecounterproductive behaviors (e.g. “Takes undeserved work breaks”) that are reversescored, and some counterproductive scales include functional behaviors (e.g. “Volunteersto finish a project for a coworker who is sick”) that are reverse scored. However,contextual performance and CWB are not the opposite ends of one scale. The absence ofcounterproductive behaviors is not identical to good contextual performance, andlikewise, the presence of functional behaviors is not identical to low counterproductivity.The inclusion of antithetical items is problematic because it magnifies the strength ofthe correlation between contextual and counterproductive scales, and perhaps moreimportantly, reduces the content validity of the scales.
The goal of the current study was to develop a generic and short questionnaire ofIWP – the individual work performance questionnaire (IWPQ) – that overcomes thepreviously mentioned limitations. This questionnaire measures all IWP dimensions, has astandardized operationalization that is developed and refined based on a genericpopulation, and includes no antithetical items. Methods discusses the developmentalprocess of the IWPQ. It describes the field testing in a generic population and the analysisof the resultant data. Results presents the results of the field testing and the construction ofthe generic, short IWPQ. Subsequently, the most important findings are discussed,strengths and limitations of the research are addressed, and avenues for future research areproposed. Finally, the conclusions support the use of a generic, short questionnaire of IWP.
MethodsIWPQThe IWPQ version 0.1 was based on a four-dimensional conceptual framework, inwhich IWP consists of four dimensions: task performance, contextual performance,adaptive performance, and CWB (Koopmans et al., 2011). For each dimension, one scale
8
IJPPM62,1
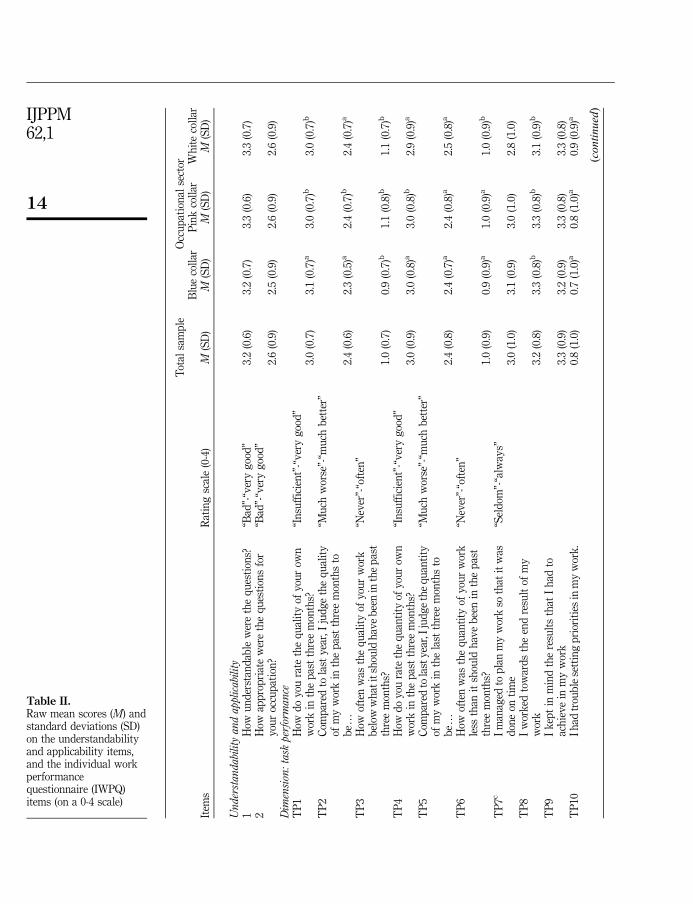
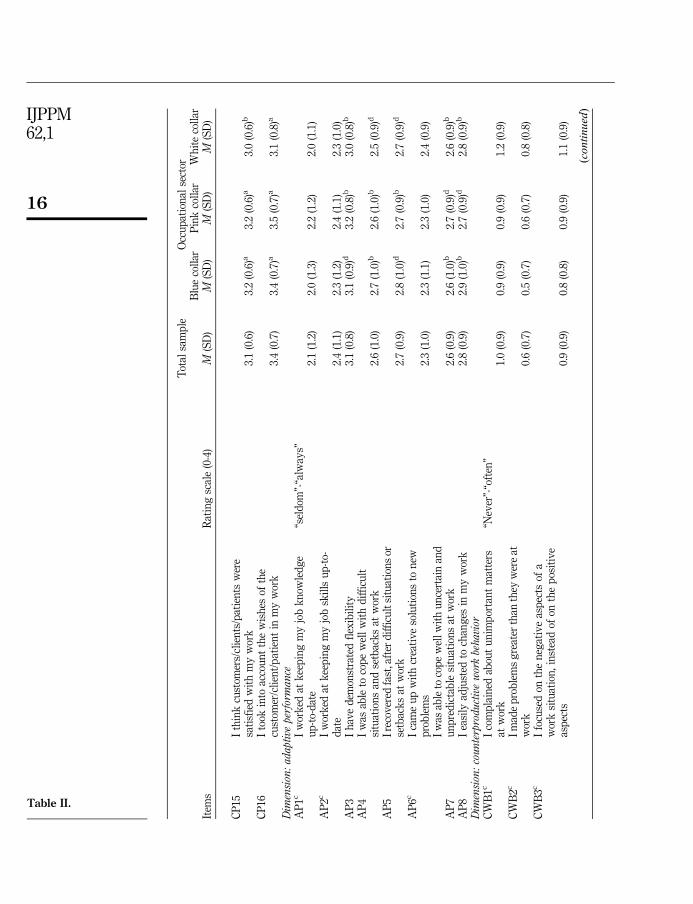
was developed. The operationalization of the scales was based on a study byKoopmans et al. (submitted). In this study, all possible indicators of the IWPdimensions were first identified from the literature, existing questionnaires, and expertinterviews. Antithetical items were removed from the dimensions. This resulted in alist of 128 unique indicators of IWP. Subsequently, agreement among experts fromdifferent professional backgrounds and countries was reached on the most relevant,generic indicators per IWP dimension. The 23 relevant, generic indicators wereincluded in the IWPQ scales. In addition, the task performance scale included workquantity as a relevant indicator. Although it was not selected as one of the mostrelevant indicators in Koopmans et al. (submitted), for theoretical reasons weconsidered this an essential indicator of IWP. For each indicator, one to threequestionnaire items were chosen, resulting in the 47-item IWPQ (Table II). The taskperformance scale consisted of 13 questionnaire items (e.g.: “How do you rate thequality of your own work?”), contextual performance of 16 (e.g.: “I came up withcreative ideas at work”), adaptive performance of eight (e.g.: “I have demonstratedflexibility”), and CWB of ten (e.g.: “I complained about unimportant matters at work”).
Pilot-testingA pilot study among 54 researchers was conducted to optimize clarity, readability, andface validity of the IWPQ. The 54 researchers were employees of TNO (NetherlandsOrganization for Applied Scientific Research) and VU University Medical Center. Inaddition, think-aloud protocols were held with six persons (three researchers, onesecretary, one nurse, and one manager). Based on the findings, clarity and readabilityof the items were improved. One main revision was reducing the answer categoriesfrom seven to five categories, as participants indicated that the differences betweensome answer categories were unclear. Another main revision was extending the recallperiod from four weeks to three months, to assure that most situations had likely takenplace, and including a “not applicable” answer category for some questions, as manyparticipants indicated that a situation may not have taken place in the past four weeks.To assess face validity, participants were asked whether they thought thequestionnaire actually measured IWP, whether any questions were redundant, andwhether any important questions were missing. Most participants indicated that theface validity of the IWPQ was good. As a final check, the VU University LanguageCenter screened the full questionnaire for readability and correct use of language.
Recall period and rating scalesAll items had a recall period of three months and a five-point rating scale. Rating scalelabels were adapted to the specific item. Quality and quantity of work was rated from“insufficient” to “very good” (items 1 and 4), quality and quantity of work compared tolast years was rated from “much worse” to “much better” (items 2 and 5), and decreasedquality and quantity of work was rated from “never” to “often” (items 3 and 6). On theremaining items, participants rated the frequency of their behavior. Frequency ratingswere preferred over agreement ratings, because agreement ratings generally requireindividuals to rate whether he or she is likely to engage in each behavior, and mayassess attitude toward the behavior rather than actual behavior (Dalal, 2005).Frequency ratings require individuals to recall and mentally calculate how often oneengaged in each behavior (Schwarz and Oyserman, 2001), and were thereforeconsidered to be more valid. A problem with self-ratings of performance is thatpersons are inclined to judge their own performance favorably (the leniency effect;
9
Workperformance
questionnaire
Van der Heijden and Nijhof, 2004), and this produces ceiling effects in the scales. As aresult, detecting improvement or distinguishing among high levels of performance isalmost impossible. One method to counteract this effect is to shift the center of thescale, so that the average point is not in the middle but rather to the left of the scale(Streiner and Norman, 2008). For these reasons, the remaining task, contextual, andadaptive behaviors (items 7-38) were rated from “seldom,” “sometimes,” “frequently,”“often,” to “always.” As the counterproductive behaviors (items 39-49) were expected toproduce floor rather than ceiling effects, the center of this scale was shifted to theright, ranging from “never,” “seldom,” “sometimes,” “frequently,” and “often.”
Field testingThe IWPQ was tested in a study among a representative sample of 1,181Dutch workers. An internet panel organization recruited the respondents. Theinternet panel consisted of Dutch adults who were willing to participate in researchprojects in exchange for a small financial reward. First, respondents filled out theirgender, age, education, and type of occupation. Second, they completed the 47-itemIWPQ. Finally, respondents rated the understandability of the IWPQ and theapplicability of the IWPQ to their occupation on a five-point scale ranging from“bad” to “very good.”
Data analysis of the field testUnderstandability and applicability. In order to determine whether participantsfound the IWPQ items understandable, and applicable to their occupation, themean score and standard deviation on these questions were calculated. One-wayanalyses of variance were performed to examine whether there were differencesbetween occupational sectors in understandability or applicability. Post hoc tests withBonferroni correction were performed to determine which occupational groups differedfrom each other.
Conceptual framework. In order to test whether the four-dimensional conceptualframework could be confirmed across occupational sectors, factor analysis (principalcomponents) with Varimax rotation was performed in SPSS 17. Beforehand, taskperformance items 3, 6, 10, and 13, and CWB items 1-10 were coded reversely (0 as 4,1 as 3, 2 as 2, 3 as 1, 4 as 0) so that a low score meant low work performance and a highscore meant high work performance. In all, 14 IWPQ items had a “not applicable”category, which was entered as a missing value. During factor analysis, missing valueswere substituted by the mean value of an item, so that no individuals had to be deletedfrom the analysis. Score ranges of the items were examined for floor or ceiling effects(415 percent at the extreme values; De Vet et al., 2011). Also, inter-item correlationswere examined. Items that correlate very low (o0.20) with all other items areproblematic because they have no relationship to any other items, and should bedeleted. Items that correlate very high (40.90) with another item should also beconsidered carefully because they are almost identical to the other item, and one maybe deleted.
The Kaiser-Meyer-Olkin’s (KMO) measure of sampling adequacy (should be 40.50)and Bartlett’s test of sphericity (should be o0.05) were performed to test whether thevariables in the data set were sufficiently correlated to apply factor analysis. Theresults of the factor analysis were used to construct unidimensional scales. The factorloadings determined which items were retained in a scale. Items loading high on afactor (40.40) for all occupational sectors, were retained. Prerequisite was that items
10
IJPPM62,1
loaded high on only one factor, as overlapping items hinder interpretation and scoringof factors.
Rasch analysis. To examine the functioning of the items in more detail, each scalewas examined using Rasch analysis (Rasch, 1960), a specific type of item responsetheory (IRT). The analysis was performed separately for each scale, because Raschanalysis must be performed on a unidimensional scale. In comparison with classicaltest theory (CTT), the Rasch model assesses a wider range of measurement properties,increasing the information available about a scale’s performance (Tennant et al., 2004;Tennant and Conaghan, 2007). For example, Rasch analysis provides information onitem difficulty (items are hierarchically ordered based on difficulty, expecting that if aperson with a certain ability scores well on a difficult item, then that person scores wellon easier items as well), response category ordening (does the category ordening ofpolytomous items work as expected), and differential item functioning (differential itemfunctioning (DIF); do subgroups in the sample respond differently to items). Analyseswere conducted using RUMM2020 software (Andrich et al., 2003).
Model fit. Data fit the Rasch model when observed responses are equivalent or donot greatly differ from responses expected by the Rasch model. The followingfit statistics test model fit: w2-fit, item fit residuals, and person fit residuals. Thew2-fit statistic is an item-trait interaction score, reflecting the property of invarianceacross the trait. Generally, a non-significant w2-fit statistics indicates model fit.However, this statistic is highly sample size dependent, and in large samples it isalmost certain to show significance because of the power of the test (Traub, 1983;Lundgren Nilsson and Tennant, 2011). RUMM2020 provides the option to reduce thesample by randomly selecting a specified number of persons from the existingsample. Therefore, model fit for the total sample was also tested by setting thesample size at 200 (Andrich and Styles, 2009). Item and person fit residualsrepresent the residuals between the observed and expected values for itemsand persons. Ideally, these should have a mean of approximately 0 and an SD of 1(Tennant and Conaghan, 2007).
Reliability. The person separation index (PSI) estimates the internal consistency of ascale. PSI is similar to Cronbach’s a (Cronbach, 1951), only it uses the logit scaleestimates as opposed to the raw scores. It is interpreted in a similar manner, that is, aminimum value of 0.70 is required for group use and 0.85 for individual use (Tennantand Conaghan, 2007).
Improving fit. Multiple statistics determine which items should be removed toimprove fit of a scale. Items with a high-fit residual (42.5) are first candidates fordeletion. Second, items with inadequate targeting are candidates for deletion. Third,items with a low slope are candidates for deletion, because they discriminate poorlybetween persons with low and high work performance. Furthermore, the content of theitems is taken into account, making sure to retain items with important content. Itemreduction is an iterative process, in which one item is removed at a time and fit re-estimated accordingly (De Vet et al., 2011).
Category ordening. In addition to good model fit, the data have to satisfy severalassumptions of the Rasch model. For one, Rasch analysis assumes that when usingpolytomous answer categories, a higher category reflects an increase in the underlyingability. If appropriate category ordening does not occur, the thresholds betweenadjacent answer categories are disordered (Tennant and Conaghan, 2007).
DIF. Rasch analysis assumes that a scale functions consistently, irrespective ofsubgroups within the sample being assessed. DIF affects model fit when different
11
Workperformance
questionnaire
groups within the sample respond in a different manner to an item, despite equal levelsof the underlying characteristic being measured (Tennant and Conaghan, 2007).
Local independence. Rasch analysis assumes that the response to an item isindependent of responses to other items, after controlling for the person’s ability. Whenthe answer to one item determines the answer to another item, there is a breach in localindependence. Such breaches are identified through the residual correlation matrix, bylooking for residual correlations0.40. Local independence is often used to give anindication of unidimensionality of a scale (Tennant and Conaghan, 2007).
Targeting of the scales. The person-item threshold map reveals the location of thepersons and the items on a linear scale that runs from �5 to þ 5, with 0 being theaverage item difficulty. This indicates how well targeted the items are for persons inthe sample (Tennant and Conaghan, 2007). An equal distribution of items is desired ifthe instrument has to discriminate between persons at various ranges on the scale.Examination of the distribution of the items over the scale shows whether there isscarceness of items, i.e. gaps at certain locations on the scale.
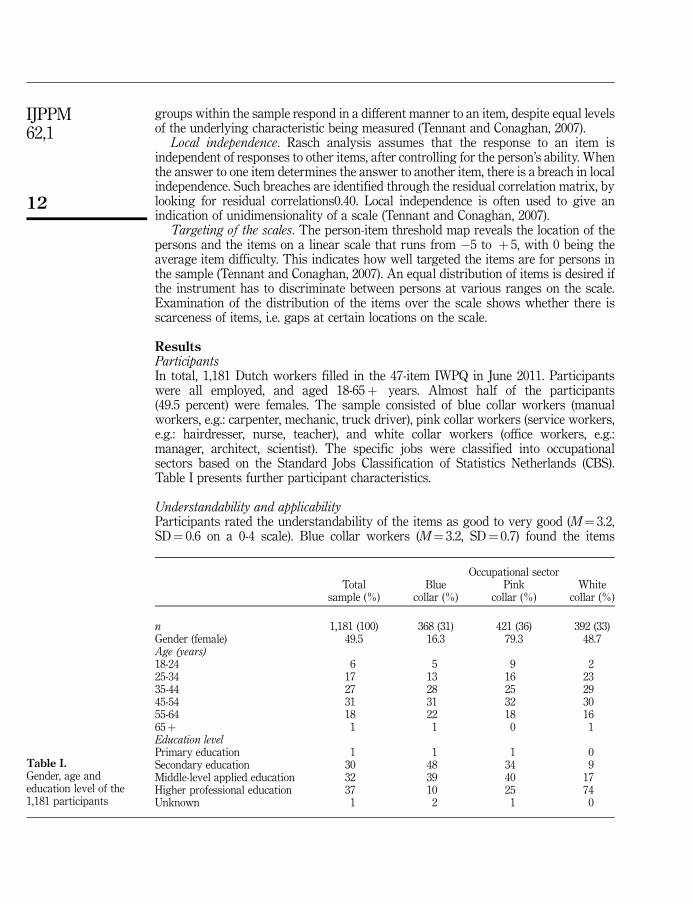
ResultsParticipantsIn total, 1,181 Dutch workers filled in the 47-item IWPQ in June 2011. Participantswere all employed, and aged 18-65þ years. Almost half of the participants(49.5 percent) were females. The sample consisted of blue collar workers (manualworkers, e.g.: carpenter, mechanic, truck driver), pink collar workers (service workers,e.g.: hairdresser, nurse, teacher), and white collar workers (office workers, e.g.:manager, architect, scientist). The specific jobs were classified into occupationalsectors based on the Standard Jobs Classification of Statistics Netherlands (CBS).Table I presents further participant characteristics.
Understandability and applicabilityParticipants rated the understandability of the items as good to very good (M¼ 3.2,SD¼ 0.6 on a 0-4 scale). Blue collar workers (M¼ 3.2, SD¼ 0.7) found the items
Occupational sectorTotal
sample (%)Blue
collar (%)Pink
collar (%)White
collar (%)
n 1,181 (100) 368 (31) 421 (36) 392 (33)Gender (female) 49.5 16.3 79.3 48.7Age (years)18-24 6 5 9 225-34 17 13 16 2335-44 27 28 25 2945-54 31 31 32 3055-64 18 22 18 1665þ 1 1 0 1Education levelPrimary education 1 1 1 0Secondary education 30 48 34 9Middle-level applied education 32 39 40 17Higher professional education 37 10 25 74Unknown 1 2 1 0
Table I.Gender, age andeducation level of the1,181 participants
12
IJPPM62,1
slightly less understandable than pink (M¼ 3.3, SD¼ 0.6) and white collar workers(M¼ 3.3, SD¼ 0.7), F(2, 1,178)¼ 4.037, po0.05. However, this difference is too small tobe considered practically relevant. Participants rated the applicability of the items totheir occupation as reasonable to good (M¼ 2.6, SD¼ 0.9 on a 0-4 scale). There wereno differences between occupational sectors regarding the applicability of the items totheir occupation, F(2, 1,178)¼ 2.071, p40.05.
Conceptual frameworkIn all, 38 of the 47 items showed ceiling effects, i.e. more than 15 percent of theresponses at the high end of the scale. Especially CWB items (recoded) showed ceilingeffects, ranging up to 96.6 percent of the scores at the extreme value. None of the itemsshowed very low (40.20) or very high (40.90) inter-item correlations. In total, 14 itemshad a “not applicable” category, which was used by 14 percent of the respondents, onaverage.
For each occupational sector, the inter-item correlations were appropriate for factoranalysis, with KMO measure of sampling adequacy being 40.90, and Bartlett’s test ofsphericity showing a p-valueo0.001. The scree plots identified three factors for blueand white collar workers, and four factors for pink collar workers. For all occupationalsectors, the task performance scale consisted of task performance items 3, 7-9, 11, 12,and contextual performance items 1, 2, and 5 (see Table II). In addition, contextualperformance items 4 and 6 were retained for blue collar workers. Task performanceitems 1, 2, 4, and 13 were retained for pink collar workers. Task performance items 1, 3,6, 13, and contextual performance items 3, 4, and 6 were retained for white collarworkers. For all occupational sectors, the contextual performance scale consisted ofcontextual performance items 7-10, 12-14, and adaptive performance items 1-8. Inaddition, contextual performance item 15 was retained for white collar workers.For blue and white collar workers, the counterproductive scale consisted of CWB items1-10. For pink collar workers, this scale was split into two factors: a minor CWB factor(Items 1-5), and a serious CWB factor (Items 6-10).
Rasch analysis of the scales per occupational sectorTo examine the functioning of the items in more detail, Rasch analysis was performedfor each scale, per occupational sector. After deleting misfitting items (see Table II), allthe scales showed good model fit (Table III, analyses 1-10). For all occupational sectors,the task performance scale included planning and organizing work (TP7), result-oriented working (TP9), prioritizing (TP11), and working efficiently (TP12). Inaddition, for blue collar workers, this scale included showing responsibility (CP1), andcommunicating effectively (CP4 and CP6). For pink collar workers, this scale alsoincluded showing responsibility (CP2). For white collar workers, this scale alsoincluded showing responsibility (CP1), cooperating with others (CP3), andcommunicating effectively (CP6).
For all occupational sectors, the contextual performance scale included takinginitiative (CP10), taking on challenging work tasks (CP14), keeping job knowledge andskills up-to-date (AP1 and AP2), and coming up with creative solutions to novel,difficult problems (AP6). In addition, for blue collar workers, this scale includedaccepting and learning from feedback (CP12 and CP13) and showing resiliency (AP3and AP5). For pink collar workers, this scale also included taking initiative (CP9). Forwhite collar workers, this scale also included taking initiative (CP9), accepting andlearning from feedback (CP12 and CP13), and showing resiliency (AP4 and AP5).
13
Workperformance
questionnaire
Tot
alsa
mp
leO
ccu
pat
ion
alse
ctor
Blu
eco
llar
Pin
kco
llar
Wh
ite
coll
arIt
ems
Rat
ing
scal
e(0
-4)
M(S
D)
M(S
D)
M(S
D)
M(S
D)
Under
standab
ilit
yand
app
lica
bility
1H
owu
nd
erst
and
able
wer
eth
eq
ues
tion
s?“B
ad”-
“ver
yg
ood
”3.
2(0
.6)
3.2
(0.7
)3.
3(0
.6)
3.3
(0.7
)2
How
app
rop
riat
ew
ere
the
qu
esti
ons
for
you
roc
cup
atio
n?
“Bad
”-“v
ery
goo
d”
2.6
(0.9
)2.
5(0
.9)
2.6
(0.9
)2.
6(0
.9)
Dim
ensi
on:
task
perf
orm
ance
TP
1H
owd
oyo
ura
teth
eq
ual
ity
ofyo
ur
own
wor
kin
the
pas
tth
ree
mon
ths?
“In
suff
icie
nt”
-“v
ery
goo
d”
3.0
(0.7
)3.
1(0
.7)a
3.0
(0.7
)b3.
0(0
.7)b
TP
2C
omp
ared
tola
stye
ar,
Iju
dg
eth
eq
ual
ity
ofm
yw
ork
inth
ep
ast
thre
em
onth
sto
bey
“Mu
chw
orse
”-“m
uch
bet
ter”
2.4
(0.6
)2.
3(0
.5)a
2.4
(0.7
)b2.
4(0
.7)a
TP
3H
owof
ten
was
the
qu
alit
yof
you
rw
ork
bel
oww
hat
itsh
ould
hav
eb
een
inth
ep
ast
thre
em
onth
s?
“Nev
er”-
“oft
en”
1.0
(0.7
)0.
9(0
.7)b
1.1
(0.8
)b1.
1(0
.7)b
TP
4H
owd
oy
oura
teth
eq
uan
tity
ofyo
ur
own
wor
kin
the
pas
tth
ree
mon
ths?
“In
suff
icie
nt”
-“v
ery
goo
d”
3.0
(0.9
)3.
0(0
.8)a
3.0
(0.8
)b2.
9(0
.9)a
TP
5C
omp
ared
tola
stye
ar,I
jud
ge
the
qu
anti
tyof
my
wor
kin
the
last
thre
em
onth
sto
bey
“Mu
chw
orse
”-“m
uch
bet
ter”
2.4
(0.8
)2.
4(0
.7)a
2.4
(0.8
)a2.
5(0
.8)a
TP
6H
owof
ten
was
the
qu
anti
tyof
you
rw
ork
less
than
itsh
ould
hav
eb
een
inth
ep
ast
thre
em
onth
s?
“Nev
er”-
“oft
en”
1.0
(0.9
)0.
9(0
.9)a
1.0
(0.9
)a1.
0(0
.9)b
TP
7cI
man
aged
top
lan
my
wor
kso
that
itw
asd
one
onti
me
“Sel
dom
”-“a
lway
s”3.
0(1
.0)
3.1
(0.9
)3.
0(1
.0)
2.8
(1.0
)T
P8
Iw
ork
edto
war
ds
the
end
resu
ltof
my
wor
k3.
2(0
.8)
3.3
(0.8
)b3.
3(0
.8)b
3.1
(0.9
)b
TP
9I
kep
tin
min
dth
ere
sult
sth
atI
had
toac
hie
ve
inm
yw
ork
3.3
(0.9
)3.
2(0
.9)
3.3
(0.8
)3.
3(0
.8)
TP
10I
had
trou
ble
sett
ing
pri
orit
ies
inm
yw
ork
.0.
8(1
.0)
0.7
(1.0
)a0.
8(1
.0)a
0.9
(0.9
)a
(con
tinu
ed)
Table II.Raw mean scores (M) andstandard deviations (SD)on the understandabilityand applicability items,and the individual workperformancequestionnaire (IWPQ)items (on a 0-4 scale)
14
IJPPM62,1
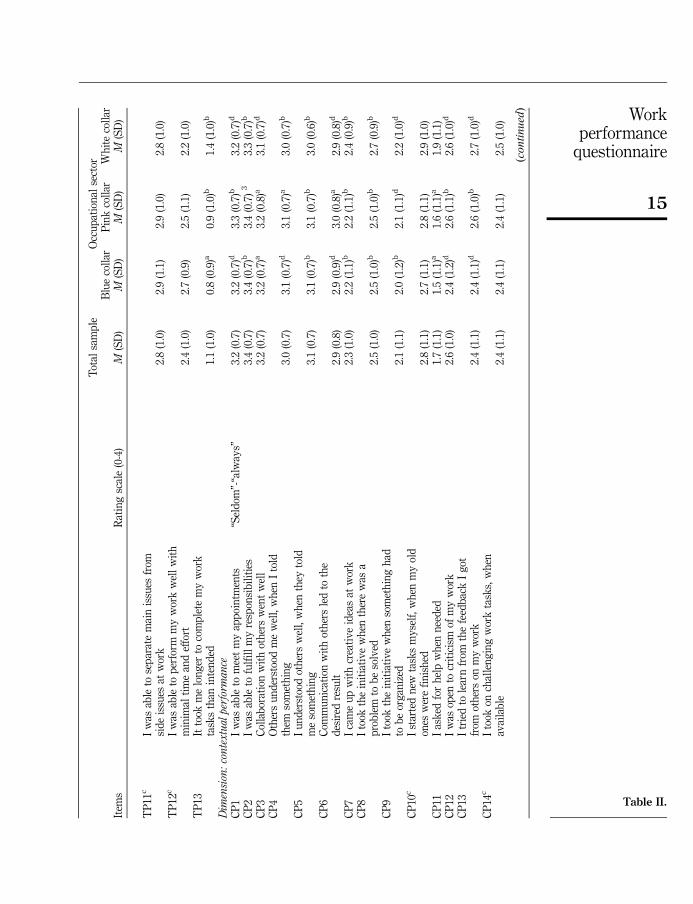
Table II.
Tot
alsa
mp
leO
ccu
pat
ion
alse
ctor
Blu
eco
llar
Pin
kco
llar
Wh
ite
coll
arIt
ems
Rat
ing
scal
e(0
-4)
M(S
D)
M(S
D)
M(S
D)
M(S
D)
TP
11c
Iw
asab
leto
sep
arat
em
ain
issu
esfr
omsi
de
issu
esat
wor
k2.
8(1
.0)
2.9
(1.1
)2.
9(1
.0)
2.8
(1.0
)T
P12
cI
was
able
top
erfo
rmm
yw
ork
wel
lw
ith
min
imal
tim
ean
def
fort
2.4
(1.0
)2.
7(0
.9)
2.5
(1.1
)2.
2(1
.0)
TP
13It
took
me
lon
ger
toco
mp
lete
my
wor
kta
sks
than
inte
nd
ed1.
1(1
.0)
0.8
(0.9
)a0.
9(1
.0)b
1.4
(1.0
)b
Dim
ensi
on:
conte
xtualpe
rfor
mance
CP
1I
was
able
tom
eet
my
app
oin
tmen
ts“S
eld
om”-
“alw
ays”
3.2
(0.7
)3.
2(0
.7)d
3.3
(0.7
)b3.
2(0
.7)d
CP
2I
was
able
tofu
lfil
lm
yre
spon
sib
ilit
ies
3.4
(0.7
)3.
4(0
.7)b
3.4
(0.7
)3
3.3
(0.7
)b
CP
3C
olla
bor
atio
nw
ith
oth
ers
wen
tw
ell
3.2
(0.7
)3.
2(0
.7)a
3.2
(0.8
)a3.
1(0
.7)d
CP
4O
ther
su
nd
erst
ood
me
wel
l,w
hen
Ito
ldth
emso
met
hin
g3.
0(0
.7)
3.1
(0.7
)d3.
1(0
.7)a
3.0
(0.7
)b
CP
5I
un
der
stoo
dot
her
sw
ell,
wh
enth
eyto
ldm
eso
met
hin
g3.
1(0
.7)
3.1
(0.7
)b3.
1(0
.7)b
3.0
(0.6
)b
CP
6C
omm
un
icat
ion
wit
hot
her
sle
dto
the
des
ired
resu
lt2.
9(0
.8)
2.9
(0.9
)d3.
0(0
.8)a
2.9
(0.8
)d
CP
7I
cam
eu
pw
ith
crea
tiv
eid
eas
atw
ork
2.3
(1.0
)2.
2(1
.1)b
2.2
(1.1
)b2.
4(0
.9)b
CP
8I
took
the
init
iati
ve
wh
enth
ere
was
ap
rob
lem
tob
eso
lved
2.5
(1.0
)2.
5(1
.0)b
2.5
(1.0
)b2.
7(0
.9)b
CP
9I
took
the
init
iati
ve
wh
enso
met
hin
gh
adto
be
org
aniz
ed2.
1(1
.1)
2.0
(1.2
)b2.
1(1
.1)d
2.2
(1.0
)d
CP
10c
Ist
arte
dn
ewta
sks
my
self
,w
hen
my
old
ones
wer
efi
nis
hed
2.8
(1.1
)2.
7(1
.1)
2.8
(1.1
)2.
9(1
.0)
CP
11I
ask
edfo
rh
elp
wh
enn
eed
ed1.
7(1
.1)
1.5
(1.1
)a1.
6(1
.1)a
1.9
(1.1
)C
P12
Iw
asop
ento
crit
icis
mof
my
wor
k2.
6(1
.0)
2.4
(1.2
)d2.
6(1
.1)b
2.6
(1.0
)d
CP
13I
trie
dto
lear
nfr
omth
efe
edb
ack
Ig
otfr
omot
her
son
my
wor
k2.
4(1
.1)
2.4
(1.1
)d2.
6(1
.0)b
2.7
(1.0
)d
CP
14c
Ito
okon
chal
len
gin
gw
ork
task
s,w
hen
avai
lab
le2.
4(1
.1)
2.4
(1.1
)2.
4(1
.1)
2.5
(1.0
)
(con
tinu
ed)
15
Workperformance
questionnaire
Tot
alsa
mp
leO
ccu
pat
ion
alse
ctor
Blu
eco
llar
Pin
kco
llar
Wh
ite
coll
arIt
ems
Rat
ing
scal
e(0
-4)
M(S
D)
M(S
D)
M(S
D)
M(S
D)
CP
15I
thin
kcu
stom
ers/
clie
nts
/pat
ien
tsw
ere
sati
sfie
dw
ith
my
wor
k3.
1(0
.6)
3.2
(0.6
)a3.
2(0
.6)a
3.0
(0.6
)b
CP
16I
took
into
acco
un
tth
ew
ish
esof
the
cust
omer
/cli
ent/
pat
ien
tin
my
wor
k3.
4(0
.7)
3.4
(0.7
)a3.
5(0
.7)a
3.1
(0.8
)a
Dim
ensi
on:
adapt
ive
perf
orm
ance
AP
1cI
wor
ked
atk
eep
ing
my
job
kn
owle
dg
eu
p-t
o-d
ate
“sel
dom
”-“a
lway
s”2.
1(1
.2)
2.0
(1.3
)2.
2(1
.2)
2.0
(1.1
)A
P2c
Iw
ork
edat
kee
pin
gm
yjo
bsk
ills
up
-to-
dat
e2.
4(1
.1)
2.3
(1.2
)2.
4(1
.1)
2.3
(1.0
)A
P3
Ih
ave
dem
onst
rate
dfl
exib
ilit
y3.
1(0
.8)
3.1
(0.9
)d3.
2(0
.8)b
3.0
(0.8
)b
AP
4I
was
able
toco
pe
wel
lw
ith
dif
ficu
ltsi
tuat
ion
san
dse
tbac
ks
atw
ork
2.6
(1.0
)2.
7(1
.0)b
2.6
(1.0
)b2.
5(0
.9)d
AP
5I
reco
ver
edfa
st,a
fter
dif
ficu
ltsi
tuat
ion
sor
setb
ack
sat
wor
k2.
7(0
.9)
2.8
(1.0
)d2.
7(0
.9)b
2.7
(0.9
)d
AP
6cI
cam
eu
pw
ith
crea
tiv
eso
luti
ons
ton
ewp
rob
lem
s2.
3(1
.0)
2.3
(1.1
)2.
3(1
.0)
2.4
(0.9
)
AP
7I
was
able
toco
pe
wel
lw
ith
un
cert
ain
and
un
pre
dic
tab
lesi
tuat
ion
sat
wor
k2.
6(0
.9)
2.6
(1.0
)b2.
7(0
.9)d
2.6
(0.9
)b
AP
8I
easi
lyad
just
edto
chan
ges
inm
yw
ork
2.8
(0.9
)2.
9(1
.0)b
2.7
(0.9
)d2.
8(0
.9)b
Dim
ensi
on:
counte
rpro
duct
ive
wor
kbe
havi
orC
WB
1cI
com
pla
ined
abou
tu
nim
por
tan
tm
atte
rsat
wor
k“N
ever
”-“o
ften
”1.
0(0
.9)
0.9
(0.9
)0.
9(0
.9)
1.2
(0.9
)C
WB
2cI
mad
ep
rob
lem
sg
reat
erth
anth
eyw
ere
atw
ork
0.6
(0.7
)0.
5(0
.7)
0.6
(0.7
)0.
8(0
.8)
CW
B3c
Ifo
cuse
don
the
neg
ativ
eas
pec
tsof
aw
ork
situ
atio
n,
inst
ead
ofon
the
pos
itiv
eas
pec
ts0.
9(0
.9)
0.8
(0.8
)0.
9(0
.9)
1.1
(0.9
)
(con
tinu
ed)
Table II.
16
IJPPM62,1
Tot
alsa
mp
leO
ccu
pat
ion
alse
ctor
Blu
eco
llar
Pin
kco
llar
Wh
ite
coll
arIt
ems
Rat
ing
scal
e(0
-4)
M(S
D)
M(S
D)
M(S
D)
M(S
D)
CW
B4c
Isp
oke
wit
hco
llea
gu
esab
out
the
neg
ativ
eas
pec
tsof
my
wor
k1.
4(1
.0)
1.2
(1.0
)1.
3(1
.0)
1.5
(0.9
)C
WB
5cI
spok
ew
ith
peo
ple
from
outs
ide
the
org
aniz
atio
nab
out
the
neg
ativ
eas
pec
tsof
my
wor
k1.
0(1
.0)
0.8
(0.9
)1.
0(1
.0)
1.1
(1.0
)C
WB
6I
pu
rpos
ely
wor
ked
slow
ly0.
2(0
.6)
0.3
(0.6
)b0.
2(0
.6)b
0.2
(0.6
)b
CW
B7
Ip
urp
osel
yle
ftm
yw
ork
soth
atso
meo
ne
else
had
tofi
nis
hit
0.1
(0.5
)0.
2(0
.5)b
0.1
(0.4
)b0.
1(0
.5)b
CW
B8
Ib
ehav
edru
del
yto
war
ds
som
eon
eat
wor
k0.
3(0
.6)
0.3
(0.6
)b0.
2(0
.5)b
0.3
(0.6
)b
CW
B9
Iq
uar
rell
edw
ith
my
coll
eag
ues
,man
ager
,or
cust
omer
s0.
3(0
.6)
0.3
(0.6
)b0.
3(0
.6)b
0.3
(0.6
)b
CW
B10
Ip
urp
osel
ym
ade
mis
tak
es0.
1(0
.3)
0.1
(0.3
)b0.
0(0
.3)b
0.1
(0.3
)b
Note
s:
aIt
ems
rem
oved
from
the
scal
eb
ased
onfa
ctor
anal
ysi
s;bit
ems
rem
oved
from
the
scal
eto
imp
rov
em
odel
fit;
c item
sth
atw
ere
incl
ud
edin
the
gen
eric
scal
es;
dit
ems
rem
oved
from
the
scal
eb
ecau
seit
was
job
-sp
ecif
ic
Table II.
17
Workperformance
questionnaire
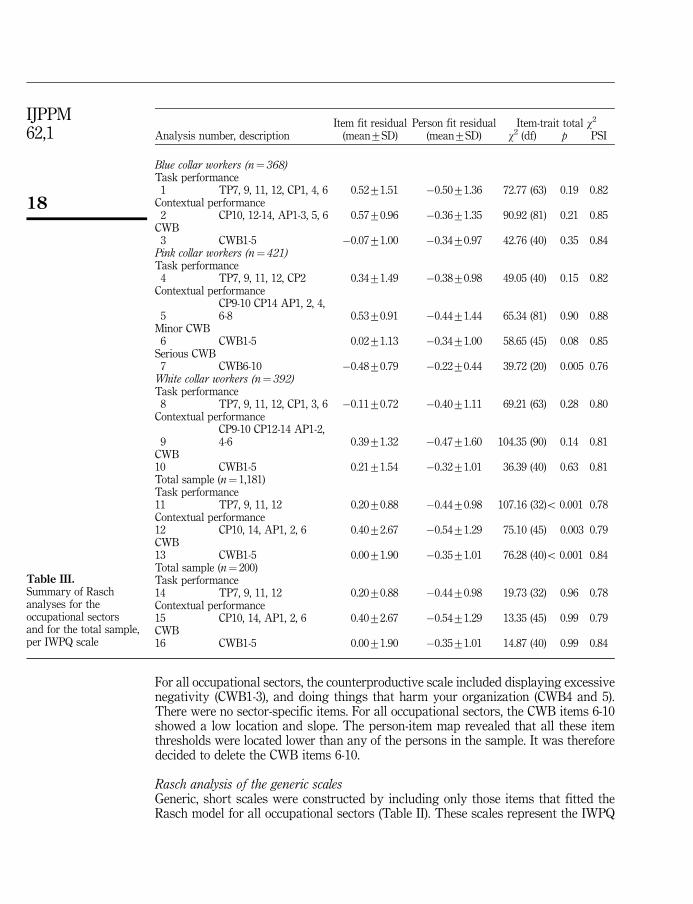
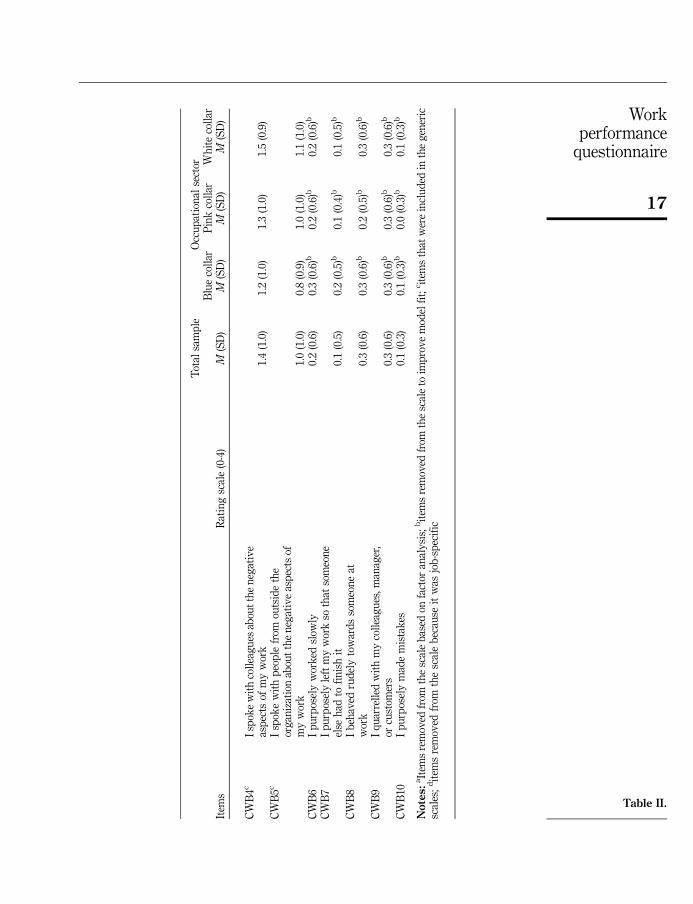
For all occupational sectors, the counterproductive scale included displaying excessivenegativity (CWB1-3), and doing things that harm your organization (CWB4 and 5).There were no sector-specific items. For all occupational sectors, the CWB items 6-10showed a low location and slope. The person-item map revealed that all these itemthresholds were located lower than any of the persons in the sample. It was thereforedecided to delete the CWB items 6-10.
Rasch analysis of the generic scalesGeneric, short scales were constructed by including only those items that fitted theRasch model for all occupational sectors (Table II). These scales represent the IWPQ
Item fit residual Person fit residual Item-trait total w2
Analysis number, description (mean7SD) (mean7SD) w2 (df) p PSI
Blue collar workers (n¼ 368)Task performance
1 TP7, 9, 11, 12, CP1, 4, 6 0.5271.51 �0.5071.36 72.77 (63) 0.19 0.82Contextual performance
2 CP10, 12-14, AP1-3, 5, 6 0.5770.96 �0.3671.35 90.92 (81) 0.21 0.85CWB
3 CWB1-5 �0.0771.00 �0.3470.97 42.76 (40) 0.35 0.84Pink collar workers (n¼ 421)Task performance
4 TP7, 9, 11, 12, CP2 0.3471.49 �0.3870.98 49.05 (40) 0.15 0.82Contextual performance
5CP9-10 CP14 AP1, 2, 4,6-8 0.5370.91 �0.4471.44 65.34 (81) 0.90 0.88
Minor CWB6 CWB1-5 0.0271.13 �0.3471.00 58.65 (45) 0.08 0.85
Serious CWB7 CWB6-10 �0.4870.79 �0.2270.44 39.72 (20) 0.005 0.76
White collar workers (n¼ 392)Task performance
8 TP7, 9, 11, 12, CP1, 3, 6 �0.1170.72 �0.4071.11 69.21 (63) 0.28 0.80Contextual performance
9CP9-10 CP12-14 AP1-2,4-6 0.3971.32 �0.4771.60 104.35 (90) 0.14 0.81
CWB10 CWB1-5 0.2171.54 �0.3271.01 36.39 (40) 0.63 0.81Total sample (n¼ 1,181)Task performance11 TP7, 9, 11, 12 0.2070.88 �0.4470.98 107.16 (32)o 0.001 0.78Contextual performance12 CP10, 14, AP1, 2, 6 0.4072.67 �0.5471.29 75.10 (45) 0.003 0.79CWB13 CWB1-5 0.0071.90 �0.3571.01 76.28 (40)o 0.001 0.84Total sample (n¼ 200)Task performance14 TP7, 9, 11, 12 0.2070.88 �0.4470.98 19.73 (32) 0.96 0.78Contextual performance15 CP10, 14, AP1, 2, 6 0.4072.67 �0.5471.29 13.35 (45) 0.99 0.79CWB16 CWB1-5 0.0071.90 �0.3571.01 14.87 (40) 0.99 0.84
Table III.Summary of Raschanalyses for theoccupational sectorsand for the total sample,per IWPQ scale
18
IJPPM62,1
version 0.2. For the task performance scale, this included planning and organizingwork (TP7), result-oriented working (TP9), prioritizing (TP11), and working efficiently(TP12). For the contextual performance scale, this included taking initiative (CP10),taking on challenging work tasks (CP14), keeping job knowledge and skills up-to-date(AP1 and AP2), and coming up with creative solutions to novel, difficult problems(AP6). For the counterproductive scale, this included displaying excessive negativity(CWB1-3), and doing things that harm your organization (CWB4 and 5).
Model fit. When testing the Rasch model for the total sample, the generic scalesshowed some misfit (analyses 11-13), as indicated by the significant w2-fit statistics.However, when setting the sample size at 200 (Andrich and Styles, 2009), the w2-fitstatistics became non-significant, indicating good model fit (analyses 14-16).Additionally, when testing the generic scales separately per occupational sector, thew2-fit statistics indicated good model fit (analyses not shown). This indicated that thepreviously significant w2-fit statistic was caused by the power of the test, and that thedata do in fact fit the Rasch model. The PSI ranged from 0.78 in the task performancescale to 0.84 in the CWB scale.
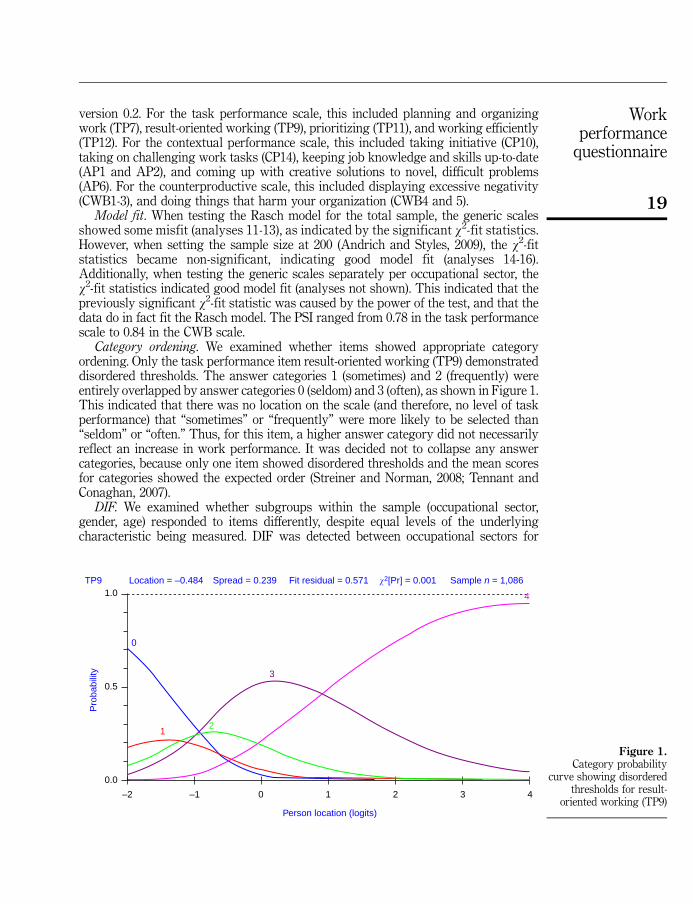
Category ordening. We examined whether items showed appropriate categoryordening. Only the task performance item result-oriented working (TP9) demonstrateddisordered thresholds. The answer categories 1 (sometimes) and 2 (frequently) wereentirely overlapped by answer categories 0 (seldom) and 3 (often), as shown in Figure 1.This indicated that there was no location on the scale (and therefore, no level of taskperformance) that “sometimes” or “frequently” were more likely to be selected than“seldom” or “often.” Thus, for this item, a higher answer category did not necessarilyreflect an increase in work performance. It was decided not to collapse any answercategories, because only one item showed disordered thresholds and the mean scoresfor categories showed the expected order (Streiner and Norman, 2008; Tennant andConaghan, 2007).
DIF. We examined whether subgroups within the sample (occupational sector,gender, age) responded to items differently, despite equal levels of the underlyingcharacteristic being measured. DIF was detected between occupational sectors for
TP9 Location = –0.484
0
12
3
4
Spread = 0.239 Fit residual = 0.571 �2[Pr] = 0.001 Sample n = 1,086
Person location (logits)
1.0
0.5
0.0
–2 –1 0 1 2 3 4
Pro
babi
lity
Figure 1.Category probability
curve showing disorderedthresholds for result-
oriented working (TP9)
19
Workperformance
questionnaire
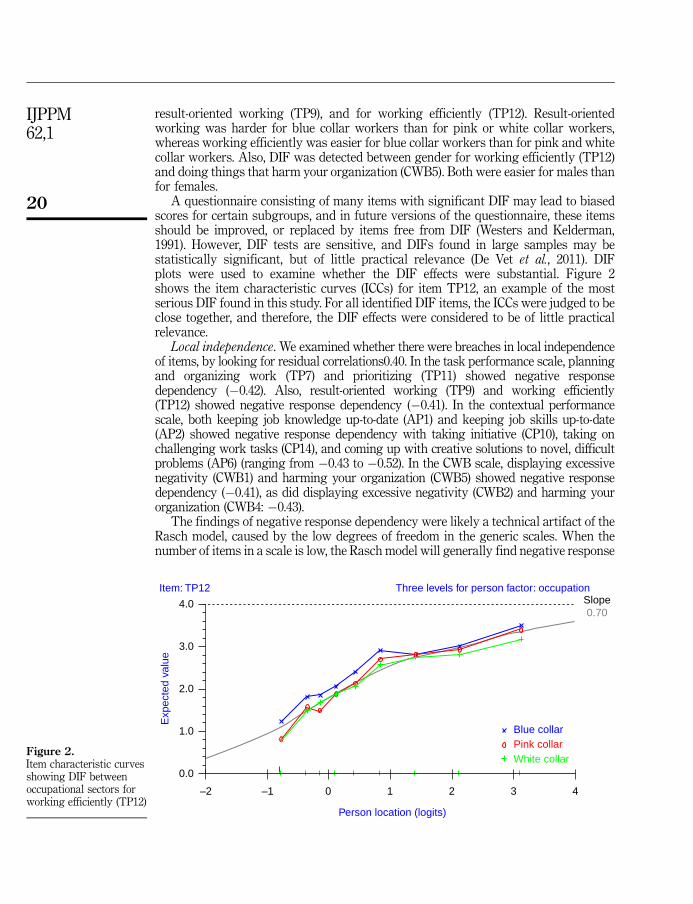
result-oriented working (TP9), and for working efficiently (TP12). Result-orientedworking was harder for blue collar workers than for pink or white collar workers,whereas working efficiently was easier for blue collar workers than for pink and whitecollar workers. Also, DIF was detected between gender for working efficiently (TP12)and doing things that harm your organization (CWB5). Both were easier for males thanfor females.
A questionnaire consisting of many items with significant DIF may lead to biasedscores for certain subgroups, and in future versions of the questionnaire, these itemsshould be improved, or replaced by items free from DIF (Westers and Kelderman,1991). However, DIF tests are sensitive, and DIFs found in large samples may bestatistically significant, but of little practical relevance (De Vet et al., 2011). DIFplots were used to examine whether the DIF effects were substantial. Figure 2shows the item characteristic curves (ICCs) for item TP12, an example of the mostserious DIF found in this study. For all identified DIF items, the ICCs were judged to beclose together, and therefore, the DIF effects were considered to be of little practicalrelevance.
Local independence. We examined whether there were breaches in local independenceof items, by looking for residual correlations0.40. In the task performance scale, planningand organizing work (TP7) and prioritizing (TP11) showed negative responsedependency (�0.42). Also, result-oriented working (TP9) and working efficiently(TP12) showed negative response dependency (�0.41). In the contextual performancescale, both keeping job knowledge up-to-date (AP1) and keeping job skills up-to-date(AP2) showed negative response dependency with taking initiative (CP10), taking onchallenging work tasks (CP14), and coming up with creative solutions to novel, difficultproblems (AP6) (ranging from �0.43 to �0.52). In the CWB scale, displaying excessivenegativity (CWB1) and harming your organization (CWB5) showed negative responsedependency (�0.41), as did displaying excessive negativity (CWB2) and harming yourorganization (CWB4: �0.43).
The findings of negative response dependency were likely a technical artifact of theRasch model, caused by the low degrees of freedom in the generic scales. When thenumber of items in a scale is low, the Rasch model will generally find negative response
4.0
3.0
2.0
1.0
0.0
–2 –1 0 1
Person location (logits)
Item: TP12 Three levels for person factor: occupation
Blue collar
White collarPink collar
Exp
ecte
d va
lue
2
Slope0.70
3 4
Figure 2.Item characteristic curvesshowing DIF betweenoccupational sectors forworking efficiently (TP12)
20
IJPPM62,1
dependencies. This can be illustrated by the following example: in a two-item scale, asum score of 3 can come about in two different ways. Namely, a person scores 1 onthe first item and 2 on the second item, or a person scores 2 on the first item and1 on the second item. The difference between each item must be �1. Consequently, theresidual correlations will always be negative (RUMM Laboratory, 2011). In addition,the negative response dependency may partly be caused by the large sample size. If thenumber of persons is very large, all observed correlations will be statisticallysignificantly different from 0, even when items fit the Rasch model perfectly (RUMMLaboratory, 2011). These explanations were supported by the finding that the negativeresponse dependencies disappeared in the job-specific scales, where the degrees offreedom were higher, and the sample size was smaller.
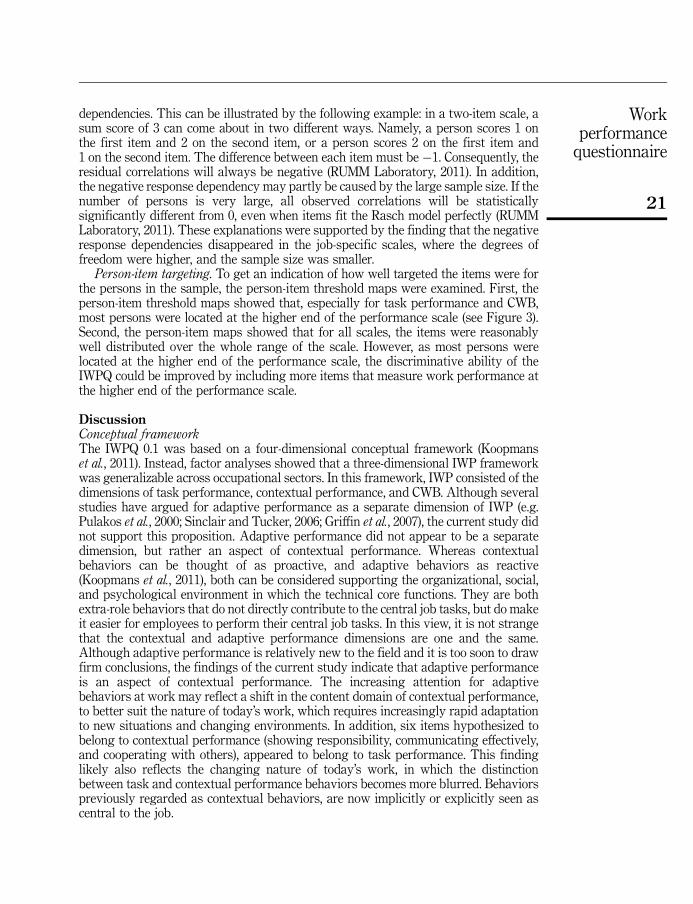
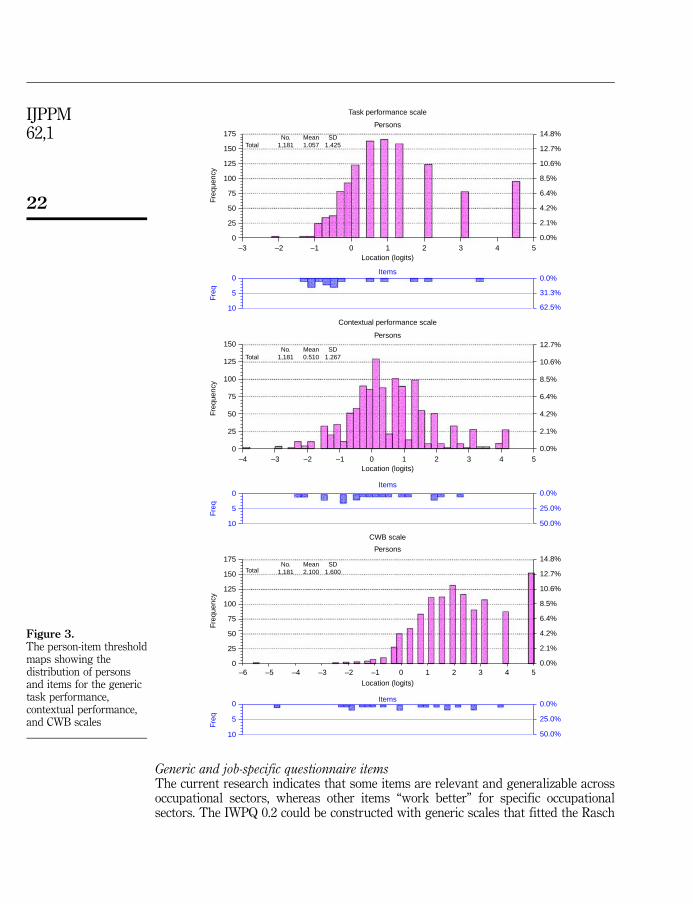
Person-item targeting. To get an indication of how well targeted the items were forthe persons in the sample, the person-item threshold maps were examined. First, theperson-item threshold maps showed that, especially for task performance and CWB,most persons were located at the higher end of the performance scale (see Figure 3).Second, the person-item maps showed that for all scales, the items were reasonablywell distributed over the whole range of the scale. However, as most persons werelocated at the higher end of the performance scale, the discriminative ability of theIWPQ could be improved by including more items that measure work performance atthe higher end of the performance scale.
DiscussionConceptual frameworkThe IWPQ 0.1 was based on a four-dimensional conceptual framework (Koopmanset al., 2011). Instead, factor analyses showed that a three-dimensional IWP frameworkwas generalizable across occupational sectors. In this framework, IWP consisted of thedimensions of task performance, contextual performance, and CWB. Although severalstudies have argued for adaptive performance as a separate dimension of IWP (e.g.Pulakos et al., 2000; Sinclair and Tucker, 2006; Griffin et al., 2007), the current study didnot support this proposition. Adaptive performance did not appear to be a separatedimension, but rather an aspect of contextual performance. Whereas contextualbehaviors can be thought of as proactive, and adaptive behaviors as reactive(Koopmans et al., 2011), both can be considered supporting the organizational, social,and psychological environment in which the technical core functions. They are bothextra-role behaviors that do not directly contribute to the central job tasks, but do makeit easier for employees to perform their central job tasks. In this view, it is not strangethat the contextual and adaptive performance dimensions are one and the same.Although adaptive performance is relatively new to the field and it is too soon to drawfirm conclusions, the findings of the current study indicate that adaptive performanceis an aspect of contextual performance. The increasing attention for adaptivebehaviors at work may reflect a shift in the content domain of contextual performance,to better suit the nature of today’s work, which requires increasingly rapid adaptationto new situations and changing environments. In addition, six items hypothesized tobelong to contextual performance (showing responsibility, communicating effectively,and cooperating with others), appeared to belong to task performance. This findinglikely also reflects the changing nature of today’s work, in which the distinctionbetween task and contextual performance behaviors becomes more blurred. Behaviorspreviously regarded as contextual behaviors, are now implicitly or explicitly seen ascentral to the job.
21
Workperformance
questionnaire
Generic and job-specific questionnaire itemsThe current research indicates that some items are relevant and generalizable acrossoccupational sectors, whereas other items “work better” for specific occupationalsectors. The IWPQ 0.2 could be constructed with generic scales that fitted the Rasch
Task performance scale
Persons
TotalNo.
1,181Mean1.057
SD1.425
TotalNo.
1,181Mean2.100
SD1.600
TotalNo.
1,181Mean0.510
SD1.267
14.8%
12.7%
14.8%
12.7%
10.6%
8.5%
6.4%
4.2%
2.1%
0.0%
Location (logits)
10.6%
8.5%
6.4%
4.2%
2.1%
0.0%
Location (logits)
12.7%
10.6%
8.5%
6.4%
4.2%
2.1%
0.0%
Location (logits)
Contextual performance scale
Persons150
125
100
75
50
25
0
CWB scale
Persons
Freq
uenc
y
175
150
125
100
75
50
25
0–6 –5 –4 –3 –2 –1 0 1 2 3 4 5
Freq
uenc
y
175
150
125
100
75
50
25
0
0
5
10 62.5%
31.3%
0.0%
50.0%
25.0%
0.0%
50.0%
25.0%
0.0%
Items
Freq
0
5
10
Items
Freq
0
5
10
Items
Freq
–4 –3 –2 –1 0 1 2 3 4 5
–3 –2 –1 0 1 2 3 4 5
Freq
uenc
y
Figure 3.The person-item thresholdmaps showing thedistribution of personsand items for the generictask performance,contextual performance,and CWB scales
22
IJPPM62,1
model well. The task performance scale included indicators measuring planningand organizing work, result-oriented working, prioritizing, and working efficiently.The contextual performance scale included indicators measuring taking initiative,taking on challenging work tasks, keeping job knowledge and skills up-to-date, andcoming up with creative solutions to novel, difficult problems. The CWB scale includedindicators measuring displaying excessive negativity, and doing things that harm yourorganization.
The results of the current study indicated that the work quality and quantityindicators did not fit well with the other indicators of task performance. In literatureand in existing questionnaires, however, these are traditionally two of the most oftenmeasured indicators of task performance (e.g. Rotundo and Sackett, 2002; Koopmanset al., submitted). Based on the conceptual definition of IWP (behaviors or actions thatare relevant to the goals of the organization, and under control of the individual), theIWPQ focussed on measuring indicators reflecting employee behaviors as opposed tothe effectiveness of these behaviors. Work quality and quantity may actually reflect theeffectiveness of employee behaviors rather than employee behaviors in themselves.Although the effectiveness of employee behaviors is certainly important froman organization’s standpoint, strictly conceptual it should not be part of IWPQsmeasuring employee behaviors. In addition, measures of effectiveness are likely to bemore reflective of individual differences in abilities or skills (e.g. cognitive ability, socialskill), and are frequently influenced by factors outside the control of the individual(e.g. technical problems, economic influences) (Penney et al., 2011).
Also, there was discrepancy between answers on serious CWB items (doing thingsthat harm your co-workers or supervisor, and purposely making mistakes) and minorCWB items (displaying excessive negativity, doing things that harm the organization).This was most evident for pink collar workers, for whom the CWB dimension was splitinto two separate dimensions of minor and serious CWB. In all Rasch analyses, seriousCWB items showed extreme ceiling effects, very low locations, and very low slopes.This could be due to the actual low occurrence of these behaviors, or due to worker’sreluctance to honestly admit to serious CWB (social desirability). Thus, the currentfindings show that when aiming to assess IWP in a general working population,including serious CWB items may not be the best way to do this.
Generic scalesGeneric scales could be constructed, supporting the use of an IWP questionnaire thatcan be utilized in all types of jobs. Generic scales pose considerable advantages inresearch, such as ease of administration and comparability between groups. Althoughthe generic scales showed good model fit, in some cases, job-specific scales may bepreferred over generic scales. The job-specific scales showed a somewhat better fit, anda higher reliability, than the generic scales. Consequently, job-specific scales maybe better able to spread out persons in the sample. Depending on their goal,researchers could choose to use a generic questionnaire (e.g. in nationwide surveys), ora job-specific questionnaire (e.g. in specific companies). Due to its generic nature,the IWPQ is not recommended for use in individual evaluations, assessments, and/orfeedback.
Occupational sectors, and men and women, were found to respond differently toseveral items. A questionnaire consisting of many items with DIF may lead to biasedscores for certain subgroups, because it is harder for them to achieve a good scoreon the questionnaire, despite equal levels of ability. Ideally, one should not compare
23
Workperformance
questionnaire
the scores of subgroups when there are items with substantial DIF in the scale.However, DIF tests are sensitive (De Vet et al., 2011), and the DIF effects identified inthis study were considered to be of little practical relevance. Therefore, comparisonsbetween occupational sectors, gender, and age groups on the IWPQ are justified.
Self-report questionnaireThe IWPQ was developed as a self-report questionnaire. Several downsidesaccompany self-reporting of performance, as opposed to objective measures or peer-or managerial ratings. First, self-ratings have a lower correlation with objectiveperformance than managerial ratings. Jaramillo et al. (2005) showed that managerialratings correlated 0.44 with objective performance, whereas self-reports correlated0.34 with objectives measures. Also, low correlations between self- and managerialratings of performance are generally found, with meta-analyses reporting correlationsbetween 0.35 (Harris and Schaubroeck, 1988) and 0.19 ( Jaramillo et al., 2005). Second,self-ratings are known to show leniency effects (Van der Heijden and Nijhof, 2004).That is, people are naturally motivated to present themselves in a favorable, sociallydesirable light. As a result, self-ratings of performance are generally one half to onestandard deviation higher than ratings by peers or managers (Van der Heijden andNijhof, 2004).
Nevertheless, self-report scales were chosen for several reasons. First, in manyoccupations, objective measures of performance are not easily obtainable ( Jaramilloet al., 2005). Especially for knowledge work or high-complexity jobs, direct measures ofcountable behaviors or outcomes such as production quantity or number of errorsmade, are almost impossible. Second, employees often have more opportunity toobserve their own behaviors than peers or managers do (Van der Heijden and Nijhof,2004). This may be especially true for counterproductive behaviors, because most ofthese behaviors are intended to be private and, hence, unobservable. It follows thatpeers or supervisors have little basis for judging many counterproductive behaviors(Dalal, 2005). A recent study by Berry et al. (2012) found that self-reports of CWB areactually more viable than other-ratings, with self-raters reporting engaging in morecounterproductive behaviors than other raters reported them engaging in. Third, peersor managers rate an employee’s performance on basis of their general impression ofthe employee (Dalal, 2005; Viswesvaran et al., 2005). This effect is named the haloeffect. As a result, scores on the different dimensions of IWP are more similar andinter-correlations between the dimensions are overestimated. Finally, compared toobjective measures or managerial ratings, self-reports have practical advantages suchas ease of collection, issues of confidentiality, and less problems with missing data(Schoorman and Mayer, 2008).
Strengths and limitationsThe development of the IWPQ was based on thorough theoretical and practicalexamination. Care was taken to include generic indicators that covered the entiredomain of IWP, that were equally relevant across occupational sectors, and that did notshow overlapping content between dimensions. To guarantee this, thorough researchabout potential indicators was conducted before constructing the questionnaire(Koopmans et al., 2011, submitted). In addition, a reflective model was used to constructthe questionnaire, in which the indicators were manifestations of the construct beingmeasured. This implies that the indicators will correlate with each other, and also thatthey may replace each other, i.e. they are interchangeable. For that reason, it is not
24
IJPPM62,1
disastrous to miss some items that are also good indicators of the construct(De Vet et al., 2011).
Another strength of the present study is that it is the first to develop or evaluate anIWPQ using Rasch analysis. This offered unique insights into the IWPQ scalecharacteristics. Rasch analysis ensured that key measurement assumptions, such asappropriate category ordening, local independence, and differential item functioning,were tested. In addition, Rasch analysis has particular value in the development of newquestionnaires, specifically in guiding item reduction (Tennant et al., 2004). It ensuresthat the items are well distributed over the whole range of the work performance scale.CTT techniques of item reduction rely on item-total correlations and/or indices ofinternal consistency, which can have unfortunate effects on the sensitivity ofquestionnaires and their ability to provide valid scores at the extremes of themeasurement range. In CTT, items at the extremes of the measurement range are oftendiscarded because too many or too few persons affirm them. In reality, these “extreme”items may be the most important in a scale – extending the range of coverage of theconstruct (Tennant et al., 2004).
The present study has some limitations as well. First, the IWPQ has not yet provento be generalizable to managerial ratings. As mentioned before, low correlationsbetween self- and managerial ratings of performance are generally found. Also,different factor structures have been found among self- and managerial ratings(Thornton, 1980; Spector et al., 2010). Due to the halo effect, supervisors rate theiremployee’s performance in a more general way, leading to less discrimination betweendifferent dimensions of IWP for managerial ratings than for self-ratings. Thus,a simpler factor structure may be found for managerial ratings than for self-ratings.The convergence in scores between the different ratings sources, as well asgeneralizability of the factor structure of the IWPQ to managerial ratings, needsfurther examination.
Second, despite the shifted center of the rating scales, many persons scored high onthe IWPQ items. This showed up in the item mean scores and in the Rasch analysis,where many persons had a high location on the person-item map. The high scorescould be caused by the tendency of persons to evaluate themselves in a favorable light(leniency effect). Alternatively, the items may simply not be difficult enough for thepersons in the sample. Especially for the task performance and CWB scale, there weretoo few items to measure the higher range of the scale. As a result, it is harder todiscriminate among persons with high task performance and persons with low CWB,and to detect changes among these groups. In order to improve the discriminativeability of the IWPQ at the high ranges of the scale, adding extra answer categories isnot an option. This will only test the response tendencies of the individual’s willingnessto give extreme answers, and to what extent they can distinguish between the differentanswer categories. However, extra items could be formulated which cover the higherrange of the ability scale (De Vet et al., 2011). This will show whether the high scoreswere caused by the lack of difficult items, or whether a leniency effect is at play.
ConclusionThe aim of this study was to develop a generic and short questionnaire to measurework performance at the individual level. The IWPQ was developed, in which IWPconsisted of the three dimensions of task performance, contextual performance, andCWB. The operationalization of the IWPQ scales was based on relevant and genericindicators, and the scales were refined based on a large, generic sample using the
25
Workperformance
questionnaire
latest statistical techniques. Short scales were constructed consisting of itemsthat were relevant across all occupational sectors, supporting the use of a genericmeasure of IWP. Future research will need to focus on further developing andtesting the reliability and validity of the IWPQ. The construct validity, sensitivityto change, and interpretability of the IWPQ need to be examined. One of the mainadjustments to be made to the IWPQ is to formulate extra items, which coverthe higher range of the ability scale. This will improve the questionnaire’sdiscriminative ability, and sensitivity to change. Overall, the IWPQ facilitatesresearchers in measuring IWP more easily and comprehensively. In addition, unifiedmeasurement of IWP will increase comparability of studies. In the future, the IWPQwill hopefully contribute toward establishing the predictors and effects of IWP evenmore accurately and completely.
References
Andrich, D. and Styles, I.M. (2009), “Distractors with information in multiple choice items:a rationale based on the Rasch model”, in Smith, E. and Stone, G. (Eds), CriterionReferenced Testing: Using Rasch Measurement Models, JAM Press, Maple Grove, MN,pp. 24-70.
Andrich, D., Lyne, A., Sheridan, B. and Luo, G. (2003), RUMM 2020, RUMM Laboratory, Perth.
Austin, J.T. and Villanova, P. (1992), “The criterion problem: 1917-1992”, Journal of AppliedPsychology, Vol. 77 No. 6, pp. 836-74.
Bennett, R.J. and Robinson, S.L. (2000), “Development of a measure of workplace deviance”,Journal of Applied Psychology, Vol. 85 No. 3, pp. 349-60.
Berry, C.M., Carpenter, N.C. and Barratt, C.L. (2012), “Do other-reports of counterproductive workbehavior provide an incremental contribution over self-reports? A meta-analyticcomparison”, Journal of Applied Psychology, Vol. 97 No. 3, pp. 613-36.
Borman, W.C. and Motowidlo, S.J. (1993), “Expanding the criterion domain to include elements ofcontextual performance”, in Schmitt, N. and Borman, W.C. (Eds), Personnel Selection inOrganizations, Jossey Bass, San Francisco, CA, pp. 71-98.
Campbell, J.P. (1990), “Modeling the performance prediction problem in industrial andorganizational psychology”, in Dunnette, M.D. and Hough, L.M. (Eds), Handbook ofIndustrial and Organizational Psychology, Consulting Psychologists Press, Palo Alto, CA,pp. 687-732.
Cronbach, I.J. (1951), “Coefficient alpha and the internal structure of tests”, Psychometrika, Vol. 16No. 3, pp. 297-333.
Dalal, R.S. (2005), “A meta-analysis of the relationship between organizational citizenshipbehavior and counterproductive work behavior”, Journal of Applied Psychology, Vol. 90No. 6, pp. 1241-55.
De Vet, H.C.W., Terwee, C.B., Mokkink, L.B. and Knol, D.L. (2011), Measurement in Medicine,Cambridge University Press, New York, NY.
Griffin, M.A., Neal, A. and Parker, S.K. (2007), “A new model of work role performance: positivebehavior in uncertain and interdependent contexts”, Academy of Management Journal,Vol. 50 No. 2, pp. 327-47.
Harris, M.M. and Schaubroeck, J. (1988), “A meta-analysis of self-supervisor, self-peer, and peer-supervisor ratings”, Personnel Psychology, Vol. 41 No. 1, pp. 43-62.
Jaramillo, F., Carrillat, F.A. and Locander, W.B. (2005), “A meta-analytic comparison ofmanagerial ratings and self-evaluations”, Journal of Personal Selling & Sales Management,Vol. XXV No. 4, pp. 315-28.
26
IJPPM62,1
Koopmans, L., Bernaards, C.M., Hildebrandt, V.H., De Vet, H.C.W. and Van der Beek, A.J.(submitted), “Measuring individual work performance – identifying and selectingindicators”.
Koopmans, L., Bernaards, C.M., Hildebrandt, V.H., Schaufeli, W.B., De Vet, H.C.W. and Van derBeek, A.J. (2011), “Conceptual frameworks of individual work performance – a systematicreview”, Journal of Occupational and Environmental Medicine, Vol. 53 No. 8, pp. 856-66.
Lundgren Nilsson, A. and Tennant, A. (2011), “Past and present issues in Rasch analysis: thefunctional independence measure (FIMt) revisited”, Journal of Rehabilitation Medicine,Vol. 43 No. 10, pp. 884-91.
Penney, L.M., David, E. and Witt, L.A. (2011), “A review of personality and performance:identifying boundaries, contingencies, and future research directions”, Human ResourceManagement Review, Vol. 21 No. 4, pp. 297-310.
Podsakoff, P.M. and MacKenzie, S.B. (1989), A Second Generation Measure of OrganizationalCitizenship Behavior, Indiana University, Bloomington, IN.
Pulakos, E.D., Arad, S., Donovan, M.A. and Plamondon, K.E. (2000), “Adaptability in theworkplace: development of a taxonomy of adaptive performance”, Journal of AppliedPsychology, Vol. 85 No. 4, pp. 612-24.
Rasch, G. (1960), Probabalistic Models for Some Intelligence and Attainment Tests, University ofChicago Press, Chicago, IL.
Rotundo, M. and Sackett, P.R. (2002), “The relative importance of task, citizenship, andcounterproductive performance to global ratings of performance: a policy-capturingapproach”, Journal of Applied Psychology, Vol. 87 No. 1, pp. 66-80.
RUMM Laboratory (2011), “Factor analysis and negative PCA values”, available at:www.rummlab.com.au/faq12.html (accessed March 15, 2012).
Schoorman, D.F. and Mayer, R.C. (2008), “The value of common perspectives in self-reportedappraisals: you get what you ask for”, Organizational Research Methods, Vol. 11 No. 1,pp. 148-59.
Schwarz, N. and Oyserman, D. (2001), “Asking questions about behavior: cognition,communication, and questionnaire construction”, American Journal of Evaluation,Vol. 22 No. 2, pp. 127-60.
Sinclair, R.R. and Tucker, J.S. (2006), “Stress-care: an integrated model of individual differences insoldier performance under stress”, in Britt, T.W., Castro, C.A. and Adler, A.B. (Eds),Military Life: The Psychology of Serving in Peace and Combat (Vol. 1): MilitaryPerformance, Praeger Security International, Westport, CT, pp. 202-31.
Spector, P.E., Bauer, J.A. and Fox, S. (2010), “Measurement artifacts in the assessment ofcounterproductive work behavior and organizational citizenship behavior: do we knowwhat we think we know?”, Journal of Applied Psychology, Vol. 97 No. 4, pp. 781-90.
Spector, P.E., Fox, S., Penney, L.M., Bruursema, K., Goh, A. and Kessler, S. (2006), “Thedimensionality of counterproductivity: are all counterproductive behaviors createdequal?”, Journal of Vocational Behavior, Vol. 68 No. 3, pp. 446-60.
Streiner, D.L. and Norman, G.R. (2008), Health Measurement Scales: A Practical Guide to theirDevelopment, 4th ed., Oxford University Press, New York, NY.
Tennant, A. and Conaghan, P.G. (2007), “The Rasch measurement model in rheumatology:what is it and why use it? When should it be applied, and what should one look for in aRasch paper?”, Arthritis & Rheumatism (Arthritis Care & Research), Vol. 57 No. 8,pp. 1358-62.
Tennant, A., McKenna, S.P. and Hagell, P. (2004), “Application of Rasch analysis inthe development and application of quality of life instruments”, Value in Health, Vol. 7No. S1, pp. S22-S26.
27
Workperformance
questionnaire
Thornton, G.C. (1980), “Psychometric properties of self-appraisals of job performance”, PersonnelPsychology, Vol. 33 No. 2, pp. 263-71.
Traub, R.E. (1983), “A priori considerations in choosing an item response model”, inHambleton, R.K. (Ed.), Applications of Item Response Theory, Educational ResearchInstitute of British Columbia, Vancouver, BC, pp. 57-70.
Van der Heijden, B.I.J.M. and Nijhof, A.H.J. (2004), “The value of subjectivity: problems andprospects for 36-degree appraisal systems”, The International Journal of Human ResourceManagement, Vol. 15 No. 3, pp. 493-511.
Van Scotter, J.R. and Motowidlo, S.J. (1996), “Interpersonal facilitation and job dedicationas separate facets of contextual performance”, Journal of Applied Psychology, Vol. 815,pp. 525-31.
Viswesvaran, C. and Ones, D.S. (2000), “Perspectives on models of job performance”,International Journal of Selection and Assessment, Vol. 8 No. 4, pp. 216-26.
Viswesvaran, C., Schmidt, F.L. and Ones, D.S. (2005), “Is there a general factor in ratingsof job performance? A meta-analytic framework for disentangling substantive and errorinfluences”, Journal of Applied Psychology, Vol. 90 No. 1, pp. 108-31.
Westers, P. and Kelderman, H. (1991), “Examining differential item functioning due to itemdifficulty and alternate attractiveness”, Psychometrika, Vol. 57 No. 1, pp. 107-18.
Williams, L.J. and Anderson, S.E. (1991), “Job satisfaction and organizational commitment aspredictors of organizational citizenship and in-role behaviors”, Journal of Management,Vol. 17 No. 3, pp. 601-17.
Corresponding authorLinda Koopmans can be contacted at: [email protected]
To purchase reprints of this article please e-mail: [email protected] visit our web site for further details: www.emeraldinsight.com/reprints
28
IJPPM62,1