image authentication with tampering localization based...
TRANSCRIPT

Image Authentication with Tampering Localization Based onWatermark Embedding in Wavelet Domain
Hsuan T. Chang1, Chih-Chung Hsu2, Chia-Hung Yeh3, Day-Fann Shen1
1Department of Electrical EngineeringNational Yunlin University of Science and Technology
Douliu Yunlin, 640 Taiwan ROC2 Department of Electrical Engineering
National Tsinhwa UniversityHsinchu City, 300 Taiwan ROC
3Center for Wireless Multimedia CommunicationsDepartment of Electrical Engineering
National Sun Yat-Sen UniversityKaoshiung, 804 Taiwan ROC
Abstract
An image authentication and tampering localization technique based on a wavelet-based
digital watermarking technique [8] is proposed. To determine whether a given watermarked
image has been tampered or not, the similarity between the extracted and embedded water-
marks is measured. If the similarity is less than a threshold value, the proposed sequential
watermark alignment based on coefficient stamping (SWACS) scheme is used to determine
the modified wavelet coefficients corresponding to the tampered region. Then, the morpho-
logical region growing and subband duplication (MRGSD) scheme are used to include neigh-
boring wavelet coefficients and then duplicate the wavelet coefficients in other subbands. The
experimental results show that the proposed SWACS and MRGSD schemes can efficiently
identify different types of image tampering. Moreover, the detection performance of the
proposed system on various sizes of the watermark and tampered region is also evaluated.
Keywords: image authentication, tampering localization, digital watermarking, morphology.
February 24, 2009
1
1 Introduction
Image watermarking techniques recently have received a great deal of attention due to the need of
data protection in electronic commerce and surveillance systems [1, 2]. A watermark can be em-
bedded into the image plane directly or in the frequency domain using mathematical transforms
such as Fourier transform, discrete cosine transform (DCT), or discrete wavelet transform (DWT)
[3]-[7]. Two issues of watermarks, the robustness and fragility, are significant considerations for
the use of watermarks in different applications. Among existing techniques, blind watermarking
for images [8, 9, 10] is required when the receiver cannot obtain the original images in advance,
especially for the image authentication applications. Because images are usually compressed
before the transmission or storage, the watermark should be robust to compression. When the
extracted watermark is distorted, it is important to distinguish that the distortion is caused from
the compression or from illegal tampering. In addition to digital right protection, audio, image,
and video authentications are also important applications of watermarking for security or surveil-
lance systems [11, 12, 13]. Fragile watermarks are embedded into video frames or images when
they are just generated or during the compression stage. If the image/video content is modified,
the fragile watermark is then distorted. Therefore, whether the image has been tampered or not
can be identified via the examination of the extracted watermark. Moreover, it is also important
to localize the tampered region in images.
Various methods for image authentication with tampering localization have been proposed
[14]-[18]. For example, Lin and Chang [14] proposed an effective authentication method based
on the invariance of the relationships among DCT coefficients at the same position in separate
image blocks. Their method can distinguish JPEG compression from malicious manipulation in
images. Hu et. al. [16] proposed a semi-fragile watermarking scheme based on a human-vision-
system (HVS) embedding method in the DWT domain to achieve the multi-resolution tamper
detection. While tolerating JPEG lossy compression, the proposed method can detect malicious
2

tampers and locate the tampered regions in an image. Celik et al. [18] proposed a lossless authen-
tication framework that can validate the authenticity and integrity of watermarked images without
the reconstruction of the original image. In addition to the reduction of computational require-
ment, this method also enables the public authentication and allows for tamper localization in
watermarked images.
Bartollini et al. [11] proposed an image authentication techniques for video surveillance sys-
tems. In this method, a pseudo-random number generator with appropriate thresholding is used
to yield the watermark sequence. The camera’s ID and frame number are used as the watermark
key for watermarking a specific frame. Accompanying with the watermark detection, an image
denoting the tampered regions of the watermarked image can be obtained. Since the video frames
are usually compressed before transmission, the robustness of the watermark to the compression
issue is critical. On the other hand, the watermark embedding is performed in the spatial domain
rather than in the transform domain. If the pixels in the tampered region do not involve with the
watermark information, it will not be detected.
In this paper, an alternative for image authentication based on blind watermarking in the
wavelet domain is proposed. When a watermark is embedded in the transform domain, it yields
the contribution of the pixel values in the corresponding local positions after the inverse trans-
form. Once the watermarked image is tampered, the pixel values and thus the corresponding
wavelet coefficients must be modified such that the extracted watermark will be distorted. When
the watermark is embedded in the spatial domain of an image, only the selected pixels contain
the watermark information. If the image is tampered only in some small region of the image, the
watermark could not be modified and thus the image tampering is not detectable. The proposed
method adapts a previous blind watermarking technique [8], which embeds watermarks by the use
of the multiple-threshold wavelet coder (MTWC) [21] adopted with successive subband quanti-
zation. For the purpose of tampering localization, however, a coefficient stamping scheme which
multiplies a random value on each watermark coefficient is proposed. Given the same random
3

seed, an exactly identical stamping sequence can be yielded in the receiver. This combinational
method is called the sequential watermark alignment based on coefficient stamping (SWACS)
scheme to determine the modified wavelet coefficients. Then, a morphological region growing
and subband duplication (MRGSD) method is proposed to include the neighboring wavelet coef-
ficients corresponding to the tampered region and then duplicate to other subbands. By applying
the inverse DWT (IDWT) on the determined wavelet coefficients, the tampered region can be
determined without using the original image.
The rest of this paper is organized as follows: The blind watermark embedding and extraction
technique used in this paper is described in Section 2. Section 3 deals with the proposed SWACS
and MRGSD methods for watermark alignment and tampering detection. The experimental re-
sults for different types of image tampering and the precision analysis of the proposed method
are given Section 4. Finally, Section 5 concludes this paper.
2 Blind Watermarking based on Multiple-Threshold WaveletCoder
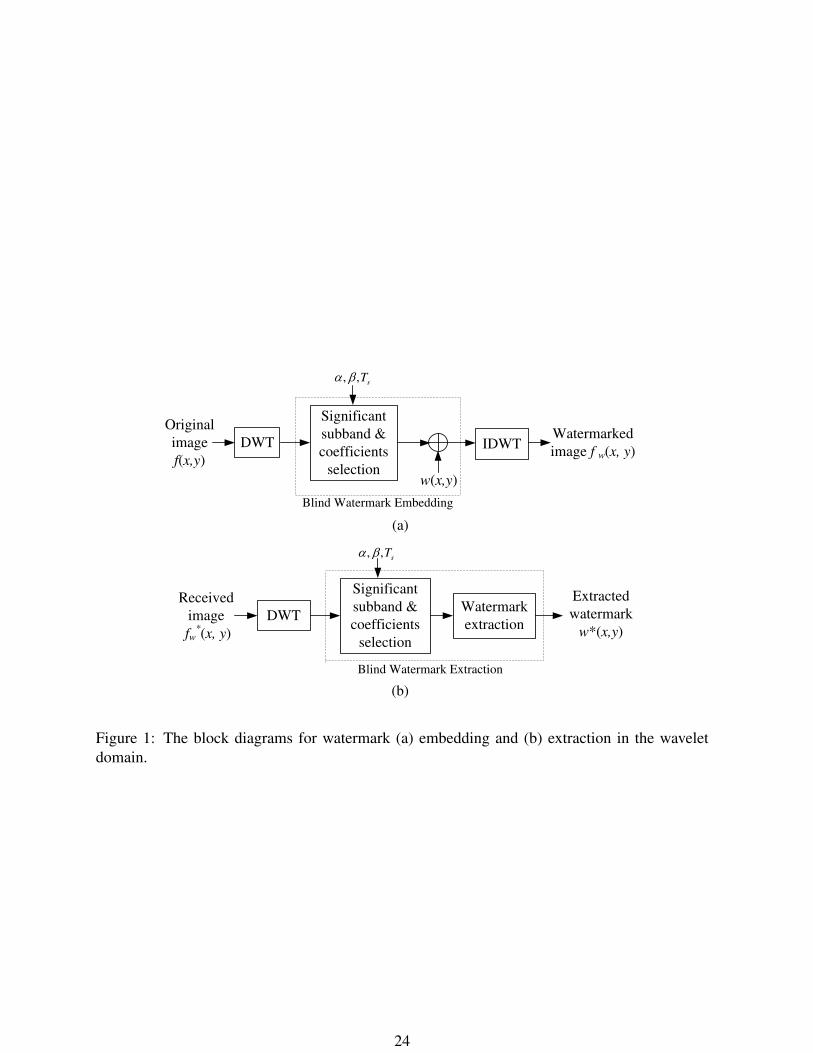
Figure 1 shows the block diagram of the blind watermark embedding and extraction processes.
Suppose that the image f(x, y) is of size h × w. To embed a watermark w(x, y) in the image,
the image is first transformed into the frequency domain by the use of DWT [24]. The significant
subbands are first selected according to the largest coefficient values in the subbands. Next the
watermark message are embedded into the significant coefficients that are selected according to
the rule shown in Ref. [8]. Then the watermark is embedded into the selected coefficients in
some significant subbands of DWT. After the watermark is embedded, the watermarked image
can be obtained by the use of the IDWT. As shown in Fig. 1(b), the watermark extraction process
basically is similar to that of the watermark embedding process. The extraction of the watermark
is blind, i.e., the original image is not referred while retrieving the watermark.
4

2.1 Watermark Embedding
This watermark embedding comprises of two stages [8]: the significant coefficient search and the
adaptive watermark casting and retrieval. At the first stage, an image is wavelet transformed with
the 7/9 filter [23] into 4-level subbands. Suppose that the wavelet coefficients in each subband are
Gaussian distributed with zero mean and variance σ2 [8]. The significant subbands are selected
as they contain more energy, i.e., the variance σ2 is greater than the threshold value Ts. The
procedures are summarized as follows:
1. For each subband s, the initial threshold Ts is set as one half of its maximum absolute value
of all coefficients Cs(u, v). That is, Ts = |Cmax,s|/2. Let all coefficients be un-selected.
2. Excluding the DC term, the subband with the maximum value of βsTs is selected, where
βs is the weighting factor of subband s and |βs| ≤ 1.
3. By examining all the un-selected coefficients Cs(u, v) in the selected subbands, the coeffi-
cients greater than the current threshold Ts are selected as the significant coefficients. The
watermark is then casted in these selected coefficients.
4. If all the watermark symbols are yet casted, the threshold in the subband s is updated as
T news = Ts/2.
5. Repeat Steps 2–4 until the condition shown in Step 4 is satisfied.
In the MTWC, each coefficient Cs(u, v) in the subband s can be expressed as
Cs(u, v) = sgn× (a0Ts
20+ a1
Ts
21+ . . . + ab
Ts
2b+ . . .), (1)
where the symbol “sgn” represents the sign value of the coefficient Cs(u, v), i.e.,
sgn =
{1, if Cs(u, v) ≥ 0−1, if Cs(u, v) < 0
(2)
5
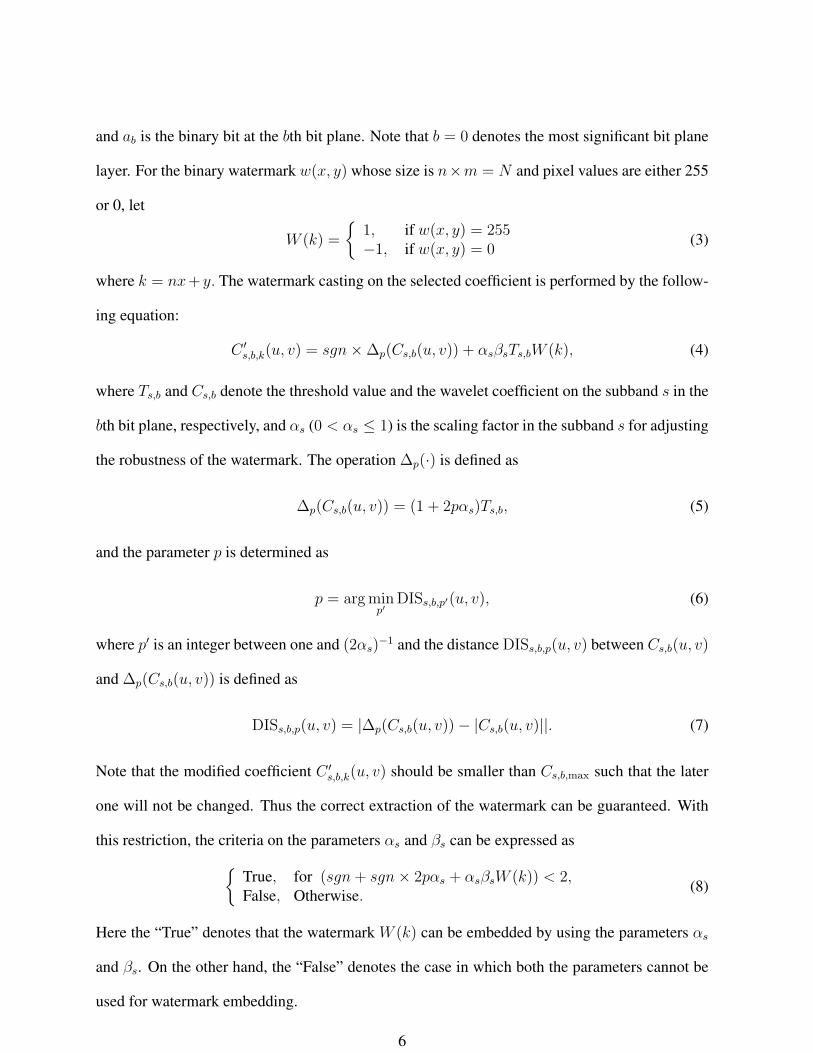
and ab is the binary bit at the bth bit plane. Note that b = 0 denotes the most significant bit plane
layer. For the binary watermark w(x, y) whose size is n×m = N and pixel values are either 255
or 0, let
W (k) =
{1, if w(x, y) = 255−1, if w(x, y) = 0
(3)
where k = nx+ y. The watermark casting on the selected coefficient is performed by the follow-
ing equation:
C ′s,b,k(u, v) = sgn×∆p(Cs,b(u, v)) + αsβsTs,bW (k), (4)
where Ts,b and Cs,b denote the threshold value and the wavelet coefficient on the subband s in the
bth bit plane, respectively, and αs (0 < αs ≤ 1) is the scaling factor in the subband s for adjusting
the robustness of the watermark. The operation ∆p(·) is defined as
∆p(Cs,b(u, v)) = (1 + 2pαs)Ts,b, (5)
and the parameter p is determined as
p = arg minp′
DISs,b,p′(u, v), (6)
where p′ is an integer between one and (2αs)−1 and the distance DISs,b,p(u, v) between Cs,b(u, v)
and ∆p(Cs,b(u, v)) is defined as
DISs,b,p(u, v) = |∆p(Cs,b(u, v))− |Cs,b(u, v)||. (7)
Note that the modified coefficient C ′s,b,k(u, v) should be smaller than Cs,b,max such that the later
one will not be changed. Thus the correct extraction of the watermark can be guaranteed. With
this restriction, the criteria on the parameters αs and βs can be expressed as{
True, for (sgn + sgn× 2pαs + αsβsW (k)) < 2,False, Otherwise. (8)
Here the “True” denotes that the watermark W (k) can be embedded by using the parameters αs
and βs. On the other hand, the “False” denotes the case in which both the parameters cannot be
used for watermark embedding.
6
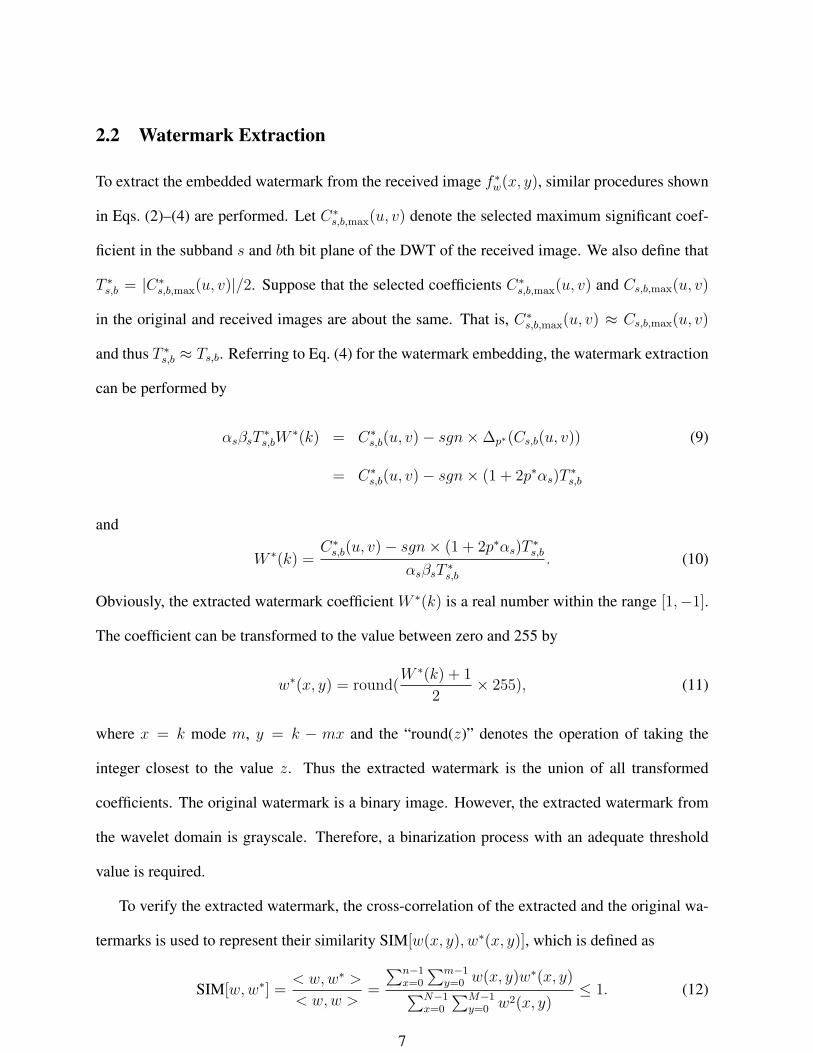
2.2 Watermark Extraction
To extract the embedded watermark from the received image f ∗w(x, y), similar procedures shown
in Eqs. (2)–(4) are performed. Let C∗s,b,max(u, v) denote the selected maximum significant coef-
ficient in the subband s and bth bit plane of the DWT of the received image. We also define that
T ∗s,b = |C∗
s,b,max(u, v)|/2. Suppose that the selected coefficients C∗s,b,max(u, v) and Cs,b,max(u, v)
in the original and received images are about the same. That is, C∗s,b,max(u, v) ≈ Cs,b,max(u, v)
and thus T ∗s,b ≈ Ts,b. Referring to Eq. (4) for the watermark embedding, the watermark extraction
can be performed by
αsβsT∗s,bW
∗(k) = C∗s,b(u, v)− sgn×∆p∗(Cs,b(u, v)) (9)
= C∗s,b(u, v)− sgn× (1 + 2p∗αs)T
∗s,b
and
W ∗(k) =C∗
s,b(u, v)− sgn× (1 + 2p∗αs)T∗s,b
αsβsT ∗s,b
. (10)
Obviously, the extracted watermark coefficient W ∗(k) is a real number within the range [1,−1].
The coefficient can be transformed to the value between zero and 255 by
w∗(x, y) = round(W ∗(k) + 1
2× 255), (11)
where x = k mode m, y = k − mx and the “round(z)” denotes the operation of taking the
integer closest to the value z. Thus the extracted watermark is the union of all transformed
coefficients. The original watermark is a binary image. However, the extracted watermark from
the wavelet domain is grayscale. Therefore, a binarization process with an adequate threshold
value is required.
To verify the extracted watermark, the cross-correlation of the extracted and the original wa-
termarks is used to represent their similarity SIM[w(x, y), w∗(x, y)], which is defined as
SIM[w, w∗] =< w, w∗ >
< w, w >=
∑n−1x=0
∑m−1y=0 w(x, y)w∗(x, y)
∑N−1x=0
∑M−1y=0 w2(x, y)
≤ 1. (12)
7

Here SIM[w,w∗] = 1 denotes that both watermarks are exactly identical. As shown in Eq. (11),
the coefficients in the extracted watermark are graylevels between 0 and 255, while the original
coefficients are binary. If the watermarked image is not attacked, the coefficients C∗s,b should be
very close to the original ones Cs,b. That is, the similarity SIM[w(x, y), w∗(x, y)] should be as
close as unity.
An image is usually compressed before the transmission or storage. The watermark extracted
from the decoded image will be distorted due to the lossy compression. Let the watermarked im-
age quality be represented by the peak signal-to-noise ratio (PSNR). Figures 2(a) and 2(b) show
the original image and the watermark, respectively. The JPEG-compressed watermarked image
(PSNR=39.45 dB) and the extracted watermark are shown in Figs. 2(c) and 2(d), respectively. As
shown in Fig. 2(d), the extracted watermark is obviously distorted. High similarity is a necessary
condition for further tampering detection and localization.
In general, important images are usually stored with a uncompressed form. Therefore, lossy
compression schemes such as JPEG are seldom applied on the images. (Even used, the high-
quality mode is preferred.) If the compression is used to save storage space or to reduce the
transmission bandwidth, lossless schemes are recommended. As for the application of image au-
thentication, the capability of the robustness to lossy compression is no longer required because
there will be an original watermark in the receiver for comparison purpose. In order to detect im-
age tampering from the extracted watermark, the previous blind watermarking scheme is adapted
and will be shown in next section.
3 Tampering Detection and Localization
With the blind watermarking scheme shown above, whether or not the received image has been
tampered can be determined by measuring the similarity between the original and extracted wa-
termarks. If the similarity is less than a threshold value (set to be 0.8 in this paper), the received
image is considered as being tampered by illegal users. To perform the tampering detection and
8
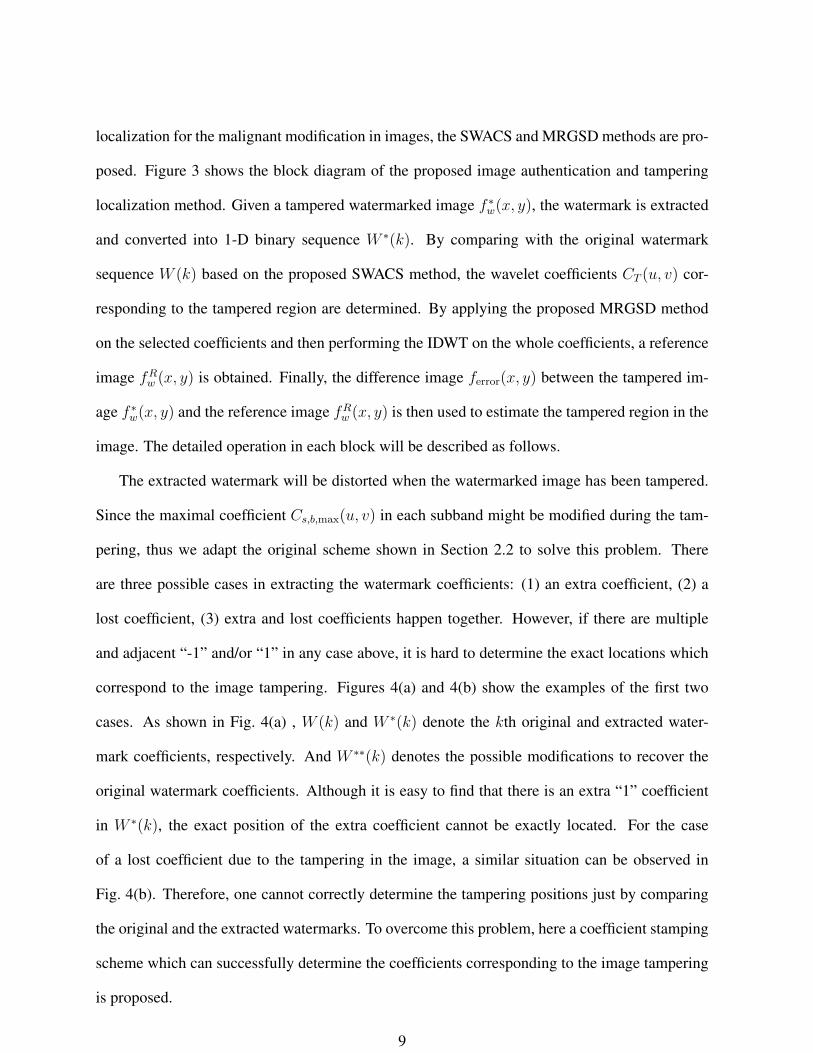
localization for the malignant modification in images, the SWACS and MRGSD methods are pro-
posed. Figure 3 shows the block diagram of the proposed image authentication and tampering
localization method. Given a tampered watermarked image f ∗w(x, y), the watermark is extracted
and converted into 1-D binary sequence W ∗(k). By comparing with the original watermark
sequence W (k) based on the proposed SWACS method, the wavelet coefficients CT (u, v) cor-
responding to the tampered region are determined. By applying the proposed MRGSD method
on the selected coefficients and then performing the IDWT on the whole coefficients, a reference
image fRw (x, y) is obtained. Finally, the difference image ferror(x, y) between the tampered im-
age f ∗w(x, y) and the reference image fRw (x, y) is then used to estimate the tampered region in the
image. The detailed operation in each block will be described as follows.
The extracted watermark will be distorted when the watermarked image has been tampered.
Since the maximal coefficient Cs,b,max(u, v) in each subband might be modified during the tam-
pering, thus we adapt the original scheme shown in Section 2.2 to solve this problem. There
are three possible cases in extracting the watermark coefficients: (1) an extra coefficient, (2) a
lost coefficient, (3) extra and lost coefficients happen together. However, if there are multiple
and adjacent “-1” and/or “1” in any case above, it is hard to determine the exact locations which
correspond to the image tampering. Figures 4(a) and 4(b) show the examples of the first two
cases. As shown in Fig. 4(a) , W (k) and W ∗(k) denote the kth original and extracted water-
mark coefficients, respectively. And W ∗∗(k) denotes the possible modifications to recover the
original watermark coefficients. Although it is easy to find that there is an extra “1” coefficient
in W ∗(k), the exact position of the extra coefficient cannot be exactly located. For the case
of a lost coefficient due to the tampering in the image, a similar situation can be observed in
Fig. 4(b). Therefore, one cannot correctly determine the tampering positions just by comparing
the original and the extracted watermarks. To overcome this problem, here a coefficient stamping
scheme which can successfully determine the coefficients corresponding to the image tampering
is proposed.
9

3.1 Sequential Watermark Alignment based on Coefficient Stamping Scheme
To correctly extract every watermark coefficient and detect the position of tampering, the em-
bedded coefficients are no longer -1 or 1. Instead, each coefficient is modified by the use of a
random number V to become the value within the range [-1, 1] during the embedding processing.
Equation (4) now is rewritten as
C ′s,k(u, v) = sgn×∆p(Cs(u, v)) + αsβsTsW (k)V (k), (13)
where V (k) is a random sequence of the same length with the watermark sequence W (k). In
addition to that each number is unique, the values of the coefficients are normalized to be within
a small range 0.7 ∼ 1. Similarly, the condition C ′s,b,k(u, v) < Cs,b,max should also be hold in
Eq. (13). Now the new equation for watermark extraction becomes
W ∗(k) =C ′
s,k(u, v)− sgn× (1 + 2p∗αs)T∗s
αsβsT ∗s V (k)
. (14)
The difference value ∆V of two consecutive random values, V (k) and V (k + 1), significantly
affects the coefficient extraction process. For example, two consecutive values V (k) = 0.7 and
V (k + 1) = 0.85 lead to that the difference between two consecutively extracted coefficients
W ∗(k) and W ∗(k +1) is proportional to 1/0.7− 1/0.85 = 0.25. That is, W ∗(k) = W ∗(k +1)×
1.25 and thus the correct sequential relationship of the watermark coefficient can be correctly
identify by introducing the random number V (k). However, the extracted watermark coefficients
will be difficult to be identified if the difference value ∆V is small. To solve this problem, we
can set a criterion to ensure that the difference value ∆V is larger than a threshold value 0.2, so
that the missed W (k) can be easily found in the next stage. For a random value V (k), if the value
V (k + 1) cannot satisfy the criterion, the value V (k + 1) is discarded and the following values
V (k + 2), V (k + 3), . . . are tested until the criterion is satisfied. When the watermarked image
has been tampered, the values of extracted watermark coefficients W ∗(k) will be quite different
from the original coefficients W (k). To determine that whether the coefficient is abnormal, the
10

criterion {1, if |W (k)− W ∗(k)| > Dth
0, Otherwise(15)
is employed, where Dth denotes a threshold value. Basically the threshold value Dth should be
greater than one and is set to be 1.5 in our experiments.
For an abnormal coefficient W ∗(k), the average error values E(k) of consecutive L decoded
coefficients are determined as follows:
E(k) =1
L
k+L∑
i=k
|W (i)− W ∗(i)|. (16)
A large average value E(k) represents that the decoded coefficient W ∗(k) is a truly abnormal
coefficient and then a seeking process is applied to determine the position of insertion or deletion.
Suppose that there is an insertion or deletion inside the position range [k, k + L]; total 2L values
of E(k) for an insertion or deletion case happened at each position in this range are determined.
The position i∗ can be determined by seeking the minimum value of all E(k) values. That is,
i∗ = arg mini
(1
L
k+L∑
i=k
|W (i)− W ∗(i)|)
, (17)
where i represents the position where the insertion or deletion happened. The case of insertion or
deletion on the wavelet coefficient W ∗(k) and the corresponding position i∗ can be determined.
In our experiment, the L value is set to be 10, which is large enough to identify the insertion
or deletion position. When the criterion cannot be reached, the watermark extraction will be
terminated. This situation could happen at when the tampered region is quite large such that the
embedded watermark has been seriously destroyed. Therefore, the tampered region cannot be
identified accordingly.
After performing the SWACS scheme on the extracted and original watermarks, most of the
wavelet coefficients that have been altered in the tampered image are detected. By the use of
the inverse DWT, these coefficients will be transformed to further determine the tampered region
in the image. However, as mentioned in the case (2), there are some corresponding wavelet
11

coefficients which may not be detected. In order to significantly emphasize the tampered region,
the proposed MRGSD scheme is then employed.
3.2 Wavelet Coefficient Duplication based on Morphological Region Grow-ing Scheme
To signalize the tampered region with the detected wavelet coefficients, their positions in a spe-
cific lower subband are duplicated to the corresponding positions in the same and higher sub-
bands. For a detected coefficient appearing at the sth HL subband, the other coefficients located
at the same position in the LL, HH, and LH subbands are selected. Next, for the higher or lower
levels of subbands, the coefficients corresponding to the same position will also be selected. The
positions of the selected wavelet coefficients could be very sparse, which lead to the detected
tampered region shown in a broken structure. Mathematical morphology has been successfully
employed to localize the tampered region in images [11]. Therefore, morphological close opera-
tions are then applied to all the selected coefficients to include the neighboring coefficients such
that a complete region of the image tampering can be expected. Note that the structure elements
for dilation and erosion operations are 7× 7 and 5× 5, respectively. All the wavelet coefficients
located at the selected positions at all subbands will then be employed to the tampered region
determination instead of only using the originally detected coefficients.
For each coefficient CT (u, v) located in the identified position, some modification is required
to obtain a reference image fRw (x, y) such that the tampered region can be determined by the
use of the difference image between the reference and tampered images, f ∗w(x, y) and fRw (x, y),
respectively. According to our empirical test results, the modified coefficient C∗R(u, v) can be
determined as
C∗R(u, v) =
{CT (u, v)× 0.5, if CT (u, v) is selected;CT (u, v), if CT (u, v) is not selected. (18)
With the modified coefficients, the reference image fRw (x, y) can be constructed by applying the
12

IDWT on C∗R(u, v). That is,
fRw (x, y) = IDWT{C∗
R(u, v)}. (19)
Obviously, the difference image corresponding to the modified wavelet coefficients will predict
the tampered region in the image. Therefore, the error image ferror(x, y) between the tampered
image f ∗w(x, y) and the constructed reference image fRw (x, y) can be calculated by
ferror(x, y) = 255− |f ∗w(x, y)− fRw (x, y)|, (20)
which is then binarized by a given threshold value for easily displaying the differences between
two images. Finally, an estimated tampered region in the tampered image can be obtained. Com-
pared with the tampered image, we can localize and identify the tampered region and content,
respectively.
3.3 Precision and Security Analysis
To evaluate the precision of the proposed method, the detected tampered region is compared with
the actually tampered region. Let the pixel numbers in the covered tampered region, in the actu-
ally tampered region, and in all the detected region be denoted as Nc, Nt, and Na, respectively.
Two factors are used to evaluate the detection accuracy of the proposed method on image tam-
pering:
(1) The coverage ratio (Cr) is defined as
Cr =Nc
Nt
; (21)
(2) The redundancy ratio (Rr) is defined as
Rr =Na
Nc
. (22)
Both factors are desired as close as unity.
It is very important that the watermark cannot be extracted by an intruder before he wants to
tamper the watermarked image. Therefore, the watermark embedding and extraction processes
13

should not be open to the public. In addition, the parameters (αs, βs, Ts, the watermark W (k),
and the random sequence V (k)) used in the proposed system are sensitive to the accuracy of the
watermark extraction. (Actually the security is mainly guaranteed by the use of a long water-
mark and a long random sequence.) As shown in Eq. (14), some small modification on these
parameters can lead to very large difference on the determined result of the watermark coeffi-
cient. Moreover, consider the random sequence which is of the same length (l = m×n) with the
watermark sequence. Even though that the watermark size is known, the possible combinations
of the random sequence will be (n × m)r, where r denotes the number of the bits required to
represent the real number in the random sequence. For example, if the watermark size is 44× 44
and the number r = 5, then there are total 220 × 1110 possible combinations. Considering the
further combinations with other parameters, the security level is high enough to prevent the brute
force attacking.
4 Experimental Results and Discussion
In computer experiments, a watermarked image of size 512× 512 shown in Fig. 7(a) and the wa-
termark of size 44×44 shown in Fig. 2(b) are used to test the proposed methods. The parameters
used in the experimental are given as αs = 0.25, βs = 1, and V (k) is within the range [0.7, 1].
Figure 5 shows the PSNR values of the watermarked images which embed the different sizes of
the watermark. When the size of watermark is only 22× 22, the PSNR values is close to 39 dB.
As the size increases to 33 × 33, the PSNR values decrease rapidly. For a large size 88 × 88 of
watermark, the PSNR value is still higher than 33 dB, which is still acceptable quality.
Figure 6 shows the detection result of abnormal wavelet coefficients when the watermarked
image has been tampered. The differences between the extracted and the original watermark coef-
ficients for two cases are illustrated. If the watermarked image is not tampered, all the difference
values between two watermark coefficients, |W (k)−W ∗(k)|, are small (< 0.5). After the image
has been tampered, some of the difference values |W (k) − W ∗(k)| are greater than one. Thus
14

the abnormal coefficients can be detected using the SWACS scheme. The undetected coefficient,
of course, will affect the synchronization with the sequence V (k). Some wavelet coefficients are
missed and several false coefficients are detected. The impact of this effect appears as imperfect
detection on the tampered region. That’s why the tampered region cannot be perfectly detected
in the proposed method.
Figure 7(b) shows the tampered image f ∗w(x, y), in which an extra mark is inserted compar-
ing with the watermarked image shown in Fig. 7(a). By using the proposed SWACS scheme, the
wavelet coefficients corresponding to the tampered region can be detected through the compar-
ison between the original and extracted watermarks. Figure 7(c) shows the extracted positions
of the originally detected and copied wavelet coefficients in different subbands. These wavelet
coefficients are modified based on Eq. (1) and then are joined with other coefficients to be in-
verse wavelet transformed to obtain a revised image fRw (x, y). Figure 7(d) shows the binarized
error image between the tampered and the revised images. Figure 7(e) shows the binarized error
image between the revised and the embedded images. By using the proposed MRGSD scheme,
the determined tamper region can be obtained. Figure 7(f) shows that the determined region can
cover the actual region. The coverage and the redundancy ratios are Cr = 1.0 and Rr = 3.16,
respectively.
Two different types of tampering in the F-16 images are also considered in our simulation.
Figure 8(a) shows that part of the text “US AIR” printed on the jet plane has been artificially
removed from the image. By using the proposed SWACS and MRGSD methods on the tampered
image, the detected tampered region can be obtained and is shown in Figure 8(b), in which the
original tampered region is also shown for comparison. Figure 8(c) shows that a rectangular
region in the plane has been blurred. As shown in Fig. 8 (d), the proposed method can success-
fully detect the tampered region as well. The corresponding coverage and redundancy ratios for
Figs. 8(b) and 8(d) are {Cr = 1.0, Rr = 4.6} and {Cr = 0.9, Rr = 5.2}, respectively. From
the results shown in Figs. 7 and 8, different types of tampering or modifications can be correctly
15

detected and localized in the corresponding regions. Therefore, the tampered part in the image
can be easily identified by the use of the proposed SWACS and MRGSD methods.
Consider the types of image tampering shown in Figs. 7(b), 8(a), and 8(c), in which the sizes
of tampered region are 34 × 26, 44 × 44, and 40 × 40, respectively. Table 1 shows the effects
on the Cr and Rr precisions under different types of image tampering and different scales of the
tampered region. For the type of image tampering shown in Fig. 7(b), almost all of the entire
tampered region can be identified (i.e., Cr ≈ 1) even when the scale of tampered region is 350%.
On the other hand, the redundancy ratio Rr increases a lot when the scale is only 10%. The
tampered region can be correctly identified but the size of detected region is much larger than
the real one. A similar trend happens for the type of image tampering shown in Fig. 8(c). The
only difference is that the coverage ratio Cr decreases a lot when the scales are 250% and 350%.
For the type of image tampering shown in Fig. 8(a), the coverage ratio Cr is less than 0.5 as the
scales are not less than 150%, which means that the detection performance is not good enough
when the tampered region increases. Table 2 shows the effects on the Cr and Rr precisions under
different types of image tampering and different sizes of the watermark. For the two types of
image tampering shown in Figs. 7(b) and 8(c), coverage ratios Rr can be greater than 10 only
when the size of watermark is 88× 88. When the size of the watermark is less than 44× 44, the
detection of text remove in Fig. 8(a) is inefficient because the coverage ratios are small. There is
no regularity on the redundancy ratio Rr in this type of image tampering.
To investigate the sensitivity of αs or βs on the detected tampered region, the following ex-
periments are performed. Let αs = 0.1 and βs = 1 and the watermarked image be not tampered.
No tampered region should be detected if all the parameters are correct. If an incorrect αs value
is used, then the extracted watermark will be incorrect and thus some false tampered region will
be detected. Table 3 shows the ratios of the area of false tampered region to the original image
size under different αs values. When the αs value is 0.105, the 0.9% region size of the image
is falsely detected as the tampered region. Therefore, some minor deviation on αs could lead to
16

different authentication results.
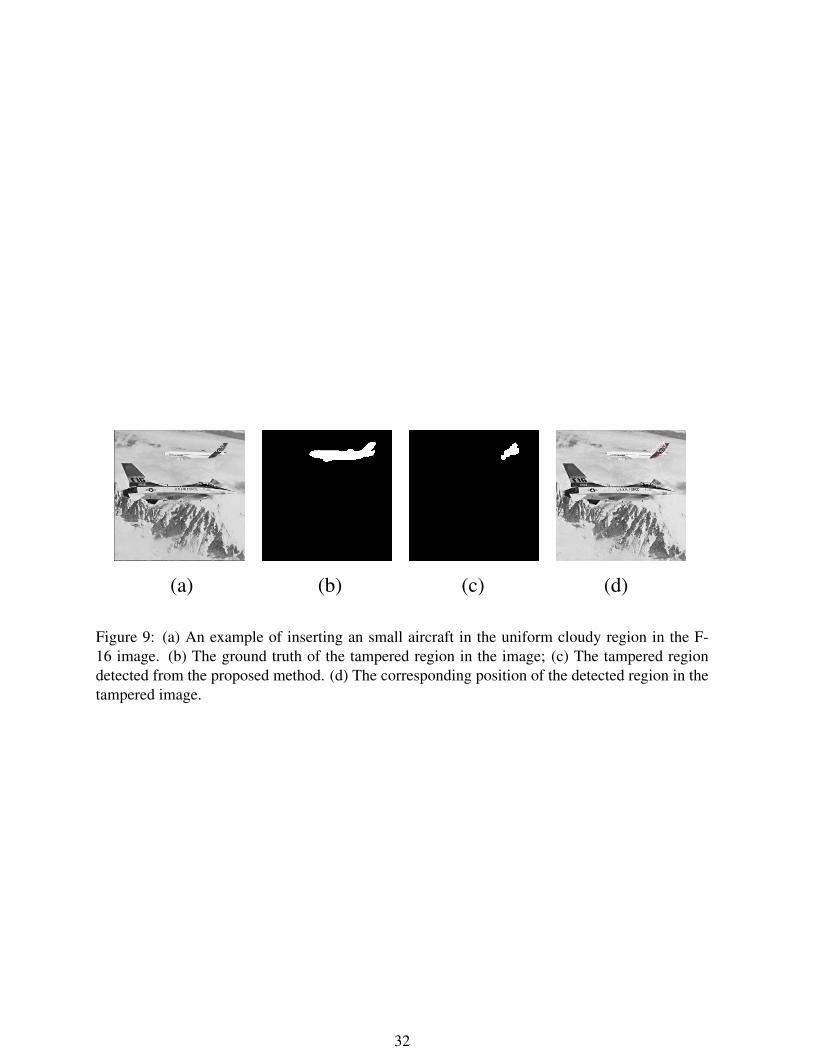
Finally, a special case of attack on the smooth region in the watermarked F-16 image is used
to test the proposed schemes. As can be seen in Fig. 9(a), a smaller aircraft is inserted into the
uniform cloudy region in the F-16 image with a smoothing process on the aircraft boundary.
Figure 9(b) shows the ground truth of the tampered region in the image. With the same parame-
ters in the watermark embedding/extraction process, only the tail of the inserted smaller aircraft
can be detected. Figs. 9(c) and 9(d) show the detected tampered region and its corresponding
position in the tampered image, respectively. Note that the grayscale values of the pixels in the
fuselage are similar to that of its neighboring cloud. The fuselage cannot be detected because
the corresponding wavelet coefficients are smaller than the N th wavelet coefficient. However,
this attack only works in the smooth region in the watermarked image because very few wavelet
coefficients can be selected to embed the watermark bits. Therefore, the tampering region will
be undetectable because the value of the maximum wavelet coefficient of the inserted object is
less than that of the N th significant wavelet coefficient in this region. To prevent this problem, a
large N value is required in the proposed method. Under this condition, the tampering effect will
be negligible. That is, the inserted object could be almost invisible if the value N is large enough
and the attacker’s purpose may not be achieved.
5 Conclusion
In this paper, a blind watermarking scheme is adopted to perform the image authentication and
tampering localization in the receiver. According to the similarity of the extracted watermark,
whether or not the received image is tampered can be determined. To detect the tampering and
localize the tampered region in the image, the SWACS and MRGSD methods are proposed to ef-
ficiently determine the positions of the modified pixels in the distorted watermark and to estimate
the possible tampered region, respectively. The experimental results verify that the proposed
system can successfully perform the image authentication and tampering localization for differ-
17

ent types and various sizes of image tampering. To further improve the precision performance
of the detected results, adequately selecting the watermark size N and determining the system
parameters in the proposed methods would be helpful.
6 Acknowledgment
This work is partly supported by the National Science Council, Taiwan R.O.C. under contract
NSC 97-2221-E-224-057. The authors appreciate the valuable comments from anonymous re-
viewers.
18

References
[1] C.-T. Hsu and J.-L. Wu, “Hidden digital watermarks in images,” IEEE Transactions on
Image Processing, vol. 8, no. 1, pp. 58–68, Jan. 1999.
[2] C.I. Podilchuk and E.J. Delp, “Digital watermarking: algorithms and application,” Signal
Processing Magazine, IEEE, vol. 18, no. 4, pp. 33–46, July 2001.
[3] S.D. Lin and C.-F. Chen, “A robust DCT-based watermarking for copyright protection,”
IEEE Transactions on Consumer Electronics, vol. 46, no. 3, pp. 415–421, Aug. 2000.
[4] X. Kang, J. Huang, Y.Q. Shi, and Y. Lin, “A DWT-DFT composite watermarking scheme
robust to both affine transform and JPEG compression,” IEEE Transactions on Circuits and
Systems for Video Technology, vol. 13, no. 8, pp. 776–786, Aug. 2003
[5] H. Yuan and X.-P. Zhand, “A multiscale fragile watermark based on the Gaussian mixture
model in the wavelet domain,” 2004 IEEE International Conference on Acoustics, Speech,
and Signal Processing (ICASSP), vol. 3, pp. 413–416, Montreal, Canada, May 2004
[6] A. Briassouli, P. Tsakalides, and A. Stouraities, “Hidden messages in heavy-tails: DCT
domain watermark detection using alpha-stable model,” IEEE Transactions on Image Pro-
cessing, vol. 7, no. 4, pp. 700–715, Aug. 2005
[7] S.-H. Wang and Y.-P. Lin, “Wavelet tree quantization for copyright protection watermark-
ing,” IEEE Transactions on Image Processing, vol. 13, no. 2, pp. 154–165, Feb. 2004
[8] H.-J. Mike Wang, P.-C. Su, and C. -C. Jay Kuo, “Wavelet-based digital image watermark-
ing,” Optics Express, vol. 3, no. 12. pp. 491–496, Dec. 1998
[9] P.-C. Su and C. -C. Jay Kuo, “Blind digital watermark for cartoon and map images,” Pro-
ceedings of SPIE, vol. 3657, pp. 296–306, April 1999
19

[10] P.H.W. Wong, O.C. Au, and Y.M. Yeung, “Novel blind multiple watermarking technique
for images,” IEEE Transactions on Circuits and Systems for Video Technology, vol. 13, no.
8, pp. 813–830, Aug. 2003
[11] F. Bartollini, A. Tefas, M. Barni and I. Pitas, “Image authentication techniques for surveil-
lance applications”, Proceedings of the IEEE, vol. 89, no. 10, pp. 1403–1418, Sept. 2001
[12] M.D. Swanson, Bin Zhu, and A.H. Tewfik, “Multiresolution scene-based video watermark-
ing using perceptual models,” IEEE Journal on Selected Areas in Communications, vol. 16,
no. 4, pp. 540–550, May 1998.
[13] D. Kirovski and H.S. Malvar, “Spread-spectrum watermarking of audio signals,” IEEE
Trans. on Signal Processing, vol. 51, no. 4, pp. 1020–1033, Apr. 2003.
[14] C.-Y. Lin and S.-F. Chang, “A Robust Image Authentication Method Distinguishing JPEG
Compression from Malicious Manipulation,” IEEE Trans. on Circuits and Systems for Video
Technology, vol. 11, no. 2, pp. 153–168, Feb. 2001.
[15] M.U. Celik, G. Sharma, E. Saber, and A.M. Tekalp, “Hierarchical watermarking for secure
image authentication with localization,” IEEE Transactions on Image Processing, vol. 11,
no. 6, pp. 585–595, Jun. 2002
[16] J. Hu, J. Huang, D. Huang, and Y.Q. Shi, “Image fragile watermarking based on fusion of
multi-resolution tamper detection,” Electronics Letters, vol. 38, no. 24, pp.1512–1513, Nov.
2002
[17] H.D. Knowles, D.A. Winne, C.N. Canagarajah, and D.R. Bull, “Image tamper detection
and classification using support vector machines,” IEE Proceedings on Vision, Image and
Signal Processing, vol. 151, no. 4, pp. 322–328, 30 Aug. 2004
20

[18] M.U. Celik, G. Sharma, E. Saber, and A.M. Tekalp, “Lossless watermarking for image
authentication: a new framework and an implementation,” IEEE Transactions on Image
Processing, vol. 15, no. 4, pp. 1042–1049, Apr. 2006
[19] C. Rey ahd J.L. Dugelay, “A Survey of Watermarking Algorithms for Image Authentica-
tion,” EURASIP Journal on Applied Signal Processing, vol. 2002, no. 6, pp. 613–621, 2002
[20] W. Zhu, Z. Xiong, and Ya-Qin Zhang, “Multiresolution watermarking for images and
video,” IEEE Transactions on Circuits and Systems for Video Technology, vol. 9, no. 4,
pp. 545–550, June 1999.
[21] H.-J. Wang and C. -C. Jay Kuo, “A multi-threshold wavelet coder (MTWC) for high fi-
delity image compression,” Proceedings of IEEE 1997 International Conference on Image
Processing, vol. 1, pp. 652–655, Oct. 1997
[22] A.Tefas and I. Pitas, “Image authentication and tamper proofing using mathematical mor-
phology,” European Signal Processing Conference (EUSIPCO’2000), Tampere, Finland,
vol.3, pp. 1681–1684, 5-8 Sept. 2000
[23] M. Rabbani and R. Joshi, “An overview of the JPEG2000 still image compression standard,”
Signal Processing: Image Communication, vol. 17, no. 1, pp. 3–48, January 2002
[24] M. Antonini, M. Barlaud, P. Mathieu, and I. Daubechies, “Image coding using wavelet
transform,” IEEE Transactions on Image Processing, vol. 1, no. 2, pp. 205–220, Apr. 1992.
21

Table 1: The effects on the two precisions Cr and Rr under different types of image tamperingand different scales of the tampered region.
Fig. 7(b) Fig. 8(a) Fig. 8(c)Scale Cr Rr Cr Rr Cr Rr
10% 1.0 25.6 1.0 13.4 1.0 58.425% 1.0 6.9 0.84 10.6 1.0 23.150% 1.0 3.5 0.90 5.0 1.0 8.8
100% 1.0 3.2 1.0 4.6 0.90 5.2125% 1.0 5.4 0.99 4.4 1.0 4.7150% 1.0 3.4 0.44 2.1 0.94 3.7250% 0.98 2.4 0.47 3.1 0.58 3.2350% 0.95 2.2 0.38 2.8 0.68 3.3
Table 2: The effects on the two precisions Cr and Rr under different types of image tamperingand different sizes of the embedded watermark.
Fig. 7(b) Fig. 8(a) Fig. 8(c)Size Cr Rr Cr Rr Cr Rr
22× 22 1.0 2.6 0.46 2.7 0.99 3.533× 33 1.0 3.0 0.57 8.2 0.93 3.944× 44 1.0 3.2 1.0 4.6 0.90 5.255× 55 1.0 3.2 0.84 5.1 0.91 5.266× 66 1.0 2.7 0.75 8.5 1.0 6.077× 77 1.0 3.4 0.86 4.7 1.0 7.788× 88 1.0 12.5 0.74 7.5 1.0 11.5
Table 3: The sensitivity of αs on the detection results of the tampered region.
α 0.2 0.1 0.11 0.105 0.101Ratio 23.3% 0 15.4% 1.9% 0.9 %
22

Figure Captions:
Figure 1: The block diagrams for watermark (a) embedding and (b) extraction in the wavelet
domain.
Figure 2: (a) The original image and (b) the embedded watermark. (c) The watermarked image
(PSNR = 39.45 dB) and (d) the extracted watermark.
Figure 3: The block diagrams of the proposed image authentication and tampering localization
method.
Figure 4: Two possible alignment results between the original and the extracted watermarks: (a)
An extra coefficient is found and discarded; (b) A coefficient is lost and should be inserted.
Figure 5: The PSNR values of the watermarked images with different watermark sizes.
Figure 6: The difference values between the original watermark coefficients and the extracted
coefficient before and after image tampering.
Figure 7: (a) The watermarked image; (b) The tampered watermarked image in which a logo
covers the tail; (c) The extracted watermark which is seriously distorted; (d) The detected coef-
ficients in the wavelet domain; (e) The wavelet coefficient at the same and lower subbands are
predicted from the original coefficients; (f) The comparison between the determined region and
actually tampered regions.
Figure 8: Two other examples for tampering detection and localization: (a) The F-16 image is
tampered by erasing part of the text; (b) The comparison between the detected and actual tam-
pered regions; (c) The F-16 image is tampered by blurring part the texture; (d) The comparison
between the detected and actual tampered regions.
Figure 9: (a) An example of inserting an small aircraft in the uniform cloudy region in the F-16
image. (b) The ground truth of the tampered region in the image; (c) The tampered region de-
tected from the proposed method. (d) The corresponding position of the detected region in the
tampered image.
23
Watermarked
image f w(x, y)
(a)
DWT IDWT
Original
image
f(x,y)
w(x,y)
Blind Watermark Embedding
Significant
subband &
coefficients
selection
sT,,
DWT
Received
image
fw*(x, y)
Extracted
watermark
w*(x,y)
(b)
Significant
subband &
coefficients
selection
Blind Watermark Extraction
Watermark
extraction
sT,,
Figure 1: The block diagrams for watermark (a) embedding and (b) extraction in the waveletdomain.
24

(a) (b)
(c) (d)
Figure 2: (a) The original image and (b) the embedded watermark. (c) The watermarked image(PSNR = 39.45 dB) and (d) the extracted watermark.
25

2D to 1D
conversion
Watermark
extraction
Tampered
image
fw*(x,y)
SWACS
Correspond
to wavelet
coefficents
MRGSDIDWTBinarize
Determine
difference
image
Estimated
tampered
region(s)
w*(x,y) W*(k)
W(k), V(k)
CT (u,v)fw
R(x,y)
fw*(x,y)
ferror(x,y)
C*R (u,v)
Modification
Figure 3: The block diagrams of the proposed image authentication and tampering localizationmethod.
26

(a) (b)
(c) (d)
Figure 4: Two possible alignment results between the original and the extracted watermarks: (a)An extra coefficient is found and discarded; (b) A coefficient is lost and should be inserted.
27

484 1089 1936 3025 4356 5929 774433
34
35
36
37
38
39
Watermark size
PS
NR
(dB
)
Figure 5: The PSNR values of the watermarked images with different watermark sizes.
28

Figure 6: The difference values between the original watermark coefficients and the extractedcoefficient before and after image tampering.
29

(a) (b) (c)
(d) (e) (f)
Figure 7: (a) The watermarked image; (b) The tampered watermarked image in which a logocovers the tail; (c) The extracted watermark which is seriously distorted; (d) The detected coef-ficients in the wavelet domain; (e) The wavelet coefficient at the same and lower subbands arepredicted from the original coefficients; (f) The comparison between the determined region andactually tampered regions.
30

(a) (b)
(c) (d)
Figure 8: Two other examples for tampering detection and localization: (a) The F-16 image istampered by erasing part of the text; (b) The comparison between the detected and actual tam-pered regions; (c) The F-16 image is tampered by blurring part the texture; (d) The comparisonbetween the detected and actual tampered regions.
31
(a) (b) (c) (d)
Figure 9: (a) An example of inserting an small aircraft in the uniform cloudy region in the F-16 image. (b) The ground truth of the tampered region in the image; (c) The tampered regiondetected from the proposed method. (d) The corresponding position of the detected region in thetampered image.
32