image processing quality analysis for particle based ... · image processing quality analysis for...
TRANSCRIPT

1. Introduction
1.1 Motivation
Highly complex microarray systems based on combinatorial synthesis techniques are inwide-spread use in biological, medical and pharmaceutical research Chee et al. (1996); Cretichet al. (2006); Debouck & Goodfellow (1999). Two prominent examples are micro arrays forthe artificial synthesis of arbitrary DNA sequences out of nucleic acids Heller (2002) andpeptide synthesis out of amino acids Beyer et al. (2007); Templin et al. (2003). In the caseof DNA arrays, these experiments mostly focus on gene identification or gene expressionprofiling to determine the effects of single genes on cellular evolution. Peptide arrays aimat understanding interactions of peptides with other molecules. As sequences in proteins,peptides are involved in the regularisation of biological activity.
Since a large number of combinations that build a valid molecule chain is possible, bothmicro array variants require high densities in the range of 10,000 cDNAs or peptides percm2. Density and size of the synthesis sites are the critical parameter for such systems,since they limit the number of molecule sorts synthesized per array. Using the micro arrayin experiments of bio-medical research or in clinical diagnostics means bringing the array intouch with target molecules. Hence, the decreasing size of the synthesis sites, also reduces theamount of target molecules required (i.e. proteins or antibodies), which may be expensive orhard to obtain.
With increasing array complexity, the need for an automated read-out of the results andstructuring of the acquired information arises because manual evaluation is tedious and ofteninconsistent when comparing thousands of synthesis sites with each other. Here, image * Felix Löffler1,2, Tobias Förtsch1,2, Christopher Schirwitz2, Simon Fernandez2, Heinz Hinkers3, Heinrich F. Arlinghaus4, Florian Painke1, Kai König1,2,5, Ralf Bischoff2, Alexander Nesterov-Müller5, Frank Breitling5, Michael Hausmann1 and Volker Lindenstruth6
1Kirchhoff Institute for Physics, Heidelberg University, Germany 2German Cancer Research Centre, Germany 3Verbundzentrum für Oberflächenanalyse Münster, Germany 4 Institute of Physics, University of Muenster, Germany 5Karlsruhe Institute for Technology, Germany 6Frankfurt Institute for Advanced Studies, Germany
Image Processing Quality Analysis for Particle Based Peptide Array Production on a Microchip
JennyWagner1,2,6 et al* 1Kirchhoff Institute for Physics, Heidelberg University
2German Cancer Research Centre 6Frankfurt Institute for Advanced Studies
Germany
4
www.intechopen.com
2 Will-be-set-by-IN-TECH
acquisition and image processing based evaluation can be used. While the concept of DNAarrays includes image processing in many ways Angulo & Serra (2003); Bajcsy (2005); Brownet al. (2001), querying the literature yields only a few image processing supported peptidearray experiments. In most cases, mass spectrometry data is analysed by means of patternmatching in order to identify peptide sequences for quality analysis Gusev et al. (1993).
Yet, up to now, all image processing tasks have only been used in the evaluation step of thearray experiment or as a post-processing routine to compensate for irregularities in the qualityof the array Wang et al. (2001), but not during array production itself. Contrary to that,we propose a destruction free quality control system based on image acquisition and imageprocessing that is capable of monitoring the peptide array production process to improvethe quality of the array with respect to the density of correctly assembled peptides. Whilepost-processing may not always restore the information content of defective synthesis sites,our method detects insufficiencies and errors when they occur, so that subsequent correctionslead to fully functional arrays.
1.2 Outline of the chapter
Section 2 starts with describing the process of peptide synthesis before Section 3 gives anoverview of state-of-the-art quality controls that are currently performed in each synthesisstep. Section 4 then introduces our new quality control system from the design of the imageacquisition setup over full automation to experiments that demonstrate the functionality.Subsequently, Section 5 deals with further applications as well as extensions and modificationsof the quality control system that are planned for future research. The conclusion in Section 6summarises the results gained and discusses the assets and drawbacks of the method.
2. Particle based solid phase peptide synthesis
Since the first peptide synthesis in 1882 by T. Curtius, peptides can be artificially producedby several methods, all basing on the principle of selectively concatenating amino acids ofdifferent kinds to create the desired peptides. The most common methods are liquid phasesynthesis and solid phase synthesis. The former assumes that peptides are synthesised insolution (i.e. the growing peptides are free to move within the liquid), while the latter requiresa solid support with fixed coupling sites to which the first amino acids can couple, so that thegrowing peptides are bound to their synthesis sites. By design, solid phase peptide synthesissurpasses the method based on liquids in the percentage of correctly assembled peptides asseparation and purification of the desired peptide sequences are easier to perform.
Using a solid support, the medium that transports the amino acids to the growing peptides hasto be determined. Selecting liquids as transport medium is a commonly used standard Fodoret al. (1991); Volkmer (2009). Nevertheless, it bears some disadvantages: First of all, the formand extension of a liquid drop on a support is hard to control. This means that synthesis spotsfor different peptides must be positioned on the support in a distance far enough that dropsto build different peptides cannot overlap accidentally. Furthermore, there is a minimum sizeof the drops below which the drop evaporates before it can reach the surface and, at last, thereis no control over the amino acids in the drop as they couple to the growing peptide uponcontact to the support. This means that incorrectly deposited drops will immediately lead toincorrectly assembled peptides at that spot. In order to overcome these disadvantages, wedeveloped a particle based transport Beyer et al. (2007) that embeds the amino acids in micro
56 Advanced Image Acquisition, Processing Techniques and Applications
www.intechopen.com
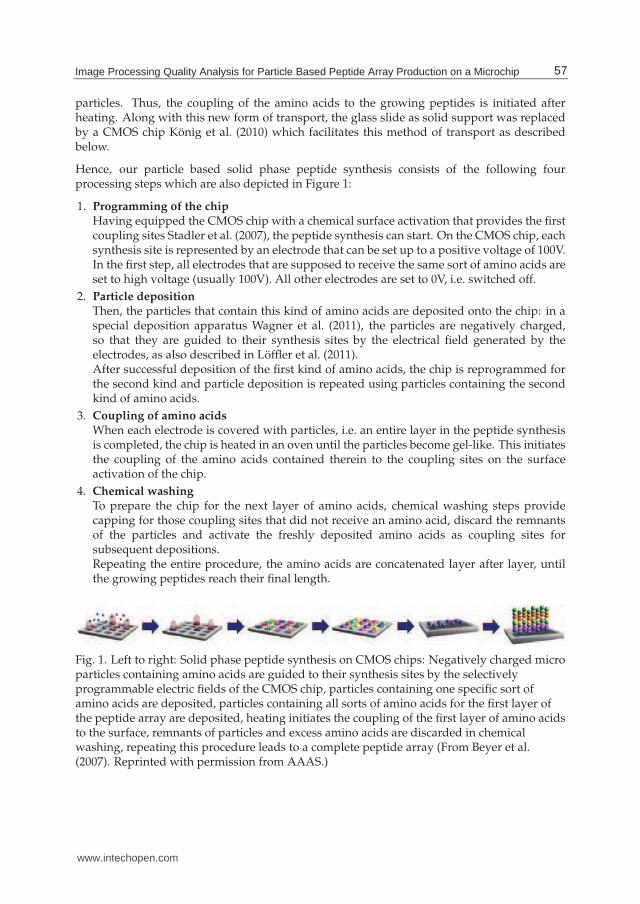
Image Processing Quality Analysis for Particle Based Peptide Array Production on a Microchip 3
particles. Thus, the coupling of the amino acids to the growing peptides is initiated afterheating. Along with this new form of transport, the glass slide as solid support was replacedby a CMOS chip König et al. (2010) which facilitates this method of transport as describedbelow.
Hence, our particle based solid phase peptide synthesis consists of the following fourprocessing steps which are also depicted in Figure 1:
1. Programming of the chipHaving equipped the CMOS chip with a chemical surface activation that provides the firstcoupling sites Stadler et al. (2007), the peptide synthesis can start. On the CMOS chip, eachsynthesis site is represented by an electrode that can be set up to a positive voltage of 100V.In the first step, all electrodes that are supposed to receive the same sort of amino acids areset to high voltage (usually 100V). All other electrodes are set to 0V, i.e. switched off.
2. Particle depositionThen, the particles that contain this kind of amino acids are deposited onto the chip: in aspecial deposition apparatus Wagner et al. (2011), the particles are negatively charged,so that they are guided to their synthesis sites by the electrical field generated by theelectrodes, as also described in Löffler et al. (2011).After successful deposition of the first kind of amino acids, the chip is reprogrammed forthe second kind and particle deposition is repeated using particles containing the secondkind of amino acids.
3. Coupling of amino acidsWhen each electrode is covered with particles, i.e. an entire layer in the peptide synthesisis completed, the chip is heated in an oven until the particles become gel-like. This initiatesthe coupling of the amino acids contained therein to the coupling sites on the surfaceactivation of the chip.
4. Chemical washingTo prepare the chip for the next layer of amino acids, chemical washing steps providecapping for those coupling sites that did not receive an amino acid, discard the remnantsof the particles and activate the freshly deposited amino acids as coupling sites forsubsequent depositions.Repeating the entire procedure, the amino acids are concatenated layer after layer, untilthe growing peptides reach their final length.
Fig. 1. Left to right: Solid phase peptide synthesis on CMOS chips: Negatively charged microparticles containing amino acids are guided to their synthesis sites by the selectivelyprogrammable electric fields of the CMOS chip, particles containing one specific sort ofamino acids are deposited, particles containing all sorts of amino acids for the first layer ofthe peptide array are deposited, heating initiates the coupling of the first layer of amino acidsto the surface, remnants of particles and excess amino acids are discarded in chemicalwashing, repeating this procedure leads to a complete peptide array (From Beyer et al.(2007). Reprinted with permission from AAAS.)
57Image Processing Quality Analysis for Particle Based Peptide Array Production on a Microchip
www.intechopen.com
4 Will-be-set-by-IN-TECH
3. Related work on state-of-the-art quality control for peptide synthesis
Quality checks on each step of the peptide synthesis process are regularly performed. Thesize of the particles can be measured by means of a Malvern Mastersizer and their formby raster electron microscopy. The percentages of the particle contents are monitored byhigh-performance liquid chromatorgraphy (HPLC) to ensure that there is an excess of aminoacids compared to the coupling sites available on the chip surface.
The deposition quality is checked by experts that investigate the spots on the support undera light microscope to find contaminations and to determine whether enough particles aredeposited on each synthesis spot to guarantee a good coupling efficiency. If the spots arehomogenously covered with particles, the experts assume that this deposition will resultin a good coupling efficiency, having already achieved good synthesis results with suchdepositions, as demonstrated in Beyer et al. (2007); König et al. (2010).
The coupling efficiency itself can be estimated in the chemical washing step, when the freshlycoupled amino acids are prepared to be the coupling sites for the next layer of amino acids.Then, protection groups (Fmoc groups) are removed from the amino acid that has just coupledto the growing peptide. The reaction product of the Fmoc group with the washing solutionabsorbs UV-light, so that UV spectrometry of the solution yields an estimate of coupled aminoacids on the entire support. Yet, this gives no information about the number of coupled aminoacids per synthesis spot, only averaged over the entire array. Furthermore, experiments withUV-spectrometry showed high error rates that originated from the fact that the measurementswere at the detection limit of the spectrometer. Hence, at this degree of miniaturisation,the amount of reagents already becomes to small to be measured with standard chemicaldetection reactions.
After termination of the entire process, a selective antibody with a fluorescing moleculeon top can be coupled to each peptide to measure the fluorescence signal as evidence fora correct synthesis. Furthermore, there is the possibility to perform a mass spectrometricanalysis to investigate the synthesis quality of the assembled peptides. Both reactions areperformed routinely Beyer et al. (2007) and are also standard for other types of peptidesynthesis Roepstorff (2000). However, as the UV-spectrometry, these measurements are notspatially resolved, i.e. they only provide results for the entire support.
4. Quality control through image acquisition and processing
4.1 Motivation and outline
As discussed in Section 3, the standard quality analysis methods to determine the amountof coupled amino acids or the density of assembled peptides do not yield information aboutsingle synthesis spots but only for the entire array. In order to overcome this shortcoming,we developed a quality analysis setup that allows to evaluate single synthesis sites. Themethod is based on the correlation of two image acquisitions, namely, relating the image of aparticle deposition with the respective image of coupled amino acids subsequently acquiredby surface analysis, as described further below.
But before the correlation can be established, an image acquisition setup has to be assembled,as described in Section 4.2. Then, we set up a model for particle deposition using the imageacquisition setup to compare the theoretical results with experimental tests. As discussed in
58 Advanced Image Acquisition, Processing Techniques and Applications
www.intechopen.com
Image Processing Quality Analysis for Particle Based Peptide Array Production on a Microchip 5
Section 4.3, this leads to improvements in the deposition step. Thus, having a tool for particledeposition analysis, Section 4.4 focuses on finding a suitable surface analysis technique thatcan image the chip surface retrieving signals from coupled amino acids with a resolutionbelow the size of a synthesis spot (i.e. 100µm for the latest chip generation). Since the chosensurface analysis technique, time of flight secondary ion mass spectrometry (TOF-SIMS),destroys the surface during analysis, it cannot be included as quality analysis routine in thepeptide array production process. Therefore, the particles deposited on the synthesis spot andthe signals from the coupled amino acids in TOF-SIMS imaging have to be correlated to obtaina destruction free quality analysis. In Section 4.5, we define a quality measure based on thiscorrelation that is capable of estimating the quality of single synthesis sites by examining thedeposition image. Using this quality measure, we implemented an automated quality control,as described in Section 4.6, that reliably decides whether the density of coupled amino acidsis sufficient to yield a predefined density of correctly assembled peptides or not and conveysthis message to the peptide array production automaton that can react to the result.
4.2 Image acquisition setup for particle deposition
An image acquisition setup for particle deposition analysis should fulfil the followingrequirements in order to be suitable for quality analysis:
• The resolution of the entire setup (objective and camera) should be able to resolve theaverage diameter of the micro particles. Hence, the resolution should be in the range of1-2µm Wagner et al. (2011).
• The optical imaging should be contactless, without interference of additional material, asfor instance, oil immersion.
• If only a chip detail can be photographed, it should contain a satisfactory amountof synthesis sites to obtain a quality analysis evaluation that is representative for theentire chip. Since the experiments in this section are performed without an automatedframework, chip details containing 100-160 synthesis sites, i.e. about 1% of the total amountof spots are photographed, as manual control samples showed that this amount alreadyrepresents the entire chip well.
• The setup should be robust in handling so that all images are taken under comparableconditions, including a uniform illumination of the chip. To monitor the exact depositionfor several amino acids, an alignment of the chip is also necessary. Yet, for retrieving aquality evaluation per synthesis site, aligning the images is not required.
Taking into account these requirements, we assembled an image acquisition setup consistingof a conventional inverted light microscope, a Zeiss Axiovert 35, a 10x/0.25 objective, aTV-adaptation of magnification 0.63, and a Progres C5 camera, as shown in Figure 2 on theleft. The right hand side of Figure 2 shows a typical image taken from a particle deposition inwhich particles are depicted in white on the dark grey synthesis sites which are separated bya grid in brown.
4.3 Image processing supported deposition modelling
The image acquisition setup as assembled in Section 4.2 is used to take photos of particledepositions. Thereby, it was noticed that the deposition quality decisively depends on theprogrammed deposition pattern Löffler et al. (2011). Figure 3 shows some examples: the
59Image Processing Quality Analysis for Particle Based Peptide Array Production on a Microchip
www.intechopen.com

6 Will-be-set-by-IN-TECH
Fig. 2. Left: Image acquisition setup to monitor the particle deposition: Zeiss Axiovert 35,10x/0.25 objective, TV-adaptation with magnification 0.63 and Progres C5 camera Right:Typical particle deposition image: particles (white), synthesis sites (dark grey), grid forseparation of synthesis sites (brown)
pincushion effect on the top of the K, the central vertical line-like deposition in the I and thecentral horizontal line-like deposition in the P.
Fig. 3. The quality of the deposition decisively depends on the programmed pattern, theimage shows the pincushion effect on the top of the K, the central vertical line-like depositionin the I and the central horizontal line-like deposition in the P
The effects could be explained by modelling the deposition process as a two-phase flow,with air as transport phase that carries the particles, subject to the boundary conditions inthe deposition apparatus and the electrical field in front of the chip. Based on this model,particle deposition simulations were performed whose results correlated well with the effectsobserved in the images of actual depositions Wagner et al. (2011).
As a result, particle deposition patterns were modified such that undesired artefacts like thepincushion effect do not occur. This is achieved by splitting the deposition pattern into several
60 Advanced Image Acquisition, Processing Techniques and Applications
www.intechopen.com
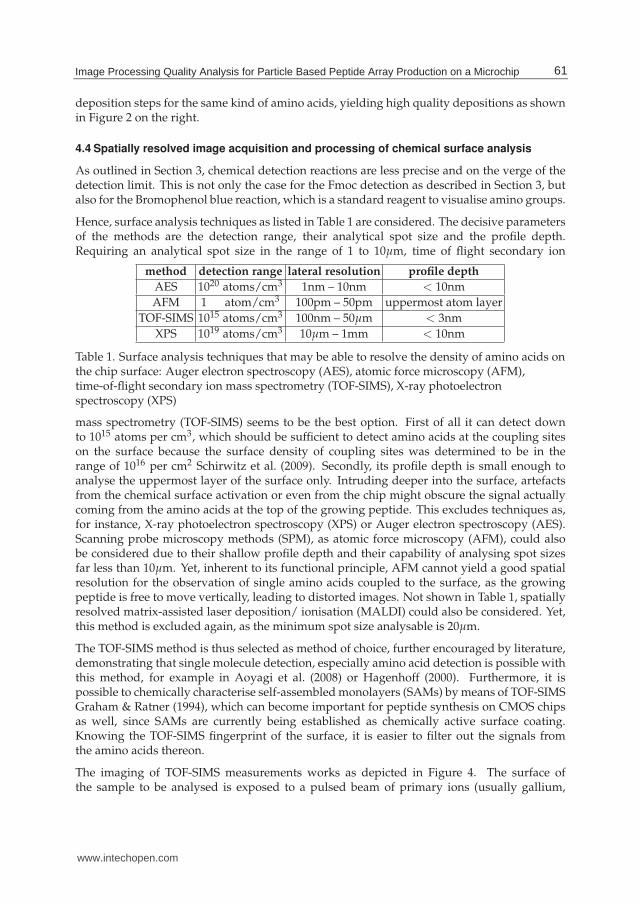
Image Processing Quality Analysis for Particle Based Peptide Array Production on a Microchip 7
deposition steps for the same kind of amino acids, yielding high quality depositions as shownin Figure 2 on the right.
4.4 Spatially resolved image acquisition and processing of chemical surface analysis
As outlined in Section 3, chemical detection reactions are less precise and on the verge of thedetection limit. This is not only the case for the Fmoc detection as described in Section 3, butalso for the Bromophenol blue reaction, which is a standard reagent to visualise amino groups.
Hence, surface analysis techniques as listed in Table 1 are considered. The decisive parametersof the methods are the detection range, their analytical spot size and the profile depth.Requiring an analytical spot size in the range of 1 to 10µm, time of flight secondary ion
method detection range lateral resolution profile depth
AES 1020 atoms/cm3 1nm – 10nm < 10nm
AFM 1 atom/cm3 100pm – 50pm uppermost atom layer
TOF-SIMS 1015 atoms/cm3 100nm – 50µm < 3nm
XPS 1019 atoms/cm3 10µm – 1mm < 10nm
Table 1. Surface analysis techniques that may be able to resolve the density of amino acids onthe chip surface: Auger electron spectroscopy (AES), atomic force microscopy (AFM),time-of-flight secondary ion mass spectrometry (TOF-SIMS), X-ray photoelectronspectroscopy (XPS)
mass spectrometry (TOF-SIMS) seems to be the best option. First of all it can detect downto 1015 atoms per cm3, which should be sufficient to detect amino acids at the coupling siteson the surface because the surface density of coupling sites was determined to be in therange of 1016 per cm2 Schirwitz et al. (2009). Secondly, its profile depth is small enough toanalyse the uppermost layer of the surface only. Intruding deeper into the surface, artefactsfrom the chemical surface activation or even from the chip might obscure the signal actuallycoming from the amino acids at the top of the growing peptide. This excludes techniques as,for instance, X-ray photoelectron spectroscopy (XPS) or Auger electron spectroscopy (AES).Scanning probe microscopy methods (SPM), as atomic force microscopy (AFM), could alsobe considered due to their shallow profile depth and their capability of analysing spot sizesfar less than 10µm. Yet, inherent to its functional principle, AFM cannot yield a good spatialresolution for the observation of single amino acids coupled to the surface, as the growingpeptide is free to move vertically, leading to distorted images. Not shown in Table 1, spatiallyresolved matrix-assisted laser deposition/ ionisation (MALDI) could also be considered. Yet,this method is excluded again, as the minimum spot size analysable is 20µm.
The TOF-SIMS method is thus selected as method of choice, further encouraged by literature,demonstrating that single molecule detection, especially amino acid detection is possible withthis method, for example in Aoyagi et al. (2008) or Hagenhoff (2000). Furthermore, it ispossible to chemically characterise self-assembled monolayers (SAMs) by means of TOF-SIMSGraham & Ratner (1994), which can become important for peptide synthesis on CMOS chipsas well, since SAMs are currently being established as chemically active surface coating.Knowing the TOF-SIMS fingerprint of the surface, it is easier to filter out the signals fromthe amino acids thereon.
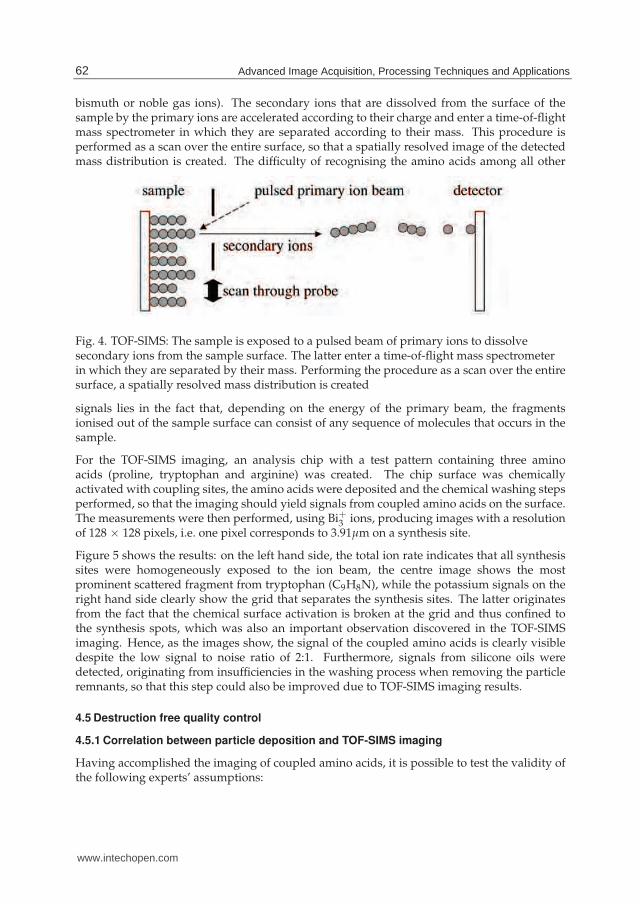
The imaging of TOF-SIMS measurements works as depicted in Figure 4. The surface ofthe sample to be analysed is exposed to a pulsed beam of primary ions (usually gallium,
61Image Processing Quality Analysis for Particle Based Peptide Array Production on a Microchip
www.intechopen.com
8 Will-be-set-by-IN-TECH
bismuth or noble gas ions). The secondary ions that are dissolved from the surface of thesample by the primary ions are accelerated according to their charge and enter a time-of-flightmass spectrometer in which they are separated according to their mass. This procedure isperformed as a scan over the entire surface, so that a spatially resolved image of the detectedmass distribution is created. The difficulty of recognising the amino acids among all other
Fig. 4. TOF-SIMS: The sample is exposed to a pulsed beam of primary ions to dissolvesecondary ions from the sample surface. The latter enter a time-of-flight mass spectrometerin which they are separated by their mass. Performing the procedure as a scan over the entiresurface, a spatially resolved mass distribution is created
signals lies in the fact that, depending on the energy of the primary beam, the fragmentsionised out of the sample surface can consist of any sequence of molecules that occurs in thesample.
For the TOF-SIMS imaging, an analysis chip with a test pattern containing three aminoacids (proline, tryptophan and arginine) was created. The chip surface was chemicallyactivated with coupling sites, the amino acids were deposited and the chemical washing stepsperformed, so that the imaging should yield signals from coupled amino acids on the surface.The measurements were then performed, using Bi+3 ions, producing images with a resolutionof 128 × 128 pixels, i.e. one pixel corresponds to 3.91µm on a synthesis site.
Figure 5 shows the results: on the left hand side, the total ion rate indicates that all synthesissites were homogeneously exposed to the ion beam, the centre image shows the mostprominent scattered fragment from tryptophan (C9H8N), while the potassium signals on theright hand side clearly show the grid that separates the synthesis sites. The latter originatesfrom the fact that the chemical surface activation is broken at the grid and thus confined tothe synthesis spots, which was also an important observation discovered in the TOF-SIMSimaging. Hence, as the images show, the signal of the coupled amino acids is clearly visibledespite the low signal to noise ratio of 2:1. Furthermore, signals from silicone oils weredetected, originating from insufficiencies in the washing process when removing the particleremnants, so that this step could also be improved due to TOF-SIMS imaging results.
4.5 Destruction free quality control
4.5.1 Correlation between particle deposition and TOF-SIMS imaging
Having accomplished the imaging of coupled amino acids, it is possible to test the validity ofthe following experts’ assumptions:
62 Advanced Image Acquisition, Processing Techniques and Applications
www.intechopen.com

Image Processing Quality Analysis for Particle Based Peptide Array Production on a Microchip 9
Fig. 5. TOF-SIMS images: Left: total ion image Centre: tryptophan signal with signal to noiseratio 2:1 Right: potassium signal indicating that the surface activation is confined to the spots
• A coverage with particles means that amino acids will couple to the surface underneath,i.e. a particle deposition on the synthesis sites automatically implies the coupling of aminoacids there.
• During coupling, the melt of the particles flows isotropically into areas on the spot whereno particles were deposited. The amino acids contained therein couple in those areas thatthe melt reaches.
• The particle depositions for each amino acid per layer must be performed twice to obtainthe desired density of coupled amino acids.
To verify these assumptions, the correlation of the particle deposition images obtained withthe image acquisition setup described in Section 4.2 with the TOF-SIMS images shown inSection 4.4 is performed by means of image processing.
First, both images are converted to greyscale. Then, the TOF-SIMS images are enlarged byLanczos-2-kernel for optimal interpolation to match the size of the deposition images.
Subsequently, the two images are manually aligned and matched. Due to the low contrast inthe grid regions of the tryptophan image, the image containing the potassium signal is usedto match the grid in the TOF-SIMS images with the grid in the deposition images. Anotheroption for alignment could have been to match the chip cell contents of the two images directlyby applying a registration and matching algorithm, e.g. finding the largest overlap of thesegmented foreground in both images. Yet, as the foreground is the object under investigation,it cannot be used for image alignment. Using the grid for alignment thus enables to detect asystematic shift in deposited particles when melting and coupling. This effect may be causedby unbalanced chip fixation on the circuit board or improper positioning in the oven duringcoupling, resulting in a unidirectional melt flow instead of a uniform distribution.
Next, both images are segmented by thresholding. The latter is calculated as the averageof the maximum mean grey value for an uncovered synthesis site and the minimum meangrey value for a synthesis site covered with particles as this has proven to work well for theunimodal intensity distributions in the images Wagner et al. (2010).
The last step is the correlation of the segmented images, yielding that the first assumption iscorrect in principle. However, there are areas in which a particle deposition did not lead toa coupling of amino acids. This can be an artefact of the high noise or of the enlargement
63Image Processing Quality Analysis for Particle Based Peptide Array Production on a Microchip
www.intechopen.com
10 Will-be-set-by-IN-TECH
of the TOF-SIMS image, but could be caused by deficiencies in the surface coating or sterichindrance to coupling as well. Furthermore, the second assumption is also true. The particlemelt actually flows isotropically up to 5µm from the location of the deposition and inducescoupling of amino acids in those areas. While the first two experts’ assumptions were correct,the last one is fortunately not. As the images show contiguous signals from coupled aminoacids on the surface, a second deposition step with the same sort of amino acids becomesobsolete, which saves deposition time and reduces the amount of required particles by onehalf.
4.5.2 Quality control system
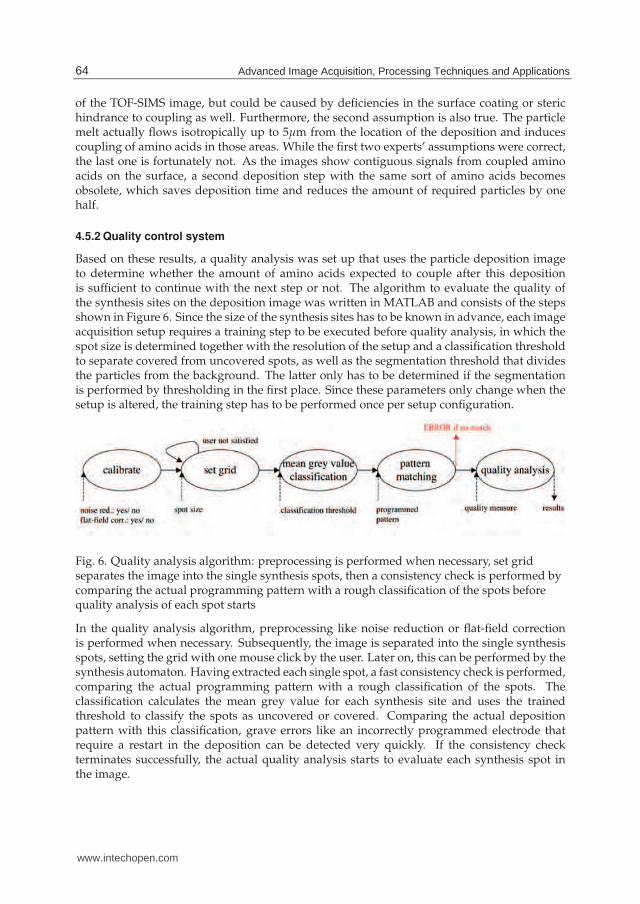
Based on these results, a quality analysis was set up that uses the particle deposition imageto determine whether the amount of amino acids expected to couple after this depositionis sufficient to continue with the next step or not. The algorithm to evaluate the quality ofthe synthesis sites on the deposition image was written in MATLAB and consists of the stepsshown in Figure 6. Since the size of the synthesis sites has to be known in advance, each imageacquisition setup requires a training step to be executed before quality analysis, in which thespot size is determined together with the resolution of the setup and a classification thresholdto separate covered from uncovered spots, as well as the segmentation threshold that dividesthe particles from the background. The latter only has to be determined if the segmentationis performed by thresholding in the first place. Since these parameters only change when thesetup is altered, the training step has to be performed once per setup configuration.
Fig. 6. Quality analysis algorithm: preprocessing is performed when necessary, set gridseparates the image into the single synthesis spots, then a consistency check is performed bycomparing the actual programming pattern with a rough classification of the spots beforequality analysis of each spot starts
In the quality analysis algorithm, preprocessing like noise reduction or flat-field correctionis performed when necessary. Subsequently, the image is separated into the single synthesisspots, setting the grid with one mouse click by the user. Later on, this can be performed by thesynthesis automaton. Having extracted each single spot, a fast consistency check is performed,comparing the actual programming pattern with a rough classification of the spots. Theclassification calculates the mean grey value for each synthesis site and uses the trainedthreshold to classify the spots as uncovered or covered. Comparing the actual depositionpattern with this classification, grave errors like an incorrectly programmed electrode thatrequire a restart in the deposition can be detected very quickly. If the consistency checkterminates successfully, the actual quality analysis starts to evaluate each synthesis spot inthe image.
64 Advanced Image Acquisition, Processing Techniques and Applications
www.intechopen.com
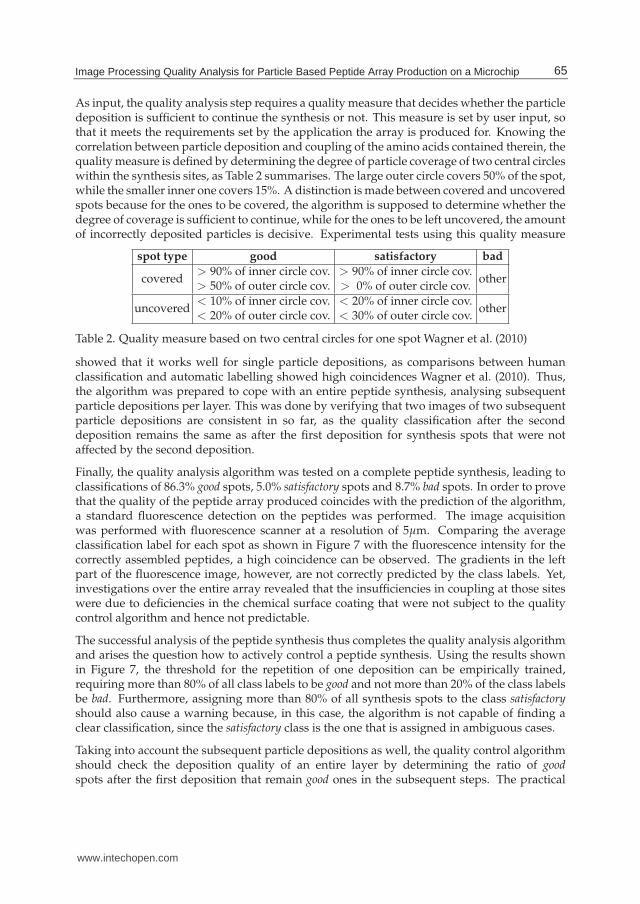
Image Processing Quality Analysis for Particle Based Peptide Array Production on a Microchip 11
As input, the quality analysis step requires a quality measure that decides whether the particledeposition is sufficient to continue the synthesis or not. This measure is set by user input, sothat it meets the requirements set by the application the array is produced for. Knowing thecorrelation between particle deposition and coupling of the amino acids contained therein, thequality measure is defined by determining the degree of particle coverage of two central circleswithin the synthesis sites, as Table 2 summarises. The large outer circle covers 50% of the spot,while the smaller inner one covers 15%. A distinction is made between covered and uncoveredspots because for the ones to be covered, the algorithm is supposed to determine whether thedegree of coverage is sufficient to continue, while for the ones to be left uncovered, the amountof incorrectly deposited particles is decisive. Experimental tests using this quality measure
spot type good satisfactory bad
covered> 90% of inner circle cov.> 50% of outer circle cov.
> 90% of inner circle cov.> 0% of outer circle cov.
other
uncovered< 10% of inner circle cov.< 20% of outer circle cov.
< 20% of inner circle cov.< 30% of outer circle cov.
other
Table 2. Quality measure based on two central circles for one spot Wagner et al. (2010)
showed that it works well for single particle depositions, as comparisons between humanclassification and automatic labelling showed high coincidences Wagner et al. (2010). Thus,the algorithm was prepared to cope with an entire peptide synthesis, analysing subsequentparticle depositions per layer. This was done by verifying that two images of two subsequentparticle depositions are consistent in so far, as the quality classification after the seconddeposition remains the same as after the first deposition for synthesis spots that were notaffected by the second deposition.
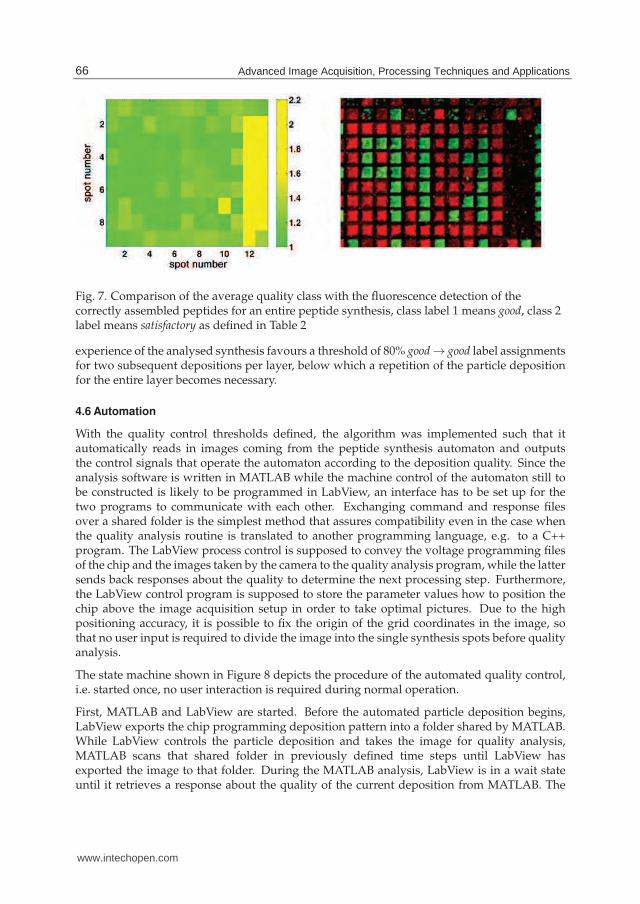
Finally, the quality analysis algorithm was tested on a complete peptide synthesis, leading toclassifications of 86.3% good spots, 5.0% satisfactory spots and 8.7% bad spots. In order to provethat the quality of the peptide array produced coincides with the prediction of the algorithm,a standard fluorescence detection on the peptides was performed. The image acquisitionwas performed with fluorescence scanner at a resolution of 5µm. Comparing the averageclassification label for each spot as shown in Figure 7 with the fluorescence intensity for thecorrectly assembled peptides, a high coincidence can be observed. The gradients in the leftpart of the fluorescence image, however, are not correctly predicted by the class labels. Yet,investigations over the entire array revealed that the insufficiencies in coupling at those siteswere due to deficiencies in the chemical surface coating that were not subject to the qualitycontrol algorithm and hence not predictable.
The successful analysis of the peptide synthesis thus completes the quality analysis algorithmand arises the question how to actively control a peptide synthesis. Using the results shownin Figure 7, the threshold for the repetition of one deposition can be empirically trained,requiring more than 80% of all class labels to be good and not more than 20% of the class labelsbe bad. Furthermore, assigning more than 80% of all synthesis spots to the class satisfactoryshould also cause a warning because, in this case, the algorithm is not capable of finding aclear classification, since the satisfactory class is the one that is assigned in ambiguous cases.
Taking into account the subsequent particle depositions as well, the quality control algorithmshould check the deposition quality of an entire layer by determining the ratio of goodspots after the first deposition that remain good ones in the subsequent steps. The practical
65Image Processing Quality Analysis for Particle Based Peptide Array Production on a Microchip
www.intechopen.com
12 Will-be-set-by-IN-TECH
Fig. 7. Comparison of the average quality class with the fluorescence detection of thecorrectly assembled peptides for an entire peptide synthesis, class label 1 means good, class 2label means satisfactory as defined in Table 2
experience of the analysed synthesis favours a threshold of 80% good → good label assignmentsfor two subsequent depositions per layer, below which a repetition of the particle depositionfor the entire layer becomes necessary.
4.6 Automation
With the quality control thresholds defined, the algorithm was implemented such that itautomatically reads in images coming from the peptide synthesis automaton and outputsthe control signals that operate the automaton according to the deposition quality. Since theanalysis software is written in MATLAB while the machine control of the automaton still tobe constructed is likely to be programmed in LabView, an interface has to be set up for thetwo programs to communicate with each other. Exchanging command and response filesover a shared folder is the simplest method that assures compatibility even in the case whenthe quality analysis routine is translated to another programming language, e.g. to a C++program. The LabView process control is supposed to convey the voltage programming filesof the chip and the images taken by the camera to the quality analysis program, while the lattersends back responses about the quality to determine the next processing step. Furthermore,the LabView control program is supposed to store the parameter values how to position thechip above the image acquisition setup in order to take optimal pictures. Due to the highpositioning accuracy, it is possible to fix the origin of the grid coordinates in the image, sothat no user input is required to divide the image into the single synthesis spots before qualityanalysis.
The state machine shown in Figure 8 depicts the procedure of the automated quality control,i.e. started once, no user interaction is required during normal operation.
First, MATLAB and LabView are started. Before the automated particle deposition begins,LabView exports the chip programming deposition pattern into a folder shared by MATLAB.While LabView controls the particle deposition and takes the image for quality analysis,MATLAB scans that shared folder in previously defined time steps until LabView hasexported the image to that folder. During the MATLAB analysis, LabView is in a wait stateuntil it retrieves a response about the quality of the current deposition from MATLAB. The
66 Advanced Image Acquisition, Processing Techniques and Applications
www.intechopen.com

Image Processing Quality Analysis for Particle Based Peptide Array Production on a Microchip 13
Fig. 8. Finite state machine diagram of automated quality control: after starting LabView,particle deposition, image acquisition, quality analysis and chemical processing can beperformed and the respective actions in the image folder and in the MATLAB routine takeplace as described in the text
chip can already be brought back to the deposition unit of the automaton in the mean time, sothat the next step can be immediately started after receiving the response – in the normal case,it is assumed that the quality will be sufficient to continue. The response, together with theanalysed data, is saved into another shared folder from where LabView gets one of the fourpossible responses:
R1 : proceed to next step
R2 : the image data is corrupted so that it cannot be processed
R3 : the image causes a MATLAB intrinsic error
R4 : the image shows that the deposition is not of expected quality
In case of R1, LabView can go on with the next step in the processing queue. For the errormessages R2 and R3, the problem could be caused in the image acquisition step. Therefore,this step is repeated once again with a new picture of the same particle deposition on the chip,while the deposition pattern file is kept. Receiving R4, the process has to clean the chip andrepeat the steps from particle deposition onwards. In order to assure that no programmingerror of the chip caused the malfunction, the deposition pattern is also created anew and sent
67Image Processing Quality Analysis for Particle Based Peptide Array Production on a Microchip
www.intechopen.com
14 Will-be-set-by-IN-TECH
to the shared folder. R4 could also be split into two errors, R4a and R4b, R4a dealing withsparse particle coverage and forcing an additional deposition step and R4b handling the caseof too many incorrectly deposited particles requiring the chip to be cleaned prior to a newdeposition. If the results do not improve after a previously determined number of retries,LabView stops the processing for human intervention and error inspection. Regardless ofthe response, MATLAB returns to scanning the shared folder waiting for a new image aftertermination of the analysis of the previous one.
5. Outlook, improvements and further applications
Integration of the image acquisition setup for quality control into the peptide synthesisautomaton still has to be performed, but can easily be achieved replacing the microscope bya suitable objective and illumination device only, so that the optimum conditions defined inSection 4.2 are fulfilled.
The results obtained in Section 4.4 are the first of their kind and demonstrate that it is possibleto detect the density of a single layer of coupled amino acids. Nevertheless, the proof ofprinciple experiment should be repeated with an increased signal to noise ratio at a higherresolution so that the TOF-SIMS images can be better correlated to the deposition imagesthat have a higher resolution. Furthermore, they should be performed for all kinds of aminoacids used in peptide synthesis. This series of experiments could give insights in the couplingbehaviour of the different amino acids and lead to semi-quantitative measurements of theircoupling efficiencies.
Additional to that, the quality measure of the control algorithm could be totally based on theresults gained in Section 4.4, simulating the coupling of amino acids, taking into account the(estimated areas and amounts of) coupled amino acids in the preceding layer and directlycalculating the density of correctly assembled peptides out of this information. Althoughbeing more precise, this quality measure would certainly require more processing time for theexact simulation of the coupling and the calculation of the peptide density. Thus, since thetime for analysis should be minimised, the current modus of quality analysis probably excelsover this precise one, which remains to be checked.
Despite the good results obtained in Wagner et al. (2010) and Section 4.5, the predictive powerof the algorithm can be further improved as currently, the assignment of the class labels istoo pessimistic, leading to more repeated depositions than actually are necessary. With anincreasing number of analysed synthesis, however, the quality measure can be refined, suchthat the number of unnecessary re-depositions is reduced.
It is also possible to extend the algorithm to evaluate fluorescence images like Figure 7 on theright. For this task, the single colour channels of the image can be evaluated after establishinga quality measure that bases on the intensity signal of the synthesis spots. Exchanging theclassification component in the existing system by this one is simple due to its modularstructure. The rest of the algorithm can be reused, since the structure of the synthesis siteswill also remain the same. Knowing the (integrated) intensities per synthesis spot also enablesbiological data evaluation like finding the peptide that binds best to a certain test molecule orcomparing different peptides with respect to their coupling probability.
Adapting the image acquisition and image processing system for glass slides as solidsupports, the quality control can also be used in the peptide synthesis by means of a peptide
68 Advanced Image Acquisition, Processing Techniques and Applications
www.intechopen.com

Image Processing Quality Analysis for Particle Based Peptide Array Production on a Microchip 15
printer as described in Beyer et al. (2007), another method for automated peptide arrayproduction developed by us.
6. Conclusion: Comprehensive imaging based quality control for peptide array
production
As shown in this chapter, image acquisition and image processing are vital parts ofminiaturised peptide array production, when standard bio-chemical methods reach theirdetection limit and physical surface analysis techniques destroy the sample. Furthermore,imaging of the sample allows for spatially resolved results while standard quality analysistechniques only yield information about the entire sample.
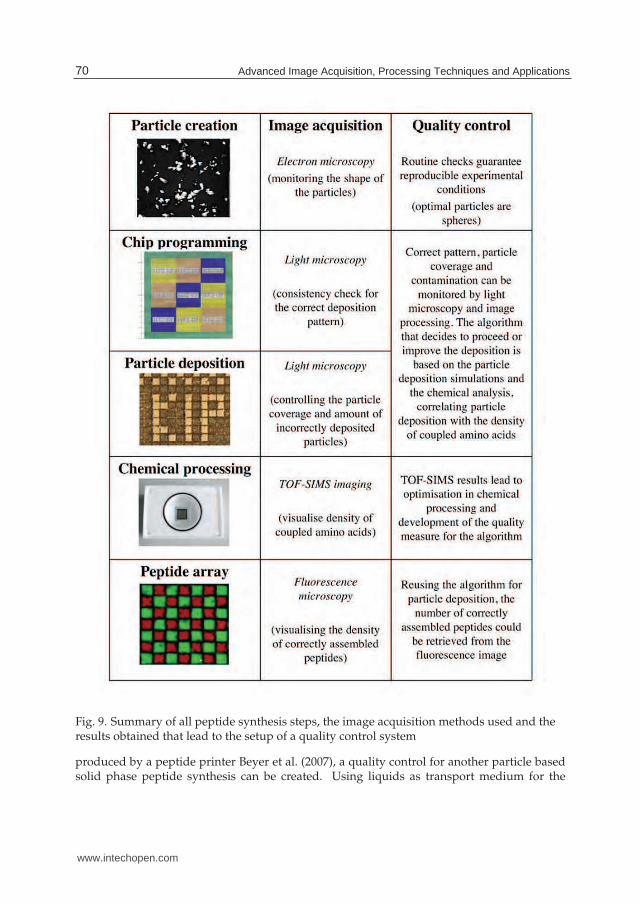
Four different methods of image acquisition were used to accomplish an automatedquality control system for peptide array production: electron microscopy, light microscopy,fluorescence microscopy and time of flight secondary ion mass spectrometry imaging(TOF-SIMS imaging). Figure 9 summarises the design of the quality control system and showswhich results were obtained by the individual imaging methods.
To monitor the shape of the micro particles that contain the amino acids electron microscopywas used. It was found out that the majority of the particles has a shape that can beapproximated by a sphere, which is an important fact because the size measurement ofthe particles outputs correct results only if the particles under analysis are approximatelyspherical. The programming of the chip and the particle deposition are checked by lightmicroscopy. As a result, the comparison of several particle deposition images revealed thatthe quality of the deposition depends on the pattern programmed. Modelling the depositionand simulating the process, these artefacts could be explained and removed by splitting thedeposition pattern into several steps for one kind of amino acid. Then, TOF-SIMS imagingwas performed to visualise the density of a single layer of coupled amino acids with anunprecedented resolution of less than 4µm, yielding the first spatially resolved detectionof coupled amino acids in such a miniaturised peptide array. As this method destroysthe surface, a correlation between the particle deposition and the TOF-SIMS images wasestablished via image processing to obtain a destruction free predictor for the amount ofcoupled amino acids when analysing the respective particle deposition. The demonstrationthat this predictor can be applied as quality control in each deposition step was performed bycomparing its results with a fluorescence image of the correctly assembled peptides.
Algorithmically, the advantage of the implemented quality control program lies in its flexiblestructure so that it can analyse any of the images coming from light microscopy, TOF-SIMSimaging or fluorescence microscopy by setting a few parameters only. The training programadditionally implemented simplifies the parameter tuning and allows to save standardconfigurations that can be quickly loaded into the quality control program.
The main future improvements on the system are planned in form of further TOF-SIMSimaging experiments to gain detailed information about the coupling efficiencies of all aminoacids and increase the precision of the current correlation between particle deposition andamino acid coupling.
Performing all steps as described in this chapter, the quality control can, in principle, beapplied to any kind of peptide array production. Adapting the algorithm to analyse glassslides instead of CMOS chips, and performing the imaging experiments with the arrays
69Image Processing Quality Analysis for Particle Based Peptide Array Production on a Microchip
www.intechopen.com
16 Will-be-set-by-IN-TECH
Fig. 9. Summary of all peptide synthesis steps, the image acquisition methods used and theresults obtained that lead to the setup of a quality control system
produced by a peptide printer Beyer et al. (2007), a quality control for another particle basedsolid phase peptide synthesis can be created. Using liquids as transport medium for the
70 Advanced Image Acquisition, Processing Techniques and Applications
www.intechopen.com
Image Processing Quality Analysis for Particle Based Peptide Array Production on a Microchip 17
amino acids, the system can still be applied, however, solely as quality analysis becausecoupling of the amino acids happens immediately when the liquid contacts the surface.Nevertheless, detecting deficiencies at an early synthesis stage saves production time andcosts, as non-functional arrays can be discarded just after the step the deficiency occurs in andnot at the end of an entire synthesis process.
7. Acknowledgements
We thank Ralf Achenbach, Markus Dorn and the ASIC laboratory for their technicalassistance with the microchips, Daniela Rambow, Sebastian Heß, Jürgen Kretschmer, ThomasFelgenhauer and Volker Stadler for their assistance, help and advice concerning particleproduction and surface activation, Klaus Leibe for his contributions to the design ofthe deposition apparatus and Jürgen Hesser for stimulating discussions. We gratefullyacknowledge the funding of the Baden-Württemberg-Stiftung and the Heidelberg GraduateSchool of Mathematical and Computational Methods for the Sciences.
8. References
Angulo, J. & Serra, J. (2003). Automatic analysis of DNA microarray images usingmathematical morphology, Bioinformatics 19(5): 553–562.
Aoyagi, S., Rouleau, A. & Boireau, W. (2008). TOF-SIMS structural charaterization ofself-assembly monolayer of cytochrome b5 onto gold substrate, Applied SurfaceScience 255: 1071–1074.
Bajcsy, P. (2005). An overview of DNA microarray image requirements for automatedprocessing, Computer Vision and Pattern Recognition Workshop 0: 147.
Beyer, M., Nesterov, A., Block, I., König, K., Felgenhauer, T., Fernandez, S., Leibe, K.,Torralba, G., Hausmann, M., Trunk, U., Lindenstruth, V., Bischoff, F. R., Stadler, V.& Breitling, F. (2007). Combinatorial synthesis of peptide arrays onto a microchip,Science 381(5858): 1888.
Brown, C. S., Goodwin, P. C. & Sorger, P. K. (2001). Image metrics in the statisticalanalysis of DNA microarray data, Proceedings of the National Academy of Sciences98(16): 8944–8949.
Chee, M., Yang, R., Hubbell, E., Berno, A., Huang, X. C., Stern, D., Winkler, J., Lockhart,D. J., Morris, M. S. & Fodor, S. P. A. (1996). Accessing genetic information withhigh-density DNA arrays, Science 274(5287): 610–614.
Cretich, M., Damin, F., Pirri, G. & Chiari, M. (2006). Protein and peptide arrays: Recent trendsand new directions, Biomolecular Engineering 23(2-3): 77–88.
Debouck, C. & Goodfellow, P. N. (1999). DNA microarrays in drug discovery anddevelopment., Nature Genetics 21(1 Suppl): 48–50.
Fodor, S. P., Read, J. L., Pirrung, M. C., Stryer, L., Lu, A. T. & Solas, D. (1991). Light-directed,spatially addressable parallel chemical synthesis, Science 251(4995): 767–773.
Graham, D. J. & Ratner, B. D. (1994). Multivariate analysis of TOF-SIMS spectra fromdodecanethiol SAM assembly on gold: Spectral interpretation and TOF-SIMSfragmentation processes, Science 264(5157): 399–402.
Gusev, A. I., Wilkinson, W. R., Proctor, A. & Hercules, D. M. (1993). Quantitativeanalysis of peptides by matrix-assisted laser desorption/ionization time-of-flightmass spectrometry, Applied Spectroscopy 47(8): 1091–1092.
71Image Processing Quality Analysis for Particle Based Peptide Array Production on a Microchip
www.intechopen.com

18 Will-be-set-by-IN-TECH
Hagenhoff, B. (2000). High resolution surface analysis by TOF-SIMS, Miicrochimica Acta132(2–4): 259–271.
Heller, M. J. (2002). DNA MICROARRAY TECHNOLOGY: Devices, systems, and applications,Annual Review of Biomedical Engineering 4(1): 129–153.
König, K., Block, I., Nesterov, A., Torralba, G., Fernandez, S., Felgenhauer, T., Leibe, K.,Schirwitz, C., Löffler, F., Painke, F., Wagner, J., Trunk, U., Hausmann, M., Bischoff,F., Breitling, F., Stadler, V. & Lindenstruth, V. (2010). Programmable high-voltagecmos chips for particle-based high-density combinatorial peptide synthesis, Sensorsand Actuators B 147(418): 418–427.
Löffler, F., Wagner, J., König, K., Märkle, F., Fernandez, S., Schirwitz, C., Torralba, G.,Hausmann, M., Lindenstruth, V., Bischoff, F. R., Breitling, F. & Nesterov, A.(2011). High-precision combinatorial deposition of micro particle patterns on amicroelectronic chip, Aerosol Science and Technology 45: 65–74.
Roepstorff, P. (2000). Maldi-tof mass spectrometry in protein chemistry, EXS 88.Schirwitz, C., Block, I., König, K., Nesterov, A., Fernandez, S., Felgenhauer, T.,
Leibe, K., Torralba, G., Hausmann, M., Lindenstruth, V. & Stadler, V. (2009).Combinatorial peptide synthesis on a microchip, Current Protocols in Protein Science57: 18.2.1–18.2.13.
Stadler, V., Beyer, M., König, K., Nesterov, A., Torralba, G., Lindenstruth, V., Hausmann, M.,Bischoff, F. R. & Breitling, F. (2007). Multifunctional cmos microchip coatings forprotein and peptide arrays, Journal of Proteome Research 6: 3197–3202.
Templin, M. F., Stoll, D., Schwenk, J. M., Pötz, O., Kramer, S. & Joos, T. O. (2003).Protein microarrays: Promising tools for proteomic research, PROTEOMICS3(11): 2155–2166.
Volkmer, R. (2009). Synthesis and application of peptide arrays: Quo vadis SPOT technology,ChemBioChem 10(9): 1431–1442.
Wagner, J., König, K., Förtsch, T., Löffler, F., Fernandez, S., Felgenhauer, T., Painke, F.,Torralba, G., Lindenstruth, V., Stadler, V., Bischoff, F., Breitling, F., Hausmann, M. &Nesterov-Müller, A. (2011). Microparticle transfer onto pixel electrodes of 45µm pitchon HV-CMOS chips – simulation and experiment, Sensors and Actuators A. Physical172: 533–545.
Wagner, J., Löffler, F., König, K., Fernandez, S., Nesterov-Müller, A., Breitling, F., Bischoff, F.,Stadler, V., Hausmann, M. & Lindenstruth, V. (2010). Quality analysis of selectivemicroparticle deposition on electrically programmable surfaces, Rev. Sci. Instrum.81(7): 073703–1–073703–6.
Wang, X., Ghosh, S. & Guo, S.-W. (2001). Quantitative quality control in microarray imageprocessing and data acquisition, Nucleic Acids Research 29(15): e75.
72 Advanced Image Acquisition, Processing Techniques and Applications
www.intechopen.com

Advanced Image Acquisition, Processing Techniques andApplications IEdited by Dr. Dimitrios Ventzas
ISBN 978-953-51-0342-4Hard cover, 170 pagesPublisher InTechPublished online 14, March, 2012Published in print edition March, 2012
InTech EuropeUniversity Campus STeP Ri Slavka Krautzeka 83/A 51000 Rijeka, Croatia Phone: +385 (51) 770 447 Fax: +385 (51) 686 166www.intechopen.com
InTech ChinaUnit 405, Office Block, Hotel Equatorial Shanghai No.65, Yan An Road (West), Shanghai, 200040, China
Phone: +86-21-62489820 Fax: +86-21-62489821
"Advanced Image Acquisition, Processing Techniques and Applications" is the first book of a series thatprovides image processing principles and practical software implementation on a broad range of applications.The book integrates material from leading researchers on Applied Digital Image Acquisition and Processing.An important feature of the book is its emphasis on software tools and scientific computing in order to enhanceresults and arrive at problem solution.
How to referenceIn order to correctly reference this scholarly work, feel free to copy and paste the following:
Jenny Wagner, Felix Löffler, Tobias Förtsch, Christopher Schirwitz, Simon Fernandez, Heinz Hinkers, HeinrichF. Arlinghaus, Florian Painke, Kai König, Ralf Bischoff, Alexander Nesterov-Müller, Frank Breitling, MichaelHausmann and Volker Lindenstruth (2012). Image Processing Quality Analysis for Particle Based PeptideArray Production on a Microchip, Advanced Image Acquisition, Processing Techniques and Applications I, Dr.Dimitrios Ventzas (Ed.), ISBN: 978-953-51-0342-4, InTech, Available from:http://www.intechopen.com/books/advanced-image-acquisition-processing-techniques-and-applications-i/image-processing-quality-analysis-for-particle-based-peptide-array-production-on-a-micro-chip

© 2012 The Author(s). Licensee IntechOpen. This is an open access articledistributed under the terms of the Creative Commons Attribution 3.0License, which permits unrestricted use, distribution, and reproduction inany medium, provided the original work is properly cited.