imagingingoutand other crystal-related arthropathies · imagingingoutand other crystal-related...
TRANSCRIPT

Imaging in Gout andOther Crystal-Related
ArthropathiesPatrick Omoumi, MD, MSc, PhDa,*, Pascal Zufferey, MDb,Jacques Malghem, MDc, Alexander So, FRCP, PhDb
KEYWORDS
� Gout � Crystal arthropathy � Calcification � Imaging � Radiography � Ultrasound� Dual-energy CT � MRI
KEY POINTS
� Crystal deposits in and around the joints are common andmost often encountered as inci-dental imaging findings in asymptomatic patients.
� In the chronic setting, imaging features of crystal arthropathies are usually characteristicand allow the differentiation of the type of crystal arthropathy, whereas in the acute phaseand in early stages, imaging signs are often nonspecific, and the final diagnosis still relieson the analysis of synovial fluid.
� Radiography remains the primary imaging tool in the workup of these conditions; ultra-sound has been playing an increasing role for superficially located crystal-induced ar-thropathies, and computerized tomography (CT) is a nice complement to radiographyfor deeper sites.
� When performed in the acute stage, MRI may show severe inflammatory changes thatcould be misleading; correlation to radiographs or CT should help to distinguish crystalarthropathies from infectious or tumoral conditions.
� Dual-energy CT is a promising tool for the characterization of crystal arthropathies, partic-ularly gout as it permits a quantitative assessment of deposits, andmay help in the follow-upof patients.
INTRODUCTION
The deposition of microcrystals within and around the joint is a common phenomenon.Intra-articular microcrystals are the most frequent cause of joint inflammation in adults.The most common types are monosodium urate (MSU), the cause of gouty arthropathy;
Disclosures: none.a Department of Diagnostic and Interventional Radiology, Lausanne University Hospital, Rue duBugnon 46, Lausanne 1011, Switzerland; b Department of Rheumatology, Lausanne UniversityHospital, Av Pierre Decker 5, Lausanne 1011, Switzerland; c Department of Radiology, Saint LucUniversity Hospital, UC Louvain, Av Hippocrate 10, Brussels 1200, Belgium* Corresponding author. Department of Diagnostic and Interventional Radiology, LausanneUniversity Hospital, Rue du Bugnon 46, Lausanne 1011, Switzerland.E-mail address: [email protected]
Rheum Dis Clin N Am 42 (2016) 621–644http://dx.doi.org/10.1016/j.rdc.2016.07.005 rheumatic.theclinics.com0889-857X/16/ª 2016 Elsevier Inc. All rights reserved.

Omoumi et al622
calcium pyrophosphate dihydrate (CPP), causing CPP deposition disease (CPPD); andbasic calciumphosphate (BCP), causingBCPdeposition disease (Table1). In this article,the authors consider the manifestations of intra-articular as well as periarticular crystaldeposits.Most casesof crystal deposits are asymptomatic and represent incidental find-ings at imaging. In case of symptomatic arthropathies, imaging can play an importantrole in the diagnosis and the assessment of disease progression as well as the extentof crystal deposits. Conventional radiography is the most common imaging modalityand still remains essential to the workup. But ultrasound (US), conventional computer-ized tomography (CT), dual-energy CT (DECT), and MRI all play an increasing role. Forexample, the new 2015 American College of Rheumatology/European League AgainstRheumatism’s classification criteria for gout take into account the radiological signsobtained by standard radiology as well as by DECT and US.1
The authors review typical radiographic features of each of these crystal-inducedarthropathies as well as findings that help to differentiate them. The increasing roleof complementary imaging techniques will also be emphasized.
CONVENTIONAL RADIOGRAPHY
Radiography remains the primary imaging technique in the diagnosis of crystal ar-thropathies. Table 2 gives an overview of the imaging features, underlying the maindifferences to help in diagnosis.
Monosodium Urate (Gout)
Radiographic features of chronic gouty arthropathyDeposits of MSU crystals are found in extra-articular as well as intraarticular sites,including cartilage.2 Gouty arthropathy may affect any joint in the body, includingthe axial skeleton.3 In the acute setting, gout most often affects the first joints of thelower limbs, most typically the first metatarsophalangeal joints.2,4
Table 1Composition and structure of the common pathogenic crystals in rheumatic diseases
Type of CrystalDeposit andChemicalComposition
Size and Shape ofCrystals
Detection of Crystals inSynovial Fluid/Biopsy
Common AssociatedClinical Conditions
Monosodiumurate (MSU)
C5H3N4O3.Na
2–30 mm, typicallyneedle shaped
By polarizing lightmicroscopy:negativelybirefringent crystals
� Acute gout� Chronic gout
(tophaceous gout)� Urate stones (contain
uric acid crystals)
Calciumphosphatedihydrate (CPP)
Ca2P2O7
1–20 mm, rhomboidalshaped
By polarizing lightmicroscopy: positivelybirefringent crystals
� Acute CPPDarthropathy (formerlyreferred to aspseudogout)
� Chronic CPPDarthropathy
Basic phosphatecalcium (BCP)
Ca5(PO4)3(OH)
1 nm, 5–20 mm in clumps � Difficult to detect bylight microscopy
� Fluorescencemicroscopy
� Aspecific alizarinstaining on tissuesamples
� BCP depositiondisease including� Calcific tendinitis� Calcific bursitis

Table 2Imaging features differentiating monosodium urate, calcium pyrophosphate dihydrate, and basic calcium phosphate crystals deposition diseases
MSU CPPD BCP
Distribution(in the joints/in the body)
Mostly para-articular structures (tendons,ligaments, bursae)
Intraarticular deposits less prominentMay be mono-articular or polyarticularFirst metatarsophalangeal joints in acute
phase, but any joint can be affected,especially in chronic phase
Mostly articular tissues (hyaline cartilage,fibrocartilage, synovium, capsule,ligament)
Usually polyarticularKnees, pubic symphysis, wrist
Mostly para-articular structures, inperiarticular locations (tendons111,bursae, ligaments)
Usually monoarticularAny joint can be affected, but in decreasingorder of frequency: shoulder, hips, elbows,wrists and knees
Radiographicaspect
Soft tissue swelling, joint effusion (acutephase)
Asymmetric soft tissue nodules that may befaintly hyperdense (tophaceous gout)
Well-defined, punched-out erosion withoverhanging edges, with preservation ofjoint space
Expansive intraosseous erosions
DenseFine, linear, punctate
Dense if quiescent, can lose density whenresorption occurs Homogeneous cloudlike,amorphous
CT Denser than soft tissues but lower densitythan calcified crystals (160–170 HU, with amaximum of 300 HU)
Nodular extra-articular and intraarticulardeposits
Dense (450 HU or more)Fine, linear, punctate
Dense (450 HU or more)Homogeneous cloudlike, amorphous
(continued on next page)
Imagingin
GoutandOtherCrysta
l-RelatedArth
ropathies
623
Ta 2(co inued )
MSU CPPD BCP
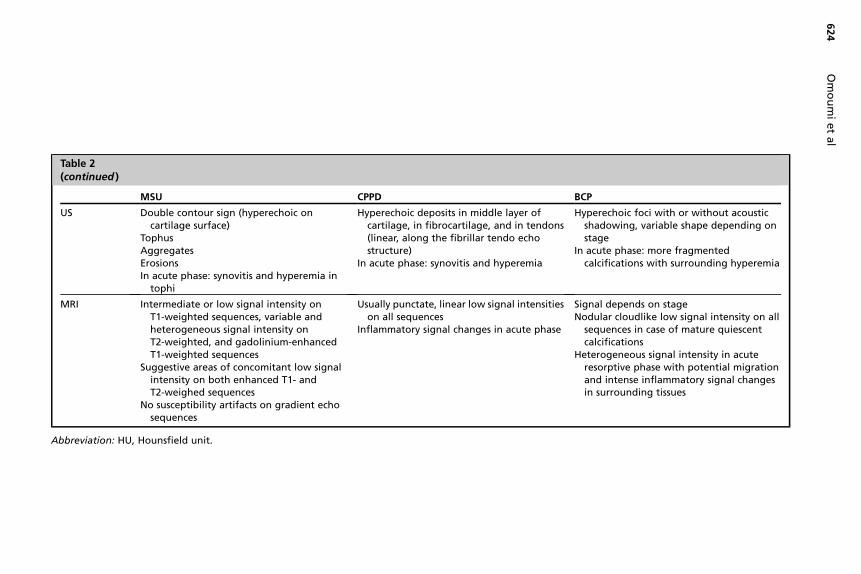
US Double contour sign (hyperechoic oncartilage surface)
TophusAggregatesErosionsIn acute phase: synovitis and hyperemia in
tophi
Hyperechoic deposits in middle lay ofcartilage, in fibrocartilage, and in endons(linear, along the fibrillar tendo ostructure)
In acute phase: synovitis and hyper ia
Hyperechoic foci with or without acousticshadowing, variable shape depending onstage
In acute phase: more fragmentedcalcifications with surrounding hyperemia
MR Intermediate or low signal intensity onT1-weighted sequences, variable andheterogeneous signal intensity onT2-weighted, and gadolinium-enhancedT1-weighted sequences
Suggestive areas of concomitant low signalintensity on both enhanced T1- andT2-weighed sequences
No susceptibility artifacts on gradient echosequences
Usually punctate, linear low signal i ensitieson all sequences
Inflammatory signal changes in acu phase
Signal depends on stageNodular cloudlike low signal intensity on allsequences in case of mature quiescentcalcifications
Heterogeneous signal intensity in acuteresorptive phase with potential migrationand intense inflammatory signal changesin surrounding tissues
Abbr iation: HU, Hounsfield unit.
Omoumietal
624
blent
I
ev
ert
ech
em
nt
te

Imaging in Gout and Other Crystal-Related Arthropathies 625
Radiographic signs of chronic gout (also called tophaceous gout) include asymmetricarticular, juxta-articular, or periarticular soft tissue nodules, corresponding to tophi.5
These nodules may be as dense or slightly denser than the adjacent soft tissues butare usually fainter than CPP or BCP deposits (Fig. 1D).6,7 MSU deposits can also occurin cartilage, but usually in advanced stages; joint space narrowing occurs late in theevolution of the disease, which is a characteristic feature of this condition (Fig. 2).Bone erosions are characteristic and present as well-defined intraarticular or juxta-
articular lesions with overhanging margins (Fig. 3).8 They can be expansive, some-times progressing to a punched-out amputated aspect of bone.9 Bone erosions are
Fig. 1. 61-year old manwith incidental signal abnormalities of the first metatarsophalangealjoint detected on anMRI of the hindfoot for peroneal tendon rupture under fluoroquinolonetherapy. These signal abnormalities yielded to complete the study with an MRI of the fore-foot, showing incidental asymptomatic chronic gouty arthropathy. Axial T1- (A), axial fat-suppressed enhanced T1- (B) and coronal fat-suppressed T2-weighted (C) sequences showarthropathy of first metatarsophalangeal joint with soft tissue swelling presenting interme-diate to low signal intensity on T1-, heterogeneous signal intensity on fat-suppressed T2-,and enhanced T1-weighted images. Note the presence of characteristic areas of low signal in-tensity on all sequences (arrows), corresponding to crystal deposits and chronic fibrous reac-tions. Radiograph of the foot (D) shows soft tissue swelling on medial aspect of firstmetatarsophalangeal joint (asterisk), of similar density than surrounding soft tissues as wellas juxta-articular bone erosion (short arrow in [D]).
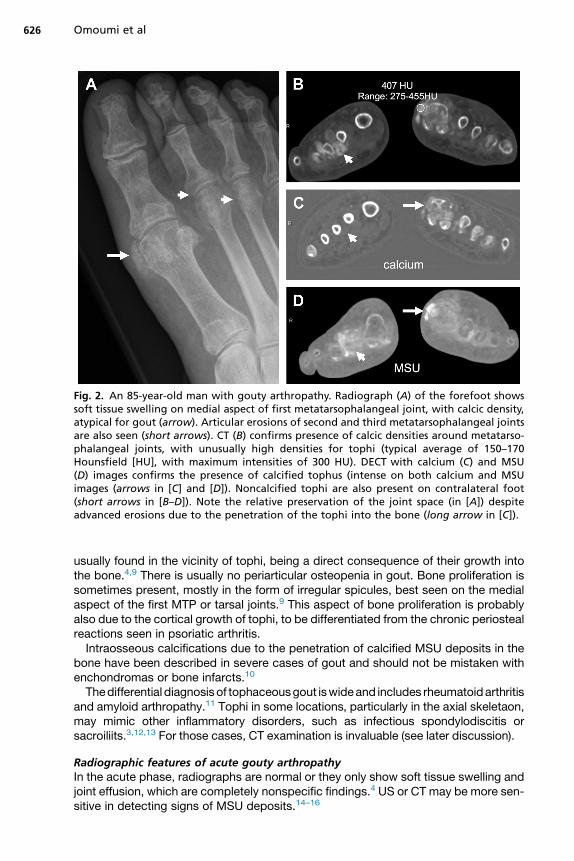
Fig. 2. An 85-year-old man with gouty arthropathy. Radiograph (A) of the forefoot showssoft tissue swelling on medial aspect of first metatarsophalangeal joint, with calcic density,atypical for gout (arrow). Articular erosions of second and third metatarsophalangeal jointsare also seen (short arrows). CT (B) confirms presence of calcic densities around metatarso-phalangeal joints, with unusually high densities for tophi (typical average of 150–170Hounsfield [HU], with maximum intensities of 300 HU). DECT with calcium (C) and MSU(D) images confirms the presence of calcified tophus (intense on both calcium and MSUimages (arrows in [C] and [D]). Noncalcified tophi are also present on contralateral foot(short arrows in [B–D]). Note the relative preservation of the joint space (in [A]) despiteadvanced erosions due to the penetration of the tophi into the bone (long arrow in [C]).
Omoumi et al626
usually found in the vicinity of tophi, being a direct consequence of their growth intothe bone.4,9 There is usually no periarticular osteopenia in gout. Bone proliferation issometimes present, mostly in the form of irregular spicules, best seen on the medialaspect of the first MTP or tarsal joints.9 This aspect of bone proliferation is probablyalso due to the cortical growth of tophi, to be differentiated from the chronic periostealreactions seen in psoriatic arthritis.Intraosseous calcifications due to the penetration of calcified MSU deposits in the
bone have been described in severe cases of gout and should not be mistaken withenchondromas or bone infarcts.10
Thedifferential diagnosisof tophaceousgout iswideand includes rheumatoidarthritisand amyloid arthropathy.11 Tophi in some locations, particularly in the axial skeletaon,may mimic other inflammatory disorders, such as infectious spondylodiscitis orsacroiliits.3,12,13 For those cases, CT examination is invaluable (see later discussion).
Radiographic features of acute gouty arthropathyIn the acute phase, radiographs are normal or they only show soft tissue swelling andjoint effusion, which are completely nonspecific findings.4 US or CT may be more sen-sitive in detecting signs of MSU deposits.14–16

Fig. 3. A 68-year-old woman with gouty arthropathy of the foot. Radiography (A) showssoft tissue swelling (asterisk) on medial aspect of first metatarsophalangeal joint, slightlydenser than surrounding soft tissues, typical for a tophus. CT (B) confirms gouty arthropathyof first metatarsophalangeal joint combining the presence of a tophus with typical densities(circle) (maximum densities usually <300 Hounsfield units [HU]), and articular/juxta-articularbone erosions with overhanging margins (arrows). Three-dimensional reconstruction ofDECT (C) confirms the presence of MSU crystals in tophi, with the added value of showingthe distribution of tophi around the ankle and of volumetric analysis (total volume of tophi:4.275 cm2). Note the presence of tophus inside the bone (arrows in [B]), causing bonyerosions with overhanging margins.
Imaging in Gout and Other Crystal-Related Arthropathies 627
Calcium Pyrophosphate Dihydrate Deposition Disease
Radiographic features of chronic calcium pyrophosphate dihydrate depositiondisease arthropathyCPPD can be found in all articular tissues, including hyaline cartilage and fibrocartilage(deposits in the 2 types of cartilage being classically referred to as chondrocalcinosis),synovium and ligaments, tendons, and other soft tissues (Fig. 4).17,18

Fig. 4. An 86-year-old woman with asymptomatic CPPD on radiographs of the knee,showing typical pattern and intraarticular distribution of CPP crystals. Note fine punctatetriangular pattern of calcifications in menisci (long arrow in [A]); linear pattern in quadrici-pital tendon (short arrows in [B]), oriented along the long axis of tendon fibers; and linearpattern of deposits in hyaline cartilage, parallel to the subchondral bone (long arrows in[B]). Deposits can occur in all intraarticular tissues, including hyaline cartilage, meniscal fi-brocartilage, tendons (popliteal tendon (short arrows in [A]) and gastrocnemius tendon(asterisk in [B])), ligaments, and synovium.
Omoumi et al628
The sites most often affected are the knee, pubic symphysis, and the wrist. Usingradiographs of these joints as a screening test for CPPD, the sensitivity obtainedwas 100%.18 However, CPPD can occur in other locations, including the spine(the crowned dens syndrome) (Fig. 5).19,20
Typically, CPP deposits present a fine, linear, or punctate pattern, somehowfollowing the fibrillar architecture of the affected tissues, particularly in tendons whereCPP crystals deposit between fibers (see Fig. 4). In cartilage, crystals tend to depositin themiddle layer of cartilage, organized in a linear pattern, parallel to the subchondralbone (Fig. 6).17
Fig. 5. A 62-year-old man with history of CPPD with chronic neck pain. MRI (A–D) showsdestructive arthropathy of the atlanto-axial joint, associated with area of low signal inten-sity on all sequences (T1- [A], fat-suppressed enhanced T1- [B], and T2-weighted sequences[C]), compatible with chronic reactional changes. The correlation with CT (D) confirms thearthropathy with erosions of the dens (black arrow in [D]), associated with calcificationsthat are compatible with CPP (white arrow in [D]), not visible on MRI (or radiographs, notshown). These features are typical of crowned dens syndrome.

Fig. 6. Comparison of US aspect of CPP (A) andMSU (C) crystals in cartilage (different patients).CPP crystal typically deposit within the layer of cartilage (A), forming hyperechoic foci (longarrows in [A]) (see radiograph of same patient in [B] for comparison), whereas MSU crystals de-posit on the surface of cartilage, forming the so-called double contour sign (superficial hyper-echoic line due toMSUdeposits on surfaceof cartilage anddeep fainter hyperechoic line due tosubchondral bone) (short arrows in [C]) (MSU deposits in cartilage are not visible on radio-graphs). Note that on the control US examination performed under appropriate hypouricemictreatment, the double contour sign has disappearedwith only one hyperechoic line visible dueto subchondral bone, which is now brighter (D).
Imaging in Gout and Other Crystal-Related Arthropathies 629
Most cases of CPPD are asymptomatic and are discovered incidentally. The prev-alence of CPPD is high and increases with age (prevalence of up to 25% in subjectsolder than 85 years).21–23 Below 50 years of age, however, idiopathic CPPD is rare; ifpresent, predisposing metabolic disorders should be excluded.1
CPPD may sometimes progress to a destructive arthropathy resembling osteoar-thritis (OA). Radiographic features may help to differentiate primary OA and CPPDarthropathy.1,18,24 In case of CPPD, arthropathic changes tend to be more severeand progressive, with extensive fragmentation of bone causing formation of intraartic-ular osseous bodies as well as prominent subchondral cystic changes. Also very sug-gestive of CPPD chronic arthropathy is the distribution: non–weight-bearing joints(shoulder, elbow, wrist) can be affected as much as weight-bearing joints (Fig. 7).18
Some sites are particularly suggestive of CPPD, such as the radiocarpal compartmentof the wrist, the patellofemoral compartment of the knee (see Fig. 7), the hindfoot, ormidfoot.CPPD can also be associated with other conditions, such as hemochromatosis, hy-
perparathyroidism, and gout; radiographic features of both CPPD and the associatedcondition can, therefore, be present simultaneously.25–27 In hemochromatosis, there ismore extensive destruction of the MCP joints (including the fourth and the fifth digits),hooklike osteophytes but deposits in the first carpometacarpal joint and scapholunatedissociation are less frequent.27
Finally, it is of note that a potential causative relationship between CPP and BCP de-posits and OA is under investigation.1,28,29

Fig. 7. A 79-year-old woman with bilateral shoulder arthropathy (radiographs on [A] and[B]), resembling severe OA, uncommon at non–weight-bearing joints. This aspect is compat-ible with a crystal-induced chronic arthropathy. Previous examinations from the patientconfirmed the presence of typical CPPD arthropathy at other sites (isolated severe femoro-patellar arthropathy seen on lateral radiographic view of the knee [arrow in (C)]) withcalcifications in the suprapatellar recess that are typical for CPP [arrowhead in (C)], symphy-sis pubis seen on axial CT image (arrow in D), multiple discovertebral destructive arthropathyseen on sagittal CT reformat (arrow in E) associated with CPPD in some discs (not shown).
Omoumi et al630
Radiographic features of calcium pyrophosphate dihydrate deposition diseasecalcifications in the acute settingIn the acute setting, the diagnosis of CPP is suggested by the presence of the char-acteristic features for CPPD described earlier. However, the diagnosis can only beproven by crystal identification.1 The sensitivity of radiography to detect CPPD incrystal-proven cases is weak: only 35.3% of histologically proven meniscal depositswere positive by radiograph in a cohort of 3228 patients.30 The reported sensitivitiesvary depending on the joint studied (from 29% to 93%).1
Basic Calcium Phosphate
Radiographic features of stable basic calcium phosphate calcificationsBCP calcifications are usually encountered in tendons, bursae, and other peritendi-nous structures.17 In descending order of frequency, the shoulder, hips, elbows,wrists, and knees are the most affected sites.31,32 However, any location can beaffected, including unusual ones that often lead to diagnostic difficulties.33–35

Imaging in Gout and Other Crystal-Related Arthropathies 631
Typically, BCP calcification in the quiescent phase presents a dense, homoge-neous, amorphous, cloudlike appearance (Fig. 8E, F).32 This aspect might be relatedto the pathophysiology of the disease: one of the prevailing theories is that dystrophiccalcifications form in areas of necrotic changes due to repetitive microtrauma andvascular changes.9,17,32
This pattern allows them to be differentiated from the linear and punctate aspects ofCPP deposits. BCP calcifications lack a cortical or trabecular structure, unlike hetero-topic ossifications and accessory ossicles (see Fig. 8E, F).36
Acute manifestations of basic calcium phosphate calcificationsAcute symptoms provoked by BCP deposits occur typically during the resportion ofcalcifications. They lose the typical features described earlier and may become faintand irregular (Figs. 9–11). Migration to bursae and adjacent soft tissues can occur(see Figs. 9–11).36 As the calcification diminishes and disappears, the acute symp-toms improve, typically over the course of a few days or weeks (see Fig. 10).36 Repeat
Fig. 8. A 33-year-old man with pain at the first metacarpophalangeal joint of the righthand. MRI (A–C) shows area of hyposignal intensity (arrows) on all sequences (T1 [A], fat-suppressed T2 [B], and fat-suppressed enhanced T1-weighted [C]), located in articularsoft-tissues of the first metacarpophalangeal joint. CT (D) and orthogonal radiographicviews (E, F) were ordered to confirm the presence of BCP calcification (long arrow in [D])with erosion of the adjacent bone (short arrow in [D]), not visible on radiographs (E, F).Note amorphous aspect of calcification on radiographs (arrow in [E]), not to be confusedwith sesamoid bones (circle in [F]), which present a typical cortico-trabecular pattern ofbone, contrary to calcifications.

Fig. 9. Three cases of rotator cuff BCP calcifications, with correlations between radiographsand US. (A, B) BCP calcification in resorptive phase. Radiograph (A) shows slightly blurry con-tours. US (B) shows multiple hyperechoic fragments visible (arrows). Parts of the fragmentsare in the subacromial bursa (short arrows). (C, D) BCP calcification that has migrated intothe subacromial bursa (arrows). Radiograph (C) shows faint calcification, whereas US (D)shows hyperechoic nodule. (E, F) BCP calcification that is migrating into the bone. Radio-graph (E) shows calcification with blurry margins (arrow in E), especially on the inferioraspect. At US (F), a hyperechoic nodule is seen (arrow in F). The continuity of the calcifica-tion with bone erosion is clearly depicted. Hyperemic reaction at Doppler imaging is seen.Note that no shadowing is present in any of the cases of resorptive calcifications.
Omoumi et al632

Fig. 10. A 60-year-old man with acute neck pain. MRI of the spine (A, B) shows inflammatorychanges in longus colli muscle (arrows). There is intermediate signal intensity on T1- (A) andhigh signal intensity on fat-suppressed T2-weighted sequence (B). Aspecific arthropathy ofatlanto-axial is also depicted (short arrow in [B]). Radiograph of the cervical spine per-formed on the same day shows well-defined calcification projecting at the anterior aspectof odontoid (arrow in [C]). Short-term follow-up radiograph at 10 days (D) shows a changein aspect of the calcification, being more elongated and fainter (arrows). This rapid changein density and shape is typical of BCP calcifications in the resorptive phase. A follow-upradiograph at 3 months (E) shows complete disappearance of calcification.
Imaging in Gout and Other Crystal-Related Arthropathies 633
radiographs can show a change in calcification and help to confirm the diagnosis (seeFig. 10). When the diagnosis is unclear, CT (especially for the spine [see Fig. 11]) or US(for superficial locations) may be useful (see later discussion).
ULTRASOUND
In recent years, major technical advances have led to improved image quality and per-formance of US. It is particularly useful for the diagnosis of crystal arthropathies andhas become, along with radiography, one of the main imaging techniques used.
Monosodium Urate Crystals
Ultrasound features of chronic tophaceous goutThe US features of MSU deposits are the double contour (DC) sign, tophi, aggregates,and erosions.37 The DC sign is defined as an “abnormal hyperechoic band over thesuperficial layer of the cartilage, independent of the angle of probe and may be either

Fig. 11. A 56-year-old man with esophageal carcinoma. The PET-CT performed for the stag-ing showed high uptake in the thoracic spine, interpreted as a metastasis (arrow in A). MRI(B–D), performed 10 days after the PET-CT shows inflammatory signal intensity on either sideof an intervertebral disc (low signal intensity on T1- [B], heterogeneous signal intensity onT2- [C], high signal intensity on fat-suppressed enhanced T1-weighted sequences [D](dashed circles)). The pattern (both sides of a disc) and signal abnormality are not compat-ible with a bone marrow replacement lesion that would be typical of a metastasis. The discitself does not show significant abnormality except for mild heterogeneous signal. Analysisof the CT examination (F) performed during the PET-CT shows heterogeneous dense calcifi-cation in the intervertebral disc (arrow). The calcification has clearly changed aspect whencompared with a CT examination (arrow in E) performed 2 weeks prior, on which it ap-peared more homogeneous. These features are characteristic of a BCP calcification in theresorptive phase, leading to inflammatory reactions. On a follow-up CT performed 5 monthslater (G), the calcification is less dense at the center and bone erosions (arrowheads) arevisible at both vertebral plates, confirming the intraosseous migration of the calcification.
Omoumi et al634
irregular or regular, continuous or intermittent and can be distinguished from the carti-lage interface sign” (see Fig. 6C, D).37,38 The specificity of this sign for gout has, how-ever, been questioned.39
Tophi are defined as « circumscribed, inhomogeneous, hyperechoic and/or hypoe-choic aggregates, which may be surrounded by a small anechoic rim » (Fig. 12).37
Aggregates are defined as « heterogeneous hyperechoic foci that have a high de-gree of reflectivity, even when the gain setting is minimized or the probe anglechanged ».37 They can have intraarticular or intratendinous locations.Erosions are defined as an « intra- and/or extra-articular discontinuity of the bone
surface (visible in two perpendicular planes)».37 Erosions have to be differentiatedfrom normal variations of cortical contour, degenerative, and traumatic changes.40
The inter-reader and intrareader agreement of these signs vary and are higher forthe DC sign (kappa 5 0.69–96) and tophi (kappa 5 0.65–1) than for aggregates.37,41
The diagnostic performance of US for gout depends on several factors, includingthe duration of the condition. The DC sign has been found in asymptomatic hyperur-icemic patients.40,42 When present, tophi and erosions seem to be depicted at US withhigh sensitivity compared with radiography, MRI, or DECT.41,43,44 Of note, US hasbeen used to assess the efficacy of urate-lowering therapy and can show a reductionin size of tophi as well as the disappearance of the DC sign (see Fig. 6).44–46
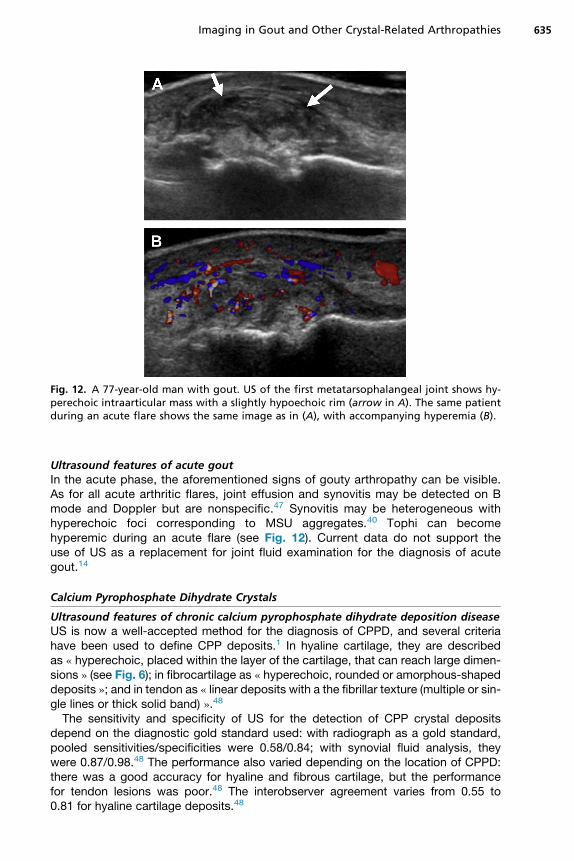
Fig. 12. A 77-year-old man with gout. US of the first metatarsophalangeal joint shows hy-perechoic intraarticular mass with a slightly hypoechoic rim (arrow in A). The same patientduring an acute flare shows the same image as in (A), with accompanying hyperemia (B).
Imaging in Gout and Other Crystal-Related Arthropathies 635
Ultrasound features of acute goutIn the acute phase, the aforementioned signs of gouty arthropathy can be visible.As for all acute arthritic flares, joint effusion and synovitis may be detected on Bmode and Doppler but are nonspecific.47 Synovitis may be heterogeneous withhyperechoic foci corresponding to MSU aggregates.40 Tophi can becomehyperemic during an acute flare (see Fig. 12). Current data do not support theuse of US as a replacement for joint fluid examination for the diagnosis of acutegout.14
Calcium Pyrophosphate Dihydrate Crystals
Ultrasound features of chronic calcium pyrophosphate dihydrate deposition diseaseUS is now a well-accepted method for the diagnosis of CPPD, and several criteriahave been used to define CPP deposits.1 In hyaline cartilage, they are describedas « hyperechoic, placed within the layer of the cartilage, that can reach large dimen-sions » (see Fig. 6); in fibrocartilage as « hyperechoic, rounded or amorphous-shapeddeposits »; and in tendon as « linear deposits with a the fibrillar texture (multiple or sin-gle lines or thick solid band) ».48
The sensitivity and specificity of US for the detection of CPP crystal depositsdepend on the diagnostic gold standard used: with radiograph as a gold standard,pooled sensitivities/specificities were 0.58/0.84; with synovial fluid analysis, theywere 0.87/0.98.48 The performance also varied depending on the location of CPPD:there was a good accuracy for hyaline and fibrous cartilage, but the performancefor tendon lesions was poor.48 The interobserver agreement varies from 0.55 to0.81 for hyaline cartilage deposits.48

Omoumi et al636
Ultrasound of acute calcium pyrophosphate dihydrate deposition diseaseIn the acute phase, the aforementioned signs of CPPD are usually accompanied by avariable degree of synovitis as well as hyperemia on Doppler examination.49
The value of US as a diagnostic modality was assessed recently. In the absence ofany signs of crystal deposit in the symptomatic joint, as well as in knees, ankles, andfirst metatarsophalangeal joints, CPPD can be ruled out with a negative predictivevalue of 87%, using synovial fluid analysis as the gold standard.14 In this study, therewas no statistically significant difference between US, radiography, and synovial fluidanalysis as a diagnostic tool; but other studies have reached differentconclusions.48,50
Basic Calcium Phosphate Calcifications
Ultrasound features of basic calcium phosphate calcificationThe main signs are hyperechoic foci with variable acoustic shadowing.51,52 The pres-ence of shadowing depends on their structure, the degree of fragmentation of thedeposit, and size.51 Four types of deposits have been described: arc-shaped(an echogenic arc with clear shadowing), fragmented or punctuate (at least 2 sepa-rated echogenic spots or plaques with or without shadowing), nodular (an echogenicnodule without shadowing), and cystic. This classification has however not been vali-dated (see Fig. 9).53
Ultrasound features of acute basic calcium phosphate calcificationThe presence of hyperemia on Doppler and of the features described above seems tocorrelate with the evolutive stage of the calcification and symptoms. A fragmentedappearance is associated with both worsening pain as well as the spontaneous reso-lution of symptoms.52,54 Doppler activity around the deposit and presence of effusionsuggest inflammation and are correlated with pain.53,54
Migration to surrounding structures (ie, bursae or bone), usually with accompanyinghyperemia, can be detected by US (see Fig. 9).36 Correlation with radiography helps inproviding the correct diagnosis.51
CONVENTIONAL COMPUTERIZED TOMOGRAPHY
Thanks to its excellent resolution and high contrast, CT is the technique of choice forthe assessment and characterization of crystal arthropathies. Crystal deposits areusually hyperdense compared with the adjacent soft tissues. Their density usuallyhelps in differentiating them. Typically, MSU deposits have average densities of160 to 170 Hounsfield units (HU), with the densest areas around 300 HU. Calcium hy-droxyapatite and calcium pyrophosphate deposits typically present densities of 450HU or more.55–57 The latter two types of calcifications are easily differentiated byapplying the same semiology as that described for radiography (fine, punctate, linear,oriented along the long axis of fibrillar structures for CPPD vs amorphous, cloudlike forBCP).CT’s main limitation is radiation exposure.58,59 In current clinical practice, CT is an
adjunct diagnostic tool to confirm the presence and nature of crystals in difficult cases,especially in locations that are difficult to visualize by radiography.19,36,57,60 In casesof crystal arthropathies affecting the axial skeleton, CT is particularly useful(see Fig. 11).3,61 A typical example of spinal deposit is the crowned dens syndrome,usually due to CPPD but rarely also a manifestation of BCP deposits (see Fig. 5).19,20
The incidental positivity of crystal arthropathies on PET and single-photon emissionCT scans has been reported, and careful analysis of the CT examination should avoiderroneous diagnoses of tumoral or infectious disorders (see Fig. 11).3,61–63

Imaging in Gout and Other Crystal-Related Arthropathies 637
Finally, CT has also been suggested as a quantitative tool to score bone erosions asan outcome measure for chronic gout studies.64
DUAL-ENERGY COMPUTERIZED TOMOGRAPHY
More recently, the advent of DECT has opened new perspectives. This technique al-lows differentiating deposits by their different x-ray spectra, using the principle that theattenuation of tissues depends not only on their density but also on their atomic num-ber Z as well as the energy of the photon beam.65
Along with the characterization of urinary stones, one of the main applications ofDECT over the past decade has been the assessment of crystal arthropathies(see Figs. 2 and 3).DECT shows a high diagnostic performance for the assessment of MSU deposition.
Reported sensitivities and specificities vary from 75% to 100% depending on thestudies, and there is high interobserver agreement (kappa 5 0.87–1).66–70 Comparedwith US, DECT has shown comparable or higher specificity but lower sensitivity indetecting smaller urate crystal deposits in joints.43,71
Numerous causes of false negatives exist. These causes can be due to less densetophi with lower crystal concentrations, small size of tophi/crystals (usually not visibleat less than 2 mm), or even technical parameters.69,72,73
There are also many causes of false-positive results. Postprocessed color-codedimages can falsely mimic the presence of MSU deposits when tissues present similarindex values, such as keratin. These false-positive results can be found around nailbeds and in the skin but also in regions of beam hardening and metal artifacts orthey can take the shape of single pixels scattered around the image, probably relatedto image noise.68,74 False-positive cases have also been described in cases of severeOA.69 A recent study has found abnormal intensities compatible with extensive depo-sition of MSU in costal cartilages and intervertebral discs of patients with gout andage-matched controls, suggesting that this finding might represent an artifact,although this would need to be confirmed.75
More work is needed to standardize postprocessing parameters in order toimprove the performance of DECT.73 Furthermore, several spectral imaging tech-niques are used by different manufacturers to obtain DECT.65 Most of the data inthe literature were obtained with dual-source scanners, which seem to representthe most robust technique. Results still need to be confirmed using other spectral im-aging methods.One of the main advantages of DECT is to offer automatic volume measurement of
MSU deposits, with potential applications not only in clinical practice but also inresearch.66,67,76,77 Therefore, DECT could serve as a tool to monitor tophus burdenas an outcome measure for gout.78 However, the sensitivity of DECT to change incrystal deposit volume still needs to be determined, and measurement errors remaina problem.79,80
MRI
MRI is not the modality of choice in the assessment of crystal arthropathies because ofits poor performance for the detection and characterization of crystals. In practice,MRI of crystal deposits can be encountered in 2 settings: first, in asymptomatic pa-tients presenting with crystal deposits as incidental findings (see Fig. 1) and, second,in acute crystal arthropathies presenting as inflammation in unusual locations whenMRI is requested for diagnostic purposes (see Figs. 5 and 10). In this setting,MR typically shows an intense inflammation in soft tissues and bones, which can be
Omoumi et al638
mistaken for infectious or tumoral conditions. A correlation with radiographs, CT, andUS is, therefore, essential to prove the presence of crystals in the inflamed area (seeFigs. 5 and 10).36
MRI Features of Monosodium Urate Crystal Deposits
MRI features of gouty arthropathy are variable and nonspecific. Tophi usually presentintermediate or low signal intensity on T1-weighted sequences. On T2-weighted andgadolinium-enhanced T1-weighted sequences, the signal intensity is heterogeneous(see Fig. 1).40,81 The more inflammatory the tophus is, the higher the signal on thesesequences. However, areas of concomitant low signal intensity on both enhancedT1- and T2-weighed sequences, corresponding to crystal deposits and chronicfibrous reactions, are often visible even at the inflammatory stage and can be sugges-tive of gouty arthropathy (see Fig. 1).5,7
The presence of synovial thickening with low signal intensity on T2-weighted se-quences can also be seen in pigmented villonodular synovitis; but in case of MSU de-posits, there is no signal attenuation on gradient echo sequences.7,11
MRI Features of Calcified Crystal Deposits (Calcium Pyrophosphate DihydrateDeposition Disease, Basic Calcium Phosphate)
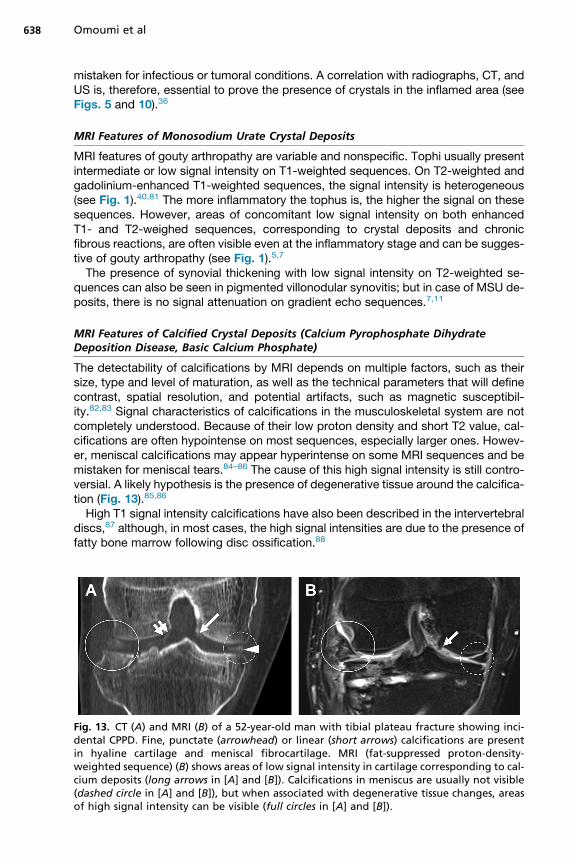
The detectability of calcifications by MRI depends on multiple factors, such as theirsize, type and level of maturation, as well as the technical parameters that will definecontrast, spatial resolution, and potential artifacts, such as magnetic susceptibil-ity.82,83 Signal characteristics of calcifications in the musculoskeletal system are notcompletely understood. Because of their low proton density and short T2 value, cal-cifications are often hypointense on most sequences, especially larger ones. Howev-er, meniscal calcifications may appear hyperintense on some MRI sequences and bemistaken for meniscal tears.84–86 The cause of this high signal intensity is still contro-versial. A likely hypothesis is the presence of degenerative tissue around the calcifica-tion (Fig. 13).85,86
High T1 signal intensity calcifications have also been described in the intervertebraldiscs,87 although, in most cases, the high signal intensities are due to the presence offatty bone marrow following disc ossification.88
Fig. 13. CT (A) and MRI (B) of a 52-year-old man with tibial plateau fracture showing inci-dental CPPD. Fine, punctate (arrowhead) or linear (short arrows) calcifications are presentin hyaline cartilage and meniscal fibrocartilage. MRI (fat-suppressed proton-density-weighted sequence) (B) shows areas of low signal intensity in cartilage corresponding to cal-cium deposits (long arrows in [A] and [B]). Calcifications in meniscus are usually not visible(dashed circle in [A] and [B]), but when associated with degenerative tissue changes, areasof high signal intensity can be visible (full circles in [A] and [B]).

Imaging in Gout and Other Crystal-Related Arthropathies 639
One of the key factors influencing the signal characteristics of calcification is theirstage of maturation.82 The signal intensity of BCP deposits in tendons is usually lowon all sequences during their quiescent, mature phase (see Fig. 8).89 Most frequentdifferential diagnoses for this pattern include the presence of gas related to a vacuumphenomenon, postsurgical magnetic artifact due to intraarticular metallic debris, andpigmented villonodular synovitis.17,86
During the resolution phase of calcific tendinitis, the calcification is no longercompact and the signal intensity of neighboring inflammatory tissues becomes het-erogeneous, with areas of intermediate signal on T1- and T2-weighted sequences.83
During this phase, extensive regional high signal intensities on T2- and fat-suppressedenhanced T1-weighted sequences, due to inflammation, usually prevail. These signalchanges are located in the tendon itself and in adjacent tissues where migration of thecalcification may occur and should not be mistaken for infectious or tumoral condi-tions (see Fig. 10).32,36
The detectability of calcifications byMRI also dependson the background tissue.82,83
Calcifications in the knee are usually easier to detect when located in hyaline cartilagecompared with menisci, which have relatively lower background signal intensity(therefore, creating less contrast with the low intensity calcifications) (see Fig. 13).86,90
Of note, novel MRI techniques are being developed, which have the potential toallow morphologic as well as quantitative assessment of calcifications.82 More workis needed, however, to shorten their acquisition times for routine clinical use.
SUMMARY
Crystal deposits in and around the joints are common and most often encountered asincidental imaging findings in asymptomatic patients. However, they can also causechronic or acute arthropathy, generating symptoms.In the chronic setting, imaging features are usually characteristic and allow the
differentiation of the type of crystal arthropathy. In the acute phase and in the earlystages of the crystal deposition, imaging signs are often nonspecific and the final diag-nosis still relies on the analysis of synovial fluid.Radiography is the main imaging modality for the workup of these conditions. It can
confirm the diagnosis and often characterizes the type of crystal arthropathy. In recentyears, US has played an increasingly important role in this setting and is a useful tool insuperficially located crystal-induced arthropathies. CT nicely complements radiog-raphy for deeper sites, especially the axial skeleton. DECT is a promising tool forthe characterization of crystal arthropathies, in particular gout as it permits a quanti-tative assessment of deposits, and may help in the follow-up of patients.When performed in the acute stage, MRI may show severe inflammatory changes
that could be misleading, and correlation to radiographs or CT should help to distin-guish crystal arthropathies from infectious or tumoral conditions.
REFERENCES
1. Zhang W, Doherty M, Bardin T, et al. European League Against Rheumatism rec-ommendations for calcium pyrophosphate deposition. Part I: terminology anddiagnosis. Ann Rheum Dis 2011;4(70):563–70.
2. Monu JUV, Pope TL. Gout: a clinical and radiologic review. Radiol Clin North Am2004;1(42):169–84.
3. Cardoso FN, Omoumi P, Wieers G, et al. Spinal and sacroiliac gouty arthritis:report of a case and review of the literature. Acta Radiol Short Rep 2014;8(3).2047981614549269.

Omoumi et al640
4. Gentili A. Advanced imaging of gout. Semin Musculoskelet Radiol 2003;3(7):165–74.
5. Dalbeth N, Pool B, Gamble GD, et al. Cellular characterization of the goutytophus: a quantitative analysis. Arthritis Rheum 2010;5(62):1549–56.
6. Bloch C, Hermann G, Yu TF. A radiologic reevaluation of gout: a study of 2,000patients. AJR Am J Roentgenol 1980;4(134):781–7.
7. Malghem J, Vande Berg B, Lecouvet F, et al. Goutte d’hier et d’aujourd’hui. In:Imagerie de l’appareil musculo-squlettique: Textes choisis. Montpellier (France):Sauramps Medical; 2011. p. 35–44.
8. Martel W. The overhanging margin of bone: a roentgenologic manifestation ofgout. Radiology 1968;4(91):755–6.
9. Choi MH, MacKenzie JD, Dalinka MK. Imaging features of crystal-inducedarthropathy. Rheum Dis Clin North Am 2006;2(32):427–46, viii.
10. Resnick D, Broderick TW. Intraosseous calcifications in tophaceous gout. AJRAm J Roentgenol 1981;6(137):1157–61.
11. Sheldon PJ, Forrester DM, Learch TJ. Imaging of intraarticular masses. Radio-graphics 2005;1(25):105–19.
12. Barrett K, Miller ML, Wilson JT. Tophaceous gout of the spine mimicking epiduralinfection: case report and review of the literature. Neurosurgery 2001;5(48):1170–2 [discussion: 1172–3].
13. Bastani B, Vemuri R, Gennis M. Acute gouty sacroiliitis: a case report and reviewof the literature. Mt Sinai J Med 1997;6(64):383–5.
14. Zufferey P, Valcov R, Fabreguet I, et al. A prospective evaluation of ultrasound asa diagnostic tool in acute microcrystalline arthritis. Arthritis Res Ther 2015;17:188.
15. Carter JD, Kedar RP, Anderson SR, et al. An analysis of MRI and ultrasoundimaging in patients with gout who have normal plain radiographs. Rheumatology(Oxford) 2009;11(48):1442–6.
16. Rettenbacher T, Ennemoser S, Weirich H, et al. Diagnostic imaging of gout: com-parison of high-resolution US versus conventional x-ray. Eur Radiol 2008;3(18):621–30.
17. Steinbach LS. Calcium pyrophosphate dihydrate and calcium hydroxyapatitecrystal deposition diseases: imaging perspectives. Radiol Clin North Am 2004;1(42):185–205, vii.
18. Resnick D, Niwayama G, Goergen TG, et al. Clinical, radiographic and patho-logic abnormalities in calcium pyrophosphate dihydrate deposition disease(CPPD): pseudogout. Radiology 1977;1(122):1–15.
19. Scutellari PN, Galeotti R, Leprotti S, et al. The crowned dens syndrome. Evalua-tion with CT imaging. Radiol Med 2007;2(112):195–207.
20. Baysal T, Baysal O, Kutlu R, et al. The crowned dens syndrome: a rare form ofcalcium pyrophosphate deposition disease. Eur Radiol 2000;6(10):1003–5.
21. Ellman MH, Brown NL, Levin B. Prevalence of knee chondrocalcinosis in hospitaland clinic patients aged 50 or older. J Am Geriatr Soc 1981;4(29):189–92.
22. Felson DT, Anderson JJ, Naimark A, et al. The prevalence of chondrocalcinosis inthe elderly and its association with knee osteoarthritis: The Framingham study.J Rheumatol 1989;9(16):1241–5.
23. Stensby JD, Lawrence DA, Patrie JT, et al. Prevalence of asymptomatic chondro-calcinosis in the pelvis. Skeletal Radiol 2016;7(45):949–54.
24. Martel W, McCarter DK, Solsky MA, et al. Further observations on the arthrop-athy of calcium pyrophosphate crystal deposition disease. Radiology 1981;1(141):1–15.

Imaging in Gout and Other Crystal-Related Arthropathies 641
25. Dodds WJ, Steinbach HL. Gout associated with calcification of cartilage. N Engl JMed 1966;14(275):745–9.
26. Hamilton EB. Diseases associated with CPPD deposition disease. ArthritisRheum 1976;19(Suppl 3):353–7.
27. Adamson TC, Resnik CS, Guerra J, et al. Hand and wrist arthropathies of hemo-chromatosis and calcium pyrophosphate deposition disease: distinct radio-graphic features. Radiology 1983;2(147):377–81.
28. Ea H-K, Nguyen C, Bazin D, et al. Articular cartilage calcification in osteoarthritis:insights into crystal-induced stress. Arthritis Rheum 2011;1(63):10–8.
29. Ea H-K, Liote F. Diagnosis and clinical manifestations of calcium pyrophosphateand basic calcium phosphate crystal deposition diseases. Rheum Dis Clin NorthAm 2014;2(40):207–29.
30. Fisseler-Eckhoff A, Muller KM. Arthroscopy and chondrocalcinosis. Arthroscopy1992;1(8):98–104.
31. Malghem J. Aspect radiologique des depots microcristallins. In: Imagerie de l’ap-pareil musculo-squlettique: Textes choisis. Montpellier (France): Sauramps Med-ical; 2011. p. 29–34.
32. Hayes CW, Conway WF. Calcium hydroxyapatite deposition disease. Radio-graphics 1990;6(10):1031–48.
33. Cox D, Paterson FW. Acute calcific tendinitis of peroneus longus. J Bone JointSurg Br 1991;2(73):342.
34. Hammoudeh M. Calcific tendinitis mimicking acute sternoclavicular joint arthritis.Rheumatology (Oxford) 2001;11(40):1316–7.
35. Moon SG, Kim NR, Choi JW, et al. Acute coccydynia related to precoccygealcalcific tendinitis. Skeletal Radiol 2012;4(41):473–6.
36. Malghem J, Omoumi P, Lecouvet F, et al. Intraosseous migration of tendinouscalcifications: cortical erosions, subcortical migration and extensive intramedul-lary diffusion, a SIMS Series. Skeletal Radiol 2015;44(10):1403–12.
37. Gutierrez M, Schmidt WA, Thiele RG, et al. International consensus for ultrasoundlesions in gout: results of Delphi process and web-reliability exercise. Rheuma-tology (Oxford) 2015;10(54):1797–805.
38. Thiele RG, Schlesinger N. Diagnosis of gout by ultrasound. Rheumatology(Oxford) 2007;7(46):1116–21.
39. Loffler C, Sattler H, Peters L, et al. Distinguishing gouty arthritis from calciumpyrophosphate disease and other arthritides. J Rheumatol 2015;3(42):513–20.
40. Girish G, Glazebrook KN, Jacobson JA. Advanced imaging in gout. AJR Am JRoentgenol 2013;3(201):515–25.
41. Durcan L, Grainger R, Keen HI, et al. Imaging as a potential outcome measure ingout studies: a systematic literature review. Semin Arthritis Rheum 2016;5(45):570–9.
42. Pineda C, Amezcua-Guerra LM, Solano C, et al. Joint and tendon subclinicalinvolvement suggestive of gouty arthritis in asymptomatic hyperuricemia: an ultra-sound controlled study. Arthritis Res Ther 2011;1(13):R4.
43. Huppertz A, Hermann K-GA, Diekhoff T, et al. Systemic staging for urate crystaldeposits with dual-energy CT and ultrasound in patients with suspected gout.Rheumatol Int 2014;6(34):763–71.
44. Perez-Ruiz F, Martin I, Canteli B. Ultrasonographic measurement of tophi as anoutcome measure for chronic gout. J Rheumatol 2007;9(34):1888–93.
45. Thiele RG, Schlesinger N. Ultrasonography shows disappearance of monoso-dium urate crystal deposition on hyaline cartilage after sustained normouricemiais achieved. Rheumatol Int 2010;4(30):495–503.

Omoumi et al642
46. Ottaviani S, Gill G, Aubrun A, et al. Ultrasound in gout: a useful tool for followingurate-lowering therapy. Joint Bone Spine 2015;1(82):42–4.
47. Mathieu S, Pereira B, Couderc M, et al. Usefulness of ultrasonography in thediagnosis of gout: a meta-analysis. Ann Rheum Dis 2013;10(72):e23.
48. Filippou G, Adinolfi A, Iagnocco A, et al. Ultrasound in the diagnosis of calciumpyrophosphate dihydrate deposition disease. A systematic literature review anda meta-analysis. Osteoarthritis Cartilage 2016;6(24):973–81.
49. Taljanovic MS, Melville DM, Gimber LH, et al. High-Resolution US of rheumato-logic diseases. Radiographics 2015;7(35):2026–48.
50. Filippou G, Adinolfi A, Cimmino MA, et al. Diagnostic accuracy of ultrasound,conventional radiography and synovial fluid analysis in the diagnosis of calciumpyrophosphate dihydrate crystal deposition disease. Clin Exp Rheumatol 2016;2(34):254–60.
51. Rutten MJCM, Jager GJ, Blickman JG. From the RSNA refresher courses: US ofthe rotator cuff: pitfalls, limitations, and artifacts. Radiographics 2006;2(26):589–604.
52. Le Goff B, Berthelot J-M, Guillot P, et al. Assessment of calcific tendonitis of rota-tor cuff by ultrasonography: comparison between symptomatic and asymptom-atic shoulders. Joint Bone Spine 2010;3(77):258–63.
53. Chiou H-J, Chou Y-H, Wu J-J, et al. Evaluation of calcific tendonitis of the rotatorcuff: role of color Doppler ultrasonography. J Ultrasound Med 2002;3(21):289–95[quiz: 296–7].
54. Zufferey P, So A. A pilot study of IL-1 inhibition in acute calcific periarthritis of theshoulder. Ann Rheum Dis 2013;3(72):465–7.
55. Malghem J, Vande Berg B, Vanden Berghe M, et al. Aspect TDM des tophi gout-teux. J Radiol 1995;76:865.
56. Gerster JC, Landry M, Duvoisin B, et al. Computed tomography of the knee jointas an indicator of intraarticular tophi in gout. Arthritis Rheum 1996;8(39):1406–9.
57. Gerster JC. Imaging of tophaceous gout: computed tomography provides spe-cific images compared with magnetic resonance imaging and ultrasonography.Ann Rheum Dis 2002;1(61):52–4.
58. Omoumi P, Becce F, Ott JG, et al. Optimization of radiation dose and imagequality in musculoskeletal CT: emphasis on iterative reconstruction techniques(part 1). Semin Musculoskelet Radiol 2015;5(19):415–21.
59. Omoumi P, Verdun FR, Becce F. Optimization of radiation dose and image qualityin musculoskeletal CT: emphasis on iterative reconstruction techniques (part 2).Semin Musculoskelet Radiol 2015;5(19):422–30.
60. McQueen FM, Doyle A, Dalbeth N. Imaging in the crystal arthropathies. RheumDis Clin North Am 2014;2(40):231–49.
61. Bancroft LW, Peterson JJ, Kransdorf MJ. Cysts, geodes, and erosions. Radiol ClinNorth Am 2004;1(42):73–87.
62. Duprez TP, Malghem J, Vande Berg BC, et al. Gout in the cervical spine: MRpattern mimicking diskovertebral infection. AJNR Am J Neuroradiol 1996;1(17):151–3.
63. Pickhardt PJ, Shapiro B. Three-phase skeletal scintigraphy in gouty arthritis: anexample of potential diagnostic pitfalls in radiopharmaceutical imaging of the ex-tremities for infection. Clin Nucl Med 1996;1(21):33–9.
64. Dalbeth N, Doyle A, Boyer L, et al. Development of a computed tomographymethod of scoring bone erosion in patients with gout: validation and clinical im-plications. Rheumatology (Oxford) 2011;2(50):410–6.
Imaging in Gout and Other Crystal-Related Arthropathies 643
65. Omoumi P, Becce F, Racine D, et al. Dual-energy CT: basic principles, technicalapproaches, and applications in musculoskeletal imaging (part 1). Semin Muscu-loskelet Radiol 2015;5(19):431–7.
66. Choi HK, Burns LC, Shojania K, et al. Dual energy CT in gout: a prospective vali-dation study. Ann Rheum Dis 2012;9(71):1466–71.
67. Choi HK, Al-Arfaj AM, Eftekhari A, et al. Dual energy computed tomography in to-phaceous gout. Ann Rheum Dis 2009;10(68):1609–12.
68. Glazebrook KN, Guimaraes LS, Murthy NS, et al. Identification of intraarticularand periarticular uric acid crystals with dual-energy CT: initial evaluation. Radi-ology 2011;2(261):516–24.
69. Bongartz T, Glazebrook KN, Kavros SJ, et al. Dual-energy CT for the diagnosis ofgout: an accuracy and diagnostic yield study. Ann Rheum Dis 2015;6(74):1072–7.
70. Finkenstaedt T, Manoliou A, Toniolo M, et al. Gouty arthritis: the diagnostic andtherapeutic impact of dual-energy CT. Eur Radiol 2016;1–11.
71. Gruber M, Bodner G, Rath E, et al. Dual-energy computed tomographycompared with ultrasound in the diagnosis of gout. Rheumatology (Oxford)2014;1(53):173–9.
72. Melzer R, Pauli C, Treumann T, et al. Gout tophus detection-a comparison of dual-energy CT (DECT) and histology. Semin Arthritis Rheum 2014;5(43):662–5.
73. McQueen FM, Doyle AJ, Reeves Q, et al. DECT urate deposits: now you seethem, now you don’t. Ann Rheum Dis 2013;3(72):458–9.
74. Mallinson PI, Coupal T, Reisinger C, et al. Artifacts in dual-energy CT gout proto-col: a review of 50 suspected cases with an artifact identification guide. AJR Am JRoentgenol 2014;1(203):W103–9.
75. Carr A, Doyle AJ, Dalbeth N, et al. Dual-Energy CT of urate deposits in costalcartilage and intervertebral disks of patients with tophaceous gout and age-matched controls. AJR Am J Roentgenol 2016;206(5):1063–7.
76. Dalbeth N, Aati O, Gao A, et al. Assessment of tophus size: a comparison be-tween physical measurement methods and dual-energy computed tomographyscanning. J Clin Rheumatol 2012;1(18):23–7.
77. Shi D, Xu J-X, Wu H-X, et al. Methods of assessment of tophus and bone erosionsin gout using dual-energy CT: reproducibility analysis. Clin Rheumatol 2015;4(34):755–65.
78. Schumacher HR, Taylor W, Edwards L, et al. Outcome domains for studies ofacute and chronic gout. J Rheumatol 2009;10(36):2342–5.
79. Bacani AK, McCollough CH, Glazebrook KN, et al. Dual energy computedtomography for quantification of tissue urate deposits in tophaceous gout: Helpfrom modern physics in the management of an ancient disease. Rheumatol Int2012;1(32):235–9.
80. Rajan A, Aati O, Kalluru R, et al. Lack of change in urate deposition by dual-energy computed tomography among clinically stable patients with long-standing tophaceous gout: a prospective longitudinal study. Arthritis Res Ther2013;5(15):R160.
81. Chen CK, Yeh LR, Pan HB, et al. Intra-articular gouty tophi of the knee: CTand MRimaging in 12 patients. Skeletal Radiol 1999;2(28):75–80.
82. Omoumi P, Bae WC, Du J, et al. Meniscal calcifications: morphologic andquantitative evaluation by using 2D inversion-recovery ultrashort echo time and3D ultrashort echo time 3.0-T MR imaging techniques–feasibility study. Radiology2012;1(264):260–8.

Omoumi et al644
TT
83. Vuillemin V, Guerini H, Omoumi P, et al. Le piege des calcifications en IRM. In:IRM musculo-squelettique de la clinique a la technique: techniques, pieges et as-tuces, ceintures scapulaire et pelvienne, rachis et pathologie tumorale, genou,IRM des extremites. Montpellier (France): Sauramps medical; 2014. p. 91–111.
84. Burke BJ, Escobedo EM, Wilson AJ, et al. Chondrocalcinosis mimicking a menis-cal tear on MR imaging. AJR Am J Roentgenol 1998;1(170):69–70.
85. Kaushik S, Erickson JK, Palmer WE, et al. Effect of chondrocalcinosis on theMR imaging of knee menisci. AJR Am J Roentgenol 2001;4(177):905–9.
86. Beltran J, Marty-Delfaut E, Bencardino J, et al. Chondrocalcinosis of the hyalinecartilage of the knee: MRI manifestations. Skeletal Radiol 1998;7(27):369–74.
87. Major NM, Helms CA, Genant HK. Calcification demonstrated as high signal in-tensity on t1-weighted MR images of the disks of the lumbar spine. Radiology1993;2(189):494–6.
88. Malghem J, Lecouvet FE, Francois R, et al. High signal intensity of intervertebralcalcified disks on t1-weighted MR images resulting from fat content. SkeletalRadiol 2005;2(34):80–6.
89. Loew M, Sabo D, Mau H, et al. Proton spin tomography imaging of the rotator cuffin calcific tendinitis of the shoulder. Z Orthop Ihre Grenzgeb 1996;4(134):354–9[in German].
90. Zubler C, Mengiardi B, Schmid MR, et al. MR arthrography in calcific tendinitis ofthe shoulder: diagnostic performance and pitfalls. Eur Radiol 2007;6(17):1603–10.
he author has requested enhancement of the downloaded file. All in-text references underlined in blue are linked to publications on ResearchGate.he author has requested enhancement of the downloaded file. All in-text references underlined in blue are linked to publications on ResearchGate.