imagng tests o the etecton of osteomyelts a systematc eew
TRANSCRIPT

Journals Library
DOI 10.3310/hta23610
Imaging tests for the detection of osteomyelitis: a systematic review Alexis Llewellyn, Julie Jones-Diette, Jeannette Kraft, Colin Holton, Melissa Harden and Mark Simmonds
Health Technology AssessmentVolume 23 • Issue 61 • October 2019
ISSN 1366-5278

Imaging tests for the detection ofosteomyelitis: a systematic review
Alexis Llewellyno ,1 Julie Jones-Dietteo ,1
Jeannette Krafto ,2 Colin Holton,2 Melissa Harden1
and Mark Simmondso1*
1Centre for Reviews and Dissemination, University of York, York, UK2Leeds Teaching Hospitals NHS Trust, Leeds, UK
*Corresponding author
Declared competing interests of authors: none
Published October 2019DOI: 10.3310/hta23610
This report should be referenced as follows:
Llewellyn A, Jones-Diette J, Kraft J, Holton C, Harden M, Simmonds M. Imaging tests for the
detection of osteomyelitis: a systematic review. Health Technol Assess 2019;23(61).
Health Technology Assessment is indexed and abstracted in Index Medicus/MEDLINE, ExcerptaMedica/EMBASE, Science Citation Index Expanded (SciSearch®) and Current Contents®/Clinical Medicine.

Health Technology Assessment HTA/HTA TAR
ISSN 1366-5278 (Print)
ISSN 2046-4924 (Online)
Impact factor: 3.819
Health Technology Assessment is indexed in MEDLINE, CINAHL, EMBASE, The Cochrane Library and the Clarivate Analytics ScienceCitation Index.
This journal is a member of and subscribes to the principles of the Committee on Publication Ethics (COPE) (www.publicationethics.org/).
Editorial contact: [email protected]
The full HTA archive is freely available to view online at www.journalslibrary.nihr.ac.uk/hta. Print-on-demand copies can be purchased from thereport pages of the NIHR Journals Library website: www.journalslibrary.nihr.ac.uk
Criteria for inclusion in the Health Technology Assessment journalReports are published in Health Technology Assessment (HTA) if (1) they have resulted from work for the HTA programme, and (2) theyare of a sufficiently high scientific quality as assessed by the reviewers and editors.
Reviews in Health Technology Assessment are termed ‘systematic’ when the account of the search appraisal and synthesis methods(to minimise biases and random errors) would, in theory, permit the replication of the review by others.
HTA programmeHealth Technology Assessment (HTA) research is undertaken where some evidence already exists to show that a technology can be effectiveand this needs to be compared to the current standard intervention to see which works best. Research can evaluate any intervention used inthe treatment, prevention or diagnosis of disease, provided the study outcomes lead to findings that have the potential to be of direct benefitto NHS patients. Technologies in this context mean any method used to promote health; prevent and treat disease; and improve rehabilitationor long-term care. They are not confined to new drugs and include any intervention used in the treatment, prevention or diagnosis of disease.
The journal is indexed in NHS Evidence via its abstracts included in MEDLINE and its Technology Assessment Reports inform National Institutefor Health and Care Excellence (NICE) guidance. HTA research is also an important source of evidence for National Screening Committee (NSC)policy decisions.
This reportThe research reported in this issue of the journal was funded by the HTA programme as project number 16/103/03. The contractual start datewas in July 2017. The draft report began editorial review in October 2018 and was accepted for publication in March 2019. The authors havebeen wholly responsible for all data collection, analysis and interpretation, and for writing up their work. The HTA editors and publisher havetried to ensure the accuracy of the authors’ report and would like to thank the reviewers for their constructive comments on the draftdocument. However, they do not accept liability for damages or losses arising from material published in this report.
This report presents independent research funded by the National Institute for Health Research (NIHR). The views and opinions expressed byauthors in this publication are those of the authors and do not necessarily reflect those of the NHS, the NIHR, NETSCC, the HTA programmeor the Department of Health and Social Care. If there are verbatim quotations included in this publication the views and opinions expressedby the interviewees are those of the interviewees and do not necessarily reflect those of the authors, those of the NHS, the NIHR, NETSCC,the HTA programme or the Department of Health and Social Care.
© Queen’s Printer and Controller of HMSO 2019. This work was produced by Llewellyn et al. under the terms of a commissioningcontract issued by the Secretary of State for Health and Social Care. This issue may be freely reproduced for the purposes ofprivate research and study and extracts (or indeed, the full report) may be included in professional journals provided thatsuitable acknowledgement is made and the reproduction is not associated with any form of advertising. Applications forcommercial reproduction should be addressed to: NIHR Journals Library, National Institute for Health Research, Evaluation,Trials and Studies Coordinating Centre, Alpha House, University of Southampton Science Park, Southampton SO16 7NS, UK.
Published by the NIHR Journals Library (www.journalslibrary.nihr.ac.uk), produced by Prepress Projects Ltd, Perth, Scotland(www.prepress-projects.co.uk).

NIHR Journals Library Editor-in-Chief
Professor Ken Stein Professor of Public Health, University of Exeter Medical School, UK
NIHR Journals Library Editors
Professor John Powell Chair of HTA and EME Editorial Board and Editor-in-Chief of HTA and EME journals. Consultant Clinical Adviser, National Institute for Health and Care Excellence (NICE), UK, and Senior Clinical Researcher, Nuffield Department of Primary Care Health Sciences, University of Oxford, UK
Professor Andrée Le May Chair of NIHR Journals Library Editorial Group (HS&DR, PGfAR, PHR journals) and Editor-in-Chief of HS&DR, PGfAR, PHR journals
Professor Matthias Beck Professor of Management, Cork University Business School, Department of Management and Marketing, University College Cork, Ireland
Dr Tessa Crilly Director, Crystal Blue Consulting Ltd, UK
Dr Eugenia Cronin Senior Scientific Advisor, Wessex Institute, UK
Dr Peter Davidson Consultant Advisor, Wessex Institute, University of Southampton, UK
Ms Tara Lamont Director, NIHR Dissemination Centre, UK
Dr Catriona McDaid Senior Research Fellow, York Trials Unit, Department of Health Sciences, University of York, UK
Professor William McGuire Professor of Child Health, Hull York Medical School, University of York, UK
Professor Geoffrey Meads Professor of Wellbeing Research, University of Winchester, UK
Professor John Norrie Chair in Medical Statistics, University of Edinburgh, UK
Professor James Raftery Professor of Health Technology Assessment, Wessex Institute, Faculty of Medicine, University of Southampton, UK
Dr Rob Riemsma Reviews Manager, Kleijnen Systematic Reviews Ltd, UK
Professor Helen Roberts Professor of Child Health Research, UCL Great Ormond Street Institute of Child Health, UK
Professor Jonathan Ross Professor of Sexual Health and HIV, University Hospital Birmingham, UK
Professor Helen Snooks Professor of Health Services Research, Institute of Life Science, College of Medicine, Swansea University, UK
Professor Ken Stein Professor of Public Health, University of Exeter Medical School, UK
Professor Jim Thornton Professor of Obstetrics and Gynaecology, Faculty of Medicine and Health Sciences, University of Nottingham, UK
Professor Martin Underwood Warwick Clinical Trials Unit, Warwick Medical School, University of Warwick, UK
Please visit the website for a list of editors: www.journalslibrary.nihr.ac.uk/about/editors
Editorial contact: [email protected]
NIHR Journals Library www.journalslibrary.nihr.ac.uk
Abstract
Imaging tests for the detection of osteomyelitis:a systematic review
Alexis Llewellyno ,1 Julie Jones-Dietteo ,1 Jeannette Krafto ,2
Colin Holton,2 Melissa Harden1 and Mark Simmondso 1*
1Centre for Reviews and Dissemination, University of York, York, UK2Leeds Teaching Hospitals NHS Trust, Leeds, UK
*Corresponding author [email protected]
Background: Osteomyelitis is an infection of the bone. Medical imaging tests, such as radiography,ultrasound, magnetic resonance imaging (MRI), single-photon emission computed tomography (SPECT)and positron emission tomography (PET), are often used to diagnose osteomyelitis.
Objectives: To systematically review the evidence on the diagnostic accuracy, inter-rater reliability andimplementation of imaging tests to diagnose osteomyelitis.
Data sources: We conducted a systematic review of imaging tests to diagnose osteomyelitis. We searchedMEDLINE and other databases from inception to July 2018.
Review methods: Risk of bias was assessed with QUADAS-2 [quality assessment of diagnostic accuracystudies (version 2)]. Diagnostic accuracy was assessed using bivariate regression models. Imaging testswere compared. Subgroup analyses were performed based on the location and nature of the suspectedosteomyelitis. Studies of children, inter-rater reliability and implementation outcomes were synthesisednarratively.
Results: Eighty-one studies were included (diagnostic accuracy: 77 studies; inter-rater reliability: 11 studies;implementation: one study; some studies were included in two reviews). One-quarter of diagnostic accuracystudies were rated as being at a high risk of bias. In adults, MRI had high diagnostic accuracy [95.6%sensitivity, 95% confidence interval (CI) 92.4% to 97.5%; 80.7% specificity, 95% CI 70.8% to 87.8%].PET also had high accuracy (85.1% sensitivity, 95% CI 71.5% to 92.9%; 92.8% specificity, 95% CI 83.0%to 97.1%), as did SPECT (95.1% sensitivity, 95% CI 87.8% to 98.1%; 82.0% specificity, 95% CI 61.5% to92.8%). There was similar diagnostic performance with MRI, PET and SPECT. Scintigraphy (83.6% sensitivity,95% CI 71.8% to 91.1%; 70.6% specificity, 57.7% to 80.8%), computed tomography (69.7% sensitivity,95% CI 40.1% to 88.7%; 90.2% specificity, 95% CI 57.6% to 98.4%) and radiography (70.4% sensitivity,95% CI 61.6% to 77.8%; 81.5% specificity, 95% CI 69.6% to 89.5%) all had generally inferior diagnosticaccuracy. Technetium-99m hexamethylpropyleneamine oxime white blood cell scintigraphy (87.3%sensitivity, 95% CI 75.1% to 94.0%; 94.7% specificity, 95% CI 84.9% to 98.3%) had higher diagnosticaccuracy, similar to that of PET or MRI. There was no evidence that diagnostic accuracy varied by scanlocation or cause of osteomyelitis, although data on many scan locations were limited. Diagnostic accuracyin diabetic foot patients was similar to the overall results. Only three studies in children were identified;results were too limited to draw any conclusions. Eleven studies evaluated inter-rater reliability. MRI hadacceptable inter-rater reliability. We found only one study on test implementation and no evidence onpatient preferences or cost-effectiveness of imaging tests for osteomyelitis.
Limitations: Most studies included < 50 participants and were poorly reported. There was limited evidencefor children, ultrasonography and on clinical factors other than diagnostic accuracy.
DOI: 10.3310/hta23610 HEALTH TECHNOLOGY ASSESSMENT 2019 VOL. 23 NO. 61
© Queen’s Printer and Controller of HMSO 2019. This work was produced by Llewellyn et al. under the terms of a commissioning contract issued by the Secretary of State forHealth and Social Care. This issue may be freely reproduced for the purposes of private research and study and extracts (or indeed, the full report) may be included in professionaljournals provided that suitable acknowledgement is made and the reproduction is not associated with any form of advertising. Applications for commercial reproduction shouldbe addressed to: NIHR Journals Library, National Institute for Health Research, Evaluation, Trials and Studies Coordinating Centre, Alpha House, University of Southampton SciencePark, Southampton SO16 7NS, UK.
v

Conclusions: Osteomyelitis is reliably diagnosed by MRI, PET and SPECT. No clear reason to prefer one testover the other in terms of diagnostic accuracy was identified. The wider availability of MRI machines, andthe fact that MRI does not expose patients to harmful ionising radiation, may mean that MRI is preferable inmost cases. Diagnostic accuracy does not appear to vary with the potential cause of osteomyelitis or withthe body part scanned. Considerable uncertainty remains over the diagnostic accuracy of imaging tests inchildren. Studies of diagnostic accuracy in children, particularly using MRI and ultrasound, are needed.
Study registration: This study is registered as PROSPERO CRD42017068511.
Funding: This project was funded by the National Institute for Health Research Health TechnologyAssessment programme and will be published in full in Health Technology Assessment; Vol. 23, No. 61.See the NIHR Journals Library website for further project information.
ABSTRACT
NIHR Journals Library www.journalslibrary.nihr.ac.uk
vi

Contents
List of tables ix
List of figures xi
Glossary xiii
List of abbreviations xv
Plain English summary xvii
Scientific summary xix
Chapter 1 Background 1Osteomyelitis 1Diagnostic imaging for osteomyelitis 1Current diagnostic and treatment practice 2Pathway to diagnosis in the NHS 2Existing review evidence 3
Chapter 2 Aims and objectives 5
Chapter 3 Methods 7Literature searches 7Study selection 7
Participants 7Index tests 7Reference standards 8Outcomes 8Study designs 8
Data extraction 8Quality assessment 9Synthesis 9
Diagnostic meta-analysis 9Inter-rater reliability and implementation review 11Deviations from the protocol 11
Role of patient and clinical advisors 11
Chapter 4 Results 13Quantity and quality of research available 13
Included studies 13Excluded studies 14
Assessment of diagnostic accuracy 14Characteristics of included studies 14Critical appraisal 19
Synthesis of diagnostic accuracy in adults 22Comparisons between tests 24Synthesis of specific imaging tests 26Other factors and subgroups 32
DOI: 10.3310/hta23610 HEALTH TECHNOLOGY ASSESSMENT 2019 VOL. 23 NO. 61
© Queen’s Printer and Controller of HMSO 2019. This work was produced by Llewellyn et al. under the terms of a commissioning contract issued by the Secretary of State forHealth and Social Care. This issue may be freely reproduced for the purposes of private research and study and extracts (or indeed, the full report) may be included in professionaljournals provided that suitable acknowledgement is made and the reproduction is not associated with any form of advertising. Applications for commercial reproduction shouldbe addressed to: NIHR Journals Library, National Institute for Health Research, Evaluation, Trials and Studies Coordinating Centre, Alpha House, University of Southampton SciencePark, Southampton SO16 7NS, UK.
vii
Synthesis of diagnostic accuracy in people with diabetic foot ulcers 35Comparisons of tests 36
Synthesis of diagnostic accuracy for osteomyelitis not related to diabetes 37Comparisons of tests 39
Studies not included in the quantitative synthesis 39Synthesis of studies in children 40Review of inter-rater reliability 42
Characteristics of included studies 42Critical appraisal 42Results of inter-rater reliability studies 44
Review of implementation 44Summary of previous systematic reviews 46Clinical effectiveness summary and conclusions 46
Summary of included studies 46General conclusions from synthesis 51Diagnostic accuracy by cause or nature of osteomyelitis 51Studies of children, inter-rater reliability and implementation 52
Chapter 5 Discussion 53Statement of principal findings 53
Diagnostic accuracy in adults 53Diagnostic tests in children 54Inter-rater reliability and implementation 54
Strengths and limitations of the assessment 54Strengths 54Limitations 55
Uncertainties 56Considerations from patient representatives 56
Chapter 6 Conclusions 57Implications for health care 57Suggested research priorities 58
Acknowledgements 59
References 61
Appendix 1 Literature searches 73
Appendix 2 Results of critical appraisal of diagnostic accuracy studies(QUADAS-2) 91
Appendix 3 Participant selection criteria in diagnostic accuracy studies 105
Appendix 4 Results of diagnostic meta-analyses 111
CONTENTS
NIHR Journals Library www.journalslibrary.nihr.ac.uk
viii

List of tables
TABLE 1 Study design and participant characteristics 15
TABLE 2 Diagnostic accuracy studies according to test and body part targeted 19
TABLE 3 Summary of critical appraisal of diagnostic accuracy studies 19
TABLE 4 Results of univariate meta-analyses 26
TABLE 5 Summary of regression model to compare imaging tests 27
TABLE 6 Summary of diagnostic accuracy of ultrasound studies 30
TABLE 7 Comparison of tests in people with diabetic foot ulcers 36
TABLE 8 Comparison of tests in people without diabetes 39
TABLE 9 Studies not included in the quantitative synthesis 40
TABLE 10 Diagnostic accuracy results of studies in children 41
TABLE 11 Characteristics of inter-rater reliability studies 43
TABLE 12 Critical appraisal of inter-rater reliability studies 44
TABLE 13 Results of inter-rater reliability studies 45
TABLE 14 Summary of previous systematic reviews 47
TABLE 15 The QUADAS-2 signalling questions for risk-of-bias assessment 91
TABLE 16 The QUADAS-2 risk-of-bias decisions 92
TABLE 17 The QUADAS-2 applicability decisions 102
TABLE 18 Participant selection criteria in diagnostic accuracy studies 105
TABLE 19 Summary of diagnostic accuracy studies 111
TABLE 20 Results from logistic regression model to compare tests 115
TABLE 21 Summary of studies of scintigraphy 115
TABLE 22 Results from logistic regression model to compare tests 118
TABLE 23 Univariate meta-analyses of studies of people with diabetic foot ulcers 122
TABLE 24 Results of logistic regression to compare tests – diabetic foot ulcers 123
TABLE 25 Univariate meta-analysis – patients without diabetes 126
TABLE 26 Results of logistic regression to compare tests – patients without diabetes 127
DOI: 10.3310/hta23610 HEALTH TECHNOLOGY ASSESSMENT 2019 VOL. 23 NO. 61
© Queen’s Printer and Controller of HMSO 2019. This work was produced by Llewellyn et al. under the terms of a commissioning contract issued by the Secretary of State forHealth and Social Care. This issue may be freely reproduced for the purposes of private research and study and extracts (or indeed, the full report) may be included in professionaljournals provided that suitable acknowledgement is made and the reproduction is not associated with any form of advertising. Applications for commercial reproduction shouldbe addressed to: NIHR Journals Library, National Institute for Health Research, Evaluation, Trials and Studies Coordinating Centre, Alpha House, University of Southampton SciencePark, Southampton SO16 7NS, UK.
ix

List of figures
FIGURE 1 A PRISMA flow diagram showing study selection 13
FIGURE 2 Summary ROC plot of diagnostic accuracy in adults 22
FIGURE 3 Bivariate meta-analysis of sensitivity and specificity: all adult studies 23
FIGURE 4 Summary HSROC curves: all adult studies 23
FIGURE 5 Forest plots of sensitivity and specificity for MRI 25
FIGURE 6 Comparing DORs within studies 27
FIGURE 7 Summary ROC plot for scintigraphy studies 28
FIGURE 8 Diagnostic accuracy of scintigraphy according to type of test performed 29
FIGURE 9 Diagnostic accuracy of SPECT studies according to type of SPECT used 30
FIGURE 10 Diagnostic accuracy results for combination tests 31
FIGURE 11 Diagnostic odds ratios for combination tests 31
FIGURE 12 Sensitivity and specificity according to whether or not any imagingtest was used before the main test 33
FIGURE 13 Sensitivity and specificity according to whether the study was of AOMor COM 34
FIGURE 14 Bivariate meta-analysis according to acute or chronic status 34
FIGURE 15 Sensitivity and specificity in studies of patients with diabetic foot ulcers 35
FIGURE 16 Bivariate analysis of sensitivity and specificity in people with diabeticfoot ulcers 36
FIGURE 17 Sensitivity and specificity according to scan location 37
FIGURE 18 Sensitivity and specificity according to likely cause of osteomyelitis 38
FIGURE 19 Bivariate meta-analysis in studies of people without diabetes 39
FIGURE 20 Summary of risk of bias and applicability assessment 91
FIGURE 21 Summary of PPV and NPV in adults 113
FIGURE 22 Summary of PPV and NPV from bivariate analysis 113
FIGURE 23 Comparisons of DORs within studies 114
DOI: 10.3310/hta23610 HEALTH TECHNOLOGY ASSESSMENT 2019 VOL. 23 NO. 61
© Queen’s Printer and Controller of HMSO 2019. This work was produced by Llewellyn et al. under the terms of a commissioning contract issued by the Secretary of State forHealth and Social Care. This issue may be freely reproduced for the purposes of private research and study and extracts (or indeed, the full report) may be included in professionaljournals provided that suitable acknowledgement is made and the reproduction is not associated with any form of advertising. Applications for commercial reproduction shouldbe addressed to: NIHR Journals Library, National Institute for Health Research, Evaluation, Trials and Studies Coordinating Centre, Alpha House, University of Southampton SciencePark, Southampton SO16 7NS, UK.
xi

FIGURE 24 Association between specificity and incidence of osteomyelitis in MRIstudies 117
FIGURE 25 Sensitivity and specificity for PET and PET-CT studies 117
FIGURE 26 Sensitivity and specificity according to test and reference standard used 118
FIGURE 27 Sensitivity and specificity according to risk of bias owing to patientselection 119
FIGURE 28 Sensitivity and specificity according to risk of bias owing to index test 119
FIGURE 29 Sensitivity and specificity according to presence of indwelling metalwork 120
FIGURE 30 The PPV and NPV in studies of people with diabetic foot ulcers 120
FIGURE 31 The HSROC curves in studies of people with diabetic foot ulcers 121
FIGURE 32 Summary PPV and NPV in studies of people with diabetic foot ulcers 121
FIGURE 33 Meta-analysis of scintigraphy studies in people with diabetic foot ulcers 122
FIGURE 34 Difference in DOR between studies – patients with diabetic foot ulcers 123
FIGURE 35 The PPV and NPV by test location 124
FIGURE 36 The PPV and NPV by cause of osteomyelitis 124
FIGURE 37 Summary sensitivity and specificity by test location 125
FIGURE 38 Summary sensitivity and specificity by cause of osteomyelitis 125
FIGURE 39 Comparisons of DORs across tests – patients without diabetes 127
LIST OF FIGURES
NIHR Journals Library www.journalslibrary.nihr.ac.uk
xii
Glossary
Diagnostic odds ratio Ratio of odds of sensitivity to odds of specificity (summarises diagnostic accuracy).
Diphosphono-1,2-propanodicarboxylic acid A substance used in scintigraphy.
False negative Incorrect negative test result – an affected individual with a negative test result.
False positive Incorrect positive test result – an unaffected individual with a positive test result.
Fludeoxyglucose A radiopharmaceutical used in positron emission tomography.
Hexamethylpropyleneamine oxime A substance used in scintigraphy.
Histopathology The microscopic study of tissue samples to enable the diagnosis of osteomyelitis.
(Hydroxy)methylene diphosphonate A substance used in scintigraphy.
Index test The test for which diagnostic accuracy is being evaluated.
Indium-111 A radioisotope used in scintigraphy.
Meta-analysis Statistical (or quantitative) techniques used to combine the results of two or more studiesand obtain a combined estimate of effect.
Microbiology A laboratory method used to diagnose osteomyelitis; a microbiological culture involvesmultiplying microbial organisms by letting them reproduce under controlled laboratory conditions.
Negative predictive value Proportion of people who test negative (for osteomyelitis) who do not havethe condition.
Positive predictive value Proportion of people who test positive who have the condition.
Positive rate Proportion of people with a positive index test result (i.e. who might be diagnosedwith osteomyelitis).
Sensitivity Proportion of people with the condition (osteomyelitis) who are correctly diagnosed.
Specificity Proportion of people without the condition who are correctly diagnosed.
Technetium-99m A radioisotope used in scintigraphy and single-photon emission computed tomography.
True negative A correct negative test result – an unaffected individual with a negative test result.
True positive A correct positive test result – an affected individual with a positive test result.
DOI: 10.3310/hta23610 HEALTH TECHNOLOGY ASSESSMENT 2019 VOL. 23 NO. 61
© Queen’s Printer and Controller of HMSO 2019. This work was produced by Llewellyn et al. under the terms of a commissioning contract issued by the Secretary of State forHealth and Social Care. This issue may be freely reproduced for the purposes of private research and study and extracts (or indeed, the full report) may be included in professionaljournals provided that suitable acknowledgement is made and the reproduction is not associated with any form of advertising. Applications for commercial reproduction shouldbe addressed to: NIHR Journals Library, National Institute for Health Research, Evaluation, Trials and Studies Coordinating Centre, Alpha House, University of Southampton SciencePark, Southampton SO16 7NS, UK.
xiii


List of abbreviations
18F-FDG fludeoxyglucose
3D three-dimensional
99mTc technetium-99m
AGA antigranulocyte antibody
AOM acute osteomyelitis
CDSR Cochrane Database of SystematicReviews
CENTRAL Cochrane Central Register ofControlled Trials
CI confidence interval
CINAHL Cumulative Index to Nursing andAllied Health
COM chronic osteomyelitis
CRD Centre for Reviews andDissemination
CT computed tomography
DARE Database of Abstracts of Reviewsof Effects
DOR diagnostic odds ratio
DPD diphosphono-1,2-propanodicarboxylic acid
GP general practitioner
(H)MDP (hydroxy)methylene diphosphonate
HMPAO hexamethylpropyleneamine oxime
HSROC hierarchical summary receiveroperating characteristic
HTA Health Technology Assessment
MDP methylene diphosphonate
MeSH medical subject heading
MRI magnetic resonance imaging
NICE National Institute for Health andCare Excellence
NPV negative predictive value
PET positron emission tomography
PPV positive predictive value
PR positive rate
PRISMA Preferred Reporting Items forSystematic Reviews andMeta-Analyses
QUADAS-2 quality assessment of diagnosticaccuracy studies (version 2)
ROC receiver operating characteristic
SPECT single-photon emission computedtomography
WBC white blood cell
DOI: 10.3310/hta23610 HEALTH TECHNOLOGY ASSESSMENT 2019 VOL. 23 NO. 61
© Queen’s Printer and Controller of HMSO 2019. This work was produced by Llewellyn et al. under the terms of a commissioning contract issued by the Secretary of State forHealth and Social Care. This issue may be freely reproduced for the purposes of private research and study and extracts (or indeed, the full report) may be included in professionaljournals provided that suitable acknowledgement is made and the reproduction is not associated with any form of advertising. Applications for commercial reproduction shouldbe addressed to: NIHR Journals Library, National Institute for Health Research, Evaluation, Trials and Studies Coordinating Centre, Alpha House, University of Southampton SciencePark, Southampton SO16 7NS, UK.
xv

Plain English summary
Osteomyelitis is an infection of the bone and is treated with antibiotics. Left untreated, it can causepermanent damage and can lead to amputation.
The best method to diagnose osteomyelitis is to take a bone sample (bone biopsy) but this is invasive andpainful. Imaging may help target the best locations for biopsies or remove the need for a biopsy entirely.Several methods are available, including radiography, ultrasound, magnetic resonance imaging (MRI),single-photon emission computed tomography (SPECT) and positron emission tomography (PET).
This project systematically reviewed the relevant literature to determine which tests are the most accurateand relevant for clinical practice. All types of patients and all types of osteomyelitis were reviewed. Studieswere pooled using statistical methods (meta-analyses) to estimate the overall accuracy of the imaging tests.
The review identified 81 studies and concluded that MRI, PET and SPECT all had similar accuracy, correctlyidentifying over 85% of people who did have osteomyelitis and over 80% of people who did not haveosteomyelitis. Radiography and computed tomography were less accurate. Modern forms of scintigraphyhave accuracy similar to PET or MRI.
There was no evidence that the accuracy of the imaging tests was different depending on the cause ofosteomyelitis or which body part was affected. In particular, diagnostic accuracy in people with diabeticfoot ulcers was similar to other types of osteomyelitis in adults. There was not enough evidence aboutwhich tests are most accurate in children, so further studies in children are needed.
DOI: 10.3310/hta23610 HEALTH TECHNOLOGY ASSESSMENT 2019 VOL. 23 NO. 61
© Queen’s Printer and Controller of HMSO 2019. This work was produced by Llewellyn et al. under the terms of a commissioning contract issued by the Secretary of State forHealth and Social Care. This issue may be freely reproduced for the purposes of private research and study and extracts (or indeed, the full report) may be included in professionaljournals provided that suitable acknowledgement is made and the reproduction is not associated with any form of advertising. Applications for commercial reproduction shouldbe addressed to: NIHR Journals Library, National Institute for Health Research, Evaluation, Trials and Studies Coordinating Centre, Alpha House, University of Southampton SciencePark, Southampton SO16 7NS, UK.
xvii

Scientific summary
Background
Osteomyelitis is an infection of the bone and bone marrow that may result in bone infarction and loss oflimb or joint function and, in extreme cases, may necessitate amputation of the affected limb. In children,osteomyelitis may also inhibit limb growth. Osteomyelitis is common in people with vascular deficiency,such as adults with diabetes mellitus.
Patients usually present with a range of symptoms including swelling, joint pain and fever. These symptomsare often not specific to osteomyelitis, leading to delays in correct diagnosis. Blood tests are used initially toassess inflammatory markers; when these tests show evidence of possible infection, patients are referred forfurther diagnostic testing. The most accurate diagnostic tool is a bone biopsy or aspiration of a pus collectionfrom the bone or tissue surrounding the bone, with a histological and/or microbiological assessment of thesample to identify the organism causing the infection. The primary treatment for osteomyelitis is a course ofantibiotics, but surgery may also be used.
Diagnostic imaging for osteomyelitisA range of diagnostic imaging methods are available, including radiography, magnetic resonance imaging(MRI) scans, computed tomography (CT) scans, scintigraphy, positron emission tomography (PET) scans,single-photon emission computed tomography (SPECT) and ultrasound.
Little formal guidance [such as guidelines produced by the National Institute for Health and Care Excellence(NICE)] exists for which imaging techniques to use to diagnose osteomyelitis. The only current NICEguidance is for the treatment of diabetic foot ulcers. In those patients, radiography is recommended,followed by MRI if osteomyelitis is suspected, but not confirmed, by radiography.
Objectives
The key objectives were to:
l perform a systematic review of all studies reporting the diagnostic accuracy of any relevant imagingtest, or combination of tests used to detect osteomyelitis
l perform diagnostic meta-analyses of identified studies to formally assess their diagnostic accuracyl investigate diagnostic accuracy across the range of different types of osteomyelitis and types of patientl compare the diagnostic accuracy of diagnostic tests both statistically and pragmatically by systematically
reviewing inter-rater reliability and also the broader issues around implementation of imaging tests,such as availability of machinery, radiation exposure and acceptability to patients
l provide useful guidance as to which imaging tests should be preferred, according to type of diseaseand patient, in the UK.
Methods
A systematic review of the clinical effectiveness was performed following the general principlesrecommended in the University of York Centre for Reviews and Dissemination’s (CRD’s) guidance and thePRISMA (Preferred Reporting Items for Systematic Reviews and Meta-Analyses) statement. The protocoldetails have been registered on PROSPERO (number CRD42017068511).
DOI: 10.3310/hta23610 HEALTH TECHNOLOGY ASSESSMENT 2019 VOL. 23 NO. 61
© Queen’s Printer and Controller of HMSO 2019. This work was produced by Llewellyn et al. under the terms of a commissioning contract issued by the Secretary of State forHealth and Social Care. This issue may be freely reproduced for the purposes of private research and study and extracts (or indeed, the full report) may be included in professionaljournals provided that suitable acknowledgement is made and the reproduction is not associated with any form of advertising. Applications for commercial reproduction shouldbe addressed to: NIHR Journals Library, National Institute for Health Research, Evaluation, Trials and Studies Coordinating Centre, Alpha House, University of Southampton SciencePark, Southampton SO16 7NS, UK.
xix

Literature searchesComprehensive searches for published and unpublished literature were carried out during August 2017and updated in July 2018. Databases searched included MEDLINE and EMBASE.
Study selectionTitles and abstracts and the full texts of studies were independently assessed for inclusion by two reviewersusing the inclusion criteria outlined in the following sections.
ParticipantsParticipants included any patients with suspected osteomyelitis (based on symptoms, surgical samples orblood tests). No restrictions were made for age or disease aetiology.
Index testsIndex texts included any diagnostic imaging technique that could potentially identify osteomyelitis,including radiography, MRI, CT, PET, scintigraphy, SPECT and ultrasound.
Reference standardsHistopathology or microbiology based on bone biopsy or pus aspiration, and surgery, were the referencestandards. As biopsies are invasive, clinical follow-up of at least 6 months with no signs or symptoms ofosteomyelitis was also accepted as confirmation of the absence of osteomyelitis.
OutcomesStudies reporting diagnostic accuracy of imaging tests compared with a reference standard expressed interms of sensitivity (percentage with osteomyelitis with a positive diagnostic test result) and specificity(percentage without osteomyelitis with a negative test result) were included.
Studies reporting inter-rater reliability data or other data on test interpretation were included. Generalimplementation outcomes considered were cost-effectiveness (of relevance to the UK), availability of tests,radiation exposure and experience of patients and clinicians.
Study designsAny study that considered an imaging test or tests for osteomyelitis and which reported data on any of thespecified outcomes was included. Only studies explicitly considering testing for osteomyelitis were included.
Data extractionStudy and patient characteristics were extracted by at least one reviewer and checked by a secondreviewer. The numbers of true-positive, true-negative, false-positive and false-negative test results wereextracted where possible.
Inter-rater reliability estimates were extracted from the papers and tabulated. For implementation studies,relevant results (e.g. from surveys of clinicians) were extracted and summarised narratively.
Quality assessmentThe quality of the included diagnostic accuracy studies was assessed using the QUADAS-2 [qualityassessment of diagnostic accuracy studies (version 2)] tool. Critical appraisal was performed by onereviewer and independently checked by another.
SynthesisData were synthesised in meta-analyses across studies using logistic regression modelling. Random-effectsmodels were used to account for potential heterogeneity in diagnostic accuracy across studies. Resultswere presented as summary sensitivity and specificity estimates, with 95% confidence intervals (CIs),and as summary HSROC (hierarchical summary receiver operating characteristic) curves. Analyses wereperformed separately for adults and children.
SCIENTIFIC SUMMARY
NIHR Journals Library www.journalslibrary.nihr.ac.uk
xx

When the studies were deemed too diverse for meta-analysis to be suitable, or where only one or twostudies were available, the reported diagnostic accuracy from each available study was presented in tablesand on ROC (receiver operating characteristic) plots.
Separate meta-analyses were conducted for each diagnostic imaging test and, when sufficient data wereavailable, in subcategories of patients including:
l patients with diabetic foot ulcersl cause of osteomyelitisl anatomical site.
When studies report diagnostic accuracy data for two or more imaging tests, these tests were comparedby extending the bivariate logistic regression models to include all imaging tests in one model.
Inter-rater reliability results and qualitative data on implementation were reported narratively andtabulated. Areas where few or no data have been published were also identified.
Results
Diagnostic accuracyThe review of diagnostic accuracy included 77 studies. The sample size of the studies ranged from 7 to 339,but most (80%) included fewer than 50 participants. Nearly one-quarter of the studies were considered asbeing at a high risk of bias, although poor reporting meant that there was significant uncertainty about thequality of most studies. Most of the evidence focused on the diagnostic accuracy of MRI, scintigraphy andradiography for the diagnosis of diabetic foot osteomyelitis. Few studies specifically focused on the axialskeleton, the pelvis/hip/knee and long bones.
The overall meta-analysis of diagnostic accuracy in adults found that MRI can detect osteomyelitis with highaccuracy (95.6% sensitivity, 95% CI 92.4% to 97.5%; 80.7% specificity, 95% CI 70.8% to 87.8%). PETalso had high diagnostic accuracy (85.1% sensitivity, 95% CI 71.5% to 92.9%; 92.8% specificity, 95% CI83.0% to 97.1%), as did SPECT (95.1% sensitivity, 95% CI 87.8% to 98.1%; 82.0% specificity, 95% CI61.5% to 92.8%). There were similar diagnostic odds ratios and summary HSROC curves for MRI, PET andSPECT, suggesting that the three imaging tests have similar diagnostic performance.
Scintigraphy (83.6% sensitivity, 95% CI 71.8% to 91.1%; 70.6% specificity, 95% CI 57.7% to 80.8%),CT (69.7% sensitivity, 95% CI 40.1% to 88.7%; 90.2% specificity, 95% CI 57.6 to 98.4) and radiography(70.4% sensitivity, 95% CI 61.6% to 77.8%; 81.5% specificity, 95% CI 69.6% to 89.5%) all had generallyinferior diagnostic accuracy when compared with MRI, PET or SPECT. The most up-to-date forms ofscintigraphy, such as 99mTc HMPAO WBC (technetium-99m hexamethylpropyleneamine oxime white bloodcell) scintigraphy (87.3% sensitivity, 95% CI 75.1% to 94.0%; 94.7% specificity 95% CI 84.9% to 98.3%),had high diagnostic accuracy, similar to that of PET or MRI. There were insufficient studies of ultrasound toassess its diagnostic accuracy.
Key participant subgroupsThe main patient subgroup was patients with diabetic foot ulcers, representing nearly half of all studies.The results of the meta-analyses for these patients were similar to those from the main meta-analysis,although there were too few studies of SPECT or CT to reliably assess diagnostic accuracy.
Studies of patients without diabetes were divided according to scan location and by potential cause ofosteomyelitis. Data within each category were generally limited, but there was no evidence that diagnosticaccuracy varied by scan location or cause, or that results differed substantially from the main analysis.
DOI: 10.3310/hta23610 HEALTH TECHNOLOGY ASSESSMENT 2019 VOL. 23 NO. 61
© Queen’s Printer and Controller of HMSO 2019. This work was produced by Llewellyn et al. under the terms of a commissioning contract issued by the Secretary of State forHealth and Social Care. This issue may be freely reproduced for the purposes of private research and study and extracts (or indeed, the full report) may be included in professionaljournals provided that suitable acknowledgement is made and the reproduction is not associated with any form of advertising. Applications for commercial reproduction shouldbe addressed to: NIHR Journals Library, National Institute for Health Research, Evaluation, Trials and Studies Coordinating Centre, Alpha House, University of Southampton SciencePark, Southampton SO16 7NS, UK.
xxi

Diagnostic tests in childrenThe evidence for the accuracy of ultrasound and MRI in children was mixed and limited overall. Ultrasonographyhad moderate sensitivity and specificity in children with suspected acute haematogenous osteomyelitis but hadperfect sensitivity and specificity in a small study of children with negative or equivocal initial radiographicfindings. MRI had good sensitivity and specificity in children with suspected acute haematogenousosteomyelitis in one study, but preoperative MRI had poor sensitivity and near perfect specificity in anotherstudy of patients with septic hip.
Inter-rater reliability and implementationEleven studies evaluated the inter-rater reliability of at least one imaging test, and one study provided dataon clinician opinions on imaging tests for osteomyelitis.
Magnetic resonance imaging appeared to have acceptable inter-rater reliability. There was some evidencesuggesting that PET and scintigraphy showed near perfect inter-rater reliability, although this is limited totwo small studies. We found no evidence on patient preferences and cost-effectiveness of imaging testsfor osteomyelitis.
Only one study on the implementation of diagnostic test imaging for osteomyelitis was included. A Dutchsurvey of clinicians found that preferred imaging strategies for diagnosing post-traumatic osteomyelitisdepended on specialty and availability of machinery. Most responders were not aware of local hospitalprotocols for diagnosing osteomyelitis.
Discussion
Strengths and limitations of the analysesThis systematic review was the largest and most comprehensive review of the diagnosis of osteomyelitis todate, and the first to comprehensively compare all relevant imaging tests across all types of patient.
There were few studies identified that included children. This may be because studies of children do notdiscuss osteomyelitis directly, but instead mostly in the context of other conditions, such as septic arthritis.Hence, it is possible that some possibly relevant studies were missed.
Some imaging tests were reported, particularly ultrasound and CT scans. Some aspects of studies wereinconsistently reported, such as varying descriptions of the cause of osteomyelitis, non-reporting ofwhether osteomyelitis was acute or chronic and lack of clarity on whether or not radiography (or othertests) had been used prior to the main test. This made assessment in these subgroups difficult.
We identified very few data beyond those on diagnostic accuracy, with few studies discussing broaderimplementation issues such as access to machinery, costs or radiation exposure.
UncertaintiesThe main uncertainties remaining following this review arise largely because of limitations in the identifiedstudies.
The diagnostic accuracy of imaging tests in children remains highly uncertain because of the very limitednature of the evidence. We could reach no firm conclusions on the diagnostic accuracy of any imaging testin children.
The diagnostic accuracy of ultrasound is currently unknown as the only two studies in adults had conflictingresults.
SCIENTIFIC SUMMARY
NIHR Journals Library www.journalslibrary.nihr.ac.uk
xxii

Although we found no evidence that diagnostic accuracy varied across subgroups of patients, limited orinconsistent reporting of some characteristics, such as acute versus chronic osteomyelitis, or the cause ofosteomyelitis, means than differences between tests or between subgroups cannot be ruled out.
Generalisability of the findingsThe apparent consistency of diagnostic accuracy across the various types of patient and causes ofosteomyelitis suggests that the diagnostic accuracy findings are likely to be generalisable to any populationbeing tested for osteomyelitis. The similarity in diagnostic accuracy across MRI, PET and SPECT scanssuggests that these tests should have similar accuracy in most clinical circumstances.
The review found considerable variation in the specificity of MRI across studies. This may mean that theobserved specificity of MRI in any given setting may differ from the summary estimates calculated in thisreview, depending on how MRI is implemented.
The limited evidence on diagnosis of osteomyelitis in children means that results may not be generalisablebeyond the populations in the included studies.
Conclusions
Implications for service provisionMagnetic resonance imaging, PET and SPECT all have broadly similar and high accuracy when diagnosingosteomyelitis. All are likely to be suitable imaging tests for diagnosing osteomyelitis. No clear reason toprefer one test over the others in terms of diagnostic accuracy was identified. The wider availability of MRImachines, and the fact that MRI does not expose patients to harmful ionising radiation, may mean thatMRI is preferable in most cases, unless it is unsuitable for a particular patient. A PET or SPECT scan may berequired if a MRI scan is inconclusive.
Positron emission tomography had poorer sensitivity but higher specificity than MRI, with more consistentresults across studies. This may make PET better suited to situations where avoiding false-positive diagnosesis important, for example when the test would be followed by surgery or other invasive procedures.
There is no evidence to suggest that the diagnostic accuracy varies with the potential cause of osteomyelitisor with the body part scanned, although data on patients other than those with diabetic foot ulcers werelimited. The review identified very limited data on diagnosing osteomyelitis in children, so considerableuncertainty remains over the diagnostic accuracy of imaging tests in children. Clinicians should be awareof this limitation in the evidence base.
Suggested research prioritiesThe most urgent research priority is to perform diagnostic accuracy studies of imaging tests in children.Large diagnostic accuracy studies are needed, which must be of high quality, with proper blinding of testassessors and consecutive recruitment of patients. The priority tests should be MRI and ultrasound, ideallycomparing the two tests in the same children.
Ultrasound has not been widely assessed in adults. Current results suggest that ultrasound on its own maynot be sufficiently accurate to diagnose osteomyelitis, but further accuracy studies are needed to resolvethe uncertainty. It may be more appropriate to investigate the diagnostic accuracy of ultrasound as aprecursor to MRI or other tests (e.g. as a replacement for radiography).
Given the similarities in diagnostic accuracy of MRI, PET and SPECT, suitable investigation of patient andclinician experience and opinion of these tests, through surveys or focus groups, would be useful toidentify practical reasons for the choice of test. Similarly, a formal economic evaluation of these tests,accounting for test cost, availability and risk of radiation exposure, would help to clarify the choicebetween these tests.
DOI: 10.3310/hta23610 HEALTH TECHNOLOGY ASSESSMENT 2019 VOL. 23 NO. 61
© Queen’s Printer and Controller of HMSO 2019. This work was produced by Llewellyn et al. under the terms of a commissioning contract issued by the Secretary of State forHealth and Social Care. This issue may be freely reproduced for the purposes of private research and study and extracts (or indeed, the full report) may be included in professionaljournals provided that suitable acknowledgement is made and the reproduction is not associated with any form of advertising. Applications for commercial reproduction shouldbe addressed to: NIHR Journals Library, National Institute for Health Research, Evaluation, Trials and Studies Coordinating Centre, Alpha House, University of Southampton SciencePark, Southampton SO16 7NS, UK.
xxiii

Study registration
This study is registered as PROSPERO CRD42017068511.
Funding
Funding for this study was provided by the Health Technology Assessment programme of the NationalInstitute for Health Research.
SCIENTIFIC SUMMARY
NIHR Journals Library www.journalslibrary.nihr.ac.uk
xxiv

Chapter 1 Background
Osteomyelitis
Osteomyelitis is an infection of the bone and bone marrow.1,2 Left untreated, it may result in bone infarctionand loss of limb or joint function and, in extreme cases may require amputation of the affected limb. If theinfection spreads, it may lead to potentially fatal septicaemia.3 In children, osteomyelitis may also inhibit limbgrowth, requiring extensive orthopaedic intervention in later childhood. Staphylococcus aureus is the mostcommon organism causing osteomyelitis, but other common organisms such as Streptococcus spp. orEscherichia coli may also be responsible in some cases. Bone infections occur most commonly in people aged< 20 years or > 50 years. It accounts for around 1% of all childhood hospital admissions. The incidence ofosteomyelitis has increased over recent decades, notably in children and in patients > 60 years of age.This growing incidence has been associated with increased prevalence of meticillin-resistant S. aureus(MRSA) in children and an increase in diabetes mellitus-related infections in adults.4
Osteomyelitis may be acute, subacute or chronic and is divided between haematogenous osteomyelitis,in which infection transfers from a remote location in the body via the bloodstream, and contiguousosteomyelitis, in which infected material comes into direct contact with the bone.5 The haematogenoustype is more common in children whereas the contiguous type is more common in adults, usually as aresult of trauma or surgery.6 Osteomyelitis is also common in people with vascular deficiency, such asadults with diabetes, as a complication of diabetic foot ulcers.7 Osteomyelitis may lead to infection of theadjacent joint (septic arthritis) or occur secondary to septic arthritis by contiguous spread.
Patients usually present with a range of symptoms including swelling, joint pain and fever. These symptomsare often not specific to osteomyelitis, leading to delays in correct diagnosis. Blood tests are used initially toassess inflammatory markers indicative of infection in the body, including white blood cell (WBC) count,C-reactive protein (CRP) levels and erythrocyte sedimentation rate (ESR).8 When these tests show evidenceof possible infection, patients are referred for further diagnostic testing. The most accurate diagnostic toolis a bone biopsy or aspiration of a pus collection from the bone or tissue surrounding the bone, with amicrobiological assessment of the sample to identify the organism causing the infection. Biopsies are invasiveand generally require a local or a general anaesthetic. The analysis of the results may take several days.Alternative diagnostic tools include blood or tissue cultures, which may be less accurate but are useful inidentifying the organism causing an infection in the body, which enables the selection of the appropriateantibiotic for treatment. The primary treatment for osteomyelitis is a course of antibiotics, but surgery mayalso be used.9
Diagnostic imaging for osteomyelitis
Diagnostic imaging of the affected area before performing a biopsy may help improve diagnosis and avoidunnecessary biopsies in people who may have an infection but are unlikely to have osteomyelitis. It canalso be useful to identify pus collections, assess the need for drainage procedures and establish the bestway for surgical access.
A range of diagnostic imaging methods are available, including radiography, magnetic resonance imaging(MRI), computed tomography (CT), scintigraphy, positron emission tomography (PET), single-photonemission computed tomography (SPECT) and ultrasound.9–12 These imaging methods each have theiradvantages and disadvantages.
DOI: 10.3310/hta23610 HEALTH TECHNOLOGY ASSESSMENT 2019 VOL. 23 NO. 61
© Queen’s Printer and Controller of HMSO 2019. This work was produced by Llewellyn et al. under the terms of a commissioning contract issued by the Secretary of State forHealth and Social Care. This issue may be freely reproduced for the purposes of private research and study and extracts (or indeed, the full report) may be included in professionaljournals provided that suitable acknowledgement is made and the reproduction is not associated with any form of advertising. Applications for commercial reproduction shouldbe addressed to: NIHR Journals Library, National Institute for Health Research, Evaluation, Trials and Studies Coordinating Centre, Alpha House, University of Southampton SciencePark, Southampton SO16 7NS, UK.
1

Radiography are easily available and cheap to perform, but are poor at detecting osteomyelitis in itsearly stages. Radiography may be most useful in identifying and ruling out other causes of the patient’ssymptoms, such as bone fractures.11 MRI is probably the most widely recommended and used technique.It is more accurate than radiography and able to detect osteomyelitis in its early stages, but is moreexpensive to perform12 and when used in children necessitates the use of sedation or general anaesthesia.PET and bone scintigraphy are more expensive and less widely available than MRI or radiography.11,13 Thesemethods expose patients to ionising radiation. Ultrasound avoids the radiation exposure and is readilyavailable, but its diagnostic accuracy is currently uncertain.12 There is also a distinction between methodsthat provide two-dimensional images (radiography, scintigraphy) and those producing three-dimensionalimages (PET, MRI, CT, SPECT). Some tests (e.g. MRI) may be less suited to patients with hip replacementsor other indwelling metalwork because the metalwork can alter the reliability of the imaging.
Current diagnostic and treatment practice
Once osteomyelitis is suspected on the basis of physical examination and blood tests, MRI is currentlygenerally recommended as the imaging test of choice because it can detect osteomyelitis early and it canidentify pus collections within bone that might require surgical drainage. Radiography is not usuallyrecommended in isolation, because of their failure to detect early osteomyelitis, but are generally usedas a first-line investigation to rule out or confirm bone fractures or other causes of symptoms.12 CT,scintigraphy and PET are less widely recommended, but are an alternative for patients in whom MRI isnot possible.
Ultrasonography is suggested as an alternative to radiological tests7,9,11,12,14 and is widely used in paediatricpractice to exclude joint effusions and pus collection next to bone.14 This is especially helpful in youngchildren (aged < 6 years), who would require a general anaesthetic for MRI. Ultrasound is also used toguide aspiration and biopsy.
Little formal guidance [such as guidelines produced by the National Institute for Health and Care Excellence(NICE)] exists about which imaging techniques to use to diagnose osteomyelitis. The only current NICEguidance is for the treatment of diabetic foot ulcers.1 In those patients, radiography is recommended to eitherconfirm advanced osteomyelitis or confirm that the symptoms are due to other causes (e.g. broken bones).Radiography is followed by MRI if osteomyelitis is suspected but not confirmed by radiography. In children,ultrasonography is sometimes used in place of MRI. Antigranulocyte Fab fragment antibody scintigraphyshould not be used in patients with diabetic foot ulcers.15 Recommendations about its use have also beenpublished in the USA.16,17
Osteomyelitis is treated with a 4- to 6-week course of antibiotics.18,19 Treatment is initially intravenous,switching to oral antibiotics after around 2 weeks. The choice of antibiotics will depend on the infectingorganism, as determined by tests such as microbiological culture and the patient’s medical history. Surgerymay also be used for debridement of necrotic tissue and affected bone, to drain pus and to reducebacterial load.
Pathway to diagnosis in the NHS
There are a number of ways in which a patient might be referred for imaging to diagnose osteomyelitis.Patients may present with fever and be admitted as inpatients, or may be referred directly by their generalpractitioner (GP) to an orthopaedic clinic. This pathway to clinic is slower than presenting directly toaccident and emergency and such patients often have less virulent infection or subacute osteomyelitis.Patients may be referred from other hospitals, particularly those that lack the facilities to treat children(e.g. if the hospital does not offer MRI under general anaesthesia). Patients presenting with acutesymptoms may have a musculoskeletal issue (often limping or joint pains) or non-specific systemic
BACKGROUND
NIHR Journals Library www.journalslibrary.nihr.ac.uk
2

symptoms and sepsis (e.g. immunodeficient patients as a result of underlying chronic condition). Generallyunwell patients with sepsis are more difficult to diagnose because they might be in intensive care and jointsymptoms could initially be missed while the focus is on treating severe symptoms.
The range of symptoms and possible causes of these symptoms mean that osteomyelitis may not besuspected at first. Patients may undergo one or more radiographic assessments (and ultrasound scans inchildren) and repeated blood tests prior to final diagnosis. Patients may also have received a course ofantibiotics before diagnosis, with osteomyelitis suspected only because that treatment course was notsuccessful. This complicates the diagnostic process, and the practical pathway to most diagnoses ofosteomyelitis in many patients will differ from that used in formal diagnostic accuracy studies.
Existing review evidence
Several systematic reviews or meta-analyses have been performed to assess diagnostic imaging techniquesfor osteomyelitis.20–30
Four of these reviews considered primarily, or only, people with diabetic foot ulcers.20,22,23,26 Their conclusionsvaried, depending on the tests included, but MRI, PET and WBC scintigraphy were all suggested as suitableimaging tests. Three reviews of osteomyelitis in the general population mostly recommended PET and SPECTas having the best diagnostic accuracy.25,27,28 One review focused on patients with peripheral post-traumaticosteomyelitis and concluded that WBC scintigraphy with SPECT/CT or 18F-FDG (fludeoxyglucose)-PET/CT hadthe best diagnostic accuracy in this population.21 Another review of MRI in patients with pressure ulcers wasinconclusive as a result of insufficient evidence.29 Two reviews were conducted in children. One focused oncalcaneal osteomyelitis and was inconclusive because of the limited evidence.24 The other children’s reviewfocused on haematogenous acute and subacute paediatric osteomyelitis, and found that MRI had thehighest sensitivity and specificity compared with radiography, scintigraphy, CT and ultrasound.30
DOI: 10.3310/hta23610 HEALTH TECHNOLOGY ASSESSMENT 2019 VOL. 23 NO. 61
© Queen’s Printer and Controller of HMSO 2019. This work was produced by Llewellyn et al. under the terms of a commissioning contract issued by the Secretary of State forHealth and Social Care. This issue may be freely reproduced for the purposes of private research and study and extracts (or indeed, the full report) may be included in professionaljournals provided that suitable acknowledgement is made and the reproduction is not associated with any form of advertising. Applications for commercial reproduction shouldbe addressed to: NIHR Journals Library, National Institute for Health Research, Evaluation, Trials and Studies Coordinating Centre, Alpha House, University of Southampton SciencePark, Southampton SO16 7NS, UK.
3


Chapter 2 Aims and objectives
The overall aim of this project was to systematically review the literature on diagnostic imaging forosteomyelitis in order to identify the techniques with the best diagnostic accuracy and the greatest
clinical utility, across the range of types of disease and patients. The key objectives were to:
l perform a systematic review of all studies reporting the diagnostic accuracy of any relevant imagingtest, or combination of tests, used to detect osteomyelitis
l perform diagnostic meta-analyses of identified studies to formally assess their diagnostic accuracyl investigate diagnostic accuracy across the range of different types of osteomyelitis and types of patientl compare the diagnostic accuracy of diagnostic tests both statistically and pragmatically, by
systematically reviewing inter-rater reliability, and the broader implementation of imaging tests,accounting for key factors such as availability of machinery, radiation exposure and acceptabilityto patients
l provide useful guidance as to which imaging tests should be preferred, according to type of diseaseand patient, in the UK.
DOI: 10.3310/hta23610 HEALTH TECHNOLOGY ASSESSMENT 2019 VOL. 23 NO. 61
© Queen’s Printer and Controller of HMSO 2019. This work was produced by Llewellyn et al. under the terms of a commissioning contract issued by the Secretary of State forHealth and Social Care. This issue may be freely reproduced for the purposes of private research and study and extracts (or indeed, the full report) may be included in professionaljournals provided that suitable acknowledgement is made and the reproduction is not associated with any form of advertising. Applications for commercial reproduction shouldbe addressed to: NIHR Journals Library, National Institute for Health Research, Evaluation, Trials and Studies Coordinating Centre, Alpha House, University of Southampton SciencePark, Southampton SO16 7NS, UK.
5

Chapter 3 Methods
A systematic review of the clinical effectiveness was performed following the general principlesrecommended in the Centre for Reviews and Dissemination’s (CRD’s) guidance and the Preferred
Reporting Items for Systematic Reviews and Meta-Analyses (PRISMA) statement. The protocol details havebeen registered on PROSPERO (number CRD42017068511).
Literature searches
The search strategy was developed by an information specialist with input from the review team andclinical advisors. The strategy was developed in MEDLINE (via Ovid) and included search terms forosteomyelitis and relevant diagnostic imaging techniques. No language, date, geographical or studydesign limits were applied. The MEDLINE strategy was adapted for use in the other resources searched.
The searches were carried out during August 2017 and updated in July 2018 to capture more recentstudies. The following databases were searched: MEDLINE (including Epub Ahead of Print, In-Process &Other Non-Indexed Citations, Ovid MEDLINE Daily and Ovid MEDLINE), Cochrane Central Register ofControlled Trials (CENTRAL), Cochrane Database of Systematic Reviews (CDSR), Cumulative Index toNursing and Allied Health (CINAHL) Plus, Database of Abstracts of Reviews of Effects (DARE), EMBASE,Health Technology Assessment (HTA) database and PubMed.
In addition, ClinicalTrials.gov and PROSPERO were searched for ongoing and unpublished studies. Relevantguidelines were identified through searches of the National Guidelines Clearing House, NHS Evidence, theNICE website and the Trip database. The reference lists of relevant systematic reviews were manuallychecked to ensure that all relevant studies from previous reviews were identified.
The search results were imported into EndNote X8 [Clarivate Analytics (formerly Thomson Reuters),Philadelphia, PA, USA] and de-duplicated. The complete search strategies can be found in Appendix 1.
Study selection
Titles and abstracts and the full texts of studies were independently assessed for inclusion by two reviewersusing the inclusion criteria outlined in this section. Disagreements were resolved through discussion and,where necessary, consultation with a third reviewer. Study selection was performed using EPPI-Reviewer4 software (Evidence for Policy and Practice Information and Co-ordinating Centre, University of London,London, UK).
ParticipantsParticipants were any patients with suspected osteomyelitis (based on symptoms, surgical samples or bloodtests). No restrictions were made for age or disease aetiology.
Index testsIndex tests considered included any diagnostic imaging technique that could potentially identifyosteomyelitis, either alone or in combination with other relevant tests, such as radiography, MRI, CT, PET,SPECT and ultrasound. Variations on these tests were included, such as variations in the radioisotopes usedand differences in protocols or contrast agent use.
Scintigraphy was not a protocol-specified imaging test for this review as it was not expected to be widelyused in the UK, particularly because three-dimensional (3D) SPECT imaging may be preferred to planarscintigraphy. However, as the protocol specified that any relevant imaging test would be considered,
DOI: 10.3310/hta23610 HEALTH TECHNOLOGY ASSESSMENT 2019 VOL. 23 NO. 61
© Queen’s Printer and Controller of HMSO 2019. This work was produced by Llewellyn et al. under the terms of a commissioning contract issued by the Secretary of State forHealth and Social Care. This issue may be freely reproduced for the purposes of private research and study and extracts (or indeed, the full report) may be included in professionaljournals provided that suitable acknowledgement is made and the reproduction is not associated with any form of advertising. Applications for commercial reproduction shouldbe addressed to: NIHR Journals Library, National Institute for Health Research, Evaluation, Trials and Studies Coordinating Centre, Alpha House, University of Southampton SciencePark, Southampton SO16 7NS, UK.
7

and many studies of scintigraphy were identified, scintigraphy was included in this review. To focus onthe more UK-relevant tests in the main analysis, data on scintigraphy were included only where theywere included in a study of another relevant imaging test. Studies evaluating the diagnostic accuracyof scintigraphy alone were considered in a separate analysis.
Reference standardsThe preferred reference standard was histopathology or microbiology based on bone biopsy. Surgery was alsoaccepted as a reference standard; other accepted methods of sample collection included pus aspiration.
As biopsies are invasive, clinical follow-up of at least 6 months with no signs or symptoms of osteomyelitiswas also accepted as confirmation of the absence of osteomyelitis. Similarly, clinical evidence that thesymptoms had another cause was accepted as confirmation of the absence of osteomyelitis.
To avoid potential bias through overestimation of diagnostic accuracy, studies were excluded if a positiveosteomyelitis diagnosis was made by using a second imaging test, or by clinical follow-up alone, withoutbiopsy or other microbiological testing.
Outcomes
Diagnostic accuracy reviewThe primary outcome was the diagnostic accuracy of the imaging test compared with the referencestandard expressed in terms of sensitivity (percentage of people/scans with osteomyelitis with a positivediagnostic test result) and specificity (percentage of people/scans without osteomyelitis with a negativetest result). Studies reporting sensitivity and specificity, or sufficient data to calculate both measures,were included. Studies evaluating other related conditions, such as spondylodiscitis or septic arthritis,were included if they provided separate diagnostic accuracy data for osteomyelitis.
Inter-rater reliability and implementation of imaging testsStudies reporting inter-rater reliability for any test, or any other measure of accuracy of test interpretation,were included. Studies reporting information on the broader implementation and acceptability of imagingtests for osteomyelitis were included. The following implementation outcomes were eligible for inclusion:cost-effectiveness of imaging tests (of relevance to the UK), availability of tests (e.g. access to machinery),radiation exposure and substantive data on the experience of patients or clinicians.
Study designsAny study that considered an imaging test or tests for osteomyelitis that reported data on any of thespecified outcomes was included. Therefore, studies reporting any diagnostic accuracy data, otherquantitative data (e.g. inter-rater reliability) or substantive qualitative or semiqualitative data (e.g. surveysof patients and clinicians) were included. Only studies explicitly considering testing for osteomyelitis wereincluded. Studies reporting on characteristics of the imaging tests more broadly were excluded.
The following types of reports were excluded: editorials and opinions, case reports, reports focusing onlyon technical aspects of imaging tests (e.g. technical descriptions or specifications of machinery). Weselected the most complete or most recent report in cases of multiple reports for a given study or whenwe could not exclude the possibility of overlapping populations.
Data extraction
A mapping exercise informed the development of the data extraction form, which was then piloted ona small selection of studies by two reviewers. Data extracted included details of patient characteristics,diagnostic tests and reference standard tests. Data were extracted by one reviewer and independentlychecked for accuracy by at least one other reviewer. Discrepancies were resolved by discussion, with
METHODS
NIHR Journals Library www.journalslibrary.nihr.ac.uk
8

involvement of a third reviewer when necessary. Given the high number of studies, authors were notcontacted if relevant data appeared to be unreported. In cases of multiple reports for a given study, themost recent or most complete report was used as the main source of data.
Study characteristics were extracted, including design, year, country and patient eligibility criteria. Patientcharacteristics that were extracted included age, comorbidities, diabetic status, location of osteomyelitisand reason for referral. Data on study intervention (e.g. characteristics of imaging test used, radioisotope,contrast agent, diagnostic cut-off point and thresholds), unit of analysis (e.g. patient, body part) and dataon exclusions from study/analysis with reasons were recorded. Types of reference standards used forconfirming positive and negative cases were recorded. The numbers of patients confirmed to be positiveor negative in accordance with the reference standard, and the numbers of true-positive, true-negative,false-positive and false-negative test results, were extracted, if reported. If not reported, sensitivity andspecificity estimates [with their 95% confidence intervals (CIs)] or other reported diagnostic accuracy datawere extracted. Where possible, sensitivity, specificity, positive predictive values (PPVs) and negativepredictive values (NPVs) were calculated and checked against reported values in the publications to checkfor any discrepancies. When more than one test was performed for the same participant in the same bodypart (i.e. repeat test, or follow-up test), only the result of the first test was used.
Inter-rater reliability estimates were extracted from the papers and tabulated. For the implementationreview, relevant results on cost-effectiveness or use of machinery or data from surveys of clinicians wereextracted and summarised narratively.
Quality assessment
The quality of the included diagnostic accuracy studies was assessed using the QUADAS-2 [qualityassessment of diagnostic accuracy studies (version 2)] tool designed for diagnostic accuracy studies.31
Critical appraisal was performed by one reviewer alongside data extraction and independently checkedby at least one other reviewer. The QUADAS-2 tool was adapted to ensure that it is applicable to assessingthe quality of studies of imaging tests for detecting osteomyelitis. The tool consists of four key domains:(1) patient selection, (2) index test, (3) reference standard and (4) flow of patients through the study andtiming of the index test(s) and reference standard. Each domain was assessed in terms of the risk of bias.The first three domains were also assessed for concerns regarding their applicability, that is, whether or notthe participants and setting, the index test, its conduct or interpretation and the target condition (as definedby the reference standard) were applicable to the review question. Further details on the critical appraisaltool, including signalling questions to inform the assessment of the key domains, are reported in Appendix 2.
No validated instrument is available for appraising the quality of studies on inter-rater reliability. We used amodified version of the tool reported by van de Pol et al.32
Synthesis
Diagnostic meta-analysisFor each diagnostic imaging test, data were synthesised in meta-analyses across studies using logisticregression modelling. This approach fits a statistical model that regresses index test outcome (positive ornegative for osteomyelitis) against whether each person does or does not have confirmed osteomyelitis,based on the reference standard. This has been shown33 to be equivalent to both bivariate meta-analysisand hierarchical summary receiver operating characteristic (HSROC) analysis, which are the methods mostcommonly used in diagnostic meta-analyses.34,35 It also accounts for correlation between sensitivity andspecificity, and for the fact that these may vary if different test thresholds are used across studies. Thisproposed model is known as a ‘one-stage’ approach because it analyses summary diagnostic accuracyacross all studies simultaneously. It provides a more flexible approach than conventional bivariate or
DOI: 10.3310/hta23610 HEALTH TECHNOLOGY ASSESSMENT 2019 VOL. 23 NO. 61
© Queen’s Printer and Controller of HMSO 2019. This work was produced by Llewellyn et al. under the terms of a commissioning contract issued by the Secretary of State forHealth and Social Care. This issue may be freely reproduced for the purposes of private research and study and extracts (or indeed, the full report) may be included in professionaljournals provided that suitable acknowledgement is made and the reproduction is not associated with any form of advertising. Applications for commercial reproduction shouldbe addressed to: NIHR Journals Library, National Institute for Health Research, Evaluation, Trials and Studies Coordinating Centre, Alpha House, University of Southampton SciencePark, Southampton SO16 7NS, UK.
9

HSROC analysis; in particular, it permits the inclusion of extra terms in the model to identify subgroups ofstudies or participants, and to compare different imaging tests.
Studies were pooled if three or more studies were eligible for the analysis. Random-effects models wereused to account for potential heterogeneity in diagnostic accuracy across studies. Results were presentedas summary sensitivity and specificity estimates, with 95% CIs, plotted in receiver operating characteristic(ROC) space, and as summary HSROC curves.
When studies reported diagnostic accuracy for multiple tests, data for each test were included in theanalysis. When studies reported multiple results for the same imaging test (e.g. at different test thresholds,or diagnosis by different clinicians) then only the data corresponding to the greatest diagnostic accuracy[i.e. having the highest diagnostic odds ratio (DOR)] were included.
The PPVs and NPVs were also analysed using the same bivariate logistic regression approach. It should benoted that PPV and NPV depend on the incidence of osteomyelitis in each study, and so may be moreheterogeneous than sensitivity and specificity.
In addition to the bivariate analyses, meta-analyses of estimated DOR and positive rates (PRs) (theproportion of people whose imaging test result suggests osteomyelitis, and so who would be diagnosedwith osteomyelitis on the basis of the imaging test) were also performed. Univariate meta-analyses(ignoring correlation between outcomes) of sensitivity, specificity, PPV and NPV were also performed, forcomparison with the bivariate analyses. In all these meta-analyses, heterogeneity was assessed using I2.36
When the studies were deemed too diverse for meta-analysis to be suitable, or when only one or twostudies were available, the reported diagnostic accuracy from each available study was presented in tablesand on ROC plots, and compared across studies, tests and subgroups. Studies that did not report fulldiagnostic accuracy data, but only summary sensitivity and specificity, were summarised in narrative formby tabulating the results.
Subgroup analysesSeparate meta-analyses were conducted for each diagnostic imaging test and, where sufficient data wereavailable, according to the following subcategories of patients:
l children and adults (as defined by the studies)l cause of osteomyelitis (haematogenous, contiguous, trauma, surgical, diabetes related, other)l acute, subacute or chronic osteomyelitis (COM)l anatomical site (long bone, spinal, foot and ankle, pelvis, other)l patients with hip replacements or other indwelling metalwork.
Subgroup analyses were also performed to assess the impact of different study characteristics:
l subtypes of imaging test (e.g. owing to the use of different radioisotopes, inclusion or exclusion of CTscanning, different thresholds, or methods of image interpretation)
l choice of reference standard (biopsy, or clinical and surgical follow-up)l study quality (based on QUADAS-2 criteria).
As having diabetic foot ulcers is one of the most common causes of osteomyelitis, we performedmeta-analyses specifically of studies of people with diabetic foot ulcers.
Analyses were performed separately for adults and children.
Analyses within subgroups were performed using the logistic regression analysis approach discussed inDiagnostic meta-analysis. Separate analyses were performed for each subgroup.
METHODS
NIHR Journals Library www.journalslibrary.nihr.ac.uk
10

Comparison of imaging testsDiagnostic tests were compared by examining summary DORs derived from the logistic regression modelsand by comparing summary ROC curves. In general, a larger DOR indicates a better performance, but thismay not be the case if ROC curves cross, in which case the trade-off between sensitivity and specificity wasconsidered. When there were sufficient data, these comparisons were made in each of the subgroupslisted in Subgroup analyses.
When studies reported diagnostic accuracy data for two or more imaging tests on the same patientpopulation, these tests were compared within the study by comparing sensitivity, specificity and DORestimates. The main bivariate logistic regression models were extended to include all imaging tests in onemodel, to allow tests to be formally compared for differences in DOR and specificity.
Inter-rater reliability and implementation reviewOwing to heterogeneity, studies evaluating inter-rater reliability results were reported narratively andtabulated. For studies reporting qualitative data on the implementation of diagnostic tests (e.g. clinical orpatient opinions), data were synthesised using a narrative synthesis approach. Areas where few or no datahave been published were also identified.
Deviations from the protocolSome changes in the review and analysis process were made as a consequence of the nature of theidentified studies.
Scintigraphy was not a protocol-specified imaging test, but many of the included studies comparedscintigraphy with another test. Scintigraphy was therefore included in the main review and meta-analyseswhere studies compared it with another eligible test. To ensure a fair analysis of scintigraphy, a separatemeta-analysis of scintigraphy alone was performed. In that analysis, we also included studies reporting thediagnostic accuracy of scintigraphy alone that included > 20 participants and that had been publishedsince 1990. These additional studies were not assessed for quality using QUADAS-2 and only basicdiagnostic accuracy data were extracted from publications.
For several proposed subgroup analyses, either we identified no relevant studies or studies did not reportsufficient data for synthesis, so no analyses were performed. The subgroups were patients with:
l acute symptoms (such as would be admitted as inpatients)l sepsisl milder or chronic symptoms (such as would be referred by a GP)l concomitant diseases (e.g. cancer).
The number of studies of children and of ultrasound were too few to permit a meta-analysis, so thesestudies were combined in a narrative synthesis only.
Role of patient and clinical advisors
Clinical advisors for this project attended meetings (in person or remotely) over the course of the project toensure that it met clinical needs. This included approving the protocol, discussing and commenting on theprovisional results and meta-analyses, and commenting on this report.
Two patient representatives, both parents of children who had been treated for osteomyelitis, werecontacted through telephone meetings over the course of the project to discuss their experience ofimaging tests and to discuss the findings of the project.
DOI: 10.3310/hta23610 HEALTH TECHNOLOGY ASSESSMENT 2019 VOL. 23 NO. 61
© Queen’s Printer and Controller of HMSO 2019. This work was produced by Llewellyn et al. under the terms of a commissioning contract issued by the Secretary of State forHealth and Social Care. This issue may be freely reproduced for the purposes of private research and study and extracts (or indeed, the full report) may be included in professionaljournals provided that suitable acknowledgement is made and the reproduction is not associated with any form of advertising. Applications for commercial reproduction shouldbe addressed to: NIHR Journals Library, National Institute for Health Research, Evaluation, Trials and Studies Coordinating Centre, Alpha House, University of Southampton SciencePark, Southampton SO16 7NS, UK.
11

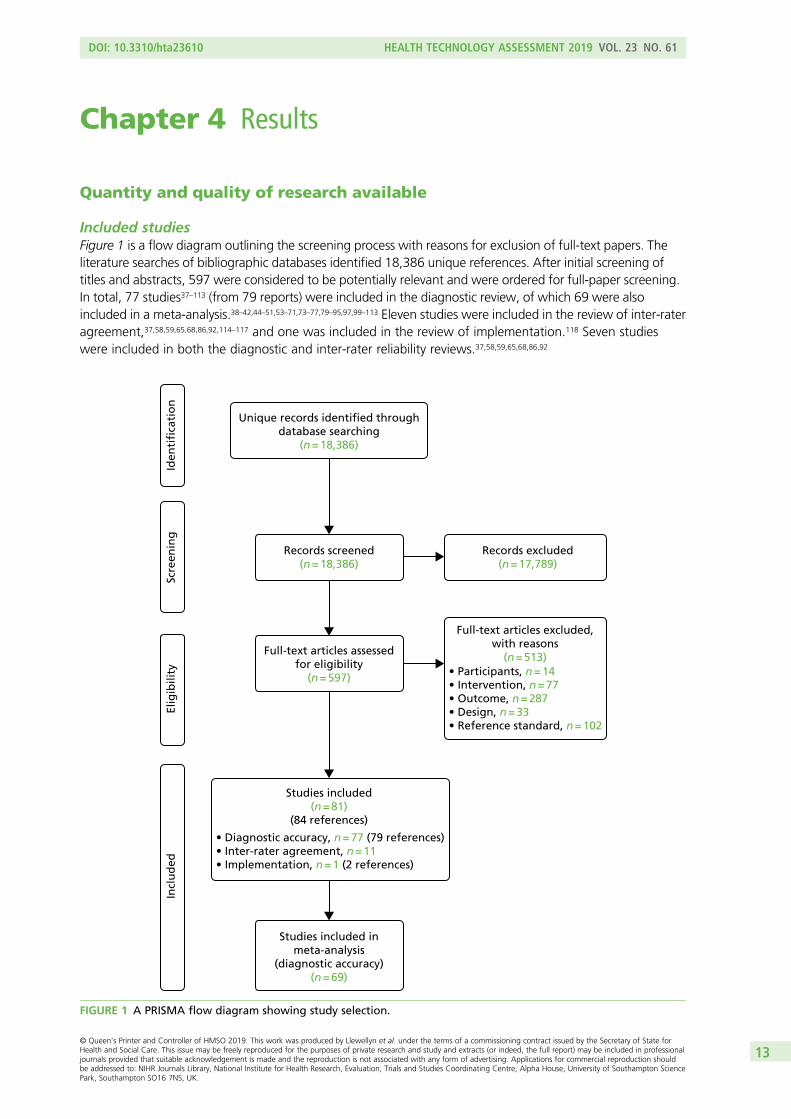
Chapter 4 Results
Quantity and quality of research available
Included studiesFigure 1 is a flow diagram outlining the screening process with reasons for exclusion of full-text papers. Theliterature searches of bibliographic databases identified 18,386 unique references. After initial screening oftitles and abstracts, 597 were considered to be potentially relevant and were ordered for full-paper screening.In total, 77 studies37–113 (from 79 reports) were included in the diagnostic review, of which 69 were alsoincluded in a meta-analysis.38–42,44–51,53–71,73–77,79–95,97,99–113 Eleven studies were included in the review of inter-rateragreement,37,58,59,65,68,86,92,114–117 and one was included in the review of implementation.118 Seven studieswere included in both the diagnostic and inter-rater reliability reviews.37,58,59,65,68,86,92
Unique records identified throughdatabase searching
(n = 18,386)
Scre
enin
gIn
clu
ded
Elig
ibili
tyId
enti
fica
tio
n
Records screened(n = 18,386)
Records excluded(n = 17,789)
Full-text articles assessedfor eligibility
(n = 597)
Full-text articles excluded,with reasons
(n = 513)• Participants, n = 14• Intervention, n = 77• Outcome, n = 287• Design, n = 33• Reference standard, n = 102
Studies included(n = 81)
(84 references)
• Diagnostic accuracy, n = 77 (79 references)• Inter-rater agreement, n = 11• Implementation, n = 1 (2 references)
Studies included inmeta-analysis
(diagnostic accuracy)(n = 69)
FIGURE 1 A PRISMA flow diagram showing study selection.
DOI: 10.3310/hta23610 HEALTH TECHNOLOGY ASSESSMENT 2019 VOL. 23 NO. 61
© Queen’s Printer and Controller of HMSO 2019. This work was produced by Llewellyn et al. under the terms of a commissioning contract issued by the Secretary of State forHealth and Social Care. This issue may be freely reproduced for the purposes of private research and study and extracts (or indeed, the full report) may be included in professionaljournals provided that suitable acknowledgement is made and the reproduction is not associated with any form of advertising. Applications for commercial reproduction shouldbe addressed to: NIHR Journals Library, National Institute for Health Research, Evaluation, Trials and Studies Coordinating Centre, Alpha House, University of Southampton SciencePark, Southampton SO16 7NS, UK.
13

Excluded studiesOf the 597 potentially relevant studies, the most common reason for exclusion was lack of relevant outcomedata (287 references, of which 49 did not have a full text available) and 102 references did not report aneligible reference standard. Fifty-four studies69,119–171 evaluated the diagnostic accuracy of scintigraphybut were excluded from the main review because they did not evaluate the diagnostic accuracy of othereligible index tests. The list of references that were excluded along with the reasons for their exclusionsis not reported because of the large number of exclusions, but is available from the authors on request.
Assessment of diagnostic accuracy
Characteristics of included studiesTable 1 presents a summary of design and patient characteristics of all included studies. Most studies(46 out of 77) were published in or after 2000.37,38,40,41,43–46,48,51–57,60–65,67–70,72,73,77,78,80–82,84,88,93,95–99,103,105,108,109,111,113
Just under half of the studies were conducted in the USA (34 studies).39,42,46,56,63,66,67,70–72,74–76,79,80,82,83,85,86,88–92,98,100–102,104,106,107,110–112 Eight studies were conducted in Germany,49,58–60,64,65,81,108 six in Switzerland,41,44,61,68,73,99
five in Italy50,53–55,95 and three in Egypt,37,52,113 the Netherlands48,62,105 and Turkey.51,96,97 Two studies wereconducted in France,41,45 India,77,93 the Republic of Korea,69,109 Spain40,84 and the UK.41,94 A single study wasconducted in the following countries: Austria,108 Belgium,57 Bulgaria,43 Canada,43 Israel,103 Japan,82 theRepublic of Korea,109 Kuwait,38 Lithuania78 and Oman.87 Three studies were conducted in more than onecountry.41,82,108
None of the included studies was randomised, and 41 studies used a prospective design.37,41–43,45,47,49,51,52,54,55,57–60,62,64–66,75–78,81,83–85,88–91,93,94,96,99,104,107,110–113
The sample size of the studies ranged from 7 to 339, but most studies were small: only 15 (20%) included≥ 50 participants.40,41,46,50,67,70,71,75,78,84,86,88,98,108,113 Nearly all studies were conducted in adults. Three studieswere conducted in children exclusively,52,78,98 and 10 were conducted in a mixed population of adultsand children.44,50,57,85,87,96,101,104,106,109 Nine studies included at least some participants with indwellingwork, 39,57,61,69,73,79,81,103,108,109 but only one focused exclusively on this population.103
Nearly half of the included studies included only or mostly patients with diabetes (36 studies).37,38,40–43,47,49,51,53,55,56,62,67,70,71,74,76,77,82,84,86,88–90,92–95,97,99,102,107,111–113 A total of 10 studies focused on patients with traumaand/or previous surgery.57,59,61,64,68,69,72,73,79,103,105,108 Osteomyelitis was caused by non-foot-related pressureulcers and skin ulcerations in six studies45,63,66,72,75,80 and one study attributed osteomyelitis to each of thefollowing conditions specifically: soft tissue infection,96 septic arthritis98 and neuropathic osteoarthropathy.100
Eighteen studies included patients with multiple aetiologies,44,46,48,50,52,54,58,60,65,78,81,83,85,91,101,106,109,110 and threestudies did not report any specific causes.39,87,104 Only one study included patients with haematogenousosteomyelitis.78 Appendix 3 presents further details on the study participant inclusion and exclusion criteria.
Forty-seven studies stated which type of osteomyelitis they targeted. Twelve studies aimed to detect acuteosteomyelitis (AOM) specifically,37,51,52,66,74,78,87,90,91,98,99,104 17 focused on COM46,49,58,60,61,64,68,73,79,81,93,94,96,108,111–113
and 15 focused on a mixed population of AOM and COM.38,42,44,48,50,54,57,63,65,69,71,80,85,92,106,107 Two studies targetedpatients with either subacute osteomyelitis or COM.39,59 The condition targeted was not specified in 30studies.40,41,43,45,47,53,55,56,62,67,70,72,75–77,82–84,86,88,89,95,97,100–103,105,109,110 Most studies used the dual reference standardfor osteomyelitis of clinical follow-up for patients who tested negative and bone biopsy with histopathology ormicrobiology for test-positive patients, although 34 studies used histopathology/microbiology in all participantsregardless of their imaging test results.37,38,42,43,45,49,51,53,54,56–59,61,62,70,72,75,77,79–82,84,89,90,92,93,98,100,102,107,108,113
Table 2 presents the distribution of included diagnostic accuracy studies according to tests and body parttargeted. This shows that most of the evidence focused on the diagnostic accuracy of MRI, scintigraphyand radiography for the diagnosis of diabetic foot osteomyelitis. Few studies specifically focused on theaxial skeleton, the pelvis/hip/knee and long bones.
RESULTS
NIHR Journals Library www.journalslibrary.nihr.ac.uk
14
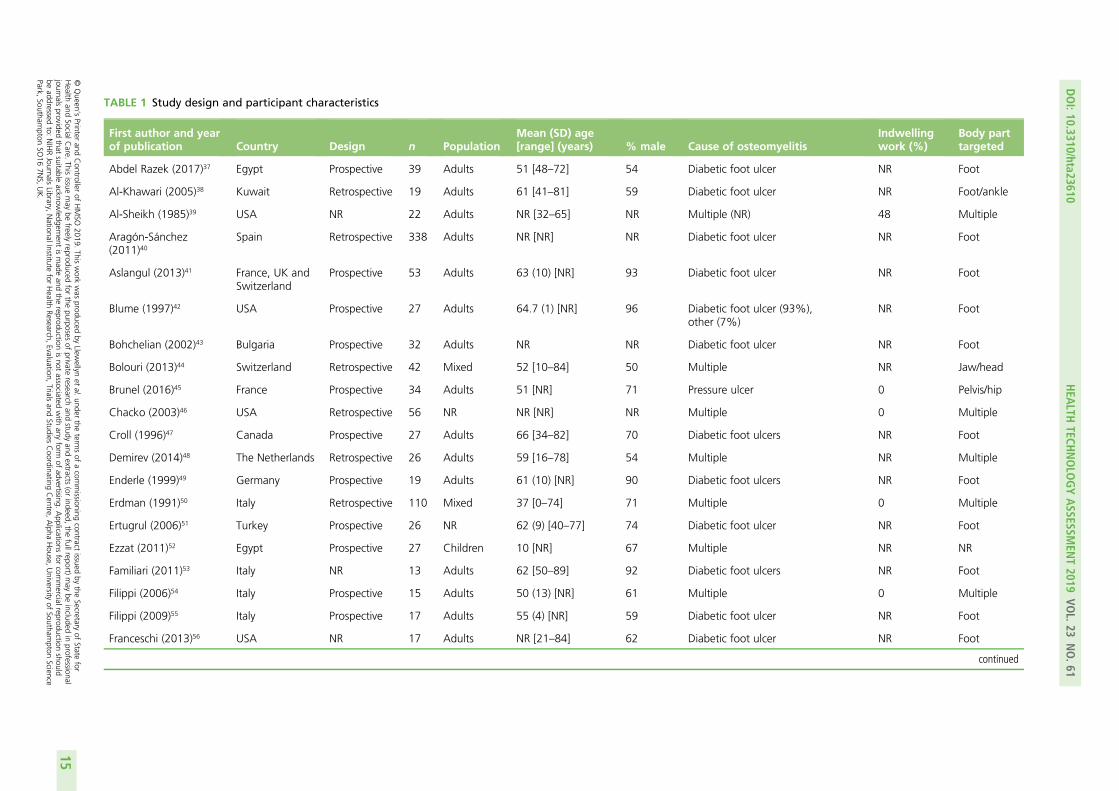
TABLE 1 Study design and participant characteristics
First author and yearof publication Country Design n Population
Mean (SD) age[range] (years) % male Cause of osteomyelitis
Indwellingwork (%)
Body parttargeted
Abdel Razek (2017)37 Egypt Prospective 39 Adults 51 [48–72] 54 Diabetic foot ulcer NR Foot
Al-Khawari (2005)38 Kuwait Retrospective 19 Adults 61 [41–81] 59 Diabetic foot ulcer NR Foot/ankle
Al-Sheikh (1985)39 USA NR 22 Adults NR [32–65] NR Multiple (NR) 48 Multiple
Aragón-Sánchez(2011)40
Spain Retrospective 338 Adults NR [NR] NR Diabetic foot ulcer NR Foot
Aslangul (2013)41 France, UK andSwitzerland
Prospective 53 Adults 63 (10) [NR] 93 Diabetic foot ulcer NR Foot
Blume (1997)42 USA Prospective 27 Adults 64.7 (1) [NR] 96 Diabetic foot ulcer (93%),other (7%)
NR Foot
Bohchelian (2002)43 Bulgaria Prospective 32 Adults NR NR Diabetic foot ulcer NR Foot
Bolouri (2013)44 Switzerland Retrospective 42 Mixed 52 [10–84] 50 Multiple NR Jaw/head
Brunel (2016)45 France Prospective 34 Adults 51 [NR] 71 Pressure ulcer 0 Pelvis/hip
Chacko (2003)46 USA Retrospective 56 NR NR [NR] NR Multiple 0 Multiple
Croll (1996)47 Canada Prospective 27 Adults 66 [34–82] 70 Diabetic foot ulcers NR Foot
Demirev (2014)48 The Netherlands Retrospective 26 Adults 59 [16–78] 54 Multiple NR Multiple
Enderle (1999)49 Germany Prospective 19 Adults 61 (10) [NR] 90 Diabetic foot ulcers NR Foot
Erdman (1991)50 Italy Retrospective 110 Mixed 37 [0–74] 71 Multiple 0 Multiple
Ertugrul (2006)51 Turkey Prospective 26 NR 62 (9) [40–77] 74 Diabetic foot ulcer NR Foot
Ezzat (2011)52 Egypt Prospective 27 Children 10 [NR] 67 Multiple NR NR
Familiari (2011)53 Italy NR 13 Adults 62 [50–89] 92 Diabetic foot ulcers NR Foot
Filippi (2006)54 Italy Prospective 15 Adults 50 (13) [NR] 61 Multiple 0 Multiple
Filippi (2009)55 Italy Prospective 17 Adults 55 (4) [NR] 59 Diabetic foot ulcer NR Foot
Franceschi (2013)56 USA NR 17 Adults NR [21–84] 62 Diabetic foot ulcer NR Foot
continued
DOI:10.3310/hta23610
HEA
LTHTECH
NOLO
GYASSESSM
ENT2019
VOL.23
NO.61
©Queen
’sPrinter
andController
ofHMSO
2019.This
work
was
producedby
Llewellyn
etal.
underthe
termsof
acom
missioning
contractissued
bythe
Secretaryof
Statefor
Health
andSocialC
are.This
issuemay
befreely
reproducedfor
thepurposes
ofprivate
researchand
studyand
extracts(or
indeed,the
fullreport)may
beincluded
inprofessional
journalsprovided
thatsuitable
acknowledgem
entismade
andthe
reproductionisnot
associatedwith
anyform
ofadvertising.
Applications
forcom
mercialreproduction
shouldbe
addressedto:
NIHRJournals
Library,NationalInstitute
forHealth
Research,Evaluation,
Trialsand
StudiesCoordinating
Centre,
Alpha
House,
University
ofSoutham
ptonScience
Park,Southam
ptonSO
167N
S,UK.
15
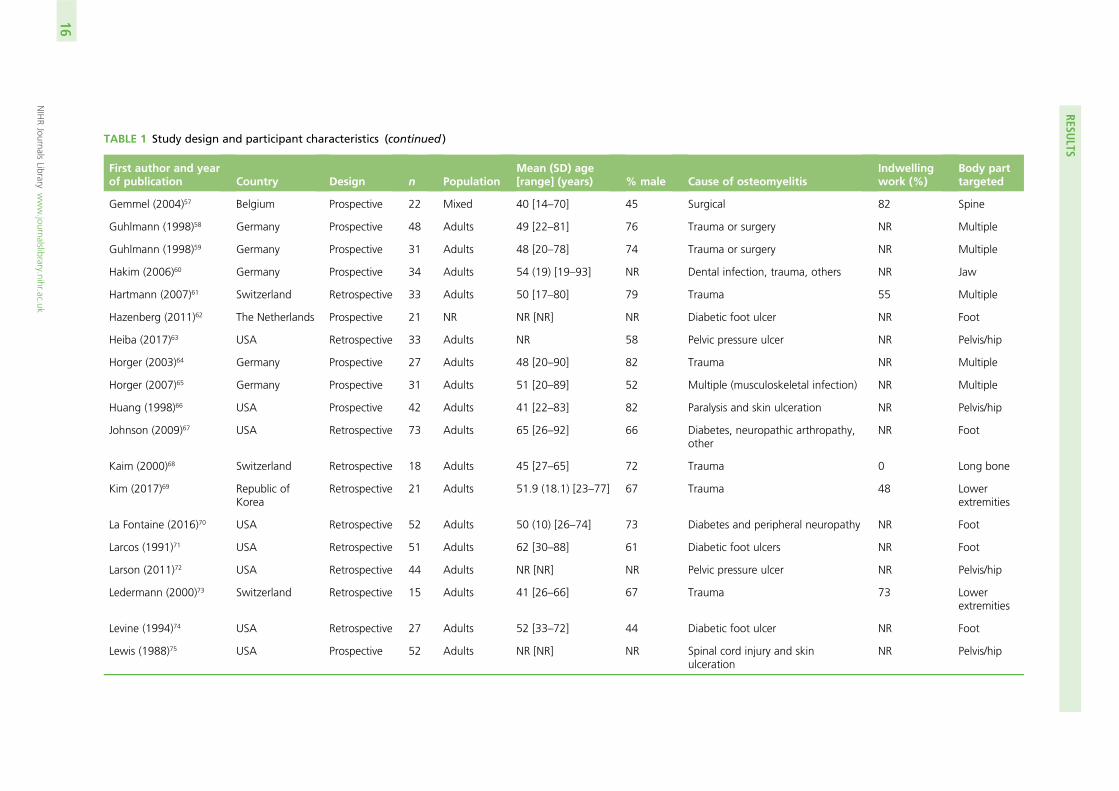
TABLE 1 Study design and participant characteristics (continued )
First author and yearof publication Country Design n Population
Mean (SD) age[range] (years) % male Cause of osteomyelitis
Indwellingwork (%)
Body parttargeted
Gemmel (2004)57 Belgium Prospective 22 Mixed 40 [14–70] 45 Surgical 82 Spine
Guhlmann (1998)58 Germany Prospective 48 Adults 49 [22–81] 76 Trauma or surgery NR Multiple
Guhlmann (1998)59 Germany Prospective 31 Adults 48 [20–78] 74 Trauma or surgery NR Multiple
Hakim (2006)60 Germany Prospective 34 Adults 54 (19) [19–93] NR Dental infection, trauma, others NR Jaw
Hartmann (2007)61 Switzerland Retrospective 33 Adults 50 [17–80] 79 Trauma 55 Multiple
Hazenberg (2011)62 The Netherlands Prospective 21 NR NR [NR] NR Diabetic foot ulcer NR Foot
Heiba (2017)63 USA Retrospective 33 Adults NR 58 Pelvic pressure ulcer NR Pelvis/hip
Horger (2003)64 Germany Prospective 27 Adults 48 [20–90] 82 Trauma NR Multiple
Horger (2007)65 Germany Prospective 31 Adults 51 [20–89] 52 Multiple (musculoskeletal infection) NR Multiple
Huang (1998)66 USA Prospective 42 Adults 41 [22–83] 82 Paralysis and skin ulceration NR Pelvis/hip
Johnson (2009)67 USA Retrospective 73 Adults 65 [26–92] 66 Diabetes, neuropathic arthropathy,other
NR Foot
Kaim (2000)68 Switzerland Retrospective 18 Adults 45 [27–65] 72 Trauma 0 Long bone
Kim (2017)69 Republic ofKorea
Retrospective 21 Adults 51.9 (18.1) [23–77] 67 Trauma 48 Lowerextremities
La Fontaine (2016)70 USA Retrospective 52 Adults 50 (10) [26–74] 73 Diabetes and peripheral neuropathy NR Foot
Larcos (1991)71 USA Retrospective 51 Adults 62 [30–88] 61 Diabetic foot ulcers NR Foot
Larson (2011)72 USA Retrospective 44 Adults NR [NR] NR Pelvic pressure ulcer NR Pelvis/hip
Ledermann (2000)73 Switzerland Retrospective 15 Adults 41 [26–66] 67 Trauma 73 Lowerextremities
Levine (1994)74 USA Retrospective 27 Adults 52 [33–72] 44 Diabetic foot ulcer NR Foot
Lewis (1988)75 USA Prospective 52 Adults NR [NR] NR Spinal cord injury and skinulceration
NR Pelvis/hip
RESULTS
NIHRJournals
Librarywww.journalslibrary.nihr.ac.uk
16
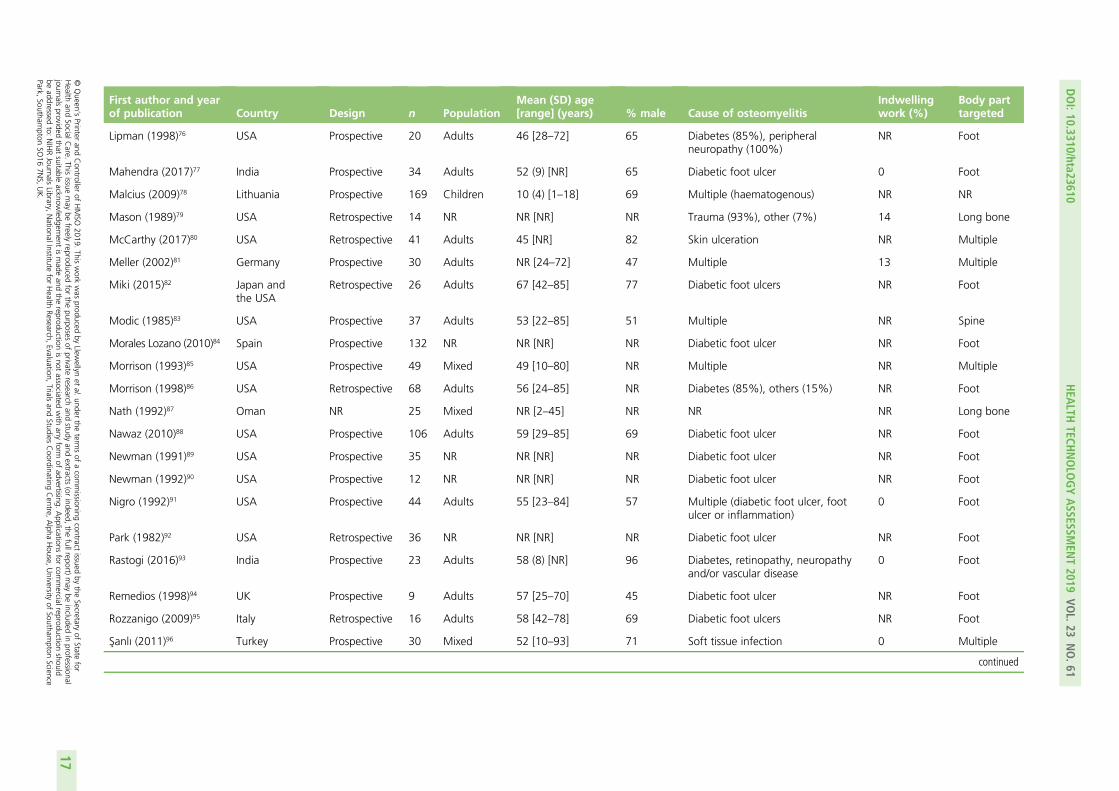
First author and yearof publication Country Design n Population
Mean (SD) age[range] (years) % male Cause of osteomyelitis
Indwellingwork (%)
Body parttargeted
Lipman (1998)76 USA Prospective 20 Adults 46 [28–72] 65 Diabetes (85%), peripheralneuropathy (100%)
NR Foot
Mahendra (2017)77 India Prospective 34 Adults 52 (9) [NR] 65 Diabetic foot ulcer 0 Foot
Malcius (2009)78 Lithuania Prospective 169 Children 10 (4) [1–18] 69 Multiple (haematogenous) NR NR
Mason (1989)79 USA Retrospective 14 NR NR [NR] NR Trauma (93%), other (7%) 14 Long bone
McCarthy (2017)80 USA Retrospective 41 Adults 45 [NR] 82 Skin ulceration NR Multiple
Meller (2002)81 Germany Prospective 30 Adults NR [24–72] 47 Multiple 13 Multiple
Miki (2015)82 Japan andthe USA
Retrospective 26 Adults 67 [42–85] 77 Diabetic foot ulcers NR Foot
Modic (1985)83 USA Prospective 37 Adults 53 [22–85] 51 Multiple NR Spine
Morales Lozano (2010)84 Spain Prospective 132 NR NR [NR] NR Diabetic foot ulcer NR Foot
Morrison (1993)85 USA Prospective 49 Mixed 49 [10–80] NR Multiple NR Multiple
Morrison (1998)86 USA Retrospective 68 Adults 56 [24–85] NR Diabetes (85%), others (15%) NR Foot
Nath (1992)87 Oman NR 25 Mixed NR [2–45] NR NR NR Long bone
Nawaz (2010)88 USA Prospective 106 Adults 59 [29–85] 69 Diabetic foot ulcer NR Foot
Newman (1991)89 USA Prospective 35 NR NR [NR] NR Diabetic foot ulcer NR Foot
Newman (1992)90 USA Prospective 12 NR NR [NR] NR Diabetic foot ulcer NR Foot
Nigro (1992)91 USA Prospective 44 Adults 55 [23–84] 57 Multiple (diabetic foot ulcer, footulcer or inflammation)
0 Foot
Park (1982)92 USA Retrospective 36 NR NR [NR] NR Diabetic foot ulcer NR Foot
Rastogi (2016)93 India Prospective 23 Adults 58 (8) [NR] 96 Diabetes, retinopathy, neuropathyand/or vascular disease
0 Foot
Remedios (1998)94 UK Prospective 9 Adults 57 [25–70] 45 Diabetic foot ulcer NR Foot
Rozzanigo (2009)95 Italy Retrospective 16 Adults 58 [42–78] 69 Diabetic foot ulcers NR Foot
Sanlı (2011)96 Turkey Prospective 30 Mixed 52 [10–93] 71 Soft tissue infection 0 Multiple
continued
DOI:10.3310/hta23610
HEA
LTHTECH
NOLO
GYASSESSM
ENT2019
VOL.23
NO.61
©Queen
’sPrinter
andController
ofHMSO
2019.This
work
was
producedby
Llewellyn
etal.
underthe
termsof
acom
missioning
contractissued
bythe
Secretaryof
Statefor
Health
andSocialC
are.This
issuemay
befreely
reproducedfor
thepurposes
ofprivate
researchand
studyand
extracts(or
indeed,the
fullreport)may
beincluded
inprofessional
journalsprovided
thatsuitable
acknowledgem
entismade
andthe
reproductionisnot
associatedwith
anyform
ofadvertising.
Applications
forcom
mercialreproduction
shouldbe
addressedto:
NIHRJournals
Library,NationalInstitute
forHealth
Research,Evaluation,
Trialsand
StudiesCoordinating
Centre,
Alpha
House,
University
ofSoutham
ptonScience
Park,Southam
ptonSO
167N
S,UK.
17
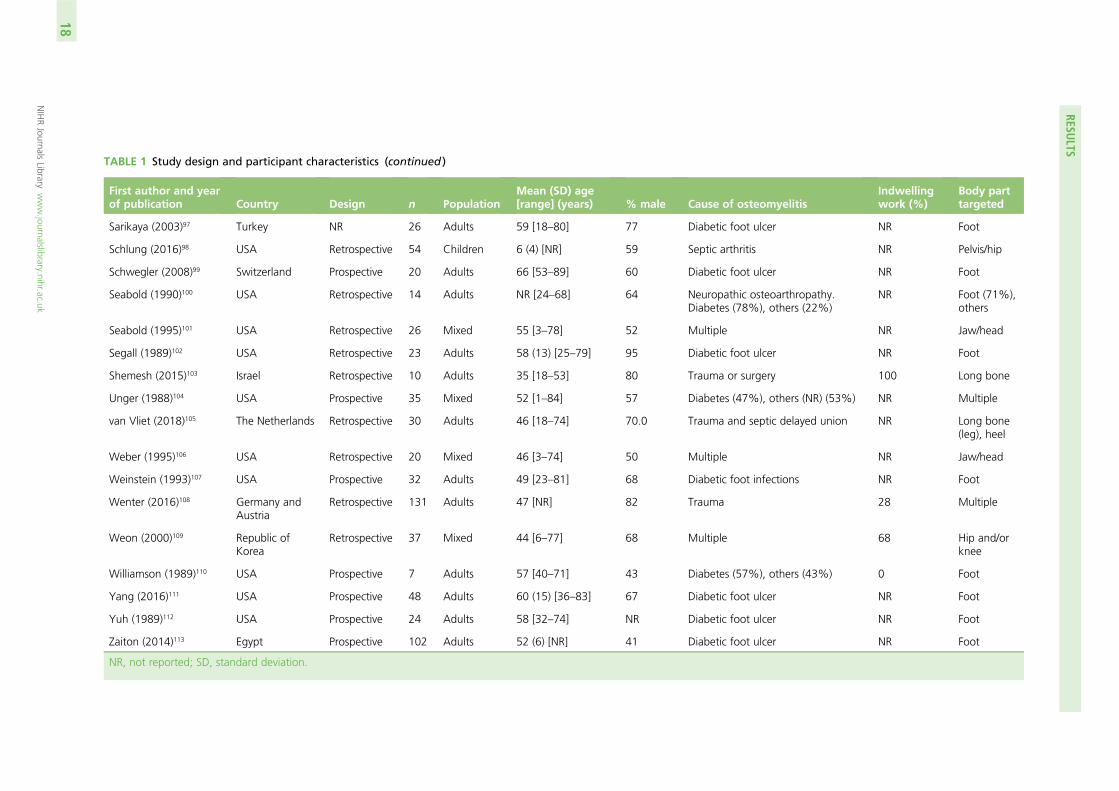
TABLE 1 Study design and participant characteristics (continued )
First author and yearof publication Country Design n Population
Mean (SD) age[range] (years) % male Cause of osteomyelitis
Indwellingwork (%)
Body parttargeted
Sarikaya (2003)97 Turkey NR 26 Adults 59 [18–80] 77 Diabetic foot ulcer NR Foot
Schlung (2016)98 USA Retrospective 54 Children 6 (4) [NR] 59 Septic arthritis NR Pelvis/hip
Schwegler (2008)99 Switzerland Prospective 20 Adults 66 [53–89] 60 Diabetic foot ulcer NR Foot
Seabold (1990)100 USA Retrospective 14 Adults NR [24–68] 64 Neuropathic osteoarthropathy.Diabetes (78%), others (22%)
NR Foot (71%),others
Seabold (1995)101 USA Retrospective 26 Mixed 55 [3–78] 52 Multiple NR Jaw/head
Segall (1989)102 USA Retrospective 23 Adults 58 (13) [25–79] 95 Diabetic foot ulcer NR Foot
Shemesh (2015)103 Israel Retrospective 10 Adults 35 [18–53] 80 Trauma or surgery 100 Long bone
Unger (1988)104 USA Prospective 35 Mixed 52 [1–84] 57 Diabetes (47%), others (NR) (53%) NR Multiple
van Vliet (2018)105 The Netherlands Retrospective 30 Adults 46 [18–74] 70.0 Trauma and septic delayed union NR Long bone(leg), heel
Weber (1995)106 USA Retrospective 20 Mixed 46 [3–74] 50 Multiple NR Jaw/head
Weinstein (1993)107 USA Prospective 32 Adults 49 [23–81] 68 Diabetic foot infections NR Foot
Wenter (2016)108 Germany andAustria
Retrospective 131 Adults 47 [NR] 82 Trauma 28 Multiple
Weon (2000)109 Republic ofKorea
Retrospective 37 Mixed 44 [6–77] 68 Multiple 68 Hip and/orknee
Williamson (1989)110 USA Prospective 7 Adults 57 [40–71] 43 Diabetes (57%), others (43%) 0 Foot
Yang (2016)111 USA Prospective 48 Adults 60 (15) [36–83] 67 Diabetic foot ulcer NR Foot
Yuh (1989)112 USA Prospective 24 Adults 58 [32–74] NR Diabetic foot ulcer NR Foot
Zaiton (2014)113 Egypt Prospective 102 Adults 52 (6) [NR] 41 Diabetic foot ulcer NR Foot
NR, not reported; SD, standard deviation.
RESULTS
NIHRJournals
Librarywww.journalslibrary.nihr.ac.uk
18
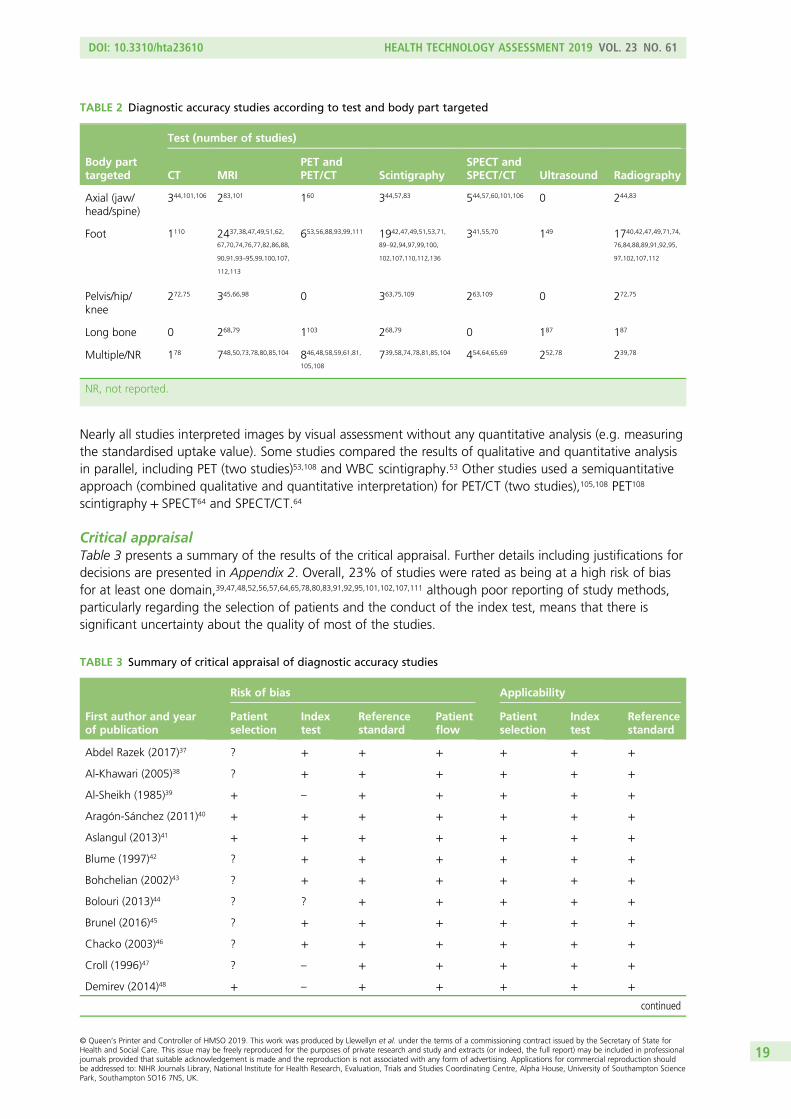
Nearly all studies interpreted images by visual assessment without any quantitative analysis (e.g. measuringthe standardised uptake value). Some studies compared the results of qualitative and quantitative analysisin parallel, including PET (two studies)53,108 and WBC scintigraphy.53 Other studies used a semiquantitativeapproach (combined qualitative and quantitative interpretation) for PET/CT (two studies),105,108 PET108
scintigraphy + SPECT64 and SPECT/CT.64
Critical appraisalTable 3 presents a summary of the results of the critical appraisal. Further details including justifications fordecisions are presented in Appendix 2. Overall, 23% of studies were rated as being at a high risk of biasfor at least one domain,39,47,48,52,56,57,64,65,78,80,83,91,92,95,101,102,107,111 although poor reporting of study methods,particularly regarding the selection of patients and the conduct of the index test, means that there issignificant uncertainty about the quality of most of the studies.
TABLE 2 Diagnostic accuracy studies according to test and body part targeted
Body parttargeted
Test (number of studies)
CT MRIPET andPET/CT Scintigraphy
SPECT andSPECT/CT Ultrasound Radiography
Axial (jaw/head/spine)
344,101,106 283,101 160 344,57,83 544,57,60,101,106 0 244,83
Foot 1110 2437,38,47,49,51,62,
67,70,74,76,77,82,86,88,
90,91,93–95,99,100,107,
112,113
653,56,88,93,99,111 1942,47,49,51,53,71,
89–92,94,97,99,100,
102,107,110,112,136
341,55,70 149 1740,42,47,49,71,74,
76,84,88,89,91,92,95,
97,102,107,112
Pelvis/hip/knee
272,75 345,66,98 0 363,75,109 263,109 0 272,75
Long bone 0 268,79 1103 268,79 0 187 187
Multiple/NR 178 748,50,73,78,80,85,104 846,48,58,59,61,81,
105,108
739,58,74,78,81,85,104 454,64,65,69 252,78 239,78
NR, not reported.
TABLE 3 Summary of critical appraisal of diagnostic accuracy studies
First author and yearof publication
Risk of bias Applicability
Patientselection
Indextest
Referencestandard
Patientflow
Patientselection
Indextest
Referencestandard
Abdel Razek (2017)37 ? + + + + + +
Al-Khawari (2005)38 ? + + + + + +
Al-Sheikh (1985)39 + – + + + + +
Aragón-Sánchez (2011)40 + + + + + + +
Aslangul (2013)41 + + + + + + +
Blume (1997)42 ? + + + + + +
Bohchelian (2002)43 ? + + + + + +
Bolouri (2013)44 ? ? + + + + +
Brunel (2016)45 ? + + + + + +
Chacko (2003)46 ? + + + + + +
Croll (1996)47 ? – + + + + +
Demirev (2014)48 + – + + + + +
continued
DOI: 10.3310/hta23610 HEALTH TECHNOLOGY ASSESSMENT 2019 VOL. 23 NO. 61
© Queen’s Printer and Controller of HMSO 2019. This work was produced by Llewellyn et al. under the terms of a commissioning contract issued by the Secretary of State forHealth and Social Care. This issue may be freely reproduced for the purposes of private research and study and extracts (or indeed, the full report) may be included in professionaljournals provided that suitable acknowledgement is made and the reproduction is not associated with any form of advertising. Applications for commercial reproduction shouldbe addressed to: NIHR Journals Library, National Institute for Health Research, Evaluation, Trials and Studies Coordinating Centre, Alpha House, University of Southampton SciencePark, Southampton SO16 7NS, UK.
19

TABLE 3 Summary of critical appraisal of diagnostic accuracy studies (continued )
First author and yearof publication
Risk of bias Applicability
Patientselection
Indextest
Referencestandard
Patientflow
Patientselection
Indextest
Referencestandard
Enderle (1999)49 + + + + + + +
Erdman (1991)50 + + + + + + +
Ertugrul (2006)51 ? ? + + + + +
Ezzat (2011)52 – + ? + + + +
Familiari (2011)53 ? + + + + + +
Filippi (2006)54 + + + + + + +
Filippi (2009)55 + + + + + + +
Franceschi (2013)56 ? + + – ? + +
Gemmel (2004)57 – + + + ? + +
Guhlmann (1998)58 ? + + + + + +
Guhlmann (1998)59 ? + + + + + +
Hakim (2006)60 ? ? + + + + +
Hartmann (2007)61 ? + + + + + +
Hazenberg (2011)62 ? ? + + + + +
Heiba (2017)63 ? + + + + + +
Horger (2003)64 ? – + + + + +
Horger (2007)65 + – + + + + +
Huang (1998)66 + + + + + + +
Johnson (2009)67 ? + + + + + +
Kaim (2000)68 ? + + + + + +
Kim (2017)69 + + + + + + +
La Fontaine (2016)70 ? + + + + + +
Larcos (1991)71 ? ? + + + + +
Larson (2011)72 ? ? + + ? + +
Ledermann (2000)73 + ? + + + ? +
Levine (1994)74 ? ? + + + + +
Lewis (1988)75 ? ? + + ? + +
Lipman (1998)76 + + + ? + + +
Mahendra (2017)77 + + + + + ? +
Malcius (2009)78 ? – ? ? + + +
Mason (1989)79 + ? + + + + +
McCarthy (2017)80 – + + + + + +
Meller (2002)81 + + + + + + +
Miki (2015)82 ? ? + + + + +
Modic (1985)83 ? – + + ? + +
Morales Lozano (2010)84 ? ? + + + + +
Morrison (1993)85 ? ? + + + + +
Morrison (1998)86 ? + + + + + +
Nath (1992)87 ? ? + + + + +
RESULTS
NIHR Journals Library www.journalslibrary.nihr.ac.uk
20

Over half of the studies (56%) did not provide sufficient information to assess the risk of bias associatedwith the selection and enrolment of patients into the study.37,38,42–47,51,53,56,58–64,67,68,70–72,74,75,78,82–87,89,94,95,97,98,100,101,103,106,108,110 In particular, most studies did not explicitly state whether or not all eligible patients wereincluded during a defined period of time. Therefore, the risk of selection bias, for instance because of theexclusion of patients who are harder to diagnose, cannot be excluded. Nine studies did not blind theinterpretation of the index test to the results of other index tests or to the reference standard, and weretherefore considered as being at a high risk of bias.39,47,48,64,65,78,83,91,95 Another 18 studies did not providesufficient information on blinding and were therefore considered as being at an unclear risk of bias.44,51,60,62,71–75,79,82,84,85,87,88,90,93,110 Nearly all studies were rated as being at a low risk of bias associated with thereference standard (91%) and patient flow (87%) and none of the included studies raised significantconcerns about their applicability to the diagnostic accuracy review questions.
TABLE 3 Summary of critical appraisal of diagnostic accuracy studies (continued )
First author and yearof publication
Risk of bias Applicability
Patientselection
Indextest
Referencestandard
Patientflow
Patientselection
Indextest
Referencestandard
Nawaz (2010)88 + ? + + + + +
Newman (1991)89 + ? + + + + +
Newman (1992)90 ? + + + + + +
Nigro (1992)91 + – ? + + + +
Park (1982)92 – + + + + + +
Rastogi (2016)93 + ? + + + + +
Remedios (1998)94 ? + + + + + +
Rozzanigo (2009)95 ? – ? ? + + +
Sanlı (2011)96 + + ? ? + + +
Sarikaya (2003)97 ? + + + + + +
Schlung (2016)98 ? + + + + + +
Schwegler (2008)99 + + + + + + +
Seabold (1990)100 ? + + ? + + +
Seabold (1995)101 ? + + – ? + +
Segall (1989)102 – + + + + + +
Shemesh (2015)103 ? + + + + + +
Unger (1988)104 + + ? ? + + +
van Vliet (2018)105 + ? + + + + +
Weber (1995)106 ? + + + + + +
Weinstein (1993)107 + + + – + + +
Wenter (2016)108 ? + + + + + +
Weon (2000)109 + + + + + + +
Williamson (1989)110 ? ? + + + + +
Yang (2016)111 + + – – + + +
Yuh (1989)112 + + + + + + +
Zaiton (2014)113 + + + + + + +
+, low risk of bias; –, high risk of bias; ?, unclear risk of bias.
DOI: 10.3310/hta23610 HEALTH TECHNOLOGY ASSESSMENT 2019 VOL. 23 NO. 61
© Queen’s Printer and Controller of HMSO 2019. This work was produced by Llewellyn et al. under the terms of a commissioning contract issued by the Secretary of State forHealth and Social Care. This issue may be freely reproduced for the purposes of private research and study and extracts (or indeed, the full report) may be included in professionaljournals provided that suitable acknowledgement is made and the reproduction is not associated with any form of advertising. Applications for commercial reproduction shouldbe addressed to: NIHR Journals Library, National Institute for Health Research, Evaluation, Trials and Studies Coordinating Centre, Alpha House, University of Southampton SciencePark, Southampton SO16 7NS, UK.
21

Synthesis of diagnostic accuracy in adults
In this section we consider the synthesis of diagnostic accuracy for studies of imaging tests in adults.Studies exclusively in children are considered in Synthesis of studies in children. Studies in mixed adult/children groups or where the population was unclear are included in the analysis of adults.
Excluded from this analysis are studies where the combined diagnostic accuracy of two or more imagingtests was reported (e.g. the accuracy of scintigraphy in combination with SPECT); these are discussed inStudies reporting on combinations of imaging tests. Also excluded are studies that did not report sufficientdata to calculate 2 × 2 tables of diagnostic accuracy; these are discussed in Studies not included in thequantitative synthesis.
This analysis included 69 diagnostic accuracy studies.38–42,44–51,53–71,73–77,79–95,97,99–113 Appendix 4, Table 19,summarises these studies. Many of these studies compare two or more imaging tests. Comparisonsbetween tests are discussed in Comparisons between tests. Many studies compare imaging tests withscintigraphy. Scintigraphy was not specified as a test of interest in the protocol, but it is included herebecause of the number of studies considering it. The main analysis only considers scintigraphy in studieswhere it was compared with other tests; for studies of scintigraphy alone, see Studies of scintigraphy.
Some studies reported diagnostic accuracy at multiple thresholds of a single test, or for a single test underdifferent conditions. Where that was the case, the main analysis uses only the result with the highest DOR,as an indicator of the ‘best’ diagnostic accuracy for that test in that study. Where appropriate, data atmultiple thresholds are considered in the sections on individual tests (see Synthesis of specific imaging tests).
Figure 2 summarises the sensitivity (proportion of people/scans with osteomyelitis correctly diagnosed) andspecificity (proportion of people/scans without osteomyelitis correctly diagnosed) for each test in eachstudy in a ROC plot. This figure shows considerable variation in the diagnostic accuracy both within andbetween tests. MRI and SPECT both generally have high sensitivity (> 80%), but with a wide range ofspecificities. PET is generally more consistent with high sensitivity and specificity, but with some studieshaving lower sensitivity. Scintigraphy results vary widely in both sensitivity and specificity. Radiographicresults generally have poor sensitivity.
100
20
30
40
50
60
Sen
siti
vity
(%
) 70
80
90
100
90 80 70 60 50 40 30 20 10 0Specificity (%)
Test usedCTMRIPETScintigraphySPECTUltrasoundRadiography
FIGURE 2 Summary ROC plot of diagnostic accuracy in adults.
RESULTS
NIHR Journals Library www.journalslibrary.nihr.ac.uk
22

In Appendix 4, Figure 21 shows a similar plot for PPVs and NPVs. These results are also variable anddifficult to interpret. MRI, SPECT and PET generally have high PPV and NPV, but with many outliers.Radiography generally has a poorer NPV.
We now consider the bivariate meta-analysis of sensitivity and specificity. Figure 3 shows the summarybivariate meta-analysis results for each test (with 95% CIs for sensitivity and specificity). Figure 4 shows thesummary HSROC curves for each test.
100
20
10
0
30
40
50
60
Sen
siti
vity
(%
)
70
80
90
100
90 80 70 60 50 40 30 20 10 0Specificity (%)
Test usedCTMRIPETScintigraphySPECTRadiography
FIGURE 3 Bivariate meta-analysis of sensitivity and specificity: all adult studies.
Test usedCTMRIPETScintigraphySPECTRadiography
100
20
10
0
30
40
50
60
Sen
siti
vity
(%
)
70
80
90
100
90 80 70 60 50 40 30 20 10 0Specificity (%)
FIGURE 4 Summary HSROC curves: all adult studies.
DOI: 10.3310/hta23610 HEALTH TECHNOLOGY ASSESSMENT 2019 VOL. 23 NO. 61
© Queen’s Printer and Controller of HMSO 2019. This work was produced by Llewellyn et al. under the terms of a commissioning contract issued by the Secretary of State forHealth and Social Care. This issue may be freely reproduced for the purposes of private research and study and extracts (or indeed, the full report) may be included in professionaljournals provided that suitable acknowledgement is made and the reproduction is not associated with any form of advertising. Applications for commercial reproduction shouldbe addressed to: NIHR Journals Library, National Institute for Health Research, Evaluation, Trials and Studies Coordinating Centre, Alpha House, University of Southampton SciencePark, Southampton SO16 7NS, UK.
23

These results show that sensitivity and specificity are highest for SPECT, but with a wide CI for specificity.MRI and PET also have high sensitivity and specificity. CT, radiography and scintigraphy all have poorersensitivity and/or specificity. The summary HSROC curves for MRI, SPECT and PET are very similar andoverlapping, suggesting that they have similar diagnostic accuracy. The curves for CT, radiography andscintigraphy are lower, showing poorer diagnostic accuracy.
Appendix 4, Figure 22, gives the results of the bivariate meta-analysis of PPV and NPV, which shows thatMRI, PET and SPECT have higher PPV (88–93%) and NPV (> 85%) than MRI and PET, with SPECT havingthe highest NPV (97%). Scintigraphy and radiography have lower PPV and NPV.
Figure 5 shows forest plots of sensitivity and specificity for MRI. These highlight the generally highsensitivity and specificity of MRI, and the overall consistency of sensitivity across studies. As noted earlier,the specificity of MRI varies substantially across studies, although many studies are small with correspondinglywide CIs. This raises concerns as to the consistency of MRI performance across studies. Given the largenumber of tests, and hence forest plots, no further forest plots are presented in this report, but they areavailable on request from the authors.
Table 4 shows the results of univariate meta-analyses of sensitivity and specificity (i.e. meta-analysedseparately rather than jointly) and also meta-analyses of DOR (to summarise overall diagnostic accuracy)and the PR (proportion of people testing positive for osteomyelitis based on the imaging test result alone).
The results for sensitivity and specificity match those of the bivariate analysis in Figure 3, as would be expected.The I2 values for sensitivity and specificity are low or zero, which conflicts with the apparent heterogeneityobserved in Figure 2. This may be because most studies are small, and so there is considerable within-studyvariability in estimates, which reduces I2, rather than an absence of heterogeneity.
Diagnostic odds ratios are similar for MRI, SPECT and PET, suggesting similar diagnostic accuracy for thesetests, as seen in Figure 4. The odds ratios are considerably lower for scintigraphy, radiography and CT,suggesting that these tests have poorer diagnostic accuracy. MRI and SPECT have high PRs of > 70%, somost people have an imaging test result that would lead to being diagnosed with osteomyelitis. This, inpart, reflects high incidence in the studies. PET, however, has a lower PR of 52.7%. This may be becausethe higher specificity and lower sensitivity of PET reduce the number of positive PET scans overall, and inparticular the number of false-positive diagnoses.
Comparisons between testsForty of the included studies of adults reported diagnostic accuracy data for two or more imaging tests. Todetermine whether or not these studies show evidence that one test is superior to another, we comparedthe DORs for each test within each study. Appendix 4, Figure 23, shows these DORs for each imaging testin each study. These results show that, when radiography was included, it was generally inferior to othertests (particularly MRI and scintigraphy); scintigraphy was generally inferior to MRI.
In Figure 6, each dot is the difference in log-DOR between the test in the title of each subplot and thecomparator test, indicated by the colour of the dot. Points to the right of the central black line are wherethe ‘title’ test has greater DOR than the ‘comparator’ test. These results suggest that SPECT and PET weregenerally superior to whatever test they were compared with (but with few studies). MRI was superior toscintigraphy and radiography, but not to PET or SPECT. Scintigraphy was superior to radiography, but notMRI, and radiography was generally inferior to all other tests.
To formally assess whether or not these apparent differences are genuine, regression modelling was usedto compare studies. This regressed the diagnostic accuracy data to estimate differences in DORs andspecificity between tests across studies (see Chapter 3, Comparison of imaging tests). Two models werefitted: one using radiography as the baseline test and one using MRI as the baseline test. The formalresults of these models are given in Appendix 4, Table 20, and a summary is presented in Table 5.
RESULTS
NIHR Journals Library www.journalslibrary.nihr.ac.uk
24

0 10 20 30 40 50 60 70 80 90Sensitivity (%)
0 10 20 30 40 50 60 70 80 90Specificity (%)
Sensitivity Mean (95% CI) Mean (95% CI)SpecificityRemedios (1998)94
Ledermann (2000)73
Rozzanigo (2009)95
Kaim (2000)68
Enderle (1999)49
Lipman (1998)76
Hazenberg (2011)62
Mason (1989)79
Newman (1992)90
Yuh (1989)112
Seabold (1995)101
Demirev (2014)48
Miki (2015)82
Schwegler (2008)99
Croll (1996)47
Al-Khawari (2005)38
Ertugrul (2006)51
Rastogi (2016)93
Mahendra (2017)77
Unger (1988)104
Levine (1994)74
Brunel (2016)45
Modic (1985)83
McCarthy (2017)80
Huang (1998)66
Weinstein (1993)107
Morrison (1993)85
Schlung (2016)98
La Fontaine (2016)70
Morrison (1998)86
Johnson (2009)67
Zaiton (2014)113
Nawaz (2010)88
Erdman (1991)50
Nigro (1992)91
80.00% (44.94% to 100.00%)63.64% (35.21% to 92.06%)
66.67% (13.32% to 100.00%)60.00% (29.64% to 90.36%)
80.00% (44.94% to 100.00%)40.00% (0.00% to 82.94%)
80.00% (44.94% to 100.00%)66.67% (13.32% to 100.00%)77.78% (50.62% to 100.00%)89.47% (75.67% to 100.00%)90.91% (66.88% to 100.00%)
70.00% (41.60% to 98.40%)96.30% (86.22% to 100.00%)92.31% (77.82% to 100.00%)97.30% (89.91% to 100.00%)
62.50% (28.95% to 96.05%)60.00% (17.06% to 100.00%)
63.64% (35.21% to 92.06%)91.67% (80.61% to 100.00%)95.65% (87.32% to 100.00%)96.97% (88.70% to 100.00%)
22.22% (0.00% to 49.38%)92.86% (79.37% to 100.00%)
10.00% (0.00% to 28.59%)87.50% (64.58% to 100.00%)81.25% (62.12% to 100.00%)93.33% (80.71% to 100.00%)94.74% (87.64% to 100.00%)
36.84% (15.15% to 58.53%)82.35% (64.23% to 100.00%)
90.74% (83.01% to 98.47%)88.46% (76.18% to 100.00%)
77.78% (68.17% to 87.38%)75.00% (63.66% to 86.34%)
90.00% (71.41% to 100.00%)
88.89% (59.85% to 100.00%)92.31% (71.82% to 100.00%)96.30% (86.22% to 100.00%)94.74% (80.54% to 100.00%)96.55% (87.16% to 100.00%)80.00% (59.76% to 100.00%)97.14% (89.34% to 100.00%)95.65% (83.87% to 100.00%)
28.57% (0.00% to 62.04%)98.04% (92.66% to 100.00%)60.00% (17.06% to 100.00%)88.24% (72.92% to 100.00%)98.41% (94.05% to 100.00%)85.71% (59.79% to 100.00%)88.89% (68.36% to 100.00%)95.65% (83.87% to 100.00%)
78.26% (61.40% to 95.12%)83.33% (62.25% to 100.00%)95.24% (82.36% to 100.00%)91.67% (76.03% to 100.00%)
76.92% (54.02% to 99.83%)94.29% (86.60% to 100.00%)92.31% (77.82% to 100.00%)
92.98% (86.35% to 99.61%)97.96% (94.00% to 100.00%)98.92% (95.96% to 100.00%)
88.24% (77.41% to 99.07%)37.50% (13.78% to 61.22%)87.18% (76.69% to 97.67%)
98.04% (92.66% to 100.00%)95.00% (85.45% to 100.00%)97.50% (94.08% to 100.00%)90.91% (78.90% to 100.00%)98.15% (94.55% to 100.00%)97.96% (92.36% to 100.00%)
100100
FIGURE 5 Forest plots of sensitivity and specificity for MRI.
DOI:10.3310/hta23610
HEA
LTHTECH
NOLO
GYASSESSM
ENT2019
VOL.23
NO.61
©Queen
’sPrinter
andController
ofHMSO
2019.This
work
was
producedby
Llewellyn
etal.
underthe
termsof
acom
missioning
contractissued
bythe
Secretaryof
Statefor
Health
andSocialC
are.This
issuemay
befreely
reproducedfor
thepurposes
ofprivate
researchand
studyand
extracts(or
indeed,the
fullreport)may
beincluded
inprofessional
journalsprovided
thatsuitable
acknowledgem
entismade
andthe
reproductionisnot
associatedwith
anyform
ofadvertising.
Applications
forcom
mercialreproduction
shouldbe
addressedto:
NIHRJournals
Library,NationalInstitute
forHealth
Research,Evaluation,
Trialsand
StudiesCoordinating
Centre,
Alpha
House,
University
ofSoutham
ptonScience
Park,Southam
ptonSO
167N
S,UK.
25
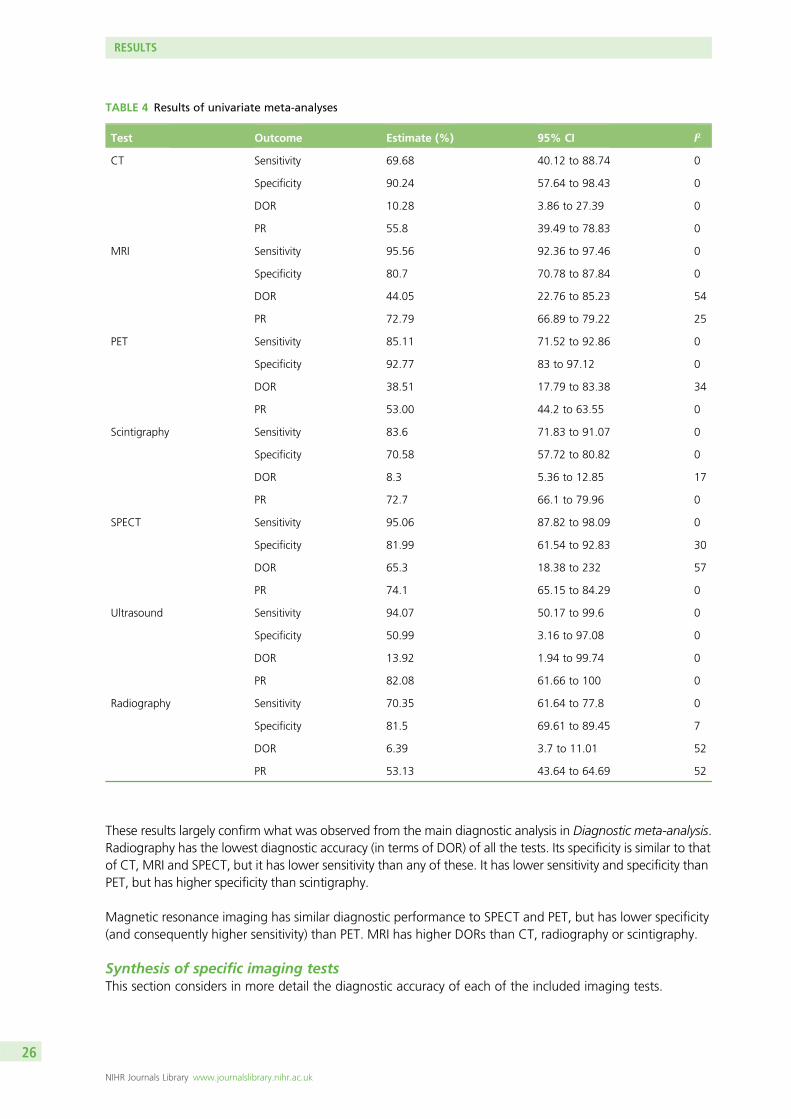
These results largely confirm what was observed from the main diagnostic analysis in Diagnostic meta-analysis.Radiography has the lowest diagnostic accuracy (in terms of DOR) of all the tests. Its specificity is similar to thatof CT, MRI and SPECT, but it has lower sensitivity than any of these. It has lower sensitivity and specificity thanPET, but has higher specificity than scintigraphy.
Magnetic resonance imaging has similar diagnostic performance to SPECT and PET, but has lower specificity(and consequently higher sensitivity) than PET. MRI has higher DORs than CT, radiography or scintigraphy.
Synthesis of specific imaging testsThis section considers in more detail the diagnostic accuracy of each of the included imaging tests.
TABLE 4 Results of univariate meta-analyses
Test Outcome Estimate (%) 95% CI I2
CT Sensitivity 69.68 40.12 to 88.74 0
Specificity 90.24 57.64 to 98.43 0
DOR 10.28 3.86 to 27.39 0
PR 55.8 39.49 to 78.83 0
MRI Sensitivity 95.56 92.36 to 97.46 0
Specificity 80.7 70.78 to 87.84 0
DOR 44.05 22.76 to 85.23 54
PR 72.79 66.89 to 79.22 25
PET Sensitivity 85.11 71.52 to 92.86 0
Specificity 92.77 83 to 97.12 0
DOR 38.51 17.79 to 83.38 34
PR 53.00 44.2 to 63.55 0
Scintigraphy Sensitivity 83.6 71.83 to 91.07 0
Specificity 70.58 57.72 to 80.82 0
DOR 8.3 5.36 to 12.85 17
PR 72.7 66.1 to 79.96 0
SPECT Sensitivity 95.06 87.82 to 98.09 0
Specificity 81.99 61.54 to 92.83 30
DOR 65.3 18.38 to 232 57
PR 74.1 65.15 to 84.29 0
Ultrasound Sensitivity 94.07 50.17 to 99.6 0
Specificity 50.99 3.16 to 97.08 0
DOR 13.92 1.94 to 99.74 0
PR 82.08 61.66 to 100 0
Radiography Sensitivity 70.35 61.64 to 77.8 0
Specificity 81.5 69.61 to 89.45 7
DOR 6.39 3.7 to 11.01 52
PR 53.13 43.64 to 64.69 52
RESULTS
NIHR Journals Library www.journalslibrary.nihr.ac.uk
26

Studies of scintigraphyScintigraphy was not specified as an imaging test of interest in our protocol, but was included in many of theeligible studies as a comparator with other tests. Hence, we included it in our main analysis in Synthesis ofdiagnostic accuracy in adults. To facilitate a more complete examination of the diagnostic value of scintigraphy,we identified larger, recent studies (> 20 participants and published since 1990) of scintigraphy for analysis,where scintigraphy was the only imaging test reported in the publication. Nine studies132,136,142,148–152,165 fromour database searches met these criteria and reported sufficient data for meta-analysis. Because they wereoff-protocol, we note that the additional nine studies have not been formally assessed for risk of bias. Thesenine studies were combined with the studies of scintigraphy included in the main meta-analysis, in order toexplore the impact of this additional evidence on scintigraphy, and as a sensitivity analysis compared with usingonly the primary included studies.
– 5.0 – 2.5 0.0
Radiography
Stu
dy
Stu
dy
Stu
dy
Stu
dy
Stu
dy
Stu
dy
2.5 5.0
Scintigraphy
– 5.0 – 2.5 0.0
SPECT
2.5 5.0– 5.0 – 2.5 0.0 2.5 5.0
– 5.0 – 2.5 0.0 2.5 5.0– 5.0 – 2.5 0.0 2.5 5.0 – 5.0 – 2.5 0.0 2.5 5.0
CT MRI PET
CTMRIPETScintigraphySPECTUltrasoundRadiography
Comparator test
Difference in log-DOR
Difference in log-DOR Difference in log-DOR
Stu
dy
– 5.0 – 2.5 0.0
Ultrasound
2.5 5.0Difference in log-DOR
Difference in log-DOR Difference in log-DOR Difference in log-DOR
FIGURE 6 Comparing DORs within studies.
TABLE 5 Summary of regression model to compare imaging tests
Parameter Radiography worse than Radiography similar to Radiography better than
DOR CT, MRI, PET, scintigraphyand SPECT
None None
Specificity PET CT, MRI and SPECT Scintigraphy
MRI worse than MRI similar to MRI better than
DOR None PET, SPECT CT, scintigraphy and radiography
Specificity PET CT, SPECT and radiography Scintigraphy
DOI: 10.3310/hta23610 HEALTH TECHNOLOGY ASSESSMENT 2019 VOL. 23 NO. 61
© Queen’s Printer and Controller of HMSO 2019. This work was produced by Llewellyn et al. under the terms of a commissioning contract issued by the Secretary of State forHealth and Social Care. This issue may be freely reproduced for the purposes of private research and study and extracts (or indeed, the full report) may be included in professionaljournals provided that suitable acknowledgement is made and the reproduction is not associated with any form of advertising. Applications for commercial reproduction shouldbe addressed to: NIHR Journals Library, National Institute for Health Research, Evaluation, Trials and Studies Coordinating Centre, Alpha House, University of Southampton SciencePark, Southampton SO16 7NS, UK.
27
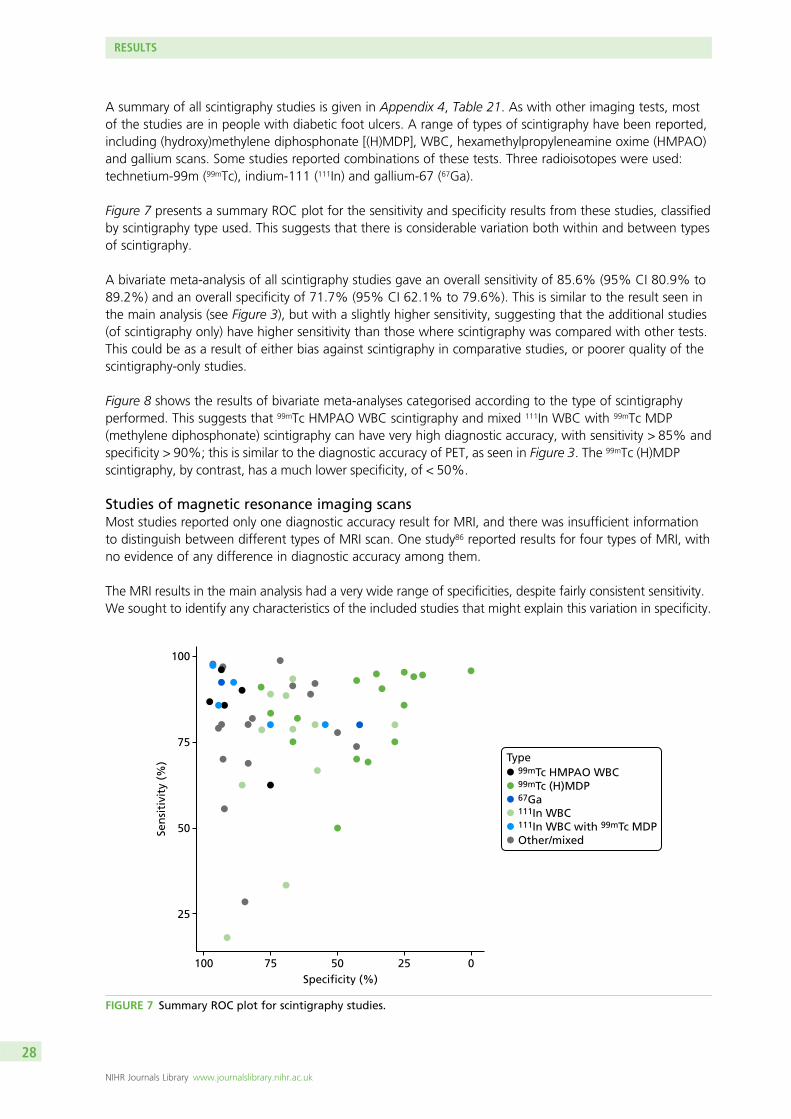
A summary of all scintigraphy studies is given in Appendix 4, Table 21. As with other imaging tests, mostof the studies are in people with diabetic foot ulcers. A range of types of scintigraphy have been reported,including (hydroxy)methylene diphosphonate [(H)MDP], WBC, hexamethylpropyleneamine oxime (HMPAO)and gallium scans. Some studies reported combinations of these tests. Three radioisotopes were used:technetium-99m (99mTc), indium-111 (111In) and gallium-67 (67Ga).
Figure 7 presents a summary ROC plot for the sensitivity and specificity results from these studies, classifiedby scintigraphy type used. This suggests that there is considerable variation both within and between typesof scintigraphy.
A bivariate meta-analysis of all scintigraphy studies gave an overall sensitivity of 85.6% (95% CI 80.9% to89.2%) and an overall specificity of 71.7% (95% CI 62.1% to 79.6%). This is similar to the result seen inthe main analysis (see Figure 3), but with a slightly higher sensitivity, suggesting that the additional studies(of scintigraphy only) have higher sensitivity than those where scintigraphy was compared with other tests.This could be as a result of either bias against scintigraphy in comparative studies, or poorer quality of thescintigraphy-only studies.
Figure 8 shows the results of bivariate meta-analyses categorised according to the type of scintigraphyperformed. This suggests that 99mTc HMPAO WBC scintigraphy and mixed 111In WBC with 99mTc MDP(methylene diphosphonate) scintigraphy can have very high diagnostic accuracy, with sensitivity > 85% andspecificity > 90%; this is similar to the diagnostic accuracy of PET, as seen in Figure 3. The 99mTc (H)MDPscintigraphy, by contrast, has a much lower specificity, of < 50%.
Studies of magnetic resonance imaging scansMost studies reported only one diagnostic accuracy result for MRI, and there was insufficient informationto distinguish between different types of MRI scan. One study86 reported results for four types of MRI, withno evidence of any difference in diagnostic accuracy among them.
The MRI results in the main analysis had a very wide range of specificities, despite fairly consistent sensitivity.We sought to identify any characteristics of the included studies that might explain this variation in specificity.
100
25
50Sen
siti
vity
(%
)
75
100
75 50 25 0Specificity (%)
Type99mTc HMPAO WBC99mTc (H)MDP67Ga111In WBC111In WBC with 99mTc MDPOther/mixed
FIGURE 7 Summary ROC plot for scintigraphy studies.
RESULTS
NIHR Journals Library www.journalslibrary.nihr.ac.uk
28

Appendix 4, Figure 24, shows the association between specificity and incidence of osteomyelitis for eachstudy. This shows that specificity declines as incidence increases. This association was statistically significant(a decline in log-odds of specificity of 0.31 per 10% increase in incidence, p = 0.008). This suggests thatosteomyelitis may be over-diagnosed using MRI in populations in which osteomyelitis is common. The modelwas not a good fit (adjusted R2 = 0.17), so incidence does not explain all the variation in specificity. No otherpossible causes of this variation could be identified.
Studies of single-photon emission computed tomography and single-photon emissioncomputed tomography/computed tomographyAs with scintigraphy studies, SPECT studies used a range of radioisotopes and test types to perform SPECTimaging. Figure 9 shows the ROC plot of sensitivity and specificity according to the type of test used. Thereare too few studies to distinguish between tests, or to perform a bivariate meta-analysis. The results show noclear evidence of difference between the types of test. When comparing results with those for scintigraphy(see Figure 8), the results suggest that SPECT produces higher sensitivity than planar scintigraphy for thesame test type.
There was no evidence that studies of SPECT/CT had differing diagnostic accuracy to those of SPECTalone, although the number of studies was limited (results not shown).
Studies of positron emission tomography and positron emission tomography/computed tomographyThere was no evidence that studies describing the test used as PET/CT differed in diagnostic accuracy fromthose describing the test only as PET (see Appendix 4, Figure 25). All but one study used 18F-FDG PET.
There was no evidence that quantitative analysis (such as measuring the standardised uptake value)improved the accuracy of PET (results not shown).
100
20
10
0
30
40
50
60
Sen
siti
vity
(%
)
70
80
90
100
90 80 70 60 50 40 30 20 10 0Specificity (%)
Type99mTc HMPAO WBC99mTc (H)MDP111In WBC111In WBC with 99mTc MDPOther/mixed
FIGURE 8 Diagnostic accuracy of scintigraphy according to type of test performed.
DOI: 10.3310/hta23610 HEALTH TECHNOLOGY ASSESSMENT 2019 VOL. 23 NO. 61
© Queen’s Printer and Controller of HMSO 2019. This work was produced by Llewellyn et al. under the terms of a commissioning contract issued by the Secretary of State forHealth and Social Care. This issue may be freely reproduced for the purposes of private research and study and extracts (or indeed, the full report) may be included in professionaljournals provided that suitable acknowledgement is made and the reproduction is not associated with any form of advertising. Applications for commercial reproduction shouldbe addressed to: NIHR Journals Library, National Institute for Health Research, Evaluation, Trials and Studies Coordinating Centre, Alpha House, University of Southampton SciencePark, Southampton SO16 7NS, UK.
29

Studies of ultrasoundOnly two studies of ultrasound for diagnosing osteomyelitis in adults were identified, so they could not beincluded in any bivariate meta-analysis. The results of these studies are summarised in Table 6. The twostudies are not consistent in their estimated sensitivity and specificity. Both have DORs that suggest poorerdiagnostic performance than MRI, PET or SPECT (see Table 4).
Studies reporting on combinations of imaging testsTwelve studies40,43,54,55,64,65,69,75,84,96,109,141 reported data on the diagnostic accuracy of combining two tests.These were mostly combinations of scintigraphy with SPECT. Two studies combined radiography withprobe-to-bone tests. These are summarised here, although we note that probe to bone is not an imaging testand so is not covered in this review.
Figure 10 shows the sensitivity and specificity estimates for all the combination tests. This shows considerablevariation in the diagnostic accuracy of combination tests. Most tests have too few studies to draw anyconclusions. A bivariate meta-analysis of the SPECT+ scintigraphy studies gives a summary sensitivity of 87.3%(95% CI 87.2% to 87.5%) and specificity of 83.4% (95% CI 83.3% to 83.6%). This is a lower sensitivity andspecificity than was estimated for SPECT alone (see Table 4).
100
70
Sen
siti
vity
(%
)
80
90
100
90 80 70 60 50 40Specificity (%)
Type99mTc (H)MDP99mTc DPD99mTc HMPAO67GaNot reportedOther 99mTc test
FIGURE 9 Diagnostic accuracy of SPECT studies according to type of SPECT used.
TABLE 6 Summary of diagnostic accuracy of ultrasound studies
Study
Enderle et al. (1999)49 (n= 19) Nath and Sethu (1992)87 (n= 25)
Cause: diabetic foot ulcers Cause: long bone pain or swelling
Sensitivity (%) (95% CI) 78.6 (57.1 to 100) 96.8 (88 to 100)
Specificity (%) (95% CI) 80 (44.9 to 100) 30 (1.6 to 58.4)
DOR (95% CI) 14.7 (1.2 to 185.2) 12.9 (0.6 to 292.8)
PPV (%) (95% CI) 91.7 (76 to 100) 68.2 (48.7 to 87.6)
NPV (%) (95% CI) 57.1 (20.5 to 93.8) 85.7 (49.1 to 122.4)
RESULTS
NIHR Journals Library www.journalslibrary.nihr.ac.uk
30

Figure 11 compares the DORs for the combination tests with those for the individual tests within eachstudy. This shows no evidence that combining tests improves diagnostic accuracy; in most studies thecombined test (circle) has a DOR no higher, and often lower, than the best single test (triangle).
One study (Aragón-Sánchez et al.40) of radiography combined with probe to bone obtained very highdiagnostic accuracy (sensitivity 97.7%, specificity 94.6%). However, this study also achieved much higherdiagnostic accuracy for radiography alone than was observed in most other studies. It is unclear whetherthis result is meaningful or a chance result in one study.
100
40
50
60Sen
siti
vity
(%
)
70
80
90
100
90 80 70 60 50 40Specificity (%)
Test usedCT + scintigraphyCT + radiographyMRI + scintigraphyProbe to bone + radiographyScintigraphy + SPECTScintigraphy + SPECT/CTScintigraphy + radiography
FIGURE 10 Diagnostic accuracy results for combination tests.
Ara
gón-
Sánc
hez
(201
1)40
Bohc
helia
n (2
002)
43Fi
lippi
(200
6)54
Filip
pi (2
009)
55H
orge
r (20
03)6
4H
orge
r (20
07)6
5Ka
im (2
000)
68Ki
m (2
017)
69Le
wis
(198
8)75
Mor
ales
Loz
ano
(201
0)84
Șanl
i (20
11)9
6W
eon
(200
0)10
9
– 5
0
5
log
-DO
R
10
15
Study
Combination
CTCT + scintigraphyCT + radiographyMRIMRI + scintigraphyProbe to boneScintigraphyScintigraphy + radiographySPECTSPECT + scintigraphyRadiographyRadiography + probe to bone
CombinationSingle
Test used
FIGURE 11 Diagnostic odds ratios for combination tests.
DOI: 10.3310/hta23610 HEALTH TECHNOLOGY ASSESSMENT 2019 VOL. 23 NO. 61
© Queen’s Printer and Controller of HMSO 2019. This work was produced by Llewellyn et al. under the terms of a commissioning contract issued by the Secretary of State forHealth and Social Care. This issue may be freely reproduced for the purposes of private research and study and extracts (or indeed, the full report) may be included in professionaljournals provided that suitable acknowledgement is made and the reproduction is not associated with any form of advertising. Applications for commercial reproduction shouldbe addressed to: NIHR Journals Library, National Institute for Health Research, Evaluation, Trials and Studies Coordinating Centre, Alpha House, University of Southampton SciencePark, Southampton SO16 7NS, UK.
31

Other factors and subgroupsThis section considers other factors that may affect diagnostic accuracy: the choice of reference standard,risk of bias, the presence of indwelling metalwork, the use of imaging tests prior to the main test andwhether osteomyelitis is acute or chronic.
Choice of reference standardThe eligible reference standards for confirming the absence of osteomyelitis were histopathology,microbiology or clinical follow-up of at least 6 months. It is possible that the choice of reference standardcould affect the diagnostic accuracy.
In Appendix 4, Figure 26 shows the ROC plots of diagnostic accuracy in accordance with the referencestandard, for each imaging test. These results suggest that, when only clinical follow-up was used,specificity might be higher than average, particularly for MRI. A formal regression model to assess this,however, found no statistically significant evidence of a difference between reference standards in eitherspecificity or DOR. We conclude that choice of reference standard is unlikely to lead to bias in the mainmeta-analyses.
Study quality and risk of biasThe impact of the QUADAS-2 assessment of each study on diagnostic accuracy was investigated. In Appendix 4,Figure 27 shows the ROC plots of sensitivity and specificity for each study according to whether the study wasrated as being at a high, unclear or low risk of bias for patient selection. In Appendix 4, Figure 28 repeatsthis for quality of the index test.
Neither figure suggests that there is any evidence that diagnostic accuracy results were biased by qualityfactors. Reference standard and patient flow issues were rated as being at a low risk of bias for moststudies, and there was no evidence that these had any impact on diagnostic accuracy (results not shown).
Indwelling metalworkFew studies reported on the number of patients (if any) who had indwelling metalwork at the time of theirscan. In Appendix 4, Figure 29 shows the diagnostic accuracy data for each imaging test according towhether indwelling metalwork was present in some patients, not present in any, or unreported. This figureshows no evidence that indwelling metalwork alters diagnostic accuracy.
Prior use of other imaging testsIn some studies, patients were included only after performing a prior imaging test, usually radiography.Patients would go on to the main imaging test only if osteomyelitis had not been ruled out by the initialtest. This extra testing could affect the diagnostic accuracy observed.
Figure 12 shows the sensitivity and specificity for all imaging tests, according to the prior imaging test used(if any). This suggests that prior use of radiography might improve specificity in MRI studies, and bothsensitivity and specificity in scintigraphy studies.
Formal regression analysis to test this possibility found no statistically significant evidence that radiographyprior to MRI improved specificity (p = 0.472) or DOR (p = 0.201). There was some evidence (but notconventionally statistically significant) that radiography prior to scintigraphy increased the DOR (p = 0.141).Hence it is possible, but uncertain, that using radiography as a precursor test to MRI or scintigraphy mayimprove diagnostic performance.
Other than radiography, few tests were used in addition to the main test. This analysis considered onlyinstances when prior tests were explicitly reported. In practice, it is likely that radiography will be used asan initial test in most patients.
RESULTS
NIHR Journals Library www.journalslibrary.nihr.ac.uk
32

Acute and chronic osteomyelitisStudies were divided according to whether the suspected osteomyelitis was acute or chronic. Studies werecategorised as:
l acute or subacute osteomyelitisl COMl COM and AOMl not reported.
Figure 13 shows the sensitivity and specificity results according to the test used and acute or chronicstatus. There appears to be some pattern in the choice of test used. PET and SPECT have not beenevaluated in people with AOM; almost all studies of PET are in people with COM. This may be aconsequence of the types of people in these studies; nearly all studies of AOM were in people withdiabetic foot ulcers. From these data, there is no clear evidence that diagnostic accuracy for any of thetests differ between COM and AOM.
Figure 14 shows the results of bivariate meta-analysis according to acute or chronic status. There is nocompelling evidence that diagnostic accuracy for any test varies with acute or chronic status. It is possiblethat MRI is more specific (91%) but less sensitive (89%) in acute cases than in chronic cases (78% and98%, respectively). The results are consistent with those in the overall analysis (see Figure 3), with MRI,PET and SPECT generally having greater diagnostic accuracy than radiography, CT or scintigraphy.
Sen
siti
vity
(%
)Se
nsi
tivi
ty (
%)
Sen
siti
vity
(%
)
Sen
siti
vity
(%
)
Sen
siti
vity
(%
)
100Radiography
75
50
25
0
Specificity (%)
Specificity (%) Specificity (%)
Specificity (%)
Specificity (%) Specificity (%) Specificity (%)
100 75 50 25 0
100 75 50 25 0
100Scintigraphy
75
50
25
0
Sen
siti
vity
(%
)
100
100
75
50
25
0
Sen
siti
vity
(%
) 100
75
50
25
0
SPECT
75 50 25 0
Ultrasound
100 75 50 25 0
100 75 50 25 00
100 75 50 25 0 100 75 50 25 0
100CT
75
50
25
0
100
75
50
25
0
100
75
50
25
MRI PET
CTMRINone/not statedOtherScintigraphyRadiography
Prior test used
FIGURE 12 Sensitivity and specificity according to whether or not any imaging test was used before the main test.
DOI: 10.3310/hta23610 HEALTH TECHNOLOGY ASSESSMENT 2019 VOL. 23 NO. 61
© Queen’s Printer and Controller of HMSO 2019. This work was produced by Llewellyn et al. under the terms of a commissioning contract issued by the Secretary of State forHealth and Social Care. This issue may be freely reproduced for the purposes of private research and study and extracts (or indeed, the full report) may be included in professionaljournals provided that suitable acknowledgement is made and the reproduction is not associated with any form of advertising. Applications for commercial reproduction shouldbe addressed to: NIHR Journals Library, National Institute for Health Research, Evaluation, Trials and Studies Coordinating Centre, Alpha House, University of Southampton SciencePark, Southampton SO16 7NS, UK.
33

60
70
80
90
100Chronic and acute
50
40
30
20
Specificity (%) Specificity (%)
Specificity (%) Specificity (%)
100 8090 6070 4050 20 10 030
100 8090 6070 4050 20 10 030 100 8090 6070 4050 20 10 030
Not reported
60
70
80
90
100Acute or subacute
50
40
30
20
Sen
siti
vity
(%
)Se
nsi
tivi
ty (
%)
60
70
80
90
100
50
40
30
20
60
70
80
90
100
50
40
30
20
Sen
siti
vity
(%
)Se
nsi
tivi
ty (
%)
Chronic
100 8090 6070 4050 20 10 030
CTMRIPETScintigraphySPECTUltrasoundRadiography
Test used
FIGURE 13 Sensitivity and specificity according to whether the study was of AOM or COM.
40
60
80
100
Chronic and acute
0
20
40
60
80
100
0
20
Specificity (%) Specificity (%)
Specificity (%) Specificity (%)
100 80 60 40 020
100 80 60 40 020 100 80 60 40 020
100 80 60 40 020
Not reported
Acute or subacute
Sen
siti
vity
(%
)Se
nsi
tivi
ty (
%)
40
60
80
100
0
20
40
60
80
100
0
20
Sen
siti
vity
(%
)Se
nsi
tivi
ty (
%)
Chronic
CTMRIPETScintigraphySPECTRadiography
Test used
FIGURE 14 Bivariate meta-analysis according to acute or chronic status.
RESULTS
NIHR Journals Library www.journalslibrary.nihr.ac.uk
34

Synthesis of diagnostic accuracy in people with diabetic foot ulcers
This section considers the 35 studies in which diabetic foot ulcers were the primary reason for testing forosteomyelitis.37,38,40–43,47,49,51,53,55,56,62,67,70,71,74,76,77,82,84,86,88–90,92–95,97,99,102,107,111–113 This includes studies in which atleast 60% of patients had diabetic foot ulcers; studies with smaller numbers of people with foot ulcers wereexcluded. Studies primarily of patients with diabetic foot ulcers constitute around half of the total studiesin this review. One study did not report sufficient data to be included in this analysis and is presented inStudies not included in the quantitative synthesis.37
The sensitivity and specificity estimates from these studies are presented in Figure 15. The results suggesthigh sensitivity (generally > 80%) for MRI and scintigraphy, but with a wide range of specificities. PETshowed high specificity, but a range of sensitivities. Radiography generally had low sensitivity. There weretoo few studies of SPECT or ultrasound to draw any conclusions, and none of CT. In Appendix 4, Figure 30shows the results for PPV and NPV, with considerable diversity in PPV and NPV values across studies.
Figure 16 shows the results of a bivariate meta-analysis of sensitivity and specificity. The results here aresimilar to those for all studies (see Figure 3). Owing to non-convergence of their respective bivariateanalyses, the univariate results are presented for PET and SPECT. Both MRI and PET have high accuracy,with MRI having higher sensitivity but lower specificity. Scintigraphy and radiography have lower specificity,but here scintigraphy has higher sensitivity than PET. The summary HSROC curves (see Appendix 4, Figure 31)suggest that MRI and PET (and possibly SPECT, although data are limited) have similar overall HSROC curves,and so similar diagnostic accuracy, whereas radiography and scintigraphy have lower accuracy.
In Appendix 4, Figure 32 gives the results of the bivariate meta-analysis of PPV and NPV, which showsthat both MRI and PET have high PPV (88%) and NPV (> 85%), with MRI having a higher NPV (95%).Scintigraphy and radiography have lower PPV and NPV rates.
In Appendix 4, Table 23 gives the results of univariate meta-analyses. The results are consistent withbivariate analyses. As in the overall analyses, PET has a markedly lower PR (46%) than MRI (70%).This means that fewer people are considered to have osteomyelitis using PET; this is a consequence ofits higher specificity and lower sensitivity.
100
20
30
40
50
60
Sen
siti
vity
(%
)
70
80
90
100
90 80 70 60 50 40 30 20 10 0Specificity (%)
Test usedMRIPETScintigraphySPECTUltrasoundRadiography
FIGURE 15 Sensitivity and specificity in studies of patients with diabetic foot ulcers.
DOI: 10.3310/hta23610 HEALTH TECHNOLOGY ASSESSMENT 2019 VOL. 23 NO. 61
© Queen’s Printer and Controller of HMSO 2019. This work was produced by Llewellyn et al. under the terms of a commissioning contract issued by the Secretary of State forHealth and Social Care. This issue may be freely reproduced for the purposes of private research and study and extracts (or indeed, the full report) may be included in professionaljournals provided that suitable acknowledgement is made and the reproduction is not associated with any form of advertising. Applications for commercial reproduction shouldbe addressed to: NIHR Journals Library, National Institute for Health Research, Evaluation, Trials and Studies Coordinating Centre, Alpha House, University of Southampton SciencePark, Southampton SO16 7NS, UK.
35
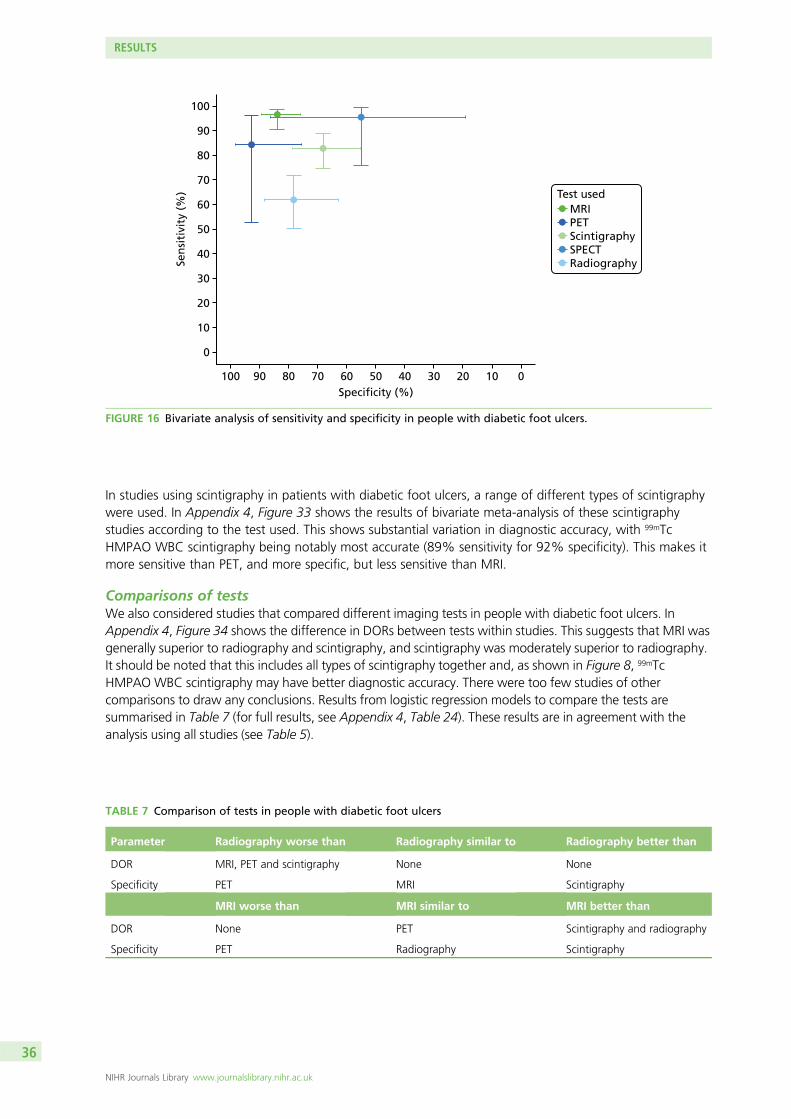
In studies using scintigraphy in patients with diabetic foot ulcers, a range of different types of scintigraphywere used. In Appendix 4, Figure 33 shows the results of bivariate meta-analysis of these scintigraphystudies according to the test used. This shows substantial variation in diagnostic accuracy, with 99mTcHMPAO WBC scintigraphy being notably most accurate (89% sensitivity for 92% specificity). This makes itmore sensitive than PET, and more specific, but less sensitive than MRI.
Comparisons of testsWe also considered studies that compared different imaging tests in people with diabetic foot ulcers. InAppendix 4, Figure 34 shows the difference in DORs between tests within studies. This suggests that MRI wasgenerally superior to radiography and scintigraphy, and scintigraphy was moderately superior to radiography.It should be noted that this includes all types of scintigraphy together and, as shown in Figure 8, 99mTcHMPAO WBC scintigraphy may have better diagnostic accuracy. There were too few studies of othercomparisons to draw any conclusions. Results from logistic regression models to compare the tests aresummarised in Table 7 (for full results, see Appendix 4, Table 24). These results are in agreement with theanalysis using all studies (see Table 5).
TABLE 7 Comparison of tests in people with diabetic foot ulcers
Parameter Radiography worse than Radiography similar to Radiography better than
DOR MRI, PET and scintigraphy None None
Specificity PET MRI Scintigraphy
MRI worse than MRI similar to MRI better than
DOR None PET Scintigraphy and radiography
Specificity PET Radiography Scintigraphy
100
20
10
0
30
40
50
60
Sen
siti
vity
(%
)70
80
90
100
90 80 70 60 50 40 30 20 10 0Specificity (%)
Test usedMRIPETScintigraphySPECTRadiography
FIGURE 16 Bivariate analysis of sensitivity and specificity in people with diabetic foot ulcers.
RESULTS
NIHR Journals Library www.journalslibrary.nihr.ac.uk
36

Synthesis of diagnostic accuracy for osteomyelitis not relatedto diabetes
The systematic review identified 31 studies in adults where osteomyelitis was not explicitly related todiabetes.39,44–46,48,50,54,57–61,63–66,68,73,75,79–81,83,85,87,101,103,105,106,108,109 This excludes studies where some of theparticipants had diabetes, but includes studies where diabetes was not reported, or where the studieshad a range of inclusion criteria, which may have included people with diabetes.
The studies were classified according to the location of the suspected diabetes as follows:
l axial skeleton (skull and spine)l long bone (leg)l pelvis, hip or kneel multiple locations or unreported location.
Studies were also classified according to the suspected cause of osteomyelitis:
l infections and ulcersl trauma and surgeryl contiguous diseasel multiple causesl other or unstated cause.
Figure 17 shows the sensitivity and specificity estimates by imaging test and scan location. Similarly, Figure 18shows results by suspected cause. There are generally few studies of any imaging test within each category,so it is not possible to draw firm conclusions. The results are broadly similar to those obtained when
60
70
80
90
100Long bone
50
40
30
20
Specificity (%) Specificity (%)
Specificity (%) Specificity (%)
100 8090 6070 4050 20 1030
100 8090 6070 4050 20 1030 100 8090 6070 4050 20 1030
Multiple or unreported
60
70
80
90
100Axial skeleton
50
40
30
20
Sen
siti
vity
(%
)Se
nsi
tivi
ty (
%)
Hip, pelvis and knee
100 8090 6070 4050 20 1030
CTMRIPETScintigraphySPECTUltrasoundRadiography
Test used
60
70
80
90
100
50
40
30
20
60
70
80
90
100
50
40
30
20
Sen
siti
vity
(%
)Se
nsi
tivi
ty (
%)
FIGURE 17 Sensitivity and specificity according to scan location.
DOI: 10.3310/hta23610 HEALTH TECHNOLOGY ASSESSMENT 2019 VOL. 23 NO. 61
© Queen’s Printer and Controller of HMSO 2019. This work was produced by Llewellyn et al. under the terms of a commissioning contract issued by the Secretary of State forHealth and Social Care. This issue may be freely reproduced for the purposes of private research and study and extracts (or indeed, the full report) may be included in professionaljournals provided that suitable acknowledgement is made and the reproduction is not associated with any form of advertising. Applications for commercial reproduction shouldbe addressed to: NIHR Journals Library, National Institute for Health Research, Evaluation, Trials and Studies Coordinating Centre, Alpha House, University of Southampton SciencePark, Southampton SO16 7NS, UK.
37

considering all studies and to the results in studies of diabetic foot ulcers. There is no immediate evidencethat diagnostic accuracy varies according to location or cause. The choice of imaging test may vary accordingto location, with SPECT and CT being used more commonly to image the axial skeleton, where MRI isused less.
Plots for PPV and NPV by location are given in Appendix 4, Figure 35, and by cause in Appendix 4, Figure 36.There is no clear evidence that PPV or NPV varies by location of imaging or cause of osteomyelitis.
Given the limited numbers of studies in each location or cause category, bivariate meta-analysis ofsensitivity and specificity could be performed for only a few tests. Results of the analyses are shown inAppendix 4, Figure 37, by location and in Appendix 4, Figure 38, by cause. The limited number of studiesmeans that CIs for most meta-analysis results are wide, so it is difficult to draw any firm conclusions. Thereis no clear evidence that diagnostic accuracy varies by location or cause, or that results differ from thoseseen in the overall meta-analysis of all studies (see Figure 3).
Given that there was no clear evidence that diagnostic accuracy for any of the tests varied by cause orlocation, a combined meta-analysis of all studies in adults without diabetes was performed. The resultsof the bivariate analysis of sensitivity and specificity are shown in Figure 19. Results from univariatemeta-analyses are provided in Appendix 4, Table 23.
These results are broadly comparable to the results using all studies (see Figure 3). There is somesuggestion that scintigraphy has slightly higher specificity and MRI has slightly lower specificity than theoverall results, or to those in diabetic foot ulcer studies (see Figure 15), but 95% CIs are too wide to drawany firm conclusions.
Sen
siti
vity
(%
)Se
nsi
tivi
ty (
%)
60
70
80
90
100Trauma or surgery related
50
40
30
20
Specificity (%)Specificity (%)
Specificity (%) Specificity (%)Specificity (%)
100 8090 6070 4050 102030
100 8090 6070 4050 102030 100 8090 6070 4050 102030
Unstated/other
100 8090 6070 4050 102030
60
70
80
90
100Contiguous
50
40
30
20
Sen
siti
vity
(%
)Se
nsi
tivi
ty (
%)
60
70
80
90
100
50
40
30
20
60
70
80
90
100
50
40
30
20
Sen
siti
vity
(%
)
60
70
80
90
100
50
40
30
20
Infection or ulcer Multiple
100 8090 6070 4050 102030
CTMRIPETScintigraphySPECTUltrasoundRadiography
Test used
FIGURE 18 Sensitivity and specificity according to likely cause of osteomyelitis.
RESULTS
NIHR Journals Library www.journalslibrary.nihr.ac.uk
38

Comparisons of testsWe also considered studies that compared different imaging tests in people without diabetes. In Appendix 4,Figure 39 shows the difference in DORs between tests within studies (as in Figure 6 for all studies). Thissuggests that PET and SPECT are generally superior to radiography and scintigraphy. Results from logisticregression models to compare the tests are summarised in Table 8 (for full results, see Appendix 4, Table 26).These appear to be similar to the results for all studies overall, but there were limited data on comparisonsbetween tests.
Studies not included in the quantitative synthesis
Of the two adult studies that were not included in any of the above quantitative syntheses, one evaluatedthe accuracy of MRI37 and one compared radiography, CT and radiography + CT72 (Table 9). The results ofboth studies differed somewhat from the meta-analysis and showed worse diagnostic accuracy overall,although these results should be interpreted with caution owing to the relatively small size of the studies.
Abdel Razek and Samir37 conducted a prospective study that evaluated MRI in adults with suspected acutediabetic foot osteomyelitis. MRI had a sensitivity of 65% (95% CI 46% to 85%) and a specificity of 61%(95% CI 39% to 84%). These results differ from the meta-analysis, which found higher sensitivity and
TABLE 8 Comparison of tests in people without diabetes
Parameter Radiography worse than Radiography similar to Radiography better than
DOR MRI, PET and SPECT CT and scintigraphy None
Specificity Too few data to draw conclusions Scintigraphy
MRI worse than MRI similar to MRI better than
DOR None PET, SPECT Scintigraphy and radiography
Specificity Too few data to draw conclusions
100
20
10
0
30
40
50
60
Sen
siti
vity
(%
)
70
80
90
100
90 80 70 60 50 40 30 20 10 0Specificity (%)
Test usedCTMRIPETScintigraphySPECTRadiography
FIGURE 19 Bivariate meta-analysis in studies of people without diabetes.
DOI: 10.3310/hta23610 HEALTH TECHNOLOGY ASSESSMENT 2019 VOL. 23 NO. 61
© Queen’s Printer and Controller of HMSO 2019. This work was produced by Llewellyn et al. under the terms of a commissioning contract issued by the Secretary of State forHealth and Social Care. This issue may be freely reproduced for the purposes of private research and study and extracts (or indeed, the full report) may be included in professionaljournals provided that suitable acknowledgement is made and the reproduction is not associated with any form of advertising. Applications for commercial reproduction shouldbe addressed to: NIHR Journals Library, National Institute for Health Research, Evaluation, Trials and Studies Coordinating Centre, Alpha House, University of Southampton SciencePark, Southampton SO16 7NS, UK.
39

specificity for MRI (see Table 4). Larson et al.72 undertook a retrospective study conducted in patients withsuspected osteomyelitis associated with pelvic pressure ulcers. Results for radiography (sensitivity 88%;specificity 32%), CT (sensitivity 50%; specificity 85%) differed from the meta-analysis, which found lowersensitivity and higher specificity for radiography, and higher sensitivity for CT overall (see Table 4). Thecombination of radiography and CT increased the sensitivity of CT alone, but reduced specificity (sensitivity61%; specificity 69%). This differs from the results of the only other study of radiography+ CT reportedearlier, which found that radiography and CT combined had a sensitivity of 38% and a specificity of 85%(see Studies reporting on combinations of imaging tests).75
Synthesis of studies in children
The three studies of children were conducted in single centres in patients with suspected AOM.52,78,98 Twostudies evaluated ultrasonography,52,78 and two used MRI.78,98 Radiography, scintigraphy and CT wereevaluated in only one study.78
The evidence for the accuracy of ultrasound and MRI in children was mixed and limited overall. Ultrasonographyhad moderate sensitivity (55%, 95% CI 43% to 67%) and specificity (47%, 95% CI 24% to 70%) in82 children with suspected acute haematogenous osteomyelitis,78 but had perfect (100%) sensitivity andspecificity in a study of 27 children with negative or equivocal initial radiographic findings.52 MRI had asensitivity of 81% (95% CI 64% to 93%) and a specificity of 67% (95% CI 22% to 96%) in 38 childrenwith suspected acute haematogenous osteomyelitis,78 but preoperative MRI had 38% sensitivity and 95%specificity in a study of 54 patients with septic hip. A study-by-study summary is provided in Table 10.
Malcius et al.78 conducted a prospective study of 183 hospitalised children with suspected acutehaematogenous osteomyelitis. A total of 169 early radiography (median first day of hospital), 142 lateradiographic assessments (15th day of hospital stay), 82 ultrasonographies (second day), 76 scintigraphies(third day), 38 MRI scans (seventh day) and 17 CT scans (15th day) were conducted. Scintigraphy (99mTc-MDP)was conducted in patients who had an unclear diagnosis based on early radiography and/or ultrasound,and MRI and CT were performed when results from scintigraphy were inconclusive. The reference standardincluded clinical follow-up, microbiology (blood or bone culture) and/or surgery. Acute haematogenousosteomyelitis was confirmed in 156 (85.2%) patients.
Early radiography had low sensitivity (16%, 95% CI 100% to 23%) but high specificity (96%, 95% CI 78% to100%). Late radiography had high sensitivity (82%, 95% CI 75% to 88%) and specificity (92%, 95% CI 62%to 100%).
Ultrasonography had moderate sensitivity (55%, 95% CI 43% to 67%) and specificity (47%, 95% CI 24%to 70%). Bone scintigraphy had high sensitivity (81%, 95% CI 68% to 90%) and specificity (84%, 95% CI60% to 97%).
TABLE 9 Studies not included in the quantitative synthesis
First author andyear of publication n Population Tests
Sensitivity (%)(95% CI)
Specificity (%)(95% CI) DOR
Abdel Razek (2017)37 39 Adults with diabeticfoot ulcer withsuspected AOM
MRI 65 (46 to 85) 61 (39 to 84) NR
Larson (2011)72 44 Adults with pelvicpressure ulcer withsuspected pelvis/hiposteomyelitis
Radiography,CT, CT +radiography
Radiography: 88;CT: 50; CT +radiography: 61
Radiography: 32;CT: 85; CT +radiography: 69
NR
NR, not reported.
RESULTS
NIHR Journals Library www.journalslibrary.nihr.ac.uk
40

TABLE 10 Diagnostic accuracy results of studies in children
First authorand year ofpublication Country Design n Population Tests Reference standard
Sensitivity (%)(95% CI)
Specificity (%)(95% CI) DOR (95% CI)
Malcius (2009)78 Lithuania Prospective 169 Children withsuspected acutehaematogenousosteomyelitis
Early radiography,late radiography,ultrasound, scintigraphy(99mTc-MDP), MRI, CT
Physical examinationand/or microbiology(blood or bone culture)or surgery
Early radiography:16 (1 to 23)
Late radiography:82 (75 to 88)
Ultrasound:55 (43 to 67)
Scintigraphy:81 (68 to 90)
MRI:81 (64 to 93)
CT: 67(38 to 88)
Early radiography:96 (78 to 100)
Late radiography:92 (62 to 100)
Ultrasound:47 (24 to 7)
Scintigraphy:84 (60 to 97)
MRI: 67(22 to 96)
CT: 5(1 to 98)
Early radiography:4.34 (0.63 to 186.3)
Late radiography:51.17 (6.61 to2222.0)
Ultrasound:1.08 (0.30 to 3.84)
Scintigraphy:22.3 (4.9 to 132.7)
MRI: 8.67(0.91 to 108.5)
CT: 2.0(0.02 to 172.4)
Schlung (2016)98 USA Retrospective 54 Children withseptic hipundergoingpreoperative MRI
MRI Positive joint fluidculture or positiveperipheral bloodculture with jointaspirate > 50,000WBCs
37.5 (NR) 94.7 (NR) NR
Ezzat (2011)52 Egypt Prospective 27 Children withsuspected AOMand negative orequivocal plainradiography
Ultrasound (greyscaleand power Doppler)
Surgery, cytology,or clinical follow-up
100 (NR) 100 (NR) NR
NR, not reported.
DOI:10.3310/hta23610
HEA
LTHTECH
NOLO
GYASSESSM
ENT2019
VOL.23
NO.61
©Queen
’sPrinter
andController
ofHMSO
2019.This
work
was
producedby
Llewellyn
etal.
underthe
termsof
acom
missioning
contractissued
bythe
Secretaryof
Statefor
Health
andSocialC
are.This
issuemay
befreely
reproducedfor
thepurposes
ofprivate
researchand
studyand
extracts(or
indeed,the
fullreport)may
beincluded
inprofessional
journalsprovided
thatsuitable
acknowledgem
entismade
andthe
reproductionisnot
associatedwith
anyform
ofadvertising.
Applications
forcom
mercialreproduction
shouldbe
addressedto:
NIHRJournals
Library,NationalInstitute
forHealth
Research,Evaluation,
Trialsand
StudiesCoordinating
Centre,
Alpha
House,
University
ofSoutham
ptonScience
Park,Southam
ptonSO
167N
S,UK.
41

Magnetic resonance imaging had a sensitivity of 81% (95% CI 64% to 93%) and a specificity of 67%(95% CI 22% to 96%), and CT had a sensitivity of 67% (95% CI 38% to 88%) and a specificity of 50%(95% CI 1% to 98%), although results should be interpreted with caution because of the small number ofpatients tested.
Overall, Malcius et al.78 found that scintigraphy and MRI are most valuable for detecting acutehaematogenous osteomyelitis at the onset of the disease, and late radiography is the most valuableradiological method. The comparability of index tests is limited by the fact that more advanced tests wereperformed only in harder-to-diagnose subgroups.
Schlung et al.98 conducted a retrospective study of 83 children with suspected septic hip arthritis, of whom54 underwent preoperative MRI. Osteomyelitis was confirmed by positive joint fluid culture or positiveperipheral blood culture with joint aspirate. The sensitivity of MRI was 38% and the specificity was 95%.Of the 10 false-negative cases missed by MRI, six had a positive femoral aspiration that resulted inappropriate management, but three had significant morbidity owing to missed or delayed diagnosis; resultsfor the remaining patient were not reported.
Ezzat et al.52 conducted a small prospective study of children with suspected AOM with negative orequivocal conventional plain radiography. The accuracy of greyscale and power Doppler ultrasound wasevaluated in 27 children, of whom 23 underwent surgery. Osteomyelitis was confirmed as positive in 25out of 27 patients. Ultrasonography had a sensitivity of 100% and a specificity of 100%. The results ofthis study need to be interpreted with caution because of the limited number of patients.
Review of inter-rater reliability
Characteristics of included studiesTable 11 presents a summary of study and patient characteristics of the 11 studies evaluating theinter-rater reliability of imaging tests for the diagnosis of osteomyelitis.37,58,59,65,68,86,92,114–117
Three studies were conducted in Germany,58,59,65 three in the USA86,92,116 and two in Spain.114,115 A singlestudy was conducted in the following countries: Egypt,37 Switzerland68 and the UK.117 Five studies wereconducted prospectively37,58,59,65,114 and six were retrospective.68,86,92,115–117 One study was conducted inchildren.116 The majority of participants were male. The condition targeted was COM in four studies,58,59,68,117
AOM in one study,37 AOM and COM in one study,65,92 and chronic or subacute osteomyelitis in one study.59,65
Five studies did not report what specific osteomyelitis subtypes were targeted.86,92,114–116 All studies includedexperienced raters, although two studies also involved inexperienced radiologists.114,116
Five studies included patients with diabetic foot ulcer,37,86,92,114,115 one study included patients with traumaor surgery as the suspected cause of osteomyelitis,68 and one included patients with spinal cord injury andpressure ulcers.117 Three studies did not report the cause of osteomyelitis.58,59,65
The inter-rater reliability of the following tests was evaluated: MRI (five studies),37,68,86,116,117 radiography(two studies),114,115 PET (two studies),58,59 scintigraphy (two studies),58,92 scintigraphy + SPECT (one study),65
SPECT/CT (one study)65 and SPECT with CT, MRI or radiography (one study).65 Four studies evaluated theinter-rater reliability of more than one test.58,65,86,92
Critical appraisalTable 12 presents a summary of the results of the critical appraisal. The studies were considered to beof fair quality overall, although most were small and none provided satisfactory measures of intra-raterreliability (the degree of agreement among repeated administrations of a test by a single rater).
RESULTS
NIHR Journals Library www.journalslibrary.nihr.ac.uk
42
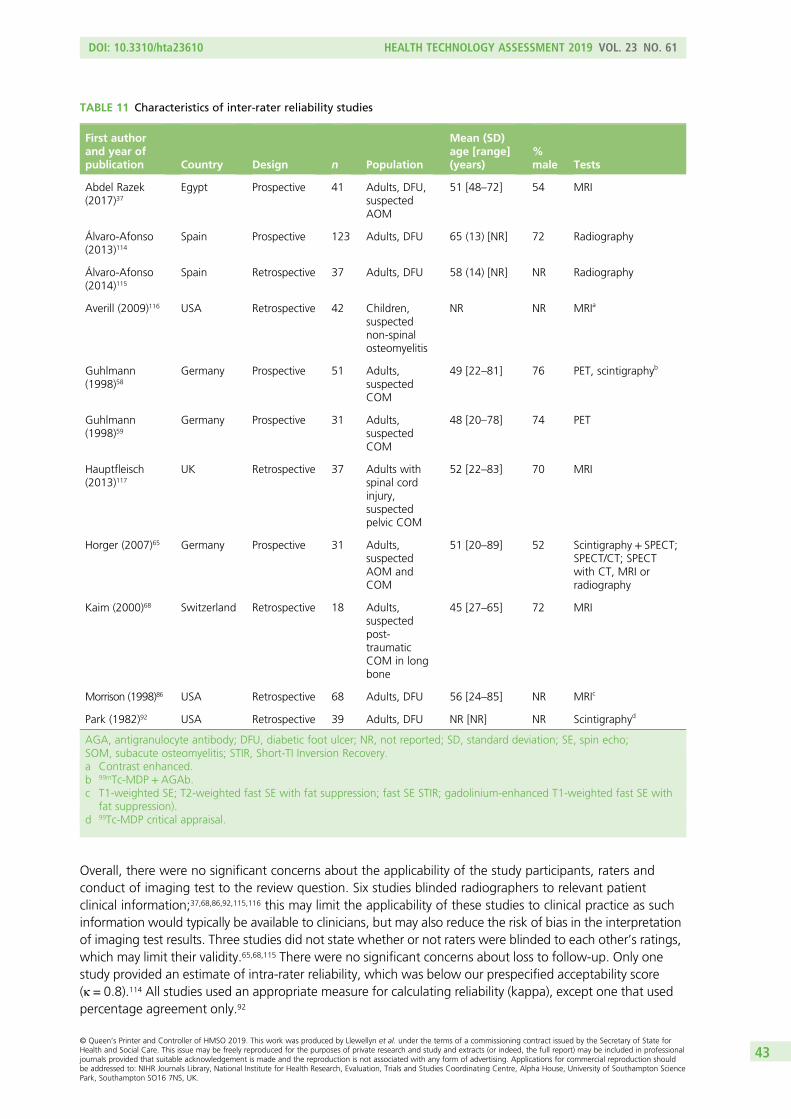
Overall, there were no significant concerns about the applicability of the study participants, raters andconduct of imaging test to the review question. Six studies blinded radiographers to relevant patientclinical information;37,68,86,92,115,116 this may limit the applicability of these studies to clinical practice as suchinformation would typically be available to clinicians, but may also reduce the risk of bias in the interpretationof imaging test results. Three studies did not state whether or not raters were blinded to each other’s ratings,which may limit their validity.65,68,115 There were no significant concerns about loss to follow-up. Only onestudy provided an estimate of intra-rater reliability, which was below our prespecified acceptability score(κ = 0.8).114 All studies used an appropriate measure for calculating reliability (kappa), except one that usedpercentage agreement only.92
TABLE 11 Characteristics of inter-rater reliability studies
First authorand year ofpublication Country Design n Population
Mean (SD)age [range](years)
%male Tests
Abdel Razek(2017)37
Egypt Prospective 41 Adults, DFU,suspectedAOM
51 [48–72] 54 MRI
Álvaro-Afonso(2013)114
Spain Prospective 123 Adults, DFU 65 (13) [NR] 72 Radiography
Álvaro-Afonso(2014)115
Spain Retrospective 37 Adults, DFU 58 (14) [NR] NR Radiography
Averill (2009)116 USA Retrospective 42 Children,suspectednon-spinalosteomyelitis
NR NR MRIa
Guhlmann(1998)58
Germany Prospective 51 Adults,suspectedCOM
49 [22–81] 76 PET, scintigraphyb
Guhlmann(1998)59
Germany Prospective 31 Adults,suspectedCOM
48 [20–78] 74 PET
Hauptfleisch(2013)117
UK Retrospective 37 Adults withspinal cordinjury,suspectedpelvic COM
52 [22–83] 70 MRI
Horger (2007)65 Germany Prospective 31 Adults,suspectedAOM andCOM
51 [20–89] 52 Scintigraphy + SPECT;SPECT/CT; SPECTwith CT, MRI orradiography
Kaim (2000)68 Switzerland Retrospective 18 Adults,suspectedpost-traumaticCOM in longbone
45 [27–65] 72 MRI
Morrison (1998)86 USA Retrospective 68 Adults, DFU 56 [24–85] NR MRIc
Park (1982)92 USA Retrospective 39 Adults, DFU NR [NR] NR Scintigraphyd
AGA, antigranulocyte antibody; DFU, diabetic foot ulcer; NR, not reported; SD, standard deviation; SE, spin echo;SOM, subacute osteomyelitis; STIR, Short-TI Inversion Recovery.a Contrast enhanced.b 99mTc-MDP + AGAb.c T1-weighted SE; T2-weighted fast SE with fat suppression; fast SE STIR; gadolinium-enhanced T1-weighted fast SE with
fat suppression).d 99Tc-MDP critical appraisal.
DOI: 10.3310/hta23610 HEALTH TECHNOLOGY ASSESSMENT 2019 VOL. 23 NO. 61
© Queen’s Printer and Controller of HMSO 2019. This work was produced by Llewellyn et al. under the terms of a commissioning contract issued by the Secretary of State forHealth and Social Care. This issue may be freely reproduced for the purposes of private research and study and extracts (or indeed, the full report) may be included in professionaljournals provided that suitable acknowledgement is made and the reproduction is not associated with any form of advertising. Applications for commercial reproduction shouldbe addressed to: NIHR Journals Library, National Institute for Health Research, Evaluation, Trials and Studies Coordinating Centre, Alpha House, University of Southampton SciencePark, Southampton SO16 7NS, UK.
43

Results of inter-rater reliability studiesTable 13 presents the results of the studies of inter-rater reliability. Overall, the tests that showed the bestinter-rater reliability were PET (κ = 0.93 and 0.96, two studies)58,59 and scintigraphy (κ = 0.91 and 95%agreement, two studies).58,92 The inter-rater reliability of MRI ranged from substantial to near perfect(κ = 0.71 to 0.93, five studies).37,68,86,116,117 The inter-rater reliability of radiography ranged from fair tosubstantial (κ = 0.35 to 0.40 in one study and κ = 0.77 in one study).114,115 One study found near-perfectagreement between raters for SPECT/CT (κ = 0.86) and SPECT with CT, MRI or radiography (κ = 0.87), andmoderate agreement for scintigraphy + SPECT (κ = 0.54).65 There was no evidence that results differedaccording to radiographer experience or patient population.
Review of implementation
One study of implementation was identified by the review.118
Govaert et al.118 was a survey of orthopaedic and trauma surgeons, radiologists and nuclear medicinephysicians in the Netherlands on preferred imaging strategies for diagnosing post-traumatic osteomyelitis.The 16-question survey included four patient-based clinical cases of fracture-related osteomyelitis. Eachcase included relevant medical history of the patient combined with a clinical picture of the affected limband radiographic results. Participants were asked to select which imaging test(s) they considered mostappropriate to diagnose or exclude the presence of post-traumatic osteomyelitis.
TABLE 12 Critical appraisal of inter-rater reliability studies
First author and year of publication
Question
1 2 3 4 5 6 7 8 9 10
Abdel Razek (2017)37 Y Y Y N Y Y Y Y N Y
Álvaro-Afonso (2013)114 Y Y Y N Y Y Y Y Na Y
Álvaro-Afonso (2014)115 Y Y Y Y Y Y UCb Y N Y
Averill (2009)116 Y Y Y N Y Y Y Y N Y
Guhlmann (1998)58 Y Y Y Y Y Y Y Y N Y
Guhlmann (1998)59 Y Y Y Y Y Y Y Y N Y
Hauptfleisch (2013)117 Y Y Y UCb Y Y Y UCb N Y
Horger (2007)65 Y Y Y Y Y Y UCb Y N Y
Kaim (2000)68 Y Y Y N Y Y UCb Y N Y
Morrison (1998)86 Y UCb Y N Y Y Y UCc N Y
Park (1982)92 Y Y Y N Y Y Y Y N N
N, no; UC, unclear; Y, yes.a Experienced 0.75, p < 001; moderately experienced 0.61, p < 001; inexperienced clinicians 0.57, p < 001.b Insufficient information reported.c Differing sample sizes for each subtest.NotesReproduced from van de Pol et al. (2010).32 See www.elsevier.com/about/policies/open-access-licenses/elsevier-user-license.Questions: 1. Was a representative sample of participants used? 2. Was a representative sample of raters used? 3. Is replication ofthe measurement procedure possible? 4. Was clinical information from participants available to raters and comparable to clinicalpractice? 5. Were participants’ characteristics stable during the study? 6. Were raters’ characteristics stable during the study?7. Were raters blinded to each other’s results? 8. Can non-random loss to follow-up be ruled out? 9. Was an estimate ofintra-rater reliability validly determined and was it above 0.80? 10. Were appropriate measures used for calculating reliability?
RESULTS
NIHR Journals Library www.journalslibrary.nihr.ac.uk
44

TABLE 13 Results of inter-rater reliability studies
First author and yearof publication Population Test Raters (n)
Replicateobservations (n)
Ratersexperience Result p-value
Abdel Razek (2017)37 Adults, DFU, suspectedAOM
MRI 2 NR Experienceda κ = 0.93 NR
Averill (2009)116 Children, multiple MRI 2 42 Inexperienced vs.very experiencedb
κ = 0.72 (95% CI 0.52 to 0.92) NR
Hauptfleisch (2013)117 Adults with spinal cordinjury, suspected pelvicCOM
MRI 2 41 Experienced κ = 0.92 (95% CI 0.84 to 1.01);agreement 88%
< 0.0001
Kaim (2000)68 Adults, suspectedpost-traumatic COM in longbone
MRI 2 19 Experienced κ = 0.88 NR
Morrison (1998)86 Adults, DFU (85%), others(15%)
MRIc 2 57 to 71d Experienced κ = 0.71 to 0.92e NR
Guhlmann (1998)59 Adults, suspectedpost-traumatic COM
PET 2 31 Experienced κ = 0.93 NR
Guhlmann (1998)58 Adults, suspectedpost-traumatic COMf
PET; scintigraphyg
2 51 Experienced PET, κ = 0.96; scintigraphy,κ = 0.91
NR
Park (1982)92 Adults, DFU with suspectedAOM and COM
Scintigraphyh 3 36 Experiencedi 95% agreement NR
Horger (2007)65 Adults with suspected AOMand COM, musculoskeletalinfection
Scintigraphy+ SPECT;SPECT/CT; SPECT with CT,MRI or radiography
2 31 Experienced Scintigraphy+ SPECT, κ = 0.54;SPECT/CT, κ = 0.86; SPECT withCT, MRI or radiography, κ = 0.87
NR
Álvaro-Afonso (2013)114 Adults, DFU Radiography 6 369 (123 × 3) Inexperienced tovery experienced
jκ = 0.35 to 0.40k < 0.001
Álvaro-Afonso (2014)115 Adults, DFU Radiography 2 NR Experienced κ = 0.77 < 0.01
AGA, antigranulocyte antibody; DFU, diabetic foot ulcer; NR, not reported; SE, shot echo; STIR, short-TI intervension recovery.a 10 and 20 years.b 20 years vs. limited (paediatric fellow).c T1-weighted SE; T2-weighted fast SE with fat suppression; fast SE STIR; gadolinium-enhanced T1-weighted fast SE with fat suppression.d T1-weighted SE: 71; T2-weighted fast SE with fat suppression: 71; fast SE STIR: 42; gadolinium-enhanced T1-weighted fast SE with fat suppression: 57.e T1-weighted SE: 0.91; T2-weighted fast SE with fat suppression: 0.71; fast SE STIR: 0.72; gadolinium-enhanced T1-weighted fast SE with fat suppression: 0.92.f ≥ 23% had indwelling work.g 99mTc-MDP+ AGAb.h 99Tc-MDP.i ≥ 7 years.j Two inexperienced, two moderately experienced, two very experienced.k 0.35 (very experienced), 0.39 (moderately experienced), 0.40 (inexperienced).
DOI:10.3310/hta23610
HEA
LTHTECH
NOLO
GYASSESSM
ENT2019
VOL.23
NO.61
©Queen
’sPrinter
andController
ofHMSO
2019.This
work
was
producedby
Llewellyn
etal.
underthe
termsof
acom
missioning
contractissued
bythe
Secretaryof
Statefor
Health
andSocialC
are.This
issuemay
befreely
reproducedfor
thepurposes
ofprivate
researchand
studyand
extracts(or
indeed,the
fullreport)may
beincluded
inprofessional
journalsprovided
thatsuitable
acknowledgem
entismade
andthe
reproductionisnot
associatedwith
anyform
ofadvertising.
Applications
forcom
mercialreproduction
shouldbe
addressedto:
NIHRJournals
Library,NationalInstitute
forHealth
Research,Evaluation,
Trialsand
StudiesCoordinating
Centre,
Alpha
House,
University
ofSoutham
ptonScience
Park,Southam
ptonSO
167N
S,UK.
45

There were 346 responders, comprising 153 trauma surgeons, 104 orthopaedic surgeons, 56 nuclearmedicine physicians and 33 musculoskeletal radiologists. There was consensus on the usefulness ofradiography in patients with a late infection, but not in patients with acute infection. There was a markeddifference between trauma surgeons, and orthopaedic surgeons’ choice of nuclear medicine imaging for lateinfection: trauma surgeons preferred PET and orthopaedic surgeons favoured WBC scintigraphy. Similarly,there was a consistent difference between radiologists and nuclear medicine physicians: musculoskeletalradiologists favoured MRI whereas nuclear medicine clinicians preferred PET/CT. CT and three-phase boneimaging for late fracture-related infections were favoured by orthopaedic surgeons and some musculoskeletalradiologists, but not by trauma surgeons or nuclear medicine physicians. Ultrasound-guided biopsy wasregarded by all physicians to have some role in patients with early infection but was not popular for lateinfections. Preference of imaging was influenced by access to equipment, with clinicians selecting imagingmethods they had access to in their own hospital.
Summary of previous systematic reviews
The systematic database searches identified 11 previous systematic reviews of the diagnosis ofosteomyelitis.20–30 Most of the studies included in these reviews were also included in this review, althoughsome did not meet our inclusion criteria. The previous reviews are summarised in Table 14.
Four of these reviews considered primarily, or only, people with diabetic foot ulcers.20,22,23,26 Theirconclusions varied, depending on the tests included, but MRI, PET and WBC scintigraphy were allsuggested as suitable imaging tests.
The Lauri et al.23 review, which is the most recent review of patients with diabetic foot osteomyelitis,concluded that MRI, PET and WBC scintigraphy have similar sensitivity, but MRI has lower specificity.This is similar to the findings of this review.
Three reviews of osteomyelitis in the general population mostly recommended PET and SPECT as havingthe best diagnostic accuracy,25,27,28 but that leucocyte scintigraphy could be useful in some cases, such asfor COM in the peripheral skeleton,25 or when PET is unavailable.28 Only one of these three reviewsconsidered MRI.25 One review focused on patients with peripheral post-traumatic osteomyelitis andconcluded that WBC [or antigranulocyte antibody (AGA)] scintigraphy with SPECT/CT or 18F-FDG-PET/CThas the best diagnostic accuracy in this population.21 Another review of MRI in patients with pressureulcers was inconclusive owing to insufficient evidence.29
Only two reviews considered osteomyelitis in children. One focused on calcaneal osteomyelitis. The reviewincluded only three diagnostic accuracy studies and was inconclusive owing to the limited evidence.24 Onereview focused on haematogenous acute and subacute paediatric osteomyelitis.30 The review included threestudies of radiography that showed low sensitivity (16–20%) but high specificity (80–100%). 99Tc boneimaging had variable sensitivity (53–100%) and specificity (50–100%) (three studies). MRI had the highestsensitivity (80–100%) and specificity (70–100%) (five studies), compared with CT (sensitivity 67%, specificity50%, two studies) and ultrasound (sensitivity 55%, specificity 47%, one study). Only one of the studiesincluded in this review met our inclusion criteria, which was the largest and most comprehensive study inchildren.78 Overall, the diagnostic accuracy findings of this review broadly agree with the evidence in adults.
Clinical effectiveness summary and conclusions
Summary of included studiesThe review of diagnostic accuracy included 77 studies. Nearly one-quarter of the studies were consideredto be at a high risk of bias.
RESULTS
NIHR Journals Library www.journalslibrary.nihr.ac.uk
46

TABLE 14 Summary of previous systematic reviews
First author andyear of publication Studies (n) Osteomyelitis Index test(s) Meta-analysis Main findings Conclusions
Dartnell (2012)30 7 Haematogenous acuteand subacute paediatricosteomyelitis
Any No Radiography: sensitivity 16–20%,specificity 80–100%
99Tc scintigraphy: sensitivity53–100%, specificity 50–100%
MRI: sensitivity 80–100%,specificity 70–100%
CT: sensitivity 67%, specificity50%
Ultrasound: sensitivity 55%,specificity 47%
Radiographs are essential forexclusion of other diagnoses.MRI is the gold-standard imagingtechnique. If unavailable or adelay is likely, bone andultrasound scans usually giveadequate diagnostic information
Dinh (2008)20 9 Diabetic foot osteomyelitis Any Yes Radiography: sensitivity 54%,specificity 68%, DOR 2.84
MRI: sensitivity 90%, specificity79%, DOR 24.36
Scintigraphy: sensitivity 81%,specificity 28%, DOR 2.10
WBC scintigraphy: sensitivity74%, specificity 68%, DOR 10.07
MRI is the most accurate imagingtest for DFO
Govaert (2017)21 10 Peripheral post-traumatic Any No WBC scintigraphy: sensitivity50–100%, specificity 0–97%
PET: sensitivity 83–100%,specificity 51–100%
PET/CT: sensitivity 86–94%,specificity 76–100%
WBC scintigraphy + SPECT/CT:sensitivity 100%, specificity89–97%
WBC (or AGA) scintigraphy withSPECT/CT or 18F-FDG/CT havethe best diagnostic accuracy forperipheral PTO
continued
DOI:10.3310/hta23610
HEA
LTHTECH
NOLO
GYASSESSM
ENT2019
VOL.23
NO.61
©Queen
’sPrinter
andController
ofHMSO
2019.This
work
was
producedby
Llewellyn
etal.
underthe
termsof
acom
missioning
contractissued
bythe
Secretaryof
Statefor
Health
andSocialC
are.This
issuemay
befreely
reproducedfor
thepurposes
ofprivate
researchand
studyand
extracts(or
indeed,the
fullreport)may
beincluded
inprofessional
journalsprovided
thatsuitable
acknowledgem
entismade
andthe
reproductionisnot
associatedwith
anyform
ofadvertising.
Applications
forcom
mercialreproduction
shouldbe
addressedto:
NIHRJournals
Library,NationalInstitute
forHealth
Research,Evaluation,
Trialsand
StudiesCoordinating
Centre,
Alpha
House,
University
ofSoutham
ptonScience
Park,Southam
ptonSO
167N
S,UK.
47

TABLE 14 Summary of previous systematic reviews (continued )
First author andyear of publication Studies (n) Osteomyelitis Index test(s) Meta-analysis Main findings Conclusions
Kapoor (2007)22 17 Foot osteomyelitis (mainlydiabetic)
MRI, scintigraphyand radiography
Yes MRI: DOR 42.1 (95% CI 14.8 to119.9)
MRI vs. scintigraphy (n = 7): DOR149.9 vs. 3.6
MRI vs. radiography (n = 9): DOR81.5 vs. 3.3
MRI vs. WBC (n = 3): DOR 120.3vs. 3.4
Accuracy of MRI was markedlysuperior to that of 99mTc bonescanning, plain radiography andWBC
Lauri (2017)23 29 Diabetic foot osteomyelitis MRI, PET, WBCscintigraphy
Yes PET: sensitivity 89%, specificity92%, DOR 95
WBC 111In scintigraphy: sensitivity92%, specificity 75%,DOR 34
WBC 99mTc-HMPAO: sensitivity91%, specificity 92%, DOR 118
MRI: sensitivity 93%, specificity75%, DOR 37
MRI, PET and WBC have similarsensitivities, PET and WBC havehighest specificities
Mooney (2017)24 3 Children (calcanealosteomyelitis)
MRI andradiography
No MRI: accuracy 100%
Radiography: accuracy 14–71.4%
No clear approach to diagnosis ofcalcaneal osteomyelitis in children
RESULTS
NIHRJournals
Librarywww.journalslibrary.nihr.ac.uk
48

First author andyear of publication Studies (n) Osteomyelitis Index test(s) Meta-analysis Main findings Conclusions
Termaat (2005)25 23 General (chronic) Any Yes PET: sensitivity 96% (95% CI88% to 99%), specificity 91%(95% CI 81% to 95%)
Bone scintigraphy: sensitivity 82%(95% CI 70% to 89%), specificity25% (95% CI 16% to 36%)
Leucocyte scintigraphy: sensitivity61% (95% CI 43% to 76%),specificity 77% (95% CI 63% to87%)
Bone +WBC scintigraphy:sensitivity 78% (95% CI 72% to83%), specificity 84% (95% CI75% to 90%)
MRI: sensitivity 84% (95% CI69% to 92%), specificity 60%(95% CI 38% to 78%)
PET has highest accuracy.Leucocyte scintigraphy has anappropriate accuracy in theperipheral skeleton, but 18F-FDG-PETis superior in the axial skeleton
Treglia (2013)26 9 Diabetic foot osteomyelitis PET Yes PET: sensitivity 74% (95% CI60% to 85%), specificity 91%(95% CI 85% to 96%), DOR16.96 (95% CI 2.1 to 139.7),AUC 0.874
18F-FDG-PET and PET/CT showedhigh specificity and are potentiallyuseful if combined with otherimaging methods such as MRI,although data are limited
van der Bruggen(2010)27
11 General PET No PET: sensitivity 94–100%,specificity 87–100%
18F-FDG-PET is also useful fordiagnosis of osteomyelitis withimproved spatial resolution overSPECT imaging, allowing moreaccurate localisation. Localisationcan be further improved byadding CT
continued
DOI:10.3310/hta23610
HEA
LTHTECH
NOLO
GYASSESSM
ENT2019
VOL.23
NO.61
©Queen
’sPrinter
andController
ofHMSO
2019.This
work
was
producedby
Llewellyn
etal.
underthe
termsof
acom
missioning
contractissued
bythe
Secretaryof
Statefor
Health
andSocialC
are.This
issuemay
befreely
reproducedfor
thepurposes
ofprivate
researchand
studyand
extracts(or
indeed,the
fullreport)may
beincluded
inprofessional
journalsprovided
thatsuitable
acknowledgem
entismade
andthe
reproductionisnot
associatedwith
anyform
ofadvertising.
Applications
forcom
mercialreproduction
shouldbe
addressedto:
NIHRJournals
Library,NationalInstitute
forHealth
Research,Evaluation,
Trialsand
StudiesCoordinating
Centre,
Alpha
House,
University
ofSoutham
ptonScience
Park,Southam
ptonSO
167N
S,UK.
49

TABLE 14 Summary of previous systematic reviews (continued )
First author andyear of publication Studies (n) Osteomyelitis Index test(s) Meta-analysis Main findings Conclusions
Wang (2011)28 23 General PET, scintigraphy Yes PET: sensitivity 92%, specificity92%, AUC 0.97
Scintigraphy: sensitivity 83%,specificity 45%, AUC 0.65
Leucocyte scintigraphy: sensitivity74%, specificity 88%, AUC 0.91
MOAB scintigraphy: sensitivity88%, specificity 71%, AUC 0.89
PET is superior to scintigraphy,but leucocyte scintigraphy isreasonable if PET is unavailable
Xu (2017)29 3 Pressure ulcer MRI No Sensitivity 98% and 94.3%,specificity 89% and 22.2%.NR for 3rd study
Insufficient evidence
AGA, antigranulocyte antibody; AUC, area under the curve; DFO, diabetic foot ulcer; MOAB, monoclonal antigranulocyte antibody; NR, not reported; PTO, post-traumatic osteomyelitis.
RESULTS
NIHRJournals
Librarywww.journalslibrary.nihr.ac.uk
50

The review of inter-rater reliability identified 11 studies. The studies were considered of fair quality overall,although most were small and none provided satisfactory measures of intra-rater reliability.
Only one study on the implementation of diagnostic test imaging for osteomyelitis from the Netherlandswas included. The applicability of its findings to other health-care systems is uncertain.
General conclusions from synthesisIn adults, MRI, PET and SPECT scans all had summary sensitivity and specificity of between 80% and 95%.Similarly, they had PPVs between 85% and 93%, and NPVs between 85% and 97%. All had similar DORsand summary HSROC curves, suggesting that overall diagnostic accuracy was similar across the three tests.Despite this good performance, MRI and SPECT showed a very high variability in specificity across studies;for MRI, specificity ranged from 0% to 98%. Results for PET were generally more consistent.
Radiography and CT generally had lower sensitivity, and scintigraphy had lower specificity than MRI, PETand SPECT. Radiography, CT and scintigraphy all had substantially lower DORs than MRI, PET or SPECT,suggesting poorer diagnostic performance in general. Formal comparisons of the tests in studies thatanalysed multiple imaging tests confirmed the above conclusions. These analyses also confirmed that MRIgenerally has higher sensitivity, but lower specificity, than PET.
There were only two studies of ultrasound, which were not consistent in their findings, so no conclusionson the diagnostic value of ultrasound can be drawn.
The diagnostic accuracy of scintigraphy depended on the type of scintigraphy performed. Althoughsensitivity was similar across types of scintigraphy (75% to 92%), specificity was poor for 99mTc-(H)MDP(at 36% to 46%), but high for 99mTc-HMPAO WBC (94%) and mixed for 111In WBC and 99mTc-MDPscintigraphy (88%). This suggests that newer forms of scintigraphy have diagnostic accuracy similar to MRI,PET and SPECT. This is perhaps unsurprising as most SPECT studies used 99mTc-HMPAO WBC imaging.
No other differences in performance within tests were identified. In particular, there was no evidence thatSPECT/CT differed from SPECT alone, or that PET/CT and PET alone differed in diagnostic accuracy. Ingeneral, there were too few data reported to distinguish between subtypes of test and few studies comparedsubtypes of test. In particular, we found no evidence on the impact of contrast agents for MRI.
There was some evidence that the specificity of MRI declined as the incidence of osteomyelitis in the studypopulation increased. This might suggest that there is overdiagnosis of osteomyelitis when using MRI,particularly when most people tested will have osteomyelitis, perhaps because of a desire not to missactual cases.
Few studies described the diagnostic accuracy when combining different tests, such as combiningscintigraphy and SPECT. There was no evidence that test combinations improved diagnostic accuracycompared with using a single test (MRI, PET or SPECT). Some studies were of patients who had alreadyreceived radiography prior to their main imaging test. There was some suggestion that performingradiography before MRI could improve diagnostic accuracy, but this was not conclusive.
Diagnostic accuracy by cause or nature of osteomyelitisThe largest group of people receiving imaging tests for osteomyelitis were people with diabetic foot ulcers,representing nearly half of the included studies. Results were broadly consistent with the overall analysis.MRI (96% sensitivity, 84% specificity) and PET (79% sensitivity, 92% specificity) both had high diagnosticaccuracy, with MRI having higher sensitivity but lower specificity. 99mTc-HMPAO scintigraphy had highaccuracy (92% sensitivity, 89% specificity), comparable to that of PET and MRI.
In studies of people without diabetes, a range of locations (including long bones, pelvis, knee, hip, spine andskull) and a range of possible causes of osteomyelitis (including infections, trauma and surgery) were tested.
DOI: 10.3310/hta23610 HEALTH TECHNOLOGY ASSESSMENT 2019 VOL. 23 NO. 61
© Queen’s Printer and Controller of HMSO 2019. This work was produced by Llewellyn et al. under the terms of a commissioning contract issued by the Secretary of State forHealth and Social Care. This issue may be freely reproduced for the purposes of private research and study and extracts (or indeed, the full report) may be included in professionaljournals provided that suitable acknowledgement is made and the reproduction is not associated with any form of advertising. Applications for commercial reproduction shouldbe addressed to: NIHR Journals Library, National Institute for Health Research, Evaluation, Trials and Studies Coordinating Centre, Alpha House, University of Southampton SciencePark, Southampton SO16 7NS, UK.
51

The numbers of studies in any category were small so the ability to compare studies was limited. There was,however, no clear evidence that location or cause of osteomyelitis had any impact on the diagnosticaccuracy of any imaging test.
When combining all studies of people without diabetes, the results were similar to the overall results andto those in people with diabetic foot ulcers. MRI (94% sensitivity, 72% specificity), PET (88% sensitivity,90% specificity) and SPECT (96% sensitivity, 95% specificity) all had high diagnostic accuracy, althoughdiagnostic accuracy was poorer for radiography, scintigraphy and CT.
Overall, there was no statistically significant evidence that diagnostic accuracy of any test varies accordingto the location or possible cause of osteomyelitis. The choice of tests did vary, with MRI most studied inpeople with diabetic foot ulcers. SPECT, by contrast, has been little studied in people with diabetes.
Studies of children, inter-rater reliability and implementationOnly three studies of children were identified. The evidence for the accuracy of ultrasound and MRI in childrenwas mixed and limited overall. Only one study evaluated radiography, scintigraphy and CT in children.
There was some evidence to suggest that MRI has an acceptable degree of agreement among radiologists.The evidence for the inter-rater reliability of other imaging tests was very limited.
There is also very limited evidence on the implementation of imaging tests for the diagnosis ofosteomyelitis. Notably, there is a lack of evidence on patient preferences and on the cost-effectiveness ofdiagnostic imaging tests and pathways for osteomyelitis.
RESULTS
NIHR Journals Library www.journalslibrary.nihr.ac.uk
52

Chapter 5 Discussion
Statement of principal findings
This systematic review identified 81 studies relating to imaging tests for the diagnosis of osteomyelitis.Seventy-seven of these were studies of diagnostic accuracy, of which 69 reported diagnostic accuracy datasufficient to be included in a quantitative synthesis. Thirty-six diagnostic accuracy studies were in patientswith diabetic foot ulcers, and 40 were in patients without diabetes.
Eleven studies evaluated the inter-rater reliability of at least one imaging test and one study provided dataon clinician opinions on imaging tests for osteomyelitis.
Overall, most diagnostic accuracy studies were small (80% had < 50 participants) and nearly one-quarterwere considered as being at a high risk of bias, although poor reporting means that there is significantuncertainty about the quality of most of the studies. The studies of inter-rater reliability were considered offair quality overall, although most were small and none provided satisfactory measures of intra-rater reliability.
Only one study from the Netherlands on the implementation of diagnostic test imaging for osteomyelitiswas included.118 The applicability of its findings to other health-care systems is uncertain.
Diagnostic accuracy in adultsThe overall meta-analysis of diagnostic accuracy in adults found that MRI (the most widely studied test) candetect osteomyelitis with high accuracy (95.6% sensitivity, 95% CI 92.3% to 97.5%; 80.7% specificity,95% CI 70.7% to 87.8%). There was, however, considerable variation in the specificity across tests. Thismay partly be as a result of the overdiagnosis of osteomyelitis, particularly in studies with a high incidenceof osteomyelitis.
Positron emission tomography also had high diagnostic accuracy (85.1% sensitivity, 95% CI 71.5% to92.9%; 92.7% specificity, 95% CI 83.0% to 97.1%), with lower sensitivity, but higher specificity, thanMRI. SPECT also had high accuracy (95.0% sensitivity, 95% CI 87.8% to 98.1%; 82.0% specificity,95% CI 61.5% to 92.8%). There was no evidence that PET alone differed in accuracy from PET/CT, northat SPECT differed from SPECT/CT. MRI, PET and SPECT all had similar DORs and summary HSROC curves,suggesting that the three imaging tests have broadly similar diagnostic performance.
Scintigraphy (83.6% sensitivity, 95% CI 71.8% to 91.1%; 70.1% specificity, 95% CI 57.7% to 80.8%),CT (69.7% sensitivity, 95% CI 40.1% to 88.7%; 90.2% specificity, 95% CI 57.6% to 98.4%) andradiography (70.3% sensitivity, 95% CI 61.6% to 77.8%; 81.5% specificity, 95% CI 69.6% to 89.4%) allhad generally inferior diagnostic accuracy to MRI, PET or SPECT. This was confirmed by their lower DORsand poorer HSROC curves. There was evidence that the diagnostic accuracy of scintigraphy depended onthe type of scintigraphy used. The most up-to-date forms of scintigraphy, such as 99mTc HMPAO WBCscintigraphy (87.3% sensitivity, 95% CI 75.1% to 94.0%; 94.7% specificity, 95% CI 84.9% to 98.3%)had higher diagnostic accuracy, similar to that of PET or MRI. However, its estimated sensitivity was lowerthan for 3D SPECT imaging.
There were insufficient studies of ultrasound to assess its diagnostic accuracy.
Comparisons and combinations of diagnostic testsIn studies that compared two or more imaging tests, informal and formal comparisons of these testsconfirmed the findings discussed above. MRI, PET and SPECT all had similar diagnostic accuracy in terms of
DOI: 10.3310/hta23610 HEALTH TECHNOLOGY ASSESSMENT 2019 VOL. 23 NO. 61
© Queen’s Printer and Controller of HMSO 2019. This work was produced by Llewellyn et al. under the terms of a commissioning contract issued by the Secretary of State forHealth and Social Care. This issue may be freely reproduced for the purposes of private research and study and extracts (or indeed, the full report) may be included in professionaljournals provided that suitable acknowledgement is made and the reproduction is not associated with any form of advertising. Applications for commercial reproduction shouldbe addressed to: NIHR Journals Library, National Institute for Health Research, Evaluation, Trials and Studies Coordinating Centre, Alpha House, University of Southampton SciencePark, Southampton SO16 7NS, UK.
53

DORs. MRI had higher sensitivity but poorer specificity than PET. Scintigraphy (all types combined),radiography and CT all had lower DORs than MRI, PET or SPECT.
In studies that reported the diagnostic accuracy of combinations of imaging tests (e.g. of the combinationof scintigraphy and SPECT), there was no clear evidence that combining tests improved diagnostic accuracyover using a single test alone, although data were limited.
Studies were generally not clear about whether or not radiography was performed prior to the mainimaging test. It was possible that prior use of radiography could improve diagnostic accuracy ofscintigraphy or MRI, but data were limited and results were not statistically significant.
Subgroups of patientsThe main patient subgroup was patients in whom osteomyelitis was suspected as a complication ofdiabetic foot ulcers. This group represented nearly half of all included studies. The results of meta-analysesin these patients were similar to those from the main meta-analysis, except that there were too few studiesof SPECT or CT to reliably assess diagnostic accuracy. There was no evidence to suggest that diagnosticaccuracy in patients with diabetic foot ulcers differed from the overall analysis.
Studies of patients without diabetes were divided according to scan location (axial skeleton, long bone,etc.) and by potential cause of osteomyelitis (trauma or surgery, infection, etc.). Data within each categorywere generally limited, but there was no clear evidence that diagnostic accuracy varied by scan location orcause, or that results differed substantially from the main analysis.
When all studies of patients without diabetes were combined, results were generally similar to the overallanalyses. There was some suggestion that the specificity of MRI and PET was lower than in the overallanalysis, but CIs were too wide for this to be conclusive.
Few studies reported whether osteomyelitis was acute or chronic, but there was no compelling evidencethat this affected diagnostic accuracy. Similarly, there was no evidence that the presence of indwellingmetalwork or the choice of reference standard test (microbiology or clinical follow-up) altered diagnosticaccuracy. There was no evidence of systematic bias in the results; diagnostic accuracy did not appear tovary according to risk of bias as assessed using QUADAS-2.
Diagnostic tests in childrenThe evidence for the accuracy of ultrasound and MRI in children was mixed and limited overall.Ultrasonography had moderate sensitivity and specificity in children with suspected acute haematogenousosteomyelitis but had perfect sensitivity and specificity in a small study of children with negative orequivocal initial radiographic findings. MRI had good sensitivity and specificity in children with suspectedacute haematogenous osteomyelitis in one study,78 but preoperative MRI had poor sensitivity and near-perfect specificity in another study of patients with septic hip.98
Inter-rater reliability and implementationMagnetic resonance imaging appeared to have acceptable inter-rater reliability. There was some evidencesuggesting that PET and scintigraphy had near-perfect inter-rater reliability, although this is limited to fewsmall studies.58,59,92 We found no evidence on patient preferences and cost-effectiveness of imaging testsfor osteomyelitis.
Strengths and limitations of the assessment
StrengthsThis systematic review was conducted in accordance with PRISMA guidelines; searches of numerousdatabases were performed, studies were assessed for quality using the QUADAS-2 framework and,
DISCUSSION
NIHR Journals Library www.journalslibrary.nihr.ac.uk
54
provided they reported sufficient data, studies were synthesised using bivariate meta-analysis methods toassess diagnostic accuracy.
Over 18,000 database records were assessed and 81 published studies were included in this review,making it the largest and most comprehensive review of the diagnosis of osteomyelitis to date. This wasthe first review in the field to consider all relevant imaging tests across all types of patient receivingimaging tests to diagnose osteomyelitis. This was, therefore, the first review to our knowledge that wasable to comprehensively compare imaging tests and to investigate whether or not the choice of imagingtest varies with type of patient.
This review used recommended contemporary meta-analysis methods such as bivariate analysis and HSROCanalysis to synthesise studies, so the synthesis is robust and meets the highest statistical standards. This wasthe first meta-analysis of osteomyelitis and, to our knowledge, the first practical diagnostic meta-analysisin any field, to use regression models to formally compare different diagnostic tests. This made it the firstanalysis to comprehensively and reliably compare the various imaging tests for osteomyelitis.
LimitationsThe limitations of this review are largely a consequence of the limitations in the identified studies.
There were numerous concerns about the potential for bias in the included studies. Most studies weresmall, with < 50 participants, and were conducted retrospectively. The risk-of-bias assessment suggestedpotential bias because of unclear methods of patient selection and lack of blinding between index testsand references standards. However, statistical analysis found no evidence that these concerns led to actualbiases in the results.
There were few studies identified that included children. This may be because studies of children do notdiscuss osteomyelitis directly, but only in the context of other conditions such as septic arthritis. Hence, it ispossible that some possibly relevant studies were missed. However, subsequent informal searches did notidentify any further useful reviews or studies that could be included and so we were unable to draw anyfirm conclusions on the accuracy of imaging in children.
Some imaging tests were reported in a few studies, particularly ultrasound and CT, so we were not able tofully assess their diagnostic accuracy. Some aspects of studies were inconsistently reported, such as varyingdescriptions of the cause of osteomyelitis, non-reporting of whether osteomyelitis was acute or chronic,and lack of clarity on whether or not radiography (or other tests) had been used prior to the main test.This made assessment in these subgroups difficult.
We identified very few data beyond those on diagnostic accuracy, with few studies discussing broaderimplementation issues such as access to machinery, costs or radiation exposure. This meant that this reviewcould not consider the broader issues of how imaging tests should be used, for example whether or notdifferences in diagnostic accuracy between PET/SPECT and MRI merit the additional radiation exposure,or suggest that PET/SPECT machines should be made more widely available.
Scintigraphy was not specified in the protocol as a test of interest as it is little used in the UK. However,many studies of scintigraphy were identified during abstract screening and many studies comparescintigraphy with other tests. Given this, we decided to include scintigraphy in the main analysis where ithad been compared with other tests. Studies of scintigraphy alone were included in further analyses, butthese studies were not fully assessed for quality. This uncertainty in quality, and the consequence that thescintigraphy-only studies may be of lower quality than the studies that were fully assessed, is a limitationof this analysis.
Our analysis therefore has the potential for bias, either because the diagnostic accuracy of scintigraphymay be underestimated when it is compared with other tests expected to be better, or because studies
DOI: 10.3310/hta23610 HEALTH TECHNOLOGY ASSESSMENT 2019 VOL. 23 NO. 61
© Queen’s Printer and Controller of HMSO 2019. This work was produced by Llewellyn et al. under the terms of a commissioning contract issued by the Secretary of State forHealth and Social Care. This issue may be freely reproduced for the purposes of private research and study and extracts (or indeed, the full report) may be included in professionaljournals provided that suitable acknowledgement is made and the reproduction is not associated with any form of advertising. Applications for commercial reproduction shouldbe addressed to: NIHR Journals Library, National Institute for Health Research, Evaluation, Trials and Studies Coordinating Centre, Alpha House, University of Southampton SciencePark, Southampton SO16 7NS, UK.
55

of scintigraphy alone may be of poorer quality. However, the diagnostic accuracy of the scintigraphy-onlystudies was similar to that of the fully assessed studies. Any bias is likely to be modest and the overallconclusions reasonable. The benefits of assessing all the evidence on scintigraphy (e.g. being able tocompare different test types) probably outweigh any risk of bias.
Uncertainties
The main uncertainties remaining from this review arise largely because of limitations in the identifiedstudies.
The diagnostic accuracy of imaging tests in children remains highly uncertain owing to the very limitednature of the evidence. We could reach no firm conclusions on the diagnostic accuracy of any imagingtest in children.
The diagnostic accuracy of ultrasound is currently unknown as the only two studies in adults hadconflicting results. However, DORs in both studies were low, suggesting that ultrasound is unlikely to havesimilar or better diagnostic accuracy than MRI, PET or SPECT. Ultrasound, however, is a test of choice inpatients with metalwork in situ as this causes artefacts in CT and MRI.
Although we found no evidence that diagnostic accuracy varied across subgroups of patients, limitedor inconsistent reporting of some characteristics, such as AOM versus COM, or the cause or locationof osteomyelitis, means than differences between tests or between subgroups cannot be ruled out.
Considerations from patient representatives
Both patient representatives were parents of children who were treated for osteomyelitis. Both discussedthe fact that diagnosis was generally a long process, with multiple imaging tests performed, withpreliminary radiography and then ultrasound tests, both of which might be repeated. MRI was used for the‘definitive’ diagnosis, and MRI was also used to confirm that treatment had been effective. We note thatthis process of multiple tests and their interactions could not be easily captured in this systematic review,and the impact and value of multiple imaging tests remain uncertain.
Antibiotics were given early in the diagnostic process, before ultrasound or MRI was performed. This mayaffect evaluations of diagnostic accuracy, because osteomyelitis is treated before being formally diagnosed.In future studies, the impact on diagnostic accuracy of treatment, given the ethical need for prompttreatment, will need to be considered.
Both parents noted that there was little time to discuss the tests or decide which was best for their childand they accepted whatever their doctors recommended. Both felt that the need to correctly diagnoseosteomyelitis outweighed any concerns about the tests themselves. So, for example, they were willing toaccept MRI requiring general anaesthesia.
DISCUSSION
NIHR Journals Library www.journalslibrary.nihr.ac.uk
56

Chapter 6 Conclusions
Implications for health care
This review found that MRI, PET and SPECT all have broadly similar and high accuracy when diagnosingosteomyelitis. All three tests correctly diagnose most people with, and most people without, osteomyelitis.All three are therefore suitable imaging tests for reliably diagnosing osteomyelitis. No clear reason toprefer one test over the other in terms of diagnostic accuracy was identified. The wider availability of MRImachines, and the fact that MRI does not expose patients to harmful ionising radiation, may mean thatMRI is preferable in most cases, unless it is unsuitable for a particular patient. MRI also gives additionalinformation as to the location of fluid collections and anatomical detail for surgical planning not given bySPECT or PET in such detail. PET or SPECT may be required if MRI is inconclusive.
Magnetic resonance imaging generally had poorer specificity than PET or SPECT, with a wide range ofspecificities across studies. This means that there may be substantial numbers of ‘false-positive’ caseswhen using MRI and clinicians should be aware of this potential for overdiagnosis. This may mean thatMRI may be best suited to cases where false-positive cases are of lesser concern, perhaps such as whenpatients would proceed directly to antibiotic treatment. This might, however, be an artefact of thediagnostic studies; actual diagnoses of osteomyelitis will consider the clinical background of the patient(e.g. fever and infection markers in the blood test), so diagnosis is not based on the imaging test alone.
Position emission tomography had poorer sensitivity, but higher specificity, than MRI, with more consistentresults across studies. This may make PET better suited to situations where avoiding false-positive diagnoses isimportant, for example when the test would be followed by surgery or other invasive procedures. However,MRI may still provide greater visual detail to guide the surgical approach than PET/CT alone.
Scintigraphy, in general, is less accurate than MRI or PET, but current methods of scintigraphy, particularly99mTc HMPAO WBC scintigraphy, may have comparable accuracy, and this should be the preferredapproach. However, planar scintigraphy may have poorer diagnostic accuracy than 3D SPECT imaging,so should perhaps be used only when SPECT is unavailable or unsuitable.
Data on ultrasound and CT were limited, but suggested that these tests have poorer diagnostic accuracyand perhaps should not currently be used in adults.
Radiography on its own has poor diagnostic accuracy so should probably not be used in isolation. This reviewcould not confirm whether or not using radiography prior to MRI or other tests improves accuracy or reducescosts. It is, therefore, unclear whether or not the common practice of using radiography as a first test andproceeding to a MRI or another test if the radiography is inconclusive maximises diagnostic accuracy. It is,however, likely that radiography can be usefully used to rule out osteomyelitis in more obvious cases (e.g.when symptoms are the result of bone fracture). Radiography is probably more useful in chronic or subacuteosteomyelitis, when bone destruction is already visible, but not in acute haematogenous osteomyelitis, whenearly changes are looked for.
The review found that diagnostic accuracy in adults does not appear to vary with the potential cause ofosteomyelitis, or with the body part scanned. In particular, there was no evidence that diagnostic accuracywas different in patients with diabetic foot ulcers. This suggests that MRI, PET and SPECT are all reasonabletests to use in adults, regardless of the underlying conditions the patient has. The choice may depend primarilyon suitability for the patient, such as potential difficulties in interpreting MRI scans in patients with indwellingmetalwork. However, data on specific locations or causes of osteomyelitis other than diabetic foot ulcerswere limited, so the possibility that diagnostic accuracy is different for some locations or causes remains.
DOI: 10.3310/hta23610 HEALTH TECHNOLOGY ASSESSMENT 2019 VOL. 23 NO. 61
© Queen’s Printer and Controller of HMSO 2019. This work was produced by Llewellyn et al. under the terms of a commissioning contract issued by the Secretary of State forHealth and Social Care. This issue may be freely reproduced for the purposes of private research and study and extracts (or indeed, the full report) may be included in professionaljournals provided that suitable acknowledgement is made and the reproduction is not associated with any form of advertising. Applications for commercial reproduction shouldbe addressed to: NIHR Journals Library, National Institute for Health Research, Evaluation, Trials and Studies Coordinating Centre, Alpha House, University of Southampton SciencePark, Southampton SO16 7NS, UK.
57
The review identified very limited data on diagnosing osteomyelitis in children, so considerable uncertaintyremains over the diagnostic accuracy of imaging tests in children. Clinicians should be aware of thislimitation in the evidence base.
There was some evidence to suggest that MRI has an acceptable degree of agreement among radiologists.The evidence for the inter-rater reliability of other imaging tests is too limited to draw conclusions. There isalso very limited evidence on the implementation of imaging tests for the diagnosis of osteomyelitis. Notably,there is a lack of evidence on patient preferences and on the most cost-effective diagnostic imagingpathways for osteomyelitis.
Suggested research priorities
The most urgent research priority is to perform diagnostic accuracy studies of imaging tests in children,given the limitations of the current evidence base. Large diagnostic accuracy studies are needed to assessimaging tests in children. These should be of high quality, with proper blinding of test assessors andconsecutive recruitment of patients, and reporting of the appropriate reference standard used to confirmpositive and negative diagnoses. The priority tests should be MRI and ultrasound, ideally comparing thetwo tests in the same children.
Ultrasound has not been widely assessed in adults. Current results suggest that ultrasound on its own maynot be sufficiently accurate to diagnose osteomyelitis, but further accuracy studies are needed to resolvethe uncertainty. It may be more appropriate to investigate the diagnostic accuracy of ultrasound as aprecursor to MRI or other tests (e.g. as a replacement for radiography).
Consistency of test interpretation is an important area in diagnostic testing that is often overlooked.Further investigation of inter- and intra-rater reliability for all tests is needed. Ideally this should be includedin diagnostic accuracy tests, but it could also be investigated in case series or clinical audits.
Given the similarities in diagnostic accuracy of MRI, PET and SPECT, suitable investigation of patient andclinician experience and opinion of these tests, through surveys or focus groups, would be useful toidentify practical reasons for the choice of test. Similarly, a formal economic evaluation of these tests,accounting for test cost, sequencing of tests, availability and risk of radiation exposure, would also help toclarify the choice between these tests.
CONCLUSIONS
NIHR Journals Library www.journalslibrary.nihr.ac.uk
58

Acknowledgements
We would like to acknowledge Teumzghi Mebrahtu, Alex Hodgkinson (both formerly of CRD) andGary Raine (CRD) for their work on abstract screening and data extraction for this review; Nerys Woolacott
(formerly of CRD) for her support in establishing the project and creating the protocol; Andrew Grainger,Emily Hargreaves and Sean O’Riordan (Leeds Teaching Hospitals) for their clinical advice over the course ofthe project; and Rachel McDonald and Ryan Harrison for their support on providing patient and carerperspectives and experience.
Contributions of authors
Alexis Llewellyn (https://orcid.org/0000-0003-4569-5136) performed the systematic review, includingscreening, study selection, data extraction, quality assessment and narrative synthesis. He wrote mostsections of this report.
Julie Jones-Diette (https://orcid.org/0000-0003-1769-8612) performed data extraction and qualityassessment and prepared data tables for the report.
Jeannette Kraft (https://orcid.org/0000-0003-2705-1302) and Colin Holton provided clinical expertiseand commented on drafts of the protocol and this report.
Melissa Harden prepared and performed all database searches for the systematic review.
Mark Simmonds (https://orcid.org/0000-0002-1999-8515) oversaw the project as a whole, performedthe statistical analyses and wrote all sections of the report pertaining to those analyses.
Data-sharing statement
This is a systematic review of published data, and no primary data were created for this report. All dataused are as reported in the publications listed throughout this report. Data-extraction forms are availableon request from the corresponding author.
DOI: 10.3310/hta23610 HEALTH TECHNOLOGY ASSESSMENT 2019 VOL. 23 NO. 61
© Queen’s Printer and Controller of HMSO 2019. This work was produced by Llewellyn et al. under the terms of a commissioning contract issued by the Secretary of State forHealth and Social Care. This issue may be freely reproduced for the purposes of private research and study and extracts (or indeed, the full report) may be included in professionaljournals provided that suitable acknowledgement is made and the reproduction is not associated with any form of advertising. Applications for commercial reproduction shouldbe addressed to: NIHR Journals Library, National Institute for Health Research, Evaluation, Trials and Studies Coordinating Centre, Alpha House, University of Southampton SciencePark, Southampton SO16 7NS, UK.
59


References
1. National Institute for Health and Care Excellence (NICE). Diabetic Foot Problems: Prevention andManagement. NICE Guideline [NG19]. London: NICE; 2015. URL: www.nice.org.uk/guidance/ng19(accessed 6 August 2019).
2. Malhotra R, Chan CS, Nather A. Osteomyelitis in the diabetic foot. Diabet Foot Ankle 2014;5:1.https://doi.org/10.3402/dfa.v5.24445
3. Josse J, Velard F, Gangloff SC. Staphylococcus aureus vs. osteoblast: relationship andconsequences in osteomyelitis. Front Cell Infect Microbiol 2015;5:85. https://doi.org/10.3389/fcimb.2015.00085
4. Kremers HM, Nwojo ME, Ransom JE, Wood-Wentz CM, Melton LJ, Huddleston PM. Trends in theepidemiology of osteomyelitis: a population-based study, 1969 to 2009. J Bone Joint Surg Am2015;97:837–45. https://doi.org/10.2106/JBJS.N.01350
5. Lew DP, Waldvogel FA. Osteomyelitis. N Engl J Med 1997;336:999–1007. https://doi.org/10.1056/NEJM199704033361406
6. Lew DP, Waldvogel FA. Osteomyelitis. Lancet 2004;364:369–79. https://doi.org/10.1016/S0140-6736(04)16727-5
7. Berendt AR, Peters EJ, Bakker K, Embil JM, Eneroth M, Hinchliffe RJ, et al. Diabetic footosteomyelitis: a progress report on diagnosis and a systematic review of treatment. DiabetesMetab Res Rev 2008;24(Suppl. 1):145–61. https://doi.org/10.1002/dmrr.836
8. Lima AL, Oliveira PR, Carvalho VC, Cimerman S, Savio E, Diretrizes Panamericanas para elTratamiento de las Osteomielitis e Infecciones de Tejidos Blandos Group. Recommendations forthe treatment of osteomyelitis. Braz J Infect Dis 2014;18:526–34. https://doi.org/10.1016/j.bjid.2013.12.005
9. Carek PJ, Dickerson LM, Sack JL. Diagnosis and management of osteomyelitis. Am Fam Physician2001;63:2413–20.
10. Gold R. Diagnosis of osteomyelitis. Pediatr Rev 1991;12:292–7. https://doi.org/10.1542/pir.12-10-292
11. Karmazyn B. Imaging approach to acute hematogenous osteomyelitis in children: an update.Semin Ultrasound CT MR 2010;31:100–6. https://doi.org/10.1053/j.sult.2009.12.002
12. Pineda C, Espinosa R, Pena A. Radiographic imaging in osteomyelitis: the role of plainradiography, computed tomography, ultrasonography, magnetic resonance imaging, andscintigraphy. Semin Plast Surg 2009;23:80–9. https://doi.org/10.1055/s-0029-1214160
13. Papanas N, Zissimopoulos A, Maltezos E. (18)F-FDG PET and PET/CT for the diagnosis of diabeticfoot osteomyelitis. Hippokratia 2013;17:4–6.
14. van Schuppen J, van Doorn MM, van Rijn RR. Childhood osteomyelitis: imaging characteristics.Insights Imaging 2012;3:519–33. https://doi.org/10.1007/s13244-012-0186-8
15. Centre for Clinical Practice at National Institute for Health and Clinical Excellence (NICE). DiabeticFoot Problems: Inpatient Management of Diabetic Foot Problems. London: NICE; 2011.
16. Hatzenbuehler J, Pulling TJ. Diagnosis and management of osteomyelitis. Am Fam Physician2011;84:1027–33.
DOI: 10.3310/hta23610 HEALTH TECHNOLOGY ASSESSMENT 2019 VOL. 23 NO. 61
© Queen’s Printer and Controller of HMSO 2019. This work was produced by Llewellyn et al. under the terms of a commissioning contract issued by the Secretary of State forHealth and Social Care. This issue may be freely reproduced for the purposes of private research and study and extracts (or indeed, the full report) may be included in professionaljournals provided that suitable acknowledgement is made and the reproduction is not associated with any form of advertising. Applications for commercial reproduction shouldbe addressed to: NIHR Journals Library, National Institute for Health Research, Evaluation, Trials and Studies Coordinating Centre, Alpha House, University of Southampton SciencePark, Southampton SO16 7NS, UK.
61

17. Lipsky BA, Berendt AR, Cornia PB, Pile JC, Peters EJ, Armstrong DG, et al. 2012 InfectiousDiseases Society of America clinical practice guideline for the diagnosis and treatment of diabeticfoot infections. Clin Infect Dis 2012;54:e132–73. https://doi.org/10.1093/cid/cis346
18. Conterno LO, da Silva Filho CR. Antibiotics for treating chronic osteomyelitis in adults. CochraneDatabase Syst Rev 2009;3:CD004439. https://doi.org/10.1002/14651858.CD004439.pub2
19. Stengel D, Bauwens K, Sehouli J, Ekkernkamp A, Porzsolt F. Systematic review and meta-analysis ofantibiotic therapy for bone and joint infections. Lancet Infect Dis 2001;1:175–88. https://doi.org/10.1016/S1473-3099(01)00094-9
20. Dinh MT, Abad CL, Safdar N. Diagnostic accuracy of the physical examination and imaging testsfor osteomyelitis underlying diabetic foot ulcers: meta-analysis. Clin Infect Dis 2008;47:519–27.https://doi.org/10.1086/590011
21. Govaert GA, IJpma FF, McNally M, McNally E, Reininga IH, Glaudemans AW. Accuracy ofdiagnostic imaging modalities for peripheral post-traumatic osteomyelitis – a systematic review ofthe recent literature. Eur J Nucl Med Mol Imaging 2017;44:1393–407. https://doi.org/10.1007/s00259-017-3683-7
22. Kapoor A, Page S, Lavalley M, Gale DR, Felson DT. Magnetic resonance imaging for diagnosingfoot osteomyelitis: a meta-analysis. Arch Intern Med 2007;167:125–32. https://doi.org/10.1001/archinte.167.2.125
23. Lauri C, Tamminga M, Glaudemans AWJM, Juárez Orozco LE, Erba PA, Jutte PC, et al. Detection ofosteomyelitis in the diabetic foot by imaging techniques: a systematic review and meta-analysiscomparing MRI, white blood cell scintigraphy, and FDG-PET. Diabetes Care 2017;40:1111–20.https://doi.org/10.2337/dc17-0532
24. Mooney ML, Haidet K, Liu J, Ebraheim NA. Hematogenous calcaneal osteomyelitis in children.Foot Ankle Spec 2017;10:63–8. https://doi.org/10.1177/1938640016679704
25. Termaat MF, Raijmakers PG, Scholten HJ, Bakker FC, Patka P, Haarman HJ. The accuracy of diagnosticimaging for the assessment of chronic osteomyelitis: a systematic review and meta-analysis. J BoneJoint Surg Am 2005;87:2464–71. https://doi.org/10.2106/00004623-200511000-00013
26. Treglia G, Sadeghi R, Annunziata S, Zakavi SR, Caldarella C, Muoio B, et al. Diagnosticperformance of fluorine-18-fluorodeoxyglucose positron emission tomography for the diagnosisof osteomyelitis related to diabetic foot: a systematic review and a meta-analysis. Foot2013;23:140–8. https://doi.org/10.1016/j.foot.2013.07.002
27. van der Bruggen W, Bleeker-Rovers CP, Boerman OC, Gotthardt M, Oyen WJ. PET and SPECT inosteomyelitis and prosthetic bone and joint infections: a systematic review. Semin Nucl Med2010;40:3–15. https://doi.org/10.1053/j.semnuclmed.2009.08.005
28. Wang GL, Zhao K, Liu ZF, Dong MJ, Yang SY. A meta-analysis of fluorodeoxyglucose-positronemission tomography versus scintigraphy in the evaluation of suspected osteomyelitis. Nucl MedCommun 2011;32:1134–42. https://doi.org/10.1097/MNM.0b013e32834b455c
29. Xu Z, Koo A, Shah A. The utility of MRI for the diagnosis of osteomyelitis in the pressure ulcerpatient. J Plast Reconstr Aesthet Surg 2017;70:289–91. https://doi.org/10.1016/j.bjps.2016.11.009
30. Dartnell J, Ramachandran M, Katchburian M. Haematogenous acute and subacute paediatricosteomyelitis: a systematic review of the literature. J Bone Joint Surg Br 2012;94:584–95.https://doi.org/10.1302/0301-620X.94B5.28523
31. Whiting PF, Rutjes AW, Westwood ME, Mallett S, Deeks JJ, Reitsma JB, et al. QUADAS-2:a revised tool for the quality assessment of diagnostic accuracy studies. Ann Intern Med2011;155:529–36. https://doi.org/10.7326/0003-4819-155-8-201110180-00009
REFERENCES
NIHR Journals Library www.journalslibrary.nihr.ac.uk
62
32. van de Pol RJ, van Trijffel E, Lucas C. Inter-rater reliability for measurement of passivephysiological range of motion of upper extremity joints is better if instruments are used: asystematic review. J Physiother 2010;56:7–17. https://doi.org/10.1016/S1836-9553(10)70049-7
33. Simmonds MC, Higgins JP. A general framework for the use of logistic regression models inmeta-analysis. Stat Methods Med Res 2016;25:2858–77. https://doi.org/10.1177/0962280214534409
34. Reitsma JB, Glas AS, Rutjes AW, Scholten RJ, Bossuyt PM, Zwinderman AH. Bivariate analysis ofsensitivity and specificity produces informative summary measures in diagnostic reviews. J ClinEpidemiol 2005;58:982–90. https://doi.org/10.1016/j.jclinepi.2005.02.022
35. Rutter CM, Gatsonis CA. A hierarchical regression approach to meta-analysis of diagnostic testaccuracy evaluations. Stat Med 2001;20:2865–84. https://doi.org/10.1002/sim.942
36. Higgins JP, Thompson SG, Deeks JJ, Altman DG. Measuring inconsistency in meta-analyses. BMJ2003;327:557–60. https://doi.org/10.1136/bmj.327.7414.557
37. Abdel Razek AAK, Samir S. Diagnostic performance of diffusion-weighted MR imaging indifferentiation of diabetic osteoarthropathy and osteomyelitis in diabetic foot. Eur J Radiol2017;89:221–5. https://doi.org/10.1016/j.ejrad.2017.02.015
38. Al-Khawari HA, Al-Saeed OM, Jumaa TH, Chishti F. Evaluating diabetic foot infection withmagnetic resonance imaging: Kuwait experience.Med Princ Pract 2005;14:165–72. https://doi.org/10.1159/000084634
39. Al-Sheikh W, Sfakianakis GN, Mnaymneh W, Hourani M, Heal A, Duncan RC, et al. Subacute andchronic bone infections: diagnosis using In-111, 67Ga and Tc-99m MDP bone scintigraphy, andradiography. Radiology 1985;155:501–6. https://doi.org/10.1148/radiology.155.2.3157204
40. Aragón-Sánchez J, Lipsky BA, Lazaro-Martinez JL. Diagnosing diabetic foot osteomyelitis: is thecombination of probe-to-bone test and plain radiography sufficient for high-risk inpatients?Diabet Med 2011;28:191–4. https://doi.org/10.1111/j.1464-5491.2010.03150.x
41. Aslangul E, M’bemba J, Caillat-Vigneron N, Coignard S, Larger E, Boitard C, Lipsky BA.Diagnosing diabetic foot osteomyelitis in patients without signs of soft tissue infection bycoupling hybrid 67Ga SPECT/CT with bedside percutaneous bone puncture. Diabetes Care2013;36:2203–10. https://doi.org/10.2337/dc12-2108
42. Blume PA, Dey HM, Daley LJ, Arrighi JA, Soufer R, Gorecki GA. Diagnosis of pedal osteomyelitiswith Tc-99m HMPAO labeled leukocytes. J Foot Ankle Surg 1997;36:120–6. https://doi.org/10.1016/S1067-2516(97)80057-9
43. Bohchelian HA, Klisarova AD, Koeva LA. Single photon emission tomography in radioimmuneimaging of diabetic foot infection. Diabetol Pol 2002;9:39–44.
44. Bolouri C, Merwald M, Huellner MW, Veit-Haibach P, Kuttenberger J, Pérez-Lago M, et al.Performance of orthopantomography, planar scintigraphy, CT alone and SPECT/CT in patientswith suspected osteomyelitis of the jaw. Eur J Nucl Med Mol Imaging 2013;40:411–17.https://doi.org/10.1007/s00259-012-2285-7
45. Brunel AS, Lamy B, Cyteval C, Perrochia H, Téot L, Masson R, et al. Diagnosing pelvic osteomyelitisbeneath pressure ulcers in spinal cord injured patients: a prospective study. Clin Microbiol Infect2016;22:267.e1–8. https://doi.org/10.1016/j.cmi.2015.11.005
46. Chacko TK, Zhuang H, Nakhoda KZ, Moussavian B, Alavi A. Applications of fluorodeoxyglucosepositron emission tomography in the diagnosis of infection. Nucl Med Commun 2003;24:615–24.https://doi.org/10.1097/01.mnm.0000075189.60210.df
DOI: 10.3310/hta23610 HEALTH TECHNOLOGY ASSESSMENT 2019 VOL. 23 NO. 61
© Queen’s Printer and Controller of HMSO 2019. This work was produced by Llewellyn et al. under the terms of a commissioning contract issued by the Secretary of State forHealth and Social Care. This issue may be freely reproduced for the purposes of private research and study and extracts (or indeed, the full report) may be included in professionaljournals provided that suitable acknowledgement is made and the reproduction is not associated with any form of advertising. Applications for commercial reproduction shouldbe addressed to: NIHR Journals Library, National Institute for Health Research, Evaluation, Trials and Studies Coordinating Centre, Alpha House, University of Southampton SciencePark, Southampton SO16 7NS, UK.
63

47. Croll SD, Nicholas GG, Osborne MA, Wasser TE, Jones S. Role of magnetic resonance imagingin the diagnosis of osteomyelitis in diabetic foot infections. J Vasc Surg 1996;24:266–70.https://doi.org/10.1016/S0741-5214(96)70102-7
48. Demirev A, Weijers R, Geurts J, Mottaghy F, Walenkamp G, Brans B. Comparison of [18 F]FDGPET/CT and MRI in the diagnosis of active osteomyelitis. Skeletal Radiol 2014;43:665–72.https://doi.org/10.1007/s00256-014-1844-3
49. Enderle MD, Coerper S, Schweizer HP, Kopp AE, Thelen MH, Meisner C, et al. Correlation ofimaging techniques to histopathology in patients with diabetic foot syndrome and clinicalsuspicion of chronic osteomyelitis. The role of high-resolution ultrasound. Diabetes Care1999;22:294–9. https://doi.org/10.2337/diacare.22.2.294
50. Erdman WA, Tamburro F, Jayson HT, Weatherall PT, Ferry KB, Peshock RM. Osteomyelitis:characteristics and pitfalls of diagnosis with MR imaging. Radiology 1991;180:533–9.https://doi.org/10.1148/radiology.180.2.2068324
51. Ertugrul MB, Baktiroglu S, Salman S, Unal S, Aksoy M, Berberoglu K, Calangu S. The diagnosisof osteomyelitis of the foot in diabetes: microbiological examination vs. magnetic resonanceimaging and labelled leucocyte scanning. Diabet Med 2006;23:649–53. https://doi.org/10.1111/j.1464-5491.2006.01887.x
52. Ezzat T, El-Hamid AA, Mostafa M, El-Kady L. Early diagnosis of acute osteomyelitis in children byhigh-resolution and power Doppler sonography. Egypt J Radiol Nucl Med 2011;42:233–42.https://doi.org/10.1016/j.ejrnm.2011.05.002
53. Familiari D, Glaudemans AW, Vitale V, Prosperi D, Bagni O, Lenza A, et al. Can sequential18F-FDG PET/CT replace WBC imaging in the diabetic foot? J Nucl Med 2011;52:1012–19.https://doi.org/10.2967/jnumed.110.082222
54. Filippi L, Schillaci O. Usefulness of hybrid SPECT/CT in 99mTc-HMPAO-labeled leukocytescintigraphy for bone and joint infections. J Nucl Med 2006;47:1908–13.
55. Filippi L, Uccioli L, Giurato L, Schillaci O. Diabetic foot infection: usefulness of SPECT/CT for99mTc-HMPAO-labeled leukocyte imaging. J Nucl Med 2009;50:1042–6. https://doi.org/10.2967/jnumed.108.059493
56. Franceschi D, Matthews R, Brunetti V, Franceschi AM, Safaie E, Carcamo CJ, et al. FDG PET/CTimaging in diabetic foot infections. Eur J Nucl Med Mol Imaging 2013;40(Suppl. 2):1–477.https://doi.org/10.1007/s00259-013-2535-3
57. Gemmel F, De Winter F, Van Laere K, Vogelaers D, Uyttendaele D, Dierckx RA. 99mTcciprofloxacin imaging for the diagnosis of infection in the postoperative spine. Nucl MedCommun 2004;25:277–83. https://doi.org/10.1097/00006231-200403000-00011
58. Guhlmann A, Brecht-Krauss D, Suger G, Glatting G, Kotzerke J, Kinzl L, Reske SN. Fluorine-18-FDGPET and technetium-99m antigranulocyte antibody scintigraphy in chronic osteomyelitis. J Nucl Med1998;39:2145–52.
59. Guhlmann A, Brecht-Krauss D, Suger G, Glatting G, Kotzerke J, Kinzl L, Reske SN. Chronicosteomyelitis: detection with FDG PET and correlation with histopathologic findings. Radiology1998;206:749–54. https://doi.org/10.1148/radiology.206.3.9494496
60. Hakim SG, Bruecker CW, Jacobsen HCh, Hermes D, Lauer I, Eckerle S, et al. The value of FDG-PETand bone scintigraphy with SPECT in the primary diagnosis and follow-up of patients with chronicosteomyelitis of the mandible. Int J Oral Maxillofac Surg 2006;35:809–16. https://doi.org/10.1016/j.ijom.2006.03.029
REFERENCES
NIHR Journals Library www.journalslibrary.nihr.ac.uk
64
61. Hartmann A, Eid K, Dora C, Trentz O, von Schulthess GK, Stumpe KDM. Diagnostic value of18F-FDG PET/CT in trauma patients with suspected chronic osteomyelitis. Eur J Nucl Med MolImaging 2007;34:704–14. https://doi.org/10.1007/s00259-006-0290-4
62. Hazenberg C, Kraai M, Moll F, van Baal S. Prediction of outcome of treatment of osteomyelitis indiabetic foot after minor amputation: the role of MR imaging. J Vasc Surg 2011;53:78S–79S.http://dx.doi.org/10.1016/j.jvs.2011.03.151
63. Heiba SI, Stempler L, Sullivan T, Kolker D, Kostakoglu L. The ideal dual-isotope imagingcombination in evaluating patients with suspected infection of pelvic pressure ulcers. Nucl MedCommun 2017;38:129–34. https://doi.org/10.1097/MNM.0000000000000625
64. Horger M, Eschmann SM, Pfannenberg C, Storek D, Dammann F, Vonthein R, et al. The value ofSPET/CT in chronic osteomyelitis. Eur J Nucl Med Mol Imaging 2003;30:1665–73. https://doi.org/10.1007/s00259-003-1321-z
65. Horger M, Eschmann SM, Pfannenberg C, Storek D, Vonthein R, Claussen CD, Bares R. Addedvalue of SPECT/CT in patients suspected of having bone infection: preliminary results. ArchOrthop Trauma Surg 2007;127:211–21. https://doi.org/10.1007/s00402-006-0259-6
66. Huang AB, Schweitzer ME, Hume E, Batte WG. Osteomyelitis of the pelvis/hips in paralyzed patients:accuracy and clinical utility of MRI. J Comput Assist Tomogr 1998;22:437–43. https://doi.org/10.1097/00004728-199805000-00017
67. Johnson PW, Collins MS, Wenger DE. Diagnostic utility of T1-weighted MRI characteristics inevaluation of osteomyelitis of the foot. AJR Am J Roentgenol 2009;192:96–100. https://doi.org/10.2214/AJR.08.1376
68. Kaim A, Ledermann HP, Bongartz G, Messmer P, Müller-Brand J, Steinbrich W. Chronic post-traumaticosteomyelitis of the lower extremity: comparison of magnetic resonance imaging and combined bonescintigraphy/immunoscintigraphy with radiolabelled monoclonal antigranulocyte antibodies. SkeletalRadiol 2000;29:378–86. https://doi.org/10.1007/s002560000228
69. Kim C, Lee SJ, Kim JY, Hwang KT, Choi YY. Comparative analysis of 99mTc-MDP three-phasebone scan with SPECT/CT and 99mTc-HMPAO-Labeled WBC SPECT/CT in the differentialdiagnosis of clinically suspicious post-traumatic osteomyelitis. Nucl Med Mol Imaging2017;51:40–8. https://doi.org/10.1007/s13139-016-0441-x
70. La Fontaine J, Bhavan K, Lam K, Van Asten S, Erdman W, Lavery LA, Öz OK. Comparisonbetween Tc-99m WBC SPECT/CT and MRI for the diagnosis of biopsy-proven diabetic footosteomyelitis. Wounds 2016;28:271–8.
71. Larcos G, Brown ML, Sutton RT. Diagnosis of osteomyelitis of the foot in diabetic patients: valueof 111In-leukocyte scintigraphy. AJR Am J Roentgenol 1991;157:527–31. https://doi.org/10.2214/ajr.157.3.1872240
72. Larson DL, Gilstrap J, Simonelic K, Carrera GF. Is there a simple, definitive, and cost-effective wayto diagnose osteomyelitis in the pressure ulcer patient? Plast Reconstr Surg 2011;127:670–6.https://doi.org/10.1097/PRS.0b013e3181fed66e
73. Ledermann HP, Kaim A, Bongartz G, Steinbrich W. Pitfalls and limitations of magnetic resonanceimaging in chronic posttraumatic osteomyelitis. Eur Radiol 2000;10:1815–23. https://doi.org/10.1007/s003300000480
74. Levine SE, Neagle CE, Esterhai JL, Wright DG, Dalinka MK. Magnetic resonance imaging for thediagnosis of osteomyelitis in the diabetic patient with a foot ulcer. Foot Ankle Int 1994;15:151–6.https://doi.org/10.1177/107110079401500311
DOI: 10.3310/hta23610 HEALTH TECHNOLOGY ASSESSMENT 2019 VOL. 23 NO. 61
© Queen’s Printer and Controller of HMSO 2019. This work was produced by Llewellyn et al. under the terms of a commissioning contract issued by the Secretary of State forHealth and Social Care. This issue may be freely reproduced for the purposes of private research and study and extracts (or indeed, the full report) may be included in professionaljournals provided that suitable acknowledgement is made and the reproduction is not associated with any form of advertising. Applications for commercial reproduction shouldbe addressed to: NIHR Journals Library, National Institute for Health Research, Evaluation, Trials and Studies Coordinating Centre, Alpha House, University of Southampton SciencePark, Southampton SO16 7NS, UK.
65

75. Lewis VL, Bailey MH, Pulawski G, Kind G, Bashioum RW, Hendrix RW. The diagnosis ofosteomyelitis in patients with pressure sores. Plast Reconstr Surg 1988;81:229–32. https://doi.org/10.1097/00006534-198802000-00016
76. Lipman BT, Collier BD, Carrera GF, Timins ME, Erickson SJ, Johnson JE, et al. Detection ofosteomyelitis in the neuropathic foot: nuclear medicine, MRI and conventional radiography.Clin Nucl Med 1998;23:77–82. https://doi.org/10.1097/00003072-199802000-00003
77. Mahendra M, Singh R. Diagnostic accuracy and surgical utility of MRI in complicated diabeticfoot. J Clin Diagn Res 2017;11:RC01–RC04. https://doi.org/10.7860/JCDR/2017/25902.10154
78. Malcius D, Jonkus M, Kuprionis G, Maleckas A, Monastyreckiene E, Uktveris R, et al. The accuracyof different imaging techniques in diagnosis of acute hematogenous osteomyelitis. Medicina2009;45:624–31. https://doi.org/10.3390/medicina45080081
79. Mason MD, Zlatkin MB, Esterhai JL, Dalinka MK, Velchik MG, Kressel HY. Chronic complicatedosteomyelitis of the lower extremity: evaluation with MR imaging. Radiology 1989;173:355–9.https://doi.org/10.1148/radiology.173.2.2798868
80. McCarthy J, Hartmann E, Bentz ML, Rao VK, Jee Y, Rivedal D, Poore SO. Seeing is believing?Preoperative magnetic resonance imaging for pressure ulcers: implications for surgicalmanagement. Plast Reconstr Surg Glob Open 2017;5:e1263. https://doi.org/10.1097/GOX.0000000000001263
81. Meller J, Koster G, Liersch T, Siefker U, Lehmann K, Meyer I, et al. Chronic bacterial osteomyelitis:prospective comparison of 18F-FDG imaging with a dual-head coincidence camera and 111In-labelledautologous leucocyte scintigraphy. Eur J Nucl Med Mol Imaging 2002;29:53–60. https://doi.org/10.1007/s00259-001-0661-9
82. Miki F, Armstrong DG, Hiroto T. Efficacy of magnetic resonance imaging in deciding theappropriate surgical margin in diabetic foot osteomyelitis. EWMA J 2015;15:8–12.
83. Modic MT, Feiglin DH, Piraino DW, Boumphrey F, Weinstein MA, Duchesneau PM, Rehm S.Vertebral osteomyelitis: assessment using MR. Radiology 1985;157:157–66. https://doi.org/10.1148/radiology.157.1.3875878
84. Morales Lozano R, González Fernández ML, Martinez Hernández D, Beneit Montesinos JV,Guisado Jiménez S, Gonzalez Jurado MA. Validating the probe-to-bone test and other testsfor diagnosing chronic osteomyelitis in the diabetic foot. Diabetes Care 2010;33:2140–5.https://doi.org/10.2337/dc09-2309
85. Morrison WB, Schweitzer ME, Bock GW, Mitchell DG, Hume EL, Pathria MN, Resnick D. Diagnosisof osteomyelitis: utility of fat-suppressed contrast-enhanced MR imaging. Radiology 1993;189:251–7.https://doi.org/10.1148/radiology.189.1.8204132
86. Morrison WB, Schweitzer ME, Batte WG, Radack DP, Russel KM. Osteomyelitis of the foot:relative importance of primary and secondary MR imaging signs. Radiology 1998;207:625–32.https://doi.org/10.1148/radiology.207.3.9609883
87. Nath AK, Sethu AU. Use of ultrasound in osteomyelitis. Br J Radiol 1992;65:649–52. https://doi.org/10.1259/0007-1285-65-776-649
88. Nawaz A, Torigian DA, Siegelman ES, Basu S, Chryssikos T, Alavi A. Diagnostic performance ofFDG-PET, MRI, and plain film radiography (PFR) for the diagnosis of osteomyelitis in the diabeticfoot. Mol Imaging Biol 2010;12:335–42. https://doi.org/10.1007/s11307-009-0268-2
89. Newman LG, Waller J, Palestro CJ, Schwartz M, Klein MJ, Hermann G, et al. Unsuspectedosteomyelitis in diabetic foot ulcers. Diagnosis and monitoring by leukocyte scanning with indium in111 oxyquinoline. JAMA 1991;266:1246–51. https://doi.org/10.1001/jama.1991.03470090080036
REFERENCES
NIHR Journals Library www.journalslibrary.nihr.ac.uk
66

90. Newman LG, Waller J, Palestro CJ, Hermann G, Klein MJ, Schwartz M, et al. Leukocyte scanningwith 111In is superior to magnetic resonance imaging in diagnosis of clinically unsuspectedosteomyelitis in diabetic foot ulcers. Diabetes Care 1992;15:1527–30. https://doi.org/10.2337/diacare.15.11.1527
91. Nigro ND, Bartynski WS, Grossman SJ, Kruljac S. Clinical impact of magnetic resonance imagingin foot osteomyelitis. J Am Podiatr Med Assoc 1992;82:603–15. https://doi.org/10.7547/87507315-82-12-603
92. Park HM, Wheat LJ, Siddiqui AR, Burt RW, Robb JA, Ransburg RC, Kernek CB. Scintigraphicevaluation of diabetic osteomyelitis: concise communication. J Nucl Med 1982;23:569–73.
93. Rastogi A, Bhattacharya A, Prakash M, Sharma S, Mittal BR, Khandelwal N, Bhansali A. Utilityof PET/CT with fluorine-18-fluorodeoxyglucose-labeled autologous leukocytes for diagnosingdiabetic foot osteomyelitis in patients with Charcot’s neuroarthropathy. Nucl Med Commun2016;37:1253–9. https://doi.org/10.1097/MNM.0000000000000603
94. Remedios D, Valabhji J, Oelbaum R, Sharp P, Mitchell R. 99mTc-nanocolloid scintigraphy forassessing osteomyelitis in diabetic neuropathic feet. Clin Radiol 1998;53:120–5. https://doi.org/10.1016/S0009-9260(98)80058-5
95. Rozzanigo U, Tagliani A, Vittorini E, Pacchioni R, Brivio LR, Caudana R. Role of magneticresonance imaging in the evaluation of diabetic foot with suspected osteomyelitis. Radiol Med2009;114:121–32. https://doi.org/10.1007/s11547-008-0337-7
96. Sanlı Y, Ozkan ZG, Unal SN, Türkmen C, Kılıçoglu O. The additional value of Tc 99m HMPAOwhite blood cell SPECT in the evaluation of bone and soft tissue infections. Mol ImagingRadionucl Ther 2011;20:7–13. https://doi.org/10.4274/MIRT.20.02
97. Sarikaya A, Aygit AC, Pekindil G. Utility of 99mTc dextran scintigraphy in diabetic patients withsuspected osteomyelitis of the foot. Ann Nucl Med 2003;17:669–76. https://doi.org/10.1007/BF02984973
98. Schlung JE, Bastrom TP, Roocroft JH, Newton PO, Mubarak SJ, Upasani VV. Femoral neckaspiration aids in the diagnosis of osteomyelitis in children with septic hip. J Pediatr Orthop2016;38:532–536. https://doi.org/10.1097/BPO.0000000000000868
99. Schwegler B, Stumpe KD, Weishaupt D, Strobel K, Spinas GA, von Schulthess GK, et al.Unsuspected osteomyelitis is frequent in persistent diabetic foot ulcer and better diagnosed byMRI than by 18F-FDG PET or 99mTc-MOAB. J Intern Med 2008;263:99–106. https://doi.org/10.1111/j.1365-2796.2007.01877.x
100. Seabold JE, Flickinger FW, Kao SC, Gleason TJ, Kahn D, Nepola JV, Marsh JL. Indium-111-leukocyte/technetium-99m-MDP bone and magnetic resonance imaging: difficulty of diagnosingosteomyelitis in patients with neuropathic osteoarthropathy. J Nucl Med 1990;31:549–56.
101. Seabold JE, Simonson TM, Weber PC, Thompson BH, Harris KG, Rezai K, et al. Cranialosteomyelitis: diagnosis and follow-up with In-111 white blood cell and Tc-99m methylenediphosphonate bone SPECT, CT, and MR imaging. Radiology 1995;196:779–88. https://doi.org/10.1148/radiology.196.3.7644643
102. Segall GM, Nino-Murcia M, Jacobs T, Chang K. The role of bone scan and radiography in thediagnostic evaluation of suspected pedal osteomyelitis. Clin Nucl Med 1989;14:255–60.https://doi.org/10.1097/00003072-198904000-00003
103. Shemesh S, Kosashvili Y, Groshar D, Bernstine H, Sidon E, Cohen N, et al. The value of 18-FDGPET/CT in the diagnosis and management of implant-related infections of the tibia: a case series.Injury 2015;46:1377–82. https://doi.org/10.1016/j.injury.2015.03.002
DOI: 10.3310/hta23610 HEALTH TECHNOLOGY ASSESSMENT 2019 VOL. 23 NO. 61
© Queen’s Printer and Controller of HMSO 2019. This work was produced by Llewellyn et al. under the terms of a commissioning contract issued by the Secretary of State forHealth and Social Care. This issue may be freely reproduced for the purposes of private research and study and extracts (or indeed, the full report) may be included in professionaljournals provided that suitable acknowledgement is made and the reproduction is not associated with any form of advertising. Applications for commercial reproduction shouldbe addressed to: NIHR Journals Library, National Institute for Health Research, Evaluation, Trials and Studies Coordinating Centre, Alpha House, University of Southampton SciencePark, Southampton SO16 7NS, UK.
67
104. Unger E, Moldofsky P, Gatenby R, Hartz W, Broder G. Diagnosis of osteomyelitis by MR imaging.AJR Am J Roentgenol 1988;150:605–10. https://doi.org/10.2214/ajr.150.3.605
105. van Vliet KE, de Jong VM, Termaat MF, Schepers T, van Eck-Smit BLF, Goslings JC, Schep NWL.FDG-PET/CT for differentiating between aseptic and septic delayed union in the lower extremity.Arch Orthop Trauma Surg 2018;138:189–94. https://doi.org/10.1007/s00402-017-2806-8
106. Weber PC, Seabold JE, Graham SM, Hoffmann HH, Simonson TM, Thompson BH. Evaluation oftemporal and facial osteomyelitis by simultaneous In-WBC/Tc-99m-MDP bone SPECT scintigraphyand computed tomography scan. Otolaryngol Head Neck Surg 1995;113:36–41. https://doi.org/10.1016/S0194-5998(95)70142-7
107. Weinstein D, Wang A, Chambers R, Stewart CA, Motz HA. Evaluation of magnetic resonanceimaging in the diagnosis of osteomyelitis in diabetic foot infections. Foot Ankle 1993;14:18–22.https://doi.org/10.1177/107110079301400104
108. Wenter V, Müller JP, Albert NL, Lehner S, Fendler WP, Bartenstein P, et al. The diagnostic valueof [18F]FDG PET for the detection of chronic osteomyelitis and implant-associated infection.Eur J Nucl Med Mol Imaging 2016;43:749–61. https://doi.org/10.1007/s00259-015-3221-4
109. Weon YC, Yang SO, Choi YY, Shin JW, Ryu JS, Shin MJ, et al. Use of Tc-99m HMPAO leukocytescans to evaluate bone infection: incremental value of additional SPECT images. Clin Nucl Med2000;25:519–26. https://doi.org/10.1097/00003072-200007000-00006
110. Williamson BR, Teates CD, Phillips CD, Croft BY. Computed tomography as a diagnostic aidin diabetic and other problem feet. Clin Imaging 1989;13:159–63. https://doi.org/10.1016/0899-7071(89)90101-0
111. Yang H, Zhuang H, Rubello D, Alavi A. Mild-to-moderate hyperglycemia will not decrease thesensitivity of 18F-FDG PET imaging in the detection of pedal osteomyelitis in diabetic patients.Nucl Med Commun 2016;37:259–62. https://doi.org/10.1097/MNM.0000000000000434
112. Yuh WT, Corson JD, Baraniewski HM, Rezai K, Shamma AR, Kathol MH, et al. Osteomyelitis ofthe foot in diabetic patients: evaluation with plain film, 99mTc-MDP bone scintigraphy, and MRimaging. AJR Am J Roentgenol 1989;152:795–800. https://doi.org/10.2214/ajr.152.4.795
113. Zaiton F, Samir AM, Elkamash TH, Tawfik AM, Hadhoud KM. Evaluation of diabetic footosteomyelitis using probe to bone test and magnetic resonance imaging and their impact onsurgical intervention. Egyptian Journal of Radiology and Nuclear Medicine 2014;45:795–802.https://doi.org/10.1016/j.ejrnm.2014.04.015
114. Álvaro-Afonso FJ, Lázaro-Martínez JL, Aragón-Sánchez J, García-Morales E, Cecilia-Matilla A,Beneit-Montesinos JV. Interobserver and intraobserver reproducibility of plain X-rays in thediagnosis of diabetic foot osteomyelitis. Int J Low Extrem Wounds 2013;12:12–15. https://doi.org/10.1177/1534734612474304
115. Álvaro-Afonso FJ, Lázaro-Martínez JL, Aragón-Sánchez J, García-Morales E, García-Álvarez Y,Molines-Barroso RJ. Inter-observer reproducibility of diagnosis of diabetic foot osteomyelitis basedon a combination of probe-to-bone test and simple radiography. Diabetes Res Clin Pract2014;105:e3–5. https://doi.org/10.1016/j.diabres.2014.04.024
116. Averill LW, Hernandez A, Gonzalez L, Peña AH, Jaramillo D. Diagnosis of osteomyelitis in children:utility of fat-suppressed contrast-enhanced MRI. AJR Am J Roentgenol 2009;192:1232–8.https://doi.org/10.2214/AJR.07.3400
117. Hauptfleisch J, Meagher TM, Hughes RJ, Singh JP, Graham A, López de Heredia L. Interobserveragreement of magnetic resonance imaging signs of osteomyelitis in pelvic pressure ulcers inpatients with spinal cord injury. Arch Phys Med Rehabil 2013;94:1107–11. https://doi.org/10.1016/j.apmr.2012.11.012
REFERENCES
NIHR Journals Library www.journalslibrary.nihr.ac.uk
68

118. Govaert GA, Glaudemans AW, Ploegmakers JJ, Viddeleer AR, Wendt KW, Reininga IH. Diagnosticstrategies for posttraumatic osteomyelitis: a survey amongst Dutch medical specialists demonstratesthe need for a consensus protocol. Eur J Trauma Emerg Surg 2017;44:417–426. https://doi.org/10.1007/s00068-017-0783-9
119. Ayati N, Norouzi M, Sadeghi R, Erfani M, Gharedaghi M, Aryana K. Diagnostic value of 99mTc-ubiquicidin scintigraphy in differentiation between osteomyelitis and bone tumors. Nucl MedCommun 2017;38:885–90. https://doi.org/10.1097/MNM.0000000000000744
120. Ballani NS, Al-Huda FA, Khan HA, Al-Mohannadi S, Mahmood H, Al-Enezi F. The value ofquantitative uptake of (99m)Tc-MDP and (99m)Tc-HMPAO white blood cells in detectingosteomyelitis in violated peripheral bones. J Nucl Med Technol 2007;35:91–5. https://doi.org/10.2967/jnmt.106.035402
121. Boronat-Ferrater M, Simó-Perdigó M, Cuberas-Borrós G, Aguadé-Bruix S, Dellepiane-Clarke F,Torrent-Llongarriu E, et al. Bone scintigraphy and radiolabeled white blood cell scintigraphy forthe diagnosis of mandibular osteomyelitis. Clin Nucl Med 2011;36:273–6. https://doi.org/10.1097/RLU.0b013e31820a9ed5
122. Buhl T, Stentzer K, Hede A, Kjaer A, Hesse B. Bone infection in patients suspected of complicatingosteomyelitis: the diagnostic value of dual isotope bone-granulocyte scintigraphy. Clin PhysiolFunct Imaging 2005;25:20–6. https://doi.org/10.1111/j.1475-097X.2004.00581.x
123. Crerand S, Dolan M, Laing P, Bird M, Smith ML, Klenerman L. Diagnosis of osteomyelitis inneuropathic foot ulcers. J Bone Joint Surg Br 1996;78:51–5. https://doi.org/10.1302/0301-620X.78B1.0780051
124. Devillers A, Moisan A, Jean S, Arvieux C, Bourguet P. Technetium-99m hexamethylpropyleneamine oxime leucocyte scintigraphy for the diagnosis of bone and joint infections: a retrospectivestudy in 116 patients. Eur J Nucl Med 1995;22:302–7. https://doi.org/10.1007/BF00941845
125. Dillmann-Arroyo C, Cantú-Leal R, Campa-Núñez H, López-Cavazos C, Bermúdez-Argüelles M,Mejía-Herrera JC. [Application of the ubiquicidin 29-41 scan in the diagnosis of pyogenic vertebralosteomyelitis.] Acta Ortop Mex 2011;25:27–31.
126. Dutta P, Bhansali A, Mittal BR, Singh B, Masoodi SR. Instant 99mTc-ciprofloxacin scintigraphy forthe diagnosis of osteomyelitis in the diabetic foot. Foot Ankle Int 2006;27:716–22. https://doi.org/10.1177/107110070602700911
127. el Esper I, Dacquet V, Paillard J, Bascoulergue G, Tahon MM, Fonroget J. 99Tcm-HMPAO-labelledleucocyte scintigraphy in suspected chronic osteomyelitis related to an orthopaedic device:clinical usefulness. Nucl Med Commun 1992;13:799–805. https://doi.org/10.1097/00006231-199211000-00005
128. Esterhai J, Alavi A, Mandell GA, Brown J. Sequential technetium-99m/gallium-67 scintigraphicevaluation of subclinical osteomyelitis complicating fracture nonunion. J Orthop Res 1985;3:219–25.https://doi.org/10.1002/jor.1100030212
129. Esterhai JL, Goll SR, McCarthy KE, Velchik M, Alavi A, Brighton CT, Heppenstall RB. Indium-111leukocyte scintigraphic detection of subclinical osteomyelitis complicating delayed and nonunionlong bone fractures: a prospective study. J Orthop Res 1987;5:1–6. https://doi.org/10.1002/jor.1100050102
130. Fernandez P, Monet A, Matei C, De Clermont H, Guyot M, Jeandot R, et al. 99mTc-HMPAOlabelled white blood cell scintigraphy in patients with osteoarticular infection: the value of lateimages for diagnostic accuracy and interobserver reproducibility. Eur J Clin Microbiol Infect Dis2008;27:1239–44. https://doi.org/10.1007/s10096-008-0563-x
DOI: 10.3310/hta23610 HEALTH TECHNOLOGY ASSESSMENT 2019 VOL. 23 NO. 61
© Queen’s Printer and Controller of HMSO 2019. This work was produced by Llewellyn et al. under the terms of a commissioning contract issued by the Secretary of State forHealth and Social Care. This issue may be freely reproduced for the purposes of private research and study and extracts (or indeed, the full report) may be included in professionaljournals provided that suitable acknowledgement is made and the reproduction is not associated with any form of advertising. Applications for commercial reproduction shouldbe addressed to: NIHR Journals Library, National Institute for Health Research, Evaluation, Trials and Studies Coordinating Centre, Alpha House, University of Southampton SciencePark, Southampton SO16 7NS, UK.
69

131. Fihn SD, Larson EB, Nelp WB, Rudd TG, Gerber FH. Should single-phase radionuclide boneimaging be used in suspected osteomyelitis? J Nucl Med 1984;25:1080–8.
132. Glaudemans AW, de Vries EF, Vermeulen LE, Slart RH, Dierckx RA, Signore A. A large retrospectivesingle-centre study to define the best image acquisition protocols and interpretation criteria forwhite blood cell scintigraphy with 99mTc-HMPAO-labelled leucocytes in musculoskeletal infections.Eur J Nucl Med Mol Imaging 2013;40:1760–9. https://doi.org/10.1007/s00259-013-2481-0
133. Govaert GAM, Bosch P, IJpma FFA, Glauche J, Jutte PC, Lemans JVC, et al. High diagnostic accuracyof white blood cell scintigraphy for fracture related infections: results of a large retrospective single-center study. Injury 2018;49:1085–90. https://doi.org/10.1016/j.injury.2018.03.018
134. Harvey J, Cohen MM. Technetium-99-labeled leukocytes in diagnosing diabetic osteomyelitis inthe foot. J Foot Ankle Surg 1997;36:209–14. https://doi.org/10.1016/S1067-2516(97)80117-2
135. Harwood SJ, Camblin JG, Hakki S, Morrissey MA, Laven DL, Zangara LM, et al. Use of technetiumantigranulocyte monoclonal antibody Fab’ fragments for the detection of osteomyelitis. Cell Biophys1994;24–25:99–107. https://doi.org/10.1007/BF02789220
136. Harwood SJ, Valdivia S, Hung GL, Quenzer RW. Use of Sulesomab, a radiolabeled antibodyfragment, to detect osteomyelitis in diabetic patients with foot ulcers by leukoscintigraphy.Clin Infect Dis 1999;28:1200–5. https://doi.org/10.1086/514791
137. Herndon WA, Alexieva BT, Schwindt ML, Scott KN, Shaffer WO. Nuclear imaging formusculoskeletal infections in children. J Pediatr Orthop 1985;5:343–7. https://doi.org/10.1097/01241398-198505000-00017
138. Hotze AL, Briele B, Overbeck B, Kropp J, Gruenwald F, Mekkawy MA, et al. Technetium-99m-labeled anti-granulocyte antibodies in suspected bone infections. J Nucl Med 1992;33:526–31.
139. Jacobson AF, Harley JD, Lipsky BA, Pecoraro RE. Diagnosis of osteomyelitis in the presence ofsoft-tissue infection and radiologic evidence of osseous abnormalities: value of leukocytescintigraphy. AJR Am J Roentgenol 1991;157:807–12. https://doi.org/10.2214/ajr.157.4.1892041
140. Johnson JE, Kennedy EJ, Shereff MJ, Patel NC, Collier BD. Prospective study of bone, indium-111-labeled white blood cell, and gallium-67 scanning for the evaluation of osteomyelitis in thediabetic foot. Foot Ankle Int 1996;17:10–16. https://doi.org/10.1177/107110079601700103
141. Kaim A, Maurer T, Ochsner P, Jundt G, Kirsch E, Mueller-Brand J. Chronic complicatedosteomyelitis of the appendicular skeleton: diagnosis with technetium-99m labelled monoclonalantigranulocyte antibody-immunoscintigraphy. Eur J Nucl Med 1997;24:732–8. https://doi.org/10.1007/BF00879660
142. Kolindou A, Liu Y, Ozker K, Krasnow AZ, Isitman AT, Hellman RS, Collier BD. In-111 WBCimaging of osteomyelitis in patients with underlying bone scan abnormalities. Clin Nucl Med1996;21:183–91. https://doi.org/10.1097/00003072-199603000-00001
143. Krznaric E, Roo MD, Verbruggen A, Stuyck J, Mortelmans L. Chronic osteomyelitis: diagnosis withtechnetium-99m-d, l-hexamethylpropylene amine oxime labelled leucocytes. Eur J Nucl Med1996;23:792–7. https://doi.org/10.1007/BF00843708
144. Machens HG, Pallua N, Becker M, Mailaender P, Schaller E, Brenner P, et al. Technetium-99mhuman immunoglobulin (HIG): a new substance for scintigraphic detection of bone and jointinfections. Microsurgery 1996;17:272–7. https://doi.org/10.1002/(SICI)1098-2752(1996)17:5<272::AID-MICR7>3.0.CO;2-L
145. Maurer AH, Millmond SH, Knight LC, Mesgarzadeh M, Siegel JA, Shuman CR, et al. Infection indiabetic osteoarthropathy: use of indium-labeled leukocytes for diagnosis. Radiology 1986;161:221–5.https://doi.org/10.1148/radiology.161.1.3763871
REFERENCES
NIHR Journals Library www.journalslibrary.nihr.ac.uk
70

146. McCarthy K, Velchik MG, Alavi A, Mandell GA, Esterhai JL, Goll S. Indium-111-labeled whiteblood cells in the detection of osteomyelitis complicated by a pre-existing condition. J Nucl Med1988;29:1015–21.
147. Melkun ET, Lewis VL. Evaluation of (111) indium-labeled autologous leukocyte scintigraphy forthe diagnosis of chronic osteomyelitis in patients with grade IV pressure ulcers, as compared witha standard diagnostic protocol. Ann Plast Surg 2005;54:633–6. https://doi.org/10.1097/01.sap.0000164467.97551.ed
148. Mora Ríos FG, Isunza Ramírez A, López Marmolejo A, Palma Rosillo RM, Guízar Cuevas S,Mora Magaña I, Velázquez Pedroza VH. [Sensitivity and specificity of the Tc-99m ciprofloxacinscan in pediatric osteomyelitis.] Acta Ortop Mex 2010;24:248–51.
149. Nepola JV, Seabold JE, Marsh JL, Kirchner PT, el-Khoury GY. Diagnosis of infection in ununitedfractures. Combined imaging with indium-111-labeled leukocytes and technetium-99mmethylene diphosphonate. J Bone Joint Surg Am 1993;75:1816–22. https://doi.org/10.2106/00004623-199312000-00012
150. Nijhof MW, Oyen WJ, van Kampen A, Claessens RA, van der Meer JW, Corstens FH. Evaluation ofinfections of the locomotor system with indium-111-labeled human IgG scintigraphy. J Nucl Med1997;38:1300–5.
151. Noriega-Álvarez E, Martínez Pimienta GA, Benítez Segura AM, Bajén Lázaro MT, Rodríguez-GasénA, Rodríguez-Rubio Corona J, Mora-Salvadó J. Utility of 8 h and time decay-corrected acquisitionscintigraphy with in-vitro labeled white blood cells for the diagnosis of osteoarticular infection.Nucl Med Commun 2017;38:500–8. https://doi.org/10.1097/MNM.0000000000000678
152. Oyen WJ, van Horn JR, Claessens RA, Slooff TJ, van der Meer JW, Corstens FH. Diagnosis of bone,joint, and joint prosthesis infections with In-111-labeled nonspecific human immunoglobulinG scintigraphy. Radiology 1992;182:195–9. https://doi.org/10.1148/radiology.182.1.1727281
153. Palestro CJ, Kim CK, Swyer AJ, Vallabhajosula S, Goldsmith SJ. Radionuclide diagnosis of vertebralosteomyelitis: indium-111-leukocyte and technetium-99m-methylene diphosphonate bonescintigraphy. J Nucl Med 1991;32:1861–5.
154. Palestro CJ, Kipper SL, Weiland FL, Love C, Tomas MB. Osteomyelitis: diagnosis with 99mTc-labeledantigranulocyte antibodies compared with diagnosis with 111In-labeled leukocytes – initial experience.Radiology 2002;223:758–64. https://doi.org/10.1148/radiol.2233011072
155. Palestro CJ, Caprioli R, Love C, Richardson HL, Kipper SL, Weiland FL, Tomas MB. Rapid diagnosisof pedal osteomyelitis in diabetics with a technetium-99m-labeled monoclonal antigranulocyteantibody. J Foot Ankle Surg 2003;42:2–8. https://doi.org/10.1053/jfas.2003.50002
156. Sapienza MT, Hironaka F, Lima AL, Yamaga LY, Hamada E, Watanabe T, et al. [Evaluation ofinflammatory activity in chronic osteomyelitis. Contribution of scintigraphy with polyclonal antibodies.]Rev Assoc Med Bras 2000;46:106–12. https://doi.org/10.1590/S0104-42302000000200004
157. Sayle BA, Fawcett HD, Yudt WM, Wang SC, Mader JT, Cierny G. Indium-111 chloride imagingwith ununited fractures. Clin Nucl Med 1987;12:208–9. https://doi.org/10.1097/00003072-198703000-00010
158. Scheidler J, Leinsinger G, Pfahler M, Kirsch CM. Diagnosis of osteomyelitis. Accuracy andlimitations of antigranulocyte antibody imaging compared to three-phase bone scan. Clin Nucl Med1994;19:731–7. https://doi.org/10.1097/00003072-199408000-00019
159. Sciuk J, Brandau W, Vollet B, Stücker R, Erlemann R, Bartenstein P, et al. Comparison oftechnetium 99m polyclonal human immunoglobulin and technetium 99m monoclonal antibodiesfor imaging chronic osteomyelitis. First clinical results. Eur J Nucl Med 1991;18:401–7. https://doi.org/10.1007/BF02258431
DOI: 10.3310/hta23610 HEALTH TECHNOLOGY ASSESSMENT 2019 VOL. 23 NO. 61
© Queen’s Printer and Controller of HMSO 2019. This work was produced by Llewellyn et al. under the terms of a commissioning contract issued by the Secretary of State forHealth and Social Care. This issue may be freely reproduced for the purposes of private research and study and extracts (or indeed, the full report) may be included in professionaljournals provided that suitable acknowledgement is made and the reproduction is not associated with any form of advertising. Applications for commercial reproduction shouldbe addressed to: NIHR Journals Library, National Institute for Health Research, Evaluation, Trials and Studies Coordinating Centre, Alpha House, University of Southampton SciencePark, Southampton SO16 7NS, UK.
71
160. Seabold JE, Nepola JV, Conrad GR, Marsh JL, Montgomery WJ, Bricker JA, Kirchner PT. Detectionof osteomyelitis at fracture nonunion sites: comparison of two scintigraphic methods. AJR Am JRoentgenol 1989;152:1021–7. https://doi.org/10.2214/ajr.152.5.1021
161. Seabold JE, Nepola JV, Marsh JL, Hawes DR, Justin EP, Ponto JA, et al. Postoperative bone marrowalterations: potential pitfalls in the diagnosis of osteomyelitis with In-111-labeled leukocytescintigraphy. Radiology 1991;180:741–7. https://doi.org/10.1148/radiology.180.3.1871288
162. Seabold JE, Ferlic RJ, Marsh JL, Nepola JV. Periarticular bone sites associated with traumatic injury:false-positive findings with In-111-labeled white blood cell and Tc-99m MDP scintigraphy.Radiology 1993;186:845–9. https://doi.org/10.1148/radiology.186.3.8430197
163. Seldin DW, Heiken JP, Feldman F, Alderson PO. Effect of soft-tissue pathology on detection ofpedal osteomyelitis in diabetics. J Nucl Med 1985;26:988–93.
164. Singh B, Sunil HV, Sharma S, Prasad V, Kashyap R, Bhattacharya A, et al. Efficacy of indigenouslydeveloped single vial kit preparation of 99mTc-ciprofloxacin in the detection of bacterialinfection: an Indian experience. Nucl Med Commun 2008;29:1123–9. https://doi.org/10.1097/MNM.0b013e328318b369
165. Sorsdahl OA, Goodhart GL, Williams HT, Hanna LJ, Rodriquez J. Quantitative bone galliumscintigraphy in osteomyelitis. Skeletal Radiol 1993;22:239–42. https://doi.org/10.1007/BF00197666
166. Tumeh SS, Aliabadi P, Seltzer SE, Weissman BN, McNeil BJ. Chronic osteomyelitis: the relativeroles of scintigrams, plain radiographs, and transmission computed tomography. Clin Nucl Med1988;13:710–15. https://doi.org/10.1097/00003072-198810000-00006
167. Unal SN, Birinci H, Baktiroglu S, Cantez S. Comparison of Tc-99m methylene diphosphonate,Tc-99m human immune globulin, and Tc-99m-labeled white blood cell scintigraphy in the diabeticfoot. Clin Nucl Med 2001;26:1016–21. https://doi.org/10.1097/00003072-200112000-00005
168. Vicente AG, Almoguera M, Alonso JC, Heffernan AJ, Gomez A, Contreras PI, et al. Diagnosis oforthopedic infection in clinical practice using Tc-99m sulesomab (antigranulocyte monoclonalantibody fragment Fab’2). Clin Nucl Med 2004;29:781–5. https://doi.org/10.1097/00003072-200412000-00001
169. Wukich DK, Abreu SH, Callaghan JJ, Van Nostrand D, Savory CG, Eggli DF, et al. Diagnosis ofinfection by preoperative scintigraphy with indium-labeled white blood cells. J Bone Joint SurgAm 1987;69:1353–60. https://doi.org/10.2106/00004623-198769090-00008
170. Wukich DK, Van Dam BE, Abreu SH. Preoperative indium-labeled white blood cell scintigraphy insuspected osteomyelitis of the axial skeleton. Spine 1988;13:1168–70. https://doi.org/10.1097/00007632-198810000-00020
171. Zeiger LS, Fox IM. Use of indium-111-labeled white blood cells in the diagnosis of diabetic footinfections. J Foot Surg 1990;29:46–51.
172. Martinez-Rios C, Jariwala M, Highmore K, Duffy KW, Laxer R, Stimec J. Sterile pyogenic arthritispyoderma gangrenosum, and acne (PAPA) syndrome: Musculoskeletal imaging findings andcommon differential diagnosis in children. Pediatr Radiol 2016;46(Suppl. 1):1–372. https://doi.org/10.1007/s00247-016-3579-x
173. Wagner FW Jr. Treatment of the diabetic foot. Compr Ther 1984;10:29–38.
REFERENCES
NIHR Journals Library www.journalslibrary.nihr.ac.uk
72
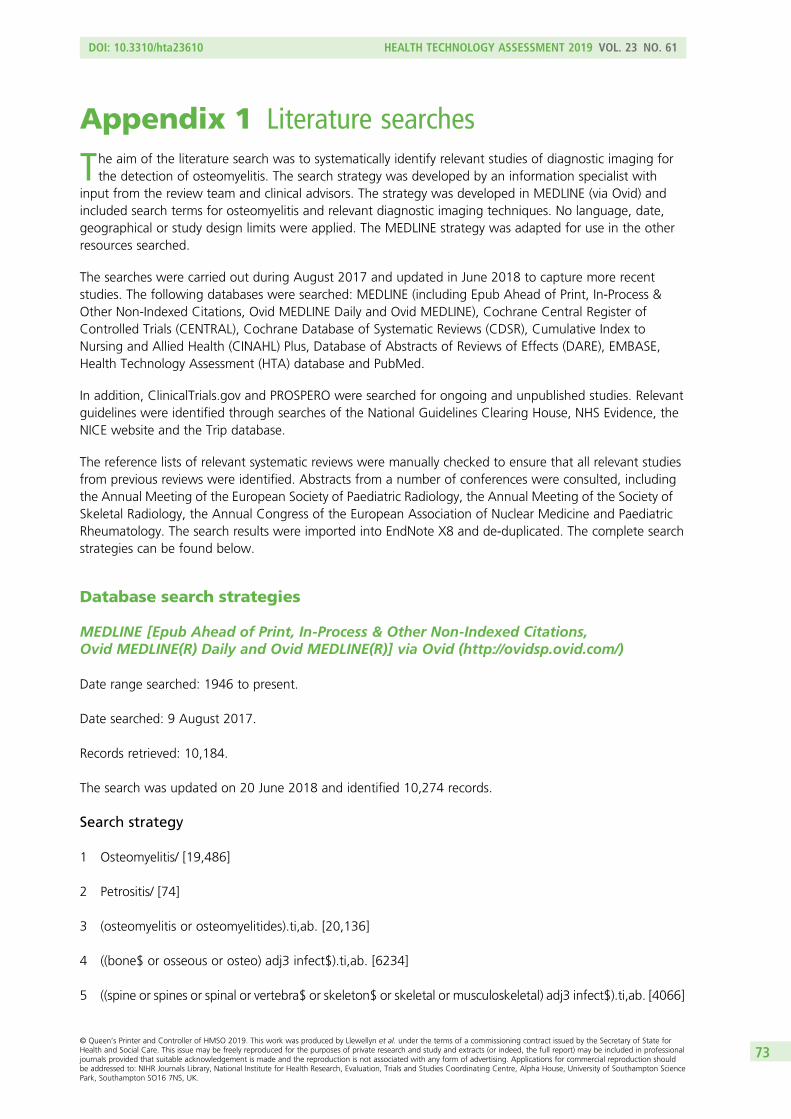
Appendix 1 Literature searches
The aim of the literature search was to systematically identify relevant studies of diagnostic imaging forthe detection of osteomyelitis. The search strategy was developed by an information specialist with
input from the review team and clinical advisors. The strategy was developed in MEDLINE (via Ovid) andincluded search terms for osteomyelitis and relevant diagnostic imaging techniques. No language, date,geographical or study design limits were applied. The MEDLINE strategy was adapted for use in the otherresources searched.
The searches were carried out during August 2017 and updated in June 2018 to capture more recentstudies. The following databases were searched: MEDLINE (including Epub Ahead of Print, In-Process &Other Non-Indexed Citations, Ovid MEDLINE Daily and Ovid MEDLINE), Cochrane Central Register ofControlled Trials (CENTRAL), Cochrane Database of Systematic Reviews (CDSR), Cumulative Index toNursing and Allied Health (CINAHL) Plus, Database of Abstracts of Reviews of Effects (DARE), EMBASE,Health Technology Assessment (HTA) database and PubMed.
In addition, ClinicalTrials.gov and PROSPERO were searched for ongoing and unpublished studies. Relevantguidelines were identified through searches of the National Guidelines Clearing House, NHS Evidence, theNICE website and the Trip database.
The reference lists of relevant systematic reviews were manually checked to ensure that all relevant studiesfrom previous reviews were identified. Abstracts from a number of conferences were consulted, includingthe Annual Meeting of the European Society of Paediatric Radiology, the Annual Meeting of the Society ofSkeletal Radiology, the Annual Congress of the European Association of Nuclear Medicine and PaediatricRheumatology. The search results were imported into EndNote X8 and de-duplicated. The complete searchstrategies can be found below.
Database search strategies
MEDLINE [Epub Ahead of Print, In-Process & Other Non-Indexed Citations,Ovid MEDLINE(R) Daily and Ovid MEDLINE(R)] via Ovid (http://ovidsp.ovid.com/)
Date range searched: 1946 to present.
Date searched: 9 August 2017.
Records retrieved: 10,184.
The search was updated on 20 June 2018 and identified 10,274 records.
Search strategy
1 Osteomyelitis/ [19,486]
2 Petrositis/ [74]
3 (osteomyelitis or osteomyelitides).ti,ab. [20,136]
4 ((bone$ or osseous or osteo) adj3 infect$).ti,ab. [6234]
5 ((spine or spines or spinal or vertebra$ or skeleton$ or skeletal or musculoskeletal) adj3 infect$).ti,ab. [4066]
DOI: 10.3310/hta23610 HEALTH TECHNOLOGY ASSESSMENT 2019 VOL. 23 NO. 61
© Queen’s Printer and Controller of HMSO 2019. This work was produced by Llewellyn et al. under the terms of a commissioning contract issued by the Secretary of State forHealth and Social Care. This issue may be freely reproduced for the purposes of private research and study and extracts (or indeed, the full report) may be included in professionaljournals provided that suitable acknowledgement is made and the reproduction is not associated with any form of advertising. Applications for commercial reproduction shouldbe addressed to: NIHR Journals Library, National Institute for Health Research, Evaluation, Trials and Studies Coordinating Centre, Alpha House, University of Southampton SciencePark, Southampton SO16 7NS, UK.
73

6 ((tibia or tibial or femur or humerus or humeral) adj3 infect$).ti,ab. [405]
7 majeed syndrome$.ti,ab. [32]
8 (petrositis or petrositides or Gradenigo$ or petrous apiciti$).ti,ab. [251]
9 or/[1-8 34,520]
10 exp Diagnostic Imaging/ [2,430,931]
11 (imag$ adj3 (diagnos$ or test$ or tool$ or procedure$ or method$ or technique$ or technolog$ ormodalit$)).ti,ab. [168,689]
12 radiograph$.ti,ab. [191,546]
13 (x-ray$ or xray$ or roentgen$).ti,ab. [337,423]
14 (bone$ adj2 (scan$ or imag$)).ti,ab. [12,239]
15 (radionuclide adj2 (imag$ or scan$ or diagnos$)).ti,ab. [4856]
16 radioisotope$ scan$.ti,ab. [683]
17 (nuclear adj2 (medicine or imag$ or scan$)).ti,ab. [14,606]
18 ((magnetic resonance adj (imag$ or scan$ or tomograph$)) or MRI or MR imag$ or MR scan$ or MRtomograph$ or MRT or NMR or NMRI or fMRI or chemical shift imag$).ti,ab. [510,943]
19 ((compute$ adj2 tomograph$) or tomodensitometry or cine-CT).ti,ab. [253,513]
20 ((CT or CAT) adj (scan$ or imag$)).ti,ab. [105,989]
21 ((emission or positron or proton) adj2 tomograph$).ti,ab. [64,652]
22 (PET or PET-CT$ or PET?CT$ or CT-PET$ or CT?PET$).ti,ab. [79,016]
23 (SPECT or SPECT-CT$ or SPECT?CT$ or CT-SPECT$ or CT?SPECT$).ti,ab. [25,475]
24 (SPET or SPET-CT$ or SPET?CT$ or CT-SPET$ or CT?SPET$).ti,ab. [1321]
25 (PET-MRI$ or PET?MRI$).ti,ab. [1227]
26 Fluorodeoxyglucose F18/ [25,483]
27 ((FDG or fluorodeoxyglucose) adj4 (imag$ or scan$)).ti,ab. [9778]
28 (FDG-PET$ or FDG?PET$).ti,ab. [20,415]
29 (ultrasound$ or ultrasonograph$ or echograph$ or ultrasonic or sonograph$ or echotomograph$ orechogram$ or echoscop$ or echosound$).ti,ab. [351,485]
30 (scintigraph$ or scintiphotograph$ or scintigram$).ti,ab. [47,128]
APPENDIX 1
NIHR Journals Library www.journalslibrary.nihr.ac.uk
74

31 (scintiscan$ or immunoscintigra$ or leu#oscintigra$).ti,ab. [2486]
32 ((leu#ocyte$ adj2 (scan$ or imag$)) or leu#oscan$).ti,ab. [697]
33 (white blood cell$ adj2 (scan$ or imag$)).ti,ab. [195]
34 (WBC scan$ or WBCS).ti,ab. [2034]
35 or/[10-34 3,217,417]
36 9 and [35 10,908]
37 exp animals/not humans/ [4,448,945]
38 36 not [37 10,184]
Key/ = indexing term (MeSH heading).
exp = exploded indexing term (MeSH heading).
$ = truncation.
? = optional wildcard, stands for zero or one character.
# = mandated wildcard, stands for one character within a word.
ti,ab = terms in either title or abstract fields.
adj3 = terms within three words of each other (any order).
Cochrane Central Register of Controlled Trials via Wiley (http://onlinelibrary.wiley.com/)
Date range searched: issue 7 of 12, July 2017.
Date searched: 9 August 2017.
Records retrieved: 147.
The strategy below was used to search CENTRAL and CDSR.
The search was updated on 20 June 2018 and identified 167 records from CENTRAL.
Search strategy
#1 MeSH descriptor: [Osteomyelitis] this term only [131]
#2 MeSH descriptor: [Petrositis] this term only [0]
#3 (osteomyelitis or osteomyelitides):ti,ab,kw [367]
#4 ((bone* or osseous or osteo) near/3 infect*):ti,ab,kw [307]
DOI: 10.3310/hta23610 HEALTH TECHNOLOGY ASSESSMENT 2019 VOL. 23 NO. 61
© Queen’s Printer and Controller of HMSO 2019. This work was produced by Llewellyn et al. under the terms of a commissioning contract issued by the Secretary of State forHealth and Social Care. This issue may be freely reproduced for the purposes of private research and study and extracts (or indeed, the full report) may be included in professionaljournals provided that suitable acknowledgement is made and the reproduction is not associated with any form of advertising. Applications for commercial reproduction shouldbe addressed to: NIHR Journals Library, National Institute for Health Research, Evaluation, Trials and Studies Coordinating Centre, Alpha House, University of Southampton SciencePark, Southampton SO16 7NS, UK.
75

#5 ((spine or spines or spinal or vertebra* or skeleton* or skeletal or musculoskeletal) near/3infect*):ti,ab,kw [184]
#6 ((tibia or tibial or femur or humerus or humeral) near/3 infect*):ti,ab,kw [55]
#7 (majeed next syndrome*):ti,ab,kw [0]
#8 (petrositis or petrositides or Gradenigo* or petrous next apiciti*):ti,ab,kw [3]
#9 #1 or #2 or #3 or #4 or #5 or #6 or #7 or #8 [845]
#10 MeSH descriptor: [Diagnostic Imaging] explode all trees [45,280]
#11 (imag* near/3 (diagnos* or test* or tool* or procedure* or method* or technique* or technolog* ormodalit*)):ti,ab,kw [10,201]
#12 radiograph*:ti,ab,kw [14,487]
#13 (x-ray* or xray* or roentgen*):ti,ab,kw [12,891]
#14 (bone* near/2 (scan* or imag*)):ti,ab,kw [513]
#15 (radionuclide near/2 (imag* or scan* or diagnos*)):ti,ab,kw [1683]
#16 (radioisotope* next scan*):ti,ab,kw [6]
#17 (nuclear near/2 (medicine or imag* or scan*)):ti,ab,kw [1197]
#18 ((magnetic next resonance next (imag* or scan* or tomograph*)) or MRI or MR next imag* orMR next scan* or MR next tomograph* or MRT or NMR or NMRI or fMRI or chemical next shift nextimag*):ti,ab,kw [18,678]
#19 ((compute* near/2 tomograph*) or tomodensitometry or cine-CT):ti,ab,kw [13,251]
#20 ((CT or CAT) next (scan* or imag*)):ti,ab,kw [3595]
#21 ((emission or positron or proton) near/2 tomograph*):ti,ab,kw [5445]
#22 (PET or PET-CT* or PET*CT* or CT-PET* or CT*PET*):ti,ab,kw [3930]
#23 (SPECT or SPECT-CT* or SPECT*CT* or CT-SPECT* or CT*SPECT*):ti,ab,kw [1385]
#24 (SPET or SPET-CT* or SPET*CT* or CT-SPET* or CT*SPET*):ti,ab,kw [96]
#25 (PET-MRI* or PET*MRI*):ti,ab,kw [49]
#26 MeSH descriptor: [Fluorodeoxyglucose F18] this term only [815]
#27 ((FDG or fluorodeoxyglucose) near/4 (imag* or scan*)):ti,ab,kw [602]
#28 (FDG-PET* or FDG*PET*):ti,ab,kw [1142]
APPENDIX 1
NIHR Journals Library www.journalslibrary.nihr.ac.uk
76

#29 (ultrasound* or ultrasonograph* or echograph* or ultrasonic or sonograph* or echotomograph* orechogram* or echoscop* or echosound*):ti,ab,kw [24,819]
#30 (scintigraph* or scintiphotograph* or scintigram*):ti,ab,kw [2121]
#31 (scintiscan* or immunoscintigra* or leu?oscintigra*):ti,ab,kw [868]
#32 ((leu?ocyte* near/2 (scan* or imag*)) or leu?oscan$):ti,ab,kw [29]
#33 (“white blood cell” near/2 (scan* or imag*)):ti,ab,kw [5]
#34 (“white blood cells” near/2 (scan* or imag*)):ti,ab,kw [0]
#35 (WBC next scan* or WBCS):ti,ab,kw [136]
#36 {or #10 to #35} [93,342]
#37 #9 and #36 [164]
#38 #9 and #36 in Cochrane Reviews (Reviews and Protocols) 6
#39 #9 and #36 in Trials [147]
KeyMeSH descriptor = indexing term (MeSH heading).
* = truncation.
? = wildcard, matches a single character within a word.
ti,ab,kw = terms in either title or abstract or keyword fields.
near/3 = terms within three words of each other (any order).
next = terms next to each other (order specified).
“ “ = phrase search.
Cochrane Database of Systematic Reviews via Wiley (http://onlinelibrary.wiley.com/)
Date range searched: issue 8 of 12, August 2017.
Date searched: 9 August 2017.
Records retrieved: 6.
See above under CENTRAL for search strategy used.
The search was updated on 20 June 2018 and identified six records from CDSR.
DOI: 10.3310/hta23610 HEALTH TECHNOLOGY ASSESSMENT 2019 VOL. 23 NO. 61
© Queen’s Printer and Controller of HMSO 2019. This work was produced by Llewellyn et al. under the terms of a commissioning contract issued by the Secretary of State forHealth and Social Care. This issue may be freely reproduced for the purposes of private research and study and extracts (or indeed, the full report) may be included in professionaljournals provided that suitable acknowledgement is made and the reproduction is not associated with any form of advertising. Applications for commercial reproduction shouldbe addressed to: NIHR Journals Library, National Institute for Health Research, Evaluation, Trials and Studies Coordinating Centre, Alpha House, University of Southampton SciencePark, Southampton SO16 7NS, UK.
77

Cumulative Index to Nursing and Allied Health Plus via EBSCO (www.ebscohost.com/)
Date range searched: inception to 8 August 2017.
Date searched: 9 August 2017.
Records retrieved: 1590.
The search was updated on 20 June 2018 and identified 1781 records.
Search strategy
S1 (MH “Osteomyelitis”) [2641]
S2 (MH “Gradenigo Syndrome”) [15]
S3 TI (osteomyelitis or osteomyelitides) OR AB (osteomyelitis or osteomyelitides) [2690]
S4 TI ((bone* or osseous or osteo) N3 infect*)) OR AB ((bone* or osseous or osteo) N3 infect*)) [906]
S5 TI ((spine or spines or spinal or vertebra* or skeleton* or skeletal or musculoskeletal) N3 infect*) ORAB ((spine or spines or spinal or vertebra* or skeleton* or skeletal or musculoskeletal) N3 infect*) [1003]
S6 TI ((tibia or tibial or femur or humerus or humeral) N3 infect*) OR AB ((tibia or tibial or femur orhumerus or humeral) N3 infect*) [153]
S7 TI majeed N1 syndrome* OR AB majeed N1 syndrome* [12]
S8 TI (petrositis or petrositides or Gradenigo* or petrous N1 apiciti*) OR AB (petrositis or petrositides orGradenigo* or petrous N1 apiciti*) [32]
S9 S1 OR S2 OR S3 OR S4 OR S5 OR S6 OR S7 OR S8 [5277]
S10 (MH “Diagnostic Imaging+”) [292,403]
S11 TI (imag* N3 (diagnos* or test* or tool* or procedure* or method* or technique* or technolog* ormodalit*)) OR AB (imag* N3 (diagnos* or test* or tool* or procedure* or method* or technique* ortechnolog* or modalit*)) [28,469]
S12 TI radiograph* OR AB radiograph* [38,222]
S13 TI (x-ray* or xray* or roentgen*) OR AB (x-ray* or xray* or roentgen*) [16,289]
S14 TI ((bone* N2 (scan* or imag*)) OR AB ((bone* N2 (scan* or imag*)) [1884]
S15 TI (radionuclide N2 (imag* or scan* or diagnos*)) OR AB (radionuclide N2 (imag* or scan* ordiagnos*)) [394]
S16 TI radioisotope* N1 scan* OR AB radioisotope* N1 scan* [26]
S17 TI (nuclear N2 (medicine or imag* or scan*)) OR AB (nuclear N2 (medicine or imag* or scan*)) [1840]
S18 TI ((“magnetic resonance” or MR) N1 (imag* or scan* or tomograph*)) OR AB ((“magneticresonance” or MR) N1 (imag* or scan* or tomograph*)) [39,205]
APPENDIX 1
NIHR Journals Library www.journalslibrary.nihr.ac.uk
78

S19 TI (MRI or MRT or NMR or NMRI or fMRI) OR AB (MRI or MRT or NMR or NMRI or fMRI) [39,230]
S20 TI chemical N1 shift N1 imag* OR AB chemical N1 shift N1 imag* [71]
S21 TI ((compute* N2 tomograph*) or tomodensitometry or cine-CT) OR AB ((compute* N2 tomograph*)or tomodensitometry or cine-CT) [42,942]
S22 TI (CAT N1 (scan* or imag*)) OR AB (CAT N1 (scan* or imag*)) [100]
S23 TI ((emission or positron or proton) N2 tomograph*) OR AB ((emission or positron or proton) N2tomograph*) [9054]
S24 TI (PET or PET-CT* or PET#CT* or CT-PET* or CT#PET*) OR AB (PET or PET-CT* or PET#CT* orCT-PET* or CT#PET*) [59,312]
S25 TI (SPECT or SPECT-CT* or SPECT#CT* or CT-SPECT* or CT#SPECT*) OR AB (SPECT or SPECT-CT*or SPECT#CT* or CT-SPECT* or CT#SPECT*) [54,720]
S26 TI (SPET or SPET-CT* or SPET#CT* or CT-SPET* or CT#SPET*) OR AB (SPET or SPET-CT* orSPET#CT* or CT-SPET* or CT#SPET*) [52,699]
S27 TI (PET-MRI* or PET#MRI*) OR AB (PET-MRI* or PET#MRI*) [235]
S28 (MH “Fludeoxyglucose F 18”) [4313]
S29 TI ((FDG or fluorodeoxyglucose) N4 (imag* or scan*)) OR AB ((FDG or fluorodeoxyglucose) N4 (imag*or scan*)) [1791]
S30 TI (FDG-PET* or FDG#PET*) OR AB (FDG-PET* or FDG#PET*) [3659]
S31 TI (ultrasound* or ultrasonograph* or echograph* or ultrasonic or sonograph* or echotomograph*or echogram* or echoscop* or echosound*) OR AB (ultrasound* or ultrasonograph* or echograph* orultrasonic or sonograph* or echotomograph* or echogram* or echoscop* or echosound*) [54,423]
S32 TI (scintigraph* or scintiphotograph* or scintigram*) OR AB (scintigraph* or scintiphotograph* orscintigram*) [2711]
S33 TI (scintiscan* or immunoscintigra* or leu?oscintigra*) OR AB (scintiscan* or immunoscintigra* orleu?oscintigra*) [34]
S34 TI (leu?ocyte* N2 (scan* or imag*)) OR AB (leu?ocyte* N2 (scan* or imag*)) [43]
S35 TI leu?oscan* OR AB leu?oscan* [1]
S36 TI (“white blood cell” N2 (scan* or imag*)) OR AB (“white blood cell” N2 (scan* or imag*)) [16]
S37 TI (“white blood cells” N2 (scan* or imag*)) OR AB (“white blood cells” N2 (scan* or imag*)) [4]
S38 TI ((WBC N1 scan*) or WBCS) OR AB ((WBC N1 scan*) or WBCS) [1459]
S39 S10 OR S11 OR S12 OR S13 OR S14 OR S15 OR S16 OR S17 OR S18 OR S19 OR S20 OR S21 ORS22 OR S23 OR S24 OR S25 OR S26 OR S27 OR S28 OR S29 OR S30 OR S31 OR S32 OR S33 OR S34 ORS35 OR S36 OR S37 OR S38 [405,211]
S40 S9 AND S39 [1590]
DOI: 10.3310/hta23610 HEALTH TECHNOLOGY ASSESSMENT 2019 VOL. 23 NO. 61
© Queen’s Printer and Controller of HMSO 2019. This work was produced by Llewellyn et al. under the terms of a commissioning contract issued by the Secretary of State forHealth and Social Care. This issue may be freely reproduced for the purposes of private research and study and extracts (or indeed, the full report) may be included in professionaljournals provided that suitable acknowledgement is made and the reproduction is not associated with any form of advertising. Applications for commercial reproduction shouldbe addressed to: NIHR Journals Library, National Institute for Health Research, Evaluation, Trials and Studies Coordinating Centre, Alpha House, University of Southampton SciencePark, Southampton SO16 7NS, UK.
79

KeyMH = indexing term (CINAHL heading).
* = truncation.
# = wildcard, stands for zero or one character.
? = wildcard, stands for one character.
TI = terms in the title.
AB = terms in the abstract.
N3 = terms within three words of each other (any order).
Database of Abstracts of Reviews of Effects via (www.crd.york.ac.uk/CRDWeb/)
Date range searched: inception to 31 March 2015.
Date searched: 9 August 2017.
Records retrieved: 14.
The strategy below was used to search DARE and the HTA database.
The search of the DARE database was not updated as it closed at the end of March 2015.
Search strategy
1 MeSH DESCRIPTOR Osteomyelitis IN DARE,HTA [22]
2 MeSH DESCRIPTOR Petrositis IN DARE,HTA [0]
3 (osteomyelitis or osteomyelitides) IN DARE, HTA [51]
4 ((bone* or osseous or osteo) NEAR3 infect*) OR (infect* NEAR3 (bone* or osseous or osteo)) IN DARE,HTA [21]
5 ((spine or spines or spinal or vertebra* or skeleton* or skeletal or musculoskeletal) NEAR3 infect*) OR(infect* NEAR3 (spine or spines or spinal or vertebra* or skeleton* or skeletal or musculoskeletal)) INDARE, HTA [22]
6 ((tibia or tibial or femur or humerus or humeral) NEAR3 infect*) OR (infect* NEAR3 (tibia or tibial orfemur or humerus or humeral)) IN DARE, HTA [2]
7 (majeed syndrome*) IN DARE, HTA [0]
8 (petrositis or petrositides or Gradenigo* or petrous apiciti*) IN DARE, HTA [0]
9 #1 OR #2 OR #3 OR #4 OR #5 OR #6 OR #7 OR #8 [88]
10 MeSH DESCRIPTOR Diagnostic imaging EXPLODE ALL TREES IN DARE,HTA [2969]
APPENDIX 1
NIHR Journals Library www.journalslibrary.nihr.ac.uk
80

11 (imag* NEAR3 (diagnos* or test* or tool* or procedure* or method* or technique* or technolog* ormodalit*)) OR ((diagnos* or test* or tool* or procedure* or method* or technique* or technolog* ormodalit*) NEAR3 imag*) IN DARE, HTA [1173]
12 (radiograph*) IN DARE, HTA [1092]
13 (x-ray* or xray* or roentgen*) IN DARE, HTA [873]
14 (bone* NEAR2 (scan* or imag*)) OR ((scan* or imag*) NEAR2 bone*) IN DARE, HTA [48]
15 (radionuclide NEAR2 (imag* or scan* or diagnos*)) OR ((imag* or scan* or diagnos*) NEAR2radionuclide) IN DARE, HTA [313]
16 (radioisotope* scan*) IN DARE, HTA [1]
17 (nuclear NEAR2 (medicine or imag* or scan*)) OR ((medicine or imag* or scan*) NEAR2 nuclear) INDARE, HTA [102]
18 (MRI or MRT or NMR or NMRI or fMRI) IN DARE, HTA [506]
19 (chemical shift imag*) IN DARE, HTA [1]
20 (compute* NEAR2 tomograph*) IN DARE, HTA [942]
21 (tomograph* NEAR2 compute*) IN DARE, HTA [809]
22 (tomodensitometry or cine-CT) IN DARE, HTA [0]
23 (CT scan* or CAT scan*) OR (CT imag* or CT imag*) IN DARE, HTA [186]
24 ((emission or positron or proton) NEAR2 tomograph*) OR (tomograph* NEAR2 (emission or positronor proton)) IN DARE, HTA [602]
25 (PET or PET-CT* or PET/CT* or PETCT* or CT-PET* or CT/PET* or CTPET*) IN DARE, HTA [437]
26 (SPECT or SPECT-CT* or SPECT/CT* or SPECTCT* or CT-SPECT* or CT/SPECT* or CTSPECT*) INDARE, HTA [73]
27 (SPET or SPET-CT* or SPET/CT* or SPETCT* or CT-SPET* or CT/SPET* or CTSPET*) IN DARE, HTA [2]
28 (PET-MRI* or PET/MRI* or PETMRI*) IN DARE, HTA [8]
29 MeSH DESCRIPTOR Fluorodeoxyglucose F18 IN DARE,HTA [223]
30 ((FDG or fluorodeoxyglucose) NEAR4 (imag* or scan*)) OR ((imag* or scan*) NEAR4 (FDG orfluorodeoxyglucose)) IN DARE, HTA [133]
31 (FDG-PET* or FDG/PET* or FDGPET*) IN DARE, HTA [200]
32 (ultrasound* or ultrasonograph* or echograph* or ultrasonic or sonograph* or echotomograph* orechogram* or echoscop* or echosound*) IN DARE, HTA [1722]
33 (scintigraph* or scintiphotograph* or scintigram*) IN DARE, HTA [105]
DOI: 10.3310/hta23610 HEALTH TECHNOLOGY ASSESSMENT 2019 VOL. 23 NO. 61
© Queen’s Printer and Controller of HMSO 2019. This work was produced by Llewellyn et al. under the terms of a commissioning contract issued by the Secretary of State forHealth and Social Care. This issue may be freely reproduced for the purposes of private research and study and extracts (or indeed, the full report) may be included in professionaljournals provided that suitable acknowledgement is made and the reproduction is not associated with any form of advertising. Applications for commercial reproduction shouldbe addressed to: NIHR Journals Library, National Institute for Health Research, Evaluation, Trials and Studies Coordinating Centre, Alpha House, University of Southampton SciencePark, Southampton SO16 7NS, UK.
81

34 (scintiscan* or immunoscintigra* or leucoscintigra* or leukoscintigra*) IN DARE, HTA [1]
35 ((leucocyte* or leukocyte*) NEAR2 (scan* or imag*)) OR ((scan* or imag*) NEAR2 (leucocyte* orleukocyte*)) IN DARE, HTA [2]
36 (leukoscan* or leucoscan*) IN DARE, HTA [1]
37 (white blood cell* NEAR2 (scan* or imag*)) OR ((scan* or imag*) NEAR2 white blood cell*) IN DARE,HTA [1]
38 (WBC scan* or WBCS) IN DARE, HTA [4]
39 (magnetic resonance imag* or magnetic resonance scan* or magnetic resonance tomograph*) INDARE, HTA [852]
40 (MR imag* or MR scan* or MR tomograph*) IN DARE, HTA [31]
41 #10 OR #11 OR #12 OR #13 OR #14 OR #15 OR #16 OR #17 OR #18 OR #19 OR #20 OR #21 OR#22 OR #23 OR #24 OR #25 OR #26 OR #27 OR #28 OR #29 OR #30 OR #31 OR #32 OR #33 OR #34 OR#35 OR #36 OR #37 OR #38 OR #39 OR #40 [5045]
42 #9 AND #41 (16) (14 DARE, 2 HTA)
KeyMeSH DESCRIPTOR = indexing term (MeSH heading).
* = truncation.
NEAR3 = terms within three words of each other (order specified).
EMBASE via Ovid (http://ovidsp.ovid.com/)
Date range searched: 1974 to 8 August 2017.
Date searched: 9 August 2017.
Records retrieved: 14,494.
The search was updated on 20 June 2018 and identified 15,225 records.
Search strategy
1 osteomyelitis/or chronic osteomyelitis/or hematogenous osteomyelitis/or majeed syndrome/or petrositis/[29,324]
2 (osteomyelitis or osteomyelitides).ti,ab. [22,929]
3 ((bone$ or osseous or osteo) adj3 infect$).ti,ab. [7658]
4 ((spine or spines or spinal or vertebra$ or skeleton$ or skeletal or musculoskeletal) adj3 infect$).ti,ab.[5024]
5 ((tibia or tibial or femur or humerus or humeral) adj3 infect$).ti,ab. [476]
APPENDIX 1
NIHR Journals Library www.journalslibrary.nihr.ac.uk
82

6 majeed syndrome$.ti,ab. [46]
7 (petrositis or petrositides or Gradenigo$ or petrous apiciti$).ti,ab. [263]
8 or/1-7 [44,156]
9 exp diagnostic imaging/ [143,551]
10 (imag$ adj3 (diagnos$ or test$ or tool$ or procedure$ or method$ or technique$ or technolog$ ormodalit$)).ti,ab. [232,999]
11 radiography/ [253,398]
12 exp bone radiography/ [62,582]
13 X ray/ [59,947]
14 radiograph$.ti,ab. [227,261]
15 (x-ray$ or xray$ or roentgen$).ti,ab. [365,257]
16 (bone$ adj2 (scan$ or imag$)).ti,ab. [17,134]
17 (radionuclide adj2 (imag$ or scan$ or diagnos$)).ti,ab. [5946]
18 radioisotope$ scan$.ti,ab. [758]
19 (nuclear adj2 (medicine or imag$ or scan$)).ti,ab. [26,429]
20 exp nuclear magnetic resonance imaging/ [759,296]
21 ((magnetic resonance adj (imag$ or scan$ or tomograph$)) or MRI or MR imag$ or MR scan$ or MRtomograph$ or MRT or NMR or NMRI or fMRI or chemical shift imag$).ti,ab. [681,481]
22 exp computer assisted tomography/ [846,193]
23 ((compute$ adj2 tomograph$) or tomodensitometry or cine-CT).ti,ab. [302,150]
24 ((CT or CAT) adj (scan$ or imag$)).ti,ab. [164,664]
25 exp x-ray tomography/ [11,890]
26 exp emission tomography/ [146,279]
27 ((emission or positron or proton) adj2 tomograph$).ti,ab. [79,931]
28 (PET or PET-CT$ or PET?CT$ or CT-PET$ or CT?PET$).ti,ab. [128,903]
29 (SPECT or SPECT-CT$ or SPECT?CT$ or CT-SPECT$ or CT?SPECT$).ti,ab. [39,774]
30 (SPET or SPET-CT$ or SPET?CT$ or CT-SPET$ or CT?SPET$).ti,ab. [1533]
31 (PET-MRI$ or PET?MRI$).ti,ab. [2339]
DOI: 10.3310/hta23610 HEALTH TECHNOLOGY ASSESSMENT 2019 VOL. 23 NO. 61
© Queen’s Printer and Controller of HMSO 2019. This work was produced by Llewellyn et al. under the terms of a commissioning contract issued by the Secretary of State forHealth and Social Care. This issue may be freely reproduced for the purposes of private research and study and extracts (or indeed, the full report) may be included in professionaljournals provided that suitable acknowledgement is made and the reproduction is not associated with any form of advertising. Applications for commercial reproduction shouldbe addressed to: NIHR Journals Library, National Institute for Health Research, Evaluation, Trials and Studies Coordinating Centre, Alpha House, University of Southampton SciencePark, Southampton SO16 7NS, UK.
83

32 fluorodeoxyglucose f 18/ [48,488]
33 ((FDG or fluorodeoxyglucose) adj4 (imag$ or scan$)).ti,ab. [17,045]
34 (FDG-PET$ or FDG?PET$).ti,ab. [34,822]
35 exp echography/ [640,877]
36 (ultrasound$ or ultrasonograph$ or echograph$ or ultrasonic or sonograph$ or echotomograph$ orechogram$ or echoscop$ or echosound$).ti,ab. [479,205]
37 exp scintiscanning/ [172,675]
38 (scintigraph$ or scintiphotograph$ or scintigram$).ti,ab. [62,147]
39 (scintiscan$ or immunoscintigra$ or leu#oscintigra$).ti,ab. [3034]
40 ((leu#ocyte$ adj2 (scan$ or imag$)) or leu#oscan$).ti,ab. [857]
41 (white blood cell$ adj2 (scan$ or imag$)).ti,ab. [228]
42 (WBC scan$ or WBCS).ti,ab. [3270]
43 or/9-42 [3,184,438]
44 8 and 43 [15,191]
45 (animal/or animal experiment/or animal model/or animal tissue/or nonhuman/) not exp human/[5,733,000]
46 44 not 45 [14,494]
Key/ = indexing term (MeSH heading).
exp = exploded indexing term (MeSH heading).
$ = truncation.
? = optional wildcard, stands for zero or one character.
# = mandated wildcard, stands for one character within a word.
ti,ab = terms in either title or abstract fields.
adj3 = terms within three words of each other (any order).
Health Technology Assessment database via (http://www.crd.york.ac.uk/CRDWeb/)
Date range searched: inception to 8 August 2017.
Date searched: 9 August 2017.
APPENDIX 1
NIHR Journals Library www.journalslibrary.nihr.ac.uk
84

Records retrieved: 2.
See above under DARE for search strategy used.
The search of the HTA database was updated on 21 June 2018 and identified two records.
PubMed (http://www.ncbi.nlm.nih.gov/pubmed/)
Date range searched: inception to 9 August 2017.
Date searched: 9 August 2017.
Records retrieved: 1534.
The search was updated on 20 June 2018 and identified 1908 records.
Search strategy
Search (((((((((((((“Osteomyelitis”[Mesh:noexp]) OR “Petrositis”[Mesh:noexp]) OR ((osteomyelitis[Title/Abstract]OR osteomyelitides[Title/Abstract]))) OR (((bone*[Title/Abstract] OR osseous[Title/Abstract] OR osteo[Title/Abstract])) AND infect*[Title/Abstract])) OR (((spine[Title/Abstract] OR spines[Title/Abstract] OR spinal[Title/Abstract] OR vertebra*[Title/Abstract] OR skeleton*[Title/Abstract] OR skeletal[Title/Abstract] OR musculoskeletal[Title/Abstract])) AND infect*[Title/Abstract])) OR (((tibia[Title/Abstract] OR tibial[Title/Abstract] OR femur[Title/Abstract] OR humerus[Title/Abstract] OR humeral[Title/Abstract])) AND infect*[Title/Abstract])) OR ((majeedsyndrome[Title/Abstract]) OR majeed syndromes[Title/Abstract])) OR ((petrositis[Title/Abstract] OR petrositides[Title/Abstract] OR Gradenigo$[Title/Abstract] OR “petrous apicitis”[Title/Abstract] OR “petrous apicitides”[Title/Abstract])))) AND ((((((((((((((((((((((((((“Diagnostic Imaging”[Mesh]) OR ((((diagnos*[Title/Abstract] OR test*[Title/Abstract] OR tool*[Title/Abstract] OR procedure*[Title/Abstract] OR method*[Title/Abstract] OR technique*[Title/Abstract] OR technolog*[Title/Abstract] OR modalit*[Title/Abstract])) AND imag*[Title/Abstract])) ORradiograph*[Title/Abstract]) OR ((x-ray*[Title/Abstract] OR xray*[Title/Abstract] OR roentgen*[Title/Abstract]))) OR((bone*[Title/Abstract]) AND (scan*[Title/Abstract] OR imag*[Title/Abstract]))) OR ((radionuclide[Title/Abstract])AND (imag*[Title/Abstract] OR scan*[Title/Abstract] OR diagnos*[Title/Abstract]))) OR radioisotope scan*[Title/Abstract]) OR ((nuclear[Title/Abstract]) AND (medicine[Title/Abstract] OR imag*[Title/Abstract] OR scan*[Title/Abstract]))) OR ((((((((magnetic resonance imag*[Title/Abstract]) OR magnetic resonance scan*[Title/Abstract]) ORmagnetic resonance tomograph*[Title/Abstract]) OR MR imag*[Title/Abstract]) OR MR scan*[Title/Abstract]) ORMR tomograph*[Title/Abstract]) OR (MRI[Title/Abstract] OR MRT[Title/Abstract] OR NMR[Title/Abstract] OR NMRI[Title/Abstract] OR fMRI[Title/Abstract])) OR chemical shift imag*[Title/Abstract])) OR ((compute*[Title/Abstract])AND tomograph*[Title/Abstract])) OR ((tomodensitometry[Title/Abstract] OR cine-CT[Title/Abstract]))) OR (((CTscan*[Title/Abstract] OR CT imag*[Title/Abstract])) OR (CAT scan*[Title/Abstract] OR CAT imag*[Title/Abstract])))OR (((emission[Title/Abstract] OR positron[Title/Abstract] OR proton[Title/Abstract])) AND tomograph*[Title/Abstract])) OR ((PET[Title/Abstract] OR PET-CT*[Title/Abstract] OR PET/CT*[Title/Abstract] OR PETCT*[Title/Abstract] OR CT-PET*[Title/Abstract] OR CT/PET$[Title/Abstract] OR CTPET*[Title/Abstract]))) OR ((SPECT[Title/Abstract] OR SPECT-CT*[Title/Abstract] OR SPECT/CT*[Title/Abstract] OR SPECTCT*[Title/Abstract] ORCT-SPECT*[Title/Abstract] OR CT/SPECT*[Title/Abstract] OR CTSPECT*[Title/Abstract]))) OR ((SPET[Title/Abstract] OR SPET-CT*[Title/Abstract] OR SPET/CT*[Title/Abstract] OR SPETCT*[Title/Abstract] OR CT-SPET*[Title/Abstract] OR CT/SPET*[Title/Abstract] OR CTSPET*[Title/Abstract]))) OR ((PET-MRI*[Title/Abstract] OR PET/MRI*[Title/Abstract] OR PETMRI*[Title/Abstract]))) OR “Fluorodeoxyglucose F18”[Mesh:noexp]) OR ((FDG-PET*[Title/Abstract] OR FDG/PET*[Title/Abstract] OR FDGPET*[Title/Abstract]))) OR ((ultrasound*[Title/Abstract] ORultrasonograph*[Title/Abstract] OR echograph*[Title/Abstract] OR ultrasonic[Title/Abstract] OR sonograph*[Title/Abstract] OR echotomograph*[Title/Abstract] OR echogram*[Title/Abstract] OR echoscop*[Title/Abstract]OR echosound*[Title/Abstract]))) OR ((scintigraph*[Title/Abstract] OR scintiphotograph*[Title/Abstract] ORscintigram*[Title/Abstract]))) OR ((scintiscan*[Title/Abstract] OR immunoscintigra*[Title/Abstract] ORleucoscintigra*[Title/Abstract] OR leukoscintigra*[Title/Abstract]))) OR (((leucocyte*[Title/Abstract] OR
DOI: 10.3310/hta23610 HEALTH TECHNOLOGY ASSESSMENT 2019 VOL. 23 NO. 61
© Queen’s Printer and Controller of HMSO 2019. This work was produced by Llewellyn et al. under the terms of a commissioning contract issued by the Secretary of State forHealth and Social Care. This issue may be freely reproduced for the purposes of private research and study and extracts (or indeed, the full report) may be included in professionaljournals provided that suitable acknowledgement is made and the reproduction is not associated with any form of advertising. Applications for commercial reproduction shouldbe addressed to: NIHR Journals Library, National Institute for Health Research, Evaluation, Trials and Studies Coordinating Centre, Alpha House, University of Southampton SciencePark, Southampton SO16 7NS, UK.
85

leukocyte*[Title/Abstract])) AND (scan*[Title/Abstract] OR imag*[Title/Abstract]))) OR ((leukoscan*[Title/Abstract] OR leucoscan*[Title/Abstract]))) OR ((white blood cell*[Title/Abstract]) AND (scan*[Title/Abstract] ORimag*[Title/Abstract]))) OR ((WBC scan*[Title/Abstract] OR WBCS[Title/Abstract]))) OR ((((FDG[Title/Abstract]OR fluorodeoxyglucose[Title/Abstract])) AND (imag*[Title/Abstract] OR scan*[Title/Abstract])))))) NOT ((animals[mh] NOT humans[mh])))) AND ((pubstatusaheadofprint OR publisher[sb] OR pubmednotmedline[sb]))
The above search strategy incorporates the following search line to limit to studies found in PubMed butnot available in Ovid MEDLINE: (pubstatusaheadofprint OR publisher[sb] OR pubmednotmedline[sb]).172
Key[Mesh] = exploded indexing term (MeSH heading).
[Mesh:noexp] = indexing term (MeSH heading) not exploded.
* = truncation.
[Title/Abstract]) = terms in either title or abstract fields.
“ “ = phrase search.
Ongoing studies search strategies
ClinicalTrials.gov (https://clinicaltrials.gov/)
Date range searched: inception to 9 August 2017.
Searched date: 9 August 2017.
Records retrieved: 66.
The search was updated on 20 June 2018 and identified 76 records.
Searched in the condition field: osteomyelitis OR “bone infection”.
PROSPERO (www.crd.york.ac.uk/PROSPERO/)
Date range searched: inception to 9 August 2017.
Searched date: 9 August 2017.
Records retrieved: 20.
The search was updated on 21 June 2018 and identified 29 records.
Search strategy
#1 MeSH DESCRIPTOR osteomyelitis [6]
#2 MeSH DESCRIPTOR Petrositis [0]
#3 osteomyelitis OR osteomyelitides [38]
APPENDIX 1
NIHR Journals Library www.journalslibrary.nihr.ac.uk
86

#4 (bone* or osseous or osteo) adj3 infect* [18]
#5 (spine or spines or spinal or vertebra* or skeleton* or skeletal or musculoskeletal) adj3 infect* [29]
#6 (tibia or tibial or femur or humerus or humeral) adj3 infect* [2]
#7 majeed syndrome* [0]
#8 petrositis or petrositides or Gradenigo* or petrous apiciti* [0]
#9 #1 OR #2 OR #3 OR #4 OR #5 OR #6 OR #7 OR #8 [81]
#10 MeSH DESCRIPTOR Diagnostic Imaging EXPLODE ALL TREES [637]
#11 imag* adj3 (diagnos* or test* or tool* or procedure* or method* or technique* or technolog* ormodalit*) [460]
#12 imag* ADJ3 (diagnos* or test* or tool* or procedure* or method* or technique* or technolog* ormodalit*) [460]
#13 radiograph* [556]
#14 x-ray* or xray* or roentgen* [313]
#15 bone* adj2 (scan* or imag*) [16]
#16 radionuclide adj2 (imag* or scan* or diagnos*) [6]
#17 radioisotope* scan* [0]
#18 nuclear adj2 (medicine or imag* or scan*) [31]
#19 “magnetic resonance” adj (imag* or scan* or tomograph*) [373]
#20 “magnetic resonance” adj1 (imag* or scan* or tomograph*) [358]
#21 “MR” adj (imag* or scan* or tomograph*) [45}
#22 MRI or MRT or NMR or NMRI or fMRI or chemical shift imag* [678]
#23 compute* adj2 tomograph* [383]
#24 tomodensitometry or cine-CT [0]
#25 (CT or CAT) adj (scan* or imag*) [260]
#26 (emission or positron or proton) adj2 tomograph* [76]
#27 PET or PET-CT* or PET*CT* or CT-PET* or CT*PET* [142]
#28 SPECT or SPECT-CT* or SPECT*CT* or CT-SPECT* or CT*SPECT* [44]
#29 SPET or SPET-CT* or SPET*CT* or CT-SPET* or CT*SPET* [0]
DOI: 10.3310/hta23610 HEALTH TECHNOLOGY ASSESSMENT 2019 VOL. 23 NO. 61
© Queen’s Printer and Controller of HMSO 2019. This work was produced by Llewellyn et al. under the terms of a commissioning contract issued by the Secretary of State forHealth and Social Care. This issue may be freely reproduced for the purposes of private research and study and extracts (or indeed, the full report) may be included in professionaljournals provided that suitable acknowledgement is made and the reproduction is not associated with any form of advertising. Applications for commercial reproduction shouldbe addressed to: NIHR Journals Library, National Institute for Health Research, Evaluation, Trials and Studies Coordinating Centre, Alpha House, University of Southampton SciencePark, Southampton SO16 7NS, UK.
87

#30 PET-MRI* or PET*MRI* [5]
#31 MeSH DESCRIPTOR Fluorodeoxyglucose F18 [15]
#32 (FDG or fluorodeoxyglucose) adj4 (imag* or scan*) [13]
#33 FDG-PET* or FDG*PET* [24]
#34 ultrasound* or ultrasonograph* or echograph* or ultrasonic or sonograph* or echotomograph* orechogram* or echoscop* or echosound* [838]
#35 scintigraph* or scintiphotograph* or scintigram* [28]
#36 scintiscan* or immunoscintigra* or leucoscintigra* or leukoscintigra* [0]
#37 (leucocyte* or leukocyte*) adj2 (scan* or imag*) [0]
#38 white blood cell* adj2 (scan* or imag*) [0]
#39 WBC scan* or WBCS [4]
#40 #39 OR #38 OR #37 OR #36 OR #35 OR #34 OR #33 OR #32 OR #31 OR #30 OR #29 OR #28 OR#27 OR #26 OR #25 OR #24 OR #23 OR #22 OR #21 OR #20 OR #19 OR #18 OR #17 OR #16 OR #15 OR#14 OR #13 OR #12 OR #11 OR #10 [2500]
#41 #40 AND #9 [20]
#42 leukoscan* or leucoscan* [0]
#43 #40 OR #42 [2500]
#44 #9 AND #43 [20]
KeyMeSH DESCRIPTOR = indexing term (MeSH heading).
* = truncation.
ADJ3 = terms within three words of each other.
Guideline searches
National Guideline Clearinghouse (www.guideline.gov/)
Date searched: 31 August 2017.
Searched for osteomyelitis – 38 results.
The search was updated on 21 June 2018 and identified 33 results.
APPENDIX 1
NIHR Journals Library www.journalslibrary.nihr.ac.uk
88

NHS Evidence (www.evidence.nhs.uk/)
Date searched: 31 August 2017.
Searched for osteomyelitis, filtered results to limit to guidance – 161 results.
The search was updated on 21 June 2018 and identified 141 results.
National Institute for Health and Care Excellence (www.nice.org.uk/guidance)
Date searched: 31 August 2017.
Browsed the diagnostics guidance page (www.nice.org.uk/guidance/published?type=dg) – zero relevantrecords found.
Searched for the term osteomyelitis in the general website search box – 21 results browsed – two relevantrecords found.
The search was updated on 21 June 2018 but did not identify any further relevant records.
Trip (www.tripdatabase.com)
Date searched: 31 August 2017.
Searched for osteomyelitis – 95 results – browsed for relevance and checked against previous searchresults in EndNote for duplicates. One relevant record identified.
The search was updated on 21 June 2018 but did not identify any further relevant records.
DOI: 10.3310/hta23610 HEALTH TECHNOLOGY ASSESSMENT 2019 VOL. 23 NO. 61
© Queen’s Printer and Controller of HMSO 2019. This work was produced by Llewellyn et al. under the terms of a commissioning contract issued by the Secretary of State forHealth and Social Care. This issue may be freely reproduced for the purposes of private research and study and extracts (or indeed, the full report) may be included in professionaljournals provided that suitable acknowledgement is made and the reproduction is not associated with any form of advertising. Applications for commercial reproduction shouldbe addressed to: NIHR Journals Library, National Institute for Health Research, Evaluation, Trials and Studies Coordinating Centre, Alpha House, University of Southampton SciencePark, Southampton SO16 7NS, UK.
89


Appendix 2 Results of critical appraisal ofdiagnostic accuracy studies (QUADAS-2)
TABLE 15 The QUADAS-2 signalling questions for risk-of-bias assessment
Domain
Domain 1: patientselection Domain 2: index test
Domain 3: referencestandard
Domain 4: flow andtiming
SQ 1: was a consecutiveor random sample ofpatients enrolled?
SQ 1: were the index test resultsinterpreted without knowledgeof the results of the referencestandard?
SQ 1: is the referencestandard likely to correctlyclassify the target condition?
SQ 1: was there anappropriate intervalbetween the index test(s)and reference standard?
SQ 2: was acase–control designavoided?
SQ 2: if a threshold was used,was it prespecified?
SQ 2: were the referencestandard results interpretedwithout knowledge of theresults of the index test?
SQ 2: did all patientsreceive the samereference standard?
SQ 3: did the studyavoid inappropriateexclusions?
SQ 3: (optional: multiple tests)were the index test resultsinterpreted without knowledge ofthe results of other index tests?
SQ3: not applicable SQ 3: were all patientsincluded in the analysis?
SQ, signalling question.
Risk of bias: could theselection of patients have
introduced bias?
38% 56% 6%
Risk of bias: could theconduct or interpretation
of the index test haveintroduced bias?
62% 26% 12%
Risk of bias: could thereference standard,
its conduct or itsinterpretation have
introduced bias?
91% 8%1%
Risk of bias: could thepatient flow have
introduced bias?87% 8% 5%
Applicability concerns:are there concerns that
the included patientsand setting do not match
the review question?
92% 8%
Applicability concerns:are there concerns that the
index test, its conduct orinterpretation differ from
the review question?
97% 3%
Applicability concerns:are there concerns thatthe target condition as
defined by the referencestandard does not match
the review question?
100%
LowUnclearHigh
Risk of bias
FIGURE 20 Summary of risk of bias and applicability assessment.
DOI: 10.3310/hta23610 HEALTH TECHNOLOGY ASSESSMENT 2019 VOL. 23 NO. 61
© Queen’s Printer and Controller of HMSO 2019. This work was produced by Llewellyn et al. under the terms of a commissioning contract issued by the Secretary of State forHealth and Social Care. This issue may be freely reproduced for the purposes of private research and study and extracts (or indeed, the full report) may be included in professionaljournals provided that suitable acknowledgement is made and the reproduction is not associated with any form of advertising. Applications for commercial reproduction shouldbe addressed to: NIHR Journals Library, National Institute for Health Research, Evaluation, Trials and Studies Coordinating Centre, Alpha House, University of Southampton SciencePark, Southampton SO16 7NS, UK.
91

TABLE 16 The QUADAS-2 risk-of-bias decisions
First authorand year ofpublication
Could the selectionof patients haveintroduced bias?
Could the conduct orinterpretation of theindex test haveintroduced bias?
Could the referencestandard, its conductor its interpretationhave introduced bias?
Could the patientflow have introducedbias?
Abdel Razek(2017)37
Unclear. Not stated ifenrolment wasconsecutive
Low Low Low
Al-Khawari(2005)38
Unclear. Unclear ifparticipants wereincluded consecutivelyand limited reportingof selection criteria
Low Low Low
Al-Sheikh(1985)39
Low High. Index test resultsinterpreted withknowledge of the resultsof the referencestandard
Low Low
Aragón-Sánchez(2011)40
Low Low. Although lackof blinding to initialprobe-to-bone test forradiography cannot beexcluded
Low Low. Although 91patients with negativeradiography and probe-to-bone test did notundergo histopathologytests (25.5%)
Aslangul (2013)41 Low Low. ‘There werefindings compatible withOM on plain radiographyin 26 of 42 (60%) of thepatients who underwentbone puncture. Thus theenrolled patients were allat high risk for underlyingOM.’ Plain radiographywas not an index test inthis study
Low Low. Although ≥ 1 yearfollow-up and no biopsy/culture for all 13 patientswith negative index test(13/53 or 25% of totalpatients). All positiveindex test patientsreceived microbiology
Blume (1997)42 Unclear. Unclear ifpatients were recruitedconsecutively andlimited reporting ofselection criteria
Low. Althoughantibiotics were used in12/27 patients
Low Low
Bohchelian(2002)43
Unclear. Unclear ifconsecutively enrolledand exclusion criteriaNR
Low Low. Although it isunclear what methodswere used to prevent softtissue contaminationwhen collecting bonesample for culture
Low
Bolouri (2013)44 Unclear. A total of4/42 patients had aknown OM withsuspected exacerbation
Unclear. Owing touncertainty regardingblinding of staff todifferent index tests
Low. Although 12/35had clinical follow-upwithout histology, someof which were positive
Low. 30 patients hadbiopsy. 12 only hadclinical/imaging follow-up,some of whom wereconfirmed positive
Brunel (2016)45 Unclear. Unclear ifconsecutively enrolled
Low Low Low
Chacko (2003)46 Unclear. Insufficientinformation,retrospective study
Low Low Low. Although thenumber of patients whoreceived only 6≥monthsof clinical follow-up inthe patients confirmednegative (23/46) isunclear
APPENDIX 2
NIHR Journals Library www.journalslibrary.nihr.ac.uk
92

TABLE 16 The QUADAS-2 risk-of-bias decisions (continued )
First authorand year ofpublication
Could the selectionof patients haveintroduced bias?
Could the conduct orinterpretation of theindex test haveintroduced bias?
Could the referencestandard, its conductor its interpretationhave introduced bias?
Could the patientflow have introducedbias?
Croll (1996)47 Unclear. Unclear ifrecruited consecutively
High. Not blinded toresults of other tests
Low. Although 6 out of27 diagnosed by clinicalfollow-up
Low. Although 6/27 onlyhad clinical follow-up
Demirev (2014)48 Low High. MRI and PET-CTresults not blinded(in 19/27, MRI wasperformed beforePET-CT, and after in8/27 cases)
Low. Although 15/27patients had histology/microbiology confirmedfrom bone sample (mostconfirmed positive).Other methods ofsample collectionincluded blood sampling(seven), pus aspiration(five), soft tissuedebridement (onenegative). Clinicalfollow-up in fourpatients
Low. Although 15/27patients had histology/microbiology confirmedfrom bone sample (mostconfirmed positive).Other methods of samplecollection included bloodsampling (seven), pusaspiration (five),soft tissue debridement(one negative). Clinicalfollow-up in fourpatients
Enderle (1999)49 Low Low Low Low
Erdman (1991)50 Low Low Low. A total of 29/110patients diagnosed byclinical follow-up
Low. Although 29/56of index test negativepatients were confirmednegative by clinicalfollow-up only
Ertugrul (2006)51 Unclear. Unclear ifpatients were enrolledconsecutively and whynot all patientsreceived both indextests (MRI: 28/31,scintigraphy: 26/31)
Unclear. No reporting onblinding to index testresults
Low Low
Ezzat (2011)52 High. Excluded patientswith ‘presence of anychronic disease withsigns and symptomssimilar to acute OM’
Low Unclear. Most (23/27)patients had surgery,only two had cytology(pus aspiration) and twohad 1-week clinicalfollow-up. It is unclearhow many hadhistology/microbiology
Low
Familiari (2011)53 Unclear. Unclear if thiswas a consecutive orrandom sample, detailon exclusions lacking
Low. Several cut-offvalues were considered,but it does not appearthat optimal cut-offvalues were derived aposteriori based on ROCcurves
Low Low
Filippi (2006)54 Low Low Low Low
Filippi (2009)55 Low Low Low Low. Although 5/17patients only had clinicalfollow-up, the durationof follow-up (24 months)and results suggest a lowrisk of verification bias
continued
DOI: 10.3310/hta23610 HEALTH TECHNOLOGY ASSESSMENT 2019 VOL. 23 NO. 61
© Queen’s Printer and Controller of HMSO 2019. This work was produced by Llewellyn et al. under the terms of a commissioning contract issued by the Secretary of State forHealth and Social Care. This issue may be freely reproduced for the purposes of private research and study and extracts (or indeed, the full report) may be included in professionaljournals provided that suitable acknowledgement is made and the reproduction is not associated with any form of advertising. Applications for commercial reproduction shouldbe addressed to: NIHR Journals Library, National Institute for Health Research, Evaluation, Trials and Studies Coordinating Centre, Alpha House, University of Southampton SciencePark, Southampton SO16 7NS, UK.
93

TABLE 16 The QUADAS-2 risk-of-bias decisions (continued )
First authorand year ofpublication
Could the selectionof patients haveintroduced bias?
Could the conduct orinterpretation of theindex test haveintroduced bias?
Could the referencestandard, its conductor its interpretationhave introduced bias?
Could the patientflow have introducedbias?
Franceschi (2013)56 Unclear. Conferenceabstract, insufficientinformation onselection
Low Low High. Only participantswho received surgerywere analysed (17 outof 39 who receivedPET/CT)
Gemmel (2004)57 High. Only patientswith final diagnosisconfirmed bymicrobiology and/orpus visible duringsurgery were included
Low Low Low
Guhlmann(1998)58
Unclear. Not statedif the sample wasconsecutive andexclusion criteria notreported
Low Low Low for 18F-FDG-PET.High for scintigraphy,owing to exclusion ofsignificant number ofinconclusive results(14, of which nine wereconfirmed positive andfive were confirmednegative)
Guhlmann(1998)59
Unclear. Unclear ifconsecutive and noreporting of exclusioncriteria
Low Low Low
Hakim (2006)60 Unclear. Unclear ifpatients were enrolledconsecutively andlimited information onselection criteria
Unclear. Unclear if PETand SPECT results wereinterpreted independentlyand blinded
Low Low. Only 4/34 (11.8%)did not have a biopsy
Hartmann(2007)61
Unclear. Unclear ifconsecutively enrolled
Low Low Low
Hazenberg(2011)62
Unclear (conferenceabstract, insufficientdetail). Unclearbecause of question 1
Unclear (conferenceabstract, insufficientdetail)
Low Low (based on limiteddata from theconference abstract)
Heiba (2017)63 Unclear. Not sure whythe diagnosis was notincluded in somepatients’ records
Low Low Low. A total of 12/33had clinical follow-uponly but most wereconfirmed negative
Horger (2003)64 Unclear. Unclear ifconsecutive with noinappropriateexclusions
High. It appears thatinterpretation ofscintigraphy + SPECTand SPECT/CT were notdone blinded
Low Low. Although 9/29sites had 6 months’follow-up and no biopsy
Horger (2007)65 Low High. No blinding toresults of various indextests
Low. Although 15/31had surgery/biopsy and16/31 had clinical,microbiology and/orradiography follow-up
Low. Although 15/31had surgery/biopsy and16/31 had clinical,microbiology and/orradiography follow-up,and it is unclear if allconfirmed positive (nine)had a biopsy
APPENDIX 2
NIHR Journals Library www.journalslibrary.nihr.ac.uk
94

TABLE 16 The QUADAS-2 risk-of-bias decisions (continued )
First authorand year ofpublication
Could the selectionof patients haveintroduced bias?
Could the conduct orinterpretation of theindex test haveintroduced bias?
Could the referencestandard, its conductor its interpretationhave introduced bias?
Could the patientflow have introducedbias?
Huang (1998)66 Low Low Low Low. A total of 10/42(23.8%, five confirmedpositive and fiveconfirmed negative)patients had clinicalfollow-up only (6 monthsto 3 years)
Johnson (2009)67 Unclear. ‘Repeatedexaminations of thesame patient wereexcluded from thestudy, as wereexaminations of patientswho had insufficientclinical follow-up toestablish the presenceor absence of OM.’Unclear how manypatients were excluded.Patients with repeatedexaminations may havebeen harder to diagnose
Low Low Low. Although negativecases confirmed byclinical follow-up(duration unknown) in85% of cases. Positivecases confirmed byhistopathology in 90%of cases
Kaim (2000)68 Unclear. Unclear ifconsecutive
Low Low. Although 5/18 onlyhad clinical follow-up(> 16 months)
Low. Although 5/18 onlyhad clinical follow-up(> 16 months)
Kim (2017)69 Low. Although limitedto those who had bothscans within 1 week
Low Low. Nine cases ofsurgery/histopathology,12 cases of clinicalfollow-up, but allpositive cases confirmedby bone biopsy
Low. Nine cases ofsurgery/histopathology,12 cases of clinicalfollow-up, but allpositive cases confirmedby bone biopsy
La Fontaine(2016)70
Unclear. Retrospectivechart review, unclear ifall eligible patientswere included
Low Low Low
Larcos (1991)71 Unclear. Unclear ifconsecutive recruitment
Unclear. Unclear if indextest results wereinterpreted blinded toeach of the other indextests
Low. It appears thatall positives and asignificant proportion ofnegatives were confirmedby histopathology
Low. It appears that allpositives and a significantproportion of negativeswere confirmed byhistopathology
Larson (2011)72 Unclear Unclear. Unclear if indextests were interpretedblinded to one another
Low Low. Sensitivity andspecificity were reported,although the finalnumber of confirmedpositive/negative caseswere not provided,therefore the 2 × 2 resultscould not be calculated
continued
DOI: 10.3310/hta23610 HEALTH TECHNOLOGY ASSESSMENT 2019 VOL. 23 NO. 61
© Queen’s Printer and Controller of HMSO 2019. This work was produced by Llewellyn et al. under the terms of a commissioning contract issued by the Secretary of State forHealth and Social Care. This issue may be freely reproduced for the purposes of private research and study and extracts (or indeed, the full report) may be included in professionaljournals provided that suitable acknowledgement is made and the reproduction is not associated with any form of advertising. Applications for commercial reproduction shouldbe addressed to: NIHR Journals Library, National Institute for Health Research, Evaluation, Trials and Studies Coordinating Centre, Alpha House, University of Southampton SciencePark, Southampton SO16 7NS, UK.
95

TABLE 16 The QUADAS-2 risk-of-bias decisions (continued )
First authorand year ofpublication
Could the selectionof patients haveintroduced bias?
Could the conduct orinterpretation of theindex test haveintroduced bias?
Could the referencestandard, its conductor its interpretationhave introduced bias?
Could the patientflow have introducedbias?
Ledermann(2000)73
Low. Although highrate of patients withmetal artefacts (11/15)and only included thosewith a possible relapseof infection in chronicpost-traumatic OM
Unclear. Owing to lackof information onblinding to CT results
Low. Final diagnosis wasestablished in 11 patientsby intraoperativemicrobiological andhistological examination,although potentially lessaccurate for clinicalfollow-up in 4/15 patients
Low. Most (11/15)confirmed bymicrobiology/histopathology
Levine (1994)74 Unclear. Unclear ifpatients were enrolledconsecutively and whythere were significantdiscrepancies in thenumber of patientsreceiving each of thefour index tests
Unclear. Owing to lackof information onblinding to referencestandard and otherindex test results
Low. Although mostconfirmed negativepatients did not havehistopathology (11/16)
Low. Although 9/36patients were excludedowing to ‘no surgical orhistological confirmationwithin 2 weeks of MRIor failure to resolvewith nonoperativemanagement’
Lewis (1988)75 Unclear. Unclear ifthe sample wasconsecutively recruited;selection criteria werenot reported
Unclear. Owing toinsufficient details onblinding of staffperforming index tests
Low Low. Although nine(14.8%) excluded owingto ‘failure to separatelyexamine the bonyportion of a pressuresore specimen ormisrouting of specimensto microbiology orgematology laboratories’
Lipman (1998)76 Low Low Low Unclear. Unclear howmany receivedradiography andscintigraphy
Mahendra(2017)77
Low Low Low Low
Malcius (2009)78 Unclear. Unclear ifconsecutively selected.Exclusions or reasonsfor exclusions were NR
High. Not all patientshad the same testsand all results wereconsidered together:scintigraphy performedif unclear diagnosisbased on earlyradiography and/orultrasound, and MRI/CTperformed if uncleardiagnosis based onscintigraphy
Unclear. Numberreceiving histology/microbiology vs. clinicalfollow-up unknown.Uncertainty aboutblinding of referencestandard assessors toindex test results
Unclear. Numberreceiving histology/microbiology vs. clinicalfollow-up unknown
Mason (1989)79 Low. Authorssuggested that therewas a selection biasbecause only patientsconsidered likely toneed surgery werestudied. Such patientsare probably morelikely to have infection,although they may notbe easier to diagnose
Unclear. Owing touncertainty aboutblinding between indextests
Low Low
APPENDIX 2
NIHR Journals Library www.journalslibrary.nihr.ac.uk
96

TABLE 16 The QUADAS-2 risk-of-bias decisions (continued )
First authorand year ofpublication
Could the selectionof patients haveintroduced bias?
Could the conduct orinterpretation of theindex test haveintroduced bias?
Could the referencestandard, its conductor its interpretationhave introduced bias?
Could the patientflow have introducedbias?
McCarthy(2017)80
High. ‘Patients wereexcluded if they did nothave a preoperativeMRI, if they did nothave intraoperativebone culture data, or ifthey underwentdebridement onlywithout reconstruction’
Low Low Low. Only a smallproportion of participants(indeterminate results,8.5%) were excludedfrom analyses
Meller (2002)81 Low Low Low. 9/11 positivelocations were confirmedby histology or culture.10/25 negative locationswere confirmed negativeby histology or culture.Other locations werediagnosed by MRI(n = 15) or clinicalfollow-up (n = 2)
Low. 9/11 positivelocations were confirmedby histology or culture.10/25 negative locationswere confirmed negativeby histology or culture.Other locations werediagnosed by MRI(n = 15) or clinicalfollow-up (n = 2)
Miki (2015)82 Unclear. Retrospectivestudy, only patientswith surgery. Unclearif all eligible patientswere recruited
Unclear. No informationon blinding to referencestandard results
Low Low
Modic (1985)83 Unclear. Unclear ifconsecutively recruitedand limited reportingof selection criteria
High. Owing to lack ofblinding to other indextests
Low. Although 14/37appeared to have notundergone biopsy.Clinical follow-upranged from 6 weeks to15 months and includedantibiotics use
Low. Although 14/37appeared to have notundergone biopsy.Clinical follow-upranged from 6 weeks to15 months and includedantibiotics use
Morales Lozano(2010)84
Unclear. Unclear ifselection wasconsecutive
Unclear. No evidencethat interpretation ofresults of index testswere blinded to eachother
Low Low
Morrison (1993)85 Unclear. Unclear ifconsecutively recruited,limited reporting ofselection criteria
Unclear. Owing to lackof information onblinding between indextest assessments
Low Low. Although smallrisk of verification bias(16.3% of patientsdid not receivehistopathology), and itwas not clear whenhistopathology wasperformed
Morrison (1998)86 Unclear. Unclear ifsignificant numberof participants wereexcluded because oflack of participantswith no confirmeddiagnosis
Low Low. 34 were confirmedpositive by biopsy,although nine confirmedpositive with clinicalfollow-up includingblood cultures, and30 confirmed negativeby clinical follow-up(rapid improvementafter conservativemanagement)
Low. 34 were confirmedpositive by biopsy,although nine confirmedpositive with clinicalfollow-up includingblood cultures, and 30confirmed negative byclinical follow-up (rapidimprovement afterconservative management)
continued
DOI: 10.3310/hta23610 HEALTH TECHNOLOGY ASSESSMENT 2019 VOL. 23 NO. 61
© Queen’s Printer and Controller of HMSO 2019. This work was produced by Llewellyn et al. under the terms of a commissioning contract issued by the Secretary of State forHealth and Social Care. This issue may be freely reproduced for the purposes of private research and study and extracts (or indeed, the full report) may be included in professionaljournals provided that suitable acknowledgement is made and the reproduction is not associated with any form of advertising. Applications for commercial reproduction shouldbe addressed to: NIHR Journals Library, National Institute for Health Research, Evaluation, Trials and Studies Coordinating Centre, Alpha House, University of Southampton SciencePark, Southampton SO16 7NS, UK.
97

TABLE 16 The QUADAS-2 risk-of-bias decisions (continued )
First authorand year ofpublication
Could the selectionof patients haveintroduced bias?
Could the conduct orinterpretation of theindex test haveintroduced bias?
Could the referencestandard, its conductor its interpretationhave introduced bias?
Could the patientflow have introducedbias?
Nath (1992)87 Unclear. Unclearwhether or not thepatients were recruitedconsecutively andbecause of limitedreporting of selectioncriteria
Unclear. Unclearblinding to referencestandard and betweenindex tests
Low. Although unclear ifall samples were takenfrom fluid from thebone itself
Low. Only three hadclinical follow-up only
Nawaz (2010)88 Low Unclear. Unclear if staffwere blinded to theresults of each of thethree index testsperformed
Low Low. Although 33.6%of all patients receivedhistopathology. Mostpatients with finalnegative diagnosis(94.5%) were confirmedby clinical examinationonly. Most (85.2%) withfinal positive diagnoseswere confirmed byhistopathology
Newman (1991)89 Low Unclear. Radiographyand scintigraphy wereinterpreted in a blindedfashion, but it is unclearif interpretation of eachof the two scintigraphymethods was performedblinded. Bone scanswere performed afterWBC scans
Low Low. Although between35 and 39 out of 41eligible ulcers wereincluded in the analysesacross the differentindex tests. Reasons forexclusion were notreported
Newman (1992)90 Unclear. Unclear whyonly 12 of 23 patientswere included. Thescintigraphy data are asubset of Newman199189
Low Low Low
Nigro (1992)91 Low. Unclear ifselection wasconsecutive, althoughit appears that alleligible patients wereincluded
High. Readers were notblinded to the results ofthe other index tests
Unclear. Duration ofclinical follow-up for13/47 examinations(of which 11 wereconfirmed negative)was not reported
Low. Although 13/47 hadonly clinical follow-up ofunknown duration,including around 50%(11/21 for MRI) ofconfirmed negative cases
Park (1982)92 High. Only diabeticpatients who hadradiographs,three-phase bonescans, and histologicalconfirmation of thediagnosis, and surgery< 4 weeks after scan
Low Low Low. Although threepatients with absentflow were excludedfrom the analysis forscintigraphy
Rastogi (2016)93 Low Unclear. It is unclear ifthe results of each ofthe two index tests wereinterpreted blinded andindependently
Low. Although someconcerns about theaccuracy of Jamshidineedle biopsy
Low. Reasons forexclusion appearedappropriate
APPENDIX 2
NIHR Journals Library www.journalslibrary.nihr.ac.uk
98

TABLE 16 The QUADAS-2 risk-of-bias decisions (continued )
First authorand year ofpublication
Could the selectionof patients haveintroduced bias?
Could the conduct orinterpretation of theindex test haveintroduced bias?
Could the referencestandard, its conductor its interpretationhave introduced bias?
Could the patientflow have introducedbias?
Remedios(1998)94
Unclear. Unclear ifconsecutively recruited
Low. The comparison ofthe two scintigraphytests may have biasedthe scintigraphyassessment, althoughthe actual comparisonbetween MRI andscintigraphy was blinded
Low. All four positivecases were confirmed bybiopsy, although fourpatients were confirmednegative by clinicalfollow-up only, and oneconfirmed negative bybiopsy
Low. All four positivecases were confirmed bybiopsy, although fourpatients were confirmednegative by clinicalfollow-up only, and oneconfirmed negative bybiopsy
Rozzanigo(2009)95
Unclear. Retrospectivestudy, unlikely to beconsecutive. Limitedreporting of selectioncriteria
High. Radiographyperformed before MRI toinform conduct of MRI(although the study wasprimarily designed toevaluate MRI, not tocompare radiographywith MRI)
Unclear. Diagnosticmethod and duration offollow-up unknown forconfirmation of 5/16
Unclear. Diagnosticmethod and duration offollow-up unknown forconfirmation of 5/16
Sanlı (2011)96 Low Low Unclear. Unclearhow many receivedhistopathologyor microbiology:histopathology, ormicrobiology orobservation at surgery,or ≥ 1 year follow-up.Unclear if referencestandard interpretationwas blinded to indextest results
Unclear. Unclear howmany receivedhistopathology ormicrobiology;histopathology, ormicrobiology orobservation at surgery,or ≥ 1-year follow-up
Sarikaya (2003)97 Unclear. Unclear ifconsecutively recruited
Low. For radiography:interpreted blinded toscintigraphy results.High. Owing to lack ofblinding between MDPand scintigraphy
Low. Culture with/without histologyconducted in 36/55lesions. Histology andculture conducted in allpositive cases. Clinicalfollow-up only(minimum 4 months)conducted in 19/55
Low. Although clinicalfollow-up only(minimum 4 months)conducted in 19/55lesions. 26/55 receivedculture with/withouthistology. All positivecases were confirmed byhistology
Schlung (2016)98 Unclear. Retrospectiveselection of subgroupof patients with MRIfindings
Low Low Low
Schwegler(2008)99
Low Low Low. Although all 13/20negative cases wereconfirmed by clinical2-year follow-up only
Low. Although all13/20 negative caseswere confirmed by clinical2-year follow-up only
Seabold (1990)100 Unclear. Unclear ifconsecutively recruitedpatients and limiteddetails about selectioncriteria
Low. Results ofscintigraphy and MRIblinded, although MRIwas interpreted inconjunction withradiography
Low Unclear. Only 7/14participants wereincluded for the analysisof MRI accuracy, withreasons NR
continued
DOI: 10.3310/hta23610 HEALTH TECHNOLOGY ASSESSMENT 2019 VOL. 23 NO. 61
© Queen’s Printer and Controller of HMSO 2019. This work was produced by Llewellyn et al. under the terms of a commissioning contract issued by the Secretary of State forHealth and Social Care. This issue may be freely reproduced for the purposes of private research and study and extracts (or indeed, the full report) may be included in professionaljournals provided that suitable acknowledgement is made and the reproduction is not associated with any form of advertising. Applications for commercial reproduction shouldbe addressed to: NIHR Journals Library, National Institute for Health Research, Evaluation, Trials and Studies Coordinating Centre, Alpha House, University of Southampton SciencePark, Southampton SO16 7NS, UK.
99

TABLE 16 The QUADAS-2 risk-of-bias decisions (continued )
First authorand year ofpublication
Could the selectionof patients haveintroduced bias?
Could the conduct orinterpretation of theindex test haveintroduced bias?
Could the referencestandard, its conductor its interpretationhave introduced bias?
Could the patientflow have introducedbias?
Seabold (1995)101 Unclear. Retrospectivestudy, insufficientdetail on selection
Low Low High. Equivocal testresults were excludedfrom analyses (two forSPECT and six for CT inthe initial test phase)and MRI was onlyconducted and analysedin 11 out of 25 patients
Segall (1989)102 High. Only those whohad histology resultwithin 3 weeks ofscan: 83 patients hadthree-phase bone scan,of whom 23 met thefinal inclusion criteria.Risk of systematicdifferences betweenincluded and excludedparticipants
Low Low Low
Shemesh(2015)103
Unclear. Retrospectivestudy, limited reportingof selection process
Low Low Low
Unger (1988)104 Low Low Unclear. 14/35 (40%)only had clinicalfollow-up, and it isnot clear if any of thepatients with surgeryhad histology/microbiology
Unclear. 14/35 (40%)only had clinicalfollow-up, and it isnot clear if any of thepatients with surgeryhad histology/microbiology
van Vliet (2018)105 Low, althoughretrospective
Unclear. Unclear ifmultiple diagnosticcut-off points wereprespecified
Low. Although 1-yearfollow-up only was usedin some (7/30, includingthree confirmed positive)
Low
Weber (1995)106 Unclear. Retrospectiveand limited reportingof selection criteria
Low Low Low. Despite somelimitations (exclusionof three patients, twopatients with no culture/histology)
Weinstein(1993)107
Low Low Low High. 15 patients withno histology and clinicalfollow-up only wereexcluded from theanalyses
Wenter (2016)108 Unclear Low for qualitative resultsHigh for quantitative testresults, owing to post hocchoice of optimal cut-offpoint based on ROCanalysis from the studypopulation
Low Low
Weon (2000)109 Low Low Low. Although durationof clinical follow-up wasnot reported in patientswho did not havehistology/microbiology(11/37)
Low. Although mostconfirmed negativepatients (10/13) onlyreceived clinical follow-up.Duration and criteria forclinical follow-up werenot reported
APPENDIX 2
NIHR Journals Library www.journalslibrary.nihr.ac.uk
100

TABLE 16 The QUADAS-2 risk-of-bias decisions (continued )
First authorand year ofpublication
Could the selectionof patients haveintroduced bias?
Could the conduct orinterpretation of theindex test haveintroduced bias?
Could the referencestandard, its conductor its interpretationhave introduced bias?
Could the patientflow have introducedbias?
Williamson(1989)110
Unclear. Only smallnumber of patientswith recentradiography andscintigraphy
Unclear. No evidence ofblinding between indextests and with referencestandard. Plausible thatthe CT results were notinterpreted blinded toradiography andscintigraphy
Low. Although onlyclinical follow-up wasused for patients withnegative CT (3/7)
Low. Although onlyclinical follow-up wasused for patients withnegative CT (3/7)
Yang (2016)111 Low Low High. Unlikely that clinicalfollow-up (referencestandard for 22/48patients) was doneblinded to PET testresults. Concerns aboutthe reliability of follow-upas the referencestandard: patients wereconsidered OM positive ifresolution of symptomswas observed aftersystematic antibiotictreatment
High. Clinical follow-upwas the referencestandard for 22/48(45.8%). Patients wereconsidered OM positive ifresolution of symptomswas observed aftersystematic antibiotictreatment
Yuh (1989)112 Low Low Low. Nearly all positivecases were confirmedby histopathology.14/24 patients hadhistopathology. However,10 had clinical follow-uponly (unknown duration),and it is unclear ifreference standard(including follow-up)was performed blindedto index test results
Low. Nearly all positivecases were confirmedby histopathology.14/24 patients hadhistopathology. However,10 had clinical follow-uponly (unknown duration)
Zaiton (2014)113 Low Low Low Low
NR, not reported; OM, osteomyelitis.
DOI: 10.3310/hta23610 HEALTH TECHNOLOGY ASSESSMENT 2019 VOL. 23 NO. 61
© Queen’s Printer and Controller of HMSO 2019. This work was produced by Llewellyn et al. under the terms of a commissioning contract issued by the Secretary of State forHealth and Social Care. This issue may be freely reproduced for the purposes of private research and study and extracts (or indeed, the full report) may be included in professionaljournals provided that suitable acknowledgement is made and the reproduction is not associated with any form of advertising. Applications for commercial reproduction shouldbe addressed to: NIHR Journals Library, National Institute for Health Research, Evaluation, Trials and Studies Coordinating Centre, Alpha House, University of Southampton SciencePark, Southampton SO16 7NS, UK.
101

TABLE 17 The QUADAS-2 applicability decisions
First author and year ofpublication
Are there concerns thatthe included patients andsetting do not match thereview question?
Are there concerns thatthe index test, its conductor interpretation differfrom the review question?
Are there concerns thatthe target condition asdefined by the referencestandard does not matchthe review question?
Abdel Razek (2017)37 Low Low Low
Al-Khawari (2005)38 Low Low Low
Al-Sheikh (1985)39 Low Low Low
Aragón-Sánchez (2011)40 Low. Note: diabetic footreferral centre, highprevalence of OM
Low Low
Aslangul (2013)41 Low Low Low
Blume (1997)42 Low Low Low
Bohchelian (2002)43 Low Low Low
Bolouri (2013)44 Low Low Low
Brunel (2016)45 Low. Although extrapolationto patients with no spinalchord injury may be limited
Low Low
Chacko (2003)46 Low Low Low
Croll (1996)47 Low Low Low
Demirev (2014)48 Low Low Low
Enderle (1999)49 Low Low Low
Erdman (1991)50 Low Low Low
Ertugrul (2006)51 Low Low Low
Ezzat (2011)52 Low. Although excludedpatients with ‘presence ofany chronic disease withsigns and symptoms similarto acute OM’
Low Low
Familiari (2011)53 Low Low Low
Filippi (2006)54 Low Low Low
Filippi (2009)55 Low Low Low
Franceschi (2013)56 Unclear. Conferenceabstract, insufficientinformation aboutparticipants
Low Low
Gemmel (2004)57 Unclear Low Low
Guhlmann (1998)58 Low Low Low
Guhlmann (1998)59 Low Low Low
Hakim (2006)60 Low Low Low
Hartmann (2007)61 Low Low Low
Hazenberg (2011)62 Low Low Low
Heiba(2017)63 Low Low Low
Horger (2003)64 Low Low Low
Horger (2007)65 Low Low Low
Huang (1998)66 Low Low Low
Johnson (2009)67 Low Low Low
APPENDIX 2
NIHR Journals Library www.journalslibrary.nihr.ac.uk
102

TABLE 17 The QUADAS-2 applicability decisions (continued )
First author and year ofpublication
Are there concerns thatthe included patients andsetting do not match thereview question?
Are there concerns thatthe index test, its conductor interpretation differfrom the review question?
Are there concerns thatthe target condition asdefined by the referencestandard does not matchthe review question?
Kaim (2000)68 Low. Although highlyselected patient population:only long-standing,post-traumatic OM withsuspected recurrent OM
Low Low
Kim (2017)69 Low Low Low
La Fontaine (2016)70 Low Low Low
Larcos (1991)71 Low Low Low
Larson (2011)72 Unclear. Only some mayhave been referred forsuspected OM (numbersunknown)
Low Low
Ledermann (2000)73 Low. No significantconcerns, although highproportion of patients withmetal artefacts (11/15) andhighly selected patientgroup. Only included thosewith a possible relapse ofinfection in chronicpost-traumatic OM
Unclear. MRIs performed in ahigh proportion of patientswith metal artefacts (11/15).Of these 11, four rated as‘metal artefact renders filminterpretation considerablymore difficult; two rated as‘metal artefact impairscomplete evaluation of filmbecause of major obscuringartefacts’
Low
Levine (1994)74 Low. Although limitedreporting of patientcharacteristics
Low Low
Lewis (1988)75 Unclear. Selection criteriaand participantcharacteristics NR
Low Low
Lipman (1998)76 Low Low Low
Mahendra (2017)77 Low Unclear. No reporting on useof antimicrobials before MRI
Low
Malcius (2009)78 Low Low Low
Mason (1989)79 Low Low Low
McCarthy (2017)80 Low Low Low
Meller (2002)81 Low Low Low
Miki (2015)82 Low Low Low
Modic (1985)83 Unclear Low Low
Morales Lozano (2010)84 Low. Although highprevalence of OM (79.5%)
Low Low
Morrison (1993)85 Low. All suspected OM Low Low
Morrison (1998)86 Low Low Low
Nath (1992)87 Low Low Low
Nawaz (2010)88 Low Low Low
Newman (1991)89 Low Low Low
Newman (1992)90 Low Low Low
continued
DOI: 10.3310/hta23610 HEALTH TECHNOLOGY ASSESSMENT 2019 VOL. 23 NO. 61
© Queen’s Printer and Controller of HMSO 2019. This work was produced by Llewellyn et al. under the terms of a commissioning contract issued by the Secretary of State forHealth and Social Care. This issue may be freely reproduced for the purposes of private research and study and extracts (or indeed, the full report) may be included in professionaljournals provided that suitable acknowledgement is made and the reproduction is not associated with any form of advertising. Applications for commercial reproduction shouldbe addressed to: NIHR Journals Library, National Institute for Health Research, Evaluation, Trials and Studies Coordinating Centre, Alpha House, University of Southampton SciencePark, Southampton SO16 7NS, UK.
103

TABLE 17 The QUADAS-2 applicability decisions (continued )
First author and year ofpublication
Are there concerns thatthe included patients andsetting do not match thereview question?
Are there concerns thatthe index test, its conductor interpretation differfrom the review question?
Are there concerns thatthe target condition asdefined by the referencestandard does not matchthe review question?
Nigro (1992)91 Low Low Low
Park (1982)92 Low Low Low
Rastogi (2016)93 Low Low Low
Remedios (1998)94 Low Low Low
Rozzanigo (2009)95 Low Low Low
Sanlı (2011)96 Low Low Low
Sarikaya (2003)97 Low. Patients with initialnormal bone scan wereexcluded
Low Low
Schlung (2016)98 Low Low Low
Schwegler (2008)99 Low Low Low
Seabold (1990)100 Low Low Low
Seabold (1995)101 Unclear. Retrospectivestudy, insufficient detail onselection
Low Low
Segall (1989)102 Low Low Low
Shemesh (2015)103 Low Low Low
Unger (1988)104 Low Low Low
van Vliet (2018)105 Low. Although only fordifferentiation betweenaseptic and septic delayedunion in lower extremity
Low Low
Weber (1995)106 Low. Although combinespreoperative and follow-upscans
Low Low
Weinstein (1993)107 Low Low Low
Wenter (2016)108 Low Low Low
Weon (2000)109 Low Low Low
Williamson (1989)110 Low Low Low
Yang (2016)111 Low Low Low
Yuh (1989)112 Low Low Low
Zaiton (2014)113 Low. Plain radiography(no radiological changessuggesting OM), patientsscheduled for surgicalmanagement
Low Low
NR, not reported; OM, osteomyelitis.
APPENDIX 2
NIHR Journals Library www.journalslibrary.nihr.ac.uk
104
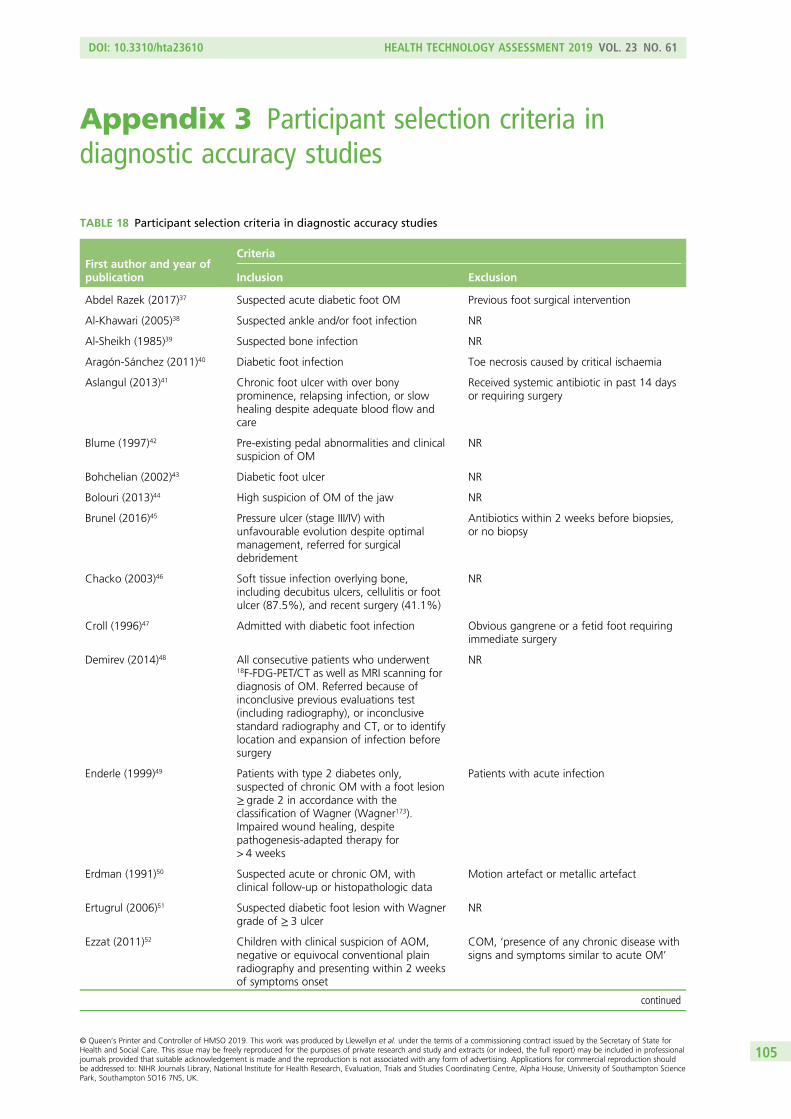
Appendix 3 Participant selection criteria indiagnostic accuracy studies
TABLE 18 Participant selection criteria in diagnostic accuracy studies
First author and year ofpublication
Criteria
Inclusion Exclusion
Abdel Razek (2017)37 Suspected acute diabetic foot OM Previous foot surgical intervention
Al-Khawari (2005)38 Suspected ankle and/or foot infection NR
Al-Sheikh (1985)39 Suspected bone infection NR
Aragón-Sánchez (2011)40 Diabetic foot infection Toe necrosis caused by critical ischaemia
Aslangul (2013)41 Chronic foot ulcer with over bonyprominence, relapsing infection, or slowhealing despite adequate blood flow andcare
Received systemic antibiotic in past 14 daysor requiring surgery
Blume (1997)42 Pre-existing pedal abnormalities and clinicalsuspicion of OM
NR
Bohchelian (2002)43 Diabetic foot ulcer NR
Bolouri (2013)44 High suspicion of OM of the jaw NR
Brunel (2016)45 Pressure ulcer (stage III/IV) withunfavourable evolution despite optimalmanagement, referred for surgicaldebridement
Antibiotics within 2 weeks before biopsies,or no biopsy
Chacko (2003)46 Soft tissue infection overlying bone,including decubitus ulcers, cellulitis or footulcer (87.5%), and recent surgery (41.1%)
NR
Croll (1996)47 Admitted with diabetic foot infection Obvious gangrene or a fetid foot requiringimmediate surgery
Demirev (2014)48 All consecutive patients who underwent18F-FDG-PET/CT as well as MRI scanning fordiagnosis of OM. Referred because ofinconclusive previous evaluations test(including radiography), or inconclusivestandard radiography and CT, or to identifylocation and expansion of infection beforesurgery
NR
Enderle (1999)49 Patients with type 2 diabetes only,suspected of chronic OM with a foot lesion≥ grade 2 in accordance with theclassification of Wagner (Wagner173).Impaired wound healing, despitepathogenesis-adapted therapy for> 4 weeks
Patients with acute infection
Erdman (1991)50 Suspected acute or chronic OM, withclinical follow-up or histopathologic data
Motion artefact or metallic artefact
Ertugrul (2006)51 Suspected diabetic foot lesion with Wagnergrade of ≥ 3 ulcer
NR
Ezzat (2011)52 Children with clinical suspicion of AOM,negative or equivocal conventional plainradiography and presenting within 2 weeksof symptoms onset
COM, ‘presence of any chronic disease withsigns and symptoms similar to acute OM’
continued
DOI: 10.3310/hta23610 HEALTH TECHNOLOGY ASSESSMENT 2019 VOL. 23 NO. 61
© Queen’s Printer and Controller of HMSO 2019. This work was produced by Llewellyn et al. under the terms of a commissioning contract issued by the Secretary of State forHealth and Social Care. This issue may be freely reproduced for the purposes of private research and study and extracts (or indeed, the full report) may be included in professionaljournals provided that suitable acknowledgement is made and the reproduction is not associated with any form of advertising. Applications for commercial reproduction shouldbe addressed to: NIHR Journals Library, National Institute for Health Research, Evaluation, Trials and Studies Coordinating Centre, Alpha House, University of Southampton SciencePark, Southampton SO16 7NS, UK.
105

TABLE 18 Participant selection criteria in diagnostic accuracy studies (continued )
First author and year ofpublication
Criteria
Inclusion Exclusion
Familiari (2011)53 High clinical suspicion of foot OM based onthe presence of signs and symptoms ofinfection (exposed bone, n = 7)
NR
Filippi (2006)54 Suspected OM NR
Filippi (2009)55 Diabetes, foot lesions, abnormal laboratorytests and clinical signs of infection
NR
Franceschi (2013)56 Chronic diabetic foot infection NR
Gemmel (2004)57 Suspected spinal infection after previousspinal surgery with a final diagnosis basedon microbiology and/or intraoperativefindings of macroscopic pus
Recently undergone surgery (no patientswith interval of < 2 months were included)
Guhlmann (1998)58 Recurrent OM or symptoms of OM for> 6 weeks. Trauma or surgery dating backat least 2 years
NR
Guhlmann (1998)59 Suspected COMwith symptoms of infectionlasting > 6 weeks or presence of recurrent OM
NR
Hakim (2006)60 Provisional chronic suppurative OMdiagnosis referred for scintigraphy, with noprevious COM diagnosis
NR
Hartmann (2007)61 Suspected COMwith symptoms of infectionlasting > 6 weeks or presence of recurrent OM,with histopathology or microbiology results
Trauma or surgical intervention on affectedbone during the 6 months prior to thePET/CT examination
Hazenberg (2011)62 Persistent OM despite antibiotics therapy Peripheral arterial disease
Heiba (2017)63 Clinically suspected OM No SPEC/CT data or definitive diagnosis
Horger (2003)64 Suspected reactivated post-traumatic COM NR
Horger (2007)65 Clinical suspicion of acute or chronic OM NR
Huang (1998)66 Paralysed with clinically suspected acuteOM of the pelvis/hip, equivocal radiography
NR
Johnson (2009)67 MRI of the foot for evaluation of suspectedOM
Repeated examinations of the same patient,insufficient clinical follow-up for OMdiagnosis
Kaim (2000)68 Suspected relapse of bone infection in leg,recurrent OM
Patients with orthopaedic devices (althoughthree with metal artefacts were included)
Kim (2017)69 Suspected OM and patients for whom timeinterval between the two index tests was< 1 week
NR
La Fontaine (2016)70 Received either MRI or SPECT-CT and abiopsy within 8 weeks for suspecteddiabetic foot OM
NR
Larcos (1991)71 Suspected pedal OM, with final diagnosisproved by surgery or clinical follow-up
Patients with multisystem disorders andinadequate documentation for the foot
Larson (2011)72 Stage IV pressure ulcers undergoing surgicaldebridement with intraoperative boneculture and prior radiography. Only somemay have been referred for suspected OM
Those without surgical debridgement, ortreated but lacking bone culture and/orradiography were excluded
Ledermann (2000)73 Suspected relapse of infection in chronic(at least 1.5 years) post-traumatic OMof lower extremities with complete MRIexamination on admission
NR
APPENDIX 3
NIHR Journals Library www.journalslibrary.nihr.ac.uk
106

TABLE 18 Participant selection criteria in diagnostic accuracy studies (continued )
First author and year ofpublication
Criteria
Inclusion Exclusion
Levine (1994)74 Suspected OM because of diabetic foot ulcer ‘No surgical or histological confirmationwithin 2 weeks of MRI or failure to resolvewith non-operative management’
Lewis (1988)75 Spinal cord injury patients with pressuresores
NR
Lipman (1998)76 Peripheral neuropathy, high clinicalsuspicion of OM
NR
Mahendra (2017)77 Diabetic foot ulcer ‘Previously operated cases with persistentulcer’
Malcius (2009)78 Pain in bone area, fever, functional disorder,and/or signs of infection. Scintigraphyperformed if unclear diagnosis based onearly radiography and/or ultrasound, andMRI/CT performed if unclear diagnosis basedon scintigraphy
NR
Mason (1989)79 Clinical history of suspected bone infection,soft tissue infection, or both; a completed MRimaging study; prior trauma, surgery, or both;and documented operative, pathologic,microbiologic and clinical follow-up
Incomplete MRI examination, MRI afterresection, lack of follow-up data
McCarthy (2017)80 Surgical reconstruction of pressure ulcerwith preoperative MRI and intraoperativebone cultures
No MRI, no intraoperative culture data,debridement only without reconstruction
Meller (2002)81 Non-diabetic, suspected COM based onpositive scintigraphy
NR
Miki (2015)82 Diabetic foot ulcer, undergone surgery andhistopathology, type 2 diabetes
NR
Modic (1985)83 Strong suspicion of vertebral OM based onsymptoms, laboratory abnormalities,abnormal or suspicious radiographicassessment and predisposing factors
NR
Morales Lozano (2010)84 Diabetic patients with infected foot ulcerattending a diabetic foot clinic withsuspicion of OM based on ulcer specimenculture, radiography and probe-to-bone test.Single ulcer (neuropathic or neuroischemic),previous surgery for OM or unresolved ulcerfollowing local or antibiotic treatment
Critical ischaemia or due for an operationunrelated to OM
Morrison (1993)85 Suspected OM NR
Morrison (1998)86 Suspected foot OM with minimum 6 weeks’follow-up
NR
Nath (1992)87 Pain and swelling of the affected limb,suspected OM
NR
Nawaz (2010)88 Diabetic foot disease and/or diabetes withsuspected deep-seated infection(s) of thelower extremity(or extremities). Serumglucose levels of < 200 mg/dl
NR
Newman (1991)89 Diabetic foot ulcer, inpatients andoutpatients
Myocardial infarction, severe peripheralvascular disease, ongoing antibiotictreatment of > 7 days or patient declined toparticipate
continued
DOI: 10.3310/hta23610 HEALTH TECHNOLOGY ASSESSMENT 2019 VOL. 23 NO. 61
© Queen’s Printer and Controller of HMSO 2019. This work was produced by Llewellyn et al. under the terms of a commissioning contract issued by the Secretary of State forHealth and Social Care. This issue may be freely reproduced for the purposes of private research and study and extracts (or indeed, the full report) may be included in professionaljournals provided that suitable acknowledgement is made and the reproduction is not associated with any form of advertising. Applications for commercial reproduction shouldbe addressed to: NIHR Journals Library, National Institute for Health Research, Evaluation, Trials and Studies Coordinating Centre, Alpha House, University of Southampton SciencePark, Southampton SO16 7NS, UK.
107

TABLE 18 Participant selection criteria in diagnostic accuracy studies (continued )
First author and year ofpublication
Criteria
Inclusion Exclusion
Newman (1992)90 Clinical suspicion of OM by referringphysician
Myocardial infarction, severe peripheralvascular disease, ongoing antibiotic treatmentfor > 7 days or patient declined to participate
Nigro (1992)91 Patients with foot inflammation andpossible OM referred for MRI
NR
Park (1982)92 Diabetic patients who had radiographs,three-phase bone scans, and histologicalconfirmation of the diagnosis
Surgical procedure performed more than4 weeks after the bone scan
Rastogi (2016)93 Diabetic Charcot neuroarthropathy,suspected diabetic foot OM, foot ulcer ordischarging sinus
Unfit for PET/CT or MRI, previous antibiotictreatment for foot infections for > 72 hours,peripheral vascular disease
Remedios (1998)94 Peripheral neuropathy chronic foot ulcersand clinical signs of OM
NR
Rozzanigo (2009)95 Infected ulcer affecting the forefoot/midfoot/hindfoot
NR
Sanlı (2011)96 Suspected bone or orthopaedic implantinfection based on clinical signs
NR
Sarikaya (2003)97 Clinically suspected OM, diabetes,non-healing ulcers or gangrene
Normal scintigraphy, antibiotics within1 week of imaging and culture
Schlung (2016)98 Septic hip (presumed likely or confirmed)with joint aspirate or culture data followingtreatment with irrigation and debridementand antibiotics who underwent preoperativeMRI
No septic hip (presumed or confirmed) withjoint aspirate or culture data, no preoperativeMRI
Schwegler (2008)99 Diabetes, non-healing chronic foot ulcer forat least 8 weeks; absence of antibioticpretreatment and of clinical signs orsymptoms of local or systemic infection
Clinical signs of local infection, antibiotictreatment at time of PET or within 1 month
Seabold (1990)100 High clinical suspicion of OM in or aroundneuropathic joint(s)
NR
Seabold (1995)101 Suspected cranial OM undergoingdiagnostic imaging
NR
Segall (1989)102 Histological test for OM within 3 weeks ofbone scan
NR
Shemesh (2015)103 Cases suspected of deep infection followingosteosynthesis for fractures of the tibia,treated surgically and had preoperativePET/CT scan
NR
Unger (1988)104 Clinical suspicion of acute OM NR
van Vliet (2018)105 Underwent 18F-FDG-PET/CT at level 1 traumacentre between March 2010 to October 2014
Surgery within 3 months of PET/CT
Weber (1995)106 Clinically suspicious postoperative initialpersistent or recurrent OM
NR
Weinstein (1993)107 Clinical suspicion of OM, non-healing footulcer or soft tissue infection of the foot
NR
Wenter (2016)108 Suspected chronic OM treated in majortrauma centre. Pain, absence of clearclinical or laboratory markers for acute localinfection, non-conclusive radiographyand MRI
NR
APPENDIX 3
NIHR Journals Library www.journalslibrary.nihr.ac.uk
108
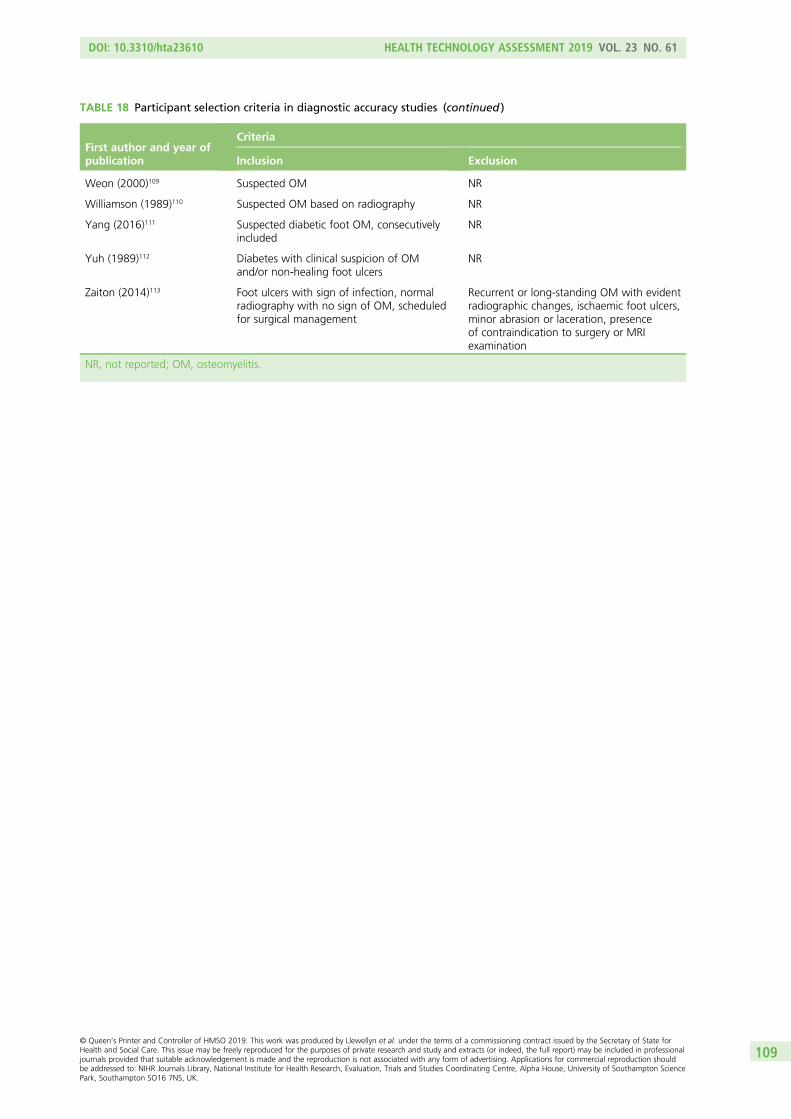
TABLE 18 Participant selection criteria in diagnostic accuracy studies (continued )
First author and year ofpublication
Criteria
Inclusion Exclusion
Weon (2000)109 Suspected OM NR
Williamson (1989)110 Suspected OM based on radiography NR
Yang (2016)111 Suspected diabetic foot OM, consecutivelyincluded
NR
Yuh (1989)112 Diabetes with clinical suspicion of OMand/or non-healing foot ulcers
NR
Zaiton (2014)113 Foot ulcers with sign of infection, normalradiography with no sign of OM, scheduledfor surgical management
Recurrent or long-standing OM with evidentradiographic changes, ischaemic foot ulcers,minor abrasion or laceration, presenceof contraindication to surgery or MRIexamination
NR, not reported; OM, osteomyelitis.
DOI: 10.3310/hta23610 HEALTH TECHNOLOGY ASSESSMENT 2019 VOL. 23 NO. 61
© Queen’s Printer and Controller of HMSO 2019. This work was produced by Llewellyn et al. under the terms of a commissioning contract issued by the Secretary of State forHealth and Social Care. This issue may be freely reproduced for the purposes of private research and study and extracts (or indeed, the full report) may be included in professionaljournals provided that suitable acknowledgement is made and the reproduction is not associated with any form of advertising. Applications for commercial reproduction shouldbe addressed to: NIHR Journals Library, National Institute for Health Research, Evaluation, Trials and Studies Coordinating Centre, Alpha House, University of Southampton SciencePark, Southampton SO16 7NS, UK.
109


Appendix 4 Results of diagnostic meta-analyses
TABLE 19 Summary of diagnostic accuracy studies
First author and year ofpublication Population Cause Diagnostic tests used
Al-Khawari (2005)38 Adults Diabetic foot ulcers MRI
Al-Sheikh (1985)39 Adults NR Scintigraphy and radiography
Aragón-Sánchez (2011)40 Adults Diabetic foot ulcers Radiography
Aslangul (2013)41 Adults Diabetic foot ulcers SPECT/CT
Blume (1997)42 Adults Diabetic foot ulcers Scintigraphy and radiography
Bolouri (2013)44 Mixed Multiple CT, scintigraphy, SPECT/CT andradiography
Brunel (2016)45 Adults Pressure ulcers MRI
Chacko (2003)46 NR Multiple PET
Croll (1996)47 Adults Diabetic foot ulcers MRI, scintigraphy and radiography
Demirev (2014)48 Adults Multiple MRI and PET-CT
Enderle (1999)49 Adults Diabetic foot ulcers MRI, scintigraphy, ultrasound andradiography
Erdman (1991)50 Mixed Multiple MRI
Ertugrul (2006)51 NR Diabetic foot ulcers MRI and scintigraphy
Familiari (2011)53 Adults Diabetic foot ulcers PET-CT and scintigraphy
Filippi (2006)54 Adults Multiple SPECT/CT
Filippi (2009)55 Adults Diabetic foot ulcers SPECT/CT
Franceschi (2013)56 Adults Diabetic foot ulcers PET-CT
Gemmel (2004)57 Mixed Surgical Scintigraphy and SPECT
Guhlmann (1998)58 Adults Trauma or surgery PET and scintigraphy
Guhlmann (1998)59 Adults Trauma or surgery PET
Hakim (2006)60 Adults Dental infection, trauma, others PET and SPECT
Hartmann (2007)61 Adults Trauma PET-CT
Hazenberg (2011)62 NR Diabetic foot ulcers MRI
Heiba (2017)63 Adults NR Scintigraphy and SPECT/CT
Horger (2003)64 Adults Trauma SPECT/CT
Horger (2007)65 Adults Multiple SPECT/CT (n = 15), MRI (n = 6) andradiography (n = 20)
Huang (1998)66 Adults Skin ulceration MRI
Johnson (2009)67 Adults Diabetes, other MRI
Kaim (2000)68 Adults Trauma MRI and scintigraphy
La Fontaine (2016)70 Adults Diabetic foot ulcers MRI and SPECT/CT
Larcos (1991)71 Adults Diabetic foot ulcers Scintigraphy and radiography
Ledermann (2000)73 Adults Trauma MRI
Levine (1994)74 Adults Diabetic foot ulcers MRI, scintigraphy and radiography
continued
DOI: 10.3310/hta23610 HEALTH TECHNOLOGY ASSESSMENT 2019 VOL. 23 NO. 61
© Queen’s Printer and Controller of HMSO 2019. This work was produced by Llewellyn et al. under the terms of a commissioning contract issued by the Secretary of State forHealth and Social Care. This issue may be freely reproduced for the purposes of private research and study and extracts (or indeed, the full report) may be included in professionaljournals provided that suitable acknowledgement is made and the reproduction is not associated with any form of advertising. Applications for commercial reproduction shouldbe addressed to: NIHR Journals Library, National Institute for Health Research, Evaluation, Trials and Studies Coordinating Centre, Alpha House, University of Southampton SciencePark, Southampton SO16 7NS, UK.
111

TABLE 19 Summary of diagnostic accuracy studies (continued )
First author and year ofpublication Population Cause Diagnostic tests used
Lewis (1988)75 Adults Skin ulceration CT, scintigraphy and radiography
Lipman (1998)76 Adults Diabetes (85%), peripheralneuropathy (100%)
MRI
Mahendra (2017)77 Adults Diabetic foot ulcers MRI
Mason (1989)79 NR Trauma (93%), other (7%) MRI and scintigraphy
McCarthy (2017)80 Adults Skin ulceration MRI
Meller (2002)81 Adults Multiple PET and scintigraphy
Miki (2015)82 Adults Diabetic foot ulcers MRI
Modic (1985)83 Adults Multiple MRI, scintigraphy (and SPECT n = 5)and radiography
Morales Lozano (2010)84 NR Diabetic foot ulcers Radiography
Morrison (1993)85 Mixed Multiple MRI
Morrison (1998)86 Adults Diabetes (85%), others (15%) MRI
Nath (1992)87 Mixed NR Ultrasound and radiography
Nawaz (2010)88 Adults Diabetic foot ulcers MRI, PET and radiography
Newman (1992)90 NR Diabetic foot ulcers Scintigraphy and radiography
Newman (1991)89 NR Diabetic foot ulcers MRI and scintigraphy
Nigro (1992)91 Adults Diabetic foot ulcers, foot ulcers orinflammation
MRI, scintigraphy and radiography
Park (1982)92 NR Diabetic foot ulcers Scintigraphy and radiography
Rastogi (2016)93 Adults Diabetic foot ulcers MRI and PET-CT
Remedios (1998)94 Adults Diabetic foot ulcers MRI and scintigraphy
Rozzanigo (2009)95 Adults Diabetic foot ulcers MRI and radiography
Sarikaya (2003)97 Adults Diabetic foot ulcers Scintigraphy and radiography
Schwegler (2008)99 Adults Diabetic foot ulcers MRI, PET and scintigraphy
Seabold (1990)100 Adults Neuropathic osteoarthropathy MRI and scintigraphy
Seabold (1995)101 Mixed Multiple CT, MRI and SPECT
Segall (1989)102 Adults Diabetic foot ulcers Scintigraphy and radiography
Shemesh (2015)103 Adults Trauma or surgery PET-CT
Unger (1988)104 Mixed NR MRI and scintigraphy
van Vliet (2018)105 Adults Trauma and septic delayed union PET-CT
Weber (1995)106 Mixed Multiple CT and SPECT
Weinstein (1993)107 Adults Diabetic foot infections MRI, scintigraphy and radiography
Wenter (2016)108 Adults Trauma PET-CT
Weon (2000)109 Mixed Mixed Scintigraphy and SPECT
Williamson (1989)110 Adults Mixed CT and scintigraphy
Yang (2016)111 Adults Diabetic foot ulcers PET
Yuh (1989)112 Adults Diabetic foot ulcers MRI, scintigraphy and radiography
Zaiton (2014)113 Adults Diabetic foot ulcers MRI
NR, not reported.
APPENDIX 4
NIHR Journals Library www.journalslibrary.nihr.ac.uk
112

10030
40
50
60PPV
(%
) 70
80
90
100
90 80 70 60 50 40 30 20 10 0NPV (%)
Test usedCTMRIPETScintigraphySPECTUltrasoundRadiography
FIGURE 21 Summary of PPV and NPV in adults.
100
20
10
0
30
40
50
60
PPV
(%
)
70
80
90
100
90 80 70 60 50 40 30 20 10 0NPV (%)
Test usedCTMRIPETScintigraphySPECTRadiography
FIGURE 22 Summary of PPV and NPV from bivariate analysis.
DOI: 10.3310/hta23610 HEALTH TECHNOLOGY ASSESSMENT 2019 VOL. 23 NO. 61
© Queen’s Printer and Controller of HMSO 2019. This work was produced by Llewellyn et al. under the terms of a commissioning contract issued by the Secretary of State forHealth and Social Care. This issue may be freely reproduced for the purposes of private research and study and extracts (or indeed, the full report) may be included in professionaljournals provided that suitable acknowledgement is made and the reproduction is not associated with any form of advertising. Applications for commercial reproduction shouldbe addressed to: NIHR Journals Library, National Institute for Health Research, Evaluation, Trials and Studies Coordinating Centre, Alpha House, University of Southampton SciencePark, Southampton SO16 7NS, UK.
113
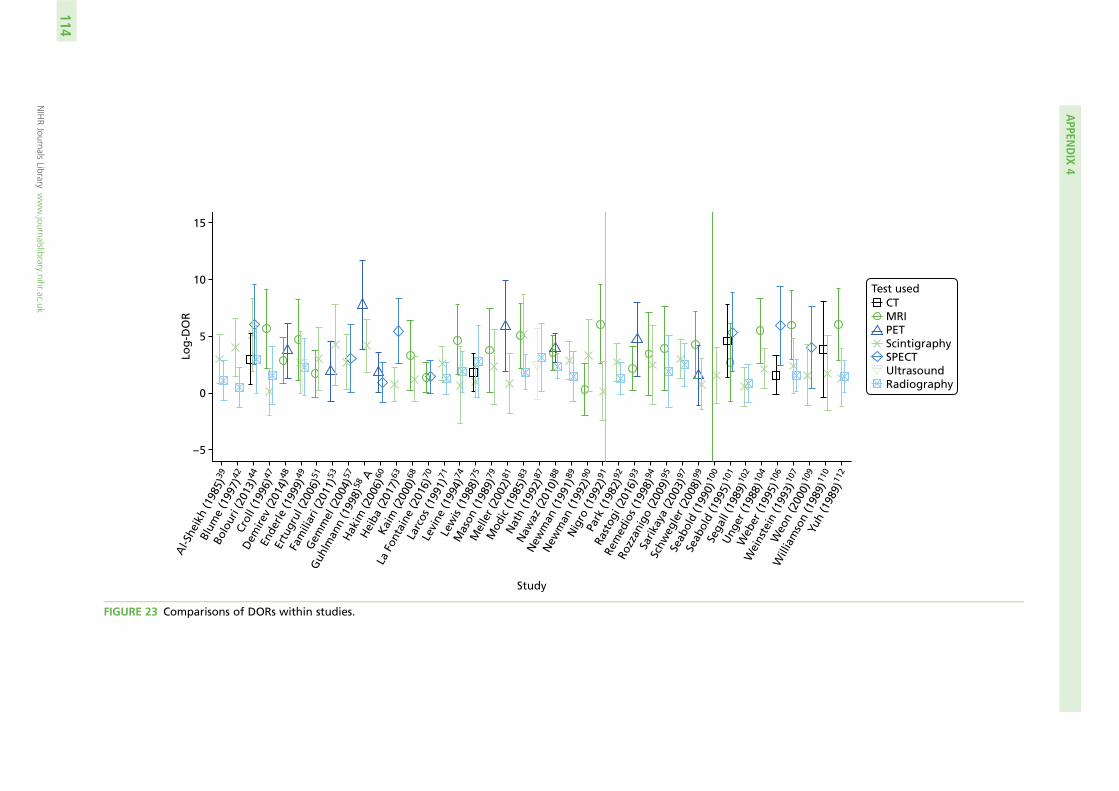
15
10
Log
-DO
R
5
0
Study
– 5
Al-S
heik
h (1
985)
39
Blum
e (1
997)
42
Bolo
uri (
2013
)44
Crol
l (19
96)4
7
Dem
irev
(201
4)48
Ende
rle (1
999)
49
Ertu
grul
(200
6)51
Fam
iliar
i (20
11)5
3
Gem
mel
(200
4)57
Guh
lman
n (1
998)
58 A
Hak
im (2
006)
60
Hei
ba (2
017)
63
Kaim
(200
0)68
La F
onta
ine
(201
6)70
Larc
os (1
991)
71
Levi
ne (1
994)
74
Lew
is (1
988)
75
Mas
on (1
989)
79
Mel
ler (
2002
)81
Mod
ic (1
985)
83
Nat
h (1
992)
87
Naw
az (2
010)
88
New
man
(199
1)89
New
man
(199
2)90
Nig
ro (1
992)
91Pa
rk (1
982)
92
Rast
ogi (
2016
)93
Rem
edio
s (19
98)9
4
Rozz
anig
o (2
009)
95
Sarik
aya
(200
3)97
Schw
egle
r (20
08)9
9
Seab
old
(199
0)10
0
Seab
old
(199
5)10
1
Sega
ll (1
989)
102
Ung
er (1
988)
104
Web
er (1
995)
106
Wei
nste
in (1
993)
107
Weo
n (2
000)
109
Will
iam
son
(198
9)11
0
Yuh
(198
9)11
2
CTMRIPETScintigraphySPECTUltrasoundRadiography
Test used
FIGURE 23 Comparisons of DORs within studies.
APPEN
DIX
4
NIHRJournals
Librarywww.journalslibrary.nihr.ac.uk
114

TABLE 20 Results from logistic regression model to compare tests
Test
Difference in log-odds of specificity Difference in log-DOR
Estimate Standard error p-value Estimate Standard error p-value
Comparison with radiography
MRI –0.149 0.228 0.512 2.392 0.339 0
Scintigraphy 0.83 0.198 0 0.554 0.272 0.041
CT –0.399 0.465 0.391 1.139 0.565 0.044
SPECT 0.261 0.362 0.471 2.493 0.53 0
PET –1.085 0.377 0.004 2.516 0.493 0
Comparison with MRI
Scintigraphy 0.977 0.224 0 –1.838 0.336 0
Radiography 0.149 0.228 0.515 –2.2392 0.339 0
CT –0.247 0.482 0.608 –1.258 0.609 0.039
SPECT 0.412 0.352 0.242 0.1 0.526 0.85
PET –0.936 0.371 0.012 0.126 0.498 0.801
TABLE 21 Summary of studies of scintigraphy
First author and yearof publication
Number ofparticipants Type or cause of osteomyelitis Isotope and scintigraphy type
Included in main meta-analysis
Al-Sheikh (1985)39 22 Multiple 67Ga
99mTc-MDP
99mTc-MDP/67Ga
111In WBC
Blume (1997)42 27 Diabetic foot ulcers 99mTc-HMPAO WBC
99mTc-MDP
Bolouri (2013)44 42 Jaw/head 99mTc-DPD
Croll (1996)47 22 Diabetic foot ulcers 99mTc-MDP
111In WBC
Enderle (1999)49 16 Diabetic foot ulcers 99mTc-MDP
Ertugrul (2006)51 26 Diabetic foot ulcers 99mTc-WBC and 99mTc-MDP
Familiari (2011)53 13 Diabetic foot ulcers 99mTc-HMPAO WBC
Gemmel (2004)57 22 Surgical in spine 99mTc-ciprofloxacin (Infection;Bayer plc, Newbury, UK)
Guhlmann (1998)59 37 Contiguous (multiple locations) 99mTc-AGAb/99mTc-MDP
Heiba (2017)63 33 Pelvis/hip Not reported
Kaim (2000)68 19 Long bone trauma 99mTc-DPD/99mTc-Mab
Larcos (1991)71 49 Diabetic foot ulcers 99mTc-MDP
Larcos (1991)71 51 Diabetic foot ulcers 111In WBC
Levine (1994)74 11 Not reported 99mTc-HMDP
111In WBC
continued
DOI: 10.3310/hta23610 HEALTH TECHNOLOGY ASSESSMENT 2019 VOL. 23 NO. 61
© Queen’s Printer and Controller of HMSO 2019. This work was produced by Llewellyn et al. under the terms of a commissioning contract issued by the Secretary of State forHealth and Social Care. This issue may be freely reproduced for the purposes of private research and study and extracts (or indeed, the full report) may be included in professionaljournals provided that suitable acknowledgement is made and the reproduction is not associated with any form of advertising. Applications for commercial reproduction shouldbe addressed to: NIHR Journals Library, National Institute for Health Research, Evaluation, Trials and Studies Coordinating Centre, Alpha House, University of Southampton SciencePark, Southampton SO16 7NS, UK.
115

TABLE 21 Summary of studies of scintigraphy (continued )
First author and yearof publication
Number ofparticipants Type or cause of osteomyelitis Isotope and scintigraphy type
Lewis (1988)75 52 Skin ulceration 99mTc-WBC
Mason (1989)79 11 Long bone trauma 111In WBC
Meller (2002)81 34 Multiple 111In WBC
Modic (1985)83 20 Multiple 67Ga
99mTc-HMDP
Newman (1991)89 39 Diabetic foot ulcers 99mTc-MDP
111In WBC
Newman (1992)90 16 Diabetic foot ulcers 111In WBC
Nigro (1992)91 39 Diabetic foot ulcers 99mTc-HMDP
Park (1982)92 36 Diabetic foot ulcers 99mTc-MDP
Remedios (1998)94 9 Diabetic foot ulcers 99mTc-NA
Sarikaya (2003)97 55 Diabetic foot ulcers 99mTc-MDP
99mTc-dextran
Schwegler (2008)99 20 Diabetic foot ulcers 99mTc-Mab
Seabold (1990)100 16 Neuropathic osteoarthropathy 111In WBC/99mTc-MDP
Segall (1989)102 24 Diabetic foot ulcers 99mTc-MDP
Unger (1988)104 31 Multiple 99mTc-MDP
Weinstein (1993)107 22 Diabetic foot infections 99mTc-MDP/67Ga
Weon (2000)109 12 Hip/knee 99mTc-HMPAO WBC
Williamson (1989)110 7 Foot (mixed causes) 99mTc-MDP
Yuh (1989)112 29 Diabetic foot ulcers 99mTc-MDP
Additional studies reporting only scintigraphy
Glaudemans (2013)132 61 Multiple 99mTc-HMPAO WBC
Harwood (1999)136 47 Diabetic foot ulcers 99mTc-MDP
99mTc-Mab
99mTc-WBC
Kolindou (1996)142 107 Multiple 111In WBC/99mTc-MDP
Mora (2010)148 94 Not reported 99mTc ciprofloxacin
Nepola (1993)149 44 Trauma or surgery 99mTc-MDP and 111In WBC scan
Nijhof (1997)150 26 Multiple 99mTc-MDP
111In IgG
Noriega-Alvarez (2017)151 27 Multiple 99mTc-HMPAO WBC
Oyen (1992)152 52 Multiple 99mTc-MDP and 111In IgG
Sorsdahl (1993)165 126 Multiple 99mTc-MDP(3 phase) + 67Ga
DPD, diphosphono-1,2-propanodicarboxylic acid.
APPENDIX 4
NIHR Journals Library www.journalslibrary.nihr.ac.uk
116

4030
20
10
3040506070
80
Spec
ifici
ty (
%)
90
95
50 60 70 80Incidence of osteomyelitis (%)
FIGURE 24 Association between specificity and incidence of osteomyelitis in MRI studies.
30
40
50
60
Sen
siti
vity
(%
)
70
80
90
100
90100 80 70 60 50 40Specificity (%)
Type of PETPETPET-CT
FIGURE 25 Sensitivity and specificity for PET and PET-CT studies.
DOI: 10.3310/hta23610 HEALTH TECHNOLOGY ASSESSMENT 2019 VOL. 23 NO. 61
© Queen’s Printer and Controller of HMSO 2019. This work was produced by Llewellyn et al. under the terms of a commissioning contract issued by the Secretary of State forHealth and Social Care. This issue may be freely reproduced for the purposes of private research and study and extracts (or indeed, the full report) may be included in professionaljournals provided that suitable acknowledgement is made and the reproduction is not associated with any form of advertising. Applications for commercial reproduction shouldbe addressed to: NIHR Journals Library, National Institute for Health Research, Evaluation, Trials and Studies Coordinating Centre, Alpha House, University of Southampton SciencePark, Southampton SO16 7NS, UK.
117

TABLE 22 Results from logistic regression model to compare tests
Test
Difference in log-odds of specificity Difference in log-DOR
Estimate Standard error p-value Estimate Standard error p-value
Comparison with radiography
MRI –0.149 0.228 0.512 2.392 0.339 0
Scintigraphy 0.83 0.198 0 0.554 0.272 0.041
CT –0.399 0.465 0.391 1.139 0.565 0.044
SPECT 0.261 0.362 0.471 2.493 0.53 0
PET –1.085 0.377 0.004 2.516 0.493 0
Comparison with MRI
Scintigraphy 0.977 0.224 0 –1.838 0.336 0
Radiography 0.149 0.228 0.515 –2.2392 0.339 0
CT –0.247 0.482 0.608 –1.258 0.609 0.039
SPECT 0.412 0.352 0.242 0.1 0.526 0.85
PET –0.936 0.371 0.012 0.126 0.498 0.801
100Radiography
80
60
40
20
100Scintigraphy
80
60
Sen
siti
vity
(%
)Se
nsi
tivi
ty (
%)
Sen
siti
vity
(%
)
40
20
SPECT
Specificity (%)
Specificity (%) Specificity (%) Specificity (%)
Specificity (%) Specificity (%)
Follow-upHistopathology orfollow-upHistopathology/microbiology
Reference standard
100CT
80
60
40
20
MRI PET
020406080100
020406080100020406080100
020406080100020406080100
100
80
60
Sen
siti
vity
(%
)Se
nsi
tivi
ty (
%)
40
20
100
80
60
40
20
Sen
siti
vity
(%
)
Specificity (%)
Ultrasound
020406080100
100
80
60
Sen
siti
vity
(%
)
40
20
100
80
60
40
20
100 020406080
FIGURE 26 Sensitivity and specificity according to test and reference standard used.
APPENDIX 4
NIHR Journals Library www.journalslibrary.nihr.ac.uk
118

100Radiography
9080706050403020
100 90 80 70 60 50 40 30 20 10 0
100Scintigraphy
90807060
Sen
siti
vity
(%
)Se
nsi
tivi
ty (
%)
Sen
siti
vity
(%
)
Sen
siti
vity
(%
)
Sen
siti
vity
(%
)
Sen
siti
vity
(%
)
50403020
SPECT
Specificity (%)
Specificity (%) Specificity (%)
Specificity (%) Specificity (%) Specificity (%)
High risk of biasLow risk of biasUnclear risk of bias
Patient selectionQUADAS-2 assessment10
0 90 80 70 60 50 40 30 20 10 010
0 90 80 70 60 50 40 30 20 10 0
100 90 80 70 60 50 40 30 20 10 0
100 90 80 70 60 50 40 30 20 10 0
100 90 80 70 60 50 40 30 20 10 0
100CT
9080706050403020
MRI PET1009080706050403020
1009080706050403020
1009080706050403020
Sen
siti
vity
(%
)
Specificity (%)
Ultrasound
100 90 80 70 60 50 40 30 20 10 0
1009080706050403020
FIGURE 27 Sensitivity and specificity according to risk of bias owing to patient selection.
High risk of biasLow risk of biasUnclear risk of bias
Index test QUADAS-2 assessment
100Radiography
9080706050403020
100 90 80 70 60 50 40 30 20 10 0
100Scintigraphy
90807060
Sen
siti
vity
(%
)Se
nsi
tivi
ty (
%)
Sen
siti
vity
(%
)
Sen
siti
vity
(%
)Se
nsi
tivi
ty (
%)
Sen
siti
vity
(%
)
50403020
SPECT
Specificity (%)
Specificity (%) Specificity (%)
Specificity (%) Specificity (%) Specificity (%)
100 90 80 70 60 50 40 30 20 10 0
100 90 80 70 60 50 40 30 20 10 0
100 90 80 70 60 50 40 30 20 10 0
100 90 80 70 60 50 40 30 20 10 0
100 90 80 70 60 50 40 30 20 10 0
100CT
9080706050403020
MRI PET1009080706050403020
1009080706050403020
Sen
siti
vity
(%
)
Specificity (%)
Ultrasound
100 90 80 70 60 50 40 30 20 10 0
1009080706050403020
1009080706050403020
FIGURE 28 Sensitivity and specificity according to risk of bias owing to index test.
DOI: 10.3310/hta23610 HEALTH TECHNOLOGY ASSESSMENT 2019 VOL. 23 NO. 61
© Queen’s Printer and Controller of HMSO 2019. This work was produced by Llewellyn et al. under the terms of a commissioning contract issued by the Secretary of State forHealth and Social Care. This issue may be freely reproduced for the purposes of private research and study and extracts (or indeed, the full report) may be included in professionaljournals provided that suitable acknowledgement is made and the reproduction is not associated with any form of advertising. Applications for commercial reproduction shouldbe addressed to: NIHR Journals Library, National Institute for Health Research, Evaluation, Trials and Studies Coordinating Centre, Alpha House, University of Southampton SciencePark, Southampton SO16 7NS, UK.
119

100Radiography
9080706050403020
100 90 80 70 60 50 40 30 20 10 0
100Scintigraphy
9080706050403020
1009080706050403020
SPECT
100 90 80 70 60 50 40 30 20 10 0
100 90 80 70 60 50 40 30 20 10 0
100 90 80 70 60 50 40 30 20 10 0
100 90 80 70 60 50 40 30 20 10 0
100 90 80 70 60 50 40 30 20 10 0
100CT
9080706050403020
1009080706050403020
1009080706050403020
MRI PET
Sen
siti
vity
(%
)Se
nsi
tivi
ty (
%)
Sen
siti
vity
(%
)
Sen
siti
vity
(%
)
Sen
siti
vity
(%
)
Sen
siti
vity
(%
)
Specificity (%)
Specificity (%) Specificity (%)
Specificity (%) Specificity (%) Specificity (%)
NoNot reportedYes
Metal
1009080706050403020
Ultrasound
100 90 80 70 60 50 40 30 20 10 0
Sen
siti
vity
(%
)
Specificity (%)
FIGURE 29 Sensitivity and specificity according to presence of indwelling metalwork.
100
40
50
60PPV
(%
) 70
80
90
100
90 80 70 60 50 40 30 20 10 0NPV (%)
Test usedMRIPETScintigraphySPECTUltrasoundRadiography
FIGURE 30 The PPV and NPV in studies of people with diabetic foot ulcers.
APPENDIX 4
NIHR Journals Library www.journalslibrary.nihr.ac.uk
120
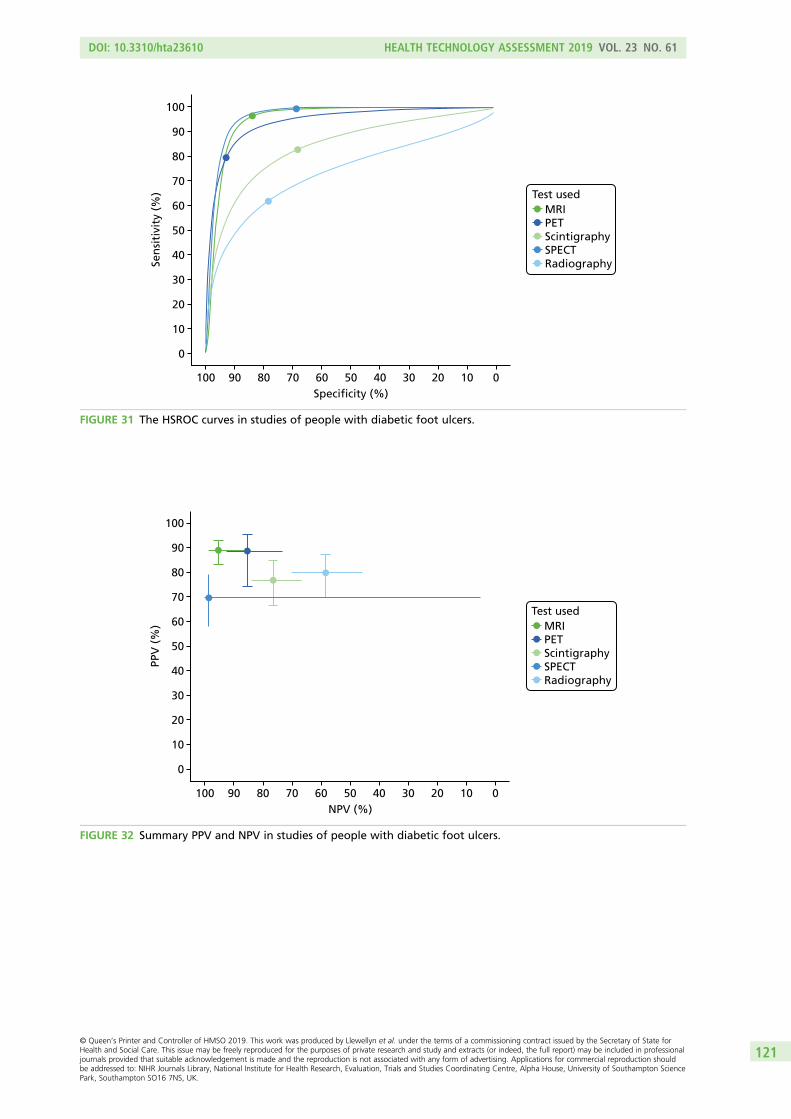
100
20
10
0
30
40
50
60
Sen
siti
vity
(%
)
70
80
90
100
90 80 70 60 50 40 30 20 10 0Specificity (%)
Test usedMRIPETScintigraphySPECTRadiography
FIGURE 31 The HSROC curves in studies of people with diabetic foot ulcers.
100
20
10
0
30
40
50
60
PPV
(%
)
70
80
90
100
90 80 70 60 50 40 30 20 10 0NPV (%)
Test usedMRIPETScintigraphySPECTRadiography
FIGURE 32 Summary PPV and NPV in studies of people with diabetic foot ulcers.
DOI: 10.3310/hta23610 HEALTH TECHNOLOGY ASSESSMENT 2019 VOL. 23 NO. 61
© Queen’s Printer and Controller of HMSO 2019. This work was produced by Llewellyn et al. under the terms of a commissioning contract issued by the Secretary of State forHealth and Social Care. This issue may be freely reproduced for the purposes of private research and study and extracts (or indeed, the full report) may be included in professionaljournals provided that suitable acknowledgement is made and the reproduction is not associated with any form of advertising. Applications for commercial reproduction shouldbe addressed to: NIHR Journals Library, National Institute for Health Research, Evaluation, Trials and Studies Coordinating Centre, Alpha House, University of Southampton SciencePark, Southampton SO16 7NS, UK.
121

TABLE 23 Univariate meta-analyses of studies of people with diabetic foot ulcers
Test Outcome Estimate (%) 95% CI (%) I2
MRI Sensitivity 95.76 91.83 to 97.85 0
Specificity 81.79 69.35 to 89.91 0
DOR 51.08 21.3 to 122.53 60
PR 70.43 64.03 to 77.47 1
PET Sensitivity 84.34 52.77 to 96.29 0
Specificity 92.8 75.67 to 98.16 0
DOR 33.91 11.75 to 97.92 12
PR 45.88 27.81 to 75.69 36
Scintigraphy Sensitivity 84.69 65.86 to 94.07 0
Specificity 73.99 54.96 to 86.89 0
DOR 8.66 4.74 to 15.83 16
PR 73.57 64.29 to 84.2 9
SPECT Sensitivity 95.53 75.95 to 99.31 0
Specificity 55.09 19.26 to 86.32 36
DOR 22.91 1.91 to 274.73 62
PR 76.7 62.79 to 93.69 0
Ultrasound Sensitivity 78.57 2.39 to 99.82 –
Specificity 80 1.61 to 99.9 –
DOR 14.67 1.16 to 185.23 –
PR 63.16 30.87 to 129.23 –
Radiography Sensitivity 68.91 57.55 to 78.38 11
Specificity 77.99 63.67 to 87.76 0
DOR 5.97 3.09 to 11.51 62
PR 51.95 41.08 to 65.68 62
100
20
10
0
30
40
50
60
Sen
siti
vity
(%
)
70
80
90
100
90 80 70 60 50 40 30 20 10 0Specificity (%)
Type99mTc HMPAO WBC99mTc (H)MDP111In WBCOther/mixed
FIGURE 33 Meta-analysis of scintigraphy studies in people with diabetic foot ulcers.
APPENDIX 4
NIHR Journals Library www.journalslibrary.nihr.ac.uk
122

– 5.0 – 2.5 0.0
SPECT
Stu
dy
Stu
dy
Stu
dy
Stu
dy
Stu
dy
Stu
dy
2.5 5.0 – 5.0 – 2.5 0.0
Difference in log-DORDifference in log-DOR
Difference in log-DOR Difference in log-DOR Difference in log-DOR
Difference in log-DOR
Ultrasound
2.5 5.0 – 5.0 – 2.5 0.0
Radiography
MRI PET Scintigraphy
2.5 5.0
MRIPETScintigraphySPECTUltrasoundRadiography
Comparator test
– 5.0 – 2.5 0.0 2.5 5.0 – 5.0 – 2.5 0.0 2.5 5.0 – 5.0 – 2.5 0.0 2.5 5.0
FIGURE 34 Difference in DOR between studies – patients with diabetic foot ulcers.
TABLE 24 Results of logistic regression to compare tests – diabetic foot ulcers
Test
Difference in log-odds of specificity Difference in log-DOR
Estimate Standard error p-value Estimate Standard error p-value
Comparison with radiography
MRI –0.175 0.255 0.493 2.188 0.366 0
Scintigraphy 0.727 0.244 0.003 0.731 0.344 0.034
SPECT 0.792 0.728 0.277 0.43 1.043 0.68
PET –1.121 0.424 0.008 1.991 0.541 0
Comparison with MRI
Scintigraphy 0.902 0.281 0.001 –1.458 0.389 0
Radiography 0.175 0.255 0.493 –2.188 0.366 0
SPECT 0.968 0.682 0.156 –1.758 0.992 0.076
PET –0.946 0.429 0.028 –0.197 0.588 0.738
DOI: 10.3310/hta23610 HEALTH TECHNOLOGY ASSESSMENT 2019 VOL. 23 NO. 61
© Queen’s Printer and Controller of HMSO 2019. This work was produced by Llewellyn et al. under the terms of a commissioning contract issued by the Secretary of State forHealth and Social Care. This issue may be freely reproduced for the purposes of private research and study and extracts (or indeed, the full report) may be included in professionaljournals provided that suitable acknowledgement is made and the reproduction is not associated with any form of advertising. Applications for commercial reproduction shouldbe addressed to: NIHR Journals Library, National Institute for Health Research, Evaluation, Trials and Studies Coordinating Centre, Alpha House, University of Southampton SciencePark, Southampton SO16 7NS, UK.
123

60
70
80
90
100Long bone
50
40
30
60
70
80
90
100
50
40
30
NPV (%)
NPV (%) NPV (%)
NPV (%)100 8090 6070 4050 2030
Multiple or unreported
60
70
80
90
100Axial skeleton
50
40
30
60
70
80
90
100
50
40
30
PPV
(%
)PP
V (
%)
PPV
(%
)PP
V (
%)
Hip, pelvis and knee
100 8090 6070 4050 2030
100 8090 6070 4050 2030 100 8090 6070 4050 2030CTMRIPETScintigraphySPECTUltrasoundRadiography
Test used
FIGURE 35 The PPV and NPV by test location.
PPV
(%
)PP
V (
%)
60
70
80
90
100Trauma or surgery related
50
40
30
NPV (%)NPV (%)
NPV (%) NPV (%)NPV (%)
100 8090 6070 4050 2030
Unstated/other
100 8090 6070 4050 2030
60
70
80
90
100Contiguous
50
40
30
PPV
(%
)PP
V (
%)
60
70
80
90
100
50
40
30
60
70
80
90
100
50
40
30
PPV
(%
)
60
70
80
90
100
50
40
30
Infection or ulcer Multiple
100 8090 6070 4050 2030100 8090 6070 4050 2030100 8090 6070 4050 2030
CTMRIPETScintigraphySPECTUltrasoundRadiography
Test used
FIGURE 36 The PPV and NPV by cause of osteomyelitis.
APPENDIX 4
NIHR Journals Library www.journalslibrary.nihr.ac.uk
124

40
60
80
100
Long bone
0
20
40
60
80
100
0
20
Specificity (%) Specificity (%)
Specificity (%) Specificity (%)
100 80 60 40 020 100 80 60 40 020
100 80 60 40 020 100 80 60 40 020
Multiple or unreported
Axial skeletonSe
nsi
tivi
ty (
%)
Sen
siti
vity
(%
)
40
60
80
100
0
20
40
60
80
100
0
20
Sen
siti
vity
(%
)Se
nsi
tivi
ty (
%)
Hip, pelvis and knee
CTMRIPETScintigraphySPECT
Test used
FIGURE 37 Summary sensitivity and specificity by test location.
40
60
80
100
Trauma or surgery related
0
20
40
60
80
100
0
20
Specificity (%) Specificity (%)
Specificity (%) Specificity (%)
100 80 60 40 020 100 80 60 40 020
100 80 60 40 020 100 80 60 40 020
Unstated/other
Infection or ulcer
Sen
siti
vity
(%
)Se
nsi
tivi
ty (
%)
40
60
80
100
0
20
40
60
80
100
0
20Sen
siti
vity
(%
)Se
nsi
tivi
ty (
%)
Multiple
CTMRIPETScintigraphySPECT
Test used
FIGURE 38 Summary sensitivity and specificity by cause of osteomyelitis.
DOI: 10.3310/hta23610 HEALTH TECHNOLOGY ASSESSMENT 2019 VOL. 23 NO. 61
© Queen’s Printer and Controller of HMSO 2019. This work was produced by Llewellyn et al. under the terms of a commissioning contract issued by the Secretary of State forHealth and Social Care. This issue may be freely reproduced for the purposes of private research and study and extracts (or indeed, the full report) may be included in professionaljournals provided that suitable acknowledgement is made and the reproduction is not associated with any form of advertising. Applications for commercial reproduction shouldbe addressed to: NIHR Journals Library, National Institute for Health Research, Evaluation, Trials and Studies Coordinating Centre, Alpha House, University of Southampton SciencePark, Southampton SO16 7NS, UK.
125
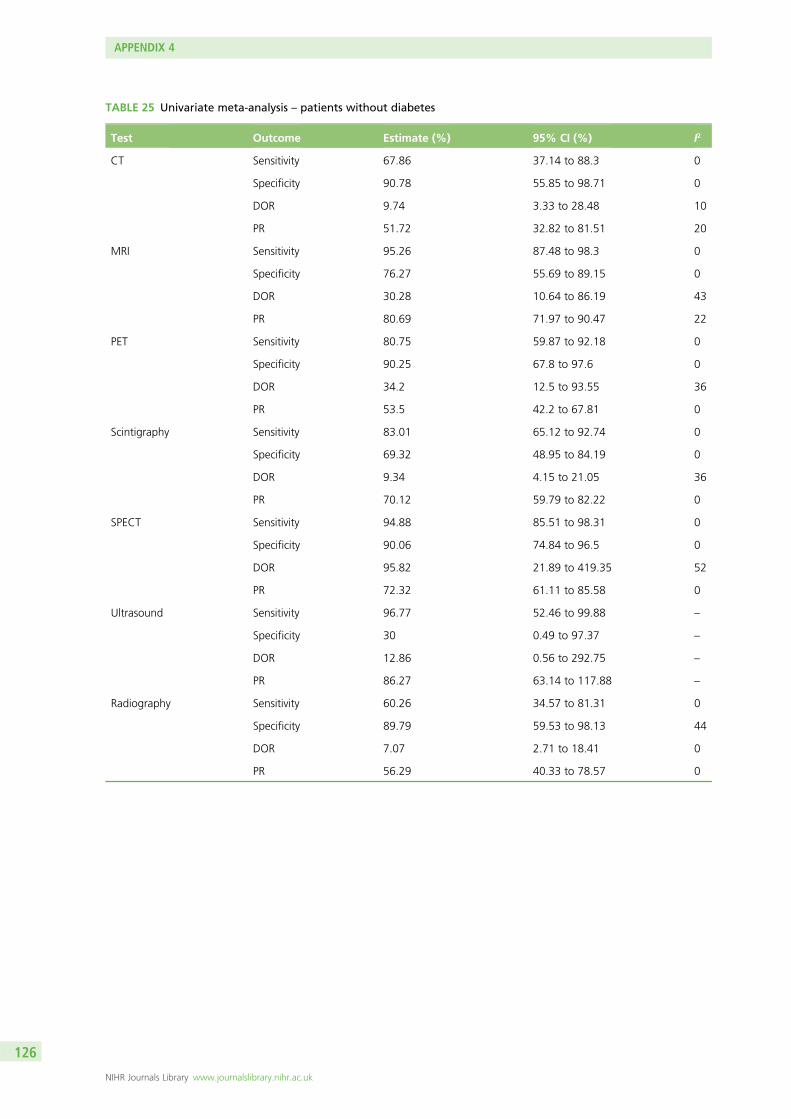
TABLE 25 Univariate meta-analysis – patients without diabetes
Test Outcome Estimate (%) 95% CI (%) I2
CT Sensitivity 67.86 37.14 to 88.3 0
Specificity 90.78 55.85 to 98.71 0
DOR 9.74 3.33 to 28.48 10
PR 51.72 32.82 to 81.51 20
MRI Sensitivity 95.26 87.48 to 98.3 0
Specificity 76.27 55.69 to 89.15 0
DOR 30.28 10.64 to 86.19 43
PR 80.69 71.97 to 90.47 22
PET Sensitivity 80.75 59.87 to 92.18 0
Specificity 90.25 67.8 to 97.6 0
DOR 34.2 12.5 to 93.55 36
PR 53.5 42.2 to 67.81 0
Scintigraphy Sensitivity 83.01 65.12 to 92.74 0
Specificity 69.32 48.95 to 84.19 0
DOR 9.34 4.15 to 21.05 36
PR 70.12 59.79 to 82.22 0
SPECT Sensitivity 94.88 85.51 to 98.31 0
Specificity 90.06 74.84 to 96.5 0
DOR 95.82 21.89 to 419.35 52
PR 72.32 61.11 to 85.58 0
Ultrasound Sensitivity 96.77 52.46 to 99.88 –
Specificity 30 0.49 to 97.37 –
DOR 12.86 0.56 to 292.75 –
PR 86.27 63.14 to 117.88 –
Radiography Sensitivity 60.26 34.57 to 81.31 0
Specificity 89.79 59.53 to 98.13 44
DOR 7.07 2.71 to 18.41 0
PR 56.29 40.33 to 78.57 0
APPENDIX 4
NIHR Journals Library www.journalslibrary.nihr.ac.uk
126
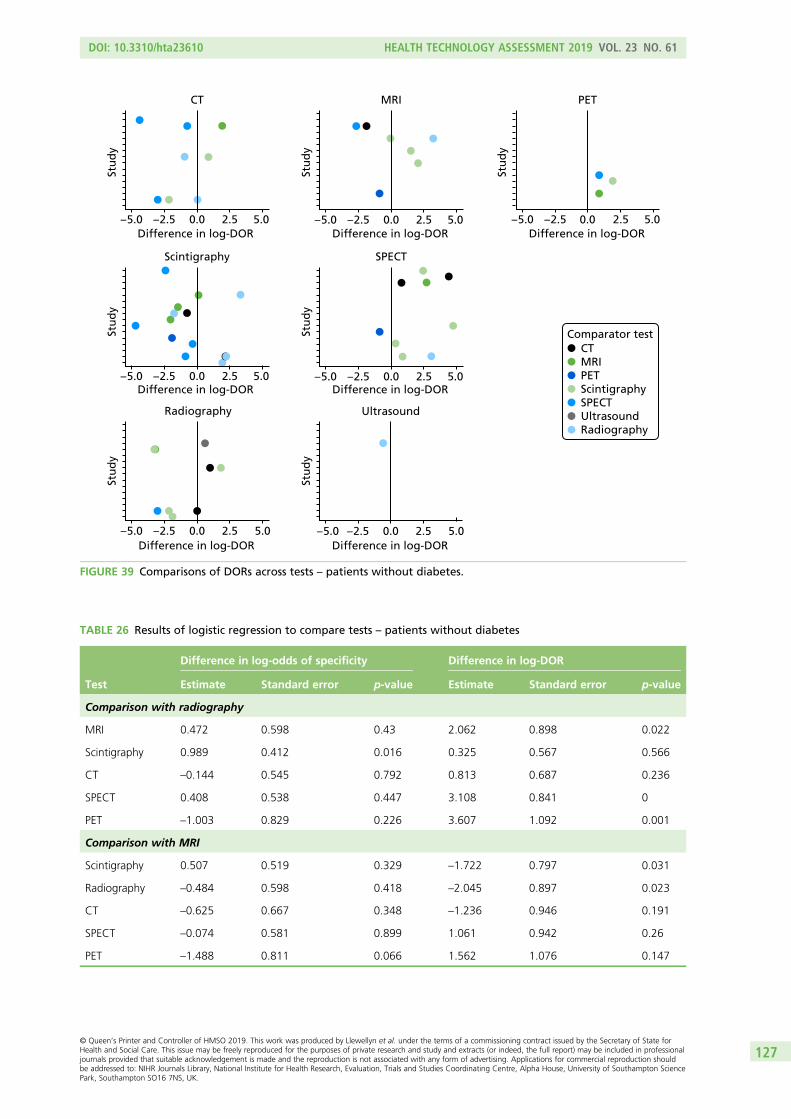
– 5.0 – 2.5 0.0
Radiography
Stu
dy
Stu
dy
Stu
dy
2.5 5.0Difference in log-DOR
Difference in log-DOR Difference in log-DOR
Difference in log-DOR Difference in log-DOR Difference in log-DOR
Scintigraphy
CT
Stu
dy
Stu
dy
Stu
dy
Stu
dy
– 2.5 0.0
SPECT
2.5 5.0
MRI
– 5.0– 2.5 0.0 2.5 5.0– 5.0
– 2.5 0.0 2.5 5.0– 5.0 – 2.5 0.0 2.5 5.0– 5.0 – 2.5 0.0 2.5 5.0– 5.0
Difference in log-DOR– 5.0 – 2.5 0.0
Ultrasound
2.5 5.0
PET
CTMRIPETScintigraphySPECTUltrasoundRadiography
Comparator test
FIGURE 39 Comparisons of DORs across tests – patients without diabetes.
TABLE 26 Results of logistic regression to compare tests – patients without diabetes
Test
Difference in log-odds of specificity Difference in log-DOR
Estimate Standard error p-value Estimate Standard error p-value
Comparison with radiography
MRI 0.472 0.598 0.43 2.062 0.898 0.022
Scintigraphy 0.989 0.412 0.016 0.325 0.567 0.566
CT –0.144 0.545 0.792 0.813 0.687 0.236
SPECT 0.408 0.538 0.447 3.108 0.841 0
PET –1.003 0.829 0.226 3.607 1.092 0.001
Comparison with MRI
Scintigraphy 0.507 0.519 0.329 –1.722 0.797 0.031
Radiography –0.484 0.598 0.418 –2.045 0.897 0.023
CT –0.625 0.667 0.348 –1.236 0.946 0.191
SPECT –0.074 0.581 0.899 1.061 0.942 0.26
PET –1.488 0.811 0.066 1.562 1.076 0.147
DOI: 10.3310/hta23610 HEALTH TECHNOLOGY ASSESSMENT 2019 VOL. 23 NO. 61
© Queen’s Printer and Controller of HMSO 2019. This work was produced by Llewellyn et al. under the terms of a commissioning contract issued by the Secretary of State forHealth and Social Care. This issue may be freely reproduced for the purposes of private research and study and extracts (or indeed, the full report) may be included in professionaljournals provided that suitable acknowledgement is made and the reproduction is not associated with any form of advertising. Applications for commercial reproduction shouldbe addressed to: NIHR Journals Library, National Institute for Health Research, Evaluation, Trials and Studies Coordinating Centre, Alpha House, University of Southampton SciencePark, Southampton SO16 7NS, UK.
127


EMEHS&DRHTAPGfARPHRPart of the NIHR Journals Librarywww.journalslibrary.nihr.ac.uk
This report presents independent research funded by the National Institute for Health Research (NIHR). The views expressed are those of the author(s) and not necessarily those of the NHS, the NIHR or the Department of Health and Social Care
Published by the NIHR Journals Library