imf country report no. 14/153 jordan · jordan 2 international monetary fund a generation in...
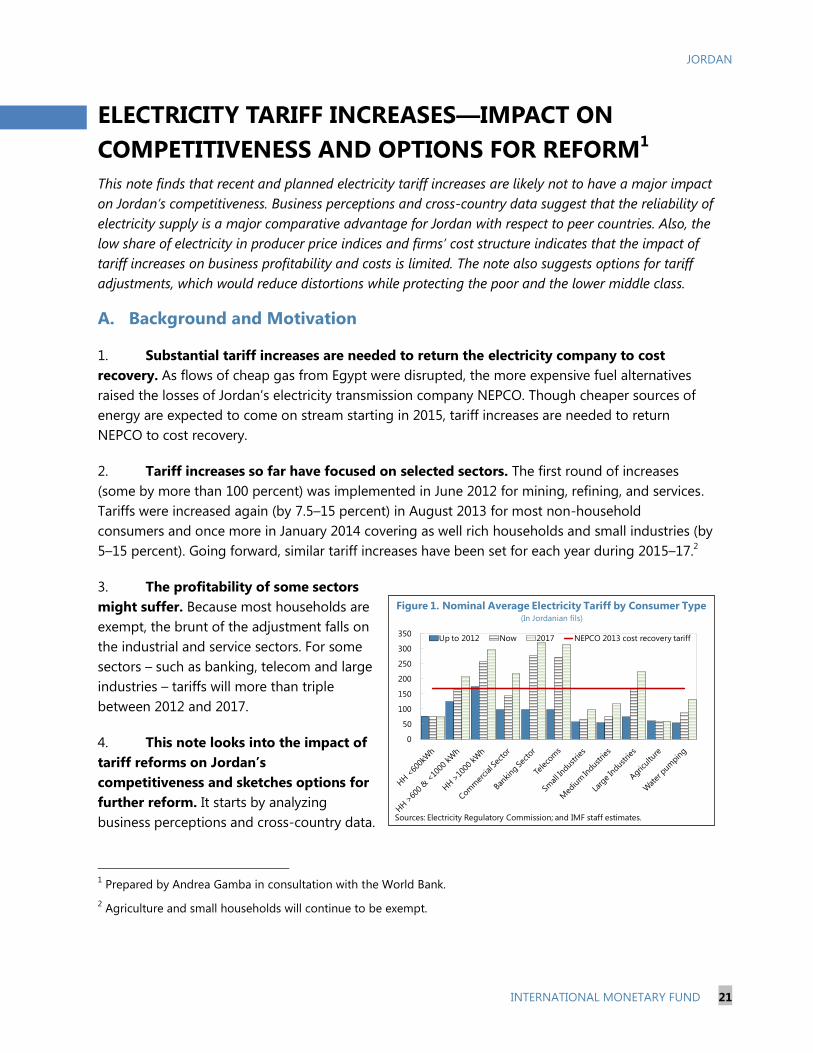
TRANSCRIPT

© 2014 International Monetary Fund
IMF Country Report No. 14/153
JORDAN SELECTED ISSUES
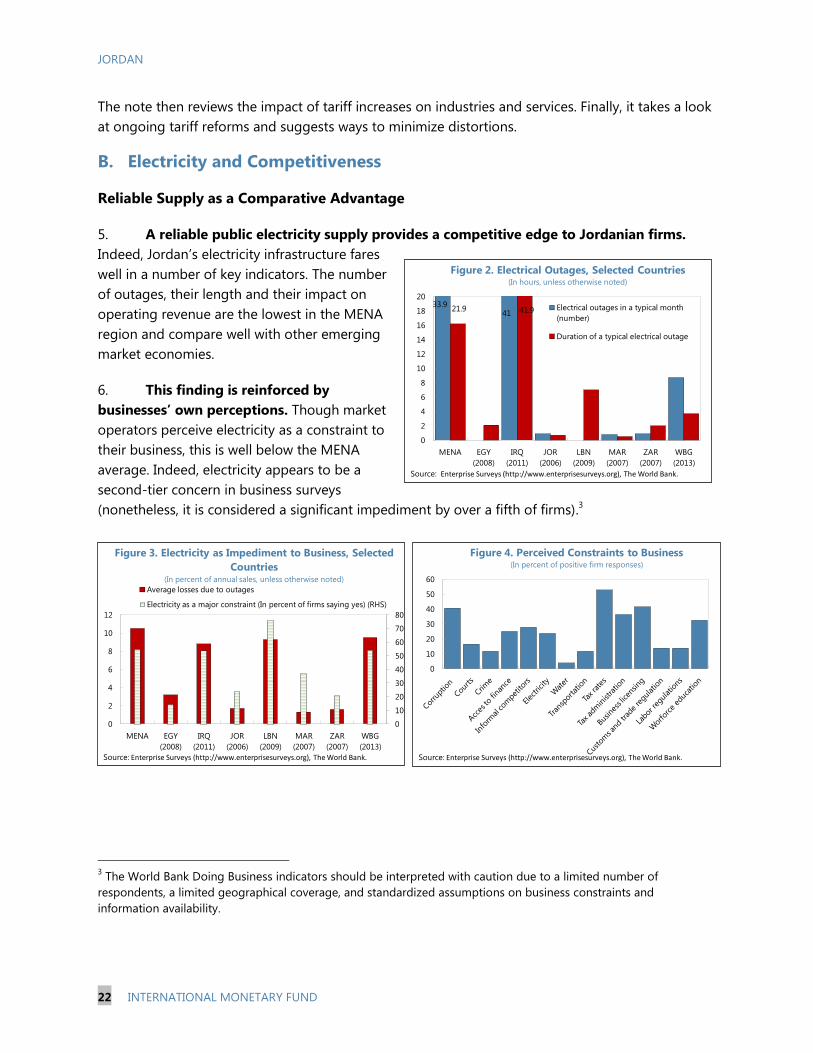
This Selected Issues Paper on Jordan was prepared by a staff team of the International Monetary Fund. It is based on the information available at the time it was completed on April 14, 2014.
The policy of publication of staff reports and other documents by the IMF allows for the deletion of market-sensitive information.
Copies of this report are available to the public from
International Monetary Fund Publication Services P.O. Box 92780 Washington, D.C. 20090
Telephone: (202) 623-7430 Fax: (202) 623-7201 E-mail: [email protected] Internet: http://www.imf.org
Price: $18.00 a copy
International Monetary Fund Washington, D.C.
June 2014
JORDAN
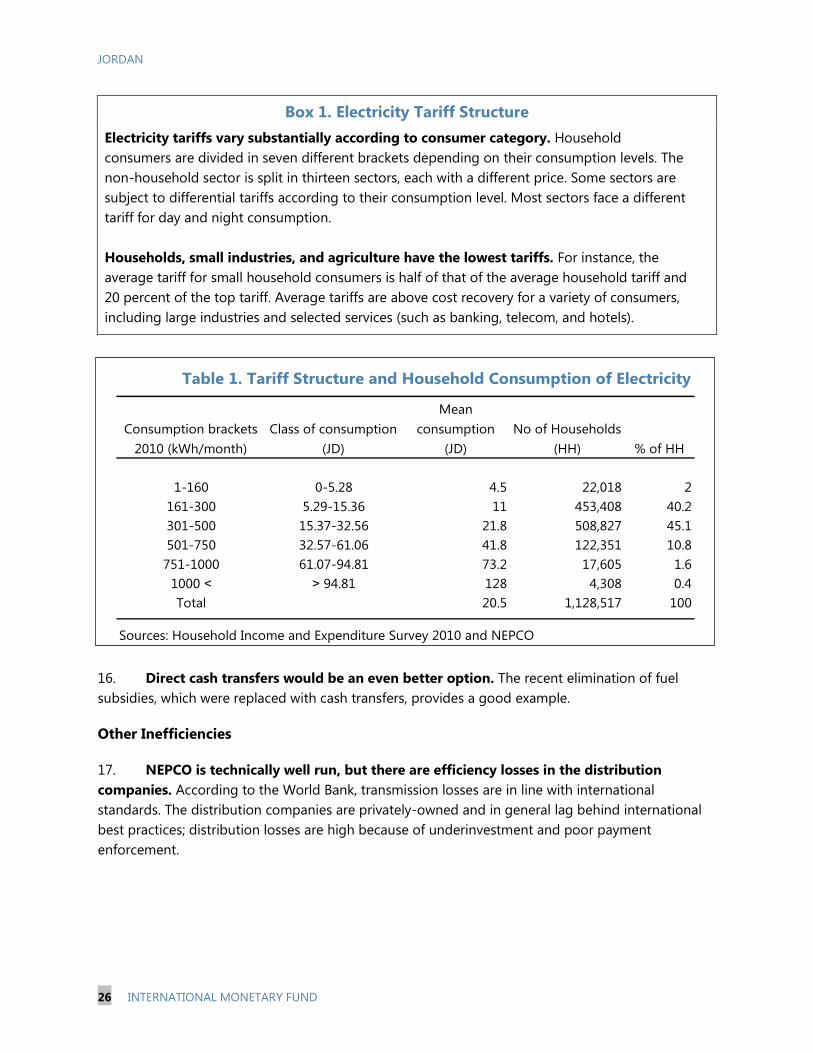
SELECTED ISSUES
Approved By Middle East and
Central Asia Department
Prepared By Yasser Abdih, Andrea Gamba, and
Rafik Selim (all MCD)
THE SYRIA CRISIS AS FELT IN JORDAN ________________________________________________ 3
A. Output_________________________________________________________________________________ 3
B. Labor Markets _________________________________________________________________________ 4
C. Inflation _______________________________________________________________________________ 5
D. Current Account _______________________________________________________________________ 6
FIGURES
1. Growth Forecasts for 2013 _____________________________________________________________ 3
2. Jordanian Informal Sector Workers and Syrian Refugees ______________________________ 3
3. Labor Market Outcomes _______________________________________________________________ 4
4. Unemployment and Public Sector Employment _______________________________________ 4
5. Labor Market Outcomes by Governorates _____________________________________________ 5
6. Syria Crisis Impact on Inflation, 2013 __________________________________________________ 5
7. Exports ________________________________________________________________________________ 6
8. Imports ________________________________________________________________________________ 6
9. Tourism Receipts ______________________________________________________________________ 6
APPENDIXES
I. The Impact on Measured GDP Growth—Empirical Model _____________________________ 8
II. The Impact on Formal Labor Market Outcomes—Empirical Model ____________________ 9
III. The Impact on Inflation—Empirical Model ____________________________________________ 12
APPENDIX TABLES
A2.1. Estimated Impact of Syria Crisis on Formal Labor Market Outcomes
at the National Level ______________________________________________________________ 10
A2.2. Estimated Impact of Syria Crisis on Formal Labor Market Outcomes
for Governorates Hosting 90 Percent of Syrian Refugees __________________________ 11
A3.1. Estimated Impact of Syria Crisis on Food Prices ___________________________________ 13
A3.2. Estimated Impact of Syria Crisis on Rents __________________________________________ 13
CONTENTS
April 14, 2014

JORDAN
2 INTERNATIONAL MONETARY FUND
A GENERATION IN WAITING—UNLOCKING THE EMPLOYMENT POTENTIAL
OF JORDAN’S POPULATION ___________________________________________________________14
FIGURES
1. Unemployment by Gender and Educational Level, 2013 ______________________________ 14
2. Labor Market Outcomes: Jordan and the World, 2013 ________________________________ 15
3. Unemployment Forecasts ____________________________________________________________ 17
4. Firms Identifying Labor Skill as a Major Constraint ___________________________________ 18
5. World Bank Doing Business Indicators: Overall Ranks, 2014 __________________________ 19
TABLES
1. Estimating Jordan's Employment Elasticity ___________________________________________ 16
2. Unemployment: Structural Component and Responsiveness to the Output Gap _____ 17
ELECTRICITY TARIFF INCREASES—IMPACT ON COMPETITIVENESS
AND OPTIONS FOR REFORM __________________________________________________________21
A. Background and Motivation __________________________________________________________ 21
B. Electricity and Competitiveness _______________________________________________________ 22
C. Outstanding Reform Issues ___________________________________________________________ 25
D. Conclusion and Policy Recommendations ____________________________________________ 27
BOX
1. Electricity Tariff Structure _____________________________________________________________ 26
FIGURES
1. Nominal Average Electricity Tariff by Consumer Type ________________________________ 21
2. Electrical Outages, Selected Countries ________________________________________________ 22
3. Electricity as Impediment to Business, Selected Countries ____________________________ 22
4. Perceived Constraints to Business ____________________________________________________ 22
5. Self-Generation, Selected Countries __________________________________________________ 23
6. Firms Stating Electricity Major Constraint ____________________________________________ 24
7. Losses If Electrical Outages Occur ____________________________________________________ 24
8. Cost Structure and Value Added of Industries ________________________________________ 24
TABLE
1. Tariff Structure and Household Consumption of Electricity ___________________________ 26
JORDAN
INTERNATIONAL MONETARY FUND 3
THE SYRIA CRISIS AS FELT IN JORDAN1
This note investigates the macroeconomic impact of the Syria crisis on Jordan. We find that the crisis:
(1) had an overall negative impact on measured output growth—although anecdotal evidence
suggests possibly a positive impact on output in the informal sector; (2) contributed to inflationary
pressures, particularly on rents; and (3) strained labor markets, mostly in the informal sector as
refugees compete with locals for jobs. While the crisis has put strain on the external trade balance, the
overall impact on the current account is not clear.2
A. Output
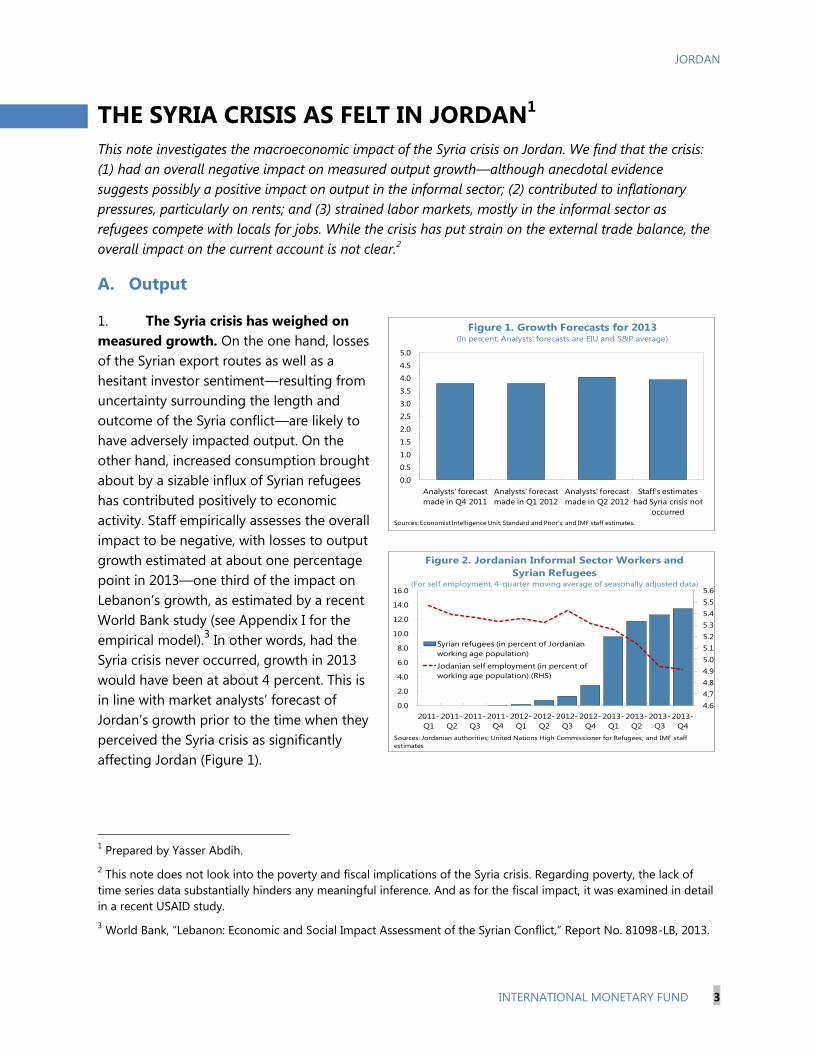
1. The Syria crisis has weighed on
measured growth. On the one hand, losses
of the Syrian export routes as well as a
hesitant investor sentiment—resulting from
uncertainty surrounding the length and
outcome of the Syria conflict—are likely to
have adversely impacted output. On the
other hand, increased consumption brought
about by a sizable influx of Syrian refugees
has contributed positively to economic
activity. Staff empirically assesses the overall
impact to be negative, with losses to output
growth estimated at about one percentage
point in 2013—one third of the impact on
Lebanon’s growth, as estimated by a recent
World Bank study (see Appendix I for the
empirical model).3 In other words, had the
Syria crisis never occurred, growth in 2013
would have been at about 4 percent. This is
in line with market analysts’ forecast of
Jordan’s growth prior to the time when they
perceived the Syria crisis as significantly
affecting Jordan (Figure 1).
1 Prepared by Yasser Abdih.
2 This note does not look into the poverty and fiscal implications of the Syria crisis. Regarding poverty, the lack of
time series data substantially hinders any meaningful inference. And as for the fiscal impact, it was examined in detail
in a recent USAID study.
3 World Bank, “Lebanon: Economic and Social Impact Assessment of the Syrian Conflict,” Report No. 81098-LB, 2013.
0.0
0.5
1.0
1.5
2.0
2.5
3.0
3.5
4.0
4.5
5.0
Analysts' forecast
made in Q4 2011
Analysts' forecast
made in Q1 2012
Analysts' forecast
made in Q2 2012
Staff's estimates
had Syria crisis not
occurred
Figure 1. Growth Forecasts for 2013(In percent; Analysts' forecasts are EIU and S&P average)
Sources: Economist Intelligence Unit; Standard and Poor's; and IMF staff estimates.
4.6
4.7
4.8
4.9
5.0
5.1
5.2
5.3
5.4
5.5
5.6
0.0
2.0
4.0
6.0
8.0
10.0
12.0
14.0
16.0
2011-
Q1
2011-
Q2
2011-
Q3
2011-
Q4
2012-
Q1
2012-
Q2
2012-
Q3
2012-
Q4
2013-
Q1
2013-
Q2
2013-
Q3
2013-
Q4
Syrian refugees (in percent of Jordanian
working age population)
Jodanian self employment (in percent of
working age population) (RHS)
Figure 2. Jordanian Informal Sector Workers and
Syrian Refugees(For self employment, 4-quarter moving average of seasonally adjusted data)
Sources: Jordanian authorities; United Nations High Commissioner for Refugees; and IMF staff
estimates
JORDAN
4 INTERNATIONAL MONETARY FUND
2. Nonetheless, informal sector output is likely to have risen. Even before the Syria crisis,
the informal sector was large, with staff’s prior research putting its size at about 26 percent of
measured GDP.4 Now, anecdotal evidence suggests an even growing share of unmeasured output
due to the heavy involvement of Syrian refugees in informal activity in sectors such as agriculture,
construction, food services, retail trade, and home-based production. However, some crowding out
of Jordanian nationals may have occurred, as evidenced by the recent sharp decline in Jordanian self
employment, a typical proxy for informal sector employment (Figure 2).5
B. Labor Markets
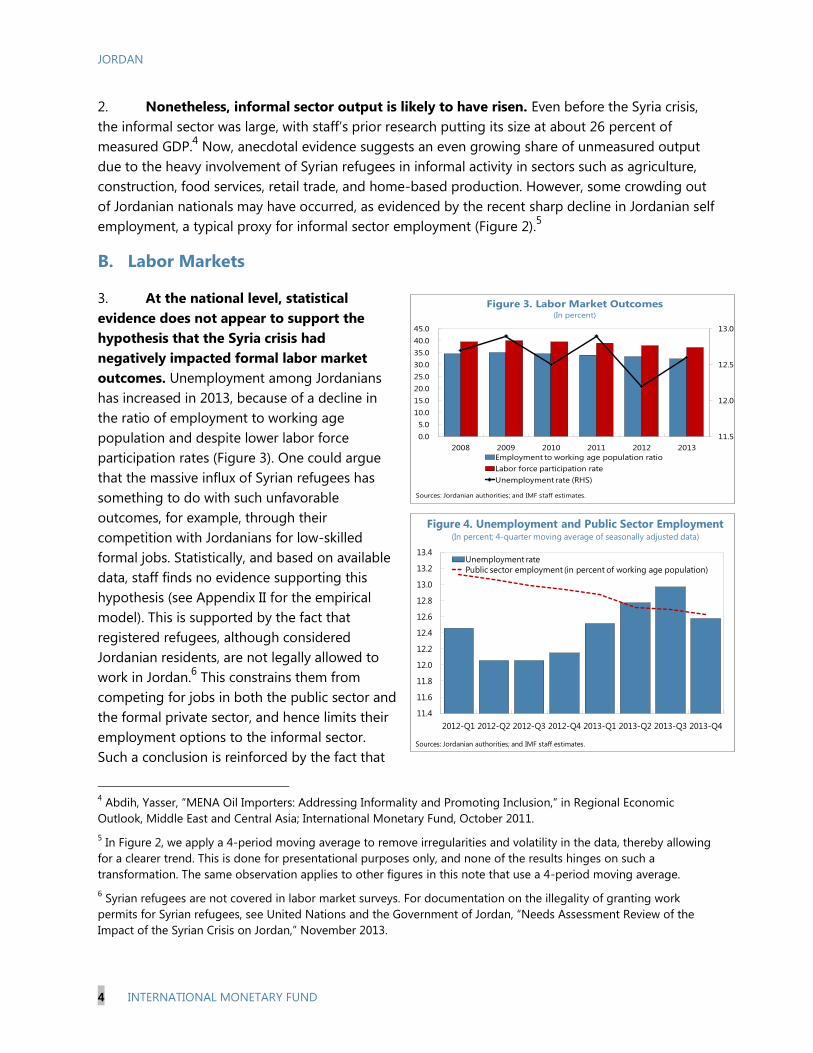
3. At the national level, statistical
evidence does not appear to support the
hypothesis that the Syria crisis had
negatively impacted formal labor market
outcomes. Unemployment among Jordanians
has increased in 2013, because of a decline in
the ratio of employment to working age
population and despite lower labor force
participation rates (Figure 3). One could argue
that the massive influx of Syrian refugees has
something to do with such unfavorable
outcomes, for example, through their
competition with Jordanians for low-skilled
formal jobs. Statistically, and based on available
data, staff finds no evidence supporting this
hypothesis (see Appendix II for the empirical
model). This is supported by the fact that
registered refugees, although considered
Jordanian residents, are not legally allowed to
work in Jordan.6 This constrains them from
competing for jobs in both the public sector and
the formal private sector, and hence limits their
employment options to the informal sector.
Such a conclusion is reinforced by the fact that
4 Abdih, Yasser, “MENA Oil Importers: Addressing Informality and Promoting Inclusion,” in Regional Economic
Outlook, Middle East and Central Asia; International Monetary Fund, October 2011.
5 In Figure 2, we apply a 4-period moving average to remove irregularities and volatility in the data, thereby allowing
for a clearer trend. This is done for presentational purposes only, and none of the results hinges on such a
transformation. The same observation applies to other figures in this note that use a 4-period moving average.
6 Syrian refugees are not covered in labor market surveys. For documentation on the illegality of granting work
permits for Syrian refugees, see United Nations and the Government of Jordan, “Needs Assessment Review of the
Impact of the Syrian Crisis on Jordan,” November 2013.
11.5
12.0
12.5
13.0
0.0
5.0
10.0
15.0
20.0
25.0
30.0
35.0
40.0
45.0
2008 2009 2010 2011 2012 2013
Employment to working age population ratio
Labor force participation rate
Unemployment rate (RHS)
Figure 3. Labor Market Outcomes(In percent)
Sources: Jordanian authorities; and IMF staff estimates.
11.4
11.6
11.8
12.0
12.2
12.4
12.6
12.8
13.0
13.2
13.4
2012-Q1 2012-Q2 2012-Q3 2012-Q4 2013-Q1 2013-Q2 2013-Q3 2013-Q4
Unemployment rate
Public sector employment (in percent of working age population)
Figure 4. Unemployment and Public Sector Employment(In percent; 4-quarter moving average of seasonally adjusted data)
Sources: Jordanian authorities; and IMF staff estimates.

JORDAN
INTERNATIONAL MONETARY FUND 5
many of the refugees are very young—more than half of the total refugee population is less than
18 years old. At this age, competition with locals would likely be in the informal labor market.
Instead, the public sector creating fewer jobs is a plausible alternative explanation of the recent
worsening of unemployment outcomes, because the sector has been generating much of the jobs in
the last decade (Figure 4).
4. The same result holds when one
looks at labor market outcomes by
governorates. Amman, Mafraq, Irbid, and
Zarqa, cumulatively host nearly ninety
percent of the Syrian refugees; eight
governorates, including those in the south,
host the remaining 10 percent. In the former
group of governorates, unemployment rates
have somewhat declined from their pre-Syria
conflict levels, whereas in the latter group,
such rates have marginally deteriorated
(Figure 5). This is consistent with staff’s
empirical analysis.
C. Inflation
5. The influx of Syrian refugees has put upward pressure on the prices of non-tradable
goods. In particular, staff finds a statistically significant effect on Jordan’s rental prices last year, with
an estimated crisis impact on end-of-period
rent inflation of about 5 percentage points
by year-end (see Appendix III for the
empirical model). This translates into a
higher end-of-period consumer price index
(CPI) inflation of about 0.6 percentage points
relative to the counterfactual of the Syria
crisis having not occurred (Figure 6).
Moreover, staff finds no statistically
significant effect of the crisis on domestic
food prices. The latter is estimated to be
predominantly driven by international food
prices, both in the short run and long run,
likely reflecting Jordan’s high degree of openness.
0
5
10
15
20
25
30
35
40
45
2010 2011 2012 2013 2010 2011 2012 2013 2010 2011 2012 2013
Unemployment rate Labor force participation
rate
Employment to
working age
population ratioGovernorates hosting 90 percent of refugees
Governorates hosting 10 percent of refugees
Figure 5. Labor Market Outcomes by Governorates(In percent)
Sources: Jordanian authorities; and IMF staff estimates.
7.73
2.66
3.31
2.69
0
1
2
3
4
5
6
7
8
9
Actual, incorporating Syria crisis Had Syria crisis not occurred
Rent inflation, eop CPI inflation, eop
Figure 6. Syria Crisis Impact on Inflation, 2013(In percent)
Source: IMF staff estimates.

JORDAN
6 INTERNATIONAL MONETARY FUND
D. Current Account
6. The Syria crisis has taken a toll on the
trade balance. Because of the conflict, Jordan
lost a major export route to Europe and other
countries in the region. Indeed, during the first
eleven months of 2013, combined exports to
Lebanon, Turkey, and Europe dropped by
30 percent relative to the same period in 2012.
As a result, Jordan is reportedly considering more
expensive alternative routes—including Iraq and
the Aqaba Port—with adverse implications for
competitiveness. Abstracting from mining
exports, which have been facing difficulties
unrelated to the Syria conflict, the severe
contraction in exports that travel through Syria
has resulted in a sizable moderation in export
growth— excluding potash and phosphate,
exports grew by an average of a mere
0.7 percent per quarter in the two years up to
2013-Q3, down from an average of 3 percent in
the previous two years (Figure 7). At the same
time, imports through Syria have declined
sharply (Figure 8). Nonetheless, the increased
size of the population brought about by the
influx of Syrian refugees has resulted in a rise in
overall imports. Non-energy imports are
estimated to have increased by over 11 percent
in 2013.
7. Nonetheless, the overall impact on the
current account is not clear. Transfers through
the UN agencies and from other private citizens
abroad to support the refugees have contributed
positively to the current account; but there is
uncertainty regarding their size, particularly on the latter. Tourism got hit initially when the transition
started in the region. Because Jordan has been stable, tourism has begun to recover, including from
non-Arab countries (Figure 9). That said, recent trends in tourism receipts are likely to be
underestimated because the data do not take into account increased duration of stay of Gulf
Cooperation Council (GCC) tourists as a result of reorientation of such activities towards Jordan from
more affected countries—including Lebanon, Egypt, and Syria. This may apply as well to tourists
3.0
3.5
4.0
4.5
5.0
5.5
7.8
7.9
8
8.1
8.2
8.3
8.4
8.5
8.6
8.7
2007-Q4 2008-Q4 2009-Q4 2010-Q4 2011-Q4 2012-Q4 2013-Q4
Non-energy imports Total imports Imports through Syria (RHS)
Figure 8. Imports(4-quarter moving average of seasonally adjusted data; in logs)
Sources: Jordanian authorities; and IMF staff estimates.
6.1
6.2
6.3
6.4
6.5
6.6
6.7
6.8
6.9
4.0
4.2
4.4
4.6
4.8
5.0
5.2
5.4
5.6
5.8
6.0
2007-4 2008-4 2009-4 2010-4 2011-4 2012-4 2013-4
GCC Jordan Non-Arab countries
Other Arab countries Total (RHS)
Figure 9. Tourism Receipts(4-quarter moving average of seasonally adjusted data; in logs)
Sources: Jordanian authorities; and IMF staff estimates.
2.4
2.6
2.8
3.0
3.2
3.4
3.6
6.8
6.9
7
7.1
7.2
7.3
7.4
7.5
2007-Q4 2008-Q4 2009-Q4 2010-Q4 2011-Q4 2012-Q4 2013-Q4
Exports excluding potash and phosphate
Total domestic exports
Exports through Syria (RHS)
Figure 7. Exports(4-quarter moving average of seasonally adjusted data; in logs)
Sources: Jordanian authorities; and IMF staff estimates.

JORDAN
INTERNATIONAL MONETARY FUND 7
from other countries in the region.7 The overall impact of the crisis on the current account though is
not clear, because it depends on whether the gains from current private transfers and tourism
receipts more than offset the deterioration in the trade balance. Available data do not allow for a
quantitative assessment.
7 Two additional factors may be at play here. First, there is the “Libya effect.”Libyans came to Jordan for medical
treatment throughout 2012, but this was not repeated in 2013. This has nothing to do with the Syria crisis, and may
partially explain the moderation in tourism receipts in 2013 from other Arab countries (see Figure 9). Second, there is
a “Ramadan effect.”Ramadan in 2013 coincided with the tourism season and may have negatively affected tourism
from the GCC and other Arab countries. Again, this has nothing to do with the Syria crisis, and although the data in
Figure 9 are seasonally-adjusted, the effect may still be there, because Ramadan does not come at the same time
each year.

JORDAN
8 INTERNATIONAL MONETARY FUND
Appendix I. The Impact on Measured GDP Growth—
Empirical Model
1. We begin by estimating the following dynamic error correction model utilizing quarterly
data:
where yt denotes the log of seasonally-adjusted real GDP; ∆yt is first difference of yt ,measuring the
growth rate of real output; y-y* denotes the output gap measured as the deviation of the log of
seasonally-adjusted real GDP from its Hodrick-Prescott (HP) trend; Dt is a vector of deterministic variables
that includes a constant and a time trend—the latter accounts for the combined effect of potentially
omitted variables. Conceptually, one can measure the Syria shock by two alternative ways: the number of
refugees or a dummy variable. The lack of sufficient time series data on the number of refugees renders
the first approach not feasible. As such, we conduct our empirical analysis using a dummy variable to
proxy for the Syria crisis, denoted Syria above. A priori, we expect β to be negative (signifying the
workings of error correction). Also, a negative value for λ would indicate a negative overall impact on
GDP growth of the Syria crisis.
2. Pretesting the above general model and starting a with relatively generous lag length ( p=6 in
the above model) revealed the following: Spillovers of the Syria crisis are not statistically significant prior
to the second quarter of 2012; only the fifth lag on growth matters statistically; large estimated errors in
1993-Q4 and 1995-Q1 taint residual normality and homoscedasticity; and the estimated coefficient of the
time trend is not statistically significant. Utilizing this information, we estimate the following final
parsimonious error correction model:
where Dt93,Q4
and Dt93,Q4
are impulse dummy variables taking the value of 1 in 1993-Q4 and 1995-Q1
respectively and zero otherwise; and Syriat is a dummy variable that takes the value of zero prior to
2012-Q2 and one otherwise. The regression output shows that all the estimated parameteres are highly
statistically significant (p-values of the t-statistic are reported in brackets); the Syria crisis has weighed on
Jordan’s output growth; and there is ultimate convergence to the steady state, as indicated by the
negative coefficient on the lagged output gap. Furthermore, various diagnostis tests show that such
inference comes from a statistically well specified and constant model with white noise residuals.1 The
coefficient of the Syria dummy variable together with the estimated model dynamics indicate losses to
GDP growth (because of the Syria crisis) of one percentage point in 2013.
1 Diagnostic tests for model validity (in the format Statistic = value (p-value)) test the null hypotheses that: there is
no residual autocorrelation (AR); there is no residual autoregressive conditional heteroscedasticity (ARCH); the
residuals are normally distributed; there is no residual heteroscedasticity (Hetero); the estimated parameters are
stable over time ( Chow) ; and the estimated regression model is well specified (Reset). Specifically, AR = 1.64 (0.161);
ARCH = 1.19 (0.323); Normality = 2.50 (0.286); Hetero = 0.57 (0.726); Chow =0.59 (0.916); and Reset = 1.35 (0.266).
tttit
p
i it Syriayyyy
11t0 Dδ
0.0452)(0.0000)(0.0017)(0.0004)(0.0001)(0.000)(
0.0090.540 y0.288 0.040 0.0420.009 15-t
1,954,93
ttt
Q
t
Q
tt SyriayyDDy
JORDAN
INTERNATIONAL MONETARY FUND 9
Appendix II. The Impact on Formal Labor Market Outcomes—
Empirical Model
1. We examine the impact of the Syria crisis on labor market outcomes by estimating dynamic
Okun’s-type regressions augmented to account for the Syria shock. We estimate these models
at both the national level and for the those governorates that host ninety percent of the refugees.
Specifically, and utilizing seasonally-adjusted quarterly data, we estimate the following model
for each of the three main labor market outcomes (LMO): the unemployment rate, the
employment-to-working age population ratio, and the labor force participation rate.
where LMO denotes a given labor market outcome (in percent); and gap denotes the output gap,
measured as the percent deviation of the log of real GDP from its HP trend. As in the previous section, we
model the Syria shock through the use of dummy variables. The lag-length of a given model is not
known a priori, but determined through sequential F-tests—a general-to-specific modeling approach.
2. Table A2.1 shows a summary of the regression results at the national level. The top block shows
results for unemployment. The first row denoted Syria 12-1 shows results for the model where the Syria
dummy variable takes the value of zero prior to 2012-Q1 and one otherwise. It reports the estimated
coefficient of the Syria dummy variable (λ), its t-statistic, and the associated p-value. It also reports the
p-values of a battery of diagnostic tests for model validity with no rejections of the null hypotheses,
underpinning the empirical validity of the model (see description in Appendix I). Table A2.1 shows that
the estimated coefficient of the Syria dummy variable is not significant. The remaining rows in the
unemployment block report results with alternative timing of potential spillovers materializing from the
Syria shock. That is, we experiment with models with Syria 12-2 (equal to zero before 2012-Q2, and one
otherwise); Syria 12-3 (equal to zero before 2012-Q3, and one otherwise); etc.. None of the Syria dummy
variables are significant, and once again the models are empirically valid. The middle and lower blocks of
Table A2.1 report results for labor force participation and employment to population ratios respectively.1
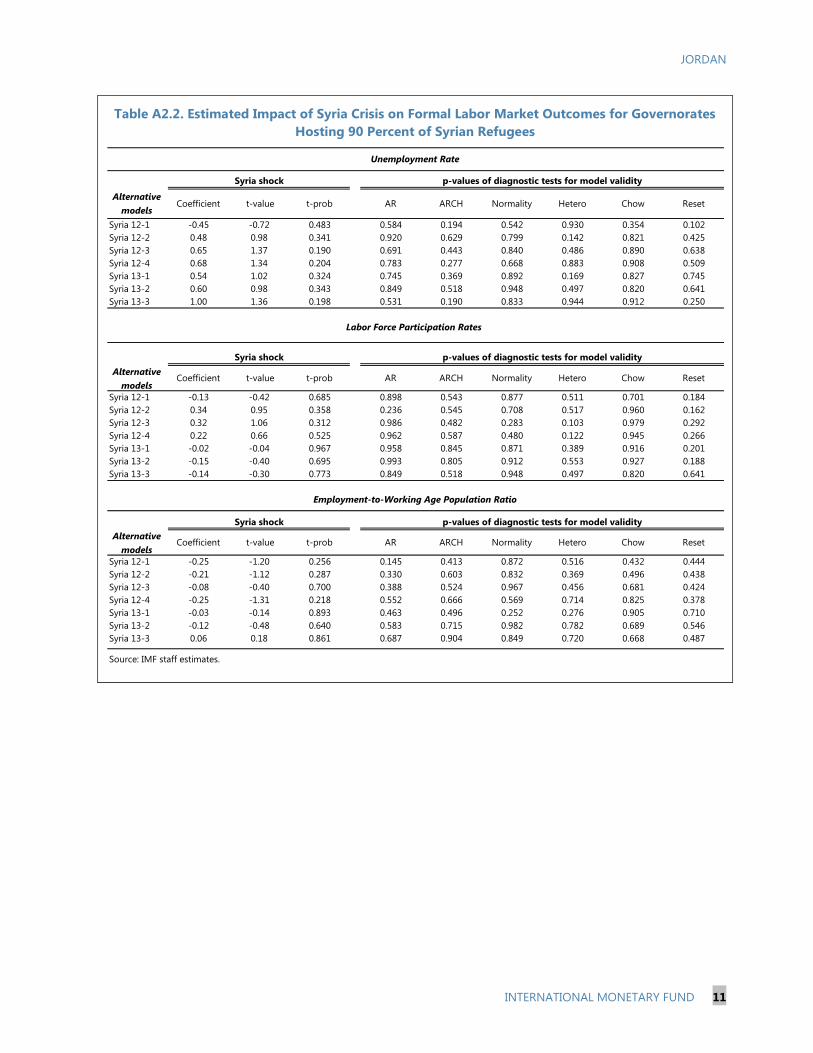
3. Table A2.2 repeats the same exercise for those governorates that host ninety percent of the
Syrian refugees. The evidence from Table A2.1 and Table A2.2 shows that for all the 42 regressions
estimated, the Syria conflict does not appear to have had a statistically significant impact on Jordan’s
formal labor market outcomes. And such inference is derived from models that are statistically valid.
1 Unit root tests suggest that the unemployment rate is stationary while labor force participation and the
employment to population ratio are I (1). As such, the first difference of the latter two is used in the empirical
specifications.
ttit
p
i iit
p
i it SyriagapLMOLMO 010

JORDAN
10 INTERNATIONAL MONETARY FUND
Table A2.1. Estimated Impact of Syria Crisis on Formal Labor Market Outcomes
at the National Level
Alternative
modelsCoefficient t-value t-prob AR ARCH Normality Hetero Chow Reset
Syria 12-1 -0.50 -1.15 0.274 0.474 0.883 0.988 0.890 0.223 0.490
Syria 12-2 0.01 0.02 0.985 0.150 0.276 0.440 0.948 0.516 0.454
Syria 12-3 0.46 1.22 0.242 0.378 0.925 0.763 0.150 0.954 0.229
Syria 12-4 0.59 1.59 0.133 0.652 0.781 0.951 0.422 0.989 0.171
Syria 13-1 0.32 0.72 0.488 0.289 0.318 0.264 0.913 0.924 0.254
Syria 13-2 0.50 1.02 0.329 0.272 0.256 0.969 0.957 0.957 0.402
Syria 13-3 0.93 1.57 0.143 0.364 0.178 0.586 0.965 0.999 0.544
Alternative
modelsCoefficient t-value t-prob AR ARCH Normality Hetero Chow Reset
Syria 12-1 -0.17 -0.55 0.593 0.774 0.466 0.341 0.685 0.824 0.319
Syria 12-2 0.02 0.08 0.938 0.843 0.849 0.194 0.220 0.925 0.356
Syria 12-3 0.13 0.44 0.669 0.975 0.979 0.131 0.226 0.964 0.459
Syria 12-4 -0.09 -0.29 0.778 0.865 0.688 0.389 0.427 0.958 0.308
Syria 13-1 -0.05 -0.16 0.878 0.834 0.765 0.276 0.412 0.955 0.334
Syria 13-2 0.00 -0.01 0.989 0.848 0.780 0.225 0.408 0.954 0.345
Syria 13-3 0.13 0.28 0.784 0.910 0.849 0.164 0.290 0.958 0.357
Alternative
modelsCoefficient t-value t-prob AR ARCH Normality Hetero Chow Reset
Syria 12-1 -0.19 -0.99 0.345 0.117 0.336 0.990 0.976 0.513 0.522
Syria 12-2 -0.22 -1.32 0.214 0.181 0.313 0.979 0.646 0.430 0.533
Syria 12-3 -0.12 -0.68 0.510 0.176 0.250 0.915 0.681 0.606 0.487
Syria 12-4 -0.26 -1.54 0.152 0.462 0.832 0.255 0.948 0.776 0.606
Syria 13-1 -0.06 -0.29 0.775 0.434 0.966 0.849 0.244 0.570 0.554
Syria 13-2 -0.01 -0.06 0.952 0.561 0.911 0.911 0.972 0.562 0.522
Syria 13-3 0.14 0.45 0.662 0.649 0.890 0.917 0.978 0.581 0.543
Source: IMF staff estimates.
Employment-to-Working Age Population Ratio
Syria shock p-values of diagnostic tests for model validity
Unemployment Rate
Labor Force Participation Rates
Syria shock p-values of diagnostic tests for model validity
Syria shock p-values of diagnostic tests for model validity
JORDAN
INTERNATIONAL MONETARY FUND 11
Table A2.2. Estimated Impact of Syria Crisis on Formal Labor Market Outcomes for Governorates
Hosting 90 Percent of Syrian Refugees
Alternative
modelsCoefficient t-value t-prob AR ARCH Normality Hetero Chow Reset
Syria 12-1 -0.45 -0.72 0.483 0.584 0.194 0.542 0.930 0.354 0.102
Syria 12-2 0.48 0.98 0.341 0.920 0.629 0.799 0.142 0.821 0.425
Syria 12-3 0.65 1.37 0.190 0.691 0.443 0.840 0.486 0.890 0.638
Syria 12-4 0.68 1.34 0.204 0.783 0.277 0.668 0.883 0.908 0.509
Syria 13-1 0.54 1.02 0.324 0.745 0.369 0.892 0.169 0.827 0.745
Syria 13-2 0.60 0.98 0.343 0.849 0.518 0.948 0.497 0.820 0.641
Syria 13-3 1.00 1.36 0.198 0.531 0.190 0.833 0.944 0.912 0.250
Alternative
modelsCoefficient t-value t-prob AR ARCH Normality Hetero Chow Reset
Syria 12-1 -0.13 -0.42 0.685 0.898 0.543 0.877 0.511 0.701 0.184
Syria 12-2 0.34 0.95 0.358 0.236 0.545 0.708 0.517 0.960 0.162
Syria 12-3 0.32 1.06 0.312 0.986 0.482 0.283 0.103 0.979 0.292
Syria 12-4 0.22 0.66 0.525 0.962 0.587 0.480 0.122 0.945 0.266
Syria 13-1 -0.02 -0.04 0.967 0.958 0.845 0.871 0.389 0.916 0.201
Syria 13-2 -0.15 -0.40 0.695 0.993 0.805 0.912 0.553 0.927 0.188
Syria 13-3 -0.14 -0.30 0.773 0.849 0.518 0.948 0.497 0.820 0.641
Alternative
modelsCoefficient t-value t-prob AR ARCH Normality Hetero Chow Reset
Syria 12-1 -0.25 -1.20 0.256 0.145 0.413 0.872 0.516 0.432 0.444
Syria 12-2 -0.21 -1.12 0.287 0.330 0.603 0.832 0.369 0.496 0.438
Syria 12-3 -0.08 -0.40 0.700 0.388 0.524 0.967 0.456 0.681 0.424
Syria 12-4 -0.25 -1.31 0.218 0.552 0.666 0.569 0.714 0.825 0.378
Syria 13-1 -0.03 -0.14 0.893 0.463 0.496 0.252 0.276 0.905 0.710
Syria 13-2 -0.12 -0.48 0.640 0.583 0.715 0.982 0.782 0.689 0.546
Syria 13-3 0.06 0.18 0.861 0.687 0.904 0.849 0.720 0.668 0.487
Source: IMF staff estimates.
Employment-to-Working Age Population Ratio
Syria shock p-values of diagnostic tests for model validity
Unemployment Rate
Syria shock p-values of diagnostic tests for model validity
Labor Force Participation Rates
Syria shock p-values of diagnostic tests for model validity
JORDAN
12 INTERNATIONAL MONETARY FUND
Appendix III. The Impact on Inflation—Empirical Model
Food prices
1. We estimate the following Autoregressive Distributed Lag model (ADL) utilizing seasonally-
adjusted monthly data:
where p is the log of the index of Jordanian food prices; p* is the log of the index of international food
prices; Syriat is a dummy variable that captures the Syria shock; and Dt is a vector including a constant
and a deterministic time trend—the latter to capture the combined effect of all potential variables
affecting domestic food prices other than international food prices and the Syria conflict.
2. Unit root tests indicate that both domestic and international food prices are non-stationary or
integrated of order one. Given that Jordan is a very open economy, we would expect domestic and
international food prices to co-move over time (or share a common stochastic trend). As such, we posit
the following co-integration relationship between the two sets of prices.
where the βs are interpreted as long-run coefficients. In fact, this model is the long-run solution of the
ADL model where
and .
3. Table A3.1 presents the estimation results of the ADL model and its long-run solution for a
battery of dummy variables each capturing a different potential starting time of Syria’s spillover effect.
For example, Syria 12-1 takes the value of zero before 2012-Q1, and one otherwise; Syria 12-2 takes the
value of zero before before 2012-Q2, and one otherwise, etc..
4. The Syria conflict appears not to have a statistically significant effect on the Jordanian food price
index—all dummy variables are not significant. Rather, international food prices appear to be the key
driver.
Rental prices
5. We empirically estimate an autoregressive process for rent inflation augmented to account
for the Syria shock. Statistically, the model captures the true data-generating process remarkably
well and the residuals are white noise. Spillover effects from Syria appear to materialize in the
second half of 2013 (Table A3.2).
ttit
p
i iit
p
i it Syriappp
01t0 Dδ
tttt Syriapp
21t0 Dη
p
i
i
p
i
i
1
01
1
p
i
i
1
2
1

JORDAN
INTERNATIONAL MONETARY FUND 13
Table A3.1. Estimated Impact of Syria Crisis on Food Prices
Table A3.2. Estimated Impact of Syria Crisis on Rents
Alternative
modelsλ t-value t-prob β2 t-value t-prob
Syria 12-1 -0.005 -0.621 0.538 -0.028 -0.610 0.544
Syria 12-2 -0.003 -0.393 0.696 -0.018 -0.390 0.698
Syria 12-3 -0.006 -0.773 0.443 -0.038 -0.740 0.462
Syria 12-4 -0.005 -0.681 0.499 -0.035 -0.655 0.515
Syria 13-1 -0.001 -0.124 0.902 -0.007 -0.123 0.902
Syria 13-2 -0.001 -0.148 0.883 -0.009 -0.147 0.884
Syria 13-3 0.003 0.220 0.827 0.018 0.222 0.826
Variable Coefficient t-value t-prob Coefficient t-value t-prob
pt-1 0.841 30.600 0.000 … … …
p*t 0.139 6.370 0.000 0.871 18.700 0.000
constant 0.094 2.150 0.036 0.587 2.700 0.009
AR ARCH Normality Hetero Chow Reset
0.898 0.938 0.155 0.437 0.245 0.118
Source: IMF staff estimates.
p-values of diagnostic tests for final model validity
ADL Long-run solution
Final model imposing no Syria impact
Long-run solutionADL
Variable Coefficient t-value t-prob
∆rt-3 0.352 2.960 0.007
Seasonal 0.015 5.570 0.000
Syria 13-June 0.024 3.360 0.003
AR ARCH Normality Hetero Chow Reset
0.590 0.274 0.602 0.183 0.841 0.815
Source: IMF staff estimates.
p-values of diagnostic tests for final model validity
Autoregression for ∆rt augmented with a Syria shock1
1/ ∆rt is the first difference of the rental price index. The data are bi-annual and seasonally not adjusted. As such, a
seasonal dummy variable is included. Aside from the third lag of the first difference, all lags are not significant. Syria 13-
June is a dummy variable that takes the value of zero prior to June 2013 and one otherwise.

JORDAN
14 INTERNATIONAL MONETARY FUND
A GENERATION IN WAITING—UNLOCKING THE
EMPLOYMENT POTENTIAL OF JORDAN’S
POPULATION1
This note documents Jordan’s labor market outcomes, quantifies the daunting employment challenge
ahead, and projects outcomes under alternative reform scenarios by drawing on the international
experience. Its results indicate that, by pursuing a wide range of reforms in labor and product markets,
Jordan can unlock the employment potential of its population.
1. Unemployment is a chronic
problem. It has been persistently high,
averaging 13.7 percent in the last decade
and registering 12.6 percent in 2013.
Unemployment in Jordan is largely a youth
phenomenon. Young people, ages 15 to 24,
account for almost half of the unemployed,
and the youth unemployment rate, at
31 percent, is among the highest in the
world. In contrast to most of the world,
unemployment rates in Jordan tend to be
highest among the educated, registering
17.8 percent among those with college
degrees, and for females, exceeding 25 percent (Figure 1).
2. Employment outcomes are poor (Figure 2). At 37.1 percent, the labor force participation
rate in Jordan is lower than the MENA average of 49.0 percent—and at 13.2 percent, the female
labor force participation is less than a quarter of the male participation. Such a low rate, together
with high unemployment, has resulted in a very low ratio of employment to working-age
population—only 32.4 percent of working-age people are actually employed, a rate that is lower
than the MENA average of 43.4 percent and falls way short of the world average of about
60 percent.
1 Prepared by Yasser Abdih and Rafik Selim.
0 5 10 15 20 25 30
Total
Illiterate
less than
Secondary
Secondary
Intermediate
Diploma
Bachelor &
Above
Female unemployment rate
Male unemployment rate
Male and Female unemployment rate
Figure 1. Unemployment by Gender and Educational Level, 2013 (In percent)
Sources: Jordanian authorities; and IMF staff estimates.

JORDAN
INTERNATIONAL MONETARY FUND 15
Figure 2. Labor Market Outcomes: Jordan and the World, 2013
(In percent)
Sources: For regional averages and Tunisia's youth labor market outcomes: International Labor Organization, Global Employment
Trends 2014. For individual countries, national authorities (Egypt, Central Agency for Public Mobilization and Statistics; Jordan,
Department of Statistics; Morroco, Haut-Commissariat Au Plan; Tunisia, Institut National de la Statistique).
Notes: DE & EU: Developed Economies & European Union; CSEE& CIS: Central & South-Eastern Europe (non-EU) &
Commonwealth of Independent States; EA: East Asia; SEAP: South-East Asia & the Pacific; SA: South Asia; LAC: Latin America &
the Caribbean; MENA: Middle East and North Africa; SSA: Sub-Saharan Africa. For Egypt, data are for 2012.
0
10
20
30
40
50
60
70
80
90Total Male Female
Labor Force Participation
0
10
20
30
40
50
60
70Youth total Youth male Youth female
Youth Labor Force Participation
0
10
20
30
40
50
60
70
80
90Total Male Female
Employment to Working Age Population Ratio
0
10
20
30
40
50
60Youth total Youth male Youth female
Youth Employment to Working Age Population Ratio
0
5
10
15
20
25
30Total Male Female
Unemployment Rate
0
10
20
30
40
50
60
Youth total
Youth male
Youth female
Youth Unemployment Rate
JORDAN
16 INTERNATIONAL MONETARY FUND
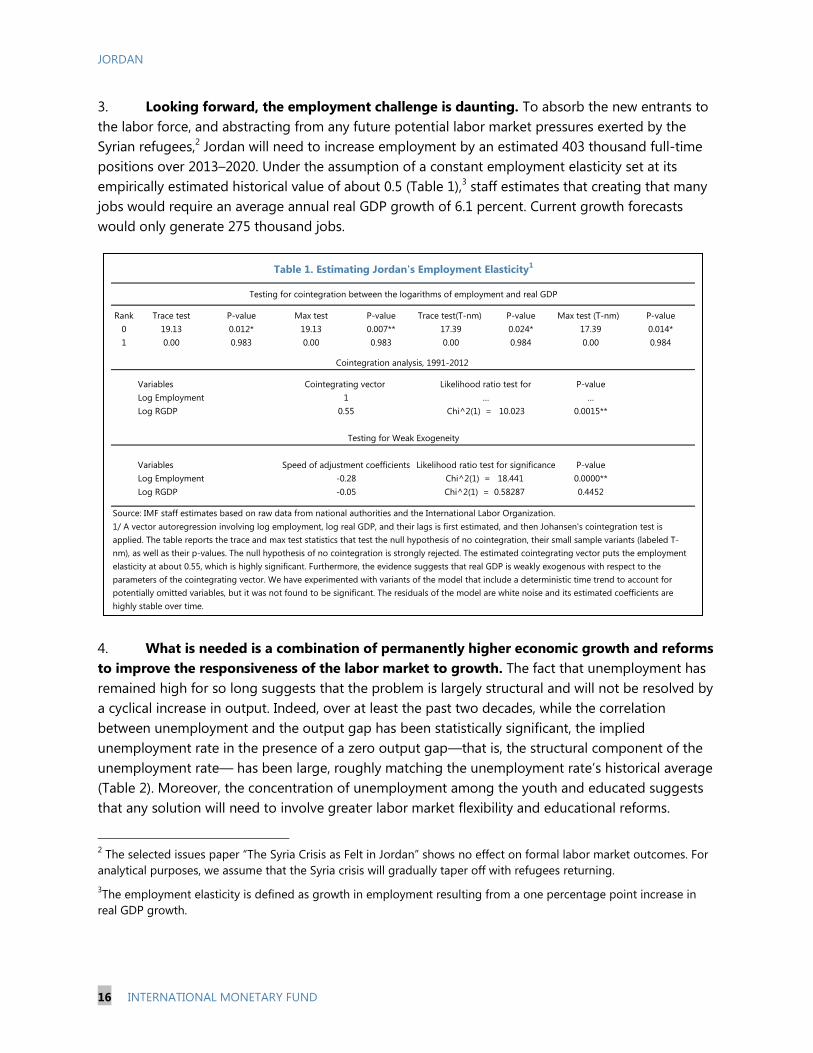
3. Looking forward, the employment challenge is daunting. To absorb the new entrants to
the labor force, and abstracting from any future potential labor market pressures exerted by the
Syrian refugees,2 Jordan will need to increase employment by an estimated 403 thousand full-time
positions over 2013–2020. Under the assumption of a constant employment elasticity set at its
empirically estimated historical value of about 0.5 (Table 1),3 staff estimates that creating that many
jobs would require an average annual real GDP growth of 6.1 percent. Current growth forecasts
would only generate 275 thousand jobs.
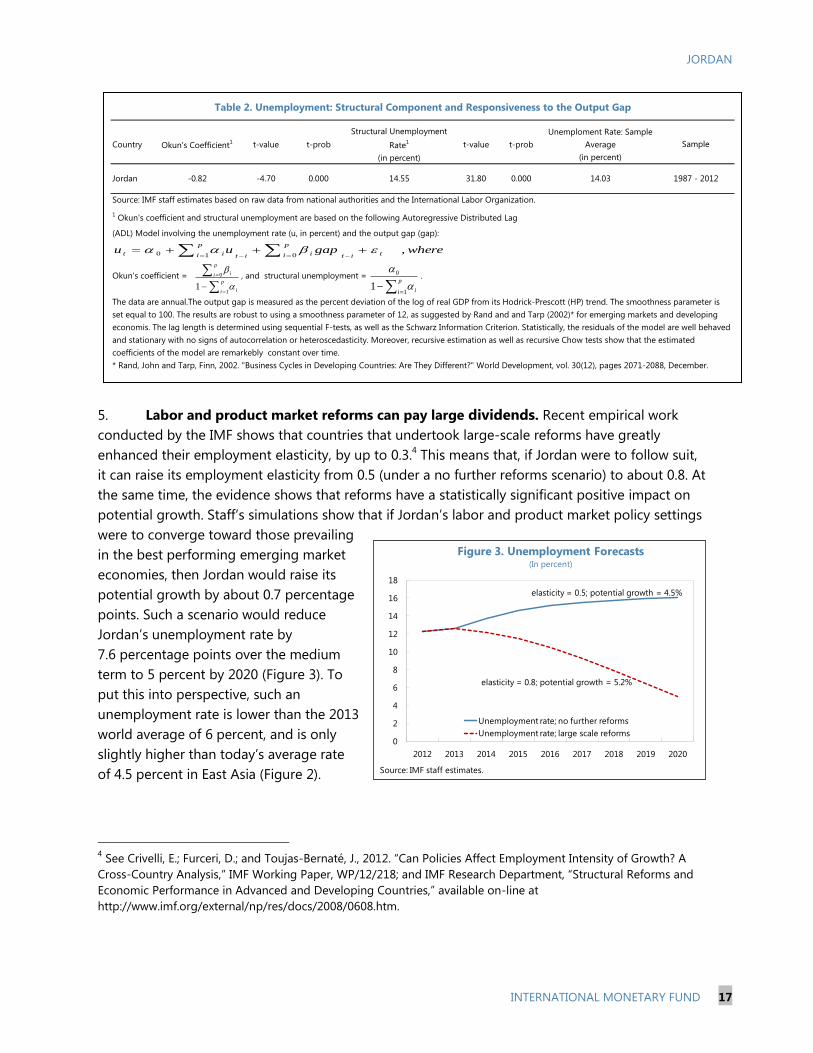
4. What is needed is a combination of permanently higher economic growth and reforms
to improve the responsiveness of the labor market to growth. The fact that unemployment has
remained high for so long suggests that the problem is largely structural and will not be resolved by
a cyclical increase in output. Indeed, over at least the past two decades, while the correlation
between unemployment and the output gap has been statistically significant, the implied
unemployment rate in the presence of a zero output gap—that is, the structural component of the
unemployment rate— has been large, roughly matching the unemployment rate’s historical average
(Table 2). Moreover, the concentration of unemployment among the youth and educated suggests
that any solution will need to involve greater labor market flexibility and educational reforms.
2 The selected issues paper “The Syria Crisis as Felt in Jordan” shows no effect on formal labor market outcomes. For
analytical purposes, we assume that the Syria crisis will gradually taper off with refugees returning.
3The employment elasticity is defined as growth in employment resulting from a one percentage point increase in
real GDP growth.
Rank Trace test P-value Max test P-value Trace test(T-nm) P-value Max test (T-nm) P-value
0 19.13 0.012* 19.13 0.007** 17.39 0.024* 17.39 0.014*
1 0.00 0.983 0.00 0.983 0.00 0.984 0.00 0.984
P-value
…
0.0015**
P-value
0.0000**
0.4452
1/ A vector autoregression involving log employment, log real GDP, and their lags is first estimated, and then Johansen's cointegration test is
applied. The table reports the trace and max test statistics that test the null hypothesis of no cointegration, their small sample variants (labeled T-
nm), as well as their p-values. The null hypothesis of no cointegration is strongly rejected. The estimated cointegrating vector puts the employment
elasticity at about 0.55, which is highly significant. Furthermore, the evidence suggests that real GDP is weakly exogenous with respect to the
parameters of the cointegrating vector. We have experimented with variants of the model that include a deterministic time trend to account for
potentially omitted variables, but it was not found to be significant. The residuals of the model are white noise and its estimated coefficients are
highly stable over time.
-0.28
-0.05
Log Employment
Log RGDP Chi^2(1) = 10.023
Log Employment
Log RGDP
Chi^2(1) = 18.441
Chi^2(1) = 0.58287
0.55
Likelihood ratio test for significance
Testing for Weak Exogeneity
Speed of adjustment coefficientsVariables
Source: IMF staff estimates based on raw data from national authorities and the International Labor Organization.
Testing for cointegration between the logarithms of employment and real GDP
Table 1. Estimating Jordan's Employment Elasticity1
Cointegration analysis, 1991-2012
Likelihood ratio test for
…
Variables Cointegrating vector
1
wheregapuu titpi iitpi it ,010
JORDAN
INTERNATIONAL MONETARY FUND 17
5. Labor and product market reforms can pay large dividends. Recent empirical work
conducted by the IMF shows that countries that undertook large-scale reforms have greatly
enhanced their employment elasticity, by up to 0.3.4 This means that, if Jordan were to follow suit,
it can raise its employment elasticity from 0.5 (under a no further reforms scenario) to about 0.8. At
the same time, the evidence shows that reforms have a statistically significant positive impact on
potential growth. Staff’s simulations show that if Jordan’s labor and product market policy settings
were to converge toward those prevailing
in the best performing emerging market
economies, then Jordan would raise its
potential growth by about 0.7 percentage
points. Such a scenario would reduce
Jordan’s unemployment rate by
7.6 percentage points over the medium
term to 5 percent by 2020 (Figure 3). To
put this into perspective, such an
unemployment rate is lower than the 2013
world average of 6 percent, and is only
slightly higher than today’s average rate
of 4.5 percent in East Asia (Figure 2).
4 See Crivelli, E.; Furceri, D.; and Toujas-Bernaté, J., 2012. “Can Policies Affect Employment Intensity of Growth? A
Cross-Country Analysis,” IMF Working Paper, WP/12/218; and IMF Research Department, “Structural Reforms and
Economic Performance in Advanced and Developing Countries,” available on-line at
http://www.imf.org/external/np/res/docs/2008/0608.htm.
0
2
4
6
8
10
12
14
16
18
2012 2013 2014 2015 2016 2017 2018 2019 2020
Unemployment rate; no further reforms
Unemployment rate; large scale reforms
Figure 3. Unemployment Forecasts(In percent)
Source: IMF staff estimates.
elasticity = 0.5; potential growth = 4.5%
elasticity = 0.8; potential growth = 5.2%
Country Okun's Coefficient1 t-value t-prob
Structural Unemployment
Rate1
(in percent)
t-value t-prob
Unemploment Rate: Sample
Average
(in percent)
Jordan -0.82 -4.70 0.000 14.55 31.80 0.000 14.03
Source: IMF staff estimates based on raw data from national authorities and the International Labor Organization.
1 Okun's coefficient and structural unemployment are based on the following Autoregressive Distributed Lag
(ADL) Model involving the unemployment rate (u, in percent) and the output gap (gap):
Okun's coefficient = , and structural unemployment = .
Table 2. Unemployment: Structural Component and Responsiveness to the Output Gap
The data are annual.The output gap is measured as the percent deviation of the log of real GDP from its Hodrick-Prescott (HP) trend. The smoothness parameter is
set equal to 100. The results are robust to using a smoothness parameter of 12, as suggested by Rand and and Tarp (2002)* for emerging markets and developing
economis. The lag length is determined using sequential F-tests, as well as the Schwarz Information Criterion. Statistically, the residuals of the model are well behaved
and stationary with no signs of autocorrelation or heteroscedasticity. Moreover, recursive estimation as well as recursive Chow tests show that the estimated
coefficients of the model are remarkebly constant over time.
* Rand, John and Tarp, Finn, 2002. "Business Cycles in Developing Countries: Are They Different?" World Development, vol. 30(12), pages 2071-2088, December.
Sample
1987 - 2012
p
i i
p
i i
1
0
1
p
i i1
0
1
wheregapuu tit
p
i iit
p
i it ,010

JORDAN
18 INTERNATIONAL MONETARY FUND
6. To reap those dividends, Jordan will need to:
Address skills mismatches through
educational reform and training
programs. While Jordan has made
important strides in providing
education to its population,
entrepreneurs regularly cite the lack of
suitable skills among job applicants as
an important constraint to hiring
(Figure 4), and unemployment rates are
highest among the most educated. This
suggests that the education system is
failing to produce graduates with
marketable job skills. Thus, it will need
to focus more on quality, realigning
curriculums with private-sector needs.
At the same time, to put the currently
unemployed into jobs, policymakers
can scale up and replicate promising training programs, such as the Job Compact, and those
run by the Education for Employment Foundation and Injaz in partnership with the private
sector. These policies will increase the supply of skilled labor, and hence, for a given change
in GDP growth, skilled employment will increase; to the extent that skilled and unskilled
workers are complements, employment of unskilled workers will also be boosted. As a result,
such policies would contribute positively to the employment elasticity. They would also
result in the augmentation of Jordan’s stock of human capital, thereby raising potential
growth.
Improve the business climate and the quality of institutions. Jordan ranks poorly relative
to elsewhere on key areas such as investor protection, contract enforcement, access to
credit, and high costs of business start-ups (Figure 5). As documented by a large body of
empirical work, reversing such outcomes would foster investment and competition, thereby
boosting output growth and labor demand. At the same time, the empirical evidence also
shows that improving the business environment and institutional quality would help move
workers out of the informal sector—where they have little protection, usually earn low
wages, and engage in low-growth-generating activities—and into the formal sector.5
5 See Abdih, Yasser, “MENA Oil Importers: Addressing Informality and Promoting Inclusion,” in Regional Economic
Outlook, Middle East and Central Asia; International Monetary Fund, October 2011. See also Abdih and Medina
(2013), “Measuring the Informal Economy in the Caucasus and Central Asia,” IMF Working Paper WP/13/137.
Figure 4. Firms Identifying Labor Skill as a Major Constraint
(Latest available data)
Source: World Bank, Enterprise Survey.
Note: JOR: Jordan; EGY: Egypt; MAR: Morocco; MENA: Middle East and
North Africa; LAC: Latin America and Caribbean; DEA: Developing and
Emerging Asia; CCA: Caucasus and Central Asia; SSA: Sub Saharan Africa;
EUAR: European Union and Euro Area; AE: Advanced Economies; EMDC:
Emerging Markets and Developing Countries.
0
10
20
30
40
50
60
JOR EGY MAR MENA LAC DEA CCA SSA EUAR AE EMDCWorld
Firms Identifying an Inadequately Educated
Workforce as a Major Constraint (In percent)

JORDAN
INTERNATIONAL MONETARY FUND 19
Figure 5. World Bank Doing Business Indicators: Overall Ranks, 2014 1/
(Out of 189 countries; lower rank means better outcome)
Source: World Bank, Doing Business Database.
1/ The World Bank Doing Business indicators should be interpreted with caution due to a limited number of respondents, a
limited geographical coverage, and standardized assumptions on business constraints and information availability.
0
20
40
60
80
100
120
140
160
Ease Of Doing Business
0
20
40
60
80
100
120
140
Starting A Business
0
20
40
60
80
100
120
140
160
Dealing With Construction Permits
0
20
40
60
80
100
120
140
160
180
Registering Property
0
20
40
60
80
100
120
140
160
180
Getting Credit
0
20
40
60
80
100
120
140
160
180
Protecting Investors
0
20
40
60
80
100
120
140
160
180
Enforcing Contracts
0
20
40
60
80
100
120
140
160
Resolving Insolvency

JORDAN
20 INTERNATIONAL MONETARY FUND
Reform public sector hiring practices and compensation policies. The public sector has
been an extraordinarily important source of Jordanian employment—over the past fifteen
years, public sector employment shares have ranged from 35 percent to almost 40 percent.
Its role has distorted labor market incentives and diverted resources away from a potentially
more dynamic private sector. Government hiring practices have typically placed a premium
on diplomas over actual skills, influencing educational outcomes and contributing to skill
mismatches. At the same time, the comparatively greater job security, higher average wages,
and more generous non-wage benefits offered by the public sector have inflated wage
expectations among new entrants. In fact, the average public sector wage is 122 percent of
the average monthly private sector wage. Except for specialists and managerial level jobs,
the public sector pays more than the private sector across all job ladders (see Jordan’s
National Employment Strategy 2011–2020). New entrants’ capacity to withstand long
periods of unemployment—in anticipation of securing more lucrative opportunities in the
public sector—is buoyed by familial support and remittances from abroad.
Public sector hiring procedures will need to place greater emphasis on skills and competition
and less on paper qualifications. Moreover, strengthening the link between compensation
and performance and implementing merit-based promotion policies would send the right
signals regarding skill formation for young people.
Reach out to the diaspora. There is a large number of Jordanians working abroad,
particularly in the Gulf Cooperation Council. In many cases, these expatriates have not only
advanced degrees, but also years of experience in competitive environments. Calling on the
skilled diaspora and reversing “brain drain” would increase the supply of skilled labor and
thereby help the domestic economy grow and compete globally. Returning members of the
diaspora would bring with them their skills, capital, marketing-know how, and innovative
ideas. They could open businesses and factories and hire from the pool of the unemployed.
Improvements in the business environment, better governance, and better enforcement of
intellectual and property rights would help bring back overseas talent. The successful
experiences of India and Taiwan in luring back the skilled diaspora suggest that such reforms
may need to be complemented with specific policy support.6
Improve female’s labor market outcomes. Not only are such outcomes worse than those
for Jordanian males, but they are also worse than the average female outcomes in MENA,
which, in turn, fare the worst worldwide (see Figure 2). Jordan’s National Employment
Strategy suggests that various factors are at play, including employer’s perceptions; limited
access to information on job opportunities; the lack of targeted active labor market policies
for females; the lack of maternity benefits in the private sector; and the absence of
affordable and dependable childcare. Addressing such constraints can go a long way to
unlocking the employment potential of Jordanian women.
6 See, for example, Noland, Marcus and Howard Pack, 2007, The Arab Economies in a Changing World (Washington:
Peterson Institute for International Economics).
JORDAN
INTERNATIONAL MONETARY FUND 21
ELECTRICITY TARIFF INCREASES—IMPACT ON
COMPETITIVENESS AND OPTIONS FOR REFORM1
This note finds that recent and planned electricity tariff increases are likely not to have a major impact
on Jordan’s competitiveness. Business perceptions and cross-country data suggest that the reliability of
electricity supply is a major comparative advantage for Jordan with respect to peer countries. Also, the
low share of electricity in producer price indices and firms’ cost structure indicates that the impact of
tariff increases on business profitability and costs is limited. The note also suggests options for tariff
adjustments, which would reduce distortions while protecting the poor and the lower middle class.
A. Background and Motivation
1. Substantial tariff increases are needed to return the electricity company to cost
recovery. As flows of cheap gas from Egypt were disrupted, the more expensive fuel alternatives
raised the losses of Jordan’s electricity transmission company NEPCO. Though cheaper sources of
energy are expected to come on stream starting in 2015, tariff increases are needed to return
NEPCO to cost recovery.
2. Tariff increases so far have focused on selected sectors. The first round of increases
(some by more than 100 percent) was implemented in June 2012 for mining, refining, and services.
Tariffs were increased again (by 7.5–15 percent) in August 2013 for most non-household
consumers and once more in January 2014 covering as well rich households and small industries (by
5–15 percent). Going forward, similar tariff increases have been set for each year during 2015–17.2
3. The profitability of some sectors
might suffer. Because most households are
exempt, the brunt of the adjustment falls on
the industrial and service sectors. For some
sectors – such as banking, telecom and large
industries – tariffs will more than triple
between 2012 and 2017.
4. This note looks into the impact of
tariff reforms on Jordan’s
competitiveness and sketches options for
further reform. It starts by analyzing
business perceptions and cross-country data.
1 Prepared by Andrea Gamba in consultation with the World Bank.
2 Agriculture and small households will continue to be exempt.
0
50
100
150
200
250
300
350Up to 2012 Now 2017 NEPCO 2013 cost recovery tariff
Figure 1. Nominal Average Electricity Tariff by Consumer Type(In Jordanian fils)
Sources: Electricity Regulatory Commission; and IMF staff estimates.
JORDAN
22 INTERNATIONAL MONETARY FUND
The note then reviews the impact of tariff increases on industries and services. Finally, it takes a look
at ongoing tariff reforms and suggests ways to minimize distortions.
B. Electricity and Competitiveness
Reliable Supply as a Comparative Advantage
5. A reliable public electricity supply provides a competitive edge to Jordanian firms.
Indeed, Jordan’s electricity infrastructure fares
well in a number of key indicators. The number
of outages, their length and their impact on
operating revenue are the lowest in the MENA
region and compare well with other emerging
market economies.
6. This finding is reinforced by
businesses’ own perceptions. Though market
operators perceive electricity as a constraint to
their business, this is well below the MENA
average. Indeed, electricity appears to be a
second-tier concern in business surveys
(nonetheless, it is considered a significant impediment by over a fifth of firms).3
3 The World Bank Doing Business indicators should be interpreted with caution due to a limited number of
respondents, a limited geographical coverage, and standardized assumptions on business constraints and
information availability.
0
10
20
30
40
50
60
70
80
0
2
4
6
8
10
12
MENA EGY
(2008)
IRQ
(2011)
JOR
(2006)
LBN
(2009)
MAR
(2007)
ZAR
(2007)
WBG
(2013)
Average losses due to outages
Electricity as a major constraint (In percent of firms saying yes) (RHS)
Figure 3. Electricity as Impediment to Business, Selected
Countries(In percent of annual sales, unless otherwise noted)
Source: Enterprise Surveys (http://www.enterprisesurveys.org), The World Bank.
0
2
4
6
8
10
12
14
16
18
20
MENA EGY
(2008)
IRQ
(2011)
JOR
(2006)
LBN
(2009)
MAR
(2007)
ZAR
(2007)
WBG
(2013)
Electrical outages in a typical month
(number)
Duration of a typical electrical outage
Figure 2. Electrical Outages, Selected Countries(In hours, unless otherwise noted)
Source: Enterprise Surveys (http://www.enterprisesurveys.org), The World Bank.
33.941.941
21.9
0
10
20
30
40
50
60
Figure 4. Perceived Constraints to Business(In percent of positive firm responses)
Source: Enterprise Surveys (http://www.enterprisesurveys.org), The World Bank.

JORDAN
INTERNATIONAL MONETARY FUND 23
7. The costs of paying cost-recovery tariffs are significantly lower than those of going
off-grid. While some productive sectors (especially mining and non-retail services) face relatively
high electricity tariffs, they do not have to buy expensive generators and fuel to self-generate
electricity in the case of supply interruptions from the main grid. In contrast, many industries in the
Arab world and in emerging markets enjoy relatively lower public tariffs, but are forced to buy and
run their own generators. A back-of-the envelop calculation indicates that, in general, businesses are
better off paying a higher tariff for reliable service rather than resorting to self-generation because
the fixed costs are large and, as generators use diesel, the fuel costs of operating them is
significantly higher than NEPCO’s average fuel costs.
8. Tariff increases are also likely a better solution than black-outs. Scheduled and rolling
black-outs have been discussed as an option to contain NEPCO’s losses if there are shortfalls in gas
from Egypt. A better policy response would though be to apply temporary tariff surcharges. This is
because raising tariffs would only
temporarily (and marginally) reduce
business margins, while black-outs would
push business into making costly
investment in self-generation. That said,
large energy-intensive companies may
decide to switch off-grid, because their
energy needs might justify the construction
of an “in-house” turbine. Jordan’s potash
company is going that route, but it is
unlikely that other industries will follow,
given the large fixed costs and the high
energy-intensity of the potash industry.
Price Levels Effects of Tariff Reforms
9. Tariff increases have had a minor impact on inflation. Export-oriented sectors could
suffer from an increase in inflation, because sustained price increases could drive an appreciation
of the real exchange rate and favor foreign goods over Jordanian tradables. However, the weight of
energy is only about 6 percent in both the consumer and producer price baskets, and other
energy-related goods—such as fossil fuels— are included in the weights.4 Moreover, a vector
autoregressive model5 of inflation shows a small short-run impact from tariff increases and no
4 Assuming that half of the energy weight is indeed electricity most likely overestimates the share of electricity.
5 The model estimates inflation as a function of the lagged price level and the nominal effective exchange rate over
2002–13. These variables are usually found to be good predictors of inflation and are available monthly. A time trend
is added to take into account the evolution of unobserved variables. The effect of electricity tariffs on the
endogenous variables is modeled by adding the average effective electricity tariff variable over time.
0
20
40
60
80
100
120
0
10
20
30
40
50
60
MENA EGY
(2008)
IRQ
(2011)
JOR
(2006)
LBN
(2009)
MAR
(2007)
ZAR
(2007)
WBG
(2013)
Proportion of electricity from a generator
If a generator is used, average proportion of electricity from a generator
Firms owning or sharing a generator (In percent of total firms)
Figure 5. Self-generation, Selected Countries(In percent, unless otherwise noted)
Source: Enterprise Surveys (http://www.enterprisesurveys.org), The World Bank.

JORDAN
24 INTERNATIONAL MONETARY FUND
0 2 4 6 8
World
MENA
All Jordan
Manufacturing
Services
Small (5-19)
Medium (20-99)
Large (100+)
Direct exports are 10% or more of sales
Non-exporter
Domestic
10% or more foreign ownership
Figure 7. Losses if Electrical Outages Occur(In percent of sales)
Source: Enterprise Surveys (http://www.enterprisesurveys.org), The World Bank.
10 20 30
All Jordan
Manufacturing
Services
Small (5-19)
Medium (20-99)
Large (100+)
Direct exports are 10% or more of sales
Non-exporter
Domestic
10% or more foreign ownership
Figure 6. Firms stating Electricity Major Constraint(Percent of total firms)
Source: Enterprise Surveys (http://www.enterprisesurveys.org), The World Bank.
second-order impact. Both approaches suggest that the consumer price response to a 15 percent
increase in the effective tariff6 would be just below 0.5 percent.
Sector Analysis
10. The World Bank business surveys show that shortcomings in electricity infrastructure
vary across the economy. Small firms see electricity as a major constraint to business in almost one
third of the interviews, significantly more than medium or large firms. Interestingly, exporting firms
declare to be less affected by electricity issues than non-exporting ones. Losses deriving from
electrical outages are generally small as a share of revenue in all sectors, again with small and non-
exporting firms marginally more affected than others.
11. Electricity constitutes a relatively small
share of Jordanian firms’ operating costs.
Among major industries, electricity costs are more
than 5 percent of operating costs only for mining
and refining companies.7 Most industries and
services are not very energy-intensive, with
electricity representing less than 2 percent of
operating costs.
6 This is constructed by weighting the end-use tariff paid by each segment by the segment’s electricity consumption.
7 Given Jordan’s water scarcity and infrastructure challenges, water supply is also very energy-intensive, but end-user
prices are administered.
-2
0
2
4
6
8
10
12
14
16
18
20
-5 0 5 10 15
Lab
or
inte
nsi
ty
Electricty as % of operating costs
Refined petroleum
products
Food products and
beverages
Chemicals and products
Mining and quarrying
Other non - metallic
mineral
Electricity, gas, steam and
hot water supply
Tobacco products
Apparel
Other
Figure 8. Cost Structure and Value Added of Industries(Buble size indicates value added)

JORDAN
INTERNATIONAL MONETARY FUND 25
12. Removing electricity subsidies will eliminate distortions against labor-intensive
industries. Cross-country studies8 find that energy subsidies usually drive resources away from
labor-intensive industries and favor energy- and capital-intensive ones. This may well be true for
Jordan, and tariff increases—coupled with the removal of fuel subsidies in 2012—will likely create
more of a level playing field.
C. Outstanding Reform Issues
Tariff Structure
13. Large tariff variations across sectors create distortions. The top electricity tariff is more
than six times higher than the bottom one. By 2017, it will be over ten times higher (Box 1). Rather
than making each business sector pay a different input cost, the authorities should seek to create a
level-playing field by setting uniform tariffs across sectors and pursue any industrial policy through
more transparent and effective means.
14. The structure of planned household tariff increases could be improved. For example,
the World Bank (2011) shows that a staggered tariff structure benefits all consumers without
discrimination, but at high fiscal costs.9 Also, only a fraction of households effectively curbs their
energy consumption because of poverty. Since the household tariff structure is based on marginal
tariff brackets, a well-off Jordanian’s household consuming, say 750kWh per month, will pay the
same price as the poorest household for the first 160kWh consumed (see Table below).
15. Better targeting household subsidies could yield substantial savings. This could be
achieved by targeting the subsidy to those who consume, say, a maximum of 300 kWh per month10
while consumers whose total consumption is above this threshold would pay at or above cost
recovery. Such a scheme would protect the poor and the most vulnerable while generating
significant savings. Importantly, the subsidy could be easily administered and would be relatively
broad (over 42 percent of the population would be covered).
8 See International Monetary Fund, 2013, Regional Economic Outlook: Middle East and Central Asia, (Washington,
November); and International Monetary Fund, 2014, Subsidy Reform in the Middle East and North Africa: Recent
Progress and Challenges Ahead.
9 World Bank, 2011, “Electricity Subsidies and Household Welfare in Jordan: Can households afford to pay for the
budget crisis?” Background paper for the Jordan Poverty Reduction Strategy.
10 This is equivalent to the first two brackets of the current structure, and close to the average consumption of
Jordanian households (328kWh/month, according to the Electricity Regulatory Commission).
JORDAN
26 INTERNATIONAL MONETARY FUND
Box 1. Electricity Tariff Structure
Electricity tariffs vary substantially according to consumer category. Household
consumers are divided in seven different brackets depending on their consumption levels. The
non-household sector is split in thirteen sectors, each with a different price. Some sectors are
subject to differential tariffs according to their consumption level. Most sectors face a different
tariff for day and night consumption.
Households, small industries, and agriculture have the lowest tariffs. For instance, the
average tariff for small household consumers is half of that of the average household tariff and
20 percent of the top tariff. Average tariffs are above cost recovery for a variety of consumers,
including large industries and selected services (such as banking, telecom, and hotels).
16. Direct cash transfers would be an even better option. The recent elimination of fuel
subsidies, which were replaced with cash transfers, provides a good example.
Other Inefficiencies
17. NEPCO is technically well run, but there are efficiency losses in the distribution
companies. According to the World Bank, transmission losses are in line with international
standards. The distribution companies are privately-owned and in general lag behind international
best practices; distribution losses are high because of underinvestment and poor payment
enforcement.
Consumption brackets
2010 (kWh/month)
Class of consumption
(JD)
Mean
consumption
(JD)
No of Households
(HH) % of HH
1-160 0-5.28 4.5 22,018 2
161-300 5.29-15.36 11 453,408 40.2
301-500 15.37-32.56 21.8 508,827 45.1
501-750 32.57-61.06 41.8 122,351 10.8
751-1000 61.07-94.81 73.2 17,605 1.6
1000 ˂ ˃ 94.81 128 4,308 0.4
Total 20.5 1,128,517 100
Table 1. Tariff Structure and Household Consumption of Electricity
Sources: Household Income and Expenditure Survey 2010 and NEPCO

JORDAN
INTERNATIONAL MONETARY FUND 27
D. Conclusion and Policy Recommendations
18. The impact of tariff reform on Jordan’s competitiveness appears limited. Reliable
electricity supply is one of Jordan’s comparative advantages relative to its neighbors, which—despite
higher tariffs—is cheaper than firms having to resort to self-generation. Also, profit margin
compression will be likely be negligible and not warrant any significant pass-through of tariff
increases to producer (and consumer) prices.
19. Policy action could focus on:
Discontinuing industrial policy through utility pricing policies. Ongoing reforms provide
an opportunity to create a more level-playing field by using the same tariffs for each sector.
Improving the household tariff structure. Currently, almost all households are subsidized.
Streamlining tariff brackets would yield savings while better targeting those who are in need.
An even better option would be to replace the electricity subsidies with cash transfers.