immigrant population hits record 42.1 million in second ... · immigrant population hits record...
TRANSCRIPT
11629 K Street, NW, Suite 600, Washington, DC 20006 • Phone 202.466.8185 • Fax 202.466.8076 • www.cis.org
C I S
CIS Letterhead_Layout 1 7/26/12 4:34 PM Page 1
August 2015
A new analysis of monthly Census Bureau data by the Center for Immigration Studies shows that the na-tion’s immigrant population (legal and illegal) hit a record high of 42.1 million in the second quarter of this year — an increase of 1.7 million since the same quarter of 2014. Growth in the immigrant popula-
tion in the last year was led by a 740,000 increase in the number of Mexican immigrants. After falling or growing little in recent years, the number of Mexican immigrants again seems to be growing significantly. The monthly Census Bureau data, referred to as the Current Population Survey (CPS), is released before other data. As more information becomes available, it should confirm the findings from the CPS.1
Among the findings:
• The nation’s immigrant (foreign-born) population, which includes legal and illegal immigrants, grew by 4.1 million from the second quarter of 2011 to the second quarter of 2015 — 1.7 million in just the last year.
• Immigrants are 13.3 percent of the nation’s total population — the largest share in 105 years.
• Growth in the last year was led by a rebound in the number of Mexican immigrants, which increased by 740,000 from 2014 to 2015 — accounting for 44 percent of the increase in the total immigrant population in the last year.
• The total Mexican immigrant population (legal and illegal) reached 12.1 million in the second quarter of 2015 — the highest quarterly total ever.
• Prior research has indicated that net migration (the number coming vs. leaving) from Mexico had fallen to zero; the recent growth indicates that the period of zero net migration has ended.
• In addition to Mexico, growth in the immigrant population was led by a 449,000 increase in the last year from countries in Latin America other than Mexico.
• The Department of Homeland Security and other researchers have estimated that eight in 10 illegal im-migrants are from Mexico and Latin America, so the increase in immigrants from these countries is an indication that illegal immigration has begun growing again.
• The number of immigrants in the United States is now enormous, but it must be recognized that most immigrants, including those from Latin America, are in the country legally. Absent a change in legal im-migration policy, the immigrant population will continue to increase.
Immigrant Population Hits Record 42.1 Million in Second Quarter of 2015Growth driven in last year by surge from Mexico
By Steven A. Camarota and Karen Zeigler
Steven A. Camarota is the director of research and Karen Zeigler is a demographer at the Center for Immigration Studies.
1629 K Street, NW, Suite 600 • Washington, DC 20006 • (202) 466-8185 • [email protected] • www.cis.org

2
Center for Immigration Studies
Table 1. Total and Mexican Immigrant Populations with Confidence Intervals
Q2 2000Q2 2001Q2 2002Q2 2003Q2 2004Q2 2005Q2 2006Q2 2007Q2 2008Q2 2009Q2 2010Q2 2011Q2 2012Q2 2013Q2 2014Q2 2015
Number
30,181 31,504 32,379 33,896 34,231 34,922 35,906 37,498 37,624 37,037 37,730 37,963 39,130 39,344 40,416 42,090
Number
8,276 8,744 9,437
10,066 10,375 10,704 10,988 11,702 11,781 11,624 11,566 11,126 11,230 11,207 11,388 12,128
Confidence Interval
± 389 ± 294 ± 298 ± 303 ± 305 ± 422 ± 426 ± 433 ± 434 ± 431 ± 434 ± 435 ± 440 ± 441 ± 445 ± 452
Confidence Interval
± 193 ± 171 ± 170 ± 169 ± 203 ± 202 ± 202 ± 203 ± 203 ± 203 ± 203 ± 202 ± 203 ± 203 ± 203 ± 203
Source: Current Population Survey public-use files from the sec-ond quarter of each year. Based on a 90 percent confidence interval.
All Immigrants Mexican Immigrants
Figure 1. Growth in the Immigrant Population Has Accelerated (millions)
Source: Current Population Survey public-use files from the second quarter of each year.
30.231.5
32.433.9 34.2 34.9
35.937.5 37.6 37.0 37.7 38.0
39.1 39.340.4
42.1
2000
40
35
30
25
20
152001 2002 2003 2004 2005 2006 2007 2008 2009 2010 2011 2012 2013 2014 2015
OverviewGiven the significant cutbacks in enforcement in recent years, the permissive nature of the legal immigration sys-tem, and improvements in the economy, it is not surprising that the immigrant (legal and illegal) population has surged in the last four years. The immigrant population, referred to as the foreign-born by the Census Bureau, consists of those residing in the United States who were not American citi-zens at birth; it includes those in the country illegally.2 We use the terms immigrant and foreign-born synonymously in this report.
After growing little from 2007 to 2011, the nation’s immi-grant population has grown by 4.1 million from 2011 to 2015. This is roughly equal to the pace of growth from 2000 to 2007. The 1.7 million growth in the immigrant popula-tion (legal and illegal) from 2014 to 2015 is one of the larg-est single-year increases from the same quarter of the prior year since 2000. Both the growth from 2011 to 2015 and the increase in the last year are statistically significant (see Table 1 and Figure 1).
3
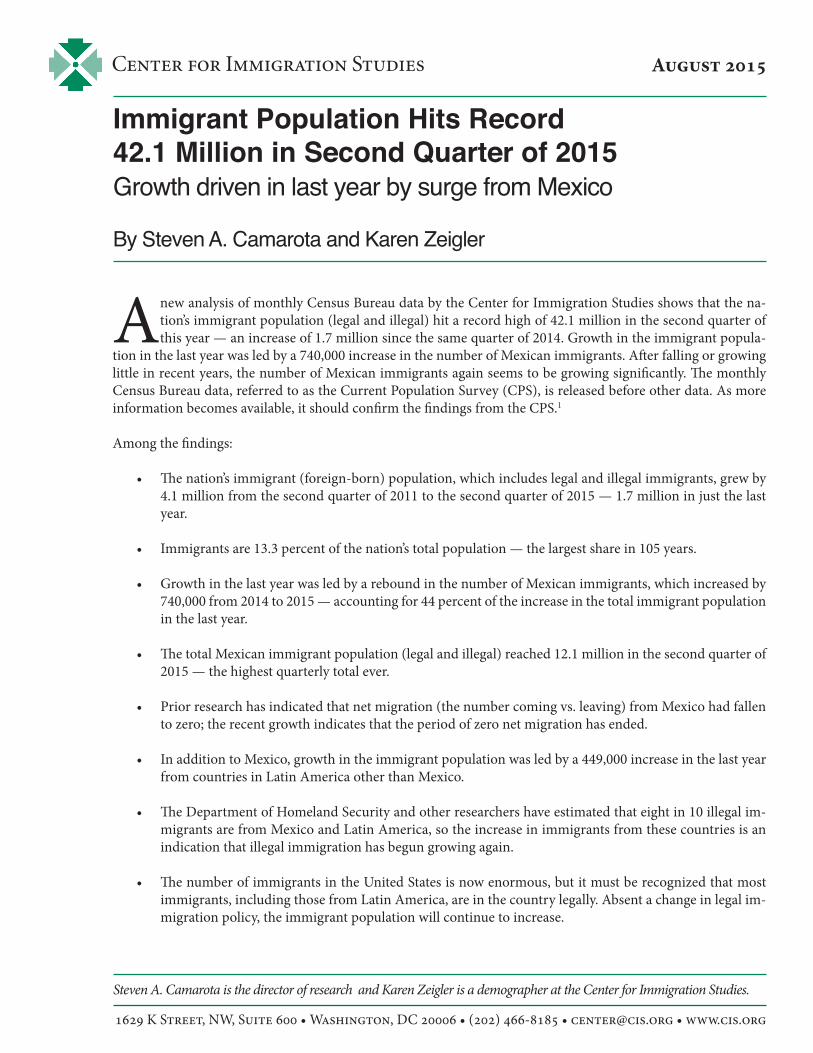
For the immigrant population to increase by one million means that significantly more than one mil-lion new immigrants must enter the country because some immigrants already here return to their home-land each year and natural mortality totals 250,000 annually.3 The number of deaths changes little from year to year and births in the United States cannot add to the immigrant population because all those born to immigrants are by definition not foreign-born and are automatically given American citizen-ship. Thus, a change in migration patterns with more immigrants coming or fewer leaving is the only way that the foreign-born population can grow.4
Figure 2 shows the number of immigrants who ar-rived in the three years prior to each year. So the fig-ure reads as follows: In the second quarter of 2015, there were 4.2 million immigrants who indicated they first came to the country in 2012 or later. Fig-ure 2 reports arrivals only for odd-numbered years because of the way the Census Bureau groups indi-vidual years of arrival in the public-use data of the CPS. This is done to preserve the anonymity of re-spondents. In the even-numbered years the grouping is for two-year cohorts.
By looking only at odd-numbered years, Figure 2 compares arrival cohorts of equal length — three years plus the first few months of the calendar year of the survey. So, for example, the 4.2 million new arrivals in 2015 is a good deal more than the 3.1 mil-lion who arrived in the three years prior to 2013. The number of recent arrivals in 2015 is very similar to the number of new arrivals in 2005 and 2007, but less than the number arriving in the three years prior to 2003.5 In addition to the significant growth in the for-eign-born population shown in Figure 1, the increase in the number of new arrivals is further evidence that the level of new immigration has increased in the last few years.
Other Data Sources While released first, the monthly CPS is not the only source of information on immigrants from the Census Bureau. In March of each year, the Bureau over-samples minorities and collects the Current Population Survey’s Annual Social and Economic Supplements, often abbreviated as CPS ASEC or just ASEC. The Census Bureau has announced that the 2015 ASEC will be made available to the public on September 16 of this year. In addition to the ASEC, there is also the American Community Survey
Figure 2. Number of New Arrivals Has Rebounded (millions)
Source: Current Population Survey public-use files from the second quarter of each year. Based on year of arrival question. Figures show number of immigrants who indicated they arrived in the three years prior to each year.
4.85 5.04
4.15 4.28
3.47 3.403.12
4.24
2001 2003 2005 2007 2009 2011 2013 2015
Table 2. Immigrant Population in Different Data Sources (thousands)
2000200120022003200420052006200720082009201020112012201320142015
Monthly CPS Averaged
over a Year1
30,533 31,665 32,513 33,727 34,053 34,873 36,070 37,395 37,594 37,309 38,039 38,312 39,591 39,983 40,883 42,046
Second Quarter CPS2
30,181 31,503 32,379 33,896 34,231 34,923 35,904 37,498 37,625 37,037 37,730 37,963 39,129 39,342 40,416 42,089
CPS ASEC3
29,985 31,811 32,453 33,471 34,244 35,214 35,659 37,279 37,264 36,750 38,546 39,432 39,976 40,107 41,009
n/a
ACS4
31,133 31,548 33,096 33,668 34,258 35,770 37,469 38,048 38,016 38,453 39,917 40,382 40,738 41,341
n/an/a
1 Yearly average for monthly Current Population Survey (CPS). 2015 only includes data for January to June.2 Based on the CPS for April, May, and June. The second quarter of 2015 is the most recent quarterly data available. In 2014, the survey was split into parts and it is possible to calculate two different foreign-born num-bers. We used the larger of the two samples.3 The Current Population Survey’s Annual Social and Economic Supple-ment, which is controlled to the March total.4 The American Community Survey (ACS) is controlled to the July 1 total.5 Based on the 2000 decennial census.
5

4
Center for Immigration Studies
Table 3. Immigrant Population by Sending Region, by Quarter (thousands)
Q1 2000Q2 2000Q3 2000Q4 2000Q1 2001Q2 2001Q3 2001Q4 2001Q1 2002Q2 2002Q3 2002Q4 2002Q1 2003Q2 2003Q3 2003Q4 2003Q1 2004Q2 2004Q3 2004Q4 2004Q1 2005Q2 2005Q3 2005Q4 2005Q1 2006Q2 2006Q3 2006Q4 2006Q1 2007Q2 2007Q3 2007Q4 2007Q1 2008Q2 2008Q3 2008Q4 2008Q1 2009Q2 2009Q3 2009Q4 2009Q1 2010Q2 2010Q3 2010Q4 2010Q1 2011Q2 2011Q3 2011Q4 2011Q1 2012Q2 2012Q3 2012Q4 2012Q1 2013Q2 2013Q3 2013Q4 2013Q1 2014Q2 2014Q3 2014Q4 2014Q1 2015Q2 2015
Mexico
8,133 8,276 8,475 8,745 8,856 8,744 8,561 9,268 9,359 9,437 9,236 9,645 9,858
10,066 10,064 10,293 10,095 10,375 10,167 10,307 10,214 10,704 10,538 10,503 10,763 10,988 11,027 11,153 11,336 11,702 11,640 11,587 11,687 11,781 12,027 11,588 11,469 11,624 11,742 11,555 11,398 11,566 11,855 11,779 11,308 11,126 11,494 11,318 11,388 11,230 11,279 11,474 11,407 11,207 11,284 11,383 11,020 11,388 11,409 11,437 11,872 12,128
Latin America
Other than Mexico
6,695 6,871 7,100 7,144 7,108 7,234 7,343 7,137 7,330 7,393 7,394 7,776 7,892 8,029 7,859 8,114 7,709 7,754 7,934 8,437 8,286 7,837 7,994 8,483 8,397 8,431 8,670 8,588 8,647 8,564 8,456 8,687 8,286 8,231 8,459 8,644 8,287 8,268 8,920 8,982 8,657 8,875 9,027 9,102 9,125 9,058 8,821 9,112 9,240 9,168 9,371 9,303 9,603 9,345 9,761 9,646 9,879 9,849
10,102 10,388 10,223 10,298
East Asia
5,731 5,753 5,722 5,964 5,902 5,719 5,742 5,972 5,836 5,620 5,777 6,103 5,868 5,832 6,032 6,159 5,985 6,091 6,091 6,140 6,109 6,318 6,291 6,302 6,244 6,354 6,374 6,303 6,572 6,677 6,472 6,573 6,760 6,906 6,759 6,528 6,477 6,680 6,642 6,707 6,614 6,845 6,890 6,925 6,755 6,790 6,808 6,791 7,312 7,163 7,238 7,553 7,495 7,328 7,262 7,401 7,452 7,497 7,266 7,523 7,706 7,749
Middle East
983 992 864 963 995
1,003 951
1,011 972
1,109 1,061 1,008 1,035 1,081 1,068 1,086 1,147 1,118 1,041 1,037 1,086 1,123 1,034 1,145 1,235 1,247 1,153 1,227 1,171 1,274 1,348 1,297 1,385 1,427 1,269 1,363 1,422 1,372 1,304 1,430 1,335 1,364 1,495 1,557 1,447 1,584 1,557 1,616 1,801 1,795 1,705 1,652 1,585 1,811 1,890 1,780 1,717 1,829 1,904 1,744 1,844 1,879
Australia/Canada/
Other
1,681 1,933 1,982 2,082 2,066 2,082 1,828 1,985 2,001 1,822 1,726 1,885 1,859 1,871 1,824 1,825 1,886 1,909 1,816 1,763 1,872 1,992 1,849 1,913 1,784 1,840 1,952 1,943 1,784 1,355 1,428 1,499 1,289 1,018
885 982 926 963 911
1,003 953 924 963
1,044 1,015 1,054 1,172 1,085 1,057 1,152 1,092 1,020
978 1,112 1,072 1,126
995 1,057 1,060 1,125
966 1,046
South Asia
1,467 1,427 1,591 1,579 1,527 1,751 1,849 1,699 1,614 1,782 1,926 1,618 1,430 1,717 1,664 1,438 1,560 1,657 1,833 1,636 1,709 1,709 1,816 1,743 1,813 1,836 1,875 1,857 2,006 2,125 2,166 2,140 2,075 2,195 2,243 2,309 2,327 2,208 2,143 2,145 2,290 2,235 2,213 2,259 2,341 2,366 2,487 2,625 2,626 2,619 2,852 2,693 2,763 2,883 2,815 2,839 2,987 2,937 3,021 3,108 3,001 2,916
Europe
4,417 4,389 4,522 4,568 4,596 4,381 4,420 4,716 4,669 4,482 4,426 4,480 4,636 4,624 4,437 4,545 4,567 4,739 4,480 4,460 4,481 4,547 4,597 4,561 4,387 4,308 4,550 4,610 4,647 4,632 4,621 4,601 4,745 4,824 4,657 4,789 4,681 4,655 4,462 4,627 4,658 4,679 4,561 4,488 4,637 4,655 4,657 4,639 4,697 4,577 4,495 4,562 4,626 4,173 4,309 4,654 4,589 4,237 4,549 4,665 4,504 4,299
Sub-Saharan
Africa
543 540 493 505 605 589 528 489 622 734 596 611 602 676 685 740 560 588 661 666 681 693 681 685 829 900 870 770
1,055 1,169 1,136 1,212 1,205 1,243 1,415 1,400 1,304 1,267 1,349 1,387 1,448 1,242 1,425 1,491 1,379 1,330 1,570 1,525 1,434 1,425 1,681 1,706 1,549 1,483 1,680 1,677 1,603 1,622 1,752 1,819 1,888 1,774
Total
29,650 30,181 30,749 31,550 31,655 31,503 31,222 32,277 32,403 32,379 32,142 33,126 33,180 33,896 33,633 34,200 33,509 34,231 34,023 34,446 34,438 34,923 34,800 35,335 35,452 35,904 36,471 36,451 37,218 37,498 37,267 37,596 37,432 37,625 37,714 37,603 36,893 37,037 37,473 37,836 37,353 37,730 38,429 38,645 38,007 37,963 38,566 38,711 39,555 39,129 39,713 39,963 40,006 39,342 40,073 40,506 40,242 40,416 41,063 41,809 42,004 42,089
Source: Current Population Survey public-use files.
5
(ACS), which is the largest Census Bureau survey. It is often used to measure the total size of the immigrant population. It is collected throughout the year and the Bureau will release information from it on September 17 of this year, but for 2014, not 2015.6 The ACS is controlled to a July 1 total, so even when it is released next month it will be almost one year behind the monthly CPS data from the second quarter of 2015 used in this analysis.7
Table 2 compares monthly data from the CPS to the ASEC and the ACS. The table shows that the ASEC produces a foreign-born estimate that is within about 1 percent of the monthly CPS from the second quarter of the same year. The ACS from each year produces an estimate that is about 3 percent larger than the monthly CPS from the second quarter of the same year.8 However, the difference has tended to increase, from 4 percent in 2010 to 6 percent in 2013. Nonetheless, all the Census surveys show similar numbers and trends.9 It is likely that when the 2014 ACS is released next month it will show somewhat over 42 million immigrants and the 2015 ACS when released next year will show roughly 44 million. As more Census Bureau data is released it should confirm what the monthly CPS data shows — significant growth in the foreign-born population in the last few years.
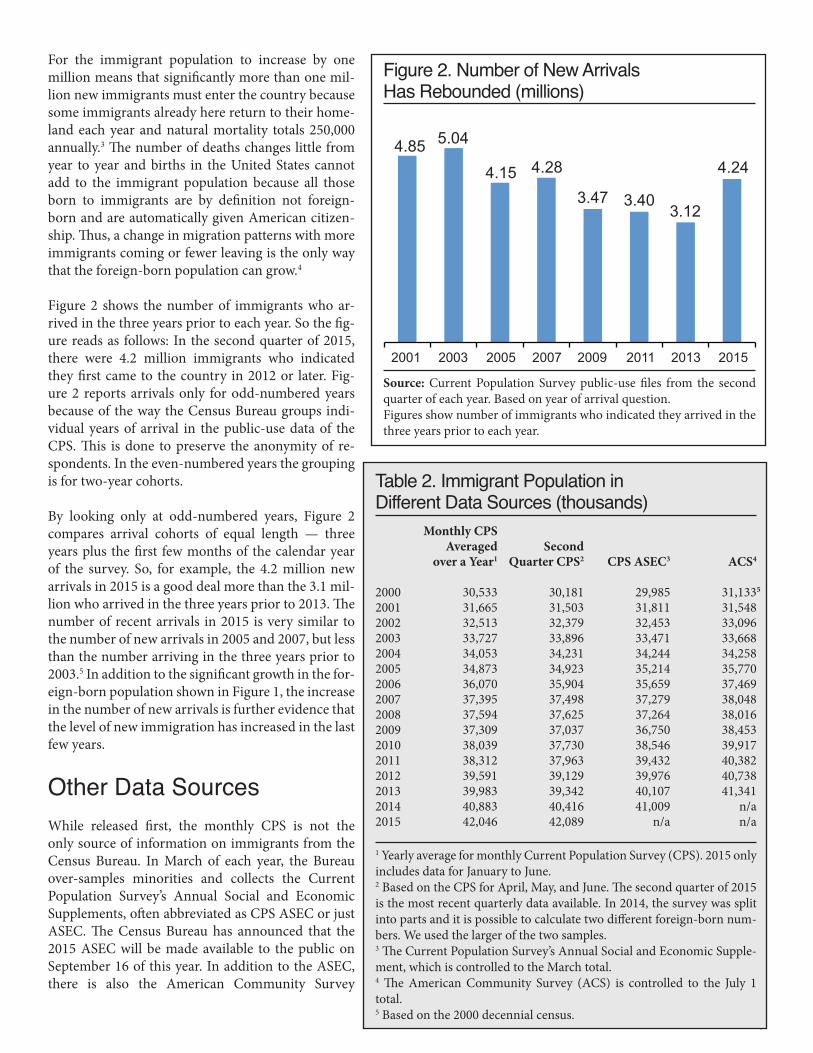
Mexican ImmigrantsIt has been widely reported that net migration from Mexico (the number leaving vs. the number coming) fell to zero.10 While estimates of out-migration in particular contain a good deal of uncertainty, there is less uncertainty when looking at the size and growth of the total Mexican immigrant population. As Figure 3 shows, there was little to no growth or an outright de-
Figure 3. A Rebound in the Number of Mexican Immigrants (millions)
Source: Current Population Survey public-use files from the second quarter of each year.
8.3
8.7
9.4
10.110.4
10.711.0
11.7 11.8 11.6 11.6
11.1 11.2 11.211.4
12.1
2000
12
11
10
9
8
7
6
52001 2002 2003 2004 2005 2006 2007 2008 2009 2010 2011 2012 2013 2014 2015
6
Center for Immigration Studies
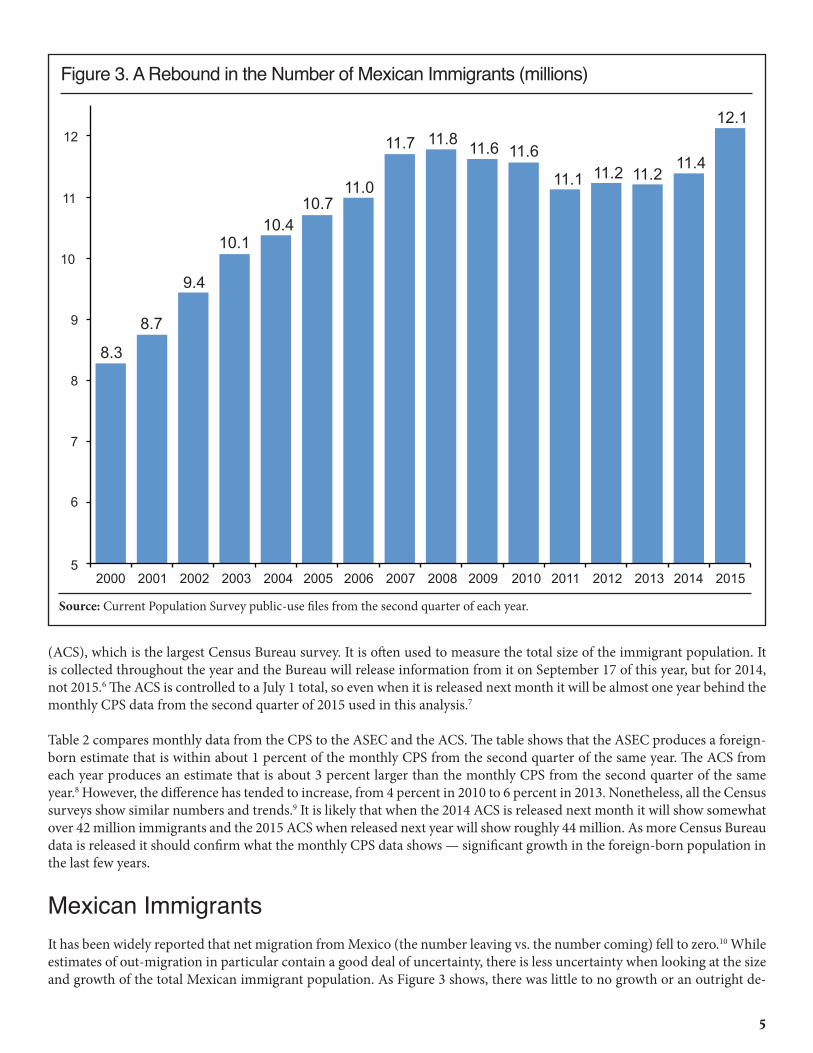
Table 4. Total Immigrant Population by Month, 2000 to 2015 (thousands) Month &Year
Jan 2000Feb 2000Mar 2000Apr 2000May 2000Jun 2000Jul 2000Aug 2000Sep 2000Oct 2000Nov 2000Dec 2000Jan 2001Feb 2001Mar 2001Apr 2001May 2001Jun 2001Jul 2001Aug 2001Sep 2001Oct 2001Nov 2001Dec 2001Jan 2002Feb 2002Mar 2002Apr 2002May 2002Jun 2002Jul 2002Aug 2002Sep 2002Oct 2002Nov 2002Dec 2002Jan 2003Feb 2003Mar 2003Apr 2003May 2003Jun 2003Jul 2003Aug 2003
Month &Year
Sep 2003Oct 2003Nov 2003Dec 2003Jan 2004Feb 2004Mar 2004Apr 2004May 2004Jun 2004Jul 2004Aug 2004Sep 2004Oct 2004Nov 2004Dec 2004Jan 2005Feb 2005Mar 2005Apr 2005May 2005Jun 2005Jul 2005Aug 2005Sep 2005Oct 2005Nov 2005Dec 2005Jan 2006Feb 2006Mar 2006Apr 2006May 2006Jun 2006Jul 2006Aug 2006Sep 2006Oct 2006Nov 2006Dec 2006Jan 2007Feb 2007Mar 2007Apr 2007
Month &Year
Jan 2011Feb 2011Mar 2011Apr 2011May 2011Jun 2011Jul 2011Aug 2011Sep 2011Oct 2011Nov 2011Dec 2011Jan 2012Feb 2012Mar 2012Apr 2012May 2012Jun 2012Jul 2012Aug 2012Sep 2012Oct 2012Nov 2012Dec 2012Jan 2013Feb 2013Mar 2013Apr 2013May 2013Jun 2013Jul 2013Aug 2013Sep 2013Oct 2013Nov 2013Dec 2013Jan 2014Feb 2014Mar 2014Apr 2014May 2014Jun 2014Jul 2014Aug 2014
Month &Year
May 2007Jun 2007Jul 2007Aug 2007Sep 2007Oct 2007Nov 2007Dec 2007Jan 2008Feb 2008Mar 2008Apr 2008May 2008Jun 2008Jul 2008Aug 2008Sep 2008Oct 2008Nov 2008Dec 2008Jan 2009Feb 2009Mar 2009Apr 2009May 2009Jun 2009Jul 2009Aug 2009Sep 2009Oct 2009Nov 2009Dec 2009Jan 2010Feb 2010Mar 2010Apr 2010May 2010Jun 2010Jul 2010Aug 2010Sep 2010Oct 2010Nov 2010Dec 2010
Month &Year
Sep 2014Oct 2014Nov 2014Dec 2014Jan 2015Feb 2015Mar 2015Apr 2015May 2015Jun 2015
Total Population
29,788 29,683 29,480 30,101 30,176 30,266 30,592 30,808 30,847 31,221 31,854 31,571 31,645 31,705 31,623 31,711 31,479 31,322 30,960 31,314 31,392 31,932 32,393 32,502 32,426 32,426 32,355 32,450 32,342 32,346 32,428 31,839 32,160 32,771 33,005 33,602 32,880 32,968 33,691 33,820 34,056 33,814 33,275 33,656
Total Population
33,967 34,193 34,420 33,989 33,376 33,396 33,757 34,101 34,388 34,203 33,910 34,224 33,935 34,369 34,848 34,125 34,271 34,474 34,567 34,881 34,869 35,015 34,740 34,779 34,881 35,041 35,513 35,448 35,399 35,451 35,504 35,772 36,039 35,912 36,232 36,475 36,702 36,646 36,454 36,254 36,872 37,416 37,371 37,571
Total Population
38,307 37,962 37,750 37,580 38,179 38,132 38,531 38,537 38,633 38,900 38,554 38,680 39,539 39,523 39,607 39,075 39,282 39,032 39,479 39,674 39,993 40,070 39,908 39,906 40,027 39,994 40,002 39,585 39,182 39,267 39,655 39,901 40,667 40,591 40,516 40,414 40,046 40,173 40,508 40,274 40,459 40,513 40,321 41,171
Total Population
37,571 37,353 37,219 36,976 37,605 37,803 37,547 37,438 37,537 37,484 37,277 37,643 37,306 37,925 37,877 37,419 37,851 37,664 37,698 37,446 37,147 36,849 36,680 37,029 36,773 37,310 37,260 37,515 37,638 37,650 38,102 37,751 37,650 37,346 37,056 36,975 37,795 38,423 38,359 38,499 38,430 38,548 38,650 38,743
Total Population
41,694 41,660 41,972 41,800 41,867 42,095 42,047 41,892 42,207 42,170
Source: Current Population Survey public-use files.
cline in the Mexican immigrant population from 2008 to 2013. This lends strong support to the idea that net migration was zero or perhaps even negative from Mexico during this time period. However, something seems to have changed in the last 18 months. The quarterly data shows an increase of 740,000 from the second quarter of 2014 to the same quarter of this year (Table 3 and Figure 3).11 Looking at individual months also shows the same upturn in the number of Mexican immigrants in the Unites States. Figure 4 shows month-to-month fluctuations in the Mexican immigrant population, which is partly related to seasonality; but there is no clear trend until 2014. From January 2014 to December 2014, the Mexican immigrant popula-tion grew by slightly more than 460,000. So far this year (January to June), the Mexican population has increased by 419,000.
For the last few decades, Mexico has been the top sending country to the United States for both legal and illegal immigration. It must be emphasized that this was the case even from 2008 to 2013, when the pace of immigration slowed from that coun-try. Mexico was the top sending country for new green card recipients in every year from 2009 to 2013. Mexico sent roughly twice as many each year as the next biggest sending country, China.12 However, not all of these green cards went to new arriv-

7
Figure 4. Number of Mexican Immigrants Shows Significant Recent Increase January 2012 to June 2015 (millions)
Source: Current Population Survey public-use files for January 2012 to June 2015.
Jan. 2012 Jan. 2013 Jan. 2014 Jan. 2015
12
11
10
als. In addition to being the top sending country for legal im-migration, the Department of Homeland Security and other researchers also have estimat-ed that more than half of all illegal immigrants are from Mexico.13 The recent increase in the number of immigrants from Mexico is an indication that the number of new illegal im migrants entering the coun-try is increasing.14
One cautionary note is in or-der: it is not known if the in-crease in the Mexican immi-grant population represents a longer-term trend or just a one-year spike. What we can say is that the growth in the Mexican immigrant popula-tion in the last year is large and statically significant. (For con-fidence intervals surrounding the Mexican immigrant popu-lation, see Table 1.)
Illegal Immigrants. It is im-portant to understand that ille-gal immigration, like immigration generally, is a dynam-ic process, with new immigrants arriving each year and some returning home. In the case of illegal immigration, in addition to deaths and return migration, new arrivals are also offset by those who remain in the country, but change their status from illegal to legal each year. Since 2009, some 2.5 million new illegals have settled in the country, with Mexico as the top sending country.15 But these new arrivals were offset by those getting legal sta-tus, going home, or dying.
It is well established that illegal immigrants respond to Census Bureau surveys. In fact, researchers have used Census Bureau data as the basis to estimate the size and composition of the illegal population. Table 5 reports es-timates of the illegal immigrant population from DHS, the Pew Research Center, and the Center for Migration Studies (CMS) compared to the total immigrant popula-tion in the second quarter of the same year. All of these estimates are based on Census Bureau surveys. The ratio of immi-grants to the illegal population in the second quarter over the years as estimated by these three organizations varies from a high of 3.57:1 to a low of 3.22:1. Averaging all three organization’s estimates results in a ratio of 3.38:1. Using this average ratio implies that the illegal population could be 12.4 million in 2015. If correct, this would mean that the illegal population grew significantly since 2013, when Pew and CMS last estimated its size. Of course, this represents only an educated guess. To actually estimate the illegal population in the second quarter of 2015 would require administrative data that is not yet
Table 5. Estimates of the Illegal Imm. Pop. Compared to Quarterly CPS (thousands)
201020112012201320142015
DHS
11,590 11,510 11,430
n/a n/a n/a
Pew Research
Center
11,400 11,500 11,200 11,300
n/a n/a
Center for Migration
Studies
11,725 11,315 11,110 11,010
n/a n/a
Second Quarter CPS
by Year
37,730 37,963 39,129 39,342 40,416 42,089
Sources: Department of Homeland Security; Pew Research Center; Center for Migration Studies; and Current Population Survey public-use files from the second quarter of each year.

8
Center for Immigration Studies
available, as well as other information. But the evidence, while preliminary and incomplete, does indicate that the number of illegal immigrants has increased in the last two years.
As we have seen, the increase in the Mexico-born population in the last year suggests that illegal immigration has increased. In addition to Mexico, growth in the immigrant population was led by a 449,000 increase in the number of immigrants from other Latin American countries in the last year. This 449,000 accounted for 27 percent of the growth in the total foreign-born population since 2014. Looking at growth in the last two years shows a 2.75 million increase in the immigrant population (See Figure 1 and Table 1). Mexico accounted for 921,000 (34 percent) of this growth and other Latin American countries accounted for 953,000 (35 percent). Most researchers have estimated that individuals from Mexico and Latin America ac-counted for eight in 10 illegal immigrants in the country.16 The significant growth of immigrants from all of Latin America over the last two years lends support to the idea that the number of illegal immigrants has begun to increase again.
ConclusionThe most up-to-date Census Bureau data is from the monthly Current Population Survey. The survey shows significant growth in the nation’s immigrant (legal and illegal) population since 2011, after a period of no significant growth. In the last two years, the growth in the immigrant population has been largely driven by immigrants from Mexico and the rest of Latin America. This suggests that illegal immigration has increased in recent years after having declined or grown little from 2009 to 2013. However, it must be remembered that legal immigrants significantly outnumber illegal immigrants. Of the more than 42 million immigrants living in the country in the second quarter of 2015, roughly three-quarters are in the country legally. While the impact of illegal immigration is often the subject of intense national debate, the much larger flow of legal immigrants has seen almost no discussion, even though its impact on American society is much larger.

9
End Notes1 The Current Population Survey is sometimes referred to as the Household Survey and is primarily collected to measure unemployment, labor force participation, and other aspects of the nation’s labor force.
2 It includes naturalized citizens, permanent residents (green card holders), long-term temporary visitors (e.g. guest workers and foreign students), and illegal immigrants.
3 The number of new immigrants arriving is much larger than the growth in the immigrant population because each year roughly half a million immigrants die or return home. Return migration and deaths offset new arrivals. We can see how new arrivals are offset by deaths and out-migration by looking at the most recent data. As Figure 1 and Table 1 show, the immigrant population grew by three million from the second quarter of 2012 to the second quarter of 2015. Figure 2 shows there were 4.24 million new immigrants in the country in 2015 who indicated in the survey that they came in 2012 or later. The 1.24 million difference between these numbers provides a very rough estimate of return-migration and deaths. This comparison is only a crude measure of deaths and out-migration because some immigrants, who had been in the country earlier, but left and then returned between 2012 to 2015, would not show up as new arrivals in the 2015 data. However they would directly add to the size of the immigrant population. Also, the undercount of new arrivals is almost certainly larger than the undercount of the overall immigrant population, which is a much more established population. For a more detailed discussion of deaths and out-migration, see the “Deaths and Out Migration” section in Steven A. Camarota, Immigrants in the United States: A Profile of America’s Foreign-Born Population, Washington, DC: Center for Immigration Studies, 2012.
4 Like all modern surveys, the Census Bureau weights the CPS and ACS based on a complex methodology that reflects what the Bureau thinks is the nation’s actual population size by such key variables as race, sex, age, and ethnicity. The weighting procedure is specifically designed to produce accurate survey results even for populations that are difficult to capture in a survey. The weights are adjusted each January as new information becomes available to the Bureau. This re-weighting can impact year-to-year comparisons in things like the unemployment rate, income, and other information drawn from the CPS, including the size of the foreign-born population. However, the bureau’s re-weighting cannot impact comparisons month-to-month within the same year. For more discussion of the methodology of the CPS see “Design and Methodology: Current Population Survey”, U.S. Department of Labor, October 2006.
5 The difference between the number of new arrivals in 2015 compared to 2013 is statistically significant. The number of new arrivals in 2015, 2007, and 2005 are all statistically equal, indicating that new immigration has returned to the level it was before the Great Recession.
6 “Census Bureau Announces Schedule for Income, Poverty and Health Insurance Statistics and American Community Sur-vey Results”, Census Bureau press release, July 30, 2015.
7 In addition to the monthly CPS, the ASEC, and the ACS, the Survey of Income and Program Participation (SIPP) also iden-tifies immigrants. While much more detailed than the other surveys, it is typically released a few years after it is collected so it cannot be used to measure recent trends in immigration.
8 Part of the reason the ACS shows a bigger population than the CPS is that, unlike the CPS, it includes the institutional population (e.g. those in prisons and nursing homes).
9 This is to be expected as the surveys are weighted to similar population controls.
10 In a recent appearance, former President Bill Clinton made a point of arguing that there is little need to worry about illegal immigration because net migration from Mexico is zero. The Pew Research Center was the first to estimate that net migra-tion was zero. See Jeffrey S. Passel, D’Vera Cohn, and Ana Gonzalez-Barrera, Net Migration from Mexico Falls to Zero — and Perhaps Less, Washington, DC: Pew Hispanic Center, April 2012.

10
Center for Immigration Studies
11 From 2000 to 2006 the countries in regions shown in Table 3 are as followings, Europe: Austria, Belgium, Czechoslova-kia, Denmark, Finland, France, Germany, Greece, Hungary, Ireland, Italy, Holland/Netherlands, Norway, Poland, Portu-gal, Azores, Romania, Spain, Sweden, Switzerland, Great Britain, England, Scotland, Northern Ireland, Yugoslavia, Europe, Czech Republic, Slovakia/Slovak Republic, USSR, Latvia, Lithuania, Armenia, Russia, Ukraine; South Asia: Afghanistan, Bangladesh, India , Pakistan; East Asia: Burma, Cambodia, China, Hong Kong, Indonesia, Japan, Korea/South Korea, Laos, Malaysia, Philippines, Singapore, Taiwan, Thailand, Vietnam, Asia not specified; Middle East: Iran, Iraq, Israel, Jordan, Leba-non, Saudi Arabia, Syria, Turkey, Middle East, Palestine, Egypt, Morocco, North Africa; Sub-Saharan Africa: Ethiopia, Gha-na, Kenya, Nigeria, South Africa, Tanzania, Other Africa; Latin America other than Mexico: Belize, Costa Rica, El Salvador, Guatemala, Honduras, Nicaragua, Panama, Central America, Bermuda, Bahamas, Barbados, Cuba, Dominica, Dominican Republic, Grenada, Haiti, Jamaica, Trinidad and Tobago, Caribbean Argentina, Bolivia, Brazil, Chile, Columbia, Ecuador, Guyana, Peru, Uruguay, Venezuela, and South America; Canada, Australia, and Other countries not specified. In 2007 the Census Bureau changed the countries identified in the CPS. From 2007 to 2015 the regions are as follows, Europe: Albania, Austria, Belgium, Bulgaria, Czechoslovakia, Denmark, Finland, France, Germany, Greece, Hungary, Iceland, Ireland, Italy, Netherlands, Norway, Poland, Portugal, Azores, Romania, Spain, Sweden, Switzerland, United Kingdom, England, Scot-land, Northern Ireland, Yugoslavia, Czech Republic, Slovakia, Bosnia & Herzegovina, Croatia, Macedonia, Serbia, Estonia, Latvia, Lithuania, Armenia, Belarus, Georgia, Moldova, Russia, Ukraine, USSR, Montenegro, Cyprus, Kosovo and Europe not specified, South Asia: Afghanistan, Bangladesh, Bhutan, India, Nepal, Pakistan, and Sri Lanka; East Asia: Myanmar (Burma), Cambodia, China, Hong Kong, Indonesia, Japan, Korea, South Korea, Laos, Malaysia, Mongolia, Philippines, Sin-gapore, Taiwan, Thailand, Vietnam, and Asia not specified; Middle East: Azerbaijan, Iran, Iraq, Israel, Jordan, Kazakhstan, Kuwait, Lebanon, Saudi Arabia, Syria, Turkey, United Arab Emirates, Uzbekistan, Yemen, Algeria, Egypt, Libya, Morocco, and Sudan; Latin American Other than Mexico: Belize, Costa Rica, El Salvador, Guatemala, Honduras, Nicaragua, Panama Bermuda, Antigua and Barbuda, Bahamas, Barbados, Cuba, Dominica, Dominican Republic, Grenada, Haiti, Jamaica, St. Kitts—Nevis, St. Lucia, St. Vincent and the Grenadines, Trinidad and Tobago, West Indies, not specified, Argentina, Bolivia, Brazil, Chile, Columbia, Ecuador, Guyana, Paraguay, Peru, Uruguay, Venezuela, South America not specified; Sub-Saharan Africa: Cameroon, Cape Verde, Congo, Ethiopia, Eritrea, Ghana, Guinea, Ivory Coast, Kenya, Liberia, Nigeria, Senegal, Sierra Leone, Somalia, South Africa, Tanzania, Togo, Uganda, Zaire, Zambia, Zimbabwe, and Africa not Specified; Canada, Australia, and Other countries not specified.
12 Lawful Permanent Residents Annual Flow Reports for 2013, 2012, and 2011, by Randall Monger and James Yank for the Department of Homeland Security.
13 DHS estimates of Mexican illegal immigrants by year can be found in Appendix Table 2 of Ryan Baker and Nancy Rytin, “Estimates of the Unauthorized Immigrant Population Residing in the United States: January 2012”, Department of Home-land Security, March 2013. See also “Unauthorized Immigrants in the United States”, Pew Hispanic Center, November 2014; and Robert Warren, “Democratizing Data about Unauthorized Residents in the United States: Estimates and Public-Use Data, 2010 to 2013”, Journal on Migration and Human Security, Vol. 2 No. 4, 2014, pp. 305-328.
14 See Table 5 for estimates of the illegal immigrant from different organizations through 2013.
15 Steven A. Camarota, “2.5 Million Join Illegal Population under Obama: Pace slower than under Bush, but still enormous”, Center for Immigration Studies, July 2015.
16 Ryan Baker and Nancy Rytin, “Estimates of the Unauthorized Immigrant Population Residing in the United States: January 2012”, Department of Homeland Security, March 2013. See also “Chapter 2: Birthplaces of U.S. Unauthorized Immigrants” in Jeffrey S. Passel, D’Vera Cohn, and Ana Gonzalez-Barrera, Net Migration from Mexico Falls to Zero — and Perhaps Less, Pew Research Center, November 2014.