immigrants, household production and women's … household production and women's ......
TRANSCRIPT

Immigrants, Household Production and Women's Retirement
Giovanni Peri (University of California, Davis) Agnese Romiti (IAB)
Mariacristina Rossi (University of Torino)
Abstract
Women contribute disproportionately to household production, especially in Southern European coun-
tries. As a consequence of population aging assistance to elderly parents, rather than child care, has become
a prevalent activity in home-production services. Immigrant labor has increasingly become a substitute for
women labor in those services. Their presence, therefore, may allow women over 55 to work more outside
of the house and retire later. We use a unique database of Italian households to identify the e�ect of local
availability of foreign workers on planned retirement age and labor supply of Italian women. We �nd that an
exogenous increase by one point in the immigrant percentage of the local population increased the planned
retirement age of women over 45 by two months relative to similar men. For over 55 women with old parents
the increase was four months and if they were in low-wealth households the increase was one full year. The
same in�ow of immigrants also increased the probability that women over 55 work outside the home by nine
percentage points, relative to men.
Keywords: International migration, retirement, labor supply, home production, elderly care.
JEL codes: J22, J26, F22.
1
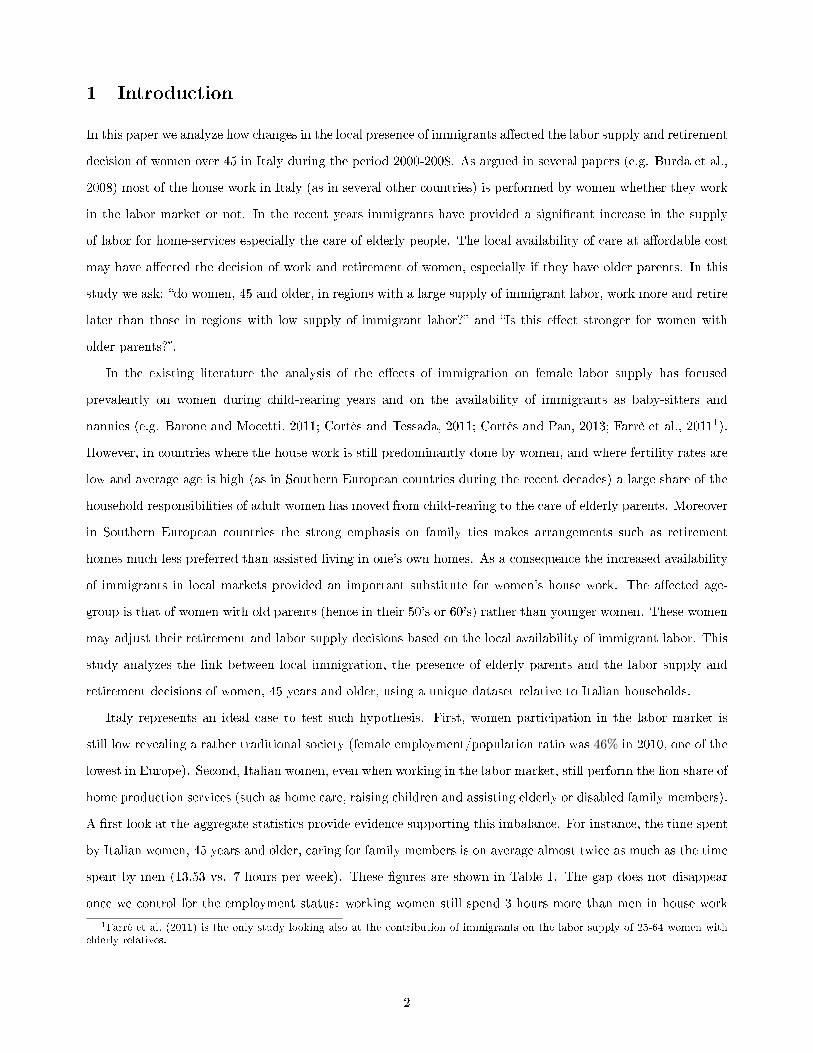
1 Introduction
In this paper we analyze how changes in the local presence of immigrants a�ected the labor supply and retirement
decision of women over 45 in Italy during the period 2000-2008. As argued in several papers (e.g. Burda et al.,
2008) most of the house work in Italy (as in several other countries) is performed by women whether they work
in the labor market or not. In the recent years immigrants have provided a signi�cant increase in the supply
of labor for home-services especially the care of elderly people. The local availability of care at a�ordable cost
may have a�ected the decision of work and retirement of women, especially if they have older parents. In this
study we ask: �do women, 45 and older, in regions with a large supply of immigrant labor, work more and retire
later than those in regions with low supply of immigrant labor?� and �Is this e�ect stronger for women with
older parents?�.
In the existing literature the analysis of the e�ects of immigration on female labor supply has focused
prevalently on women during child-rearing years and on the availability of immigrants as baby-sitters and
nannies (e.g. Barone and Mocetti, 2011; Cortès and Tessada, 2011; Cortès and Pan, 2013; Farrè et al., 20111).
However, in countries where the house work is still predominantly done by women, and where fertility rates are
low and average age is high (as in Southern European countries during the recent decades) a large share of the
household responsibilities of adult women has moved from child-rearing to the care of elderly parents. Moreover
in Southern European countries the strong emphasis on family ties makes arrangements such as retirement
homes much less preferred than assisted living in one's own homes. As a consequence the increased availability
of immigrants in local markets provided an important substitute for women's house work. The a�ected age-
group is that of women with old parents (hence in their 50's or 60's) rather than younger women. These women
may adjust their retirement and labor supply decisions based on the local availability of immigrant labor. This
study analyzes the link between local immigration, the presence of elderly parents and the labor supply and
retirement decisions of women, 45 years and older, using a unique dataset relative to Italian households.
Italy represents an ideal case to test such hypothesis. First, women participation in the labor market is
still low revealing a rather traditional society (female employment/population ratio was 46% in 2010, one of the
lowest in Europe). Second, Italian women, even when working in the labor market, still perform the lion share of
home production services (such as home care, raising children and assisting elderly or disabled family members).
A �rst look at the aggregate statistics provide evidence supporting this imbalance. For instance, the time spent
by Italian women, 45 years and older, caring for family members is on average almost twice as much as the time
spent by men (13.53 vs. 7 hours per week). These �gures are shown in Table 1. The gap does not disappear
once we control for the employment status: working women still spend 3 hours more than men in house work
1Farrè et al. (2011) is the only study looking also at the contribution of immigrants on the labor supply of 25-64 women withelderly relatives.
2

(9 vs. 6 hours) whereas non-working women spent 7 hours in house work more than non-working men (16 vs.
9 hours). This gap widens further when an older (80+) parent is present in the household: women spend more
than 13 hours as opposed to the 6.12 of men (and the gap widens even further for the sample of older women,
55 years and older). Women with older parents spend 17 hours per week caring for family members compared
to only 7 hours spent by men. In a cross-country perspective, this evidence is also con�rmed by Burda et al.
(2008) who look at time-allocation data for European Households.
In Italy strong and persistent familial ties between children and their parents, accompanied by the low
mobility of young people, have encouraged families to care for their elderly. Publicly provided residential care
covers only 3% of those aged 65 and over (Presidi residenziali socio-assistenziali e sanitari, 2009, ISTAT).
Institutions for the elderly (such as convalescent homes) care for only three out of 1000 people aged 65 and
over. They are perceived as being much less desirable than caring for the elderly in their own home. As a
consequence, during the last two decades the paid care for the elderly and the disabled (in Italian: �Assistenti
e Badanti�) has expanded dramatically. This sector has been dominated by foreign workers. Italian citizens,
especially those in young cohorts, supply almost no labor to these services.
Our data, a representative survey of Italian households, contain very detailed information on family structure,
employment and retirement decisions and planning. This allows us to analyze the impact of immigrant labor
on the planned age of retirement of Italian women (and men), accounting for their family characteristics. In
particular, we analyze whether the increased presence of immigrant labor in a region, as predicted by the presence
of speci�c national enclaves before 2000, a�ected the planned retirement age of women over 45 (relative to men)
and whether this e�ect was stronger for those with living elderly parents (relative to women with no living
parents). We also analyze whether the immigrant labor has had an impact on the labor supply, particularly on
that of women. Hence, this paper contributes to the literature on the impact of immigration and to that on the
determinants of the retirement age.
Empirical evidence has reported that the care for parents inevitably a�ects working and retirement deci-
sions (Bolin et al., 2008; Carmichael and Charles, 1998, 2003; Crespo and Mira, 2010; Kolodinsky and Shirey,
2000; Wolf and Soldo, 1994) and particularly those of women in Italy (Marenzi and Pagani, 2008), given their
traditional role as care-givers (Lamura et al., 2008). Our �ndings indicate that in regions with a large increase
in immigration women stay employed longer. In a country as Italy, where a series of reforms has increased the
retirement age of individual through increasing mandatory working age, our paper proposes an interesting, if
more limited, market-based mechanism to achieve an increase in retirement age: increase the supply of immi-
grants hence reducing the cost of the care of elderly parents, enabling women in their 50's and 60's to continue
to work outside the home.
The main �ndings of our analysis are as follows. First, an increase in the employment share of immigrant
3
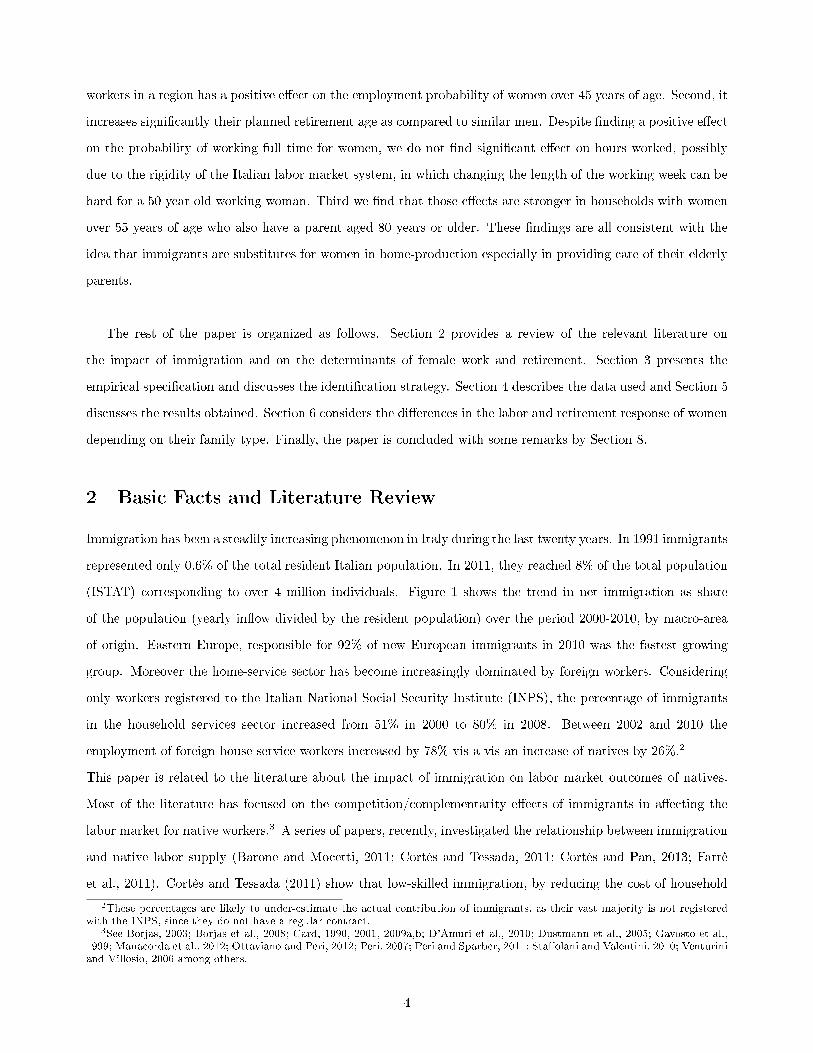
workers in a region has a positive e�ect on the employment probability of women over 45 years of age. Second, it
increases signi�cantly their planned retirement age as compared to similar men. Despite �nding a positive e�ect
on the probability of working full time for women, we do not �nd signi�cant e�ect on hours worked, possibly
due to the rigidity of the Italian labor market system, in which changing the length of the working week can be
hard for a 50 year old working woman. Third we �nd that those e�ects are stronger in households with women
over 55 years of age who also have a parent aged 80 years or older. These �ndings are all consistent with the
idea that immigrants are substitutes for women in home-production especially in providing care of their elderly
parents.
The rest of the paper is organized as follows. Section 2 provides a review of the relevant literature on
the impact of immigration and on the determinants of female work and retirement. Section 3 presents the
empirical speci�cation and discusses the identi�cation strategy. Section 4 describes the data used and Section 5
discusses the results obtained. Section 6 considers the di�erences in the labor and retirement response of women
depending on their family type. Finally, the paper is concluded with some remarks by Section 8.
2 Basic Facts and Literature Review
Immigration has been a steadily increasing phenomenon in Italy during the last twenty years. In 1991 immigrants
represented only 0.6% of the total resident Italian population. In 2011, they reached 8% of the total population
(ISTAT) corresponding to over 4 million individuals. Figure 1 shows the trend in net immigration as share
of the population (yearly in�ow divided by the resident population) over the period 2000-2010, by macro-area
of origin. Eastern Europe, responsible for 92% of new European immigrants in 2010 was the fastest growing
group. Moreover the home-service sector has become increasingly dominated by foreign workers. Considering
only workers registered to the Italian National Social Security Institute (INPS), the percentage of immigrants
in the household services sector increased from 51% in 2000 to 80% in 2008. Between 2002 and 2010 the
employment of foreign house-service workers increased by 78% vis-a-vis an increase of natives by 26%.2
This paper is related to the literature about the impact of immigration on labor market outcomes of natives.
Most of the literature has focused on the competition/complementarity e�ects of immigrants in a�ecting the
labor market for native workers.3 A series of papers, recently, investigated the relationship between immigration
and native labor supply (Barone and Mocetti, 2011; Cortès and Tessada, 2011; Cortès and Pan, 2013; Farrè
et al., 2011). Cortès and Tessada (2011) show that low-skilled immigration, by reducing the cost of household
2These percentages are likely to under-estimate the actual contribution of immigrants, as their vast majority is not registeredwith the INPS, since they do not have a regular contract.
3See Borjas, 2003; Borjas et al., 2008; Card, 1990, 2001, 2009a,b; D'Amuri et al., 2010; Dustmann et al., 2005; Gavosto et al.,1999; Manacorda et al., 2012; Ottaviano and Peri, 2012; Peri, 2007; Peri and Sparber, 2011; Sta�olani and Valentini, 2010; Venturiniand Villosio, 2006 among others.
4

services, increases the labor supply of young educated women, reducing their time spent in caring for their
children and increasing their expenditure on housekeeping services. For Italy, Barone and Mocetti (2011) �nd
similar results, showing that female immigrants who specialized in household production increase the labor
supply of highly-educated Italian working age women by increasing their working hours. Also Cortès and Pan
(2013) �nd that temporary domestic migrant workers have increased female labor force participation rates for
women in Hong Kong and the e�ect has been particularly large for highly educated women with young children.
No previous study, to the best of our knowledge, has looked at the e�ect of immigration on retirement decision.
The closest study to ours is Farrè et al. (2011), who analyze the impact of female immigration to Spain on the
labor supply of highly educated native women, with a particular focus on women with family care commitments,
such as children or elderly relatives living with them. Among others, one of their �ndings shows that female
immigration rises the probability of working for highly skilled women with elderly relatives. Our paper di�ers
from their in three main aspects. First we focus on the (more appropriate) age range4 in order to isolate the
potential users of immigrants for elderly care. Second we can identify whether the head of a household or his/her
spouse has a living elderly parent. Third we are the �rst to analyze the impact on planned retirement age.
There is also an abundant literature on the determinants of retirement. Within this body of literature,
the paper of Stock and Wise (1990) stands out as the seminal work which explains the choice of retirement
according to the Option Value (OV) model. This model considers the di�erent utilities associated with immediate
retirement versus the utility associated with postponement. The agent, if rational, would choose the option with
the highest corresponding utility, which is the best of the alternatives. Several papers have drawn on the seminal
contribution of Stock and Wise (1990) and evaluated, using this model, the e�ectiveness of some policies and of
�nancial incentives in a�ecting retirement age. Brugiavini and Peracchi (2004) and Belloni and Alessie (2009,
2013) are such examples. Cross-country evidence is considered in Gruber and Wise (2004), who apply the
same template to 12 OECD countries by running a reduced form of the OV model and simulating di�erent
policy scenarios, and provide strong support for the signi�cant causal e�ect of �nancial incentives on retirement
decisions.5 The literature on the determinants of retirement age has recognized that the needs of elderly parents
may act as a disincentive to continue working. Retiring earlier allows workers with living parents to care for
them and to avoid buying long-term care on the formal market which can be very expensive. Some studies
have analyzed the e�ect of a�ordable care options on the labor market outcomes of households. They use data
from the US (Ettner, 1996; Kolodinsky and Shirey, 2000; Wolf and Soldo, 1994), with fewer cases analyzing
the UK (Carmichael and Charles, 1998, 2003), a few cross-country studies of European countries (Bolin et al.,
2008; Crespo and Mira, 2010) and one study on Italy (Marenzi and Pagani, 2008). All of these studies point
4The authors consider women of 25-65 years as opposed to our analysis looking at 45-70 years.5Samwick (1998) represents another relevant study which applies this reduced-form version of the OV model for the case of the
US.
5

out the positive relationship between the availability of care for the elderly and labor market supply, at either
the intensive or the extensive margin.
3 Empirical Framework
3.1 Basic Speci�cation
Our empirical strategy is based on a simple speci�cation relating the outcome (or choice) yirt for individual
i in region r at time t to a series of individual controls and to the share of immigrants in the regional labor
market (frt). Importantly, we also include in the regression the interaction of the immigrant share with gender
and with the presence of elderly parents. The basic speci�cation is as follows:
yirt = φi + φt + αXirt + βfrt + γ1femalei ∗ frt + γ2femalei ∗ old parentsirt ∗ frt + εirt (1)
The dependent variable yirt is, alternatively, the expected retirement age or a dummy for being employed,
or for working full time or the number of hours worked, conditional on working. The term φi represents a set
of individual e�ects capturing the time invariant individual characteristics (including gender). The term φt
captures a set of year �xed e�ects. The vector Xirt includes individual time-varying characteristics such as
age, age squared, marital status, partner's employment status, education,6 and the logarithm of net wealth.
We also include among those controls the indicator �old parents�, a dummy capturing the presence of at least
a living elderly parent (or parent in law) over the age of 80 and its interaction with the female dummy. We
also control for parental economic conditions by using an indicator for having at least one old parent (or parent
in law) whose last occupation was as a blue collar or unemployed. In the speci�cation that includes planned
retirement age as outcome we also include individual controls based on the determinants of retirement age in
an Option Value model. Those are the eligibility for seniority pension (as it changed over time according to
requirements based on age and seniority), occupational dummies and a measure of �nancial incentives given by
the predicted option value of retiring.7 The variable frt is the share of foreign-born in the population of region r
in year t. Finally the term εirt captures all the zero-mean idiosyncratic random shocks to the outcome variable
for individual i in period t. The focus of the analysis is the estimate of the coe�cients γ1 and γ2. The �rst
coe�cient identi�es whether a change in the share of immigrants in the region produces a di�erential e�ect in
the outcome of men and women. If β captures the average e�ect of immigration on male individuals, channeled
through labor market and general equilibrium e�ects, γ1 identi�es the additional e�ect of immigrants on women
labor supply or retirement decision. Even more importantly γ2 identi�es the additional e�ect of immigrants on
6We consider three dummies corresponding to compulsory education, high school, and higher education, with the excludedcategory representing no education.
7For the computation of the predicted measure of the OV see the Appendix.
6

women labor supply (or retirement decisions) when they have an elderly parent. If immigrants have an e�ect
in substituting for house services then their impact in encouraging participation to the labor market, should be
stronger for women (positive value of γ1) , and particularly for those women with living elderly parents (positive
value of γ2). In the empirical analysis we break down the sample according to di�erent age brackets in order to
isolate the di�erent role of family care commitments and also to isolate the sample where the expectations about
retirement are likely to be a�ected by current conditions. For the retirement estimation we concentrate on two
age brackets: 45-70, and 55-70. We use the same two age brackets for the analysis on the intensive margin of
labor supply (weekly working hours and full time indicator), whereas we include the additional sample of 60-70
years old for the analysis on the extensive margin (working or not). The other dependent variables contain too
many missing values in the sample 60 years and older to be usable.
3.2 Identi�cation and IV strategy
Our data set includes individual observations spanning the period 2000-2008 every other year. We exploit the
longitudinal dimensions of the data and we estimate equation (1) using a �xed e�ects estimator to control
for unobserved individual characteristics. This approach can still produce inconsistent estimates of the causal
impact of immigration on women employment and retirement decisions if omitted variables at the regional level
a�ect both changes in immigration and changes in the incentives to retire and to work. The inclusion of �xed
e�ects, the presence of the controls and, most importantly, the focus only on the di�erential e�ect between men
and women will absorb a large number of unobserved factors that a�ect individual labor market outcomes and
may be correlated with immigration at the regional level. Only economic factors that a�ect di�erentially men
and women, and speci�cally women with older parents, and are correlated with local immigration would generate
an omitted variable bias in the OLS estimates. Nevertheless, in order to reduce even further the presence of
these unobservable factors, we use, as preferred model, an instrumental variable estimator. The most insidious
omitted variables would be region-level demand shocks that attract immigrants and a�ect the retirement and
labor supply decisions of native women relative to native men. Positive demand shocks to sectors mainly hiring
women may constitute such factors. In that case the FE estimate would be biased upwards. In the empirical
analysis we also show that our results are robust to potential confounding gender-speci�c labor demand factors
by controlling for men and women unemployment rates (at the regional level). In addition, our measure of
the immigration share of the population may be a�ected by measurement errors, as it only accounts for legal
resident immigrants and is based on a sample rather than on the total population.8 This type of measurement
error introduces a downward bias in the FE coe�cient. In one of the robustness checks we try to address this
issue by quantifying the impact of the unaccounted illegal immigrants on our �ndings by using the information
8According to estimates based on ISMU (Iniziative e Studi sulla Multietnicità) data and provided by Blangiardo and Cesareo(2009) in year 2000, undocumented represented 10% of resident immigrants.
7

taken from the 2002 Amnesty.
The IV strategy that we adopt is broadly used in the literature on immigration. Our estimates exploit the
variation in the immigrant share of the population over time within regions: we have 20 regions in total and a
time span of 8 years distributed in 5 waves (2000-2008), due to the structure of the Survey which is run every
two years. Table 2 shows the variation in the immigrant share of the population in each region at the beginning
and at the end of the considered period. One can see that there is a signi�cant variation across regions in the
increase in the immigrant share. In particular we use as instrument the supply-push component of immigration,
following Card (2001). The rationale behind the instrument rests on the use of the regional pattern of settlement
of immigrants from a given source country in the past as an exogenous determinant of the subsequent local
country-speci�c �ow of immigrants. The total country-speci�c �ow of immigrants to the host country between
2000 and 2008 is distributed according to the regional shares as of 1991. Hence the demand shocks, that may
a�ect immigration over the considered period, do not contribute to the correlation between the instrument and
the dependent variable.
Speci�cally the instrument for the immigrant share in region r at time t , that we will call �imputed immigrant
share� and denote as f̂rt, is computed according to the following formula:
f̂rt =Σc
(Imcrt0Imct0
)Imct
Poprt1(2)
In the formula (2) the termImcrt0Imct0
represents immigrants born in country c residing in region r at time t0 relative
to all immigrants from country c residing in Italy in year t0. The year chosen to determine the initial regional
distribution of immigrants across regions is t0 = 1991 and we rely on Census data for that year.9 Imct is the
stock of immigrants from country c present in Italy as of year t, and Poprt1 is the total resident population
in region r computed in 2000, the �rst wave of our analysis. Both of those values are taken from population
registry data.
As we use the variation of this index over time to identify the impact of immigration the validity of this
strategy relies upon two main requirements: �rst, the distribution of immigrants across regions, by nationality,
as of 1991 should be uncorrelated to local demand shifter in the period 2000-2008, especially those a�ecting
relative changes in employment of women that are not observable. Second, the distributions of immigrants across
regions in 1991 must be correlated to regional �ows in the 2000-2008, because of network e�ects. This ideas
is strongly supported by the broad empirical evidence on the tendency of newly-arrived immigrants to cluster
in areas which are highly populated by immigrants from the same country following pre-established networks
(Aslund (2005) and Damm (2009) provide two examples for Sweden, Cutler et al. (2008) for the US). Table
9In the Data section we describe in greater detail both the data used for the implementation of the instrument and the sampleof selected immigrants.
8

3 shows the predictive power of the instrument using the aggregate region-time regression of the dependent
variable on the imputed share de�ned in (2). In the �rst speci�cation we do not include any other control, in
speci�cation (2) we include region and year e�ects, relying therefore on the within region change over time;
in speci�cation (3) we add controls for the average regional level of the variables included in the individual
speci�cation. Finally in speci�cation (4) we control for the regional female and male unemployment rate. The
coe�cient estimates show that the instrument is a strong predictor of the share of immigrants, implying that
the historical (1991) distribution of immigrants by nationality is a good predictor of their later in�ow.
In the individual regressions (1) that we estimate beginning in section 5 we include not only immigrants
as share of the population, but also the interaction of this variable with female and old-parent dummies. In
the estimation we consider also these interactions as potentially endogenous and we instrument them with the
imputed share (2) interacted with those same dummies. We end up with four endogenous variables and four
instruments and the joint F-statistic of the instruments is somewhat weak. Hence we also perform a reduced
form regression, in which we enter directly the IV and the IV interacted with �female� and �old parents� as
explanatory variables. All Tables of results reported below, show the predictive power of the instrument, by
reporting the �rst stage joint F-statistics of the instruments and, for the main results, we also report the
estimates of the reduced-form regressions, where we include the imputed immigration rate and its interaction
directly in the regression.
4 Data: Description and Summary Statistics
Our empirical analysis relies on three di�erent sources of data. The Survey on Household Income and Wealth
(SHIW for brevity) provides all the individual variables; the administrative registry includes data on the total
resident and immigrant population and the 1991 Census data has the information needed to compute the regional
distribution of immigrants as of 1991 used to construct the instrument as described in (2).
The SHIW survey, which has been run since 1965 by the Bank of Italy on a large and representative random
sample of the Italian population is the main source of data. The latest available wave is for year 2010.10
Until 1987, the sample was only cross-sectional, whereas since 1989, the survey has introduced a sub-sample of
panel households. Every two years, the survey gathers information on about 8,000 households corresponding
to about 24,000 individuals and provides data about the income, wealth, work-related and sociodemographic
characteristics of family members. Since 1993, a special section has been devoted to collecting information
about the family background of the head of the household and his/her spouse. Detailed information is provided
about non coresident living parents, their age, their highest attained educational level and their occupation at
10Despite being available we cannot use the last year 2010 because the information of the parental living status - crucial for ouranalysis - is not available.
9

the time when they were the same age as the respondent.
When analyzing retirement decisions as dependent variable, we use the information provided by the survey
on the planned retirement age. Individuals are asked the following question: �At what age do you expect to
retire? � The information on the planned retirement age has been available since the year 1989 for all waves.
The survey also elicits information about the expected replacement rate at the time of retirement by asking the
following question: �Think about when you will retire, and consider your public pension only (that is, exclude
private pensions, if you have them). At the time of retirement, what fraction of your labor income will your
public pension be? � This question is only available for the following years: 1989, 1991 and all years between
2000 and 2008. The current replacement rate and the replacement rate at time of planned retirement allow us
to calculate the option value of delaying retirement,11 which we use as an explanatory variable in regression
(1). The planned retirement age turns out to be a good proxy for the actual retirement age; the correlation
coe�cient between the two variables is equal to 0.727, the average value of their di�erence is 0.615, whereas
the median value of the di�erence is equal to 0. In addition to the planned retirement age we also consider
di�erent measures of labor supply. Accordingly we consider three di�erent variables: a binary indicator for
working or not, the logarithm of hours worked per week, and a binary indicator for working full-time versus
working part-time.
The second source of data, represented by the residential registry data, includes information on the resident
native and immigrant population at the regional level, by country of origin. This source of data serves two
purposes in our empirical analysis: �rst we use it to compute the immigration share by region, the explanatory
variable of interest.12 Second, we use the total number of resident immigrants by year and country of origin to
compute the term Imct used to construct the instrument.
As we do not have information about the skill level of the immigrants, in order to focus on immigration that
mainly brings low-skilled workers in Italy, we limit our measures to immigrants who were born outside Western
Europe and North America. This choice is supported by the evidence about the distribution of education by
country of origin provided by the EULFS (European Labor Force Survey). By using this data relative to years
2005-200813 we see that in Italy immigrants from EU15 and from North America are the most educated. 35%
of EU15 immigrants and 57% of North America immigrants have high (tertiary) education relative to only 14%
of Italians. For the construction of the instrument, we disaggregate the immigrant population according to
groups of countries of origin. Similarity in cultures and traditions drives the tendency to locate in the same
areas (Aslund, 2005; Cutler et al., 2008; Damm, 2009). We categorize immigrants into the following �ve macro-
regions: Asia; Africa; Latin America; Eastern Europe (non-EU) and others. The 1991 Census of population is
11For the details of its computation see the Appendix.12This number may underestimate the total presence of immigrants as it is not compulsory to be registered for immigrants. It
has been estimated that Registry data account for about 88% of immigrants regularly present in Italy (ISTAT) and the correlationwith total number across regions is very high.
13Before 2005 the classi�cation of country of origin only distinguishes between EU-15 and non EU-15 countries.
10

the third source of data that we use to compute the historical regional distribution of immigrants as of 1991
and to implement our instrument. Table 2 reports the immigrant population share by region and over time; the
table reveals that there is substantial variation of the immigrant share of the population both by region and
time, and there are no outliers potentially a�ecting the estimates.
Given the broad empirical evidence that immigrants represent the largest share of workers employed in the
long-term care sector (80% in 2008; INPS) and that 31% of immigrant workers are employed in low-skilled
occupations (LFS, 2008), a large in�ow of immigrants, as measured by an increase in the immigrant share of
the population, could have a substantial impact on the local labor supply for the household services sector.
At the same time immigration can a�ect labor supply decisions of family through its e�ect on local wages
(Gavosto et al., 1999; Romiti, 2011; Sta�olani and Valentini, 2010). It is very likely however, that the labor
market channel a�ects the labor supply of all workers, while the �rst channel a�ects mainly women, who are
the main providers of household services, and in particular women with elderly parents. By including in (1) the
interaction of the dummy female and of the presence of elderly parents with the share of immigrants we aim to
isolate such an e�ect.
The sample used in the analysis includes native heads of household and their spouses 45 to 70 years old. For
the regressions explaining retirement age we include all employed workers. To estimate the e�ects on the labor
supply we also include unemployed, stay-at-home individuals and retired individuals. This implies that the
sample on which we estimate labor supply decision is larger than the one used to estimate expected retirement
age. The �planned retirement� sample consists of a panel of 7,876 observations and 1,561 individuals, 40 percent
of whom are women (Table 4 reports the summary statistics for the variables included in the analysis).14 The
average planned retirement age is 61, and immigrants represent 4% of the regional population. Only 4 percent of
the sample is eligible for a seniority pension. This percentage rises to 14 percent when we restrict the analysis to
workers 55 years and older. 56 percent of the sample is employed in white collar types of jobs (including teachers,
o�ce workers, and junior managers), whereas 5 percent of them work as managers, university Professors, or in
other similarly high skilled jobs. The share of persons with tertiary education (13.8%) is in line with the average
value for the Italian population 14.4% (2008, EUROSTAT). Almost 40 percent of individuals have at least one
old living (non coresident) parent or parent in law.15 Table 5 shows the evolution of the planned retirement age
for men and women over the years. In the Table we distinguish individuals with and without elderly parents.
Focusing on the age group over 55, we see that women have increased their planned retirement age by a year or
more between 2000 and 2008, while men have experienced no change. Moreover, the increase in retirement age
14All descriptive statistics are weighted by using the survey sampling weights.15The presence of co-resident parents or parents in law can be identi�ed for the head of household, only in 2008 we have this
information for both partners. However only 1 percent of the 2008 sample live with an old parent.
11
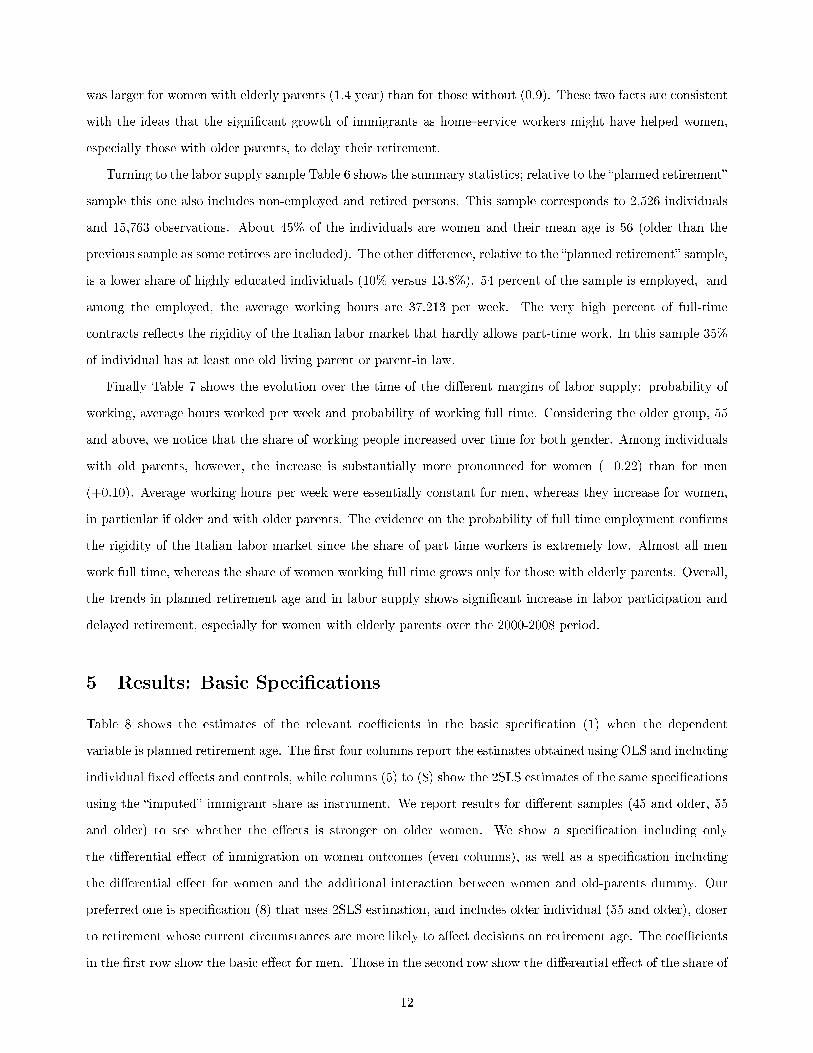
was larger for women with elderly parents (1.4 year) than for those without (0.9). These two facts are consistent
with the ideas that the signi�cant growth of immigrants as home�service workers might have helped women,
especially those with older parents, to delay their retirement.
Turning to the labor supply sample Table 6 shows the summary statistics; relative to the �planned retirement�
sample this one also includes non-employed and retired persons. This sample corresponds to 2,526 individuals
and 15,763 observations. About 45% of the individuals are women and their mean age is 56 (older than the
previous sample as some retirees are included). The other di�erence, relative to the �planned retirement� sample,
is a lower share of highly educated individuals (10% versus 13.8%). 54 percent of the sample is employed, and
among the employed, the average working hours are 37.213 per week. The very high percent of full-time
contracts re�ects the rigidity of the Italian labor market that hardly allows part-time work. In this sample 35%
of individual has at least one old living parent or parent-in law.
Finally Table 7 shows the evolution over the time of the di�erent margins of labor supply: probability of
working, average hours worked per week and probability of working full time. Considering the older group, 55
and above, we notice that the share of working people increased over time for both gender. Among individuals
with old parents, however, the increase is substantially more pronounced for women (+0.22) than for men
(+0.10). Average working hours per week were essentially constant for men, whereas they increase for women,
in particular if older and with older parents. The evidence on the probability of full time employment con�rms
the rigidity of the Italian labor market since the share of part time workers is extremely low. Almost all men
work full time, whereas the share of women working full time grows only for those with elderly parents. Overall,
the trends in planned retirement age and in labor supply shows signi�cant increase in labor participation and
delayed retirement, especially for women with elderly parents over the 2000-2008 period.
5 Results: Basic Speci�cations
Table 8 shows the estimates of the relevant coe�cients in the basic speci�cation (1) when the dependent
variable is planned retirement age. The �rst four columns report the estimates obtained using OLS and including
individual �xed e�ects and controls, while columns (5) to (8) show the 2SLS estimates of the same speci�cations
using the �imputed� immigrant share as instrument. We report results for di�erent samples (45 and older, 55
and older) to see whether the e�ects is stronger on older women. We show a speci�cation including only
the di�erential e�ect of immigration on women outcomes (even columns), as well as a speci�cation including
the di�erential e�ect for women and the additional interaction between women and old-parents dummy. Our
preferred one is speci�cation (8) that uses 2SLS estimation, and includes older individual (55 and older), closer
to retirement whose current circumstances are more likely to a�ect decisions on retirement age. The coe�cients
in the �rst row show the basic e�ect for men. Those in the second row show the di�erential e�ect of the share of
12

immigrants on women's planned retirement age. Those in the third row show whether the presence of old parents
a�ected the impact of immigrants on the men's retirement decisions. Those in the fourth row show the additional
e�ect of immigrants on planned retirement age of women with living old parents (80 years and older). Each
regression also includes individual �xed e�ects, the dummy �Old parents�, and its interaction with the female
dummy, an indicator for living parents being old and low income, the predicted Option Value of retirement for
the person, the logarithm of net wealth of the family, a dummy for eligibility in seniority pension, a dummy for
having an employed partner, dummies for educational attainment, occupational dummies, a dummy for marital
status, age, age squared and year dummies. Since we are interested in the di�erential e�ect of immigrants
on women's retirement, we mainly concentrate on the coe�cients γ1 and γ2 from equation (1) reported in the
second and in the fourth row of Table 8. As the main explanatory variable, the share of immigrants in the region,
only varies by region and year we cluster the standard errors by region to correct for the potential correlation
between errors across individuals within a region.
Focusing on the 2SLS results of Table 8 we see that the immigration share of the population in the region
increases signi�cantly planned retirement age, for women relative to men. Women over 55 in a region where
immigration grew by one percent of the population increased their planned retirement age by one third of one
year, vis-a-vis similar men. For women over 45 the relative increase was a sixth of one year. The share of
immigrants in the region, on the other hand, had a negative e�ect on men's retirement age (the main e�ect),
implying that possibly the labor market competition or complementarity e�ects of immigrants pushed native
males to reduce their planned retirement age. When considering the speci�cation that includes the additional
regressors indicating the presence of old parents and their interactions with gender and immigrant share we �nd
that the positive impact of immigration on females' planned retirement age remains unchanged for women over
45. However, considering the older age bracket (55 and older) in the last column of Table 8 we see that most
of the positive e�ect on women retirements comes through the e�ect on women with older parents. Since the
burden of care for older parents may emerge more clearly later in life and individuals make more precise plans
for retirement when approaching retirement age, focusing on older respondents may increase the precision of
the estimates. For the older sample, not only the immigrant share of the population has a larger impact on
women's planned retirement age in the basic speci�cation, but that e�ect is mainly due to women with older
parents. These are interesting and new results. Immigration may allow women to delay retirement, especially
when those women have to care for an older parent. Men's decisions overall are less a�ected by the regional
immigration share (and if anything the main e�ect is negative). These results seem consistent with the idea
that immigrants, especially less educated, are good substitute to the services otherwise provided by women in
the household. Their presence reduces the incentives for women to retire early. The OLS speci�cations provide
similar results with lower coe�cients suggesting that omitted regional variables (such as working opportunities
13
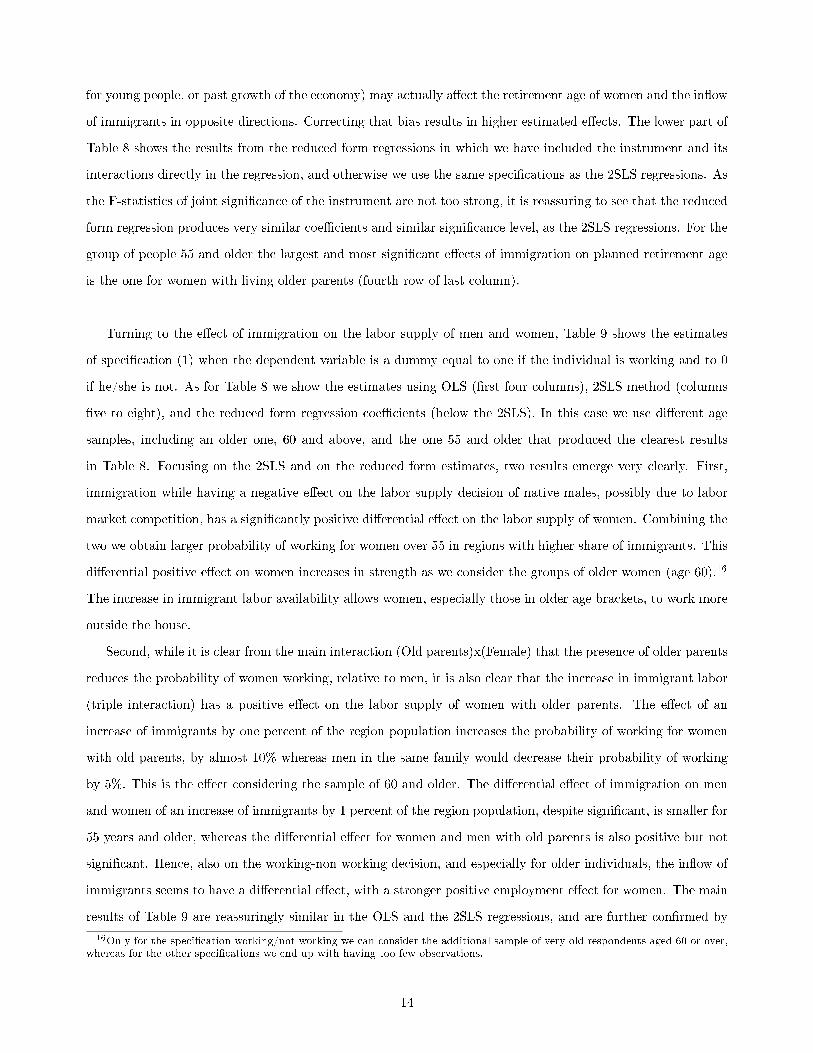
for young people, or past growth of the economy) may actually a�ect the retirement age of women and the in�ow
of immigrants in opposite directions. Correcting that bias results in higher estimated e�ects. The lower part of
Table 8 shows the results from the reduced form regressions in which we have included the instrument and its
interactions directly in the regression, and otherwise we use the same speci�cations as the 2SLS regressions. As
the F-statistics of joint signi�cance of the instrument are not too strong, it is reassuring to see that the reduced
form regression produces very similar coe�cients and similar signi�cance level, as the 2SLS regressions. For the
group of people 55 and older the largest and most signi�cant e�ects of immigration on planned retirement age
is the one for women with living older parents (fourth row of last column).
Turning to the e�ect of immigration on the labor supply of men and women, Table 9 shows the estimates
of speci�cation (1) when the dependent variable is a dummy equal to one if the individual is working and to 0
if he/she is not. As for Table 8 we show the estimates using OLS (�rst four columns), 2SLS method (columns
�ve to eight), and the reduced form regression coe�cients (below the 2SLS). In this case we use di�erent age
samples, including an older one, 60 and above, and the one 55 and older that produced the clearest results
in Table 8. Focusing on the 2SLS and on the reduced form estimates, two results emerge very clearly. First,
immigration while having a negative e�ect on the labor supply decision of native males, possibly due to labor
market competition, has a signi�cantly positive di�erential e�ect on the labor supply of women. Combining the
two we obtain larger probability of working for women over 55 in regions with higher share of immigrants. This
di�erential positive e�ect on women increases in strength as we consider the groups of older women (age 60).16
The increase in immigrant labor availability allows women, especially those in older age brackets, to work more
outside the house.
Second, while it is clear from the main interaction (Old parents)x(Female) that the presence of older parents
reduces the probability of women working, relative to men, it is also clear that the increase in immigrant labor
(triple interaction) has a positive e�ect on the labor supply of women with older parents. The e�ect of an
increase of immigrants by one percent of the region population increases the probability of working for women
with old parents, by almost 10% whereas men in the same family would decrease their probability of working
by 5%. This is the e�ect considering the sample of 60 and older. The di�erential e�ect of immigration on men
and women of an increase of immigrants by 1 percent of the region population, despite signi�cant, is smaller for
55 years and older, whereas the di�erential e�ect for women and men with old parents is also positive but not
signi�cant. Hence, also on the working-non working decision, and especially for older individuals, the in�ow of
immigrants seems to have a di�erential e�ect, with a stronger positive employment e�ect for women. The main
results of Table 9 are reassuringly similar in the OLS and the 2SLS regressions, and are further con�rmed by
16Only for the speci�cation working/not working we can consider the additional sample of very old respondents aged 60 or over,whereas for the other speci�cations we end up with having too few observations.
14

the reduced form regression.
We then move to analyze the e�ects of immigrants on the other margins of labor supply. The upper part of
Table 10 shows the estimated coe�cients, when the dependent variable is the average hours worked per week.
The di�erent columns show the OLS and 2SLS estimates, for the 45 and older or 55 and older samples including
or not the double and triple interactions. The lower part of the Table shows the same speci�cations when the
dependent variable is a dummy for working full time. In these regressions we do not �nd any signi�cant e�ect
of the immigrant share of the population on hours worked and on their gender di�erential. The presence of old
parents in the family does not contribute either to the e�ect of immigrants on women's hours supply. We �nd,
however, some evidence of an e�ect of immigration on the probability that women with older parents switch
from part time to full time employment. All speci�cations (OLS and 2SLS) show a positive e�ect of immigration
on the probability that women with older parents switch to full time (triple interaction). The e�ect is signi�cant
in three out of four speci�cations although relatively small in size. The very small variation of hours worked by
older workers in Italy and of the probability of part-time, due to relatively rigid contractual agreements in the
Italian labor market, may explain the lack or the small magnitude of the response of these variables capturing
the intensive variation of labor supply.
In order to have an idea of the magnitudes of the estimated e�ects, we summarized them in Table 14 which is
reported in section 6. In that Table we summarize the e�ects of a 1 point increase in immigration as percentage
of population on women outcomes relative to men's and on the additional e�ect on outcomes for women with old
parents. The Table shows, essentially, the coe�cients γ1 and γ2 from equation (1) multiplied by a change in the
immigrant share of 0.01. We use the 2SLS estimates for these calculations and we include only e�ects based on
estimates whose signi�cance level is larger then 5%. The top row of Table 14 shows the magnitudes calculated
for the whole sample (based on estimates of Tables 8 to 10). The remaining rows report the magnitude of the
e�ects for di�erentiated groups, based on the analysis that we present in the next section. One point increase in
regional immigrants as percentage of the population increases planned retirement age for women by 2.2 months
relative to men in the same conditions. In the same regions the retirement date of women is delayed by 4.2
months - compared to that men - for older women with old parents. The overall increase in planned retirement
age for women older than 45 is about 4 months in response to the observed increase in immigration (4.7pp)
between 2000 and 2008. This explains about 18% of the 1.7 year increase in planned retirement age observed for
women during that period. As for the other outcomes, in response to an increase in immigration of a percentage
point of population, the probability of working for women 45 years and older increases by 4 percentage points
relative to men. It increases by 9 percentage points for women 55 and older relative to the men in the same
age group. Immigration rises the probability of working for the group of women 60 and older by 16 percentage
points compared to men, and an additional 9 percentage points for women with older parents. The absolute
15

e�ect on women 45 years and older is less than 1 percentage point, and it increases to 2 and 5 percentage points
for older women, whereas the oldest group with old parents increased employment probability by 9 percentage
points in absolute terms, due to immigration. In order to understand the relevance of these numbers, we need
to compare them to the descriptive evidence, which reports that the labor supply for women 45 years and older
increases by 20 percentage points (by 22pp for women older than 55), and by 21 percentage points (and 22pp
for 55 and older) for women with old parents. Therefore, using these estimated coe�cients, the 4.7 points rise of
immigrants as percentage of population occurred over the period 2000-2008 has been responsible for an increase
of 3 percentage points in the labor supply of women 45 and older equivalent to 16 percent of the observed 20pp
increase), and for 9 percentage points in the labor supply of women 55 and older (equivalent to 39 percent of
the observed 23pp increase).
6 Heterogeneous e�ects by household characteristics
The e�ect of immigrants on the retirement age and labor supply of individuals may be di�erent depending
on their characteristics. The potential wage that they can earn if they work, relative to the cost of hiring
an immigrant as house worker, will a�ect the sensitivity of their labor supply and retirement decisions to the
availability of home care. Hence individuals with di�erent skills (earning potential) and wealth (ability to
pay) can be a�ected di�erentially by the local availability of immigrant labor. We explore the heterogeneity
of the impact of immigration by separating individuals with di�erent levels of initial education and wealth.
We begin by replicating the previous empirical analysis separately for high and low educated individuals and
then separately for individuals with high and low wealth. Table 11 shows the estimates by education group for
planned age of retirement (Top panel) and for probability of working (Bottom panel) as dependent variables.
Beginning with the breakdown by education groups, we de�ne as highly educated those with at least a high
school diploma. We use this de�nition, as opposed to the more standard one based on tertiary education,
because in Italy only about 10 to 13% of the individuals in the considered age range had a college education. In
our sample more than 40% of the individuals had a high school diploma. Considering planned age of retirement
as outcome, it is evident that the main results are driven, mainly, by the response of less educated women.
Highly educated women, aged 45 and above, increase their planned retirement age in response to immigration
but to a lower extent than the less educated ones. When considering the older group (55 years and above) the
di�erence is even stronger: no signi�cant e�ect of increased immigration is identi�ed on retirement decision of
more educated women, while less educated women increase signi�cantly their planned retirement age and the
e�ect is even stronger for less educated women with an older parent. These results are mirrored by the results
on the probability of working (bottom panel); a positive and signi�cant impact of immigration is found only for
women and it turns out that both high and low educated women increase their probability of working, even if
16

this impact is substantially higher and more signi�cant for less educated ones (in particular for the sample 55
years and older). As for the other two dimensions of the labor supply (weekly working hours and full time/part
time, not reported in the Table), the positive e�ect found for women 45 and older on the probability to switch
to full time position is driven by low educated women with old parents. Similarly low educated old women with
old parents also respond to immigration by increasing signi�cantly their working time per week, while highly
educated ones do not.17
We then split the sample according to the wealth of the household. Each respondent's household is classi�ed
as �below median wealth� if his/her household net asset worth lies below the median value of the distribution,
it is classi�ed as �above median wealth� if his/her household wealth is above the median. Table 12 shows the
estimates for each sub-group. We see that for retirement decisions (Top panel) the impact of immigrants is
entirely driven by women in household with below-median wealth. In particular, the older sample with old
parents shows a very large and signi�cant e�ect of the triple interaction, denoting that women in low-wealth
families with elderly parents are the group most a�ected by immigrants in their retirement decisions. Very
interesting, and also reasonable, is that the simple presence of older parents has a strong and negative e�ect on
the planned retirement age of women, only in �low wealth� households. The scenario is less clear-cut when we
consider the e�ect of immigration on women's labor supply. Both poor and rich women respond to increased
immigration by increasing their labor supply. However the e�ect is stronger for women with old parents who
are in low wealth households.
In order to translate the coe�cients of Tables 11 and 12 into e�ects of an increase in immigrant share by 0.01,
the lower part of Table 14 shows the e�ect of immigration on women's planned retirement age and labor supply,
separately by education and wealth. Relative to men in similar conditions low educated women delay their
planned retirement age by almost 3 months as a results of a 1 point rise in the regional migrants as percentage
of the population. This e�ect, however is only signi�cant at the 10% level and not reported in Table 14. The
delay, however, increases to 8 months for older women (55 and above) with no elderly relatives, and to 7 months
for older low educated women with old parents. As for the highly educated the gain corresponds to almost
2 months and it is only limited to the younger group. Similarly, women in low wealth households, increase
retirement age by 4 months (8 months if older) in comparison to similar men in response to a one percentage
point increase in the immigrant percentage of population. To the contrary the increase in planned retirement
for low-wealth women with old parents is more than 1 year relative to similar men. As for the probability of
working we �nd very close results between low educated and low-wealth women. They increase their probability
of working by 5 percentage points in response to one extra point in the immigration share, relative to similar
men. If old parents are alive, low-wealth or less educated women increase their probability of working by 6
17The results relevant to working hours and full time are not reported in the paper but are available upon request.
17

additional percentage points. At the same time high-wealth women seem to bene�t more than high educated
ones from immigration in comparison to men since they increase their labor supply between 3 percentage points
(if younger) and 11 percentage points (if older).
These results taken together suggest that women with lower income and wealth are those mostly a�ected by
the availability of inexpensive household-care possibilities brought by immigrants. While wealthier families may
respond less to the cost of care in their retirement decisions, poorer ones and especially women who provide
the house care services, are sensitive to such price. More immigration makes care a�ordable and available
encouraging women of less wealthy families to continue working. A�ordable home care may entice poorer
women to work, while richer ones can a�ord care and work in the labor market even when it is more expensive.
7 Robustness Checks
Omitted local factors, potentially biasing our estimates are speci�c local labor market conditions. If the demand
for women workers is correlated with immigration this can cause a bias. We already control for time invariant
factors, a�ecting men and women di�erently, through our FE strategy. However there might still be some un-
accounted time-variant factors, which could a�ect our estimation. The �rst series of robustness check addresses
this issue. A second issue, related to measurement errors of immigrant labor, is linked to the fact that we use
an imperfect measure of the presence of immigrants in the country. We are not considering illegal immigrants
nor unregistered legal ones. It has been estimated that Registry data represent 88% of the total stock of immi-
grants regularly present (ISTAT, 2005). Undocumented immigrants, however, are completely unaccounted in
our measure. Therefore we perform a correction for this potential mismeasurement by exploiting data from the
2002 Amnesty that pushed several undocumented immigrants to reveal themselves.
To control for gender-speci�c local labor market conditions we include two variables. First the presence of
a daughter between 18 and 35 years old in the household. This may signal weak labor market conditions for
women, or also an attitude of the family favoring stay at home women. In either case this can be correlated
with the local labor conditions for immigrants and hence their in�ow. Additionally we account for local demand
conditions by including both the female and male regional unemployment rate (Table 13, various columns). By
comparing the results with and without the additional controls we can see that the main �nding for retirement
(Top panel, Table 13) and probability of working (Bottom panel, Table 13) are robust to the inclusion of these
controls. The second robustness check introduces a correction to account for undocumented immigrants using
the information provided by the Amnesty of 2002.18 As of January 2004, 647,000 immigrants were regularized
18The law regulating the Amnesty was enacted in October 2002; the law introduced a period for the request of a permit up toNovember 2003. For this reason we compare the stock of regularized immigrants with resident ones as of 1 January 2004.
18

by receiving a residence permit (ISTAT, 2005) thanks to the 2002 Amnesty. We thus exploit these information
in order to estimate the approximate share of irregular immigrants by region which we use to correct the stock
of immigrants that we are using to calculate shares in our empirical analysis. The factor is computed as follows:
we �rst take the stock of residence permits released by regions and we divide this measure of regional irregulars
by the stock of resident immigrants19 using the Registry data - our measure of immigration. This calculation
provides us with a measure of the irregular immigrants relative to the stock of regular ones by region. This
measure has a mean value of 31%. We thus correct our regional stock of resident immigrants using this share.
The corrected measure of immigration rate has a mean value of 5% and it is 1 percentage point higher than our
original measure. In Table 13 (columns 4 and 8) we compare the results from the original measure of immigration
with the ones obtained from the correction.20 The main results are con�rmed in terms of signi�cance and sign.
The only di�erence is that the coe�cients become somewhat lower in magnitude after the correction is applied.
As the variation across regions is increased when including the undocumented, the lower coe�cients produce
essentially the same e�ect of a change in the explanatory variable by one standard deviation. The fact that
the estimates are robust to controlling for undocumented is in line with what has been found by Bianchi et al.
(2012), which looks at the impact of immigration on crime in Italy. The authors consider the residence permits
as main measure of immigration and they correct the latter exploiting data from di�erent Amnesties. While
their method is more sophisticated than ours as they use data from several amnesties, they con�rm that there
is an extremely high correlation in immigrant shares across regions and over time, when including or when not
including undocumented immigrants.
8 Conclusion
Italy, among OECD countries, showed some demographic and immigration tendencies during the last decade
that are typical of most rich countries. First, the ratio of its old to young population has increased rapidly.
Similarly, life expectancy and the associated need for assistance of older people has grown. The retirement and
labor supply decisions of their daughters, who have contributed to provide care, have been a�ected by this.
Women, and particularly those with older parents and in poor households, were the group most likely a�ected
by the increasing burden of long-term care. In the same years immigration from non-EU countries has grown.
The presence of immigrant labor and its specialization in home-care has been a potentially important substitute
for women's work at home. Families could hire a�ordable and available care-takers among immigrants and
hence the women's option to continue participating to employment was increased.
19Since the resident permits do not count children under age 18, we try to replicate the analysis excluding minors from theresident immigrant population, and the reported results remain robust.
20Only the results for the full speci�cation (equation 1) on retirement and working/not working outcomes are reported, howeverthe results for the other two outcomes are consistent with the ones shown.
19

Our results show that the in�ow of immigrants in the local labor market caused women to delay their
retirement and to increase their labor supply, relative to men. In addition, among women the most a�ected
groups are those with older parents, low education and low wealth. Since in a traditional context such as Italy
the women are those mainly responsible for the household production, our results can be explained considering
immigrants as substitutes for women, especially as care takers of the elderly. Allowing a larger in�ow of
immigrants in these jobs may help women work longer, and would help especially those with low wealth and
hence in larger need of the labor income from working outside of the house.
20

References
Aslund, O. (2005). Now and forever? Initial and subsequent location choices of immigrants. Regional Science
and Urban Economics, 35(2):141�165.
Barone, G. and Mocetti, S. (2011). With a little help from abroad: The e�ect of low-skilled immigration on the
female labour supply. Labour Economics, 18(5):664�675.
Belloni, M. and Alessie, R. (2009). The importance of �nancial incentives on retirement choices: New evidence
for Italy. Labour Economics, 16(5):578�588.
Belloni, M. and Alessie, R. (2013). Retirement choices in Italy: What an option value model tells us. Oxford
Bulletin of Economics and Statistics, 75(4):499�527.
Bianchi, M., Buonanno, P., and Pinotti, P. (2012). Do immigrants cause crime? Journal of the European
Economic Association, 10(6):1318�1347.
Blangiardo, G. and Cesareo, V. (2009). Indici di integrazione. Un'indagine emnpirica sulla realta' migratoria
italiana. Franco Angeli Editore.
Bolin, K., Lindgren, B., and Lundborg, P. (2008). Your next of kin or your own career?: Caring and working
among the 50+ of Europe. Journal of Health Economics, 27(3):718�738.
Borella, M. and Moscarola, F. C. (2010). Microsimulation of pension reforms: behavioural versus nonbehavioural
approach. Journal of Pension Economics and Finance, 9(04):583�607.
Borjas, G. J. (2003). The labor demand curve is downward sloping: Reexamining the impact of immigration
on the labor market. The Quarterly Journal of Economics, 118(4):1335�1374.
Borjas, G. J., Grogger, J., and Hanson, G. H. (2008). Imperfect substitution between immigrants and natives:
A reappraisal. Working Paper 13887, National Bureau of Economic Research.
Brugiavini, A. and Peracchi, F. (2004). Micro-modeling of retirement behavior in Italy. In Social Security Pro-
grams and Retirement around the World: Micro-Estimation, NBER Chapters. National Bureau of Economic
Research, Inc.
Burda, M., Hamermesh, D., and Weil, P. (2008). The distribution of total work in the EU and in US. In
Working Hours and Job Sharing in the EU and USA: Are Europeans Lazy? Or Americans Crazy?, Boeri, T.,
Burda, M. and, Kramarz F. Oxford University Press.
Card, D. (1990). The impact of the mariel boatlift on the Miami labor market. Industrial and Labor Relations
Review, 43(2):245�257.
21

Card, D. (2001). Immigrant in�ows, native out�ows, and the local labor market impacts of higher immigration.
Journal of Labor Economics, 19(1):22�64.
Card, D. (2009a). How Immigration A�ects U.S. Cities, pages 158 � 200. Princeton University press.
Card, D. (2009b). Immigration and inequality. American Economic Review, 99(2):1�21.
Carmichael, F. and Charles, S. (1998). The labour market costs of community care. Journal of Health Economics,
17(6):747 � 765.
Carmichael, F. and Charles, S. (2003). The opportunity costs of informal care: does gender matter? Journal
of Health Economics, 22(5):781�803.
Chan, S. and Stevens, A. H. (2004). Do changes in pension incentives a�ect retirement? a longitudinal study
of subjective retirement expectations. Journal of Public Economics, 88(7-8):1307�1333.
Cortès, P. and Pan, J. (2013). Outsourcing household production: Foreign domestic workers and native labor
supply in Hong Kong. Journal of Labor Economics, 31(2):pp. 327�371.
Cortès, P. and Tessada, J. (2011). Low-skilled immigration and the labor supply of highly skilled women.
American Economic Journal: Applied Economics, 3(3):88 � 123.
Crespo, L. and Mira, P. (2010). Caring for parents and employment of European mature women. Working
Papers wp2010_1007, CEMFI.
Cutler, D. M., Glaeser, E. L., and Vigdor, J. L. (2008). When are ghettos bad? lessons from immigrant
segregation in the United States. Journal of Urban Economics, 63(3):759�774.
Damm, A. (2009). Determinants of recent immigrants' location choices: quasi-experimental evidence. Journal
of Population Economics, 22(1):145�174.
D'Amuri, F., Ottaviano, G. I., and Peri, G. (2010). The labor market impact of immigration in Western
Germany in the 1990. European Economic Review, 54(4):550�570.
Dustmann, C., Fabbri, F., and Preston, I. (2005). The impact of immigration on the British labour market.
Economic Journal, 115(507):F324�F341.
Ettner, S. L. (1996). The opportunity costs of elder care. The Journal of Human Resources, 31(1):189�205.
Farrè, L., Gonzalez, L., and Ortega, F. (2011). Immigration, family responsibilities and the labor supply of
skilled native women. B.E. Journal of Economic Analysis and Policy: Contributions to Economic Analysis
and Policy, 11(1):1�48.
22

Gavosto, A., Venturini, A., and Villosio, C. (1999). Do immigrants compete with natives? Labour, 13(3):603�
621.
Gruber, J. and Wise, D. A. (2004). Social Security Programs and Retirement around the World: Micro-
Estimation. NBER Books. National Bureau of Economic Research, Inc.
ISTAT (2005). Gli stranieri in Italia: gli e�etti dell'ultima regolarizzazione.
Kolodinsky, J. and Shirey, L. (2000). The impact of living with an elder parent on adult daughter's labor supply
and hours of work. Journal of Family and Economic Issues, 21:149�175.
Lamura, G., Mnich, E., Nolan, M., Wojszel, B., Krevers, B., Mestheneos, L., and Döhner, H. (2008). Family
carers' experiences using support services in Europe: Empirical evidence from the Eurofamcare study. The
Gerontologist, 48(6):752�771.
Manacorda, M., Manning, A., and Wadsworth, J. (2012). The impact of immigration on the structure of wages:
Theory and evidence from Britain. Journal of the European Economic Association, 10(1):120�151.
Marenzi, A. and Pagani, L. (2008). The labor market participation of sandwich generation Italian women.
Journal of Family and Economic Issues, 29(3):427�444.
Ottaviano, G. I. P. and Peri, G. (2012). Rethinking the e�ect of immigration on wages. Journal of the European
Economic Association, 10(1):152�197.
Peri, G. (2007). Immigrants' complementarities and native wages: Evidence from California. NBER Working
Papers 12956, National Bureau of Economic Research, Inc.
Peri, G. and Sparber, C. (2011). Highly educated immigrants and native occupational choice. Industrial
Relations: A Journal of Economy and Society, 50(3):385�411.
Romiti, A. (2011). Immigrants-natives complementarities in production: evidence from Italy. Cerp working
papers, Center for Research on Pensions and Welfare Policies, Turin (Italy).
Samwick, A. A. (1998). New evidence on pensions, social security, and the timing of retirement. Journal of
Public Economics, 70(2):207�236.
Sta�olani, S. and Valentini, E. (2010). Does immigration raise blue and white collar wages of natives? the case
of Italy. Labour, 24(3):295�310.
Stock, J. H. and Wise, D. A. (1990). Pensions, the Option Value of Work, and Retirement. Econometrica,
58(5):1151�1180.
23

Venturini, A. and Villosio, C. (2006). Labour market e�ects of immigration into Italy: An empirical analysis.
International Labour Review, 145(1-2):91�118.
Wolf, D. A. and Soldo, B. J. (1994). Married women's allocation of time to employment and care of elderly
parents. The Journal of Human Resources, 29(4):1259�1276.
24
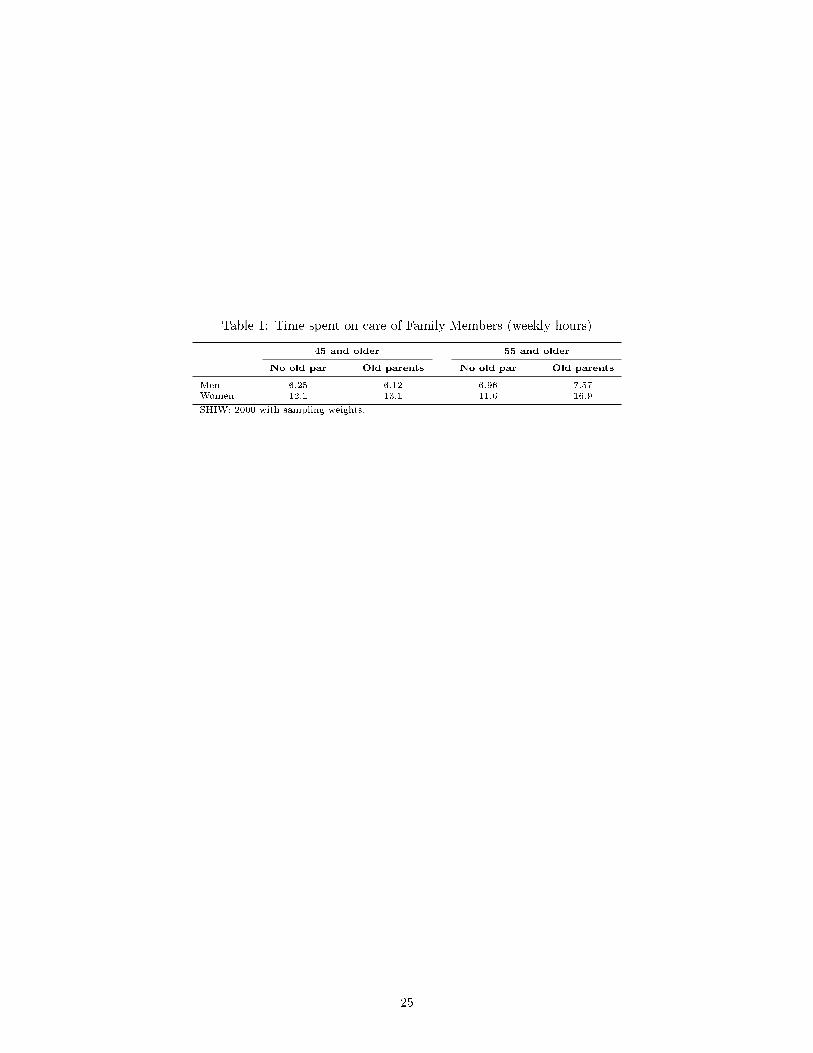
Table 1: Time spent on care of Family Members (weekly hours)
45 and older 55 and older
No old par Old parents No old par Old parents
Men 6.25 6.12 6.96 7.57Women 12.1 13.1 11.6 16.9
SHIW: 2000 with sampling weights.
25

Table 2: Distribution of Immigrants by Regions and Year
2000 2008 Total
Piemonte 0.023 0.080 0.045Valle d'Aosta 0.017 0.059 0.039Lombardia 0.034 0.097 0.059Trentino 0.025 0.077 0.047Veneto 0.029 0.098 0.063Friuli 0.025 0.078 0.043Liguria 0.020 0.062 0.036Emilia 0.031 0.104 0.060Toscana 0.028 0.083 0.048Umbria 0.031 0.098 0.056Marche 0.026 0.086 0.042Lazio 0.039 0.082 0.049Abruzzo 0.017 0.053 0.029Molise 0.006 0.022 0.013Campania 0.009 0.022 0.013Puglia 0.008 0.017 0.011Basilicata 0.005 0.019 0.011Calabria 0.009 0.028 0.016Sicilia 0.013 0.022 0.015Sardegna 0.006 0.016 0.011
Total 0.023 0.070 0.040
Source: Registry data, 2000-2008.
26
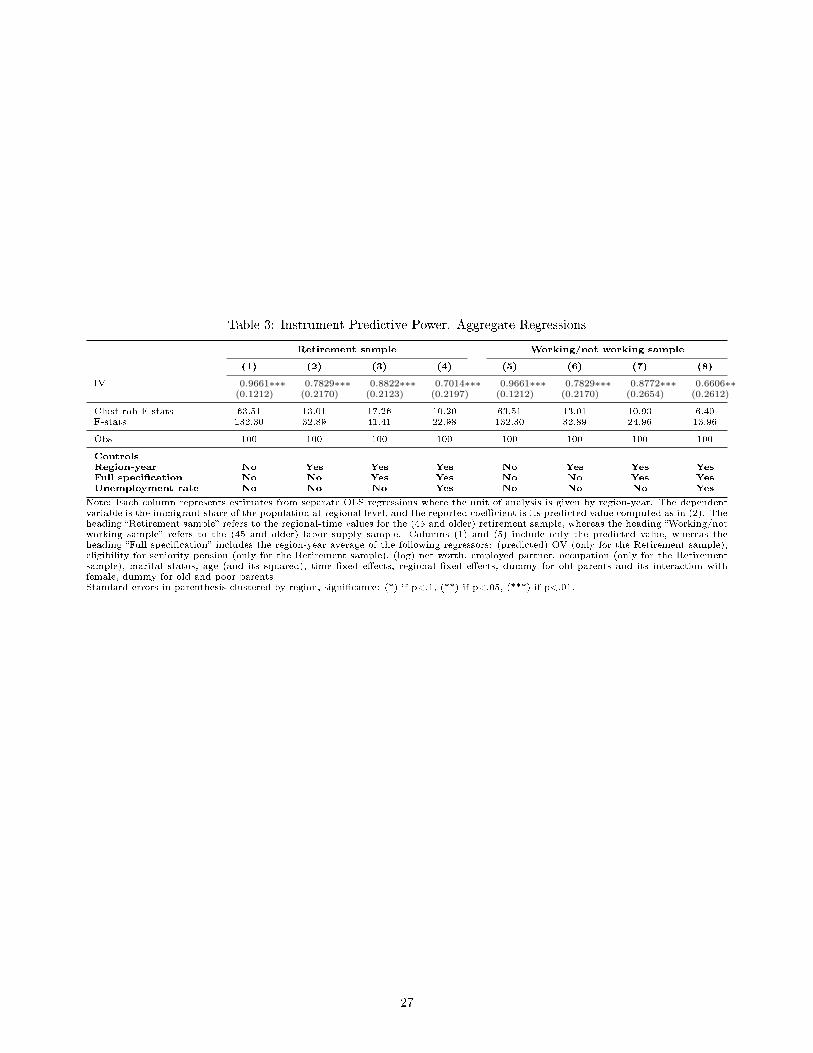
Table 3: Instrument Predictive Power. Aggregate Regressions
Retirement sample Working/not working sample
(1) (2) (3) (4) (5) (6) (7) (8)
IV 0.9661∗∗∗ 0.7829∗∗∗ 0.8822∗∗∗ 0.7014∗∗∗ 0.9661∗∗∗ 0.7829∗∗∗ 0.8772∗∗∗ 0.6606∗∗(0.1212) (0.2170) (0.2123) (0.2197) (0.1212) (0.2170) (0.2654) (0.2612)
Clust-rob F stats 63.51 13.01 17.26 10.20 63.51 13.01 10.93 6.40F-stats 132.30 32.89 41.41 22.98 132.30 32.89 24.96 13.96
Obs 100 100 100 100 100 100 100 100
ControlsRegion-year No Yes Yes Yes No Yes Yes YesFull speci�cation No No Yes Yes No No Yes YesUnemployment rate No No No Yes No No No Yes
Note: Each column represents estimates from separate OLS regressions where the unit of analysis is given by region-year. The dependentvariable is the immigrant share of the population at regional level, and the reported coe�cient is its predicted value computed as in (2). Theheading �Retirement sample� refers to the regional-time values for the (45 and older) retirement sample, whereas the heading �Working/notworking sample� refers to the (45 and older) labor supply sample. Columns (1) and (5) include only the predicted value, whereas theheading �Full speci�cation� includes the region-year average of the following regressors: (predicted) OV (only for the Retirement sample),eligibility for seniority pension (only for the Retirement sample), (log) net worth, employed partner, occupation (only for the Retirementsample), marital status, age (and its squared), time �xed e�ects, regional �xed e�ects, dummy for old parents and its interaction withfemale, dummy for old and poor parents.Standard errors in parenthesis clustered by region, signi�cance: (*) if p<.1, (**) if p<.05, (***) if p<.01.
27
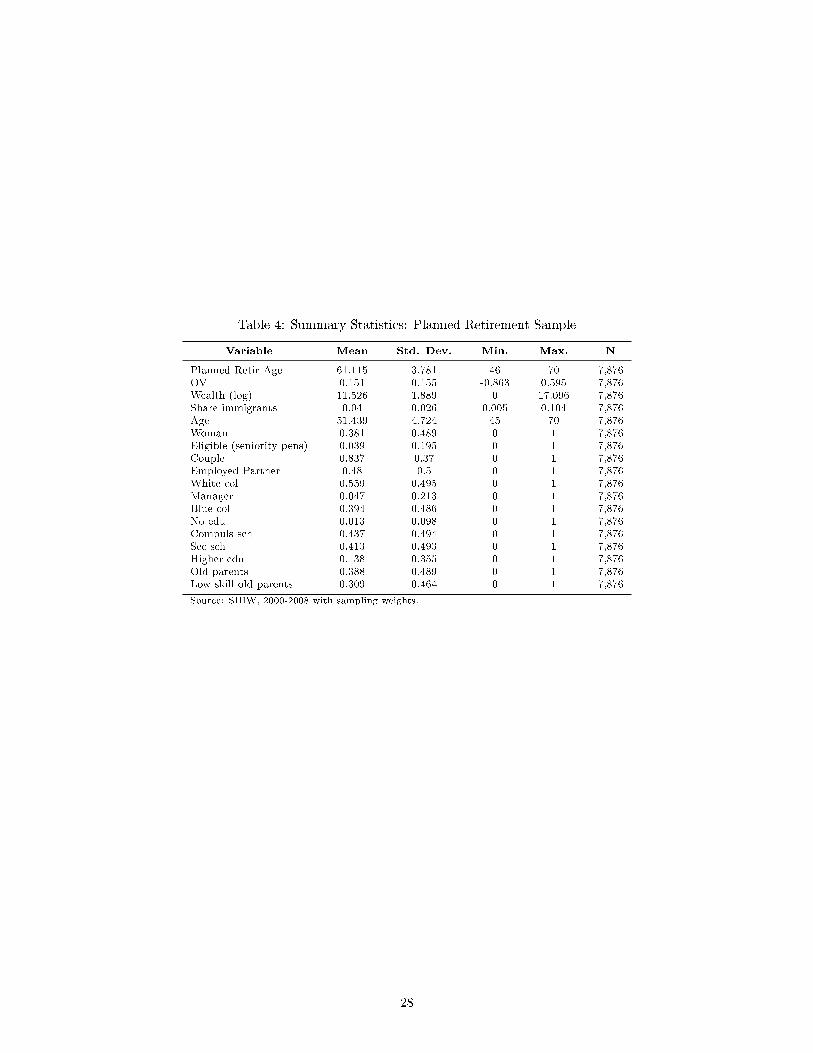
Table 4: Summary Statistics: Planned Retirement Sample
Variable Mean Std. Dev. Min. Max. N
Planned Retir Age 61.115 3.781 46 70 7,876OV 0.151 0.155 -0.863 0.595 7,876Wealth (log) 11.526 1.889 0 17.096 7,876Share immigrants 0.04 0.026 0.005 0.104 7,876Age 51.439 4.724 45 70 7,876Woman 0.381 0.489 0 1 7,876Eligible (seniority pens) 0.039 0.195 0 1 7,876Couple 0.837 0.37 0 1 7,876Employed Partner 0.48 0.5 0 1 7,876White col 0.559 0.495 0 1 7,876Manager 0.047 0.213 0 1 7,876Blue col 0.394 0.486 0 1 7,876No edu 0.013 0.098 0 1 7,876Compuls sch 0.437 0.494 0 1 7,876Sec sch 0.413 0.493 0 1 7,876Higher edu 0.138 0.355 0 1 7,876Old parents 0.388 0.489 0 1 7,876Low skill old parents 0.309 0.464 0 1 7,876
Source: SHIW, 2000-2008 with sampling weights.
28

Table 5: Planned Retirement Age
45 and older 55 and older
Men Women Men Women
No old Old No old Old No old Old No Oldparents parents parents parents parents parents parents parents
2000 61.2 60.3 60.1 59.3 63.4 62.4 60.8 60.92002 61.7 60.9 60.3 59.8 63.2 61.8 61.7 61.12004 62.2 61.5 60.5 60.2 63.0 62.1 61.4 61.52006 62.0 61.6 60.9 60.4 63.1 62.0 62.3 60.32008 62.8 62.3 61.7 61.3 63.5 62.7 61.7 62.3
SHIW: 2000-2008 with sampling weights.
29

Table 6: Summary statistics: Labor Supply Sample
Variable Mean Std. Dev. Min. Max. N
Labor supply (Working/not working) 0.541 0.499 0 1 15,763Labor supply (Weekly hrs) 37.213 8.338 3 65 8,407Full Time 0.927 0.259 0 1 8,453Wealth (log) 11.521 2.01 0 17.096 15,763Share immigrants 0.038 0.025 0.005 0.104 15,763Age 55.666 7.119 45 70 15,763Woman 0.452 0.499 0 1 15,763Couple 0.824 0.377 0 1 15,763Employed Partner 0.354 0.479 0 1 15,763No edu 0.034 0.173 0 1 15,763Compuls sch 0.554 0.498 0 1 15,763Sec sch 0.316 0.466 0 1 15,763Higher edu 0.096 0.303 0 1 15,763Old parents 0.345 0.477 0 1 15,763Low skilled old parents 0.281 0.451 0 1 15,763
Source: SHIW, 2000-2008 with sampling weights.
30

Table 7: Labor Supply
45 and older 55 and older
Men Women Men Women
No old Old No old Old No old Old No Oldparents parents parents parents parents parents parents parents
(1) (2) (3) (4) (5) (6) (7) (8)
Probability of working
2000 0.54 0.63 0.37 0.46 0.24 0.36 0.13 0.202002 0.53 0.66 0.39 0.53 0.23 0.37 0.11 0.212004 0.59 0.66 0.43 0.55 0.30 0.41 0.17 0.262006 0.57 0.67 0.48 0.58 0.28 0.43 0.22 0.342008 0.67 0.67 0.56 0.66 0.43 0.46 0.36 0.42
Weekly hours (conditional on working)
2000 39.4 39.7 33.9 33.3 38.3 37.5 35.1 30.62002 39.2 39.4 33.9 34.3 38.3 39.6 32.6 33.82004 39.1 39.2 33.9 33.8 38.8 39.6 34.3 33.42006 39.4 39.5 33.7 33.4 38.0 39.9 31.7 33.12008 39.9 39.3 34.4 34.4 38.9 39.6 30.9 35.0
Probability of full time (conditional on working)
2000 0.98 0.99 0.87 0.84 0.95 0.99 0.94 0.862002 0.98 0.98 0.85 0.85 0.95 0.96 0.84 0.782004 0.98 0.99 0.82 0.84 0.96 1.00 0.93 0.912006 0.98 0.99 0.83 0.82 0.98 0.99 0.85 0.832008 0.97 0.99 0.85 0.86 0.97 1.00 0.82 0.94
SHIW: 2000-2008 with sampling weights.
31

Table 8: The E�ect of Immigration on Planned Retirement Age
OLS 2SLS
45 and older 55 and older 45 and older 55 and older
Base Old Base Old Base Old Base Oldparents parents parents parents
(1) (2) (3) (4) (5) (6) (7) (8)
Share immigrants −0.084 −0.077 −0.230∗ −0.189 −0.115 −0.111 −0.321∗ −0.278(0.063) (0.071) (0.126) (0.116) (0.125) (0.116) (0.185) (0.181)
(Share immigrants)x(Female) 0.135∗∗ 0.140∗ 0.258∗∗ 0.175 0.181∗∗ 0.178∗∗ 0.305∗∗ 0.174(0.064) (0.075) (0.122) (0.131) (0.087) (0.083) (0.147) (0.143)
(Share immigrants)x(Old parents) −0.011 −0.170 0.001 −0.241(0.060) (0.120) (0.063) (0.149)
(Share immigrants)x(Old parents)x(Female) −0.010 0.207 0.015 0.347∗∗(0.091) (0.133) (0.105) (0.167)
Old parents 0.286 0.441 0.257 0.671(0.338) (0.655) (0.375) (0.725)
(Old parents)x(Female) −0.034 −0.415 −0.191 −0.872(0.411) (0.676) (0.477) (0.771)
Clust-rob F stats 6.489 3.248 9.670 4.814
Reduced Form
IV −0.126 −0.121 −0.280 −0.228(0.122) (0.112) (0.171) (0.167)
(IV)x(Female) 0.192∗∗ 0.188∗∗ 0.273∗ 0.133(0.087) (0.084) (0.141) (0.143)
(IV)x(Old parents) −0.000 −0.250∗(0.071) (0.141)
(IV)x(Old parents)x(Female) 0.017 0.357∗∗(0.116) (0.166)
Obs 4,267 4,267 842 842 4,267 4,267 842 842
Note: Each column shows estimates from separate regressions estimated using individual level data. The method of estimation is OLS or2SLS according to the heading. The dependent variable is planned retirement age. Each regression includes individual �xed e�ects andthe following controls: (predicted) OV, (log) net worth, eligibility for seniority pension, employed partner, occupation, education, maritalstatus, age (and its squared), time �xed e�ects. Additional regressors for the �Old parents� speci�cation: dummy for old parents andits interaction with female, dummy for old and poor parents. The variable �Share immigrants� as reported in descriptive tables has beenmultiplied by 100.Standard errors in parenthesis clustered by region, signi�cance: (*) if p<.1, (**) if p<.05, (***) if p<.01.
32
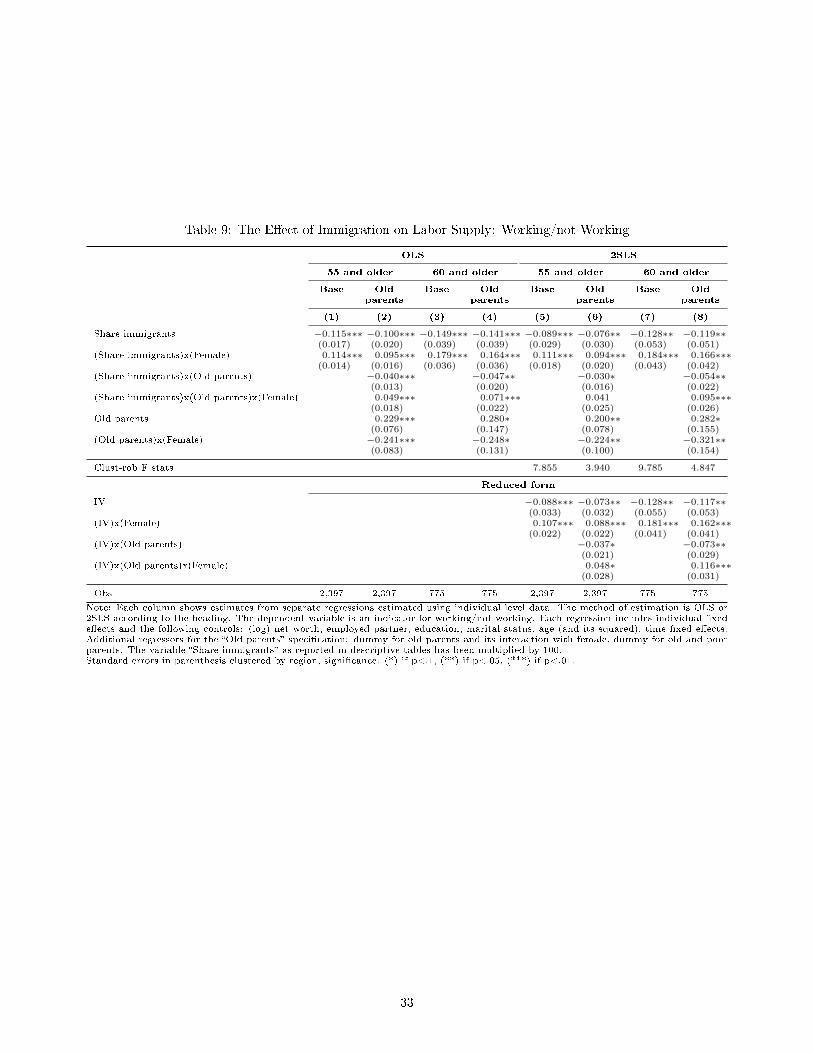
Table 9: The E�ect of Immigration on Labor Supply: Working/not Working
OLS 2SLS
55 and older 60 and older 55 and older 60 and older
Base Old Base Old Base Old Base Oldparents parents parents parents
(1) (2) (3) (4) (5) (6) (7) (8)
Share immigrants −0.115∗∗∗ −0.100∗∗∗ −0.149∗∗∗ −0.141∗∗∗ −0.089∗∗∗ −0.076∗∗ −0.128∗∗ −0.119∗∗(0.017) (0.020) (0.039) (0.039) (0.029) (0.030) (0.053) (0.051)
(Share immigrants)x(Female) 0.114∗∗∗ 0.095∗∗∗ 0.179∗∗∗ 0.164∗∗∗ 0.111∗∗∗ 0.094∗∗∗ 0.184∗∗∗ 0.166∗∗∗(0.014) (0.016) (0.036) (0.036) (0.018) (0.020) (0.043) (0.042)
(Share immigrants)x(Old parents) −0.040∗∗∗ −0.047∗∗ −0.030∗ −0.054∗∗(0.013) (0.020) (0.016) (0.022)
(Share immigrants)x(Old parents)x(Female) 0.049∗∗∗ 0.071∗∗∗ 0.041 0.095∗∗∗(0.018) (0.022) (0.025) (0.026)
Old parents 0.229∗∗∗ 0.280∗ 0.200∗∗ 0.282∗(0.076) (0.147) (0.078) (0.155)
(Old parents)x(Female) −0.241∗∗∗ −0.248∗ −0.224∗∗ −0.321∗∗(0.083) (0.131) (0.100) (0.154)
Clust-rob F stats 7.855 3.940 9.785 4.847
Reduced form
IV −0.088∗∗∗ −0.073∗∗ −0.128∗∗ −0.117∗∗(0.033) (0.032) (0.055) (0.053)
(IV)x(Female) 0.107∗∗∗ 0.088∗∗∗ 0.181∗∗∗ 0.162∗∗∗(0.022) (0.022) (0.041) (0.041)
(IV)x(Old parents) −0.037∗ −0.073∗∗(0.021) (0.029)
(IV)x(Old parents)x(Female) 0.048∗ 0.116∗∗∗(0.028) (0.031)
Obs 2,397 2,397 775 775 2,397 2,397 775 775
Note: Each column shows estimates from separate regressions estimated using individual level data. The method of estimation is OLS or2SLS according to the heading. The dependent variable is an indicator for working/not working. Each regression includes individual �xede�ects and the following controls: (log) net worth, employed partner, education, marital status, age (and its squared), time �xed e�ects.Additional regressors for the �Old parents� speci�cation: dummy for old parents and its interaction with female, dummy for old and poorparents. The variable �Share immigrants� as reported in descriptive tables has been multiplied by 100.Standard errors in parenthesis clustered by region, signi�cance: (*) if p<.1, (**) if p<.05, (***) if p<.01.
33

Table 10: The E�ect of Immigration on Labor Supply: Weekly Hours Worked and Full time/Part Time
OLS 2SLS
45 and older 55 and older 45 and older 55 and older
Base Old Base Old Base Old Base Oldparents parents parents parents
(1) (2) (3) (4) (5) (6) (7) (8)
Weekly working hours
Share immigrants −0.015∗∗∗ −0.016∗∗∗ −0.006 0.001 −0.011∗ −0.009 −0.006 0.003(0.004) (0.006) (0.017) (0.015) (0.006) (0.006) (0.019) (0.018)
(Share immigrants)x(Female) 0.001 −0.002 0.006 −0.004 0.000 −0.003 0.007 0.002(0.005) (0.006) (0.020) (0.020) (0.006) (0.006) (0.023) (0.019)
(Share immigrants)x(Old parents) 0.001 −0.012 −0.002 −0.016(0.005) (0.016) (0.004) (0.015)
(Share immigrants)x(Old parents)x(Female) 0.007 0.033 0.008 0.018(0.007) (0.024) (0.007) (0.028)
Old parents 0.027 0.184∗∗ 0.040∗∗ 0.194∗∗∗(0.020) (0.075) (0.019) (0.064)
(Old parents)x(Female) −0.044 −0.291∗ −0.048 −0.232(0.041) (0.153) (0.043) (0.162)
Clust-rob F stats 7.014 3.530 10.189 5.010
Obs 4,650 4,650 949 949 4,650 4,650 949 949
Full time/Part time
Share immigrants −0.003 −0.001 0.001 0.004 0.004 0.006 0.022 0.024(0.003) (0.003) (0.010) (0.009) (0.004) (0.005) (0.017) (0.017)
(Share immigrants)x(Female) 0.002 −0.004 −0.013 −0.021 0.001 −0.004 −0.014 −0.022(0.002) (0.003) (0.016) (0.017) (0.003) (0.004) (0.017) (0.017)
(Share immigrants)x(Old parents) −0.004∗∗ −0.011 −0.005∗ −0.009(0.002) (0.007) (0.003) (0.007)
(Share immigrants)x(Old parents)x(Female) 0.012∗∗∗ 0.024∗ 0.012∗∗ 0.024(0.005) (0.014) (0.006) (0.020)
Old parents 0.013 −0.005 0.014 −0.009(0.012) (0.055) (0.013) (0.055)
(Old parents)x(Female) −0.047 −0.071 −0.045 −0.082(0.029) (0.044) (0.031) (0.058)
Clust-rob F stats 6.921 3.479 10.151 4.990
Obs 4,679 4,679 952 952 4,679 4,679 952 952
Note: Each column shows estimates from separate regressions estimated using individual level data. The method of estimation is OLSor 2SLS according to the heading. The dependent variables are: (log) weekly hours of work conditional on working (Top panel) and anindicator for working full-time vs part-time conditional on working (Bottom panel). Each regression includes individual �xed e�ects andthe following controls: (log) net worth, employed partner, education, marital status, age (and its squared), time �xed e�ects. Additionalregressors for the �Old parents� speci�cation: dummy for old parents and its interaction with female, dummy for old and poor parents. Thevariable �Share immigrants� as reported in descriptive tables has been multiplied by 100.Standard errors in parenthesis clustered by region, signi�cance: (*) if p<.1, (**) if p<.05, (***) if p<.01.
34

Table 11: 2SLS-FE. The E�ect of Immigration on Planned Retirement Age and Working/not Working byEducation Level
45 and older 55 and older
High education Low education High education Low education
Base Old Base Old Base Old Base Oldparents parents parents parents
(1) (2) (3) (4) (5) (6) (7) (8)
Planned retirement age
Share immigrants 0.044 0.026 −0.242 −0.231 −0.072 −0.032 −0.727∗∗∗ −0.677∗∗∗(0.132) (0.144) (0.182) (0.152) (0.263) (0.273) (0.215) (0.197)
(Share immigrants)x(Female) 0.144∗∗ 0.173∗ 0.220 0.237∗ 0.105 0.082 0.737∗∗∗ 0.510∗∗(0.061) (0.091) (0.146) (0.122) (0.163) (0.160) (0.199) (0.205)
(Share immigrants)x(Old parents) 0.032 −0.007 −0.206 −0.324(0.070) (0.108) (0.143) (0.291)
(Share immigrants)x(Old parents)x(Female) −0.056 −0.018 −0.102 0.617∗∗(0.117) (0.115) (0.271) (0.296)
Old parents 0.026 0.487 0.773 1.038(0.323) (0.674) (0.817) (1.217)
(Old parents)x(Female) 0.142 −0.171 0.862 −2.562∗(0.569) (0.637) (1.097) (1.476)
Obs 2,207 2,207 2,204 2,204 462 462 375 375
Labor supply: Working/not working
Share immigrants −0.026 −0.023 −0.046∗∗∗ −0.046∗∗∗ −0.028 −0.020 −0.153∗∗∗ −0.130∗∗∗(0.018) (0.019) (0.014) (0.015) (0.048) (0.046) (0.040) (0.044)
(Share immigrants)x(Female) 0.010 0.016∗ 0.061∗∗∗ 0.059∗∗∗ 0.041∗ 0.041∗∗ 0.160∗∗∗ 0.135∗∗∗(0.010) (0.010) (0.011) (0.013) (0.021) (0.019) (0.030) (0.034)
(Share immigrants)x(Old parents) −0.006 −0.004 −0.038 −0.029(0.009) (0.007) (0.026) (0.021)
(Share immigrants)x(Old parents)x(Female) −0.009 0.014 −0.016 0.059∗∗(0.012) (0.012) (0.042) (0.024)
Old parents 0.007 0.117∗∗∗ 0.096 0.299∗∗∗(0.033) (0.044) (0.130) (0.097)
(Old parents)x(Female) 0.003 −0.141∗∗ −0.060 −0.354∗∗∗(0.048) (0.056) (0.153) (0.095)
Obs 2,880 2,880 4,213 4,213 804 804 1,566 1,566
Note: Each column shows estimates from separate regressions on two di�erent samples broken down by education level and estimatedusing individual level data. The method of estimation is 2SLS. The dependent variables are: planned retirement age (Top panel) and anindicator for working/not working (Bottom panel). Each regression includes individual �xed e�ects and the following controls: (log) networth, employed partner, education, marital status, age (and its squared), time �xed e�ects. Additional regressors for the �Old parents�speci�cation: dummy for old parents and its interaction with female, dummy for old and poor parents. Additional regressors includedonly for the planned retirement age speci�cation: (predicted) OV, eligibility for seniority pension, and occupation. The variable �Shareimmigrants� as reported in descriptive tables has been multiplied by 100.Standard errors in parenthesis clustered by region, signi�cance: (*) if p<.1, (**) if p<.05, (***) if p<.01.
35

Table 12: 2SLS-FE. The E�ect of Immigration on Planned Retirement Age and Working/not Working byWealth
45 and older 55 and older
Above median Below median Above median Below medianWealth Wealth Wealth Wealth
Base Old Base Old Base Old Base Oldparents parents parents parents
(1) (2) (3) (4) (5) (6) (7) (8)
Planned retirement age
Share immigrants −0.250 −0.157 −0.225 −0.270∗ −0.089 −0.056 −0.530∗∗ −0.510∗(0.222) (0.204) (0.145) (0.139) (0.427) (0.425) (0.241) (0.268)
(Share immigrants)x(Female) 0.064 0.049 0.363∗∗∗ 0.344∗∗∗ 0.057 0.049 0.679∗∗∗ 0.394(0.072) (0.081) (0.120) (0.127) (0.140) (0.177) (0.222) (0.260)
(Share immigrants)x(Old parents) −0.113 0.096 −0.127 −0.621∗(0.114) (0.072) (0.170) (0.353)
(Share immigrants)x(Old parents)x(Female) 0.016 0.089 −0.003 1.101∗∗∗(0.146) (0.090) (0.223) (0.368)
Old parents 1.041∗ −0.458 0.497 2.091(0.567) (0.438) (0.877) (1.462)
(Old parents)x(Female) −0.074 −1.098∗∗ 0.597 −4.150∗∗(0.652) (0.523) (1.092) (1.661)
Obs 1,874 1,874 1,871 1,871 375 375 364 364
Labor supply. Working/not working
Share immigrants −0.032∗∗ −0.032∗ −0.037∗∗ −0.041∗∗ −0.072 −0.071 −0.109∗∗∗ −0.097∗∗(0.016) (0.019) (0.016) (0.017) (0.050) (0.049) (0.039) (0.043)
(Share immigrants)x(Female) 0.033∗∗∗ 0.036∗∗∗ 0.053∗∗∗ 0.054∗∗∗ 0.106∗∗∗ 0.107∗∗∗ 0.132∗∗∗ 0.114∗∗∗(0.006) (0.007) (0.014) (0.016) (0.024) (0.026) (0.040) (0.042)
(Share immigrants)x(Old parents) −0.004 0.009 −0.002 −0.014(0.011) (0.008) (0.027) (0.030)
(Share immigrants)x(Old parents)x(Female) −0.001 −0.001 −0.018 0.071∗∗(0.010) (0.015) (0.027) (0.032)
Old parents 0.050 0.003 0.114 0.209∗∗(0.052) (0.051) (0.122) (0.106)
(Old parents)x(Female) −0.085∗ −0.022 −0.082 −0.273∗(0.052) (0.060) (0.099) (0.140)
Obs 3,179 3,179 3,166 3,166 1,063 1,063 1,059 1,059
Note: Each column shows estimates from separate regressions on two di�erent samples broken down by household wealth and estimatedusing individual level data. The method of estimation is 2SLS. The dependent variables are: planned retirement age (Top panel) and anindicator for working/not working (Bottom panel). Each regression includes individual �xed e�ects and the following controls: (log) networth, employed partner, education, marital status, age (and its squared), time �xed e�ects. Additional regressors for the �Old parents�speci�cation: dummy for old parents and its interaction with female, dummy for old and poor parents. Additional regressors includedonly for the planned retirement age speci�cation: (predicted) OV, eligibility for seniority pension, and occupation. The variable �Shareimmigrants� as reported in descriptive tables has been multiplied by 100.Standard errors in parenthesis clustered by region, signi�cance: (*) if p<.1, (**) if p<.05, (***) if p<.01.
36

Table 13: 2SLS-FE. Robustness. Control for Local Demand Factors, Daughters' Contribution to HouseholdServices, and Correction for Illegals
45 and older 55 and older
(1) (2) (3) (4) (5) (6) (7) (8)
Planned retirement age
Share immigrants −0.111 −0.137 −0.141 −0.088 −0.278 −0.266 −0.275 −0.233(0.116) (0.216) (0.220) (0.094) (0.181) (0.242) (0.242) (0.144)
(Share immigrants)x(Female) 0.178∗∗ 0.180∗∗ 0.169∗∗ 0.138∗∗ 0.174 0.170 0.201 0.136(0.083) (0.083) (0.080) (0.066) (0.143) (0.145) (0.158) (0.108)
(Share immigrants)x(Old parents) 0.001 0.010 0.009 0.000 −0.241 −0.241 −0.291∗ −0.197(0.063) (0.067) (0.067) (0.050) (0.149) (0.149) (0.169) (0.122)
(Share immigrants)x(Old parents)x(Female) 0.015 0.008 0.011 0.013 0.347∗∗ 0.345∗∗ 0.410∗∗ 0.277∗∗(0.105) (0.106) (0.106) (0.083) (0.167) (0.165) (0.163) (0.131)
Obs 4,267 4,267 4,267 4,267 842 842 842 842
Labor supply. Working/non working
Share immigrants −0.037∗∗∗ −0.034 −0.035∗ −0.029∗∗∗ −0.076∗∗ −0.068∗ −0.061 −0.059∗∗(0.013) (0.021) (0.021) (0.010) (0.030) (0.037) (0.039) (0.023)
(Share immigrants)x(Female) 0.044∗∗∗ 0.044∗∗∗ 0.045∗∗∗ 0.034∗∗∗ 0.094∗∗∗ 0.095∗∗∗ 0.091∗∗∗ 0.071∗∗∗(0.007) (0.007) (0.007) (0.005) (0.020) (0.019) (0.019) (0.015)
(Share immigrants)x(Old parents) −0.003 −0.003 −0.002 −0.003 −0.030∗ −0.029∗ −0.024 −0.024∗(0.006) (0.006) (0.006) (0.005) (0.016) (0.017) (0.018) (0.012)
(Share immigrants)x(Old parents)x(Female) −0.001 −0.001 −0.001 0.000 0.041 0.039 0.034 0.033∗(0.007) (0.007) (0.007) (0.005) (0.025) (0.025) (0.028) (0.019)
Obs 7,185 7,185 7,185 7,185 2,397 2,397 2,397 2,397
ControlsUnemployment rate No Yes Yes No No Yes Yes NoCoresident daughters No No Yes No No No Yes NoCorrection for illegals No No No Yes No No No Yes
Note: Each column shows estimates from separate regressions and estimated using individual level data. The method of estimation is 2SLS.The dependent variable are: planned retirement age (Top panel) and an indicator for working/not working (Bottom panel). In each columnwe add a di�erent control: contextual local labor market factors (male and female regional unemployment rate), potential contribution tofamily care from co-resident daughters (by including its indicator and its interaction with female), correction for illegals (as described insection 7). Each regression includes individual �xed e�ects and the following controls: (log) net worth, employed partner, education, maritalstatus, age (and its squared), time �xed e�ects. Additional regressors for the �Old parents� speci�cation: dummy for old parents and itsinteraction with female, dummy for old and poor parents. Additional regressors included only for the planned retirement age: (predicted)OV, eligibility for seniority pension, and occupation. The variable �Share immigrants� as reported in descriptive tables has been multipliedby 100.Standard errors in parenthesis clustered by region, signi�cance: (*) if p<.1, (**) if p<.05, (***) if p<.01.
37
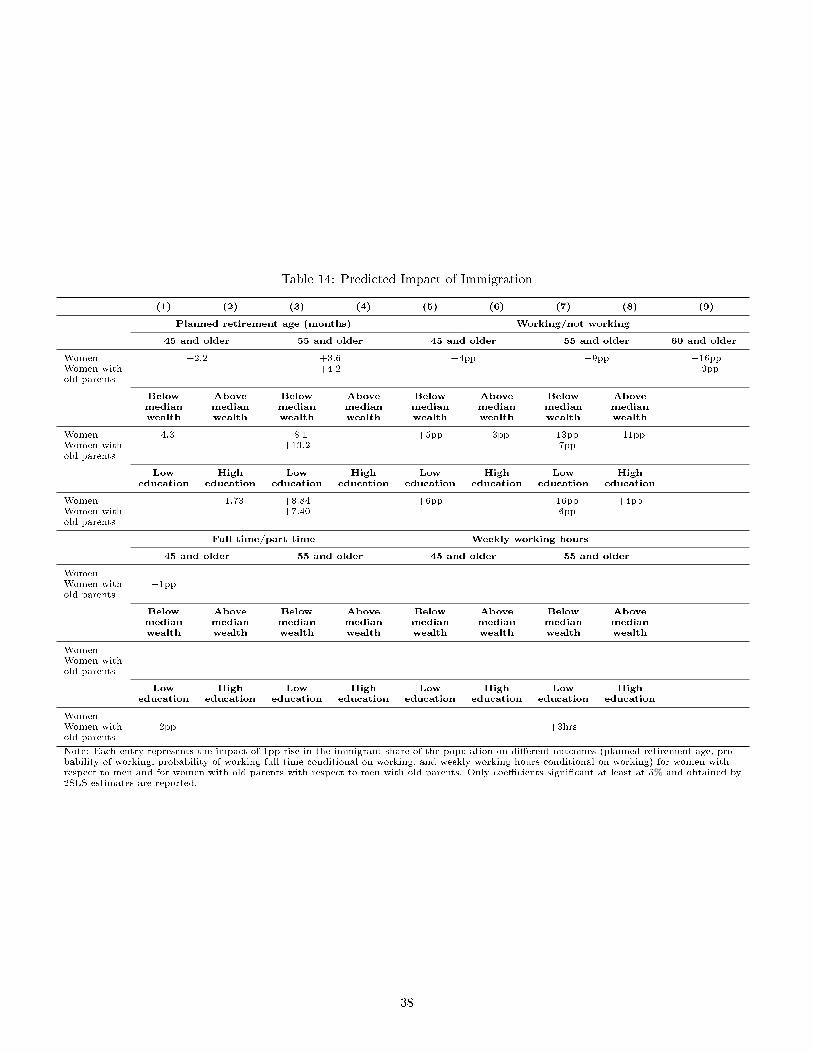
Table 14: Predicted Impact of Immigration
(1) (2) (3) (4) (5) (6) (7) (8) (9)
Planned retirement age (months) Working/not working
45 and older 55 and older 45 and older 55 and older 60 and older
Women +2.2 +3.6 +4pp +9pp +16ppWomen with +4.2 +9ppold parents
Below Above Below Above Below Above Below Abovemedian median median median median median median medianwealth wealth wealth wealth wealth wealth wealth wealth
Women +4.3 +8.1 +5pp +3pp +13pp +11ppWomen with +13.2 +7ppold parents
Low High Low High Low High Low Higheducation education education education education education education education
Women +1.73 +8.84 +6pp +16pp +4ppWomen with +7.40 +6ppold parents
Full time/part time Weekly working hours
45 and older 55 and older 45 and older 55 and older
WomenWomen with +1ppold parents
Below Above Below Above Below Above Below Abovemedian median median median median median median medianwealth wealth wealth wealth wealth wealth wealth wealth
WomenWomen withold parents
Low High Low High Low High Low Higheducation education education education education education education education
WomenWomen with +2pp +3hrsold parents
Note: Each entry represents the impact of 1pp rise in the immigrant share of the population on di�erent outcomes (planned retirement age, pro-bability of working, probability of working full time conditional on working, and weekly working hours conditional on working) for women withrespect to men and for women with old parents with respect to men with old parents. Only coe�cients signi�cant at least at 5% and obtained by2SLS estimates are reported.
38

Figure 1: Immigrant in�ow as share of the Population by Country of origin
0
.01
.02
.03
.04
2000 2003 2006 2009
EU 12 Eastern-Central EUAfrica AsiaCentral-South Ame OthersNorth Ame
Source: authors' calculation from registry data (2000-2010)
39

Appendix
A1. Theoretical appendix
We describe brie�y here a model in the spirit of Chan and Stevens (2004) that can be used to justify the role
of lowering the cost of caring for older parents on the retirement decision. It follows the Option Value approach
pioneered by Stock and Wise (1990). This model expands upon Chan and Stevens (2004) in two main respects:
we introduce the non separability between leisure and consumption and we enrich their model allowing for the
role of the long-term care costs related to parental care. As Stock and Wise (1990) and Chan and Stevens (2004)
our model is a modi�ed version of the standard life-cycle approach with a leisure enhancing factor entering the
utility function only after retirement. Individuals are assumed to maximize the following inter-temporal and
separable utility function, with a Constant Relative Risk Aversion (CRRA) form:
maxctU(ct, ct+1, ..., cT ) = maxct,ct+1..cT
R∑s=t
(cs)1−γ
(1 + ρ)s−t(1 − γ)+
T∑s=R+1
(kcs)1−γ
(1 + ρ)s−t(1 − γ)(3)
where c is consumption level, 1/γ is the inter-temporal elasticity of substitution, ρ is the subjective discount
rate, T the expected lifetime, and k > 1 is a factor enhancing utility when individuals enjoy free time. It
captures, in other words, the leisure in the utility function which we suppose the individual can enjoy if she/he
does neither work nor takes care of her/his parents. R is the age at which individuals retire and T is the end
of lifetime (known with certainty).
The inter-temporal budget constraint can be written as follows:
T∑s=t
cs(1 + r)s−t
= At +
R∑s=t
ys(1 + r)s−t
+
T∑s=R+1
Bs(1 + r)s−t
(4)
T∑s=t
cs(1 + r)s−t
= At +
R2∑s=t
ys(1 + r)s−t
+
T∑s=R2+1
B̄s(1 + r)s−t
−R2∑
s=R+1
ycs(1 + r)s−t
(5)
where y and B are labor income and pension bene�ts, respectively, At is the sum of real and �nancial wealth, and
r is the annual interest rate, supposed to be known and constant over time.21 After solving the maximization
problem,22 the relevant value function is the sum of �ows of future utility when consumption is chosen at its
optimal level:
Vt(R,At) =
(R∑s=t
ys +
T∑s=R+1
Bs +At
)1−γ(R− t+ 1 + k
1−γγ (T −R))γ
(1 − γ)
21Uncertainty is removed from the model by assuming that individuals know with certainty their expected end of life.22We assume here for simplicity r = ρ and equal to zero, though the general case with r 6= 0 provides the same testable implication
and it is available upon request.
40
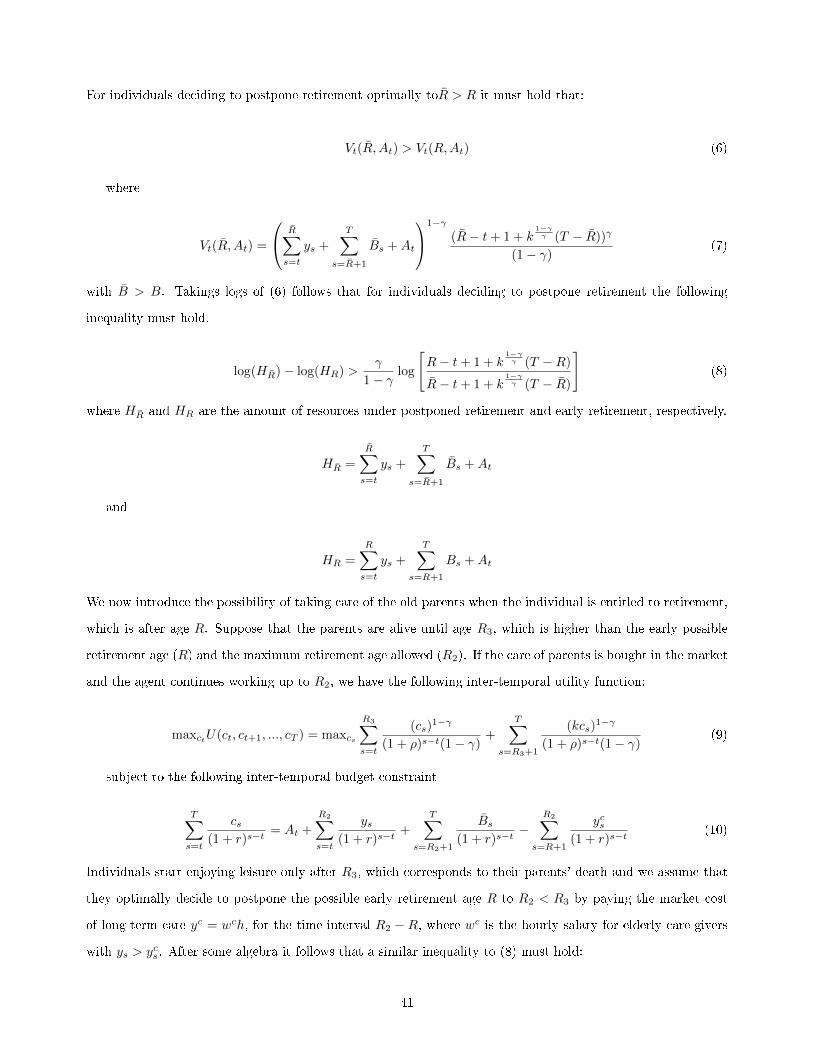
For individuals deciding to postpone retirement optimally toR̄ > R it must hold that:
Vt(R̄, At) > Vt(R,At) (6)
where
Vt(R̄, At) =
R̄∑s=t
ys +
T∑s=R̄+1
B̄s +At
1−γ(R̄− t+ 1 + k
1−γγ (T − R̄))γ
(1 − γ)(7)
with B̄ > B. Takings logs of (6) follows that for individuals deciding to postpone retirement the following
inequality must hold.
log(HR̄) − log(HR) >γ
1 − γlog
[R− t+ 1 + k
1−γγ (T −R)
R̄− t+ 1 + k1−γγ (T − R̄)
](8)
where HR̄ and HR are the amount of resources under postponed retirement and early retirement, respectively.
HR̄ =
R̄∑s=t
ys +
T∑s=R̄+1
B̄s +At
and
HR =
R∑s=t
ys +
T∑s=R+1
Bs +At
We now introduce the possibility of taking care of the old parents when the individual is entitled to retirement,
which is after age R. Suppose that the parents are alive until age R3, which is higher than the early possible
retirement age (R) and the maximum retirement age allowed (R2). If the care of parents is bought in the market
and the agent continues working up to R2, we have the following inter-temporal utility function:
maxctU(ct, ct+1, ..., cT ) = maxcs
R3∑s=t
(cs)1−γ
(1 + ρ)s−t(1 − γ)+
T∑s=R3+1
(kcs)1−γ
(1 + ρ)s−t(1 − γ)(9)
subject to the following inter-temporal budget constraint
T∑s=t
cs(1 + r)s−t
= At +
R2∑s=t
ys(1 + r)s−t
+
T∑s=R2+1
B̄s(1 + r)s−t
−R2∑
s=R+1
ycs(1 + r)s−t
(10)
Individuals start enjoying leisure only after R3, which corresponds to their parents' death and we assume that
they optimally decide to postpone the possible early retirement age R to R2 < R3 by paying the market cost
of long-term care yc = wch, for the time interval R2 − R, where wc is the hourly salary for elderly care-givers
with ys > ycs. After some algebra it follows that a similar inequality to (8) must hold:
41

log(HR̄) − log(HR) >γ
1 − γlog
[(R− t+ 1) + k
1−γγ (T −R)
(R3 − t+ 1) + k1−γγ (T −R3)
](11)
where
HR̄ =
R2∑s=t
ys +
T∑s=R2+1
B̄s +At −R2∑
s=R+1
ycs
and
HR =
R∑s=t
ys +
T∑s=R+1
Bs +At
The testable implication is derived by taking the �rst derivative of equation (11) with respect to the market
cost of long-term care, yc. The main intuition is that a reduction in the market cost of long term care has a
positive impact on the retirement age, as follows:
∂ log(HR̄) − log(HR)
∂yc= − 1(∑R2
s=t ys +∑Ts=R2+1 B̄s +At −
∑R2
s=R+1 ycs
) < 0
A2. OV, earnings, and pension bene�ts projection
Our measure of the OV is computed as the left hand side of equation (11), where HR̄, and (HR) are the sum
of life-time resources including the sums of net worth wealth, labor earnings, and pension bene�ts.23 In order
to compute the sum of life-time resources we need to recover individual life-expectancy. First we assume that
individuals know with certainty the expected end of their life, (T ) which we take for each respondent from
the life-tables, disaggregated by year, gender, age and geographic location (de�ned by �ve macro-regions and
provided by ISTAT). Second, for each worker we need to compute the expected pension bene�ts, B̄, thus we
need to project forward their earnings to the year before their expected retirement and to apply the expected
replacement rate. Therefore, individual earnings are projected forward up to the year prior to the expected
retirement, applying the constant growth rate of real earnings per capita corresponding to the last year in
which they featured in the sample. We compute the per capita (real) earning growth rate by using the growth
rate of earning at national level.24 In addition, in order to compute the pension bene�t in cases of immediate
retirement, B, we need to recover the expected replacement rate corresponding to the last year in which the
23Since we do not have information on wages, we cannot include the market cost of elderly care in HR̄. The immigration variableincluded in equation (1) controls for the impact of immigrants both on availability and on market cost of household services.
24For an alternative earnings projection strategy see Borella and Moscarola (2010) who model individual earnings pro�les byusing a regression model, which controls for age, cohort, regional and time dummies, plus and additional individual random e�ect,and with the error term following an AR(1) process.
42

individuals featured in the sample. However, the data provides only the expected replacement rate for the year
when the respondent expects to retire. We therefore predict the expected replacement rate using the following
regression:
yit = βzit + x′itγ +Dt + εit (12)
where yit is the expected replacement rate provided by the survey and zit represents the years of contributions
expected to be paid before retirement. In order to compute the latter variable, we use the information provided
by the survey regarding the number of years of contributions paid by workers at the time of the interview, and
we assume that each worker would pay contributions for the remaining years up to their expected retirement
age. xit is a vector of individual characteristics including gender, education, type of occupation and civil status,
Dt is a time dummy and εit is the standard zero-mean error term. We then use the coe�cients estimated in
equation (12) to predict the expected replacement rate corresponding to immediate retirement. This predicted
value is applied to the earnings corresponding to the penultimate year to recover the immediate bene�ts (B). In
the computation of HR̄ and HR, both B̄ and B are assumed to be constant. All �nancial values are expressed
in real terms, de�ated using the CPI-based index with base= 2005.
43