immunoassay screening of sediment cores for
TRANSCRIPT

In cooperation with the U.S. Environmental Protection Agency
Immunoassay Screening of Sediment Cores for Polychlorinated Biphenyls, Devil’s Swamp Lake Near Baton Rouge, Louisiana, 2004
Open-File Report 2004–1397
U.S. Department of the InteriorU.S. Geological Survey

Immunoassay Screening of Sediment Cores for Polychlorinated Biphenyls, Devil’s Swamp Lake Near Baton Rouge, Louisiana, 2004
By Peter C. Van Metre and Jennifer T. Wilson
U.S. Department of the InteriorU.S. Geological Survey
In cooperation with U.S. Environmental Protection Agency
Open-File Report 2004–1397
U.S. Department of the InteriorGale A. Norton, Secretary
U.S. Geological SurveyCharles G. Groat, Director
U.S. Geological Survey, Reston, Virginia: 2004For sale by U.S. Geological Survey, Information ServicesBox 25286, Denver Federal CenterDenver, CO 80225
For more information about the USGS and its products:Telephone: 1-888-ASK-USGSWorld Wide Web: http://www.usgs.gov/
Any use of trade, product, or firm names in this publication is for descriptive purposes only and does not implyendorsement by the U.S. Government.
Although this report is in the public domain, permission must be secured from the individual copyright owners toreproduce any copyrighted materials contained within this report.
Suggested citation:
Van Metre, P.C., and Wilson, J.T., 2004, Immunoassay screening of sediment cores for polychlorinated biphenyls, Devil’sSwamp Lake near Baton Rouge, Louisiana, 2004: U.S. Geological Survey Open-File Report 2004–1397, 10 p.

iii
Contents
Abstract . . . . . . . . . . . . . . . . . . . . . . . . . . . . . . . . . . . . . . . . . . . . . . . . . . . . . . . . . . . . . . . . . . . . . . . . . . . . . . . . . . . . . . . . . . . . . . . . . . . . 1Introduction . . . . . . . . . . . . . . . . . . . . . . . . . . . . . . . . . . . . . . . . . . . . . . . . . . . . . . . . . . . . . . . . . . . . . . . . . . . . . . . . . . . . . . . . . . . . . . . . . 1Sample Collection . . . . . . . . . . . . . . . . . . . . . . . . . . . . . . . . . . . . . . . . . . . . . . . . . . . . . . . . . . . . . . . . . . . . . . . . . . . . . . . . . . . . . . . . . . . 3Chemical Analysis . . . . . . . . . . . . . . . . . . . . . . . . . . . . . . . . . . . . . . . . . . . . . . . . . . . . . . . . . . . . . . . . . . . . . . . . . . . . . . . . . . . . . . . . . . 4Quality Assurance . . . . . . . . . . . . . . . . . . . . . . . . . . . . . . . . . . . . . . . . . . . . . . . . . . . . . . . . . . . . . . . . . . . . . . . . . . . . . . . . . . . . . . . . . . 5Estimation of Deposition Dates of Core Sediment . . . . . . . . . . . . . . . . . . . . . . . . . . . . . . . . . . . . . . . . . . . . . . . . . . . . . . . . . . . . 6Sediment Descriptions and Polychlorinated Biphenyl Concentrations . . . . . . . . . . . . . . . . . . . . . . . . . . . . . . . . . . . . . . . 6Summary . . . . . . . . . . . . . . . . . . . . . . . . . . . . . . . . . . . . . . . . . . . . . . . . . . . . . . . . . . . . . . . . . . . . . . . . . . . . . . . . . . . . . . . . . . . . . . . . . . . 7References . . . . . . . . . . . . . . . . . . . . . . . . . . . . . . . . . . . . . . . . . . . . . . . . . . . . . . . . . . . . . . . . . . . . . . . . . . . . . . . . . . . . . . . . . . . . . . . . . 7
Figures
1. Aerial images of Devil’s Swamp Lake near Baton Rouge, Louisiana, showing (a) lake in relation to surrounding features and (b) approximate locations of sites sampled October 5, 2004 . . . . . . . . . . . . . . . . . . . . . . . . . . . . . . . . . . . . . . . . . . . . . . . . . . . . . . . . . . . . . . . . . . . . . . . . . . . . . . . . . . . 2
2. Photograph of cores DSL.1 and DSL.2 split lengthwise for description and subsampling . . . . . . . . . . . 33. Photograph of core DSL.4 split lengthwise for description and subsampling . . . . . . . . . . . . . . . . . . . . . . . 34. Mosaic of photographs of core DSL.5, from Devil’s Swamp Lake near Baton Rouge,
Louisiana . . . . . . . . . . . . . . . . . . . . . . . . . . . . . . . . . . . . . . . . . . . . . . . . . . . . . . . . . . . . . . . . . . . . . . . . . . . . . . . . . . . . . . . . . 45. Photograph of the subsampling of core DSL.5 collected October 5, 2004, from Devil’s
Swamp Lake near Baton Rouge, Louisiana . . . . . . . . . . . . . . . . . . . . . . . . . . . . . . . . . . . . . . . . . . . . . . . . . . . . . . . . 56. Graphs showing trends of polychlorinated biphenyls (PCB) as determined with immunoassay
kits for samples collected October 5, 2004, from Devil’s Swamp Lake near Baton Rouge, Louisiana. . . . . . . . . . . . . . . . . . . . . . . . . . . . . . . . . . . . . . . . . . . . . . . . . . . . . . . . . . . . . . . . . . . . . . . . . . . . . . . . . . . . . . . . . . 6
Tables
1. Locations and characteristics of sediment sampling sites in and near Devil’s Swamp Lake, Louisiana, October 5, 2004 . . . . . . . . . . . . . . . . . . . . . . . . . . . . . . . . . . . . . . . . . . . . . . . . . . . . . . . . . . . . . . . . . . . . . . . . . 4
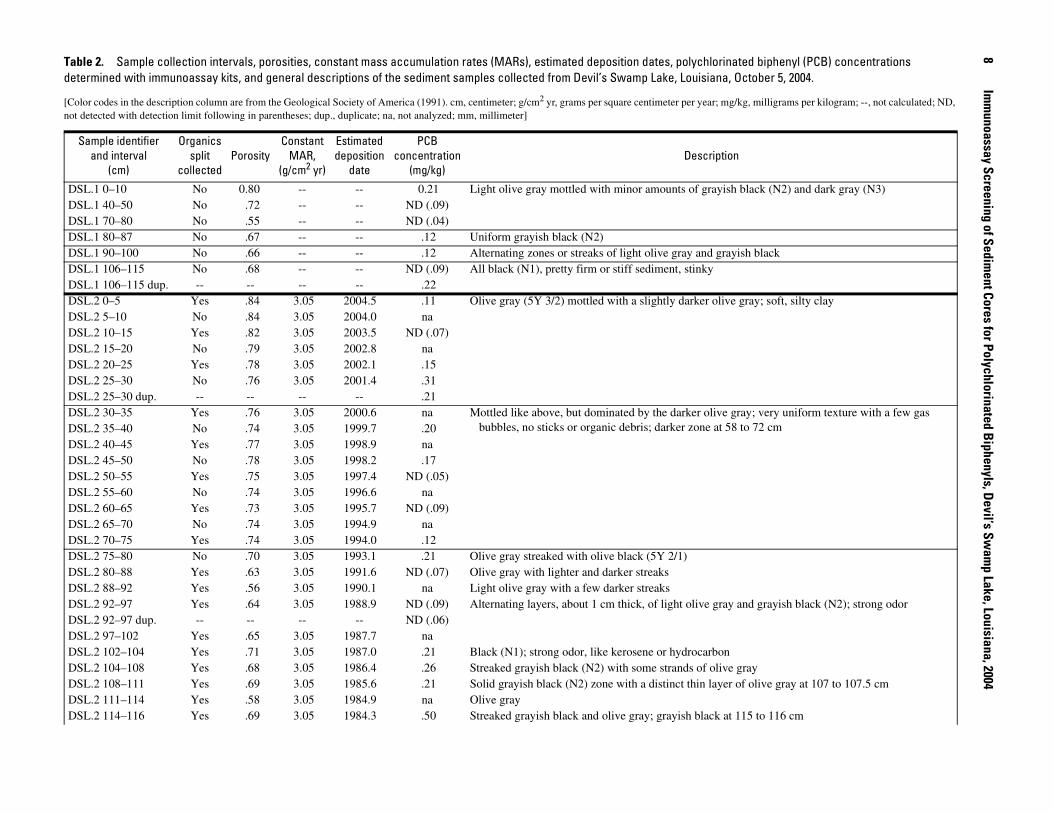
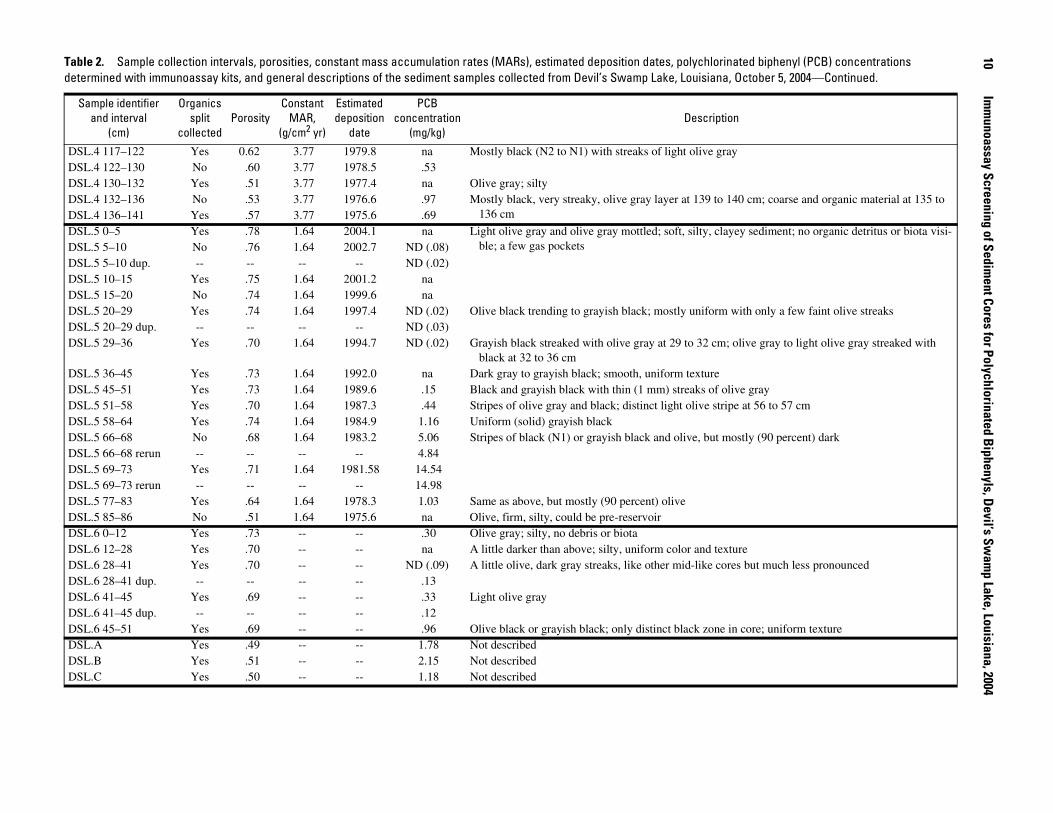
2. Sample collection intervals, porosities, constant mass accumulation rates (MARs), estimated deposition dates, polychlorinated biphenyl (PCB) concentrations determined with immunoassay kits, and general descriptions of the sediment samples collected from Devil’s Swamp Lake, Louisiana, October 5, 2004 . . . . . . . . . . . . . . . . . . . . . . . . . . . . . . . . . . . . . . . . . . . . . . . . . . . 8

Immunoassay Screening of Sediment Cores for Polychlorinated Biphenyls, Devil’s Swamp Lake Near Baton Rouge, Louisiana, 2004
Peter C. Van Metre and Jennifer T. Wilson
Abstract
Devil’s Swamp Lake near Baton Rouge, Louisiana, constructed by dredging in 1973 in Devil’s Swamp along the Mississippi River, is contaminated with polychlorinated biphenyls (PCBs). This study investigated the possible histori-cal contribution of PCBs from a hazardous-chemical disposal facility by way of a wastewater drainage ditch that operated from 1971 to 1993. Six sediment cores from the lake and three bottom-material samples from the drainage ditch were collected on October 5, 2004, and analyzed for PCBs using an immunoassay screening method. The results were used to eval-uate qualitatively the historical input record of PCBs to the lake. Deposition dates in three of the cores were estimated by assum-ing that penetration of the push corer was stopped by firmer, pre-lake materials that mark the 1973 subsurface level of dredg-ing. Sixty-one samples from five of the six cores and three bottom-material samples from the drainage ditch were ana-lyzed. PCBs were at higher concentrations in ditch bottom material (about 1.1 to 2.2 milligrams per kilogram) than in cores from sites near where the ditch enters the lake (about 0.1 to 1.0 milligrams per kilogram). The highest concentrations of PCBs (maximum about 15 milligrams per kilogram) were detected in lake-bottom sediment about 350 meters west of where the drainage ditch enters the lake. Detection rates and median PCB concentrations were higher in all of the dated core sediments deposited before about 1990 than after 1990.
Introduction
Polychlorinated biphenyls (PCBs) are a group of closely related organic compounds that are persistent in the environ-ment and strongly associated with sediments because of their low water solubility and affinity for lipids and organic carbon. Sediment contaminated with PCBs deposited in lakes and res-ervoirs can provide a historical record of PCB contamination in
the watershed. Sediment cores have been used to reconstruct water-quality histories in a variety of hydrologic and land-use settings (Davis, 1980). PCBs pose a threat to biota in aquatic systems because they are persistent, bioaccumulative, and toxic (U.S. Environmental Protection Agency, 1997).
Devil’s Swamp Lake is located on the northwest side of Baton Rouge, La., in Devil’s Swamp along the east bank of the Mississippi River (fig. 1). The approximately 26-hectare lake was constructed by dredging in 1973, with the material removed used to reinforce the levee along the north and west side of the Baton Rouge Harbor (U.S. Environmental Protection Agency, 2004). During flood conditions, the lake and surrounding swamp are inundated by water from the Mississippi River. A hazardous-chemical disposal (HCD) facility is located north-east of the lake. The HCD facility began operating in 1971 and discharged wastewater to the north end of Devil’s Swamp Lake by way of a drainage ditch. The ditch remained in use until 1993 when a discharge pipe to the Mississippi River was installed and permitted. Sediment samples collected in 1986 by the Louisiana Department of Environmental Quality (LDEQ) and the U.S. Environmental Protection Agency (USEPA) in Devil’s Swamp Lake and along the wastewater drainage ditch contained PCBs (U.S. Environmental Protection Agency, 2004).
The objective of this study, done by the U.S. Geological Survey (USGS) in cooperation with the USEPA in October 2004, was to determine if a temporal record of PCB inputs to Devil’s Swamp Lake was preserved in bottom sediment in the lake, and if so, to assess this record. This report documents the approach and findings of the study. The approach was to collect sediment cores from several locations in Devil’s Swamp Lake near where the wastewater drainage ditch enters the lake, to visually inspect and describe the cores, to analyze selected intervals in the cores for PCBs using an immunoassay screening method (Strategic Diagnostics, Inc, 2004), and to estimate dep-osition dates of core sediment. Samples of bottom material from the wastewater drainage ditch also were analyzed. Because of the relatively large uncertainty associated with this analytical method, PCB concentrations presented here should be consid-ered semi-quantitative.

2 Immunoassay Screening of Sediment Cores for Polychlorinated Biphenyls, Devil’s Swamp Lake, Louisiana, 2004
Figure 1. Aerial images of Devil’s Swamp Lake near Baton Rouge, Louisiana, showing (a) lake in relation to surrounding features and (b) approximate locations of sites sampled October 5, 2004.
Baton Rouge Harbor
Baton RougeBay
ou B
aton
Rou
ge
MISSISSIPPI RIVER
DEVIL'S SWAMP LAKE
Bayou Baton Rouge
DE
VIL'S
SW
AM
P
(a)
(b)
91o12'23" 91o11'23"91o13'23"91o14'23"91o15'23"
30o34'37"
30o33'45"
30o32'53"
30o32'01"
91o13'09"91o13'16"91o13'24"91o13'31"
30o33'50"
30o33'43"
30o33'37"
U.S. Geological Survey digital orthophoto quadrangle6 kilometers southwest of Baker, Louisiana, February 21, 1998:accessed November 11, 2004, at URLhttp://terraserver-usa.com/image.aspx?t=1&s=13&x=419&y=2113&z=15&w=2
U.S. Geological Survey high-resolution natural color image6 kilometers southwest of Baker, Louisiana, March 22, 2002:accessed November 11, 2004, at URLhttp://terraserver-usa.com/image.aspx?t=4&s=10&x=3352&y=16911&z=15&w=1
Bayou Baton Rouge
Hazardous-chemicaldisposal facility
wastewater drainage ditch
DSL.A
DSL.B
DSL.C
DSL.3,DSL.4
DSL.1,DSL.2
DSL.5
DSL.6
0 0.5 1 KILOMETER
0 50 100 METERSBatonRouge
LOUISIANA
LOCATION MAP

Sample Collection 3
Sample Collection
Six sediment cores were collected from four locations in Devil’s Swamp Lake, and bottom-material samples were collected from three locations in the wastewater drainage ditch on October 5, 2004 (fig. 1; table 1). All cores analyzed were collected using a push corer that is pushed into the bed sediment to obtain a core that is retained by a check valve. One gravity core also was collected; however, penetration and recovery were less than in a push core from the same site, so the gravity core was discarded. Cores DSL.1 and DSL.2 were collected near each other at a site in the upper (east) end of the lake, east of the low spit of land where the drainage ditch enters the lake (fig. 1b). This spit separates the upper end from the main body of the lake during low water. Cores DSL.3 and DSL.4 were collected near each other at the approximate center of the lake and about the same distance west of the spit as the site of DSL.1 and DSL.2 were to the east. Core DSL.5 was collected from a site about 350 meters (m) west of the spit at the approximate
center of the lake. Core DSL.6 was collected north of DSL.5, near the shore in front of a channel entering the lake from the large area of wetlands to the north and where Bayou Baton Rouge enters the lake. The bayou is a 248-square-kilometer watershed with headwaters to the north and east of the lake. Three bottom-material samples were collected from the wastewater drainage ditch: DSL.A, on the spit of land about 40 m into the lake from where the ditch crosses the north shore of the lake; DSL.B, approximately coincident with the north shore of the lake; and DSL.C, about 70 m upstream from the north shore of the lake. All three samples were obtained from the top 10 to 15 centimeters (cm) of bottom material at the center of the 3- to 4-m-wide drainage ditch.
Cores were collected using a 6.7-cm-diameter push corer with a 6.3 cm-diameter polybuterate liner. Cores were pushed into the bottom until firm sediment prevented further penetra-tion. Sediment recovery ranged from 51 to 148 cm. Cores were returned to the USGS office in Austin, Tex., where they were split lengthwise by cutting most of the way through the liner on opposite sides using a circular saw, cutting the rest of the
Figure 2. Photograph of cores DSL.1 and DSL.2 split lengthwise for description and subsampling. Cores were collected October 5, 2004, from Devil’s Swamp Lake near Baton Rouge, Louisiana.
TOP OF
CORES
BOTTOMOF
CORES
Figure 3. Photograph of core DSL.4 split lengthwise for descrip-tion and subsampling. Core was collected October 5, 2004, from Devil’s Swamp Lake near Baton Rouge, Louisiana.
TOP OF
CORE
BOTTOMOF
CORE

4 Immunoassay Screening of Sediment Cores for Polychlorinated Biphenyls, Devil’s Swamp Lake, Louisiana, 2004
way through using a utility knife, then slicing the sediment with a washed, Teflon-coated blade (figs. 2–4). Each core was photographed and described. Description included color, tex-ture, odor, and presence or absence of visible organic detritus, biota, and gas pockets. Selected intervals from the cores were transferred to pre-cleaned glass jars or Nalgene jars for chemi-cal analysis (fig. 5). Intervals were selected either using a con-stant length (for example, 5 cm) or on the basis of distinct changes in color and odor. Color changes were mostly alternat-ing light (olive gray) and dark (black) bands in the cores. Sedi-ments, especially in the dark layers, had a hydrocarbon odor. Samples for chemical analysis were scooped from the open liner using a Teflon-coated spatula taking care to not include material in contact with the walls of the liner. Subsampling tools were cleaned between each sample by rinsing with tap water, washing with phosphate-free detergent, and rinsing again with tap water.
Chemical Analysis
Sediment samples were analyzed for total PCBs using the RaPID Assay® immunoassay kit. The description below follows the description in the Users Guide provided by the manufacturer (Strategic Diagnostics, Inc., 2004). The PCB RaPID Assay® kit applies the principles of enzyme-linked immunosorbent assay (ELISA) to the determination of PCBs. A soil or sediment sample is extracted using methanol in a hand-shaken vial. The extract to be tested is added, along with an enzyme conjugate (enzyme-labeled PCB analog), to a dis-posable test tube. Next, paramagnetic particles with antibodies specific to PCBs attached are added. PCBs in the sample and in the enzyme conjugate compete for antibody binding sites on the magnetic particles. PCBs in the sample and the labeled PCB analog (the conjugate) are bound to the antibodies on the
Figure 4. Mosaic of photographs of core DSL.5, from Devil’s Swamp Lake near Baton Rouge, Louisiana.
BOTTOMOF
CORE
TOP OF
CORE
Table 1. Locations and characteristics of sediment sampling sites in and near Devil’s Swamp Lake, Louisiana, October 5, 2004.
[ID, identifier; GPS, global positioning system; cm, centimeter; m, meter; nr, near; N, north; na, not applicable]
USGSstation ID
USGSstation name Field ID GPS
coordinates
Lengthof core
(cm)
Waterdepth
(m)
Pre-reservoirboundary depth
(cm)
303342091131601 Upper Lagoon Devil’s Swamp Lake nr Baton Rouge, La.
DSL.1 and DSL.2
N 30°33'42"W 91°13'16"
DSL.1 - 110;DSL.2 - 148
2.4 DSL.1 - No pre-reservoir;DSL.2 - Pre-reservoir assumed
to be just below 148 cm
303342091132001 Devil’s Swamp Lake below Outfall nr Baton Rouge, La.
DSL.3 and DSL.4
N 30°33'42"W 91°13'20"
DSL.3 - 114;DSL.4 - 141
2.4 DSL.3 - 112; DSL.4 - 132
303339091132901 Devil’s Swamp Lake nr Bend nr Baton Rouge, La.
DSL.5 N 30°33'39"W 91°13'29"
86 2.4 85
303341091132901 Devil’s Swamp Lake nr Slough nr Baton Rouge, La.
DSL.6 N 30°33'41"W 91°13'29"
51 .9 Pre-reservoir assumed to be just below 51 cm
303343091131801 Devil’s Swamp Lake mid Outfall Spit nr Baton Rouge, La.
DSL.A N 30°33'43"W 91°13’18"
na na na
303344091131801 Devil’s Swamp Lake N end Outfall Spit nr Baton Rouge, La.
DSL.B N 30°33'44"W 91°13'18"
na na na
303345091131801 Outfall Ditch N of Devil’s Swamp Lake nr Baton Rouge, La.
DSL.C N 30°33'45"W 91°13'18"
na na na

Quality Assurance 5
particles, in proportion to their original concentration. At the end of an incubation period, a magnetic field is applied to hold the paramagnetic particles in the tube and allow the unbound reagents to be decanted. After decanting, the particles are washed. PCBs are detected by adding an enzyme substrate (hydrogen peroxide) and a chromogen (3,3',5,5'-tetramethyl-benzidine). The enzyme-labeled PCB analog bound to the PCB antibody catalyzes the conversion of the substrate/chromogen mixture to a colored product. After an incubation period, the reaction is stopped and stabilized by adding acid. Because the labeled PCBs (conjugate) are in competition with the unlabeled PCBs (sample) for the antibody sites, the color developed is inversely proportional to the concentration of PCBs in the sample. Thus, a darker color means lower sample concentrations and a lighter color means higher sample concentrations. The determination of the PCB concentration in an unknown sample is interpreted relative to the standard curve generated from kit standards after reading with a spectrophotometer.
Quality Assurance
The performance of the RaPid Assay® kit was evaluated along with several other assay kits by the USEPA in 1998 (U.S.
Environmental Protection Agency, 1998). Data quality of the RaPID Assay® kit was characterized in that study:
“The overall performance of the RaPID Assay Sys-tem was characterized as slightly biased and precise, under a given set of environmental conditions. Although there was a significant “site effect” in terms of the precision, it should be noted that the RaPID’s worst-case precision (25% RSD [relative standard deviation]) was comparable to the best-case precision (21% RSD, excluding suspect values) for the reference laboratory (U.S. Environmental Protec-tion Agency, 1998, p. 6).”
Sixty-four environmental samples were analyzed from the DSL cores. Eleven of these samples, or 17 percent, were split after drying and grinding and analyzed in duplicate. Duplicate analyses are included in this report (table 2, at end of report). Detection or nondetection was consistent for seven (64 percent) of the duplicates. Among the four samples with detections in both samples, the median relative percent difference was 26 percent and the range was from 12 to 93 percent. A control sample with a PCB concentration of about 3 milligrams per kilogram (mg/kg) was included with every six or seven environ-mental samples analyzed. Ten control samples had concen-trations ranging from 2.94 to 4.22 mg/kg with a median of 3.14 mg/kg.
Figure 5. Photograph of the subsampling of core DSL.5 collected October 5, 2004, from Devil’s Swamp Lake near Baton Rouge, Louisiana.

6 Immunoassay Screening of Sediment Cores for Polychlorinated Biphenyls, Devil’s Swamp Lake, Louisiana, 2004
Estimation of Deposition Dates of Core Sediment
Undisturbed sediment cores from lakes and reservoirs can be used to reconstruct contaminant histories for persistent, hydrophobic contaminants like PCBs if a sediment chronology can be established (Eisenreich and others, 1989; Van Metre and others, 1998). In reservoirs or constructed lakes, one useful date marker is the boundary between lacustrine sediment and pre-lake soil (Van Metre and others, 1997; Van Metre and others, 2004). That boundary usually is characterized by an abrupt change from soft, fine-grained, high-porosity sediment typical of lake environments to firmer, drier soil or sandy sediment. The nature of the pre-lake sediment varies depending on what existed at the location prior to construction of the water body. Devil’s Swamp Lake was created by dredging, so it is expected that material underlying the lacustrine sediment is an alluvial clay or a deeper soil horizon and that it is much firmer and of lower porosity than the overlying sediment.
Six cores were collected using a push corer. Each time, the push corer initially encountered little resistance as it penetrated the sediment, then encountered firm resistance, relatively suddenly, at depth. No obvious pre-lake material was recovered in the cores, with the possible exception of a 1-cm layer of firm, silty clay at the bottom of DSL.5. The initial ease of penetration and the relatively abrupt resistance to penetration at depth indicate the corer was stopped by pre-lake
soil or clay. Deposition dates for samples from cores DSL.2, DSL.4, and DSL.5 were assigned assuming cores penetrated almost to the pre-soil marking 1973, when dredging formed the lake, and assuming a constant mass accumulation rate (MAR) of sediment for each core. MAR in each core was calculated using measured porosity and an assumed density of solids (2.0 grams per cubic centimeter) for sediment samples over the time interval assumed to be represented by the core (1975, the assumed bottom of the core, to the sampling date in October 2004). This approach is similar to the approach used by Van Metre and others (2004) for reservoir cores where the depth-date marker was either the construction date of the reservoir or the peak in radioactive cesium-137 concen-tration. Sample intervals, porosities, MARs, estimated deposi-tion dates, PCB concentrations, and general descriptions of samples are listed in table 2.
Sediment Descriptions and Polychlorinated Biphenyl Concentrations
All five cores from along the axis of the lake (excluding core DSL.6) had alternating light and dark layering, with dark layers more common in deeper sediments (figs. 2–5; table 2). DSL.2, for example, was a relatively uniform olive gray to a depth of 75 cm, then had alternating streaks of olive gray and black, some as thick as 2 cm, to the bottom of the
Figure 6. Trends of polychlorinated biphenyls (PCB) as determined with immunoassay kits for samples collected October 5, 2004, from Devil’s Swamp Lake near Baton Rouge, Louisiana.
Core DSL.2
Core DSL.4
Core DSL.5
0 0.2 0.4 0.6 0 0.5 1 1.5 0 5 10 15 20
PCB CONCENTRATION, IN MILLIGRAMS PER KILOGRAM
1970
1975
1980
1985
1990
1995
2000
2005
ES
TIM
AT
ED
DE
PO
SIT
ION
DA
TE
Nondetections in white at the respective detection limit.
Nondetections in white at the respective detection limit.
Nondetections in white at the respective detection limit.

Summary 7
core at 148 cm (fig. 2). Although the overall pattern of increas-ing numbers of dark sediment layers with increasing depth occurred in all five cores, there were differences between cores and the dark layers could not be directly correlated between cores, even for cores collected relatively near each other. DSL.1, for example, had more dark layering than nearby DSL.2 (fig. 2).
Selected samples from five of the six cores and three bottom-material samples from the remains of the wastewater drainage ditch were analyzed by immunoassay (table 2). Core DSL.3 was not analyzed because of its proximity to DSL.4 and the fact that it was the shorter of the two. PCBs were detected in about 70 percent of the 64 environmental samples analyzed (excluding duplicates and reruns). The highest concentrations were detected below 45 cm in core DSL.5; all six samples ana-lyzed from 45 to 83 cm in core DSL.5 had detections including a maximum of about 15 mg/kg in the 69- to 73-cm sample. Esti-mated deposition dates for this interval of the core were from the late 1970s to about 1990; the highest concentration thus cor-relates with a deposition date of about 1982. PCBs were not detected in three samples analyzed from the upper part of core DSL.5 (between 5 and 36 cm), sediment deposited after about 1990. Concentrations of PCBs in sediment deposited before about 1990 also were generally greater in cores DSL.2 and DSL.4 compared to those in sediment deposited after about 1990 (fig. 6). Detection rates in DSL.2 decreased from 78 to 64 percent and median concentrations decreased by about one-half, from 0.21 to 0.12 mg/kg. Detection rates in DSL.4 decreased from 100 to 45 percent and median concentrations decreased by about a factor of 10, from 0.47 mg/kg to a non-detection at 0.05 mg/kg. Although these sites are much closer to the wastewater drainage ditch than DSL.5, maximum concen-trations were much lower than at DSL.5. PCBs were detected in the three bottom-material samples from the drainage ditch at about 1.8, 2.2, and 1.2 mg/kg for the three sites in the direction away from the lake (fig. 1; table 2), concentrations higher than those at sites DSL.2 and DSL.4 near where the ditch enters the lake. PCBs were detected in core DSL.6 from near the north shore of the lake and at the mouth of a ditch entering the lake from the swamp at concentrations ranging from a nondetection to 0.96 mg/kg.
Summary
This study investigated the possible historical contribution of PCBs from a hazardous-chemical disposal facility by way of a wastewater drainage ditch to Devil's Swamp Lake. Six sedi-ment cores from the lake and three bottom-material samples from the drainage ditch were collected and analyzed for PCBs using an immunoassay screening method. Deposition dates for intervals in the cores were estimated and the results were used to evaluate qualitatively the historical input record of PCBs to the lake. Sixty-one samples from five of the six cores and the
three samples of bottom-material from the drainage-ditch were analyzed. PCBs were at higher levels in ditch bottom material (about 1.1 to 2.2 mg/kg) than in cores DSL.2 and DSL.4 from near where the ditch enters the lake (about 0.1 to 0.9 mg/kg). The highest concentrations of PCBs (maximum of 15 mg/kg) were detected in lake-bottom sediment about 350 m west of the ditch. Wastewater discharge from the ditch ended in 1993. Detection rates and median PCB concentrations were higher in all of the dated cores before about 1990 than after 1990.
References
Davis, R.B., 1980, The scope of Quaternary paleolimnology: Paleolimnology and the reconstruction of ancient environ-ments: Boston, Kluwer Academic, 1–24 p.
Eisenreich, S.J., Capel, P.D., Robbins, J.A., and Boubonniere, R.A., 1989, Accumulation and diagenesis of chlorinated hydrocarbons in lacustrine sediments: Environmental Science and Technology, v. 23, no. 9, p. 1,116–1,126.
Geological Society of America, 1991, Rock color chart with genuine Munsell color chips: Boulder, Colo., The Geological Society of America.
Strategic Diagnostics, Inc., 2004, Remediation, assessment, and industrial testing: RaPID Assay.
U.S. Environmental Protection Agency, 1997, The incidence and severity of sediment contamination in surface waters of the United States—Volume 1—National sediment quality survey: U.S. Environmental Protection Agency EPA 823-R-97-006.
U.S. Environmental Protection Agency, 1998, Environmental technology verification report—Immunoassay kit, Strategic Diagnostics, Inc., RaPID assay system for PCB analysis: U.S. Environmental Protection Agency EPA 600-R-98-111.
U.S. Environmental Protection Agency, 2004, Devil's Swamp Lake, Baton Rouge, Louisiana: accessed September 28, 2004, at URL http://www.epa.gov/earth1r6/6sf/pdffiles/devils_swamp.pdf
Van Metre, P.C., Callender, Edward, and Fuller, C.C., 1997, Historical trends in organochlorine compounds in river basins identified using sediment cores from reservoirs: Environmental Science and Technology, v. 31, no. 8, p. 2,339–2,344.
Van Metre, P.C., Wilson, J.T., Callender, Edward, and Fuller, C.C., 1998, Similar rates of decrease of persistent, hydro-phobic contaminants in riverine systems: Environmental Science and Technology, v. 32, no. 21, p. 3,312–3,317.
Van Metre, P.C., Wilson, J.T., Fuller, C.C., Callender, Edward, and Mahler, B.J., 2004, Collection, analysis, and age-dating of sediment cores from 56 U.S. lakes and reservoirs sampled by the U.S. Geological Survey, 1992–2001: U.S. Geological Survey Scientific Investigations Report 2004–5184, 180 p.
8Im
munoassay Screening of Sedim
ent Cores for Polychlorinated Biphenyls, D
evil’s Swam
p Lake, Louisiana, 2004
Table 2. Sample collection intervals, porosities, constant mass accumulation rates (MARs), estimated deposition dates, polychlorinated biphenyl (PCB) concentrations determined with immunoassay kits, and general descriptions of the sediment samples collected from Devil’s Swamp Lake, Louisiana, October 5, 2004—Continued.
Sample identifierand interval
(cm)
Organicssplit
collectedPorosity
ConstantMAR,
(g/cm2 yr)
Estimateddeposition
date
PCBconcentration
(mg/kg)Description
DSL.1 0–10 No 0.80 -- -- 0.21 Light olive gray mottled with minor amounts of grayish black (N2) and dark gray (N3)DSL.1 40–50 No .72 -- -- ND (.09)DSL.1 70–80 No .55 -- -- ND (.04)DSL.1 80–87 No .67 -- -- .12 Uniform grayish black (N2)DSL.1 90–100 No .66 -- -- .12 Alternating zones or streaks of light olive gray and grayish blackDSL.1 106–115 No .68 -- -- ND (.09) All black (N1), pretty firm or stiff sediment, stinkyDSL.1 106–115 dup. -- -- -- -- .22DSL.2 0–5 Yes .84 3.05 2004.5 .11 Olive gray (5Y 3/2) mottled with a slightly darker olive gray; soft, silty clayDSL.2 5–10 No .84 3.05 2004.0 naDSL.2 10–15 Yes .82 3.05 2003.5 ND (.07)DSL.2 15–20 No .79 3.05 2002.8 naDSL.2 20–25 Yes .78 3.05 2002.1 .15DSL.2 25–30 No .76 3.05 2001.4 .31DSL.2 25–30 dup. -- -- -- -- .21DSL.2 30–35 Yes .76 3.05 2000.6 na Mottled like above, but dominated by the darker olive gray; very uniform texture with a few gas
bubbles, no sticks or organic debris; darker zone at 58 to 72 cmDSL.2 35–40 No .74 3.05 1999.7 .20DSL.2 40–45 Yes .77 3.05 1998.9 naDSL.2 45–50 No .78 3.05 1998.2 .17DSL.2 50–55 Yes .75 3.05 1997.4 ND (.05)DSL.2 55–60 No .74 3.05 1996.6 naDSL.2 60–65 Yes .73 3.05 1995.7 ND (.09)DSL.2 65–70 No .74 3.05 1994.9 naDSL.2 70–75 Yes .74 3.05 1994.0 .12DSL.2 75–80 No .70 3.05 1993.1 .21 Olive gray streaked with olive black (5Y 2/1)DSL.2 80–88 Yes .63 3.05 1991.6 ND (.07) Olive gray with lighter and darker streaksDSL.2 88–92 Yes .56 3.05 1990.1 na Light olive gray with a few darker streaksDSL.2 92–97 Yes .64 3.05 1988.9 ND (.09) Alternating layers, about 1 cm thick, of light olive gray and grayish black (N2); strong odorDSL.2 92–97 dup. -- -- -- -- ND (.06)DSL.2 97–102 Yes .65 3.05 1987.7 naDSL.2 102–104 Yes .71 3.05 1987.0 .21 Black (N1); strong odor, like kerosene or hydrocarbonDSL.2 104–108 Yes .68 3.05 1986.4 .26 Streaked grayish black (N2) with some strands of olive grayDSL.2 108–111 Yes .69 3.05 1985.6 .21 Solid grayish black (N2) zone with a distinct thin layer of olive gray at 107 to 107.5 cmDSL.2 111–114 Yes .58 3.05 1984.9 na Olive grayDSL.2 114–116 Yes .69 3.05 1984.3 .50 Streaked grayish black and olive gray; grayish black at 115 to 116 cm
Table 2. Sample collection intervals, porosities, constant mass accumulation rates (MARs), estimated deposition dates, polychlorinated biphenyl (PCB) concentrations determined with immunoassay kits, and general descriptions of the sediment samples collected from Devil’s Swamp Lake, Louisiana, October 5, 2004.
[Color codes in the description column are from the Geological Society of America (1991). cm, centimeter; g/cm2 yr, grams per square centimeter per year; mg/kg, milligrams per kilogram; --, not calculated; ND, not detected with detection limit following in parentheses; dup., duplicate; na, not analyzed; mm, millimeter]

References9
DSL.2 116–121 Yes 0.55 3.05 1983.4 na Light olive gray with faint dark zones at 119, 123, 128, and 131 cmDSL.2 121–126 Yes .54 3.05 1981.9 .13DSL.2 126–131 Yes .54 3.05 1980.4 naDSL.2 131–136 Yes .54 3.05 1978.9 ND (.07)DSL.2 131–136 dup. -- -- -- -- .10DSL.2 136–141 Yes .61 3.05 1977.5 .32 Grayish black at 136 to 138 cm; olive gray at 138 to 139 cm, and grayish black again at 139 to 140
cmDSL.2 141–148 Yes .60 3.05 1975.9 .19 Mostly light olive gray with a grayish black zone at 144 to 146 cm; creamier texture, thick, sticky,
clayey sedimentDSL.4 0–5 Yes .71 3.77 2004.4 .14 Olive gray, slightly mottled; smooth and uniform textureDSL.4 5–10 No .70 3.77 2003.6 .15DSL.4 10–15 Yes .70 3.77 2002.8 naDSL.4 15–20 No .66 3.77 2002.0 ND (no value)DSL.4 20–25 Yes .66 3.77 2001.1 naDSL.4 25–30 No .65 3.77 2000.1 ND (.02)DSL.4 30–35 Yes .65 3.77 1999.2 ND (.03)DSL.4 35–40 No .58 3.77 1998.2 na Light olive gray with streaks of olive grayDSL.4 40–45 Yes .60 3.77 1997.1 .14DSL.4 45–50 No .56 3.77 1996.0 ND (.02)DSL.4 50–55 Yes .65 3.77 1994.9 .84 Alternating streaks of light olive gray and dark gray, with a few streaks that may be grayish blackDSL.4 55–60 No .59 3.77 1993.9 .12DSL.4 55–60 dup. -- -- -- -- ND (.07)DSL.4 60–65 Yes .53 3.77 1992.8 ND (.04)DSL.4 65–70 No .59 3.77 1991.6 naDSL.4 70–75 Yes .57 3.77 1990.5 ND (.05)DSL.4 75–80 No .59 3.77 1989.4 naDSL.4 80–85 Yes .66 3.77 1988.4 .20 Wide zone of uniform grayish blackDSL.4 85–90 No .54 3.77 1987.3 .23 Light olive gray; texture is drier and stickierDSL.4 85–90 dup. -- -- -- -- .20DSL.4 90–93 Yes .64 3.77 1986.4 .28 Olive gray with streaks of dark gray and black DSL.4 93–99 No .53 3.77 1985.3 .83 Light olive gray at 93 to 95 cm, grayish black at 95 to 96 cm, and light olive gray with a layer of
coarser material (fine sand) and organic debris at 96 to 98 cmDSL.4 99–104 Yes .59 3.77 1984.1 .22 Alternating layers, 1 cm thick, of olive gray and grayish blackDSL.4 104–106 No .60 3.77 1983.2 .35 Grayish blackDSL.4 107–111 Yes .57 3.77 1982.4 .60 Dark gray; very uniform zoneDSL.4 111–117 No .49 3.77 1981.1 .47 Light olive gray; wide, uniform zoneDSL.4 111–117 dup. -- -- -- -- .53
Table 2. Sample collection intervals, porosities, constant mass accumulation rates (MARs), estimated deposition dates, polychlorinated biphenyl (PCB) concentrations determined with immunoassay kits, and general descriptions of the sediment samples collected from Devil’s Swamp Lake, Louisiana, October 5, 2004—Continued.
Sample identifierand interval
(cm)
Organicssplit
collectedPorosity
ConstantMAR,
(g/cm2 yr)
Estimateddeposition
date
PCBconcentration
(mg/kg)Description
10Im
munoassay Screening of Sedim
ent Cores for Polychlorinated Biphenyls, D
evil’s Swam
p Lake, Louisiana, 2004
DSL.4 117–122 Yes 0.62 3.77 1979.8 na Mostly black (N2 to N1) with streaks of light olive grayDSL.4 122–130 No .60 3.77 1978.5 .53DSL.4 130–132 Yes .51 3.77 1977.4 na Olive gray; siltyDSL.4 132–136 No .53 3.77 1976.6 .97 Mostly black, very streaky, olive gray layer at 139 to 140 cm; coarse and organic material at 135 to
136 cmDSL.4 136–141 Yes .57 3.77 1975.6 .69DSL.5 0–5 Yes .78 1.64 2004.1 na Light olive gray and olive gray mottled; soft, silty, clayey sediment; no organic detritus or biota visi-
ble; a few gas pocketsDSL.5 5–10 No .76 1.64 2002.7 ND (.08)DSL.5 5–10 dup. -- -- -- -- ND (.02)DSL.5 10–15 Yes .75 1.64 2001.2 naDSL.5 15–20 No .74 1.64 1999.6 naDSL.5 20–29 Yes .74 1.64 1997.4 ND (.02) Olive black trending to grayish black; mostly uniform with only a few faint olive streaksDSL.5 20–29 dup. -- -- -- -- ND (.03)DSL.5 29–36 Yes .70 1.64 1994.7 ND (.02) Grayish black streaked with olive gray at 29 to 32 cm; olive gray to light olive gray streaked with
black at 32 to 36 cmDSL.5 36–45 Yes .73 1.64 1992.0 na Dark gray to grayish black; smooth, uniform textureDSL.5 45–51 Yes .73 1.64 1989.6 .15 Black and grayish black with thin (1 mm) streaks of olive grayDSL.5 51–58 Yes .70 1.64 1987.3 .44 Stripes of olive gray and black; distinct light olive stripe at 56 to 57 cmDSL.5 58–64 Yes .74 1.64 1984.9 1.16 Uniform (solid) grayish blackDSL.5 66–68 No .68 1.64 1983.2 5.06 Stripes of black (N1) or grayish black and olive, but mostly (90 percent) darkDSL.5 66–68 rerun -- -- -- -- 4.84DSL.5 69–73 Yes .71 1.64 1981.58 14.54DSL.5 69–73 rerun -- -- -- -- 14.98DSL.5 77–83 Yes .64 1.64 1978.3 1.03 Same as above, but mostly (90 percent) oliveDSL.5 85–86 No .51 1.64 1975.6 na Olive, firm, silty, could be pre-reservoirDSL.6 0–12 Yes .73 -- -- .30 Olive gray; silty, no debris or biotaDSL.6 12–28 Yes .70 -- -- na A little darker than above; silty, uniform color and textureDSL.6 28–41 Yes .70 -- -- ND (.09) A little olive, dark gray streaks, like other mid-like cores but much less pronouncedDSL.6 28–41 dup. -- -- -- -- .13DSL.6 41–45 Yes .69 -- -- .33 Light olive grayDSL.6 41–45 dup. -- -- -- -- .12DSL.6 45–51 Yes .69 -- -- .96 Olive black or grayish black; only distinct black zone in core; uniform textureDSL.A Yes .49 -- -- 1.78 Not describedDSL.B Yes .51 -- -- 2.15 Not describedDSL.C Yes .50 -- -- 1.18 Not described
Table 2. Sample collection intervals, porosities, constant mass accumulation rates (MARs), estimated deposition dates, polychlorinated biphenyl (PCB) concentrations determined with immunoassay kits, and general descriptions of the sediment samples collected from Devil’s Swamp Lake, Louisiana, October 5, 2004—Continued.
Sample identifierand interval
(cm)
Organicssplit
collectedPorosity
ConstantMAR,
(g/cm2 yr)
Estimateddeposition
date
PCBconcentration
(mg/kg)Description

Prepared by the Texas District Office:U.S. Geological Survey8027 Exchange DriveAustin, TX 78754–4733
Information regarding water resources in Texas is available at URLhttp: //tx.usgs.gov/