impact assessment texture processing - refresh
TRANSCRIPT

REFRESH is funded by the Horizon 2020 Framework Programme of the European Union under Grant Agreement no. 641933. The contents of this document are the sole responsibility of REFRESH and can in no way be taken to reflect the views of the European
Union
Impact assessment texture processing Deliverable D6.4

Impact assessment texture processing 2
Authors
Peter Ryden, Quadram Institute Bioscience
Graham Moates, Quadram Institute Bioscience
Keith Waldron, Quadram Institute Bioscience
Matthew de Roode, Sensus
Project coordination and editing provided by Wageningen Food & Biobased Research.
Manuscript completed in January 2018
This document is available on the Internet at: www.eu-refresh.org
Document title D6.4 Impact assessment texture processing
Work Package WP6
Document Type Deliverable
Date 5th January 2018
Document Status Final
Acknowledgments & Disclaimer
This project has received funding from the European Union’s Horizon 2020 research and
innovation programme under grant agreement No 641933.
Neither the European Commission nor any person acting on behalf of the Commission is
responsible for the use which might be made of the following information. The views
expressed in this publication are the sole responsibility of the author and do not necessarily
reflect the views of the European Commission.
Reproduction and translation for non-commercial purposes are authorised, provided the
source is acknowledged and the publisher is given prior notice and sent a copy.

Impact assessment texture processing 3
Table of Contents
1 Executive Summary 6
1.1 Objectives of work 6
1.2 Approach 6
1.3 Next steps 6
2 Introduction 7
2.1 REFRESH 8
2.2 Aim of Workpackage 8
2.3 Description of related Task 8
3 Methodology 9
3.1 Introduction 9
3.2 Fibre samples 10
3.3 Thermophysical methods using carrot fibre from Provalor and
Chicory fibre from VeggieFiber 11
3.3.1 Laboratory-scale experiments 11
3.3.2 Pilot-scale experiments 12
3.3.3 Drying 13
3.4 Precooking and Pressure cooking of chicory fibre from Sensus
13
3.5 Analysis of carrot fibre from Provalor and chicory fibre from
VeggieFiber 14
3.5.1 Visible reflectance - pellets 14
3.5.2 Infrared spectroscopy - supernatants 14
3.5.3 Rheology 15
3.5.4 Water retention and oil retention capacities. 15
3.5.5 Light microscopy 16

Impact assessment texture processing 4
3.6 Milling and analysis of chicory fibre from Sensus. 16
3.6.1 Milling 16
3.6.2 Reflectance 16
3.6.3 Water holding capacity 16
3.7 Incorporation of pressure cooked pulp into foods. 16
3.7.1 Pressure cooked pulp in a breakfast drink. 16
3.7.2 Milled dried pressure cooked fibre in bread. 19
4 Results 21
4.1 Carrot fibre from Provalor and chicory fibre from VeggieFiber.
21
4.1.1 Sugar analysis 21
4.1.2 Reflectance 21
4.1.3 FTIR absorbance 26
4.1.4 Penetration tests 26
4.1.5 Steam-exploded samples 32
4.1.6 Pressure-cooked samples 33
4.2 Effects of drying on swelling and water retention 37
5 Results of chicory fibre from Sensus 40
5.1 Processing conditions 40
5.2 Colour analysis 40
5.3 Water holding capacity 41
5.4 Dough and bread properties 41
5.5 Summary of the baking tests. 44
6 Conclusions 44
7 References 50

Impact assessment texture processing 5
List of abbreviations
AACC American Association of Cereal Chemists (now known as AACC International)
FA Framework for Action
FTIR Fourier Transform Infra-Red
NACE European Classification of Economic Activities
PA/PE Polyamide/Polyethylene
RSM Response surface methodology
VIS/NIR Visible/near infrared
WHC Water holding capacity
WP Work Package

Impact assessment texture processing 6
1 Executive Summary
1.1 Objectives of work
This work aims to utilise vegetable side streams, treated using a thermophysical
technique known as steam explosion, as food ingredients and test their functionality in model food products.
The wider research covered in this report and alternative valorisation approaches
covered in Deliverables D6.7 & D6.8 are integral to the longer term aims of the project.
This case study sits within Work Package 6 (WP6) (Valorisation of waste streams and co-products) of the EU H2020 funded REFRESH project. One of the key objectives of WP6 is to increase the exploitation of food and packaging waste by
helping business stakeholders to identify waste streams appropriate for valorisation regarding a) their robustness of supply, quality and composition and b) for which
products and outputs might be realised that are technologically feasible, economically viable, legislatively compliant and environmentally sustainable / beneficial.
1.2 Approach
Two candidate vegetable side-streams were chosen: carrot fibre from a vegetable juice production facility and chicory fibre from an inulin factory. Both side-streams represent a source of pectic-polysaccharide-rich fibre. Carrot fibre has many
applications as a binder or extender in meat products such as sausages and pates, to reduce water purging in canned meats and to improve textures in bakery
products such as breads, cakes and tortillas. Chicory pulp is largely used as an animal feed (Maertens et al. 2014) though there have been some applications in food for human consumption (Cardoso et al. 2007).
Pulp residues from carrot juice and chicory inulin manufacturers were subjected to thermophysical processing using microwaves, steam-explosion and pressure
cooking to assess the potential to improve their properties for incorporation into foods.
The incorporation of added fibre is of interest to food manufacturers to enable high fibre claims to be made about products. Food processing residues from vegetables offer scope for improved functionality of existing food products as well as a route
for reducing ingredient waste and improving process sustainability.
1.3 Results and conclusions
Mild thermophysical processing produced insoluble fibres with stronger textural properties. The increase in colour after processing was sufficiently slight. These
processed insoluble fibres were incorporated into food products, by drying and milling for bakery products and by blending the undried fibre for use in a breakfast
drink. At 2% of the flour chicory fibre could be incorporated as a milled product

Impact assessment texture processing 7
into bread without adverse effects i.e. no loss of loaf volume and no impairment of taste or texture.
With respect to the application of undried chicory pulp in a breakfast drink an optimum recipe could be determined. Based on consumer sensory trials, an optimal
recipe was determined for a particle size of 7,5 mm – 10 mm and a percentage addition of 7,6%; the resulting overall score was 6,6, which is objectively
considered an acceptable score for the palatability of insoluble chicory root fibre inside a prototype breakfast drink. Based on these results a business model, including a production process and different commercial scenarios will be
established.
The results demonstrate a technologically feasible route for the utilisation of
defined, traceable residues from the food manufacturing industries to impart functional characteristics when reformulating existing product recipes. In both the bread product and the breakfast drink, it was possible to add chicory fibre to
produce a high-fibre product with no adverse effect on product quality when compared against a conventional equivalent product.

Impact assessment texture processing 8
2 Introduction
2.1 REFRESH
REFRESH is an EU Horizon 2020 funded research project (which runs for 4 years
until June 2019) taking action against food waste. Twenty-six partners from 12 European countries and China are working towards the project's aim to contribute towards Sustainable Development Goal 12.3 of halving per capita food waste at the
retail and consumer level and reducing food losses along production and supply chains, reducing waste management costs, and maximizing the value from un-
avoidable food waste and packaging materials.
This cast study forms part of Work Package 6 entitled “Valorisation of waste streams and co-products”.
2.2 Aim of Work Package
WP6 – Valorisation of waste streams and co-products
This report is part of Work Package 6 within REFRESH. The aim of the work package is to increase the exploitation of food & packaging waste by:
• helping business stakeholders to identify waste streams (organic and packaging) that are appropriate to valorise due to their robustness of supply,
quality and composition, and for which products and outputs might be realised that are technologically feasible, economically viable, legislatively compliant and environmentally sustainable/beneficial;
• valorising post-consumer putrescible waste; • helping policy makers to identify and implement improvements to the
legislation that will reduce unnecessary restrictions on valorisation (including use in feed production, whilst maintaining appropriate safety and quality standards).
2.3 Description of Sub-task
T6.3.2 New food ingredient streams
High value fibre products will be developed from the residues of chicory and/or carrot juice processing utilising modern thermophysical pre-treatment
technologies. Changes in composition and rheological/textural characteristics will be evaluated before conducting product incorporation trials to evaluate the
performance of the ingredient in food products, such as bread and breakfast drinks. This report presents the results of this sub-task.

Impact assessment texture processing 9
3 Methodology
3.1 Background
The fibre residues from juice-extracted carrots and inulin-extracted chicory were
investigated as possible sources of new food ingredients. The fibre residues were subjected to thermophysical treatments, at a lower severity than that typically used for lignocellulosic wastes, to obtain soluble and insoluble fibres with altered textural
properties. The chemical and textural properties of the insoluble fibres were measured and their suitability as ingredients in bakery products and a breakfast
drink (smoothie) was assessed. A suggested use in formed meat products, where the textural requirement are moderate firmness and strong cohesion, was not pursued.
Among the requirements of insoluble fibres as ingredients are the following:
• The browning reaction should not give an unacceptable amount of colour.
• Processing costs should be minimised by using the lowest useful severity. • Mouth-feel needs to be acceptable; coarse particles must be removed, milled
or softened.
• Preferably the fibre should not be milled so as not to lose the water holding capacity which depends on retention of structure.
• A high water-holding capacity, a high oil-holding capacity and the formation of a weak solid in concentrated suspensions.
Two sources of chicory pulp were supplied, both originating from the Sensus inulin
factory (Roosendaal, the Netherlands). The first source used in the laboratory at IFR Norwich (February 2016 to July 2016), was supplied by VeggieFiber Europe BV
(Kruisweg 757, Hoofddorp, the Netherlands). The second source came directly from the inulin factory and the experiments were done in the laboratories adjoining the factory.
While detailed rheological studies to measure elastic modulus and yield stress are done with plant fibre suspensions smooth enough and dilute enough for oscillatory
measurements (Castro et al. 2012; Castro et al. 2013); in our experiments, simple penetration tests were done on concentrated fibre suspensions formed into pastes,
using a miniaturised form of the tests recommended by Paulus Kosters (Femenia et al. 1997). This enabled rapid assessment of the changes caused by thermophysical treatments.
Pulp residues directly from the Sensus chicory factory were subjected to thermophysical treatments, at the same lower severities that achieved a significant
change in textural properties in the insoluble fibres of the chicory pulp previously supplied by VeggieFiber BV. Pressure cooking was used as a proxy for steam explosion to enable the integrity of food hygiene requirements to be maintained
thereby allowing for the possibility of sensorial analysis including product taste panels. The pulp from Sensus had such a large particle size that the penetration
tests used to measure the textural properties of the soft solids formed from treated VeggieFiber pulp were not appropriate. The VeggieFiber pulp had been obtained from Sensus but the exact process of blending or cutting that VeggieFiber had
performed is unknown.

Impact assessment texture processing 10
The treated insoluble fibre was tested in two food applications; white bread and a breakfast drink. For breads, the treated pulp was dried and milled and added to the
flour. For the breakfast drink (smoothie), the undried fibre was blended in. The prepared foods were subjected to physical and sensory testing. The breads made
with the modified milled fibre were compared with bread prepared using unmodified milled fibre. This unmodified fibre was a bulk preparation that had been dried
rapidly in a belt dryer. No small-scale belt dryer exists. The means of drying at the laboratory scale was much slower and may have caused the greater development of colour.
3.2 Fibre samples
Carrot fibre from the Provalor bio-refinery was supplied wet and frozen. While the processing history of the carrot fibre had not been provided, it was apparent that they have not been subjected to heat treatment. The carrot fibre as supplied
contained some fibrous material but it was well shredded and the texture on the whole was fairly soft.
The chicory pulp is the residue remaining after inulin extraction in which chicory roots are shredded then heated gradually over 30 min from 20 °C to 60 °C, then held at 70 °C for 4 h for the diffusion stage when inulin juice is obtained. The pulp
from this stage is dried from 10% dry matter to 25% at ambient (5 to 25 °C) in a screw press over 30 min. In the experiments done in Roosendaal the pulp was
obtained directly from the inulin extraction process and particle sizes were as high as 80 mm (Figure 1). This waste pulp was provided frozen (5.045 kg wet mass, 1.261 kg dry). The waste pulp contained sand and silt. It was thawed out in 35 L
of water at 18 °C allowing the sand to sediment. The pulp was scooped out of the water with a colander and transferred to 35 L clean water. The sieving and washing
was repeated twice. The pulp was contained in 1 m2 100 μm nylon bolting cloth and wrung out to remove excess moisture. A silt-like filtrate was obtained.
A
B
Figure 1A washed chicory pulp, 1B a selection of pulp particles including the
largest particles and those with appreciable amounts of black or brown epidermal
tissues, with a cm/mm scale.
The chicory fibre used in the experiments in Norwich was sent by VeggieFiber Europe BV and labelled ‘cichoreivezel fijn’ (Chicory fibre fine). It is derived from the

Impact assessment texture processing 11
same pulp source but had been shredded to decrease the particle size. It contained tissues that are softer than the carrot fibre and clumps of tissues that are tougher
than the carrot fibre; its mouth feel was less acceptable. The polysaccharide content of the carrot and chicory fibres was analysed by acid
hydrolysis (Blakeney et al., 1983; Blumenkrantz and Asboe-Hansen, 1973).
3.3 Thermophysical methods using carrot fibre from Provalor and Chicory fibre from VeggieFiber
3.3.1 Laboratory-scale experiments
Pressure cooking
In laboratory scale and at temperatures up to 100 °C, pressure-cooking was done
in tubular steel reactor vessels with closures forming hemispherical caps (20 mm diameter × 150 mm length, total volume 51 mL). Carrot (13.75 g wet mass, 2.75
g dry mass, 50 mL total water) and chicory (9.17 g wet mass, 2.75 g dry mass, 50 ml total water) was put in the steel reactor vessels and these were placed in a boiling water bath for known times between 10 and 28 min.
Microwave experiments
In laboratory scale experiments at temperatures > 100 °C, microwave heating was
done using a Biotage Initiator+ Microwave Synthesiser (Biotage GB Limited, Ystrad Mynach, Hengoed, UK). The need to keep the fibre suspensions stirred during microwave treatment limited the substrate concentration to 17 g/L in 10 mL glass
tubes and to 52 g/L in 20 mL tubes. Carrot fibre (0.42 g wet mass + 4.81 mL water) and chicory fibre (0.28 g wet mass + 4.67 mL water) was heated in 10 mL tubes
at temperatures up to 220 °C. Carrot fibre (3.45 g wet mass + 10.58 mL water) and chicory fibre (2.30 g wet mass + 11.73 mL water) was heated in 20 mL tubes at temperatures up to 170 °C.

Impact assessment texture processing 12
Bulk preparations at laboratory scale
Rheological measurements require large amounts of
material. Thus samples were combined from 20 repeats of
microwave treatments using 20 mL tubes or from 5 pressure cooking experiments. To save
time during microwaving, treatments were done
isothermally at 170 °C (Figure 2). Severity factors were calculated to show contour
lines of equal severity (Overend et al. 1987).
Figure 2: Isothermal (•) and isochronic (□)
treatments at equivalent severities.
After thermal treatments, the samples were left to cool then the material was
contained in a 50 μm nylon bolting cloth and the liquor was expressed by
wringing the cloth. More liquor was expressed by flattening the sample by
hand between sheets of 50 μm nylon bolting cloth with absorbent paper above and below the cloths (Figure 3).
The moisture content of the insoluble material was measured 3 times on an
infra-red balance at 105 °C. Efforts to express more water were continued until the solids concentration had
reached 20 g/100 g.
Figure 3: Carrot pressure-cooked
sample flattened between nylon
bolting cloth and absorbent paper.
3.3.2 Pilot-scale experiments
Steam-explosion and pre-cooking
Based on the rheological measurements of the microwave-treated samples, a single pre-treatment condition was chosen for both chicory and carrot fibre; 120 °C (1.0
bar gauge pressure) for 10 min using a Cambi™ Steam Explosion Pilot Plant (Cambi, Asker, Norway). Pre-cooking was done in a laboratory water bath.
110
120
130
140
150
160
170
180
190
200
210
0 5 10
tem
pe
ratu
re (
C)
time (minutes)
Severity Factors:1.589 1.883 2.178 2.472 2.767 3.061
Severity Factor = Log(t*EXP((T-100)/14.75))
isochronic and isothermal treatments

Impact assessment texture processing 13
Steam-explosion experiments without pre-cooking used wet fibre containing 0.5 kg dry matter (2.50 kg carrot fibre, 1.67 kg chicory fibre). The steam-exploded slurries
were contained in nylon bolting cloth (50 μm mesh) and liquor was expressed using a cider press. Then the pellets were dispersed in 2.00 L of water and the liquor was
expressed again. Pre-cooking used wet fibre containing 0.3 kg dry matter (1.50 kg carrot fibre, 1.00
kg chicory fibre). Water was heated to 60 °C (3.10 L for carrot fibre and 3.60 L for chicory fibre) then added to the wet fibre to give total water volumes of 4.30 L. The slurries were heated at 60 °C for 40 min (Castro et al. 2013). The pre-cooked
slurries were transferred to the steam-exploder within 5 min and steam-treated at 120 °C for 10 min. The hopper was rinsed with 0.8 L of water. The slurries were
contained in nylon bolting cloth (50 μm mesh) and the liquor was expressed. The pellet was dispersed in 2 L water and the liquor was expressed.
Pressure-cooking and pre-cooking
Because of the poor recoveries from the steam-exploder and because of the need for an accurate mass balance, a pressure-cooker was purchased. The simpler
Prestige pressure-cooker (6 L Hi-Dome) was used because a constant pressure can be guaranteed by maintaining continuous over-heating while regulating the pressure to 1 bar (120 °C). It can also be cooled rapidly by plunging into water. 1
L of water was heated to boil in the pressure cooker base. Triplicate samples of wet chicory fibre (33.3 g; 7.5 g dry mass) and carrot fibre (50.0 g; 11.0 g dry mass)
were pre-cooked at 60 °C for 40 min in 500 mL Duran bottles (total water 143 mL). Then the Duran bottles were uncapped and placed in the pressure-cooker. The pressure cooker lid was fixed. Cooking time was measured from when a continuous
flow of steam was emitted. After 10 min, the pressure cooker was cooled in cold water and within 1 minute the lid was opened. The liquor was separated from the
fibre using 50 μm bolting cloth. The pellet was dispersed in 140 mL water and then separated using 50 μm bolting cloth. The fibre samples were prepared for penetration tests. The liquor was freeze-dried.
3.3.3 Drying
A Johnson Matthey fluid bed dryer was used to dry untreated and pre-treated fibre
samples. Low temperatures and short drying times are preferable. An initial unsatisfactory trial produced clumps of fibre up to 5 mm diameter and drying times as long as 60 min. To minimize the size of clumps that formed, water was expressed
from the wet pre-treated fibre until it formed a readily friable solid, with a fibre concentration > 200 g/L and the amount of material to be dried was limited to 10
g wet weight. The fibre was dried at 35 °C, blower speed 7, for 30 min. The impairment that drying caused to the fibre was assessed by measuring the water holding capacity and the textural properties before and after drying.
3.4 Pre-cooking and Pressure cooking of chicory fibre from Sensus
Samples for pre-cooking were put in a 4 L steel bucket (1670 g wet mass of washed
pulp + 1.00 L water at 60 °C), and this was heated in a water bath at 60 °C for 40 min; then 1.5 L hot water was added for the pressure cooking stage. A large

Impact assessment texture processing 14
pressure cooker was provided, rated to 1.5 bar, which could conveniently hold a 5 L steel bucket, so the experiments were scaled to fit using 1670 g wet mass of
washed pulp (183 g dry matter) + 2500 mL hot (>90 °C) water (44 g/L). The pressure cooker was fitted with a wire mesh to hold samples off the base. Water
(3 L) was heated in a kettle to boil then poured into the pressure cooker. The pressure cooker was placed on a gas-fired stove and heated on maximum gas flow.
The 5 L sample bucket was placed on the mesh. The weight that formed the pressure valve was fitted to the lid and the lid was closed. The pressure cooker took 6 min to pressurise and 12 min to reach 1 bar. When the pressure reached
the required pressure (0.4 or 1.0 bar, gauge pressure) it was then regulated by controlling the gas flow. After cooking the pressure cooker was cooled by placing
in a sink containing 20 L water. When it had depressurised the lid was opened. The cooked pulp was dispersed in 20 L water, to cool it rapidly, and then contained in 100 μm bolting cloth and the liquor was wrung out. Some of the pressure-cooked
samples were then contained in jelly strainer bags and placed in a hydraulic press to remove more water. The pressure-cooked pulps were spread on perforated trays
and dried at 60 °C. The oven had a vent which was opened to maximum but it did not have an air draught. If dried at 40 °C the samples were thought likely to become a microbiological hazard before drying. Drying took 2 to 3 days.
3.5 Analysis of carrot fibre from Provalor and chicory fibre from VeggieFiber
3.5.1 Visible reflectance - pellets
The insoluble material from carrot fibre and chicory fibre after microwave-treatment for 10 min at temperatures from 120 °C to 220 °C in 10 mL tubes was
recovered by centrifugation at 1000 g. The pellets were freeze-dried, broken up a spatula and packed into the caps of gas chromatograph vials and pressed down with a glass rod. The caps were placed in a 1 mL pipette-tip rack. The reflectance
was measured using a Stellarnet VIS/NIR system, 30 scans 100 ms for channels 1 and 2 (visible and near infra-red). To avoid the fluorescent Hg spikes the laboratory
lights were switched off. A white standard (RS-50) provided diffuse reflectance.
3.5.2 Infrared spectroscopy - supernatants
The soluble material from carrot fibre and chicory fibre after microwave-treatment
for 10 min at temperatures from 120 °C to 220 °C in 10 mL tubes was obtained by centrifugation at 1000 g. The supernatants were freeze-dried. The FTIR spectra of
the freeze-dried samples were obtained using a Digilab FTS 6000 spectrometer with 64 scans at 4 cm-1 resolution, sensitivity 1, Filter 5, UDR 2 and speed 10 Hz. A scan of the water vapour in the air was done and this was subtracted from each scan
(the subtraction factor is adjustable). The scans were truncated to 800 to 1800 cm-
1, baseline anchored to 1800 cm-1 and area normalised.

Impact assessment texture processing 15
3.5.3 Rheology
No standard for a penetration test of a
weak solid is known. The advice of the application file is that the maximum depth
should be less than 75% of the sample depth. The method of Femenia et al.
(1997), provided the basis. The test was miniaturised using a TA-XT2i texture analyzer (Stable Microsystems, Godalming,
Surrey, UK), a 10 mL sample volume (1.5 cm depth, 1.46 cm radius) in a 25 mL glass
jar and a 1 kg or 5 kg load cell, a Magness-Taylor probe with a hemispherical end 6.7 mm diameter, a trigger force of 1 g and a
penetration speed of 10 mm/min to a depth of 10 mm (Figure 4). Water was used
instead of a phosphate buffer.
Figure 4: A penetration test.
The tests on the microwave-treated material were done with duplicate samples of a fibre suspension of 20 g/100 mL. Then water was added to decrease the fibre concentration. The water was mixed into the suspension with a spatula and the
sample was left for at least 3 h before repeating the penetration test. Successive additions of 1.43, 1.90 and 2.67 mL of water decreased the fibre concentration to
17.5, 15.0 and 12.5 g/100 mL. Steam-exploded fibre was available in much larger amounts so duplicate samples at each fibre concentration were prepared. The larger scale pressure-cooking experiments provided enough material for triplicate
samples at 15.0, 17.5 and 20.0 g/100 mL and the 12.5 g/100 mL samples were obtained by diluting the 15.0 g/100 ml samples. The force achieved at the
maximum depth was recorded (Femenia et al. 1997), the area under the force distance curve (work done) was calculated (Mehinagic et al. 2003) and the force-distance curves were plotted.
3.5.4 Water retention and oil retention capacities.
Samples were dispersed in excess water in 15 mL Falcon tubes at 21 °C for 16 h
on a gyrorocker (Stuart Scientific Ltd, Chelmsford, UK). The fibre was then left to settle for 8 h. The bed volume was measured from which the swelling (also known as global absorption without centrifugation) was calculated (Kuniak and
Marchessault 1972). The tubes were then centrifuged at 1500 g for 15 min. The supernatant was decanted and the wet pellet was weighed to calculate the water
retention capacity.
Fluid bed dried samples were dispersed in sunflower oil for 16 h in 15 mL Falcon
tubes at 21°C for 16 h on a gyrorocker. The fibre was then left to settle for 8 h. The fibres were not softened and did not settle into a compact bed even after centrifugation. After centrifugation at 1500 g for 15 min the tubes were inverted to
let the oil drain out for 30 min. The pellets were weighed and the oil retention capacity was calculated. These fluid bed dried samples were compared with freeze-
dried samples.

Impact assessment texture processing 16
3.5.5 Light microscopy
Insoluble fibre dispersions in water, NaOH and phloroglucinol-stained were
photographed under an Olympus BX60 using ×4, ×10, and ×20 objectives, bright-field and epi-fluorescence detection.
3.6 Milling and analysis of chicory fibre from Sensus
3.6.1 Milling
The pressure-cooked pulps, dried to < 10% moisture, were Retsch-milled to < 0.2 mm for incorporation into bread-making wheat flour. The moisture content of the
milled fibre was measured using a Mettler HB43-S moisture analyser used NACE code: 1530.04 (powdered carrot programme; 5-6 min at 120 °C).
3.6.2 Reflectance
Reflectance of the milled material was measured using a Konica Minolta PO0102 colour analyser. A glass cuvette was half filled and L*, a* and b* were measured
twice. The cuvette had to be full enough to ensure no light came through. Water holding capacity
3.6.3 Water holding capacity
Water holding capacity (WHC) was measured using the AACC 56-30.01 method. It is determined as the maximum amount of water that 1 g of material will imbibe
and retain under low-speed centrifugation.
3.7 Incorporation of pressure cooked pulp into foods
3.7.1 Pressure cooked pulp in a breakfast drink
3.7.1.1. Preparation of the pulp
Frozen chicory root pulp (-20 oC) was washed twice with 35 oC tap water to remove
sand, and manually pressed (both washing and pressing was done manually) to remove excess water, to a dry content of 9.82%, measured using a Mettler Toledo HE73 Moisture Analyzer. The chicory root pulp was then weighed per 100 g in
standard PA/PE vacuum bags. The bags are then vacuum sealed using a single chamber Henkelman Vacuum Packer Jumbo 35. The sealed vacuum bags containing
chicory root pulp were either sterilized in a pressure cooker or pasteurized (15 minutes at 84 oC) in a water bath. The sterilization was performed for t = 5 minutes in a (1 tray) pressure cooker with a gauge pressure of 1,5 bar (which is 127 oC
saturated steam temperature). The pasteurizer has 6 heated baths with an input temperature of 84 oC for t = 15 minutes.

Impact assessment texture processing 17
3.7.1.2. Particle size determination
The particle size after milling is shown in Figure 5. The graphing paper used has
squares of 1 cm2.
Figure 5: Processed chicory fibre of particle size distribution of various grinding
times (20s, 40s, 80s), depicted on 1 cm2 graphing paper.
The mean particle size at t= 0 is roughly visually estimated at a length range of
2,0 – 3,0 cm. The mean particle size at t= 20 roughly visually estimated at a length range of 1,0 - 2,5 cm. The mean particle size at t= 40 roughly visually estimated at a length of 0,75 – 1,0 cm. The mean particle size at t= 80 roughly visually
estimated at a length of 0,5 - 1,0 cm.
3.7.1.2 Breakfast drink recipe
Frozen chicory fibre (-20 oC) was washed twice with 35 oC tap water to remove sand, and manually pressed (both washing and pressing by hand) to remove excess
water, to a dry matter content of 9.82%, measured using a Mettler Toledo HE73 Moisture Analyzer. The chicory fibre was then weighed per 100 g in standard PA/PE vacuum bags. The bags are then vacuum sealed using a single chamber Henkelman
Vacuum Packer Jumbo 35.
The initial recipe for the breakfast drink prototype for the trials was 30% banana,
50% yoghurt (0% fat), 15% fresh chicory fibre, 5% inulin Frutalose L85. The chicory fibre and inulin supplied by Sensus B.V., whilst the yoghurt and banana were obtained from a local supermarket (Albert Heijn). The chicory fibre was milled
to a desired particle size (measured in grinding time) using a food processer (Philips Avance HR1673/90). The banana, yoghurt and inulin were blended together in the
food processor, after which a percentage of chicory fibre and yoghurt/fruit/inulin were mixed together by hand.

Impact assessment texture processing 18
3.7.1.3 Sensory analysis and recipe optimization of a breakfast drink
Sensory analyses. The objective of the sensory analyses was to determine the
effect of chicory fibre concentration, as well as mean particle size on the sensory evaluation of the breakfast drink of consumers. (Meilgaard, Civille, & Carr, 2007).
The results of the sensory analyses will lead to the optimization of the recipe. The experimental design was created in Design-Expert software (version 10; Stat-Ease,
Inc., 2016) according to first-order RSM experimentation. The variables were: mean particle size and concentration of chicory fibre. The centre point (medium particle size at 15% addition level) is replicated 5 times to provide an independent
estimate of experimental error (see Table 1, bold font).
Table 1: Sample code numbers for sensory testing, with the centre point (in bold
and italic) replicated 5 times.
Sample code # %
chicory
fibre
%
chicory
fibre
% chicory
fibre
Particle size
(grinding time) 5% 15%
30%
Large (20 s) 862 698 424
935
Medium (40 s) 821 375 656 374 588
268
Fine (80 s) 849 255 287
The samples were evaluated quantitively with acceptance tests and attribute diagnostics. Assessments of individual attributes such as appearance, smell & taste
and mouthfeel were rated on an intensity scale of 1-10 (10 cm line). The overall experience of the consumer was determined on a hedonic rating (10 cm line, dislike to like), to study how acceptance was distributed in the population represented by
the subjects. The subject was allowed to indicate a particular cause of like or dislike of the product in the comment section, and were asked their average consumption
of similar breakfast drinks, to determine bias and reference capacity. The age, gender, and nationality were all noted to possibly determine trends in preferences of consumer demographics. There were 60 panellists; a combination of trained
(nutrition & dietetics students), as well as lecturers & untrained students from a chemical/food technical background. Each subject evaluated 1 sample to avoid bias
between samples. The testing location was at the food sensory laboratory at The Hague University of Applied Sciences. Individual booths were equipped with sliding
doors to minimize any distractions in terms of odours, noise, temperature and lighting. The breakfast drink samples were prepared using the method given in section 3.7.1.1. The batches were stored in a covered measuring cup at 20 oC until
moment of sensory evaluation. The sample was presented in a small plastic cup, which contained 75 g of the sample, along with a plastic spoon to aid in sensory

Impact assessment texture processing 19
evaluation. The samples were coded in 3-digit random numbers shown in Table 1. Mouth rinsing with water before tasting was required. The evaluation period was
from 10:30 in the morning until 15:30 in the afternoon, which was consistent with the typical hours of consumption of a breakfast beverage snack. The statistical
results were analysed using the programs “Design-Expert” (version 10; Stat-Ease, Inc., 2016) and Statgraphics) (Statpoint Technologies, Inc., 2017).
Recipe optimization. The results from the sensory test were used to obtain the optimized version of a breakfast drink. A preference for a specific attribute has been asked in the sensory tests to enable the possibility of optimizing the formula
to a generally preferred formula. By combining the 5 attributes (differences between actual rating and preferred), an optimum can be calculated by addition of
the following constraints: addition level ranges & particle size ranges are fixed, sensory parameters (thickness, flavour, scent, chewiness) deviation from preferred are zeroed or minimized, and overall rating is maximized.
3.7.2 Milled dried pressure cooked fibre in bread
50 g samples of the dried powders were supplied for bread baking tests at 2% of
the mass of the flour (Table 2).
Table 2. The composition of the breads.
Ingredients Type, supplier % g
Flour Orchidee, Meneba 98 2450
Fibre 2 50
Yeast (fresh) 4 100
Salt 1.8 45
Bread improver Sonplus Wit, Sonneveld 2 50
Sugar Crystal sugar extra fine, Suiker Unie 1 25
Water Tap water 67 1675
Ascorbic acid 0.004 0.1
Gluten powder Gluvital 21020, Cargill 1 25
Emulsifier Panodan 165, Danisco 0.1 2.5
Total 4422.6
The dry ingredients were mixed for 1 minute then the water was added and the
dough was kneaded for 10 minutes. 4 loaves were prepared using 600 g of dough

Impact assessment texture processing 20
for each loaf. The first proof was for 40 min at 32 °C, then the dough was moulded and the final proof was for 75 min at 34 °C. The bread was baked for 38 min at
220 °C in a commercial oven.
Description of the dough properties
The colour, gluten development, stickiness and moulding behaviour were described qualitatively. The volume of the final proof was measured.
Analysis of the baked bread
The baked breads were measured for volume, texture, water activity, moisture content and taste 24 h after baking.
For the texture measurements a TA.XT Texture Analyser (Stable Microsystems, Godalming, UK) was used. 5 slices 3 cm thick were cut from the breads 24 h after
baking. The crosshead was fitted with a 5 cm diameter cylindrical probe and a 5 kg load cell. Each slice was placed so that the probe would compress the centre of the domed portion of the bread as far from the crust as possible. In the compression
test the probe was lowered at 2 mm/s and, from a trigger force of 5 g, the compression was continued to 10 mm depth. The probe was then held at this
position and the decay in the force over the next 30 s was recorded. The maximum force and the final force was recorded to give measures of softness and resilience. The texture tests, moisture and water activity measurements were repeated at 7
days.
50 g samples of the dried powders were supplied to the analytical laboratory for
water holding measurements. The undried pressure cooked samples were stored at -18 °C. They are available for use in a breakfast drink by a student from The Hague University of Applied Sciences, The Netherlands.

Impact assessment texture processing 21
4 Results
4.1 Carrot fibre from Provalor and chicory fibre from VeggieFiber
4.1.1 Sugar analysis
The carbohydrate compositions of the untreated carrot and chicory fibre were
determined by gas chromatography following acid hydrolysis of the cell wall polysaccharides to their constituent monosaccharides (Section 3.2).
Table 3: Triplicate sugar analysis of untreated carrot and chicory fibre.
Carrot Chicory
g kg-1 s. d. g kg-1 s. d.
Rhamnose 6.9 0.4 6.4 0.6
Fucose 1.4 0.2 2.0 0.1
Arabinose 51.0 0.7 67.8 0.7
Xylose 10.6 0.6 24.4 7.4
Mannose 15.6 0.5 20.7 0.6
Galactose 85.9 3.3 38.6 1.4
Glucose 258.1 4.9 197.6 16.7
Uronic Acid 121.3 4.2 158.0 18.5
Total 550.8 515.5
4.1.2 Reflectance
Reflectance of Insoluble fibre
The freeze-dried pellets from untreated samples and samples microwave-treated for 10 minutes at 120, 130, 140, 150, 160, 170, 180, 190, 200, 210, and 220 °C
are shown below.

Impact assessment texture processing 22
Figure 6: Reflectance of insoluble fibre.
Top row: insoluble microwave-treated carrot fibre (left to right: 120 to 220 °C).
Bottom row: insoluble microwave-treated chicory fibre (left to right: 120 to 220
°C).
Middle row: a range of commercial fibre preparations: wheat fibre Vitacell WF200, chicory root fibre 650 CYYY001, carrot TD809 large, carrot fibre Aureli, apple fibre
Vitacel AF401.
To try to quantify the observed darkening of the samples, the reflectance measurements from 400 to 1100 nm of the insoluble pellets are shown below.
Figure 7: Reflectance measurements from insoluble microwave-treated carrot,
chicory and commercial fibre preparations.
0.0
0.2
0.4
0.6
0.8
1.0
1.2
1.4
1.6
400 500 600 700 800 900 1000 1100
120130140150160170180
Reflectance Stellarnet VIS
0.0
0.2
0.4
0.6
0.8
1.0
1.2
1.4
1.6
400 500 600 700 800 900 1000 1100
120130140150160170180
Reflectance

Impact assessment texture processing 23
Among the commercial fibre preparations, apple fibre had the highest absorbance.
This absorbance was exceeded by chicory fibre treated at ≥170 °C and by all of the carrot samples.
Reflectance of soluble fibre
The supernatants were photographed in cuvettes, (Fujifilm FinePix S9600 auto, manual focus) (Figure 8).
Figure 8: Supernatants from 1000 g centrifugations of microwave-treated fibre.
0.0
0.2
0.4
0.6
0.8
1.0
1.2
1.4
1.6
400 500 600 700 800 900 1000 1100
wheat fibre Vitacel WF200Chicory root fibre 650 CYYY001Carrot TD809 large
Reflectance Stellarnet VIS

Impact assessment texture processing 24
Figure 9: Absorbance in the visible and near IR of microwave-treated
supernatants of carrot and chicory fibre.
The plots of absorbance against wavelength showed considerable instrumental
noise which may have been improved by performing more scans. The data was smoothed by obtaining a moving average over 24 values (data points are every 0.5 nm). The maximum absorbance was plotted against severity factor. The most
severely treated samples contained some sedimented material.

Impact assessment texture processing 25
Figure 10: Maximum of smoothed absorbance in the visible region of carrot and
chicory supernatants.

Impact assessment texture processing 26
4.1.3 FTIR absorbance of soluble fibre
Figure 11: FTIR spectroscopy of carrot and chicory supernatants. The traces are
coloured according to the temperature of the microwave treatment.
The increase in amount of solubilised polymer at moderate severities and its breakdown at higher severities is obvious. This is evidenced by the loss of the ester
group band at 1740 cm-1 and the appearance of free acid (1710 cm-1) and carboxylate (1600 cm-1) at high severities. Changes are also observed in the ‘fine’
structure which can be seen from 1200 to 800 cm-1.
4.1.4 Penetration tests
Microwave and pressure cooked samples
The penetration tests were done with a 1 kg load cell.

Impact assessment texture processing 27
Figure 12: Penetration tests showing the force at maximum depth of untreated
(○○), pressure-cooked (▲▲) and microwave-treated (●●) carrot and chicory
insoluble fibres in 20 g/100 ml suspensions.
The force at maximum depth (reflecting the amount of work being performed)
increases for all treatments for chicory fibre whereas for carrot fibre appears to require a severity factor in excess of 1 (Figure 12).
Figures 13 & 14 show the effect of treatment at increasing severity factor and concentration of fibre for both carrot and chicory fibre. It may be possible to reach the desired textural characteristics of the final product by either changing the fibre
concentration in the final product or changing the severity of pretreatment. The force at maximum depth obviously increases at higher fibre concentration due to
increased particle-particle interactions.

Impact assessment texture processing 28
Figure 13: Penetration tests showing the force at maximum depth of untreated,
pressure-cooked, and microwave-treated carrot and chicory insoluble fibres at 4
dilutions, coloured according to the severity factors listed.

Impact assessment texture processing 29
Figure 14: Penetration tests showing the work done (force × distance) of
untreated, pressure-cooked, and microwave-treated carrot and chicory insoluble
fibres at 4 concentrations.

Impact assessment texture processing 30
Figure 15: Penetration tests showing force against distance of untreated,
pressure-cooked, and microwave-treated carrot and chicory insoluble fibres at 4
dilutions. The traces are coloured as in the previous figure.

Impact assessment texture processing 31
Figure 15 shows force-distance curves for both carrot and chicory fibre at four selected fibre concentrations. Again the effect of higher fibre concentration can be
seen in the higher forces observed. Increased severity treatment also results in higher forces i.e. a stiffer ‘gel’/suspension. The force also increases as the probe
is pushed further into the sample.
In all subsequent experiments pressure cooking was at 120 °C for 10 min, steam-explosion was at 120 °C for 10 min and pre-cooking was at 60 °C for 40 min.

Impact assessment texture processing 32
4.1.5 Steam-exploded samples
The proportion of the initial dry matter recovered from the steam-exploded samples
without pre-cooking was; carrot 90.6% and chicory 43.6%. The proportion recovered from the pre-cooked and steam-exploded material was; carrot 75.0%
and chicory 51.3%. Neither the total mass recovered nor the proportions of soluble and insoluble material can be taken to be reliable. The low pressure means that
the explosive force is rather weak and so the material is not expelled effectively. The steam-exploded material was sticky and some remained in the flash tank and came out in the washings. The penetration tests used a 5 kg load cell for the pre-
cooked and steam-exploded material and a 1 kg load cell for samples steam-exploded without pre-cooking. The penetrations tests are shown below.
Figure 16: Penetration tests showing force at maximum depth and work done
(force × distance) of steam-exploded (open symbols) and pre-cooked and steam-
exploded (filled symbols) of carrot ○● and chicory insoluble fibres at 4
dilutions.

Impact assessment texture processing 33
Figure 17: Penetration tests showing force against distance of steam-exploded
and pre-cooked and steam-exploded carrot and chicory insoluble fibres at 4
dilutions.
4.1.6 Pressure-cooked samples
The dry matter recovered in the pellets and the supernatants are shown in Table
1. There was sufficient pre-treated fibre from each of the triplicate samples to prepare 3 samples for the penetration tests so samples were prepared at concentrations of 15.0, 17.5 and 20 g/100 mL. After testing the 15.0 g/100 ml
samples were diluted to 12.5 g/100 mL. The texture measurements were done with a 5 kg load cell.

Impact assessment texture processing 34
Figure 18: Penetration tests of pre-cooked and pressure-cooked carrot (orange
symbols) and chicory (blue symbols) insoluble fibres in 12.5, 15.0, 17.5 and 20.0
g/100 mL suspensions.
Figure 19: Penetration tests showing force against distance of steam-exploded
and pre-cooked and pressure cooked carrot and chicory insoluble fibres at 4
dilutions.
While these pre-cooked and pressure-cooked chicory samples showed similar mechanical properties as the pre-cooked and steam-exploded chicory (see figure
15), the carrot samples were not as strong. The dry masses of pellets and liquor are shown below.

Impact assessment texture processing 35
Table 4: Dry matter proportions of pellet and liquor from pre-cooked and pressure-
cooked carrot and chicory fibre.
Fibre Dry matter Pellet
Dry matter Liquor (g)
Water lost during pressure-cooking
Carrot 7.80 3.11 3.33 mL 2.35 %
Carrot 7.96 2.95 3.70 mL 2.58 %
Carrot 7.94 2.62 3.01 mL 2.34 %
Average ± s.d. 8.12 ± 0.10 2.89 ± 0.25 3.35 ± 0.35 mL
Chicory 5.88 1.19 5.69 mL 3.97 %
Chicory 6.00 1.25 5.42 mL 3.78 %
Chicory 5.96 1.18 5.44 mL 3.80 %
Average ± s.d. 5.95 ± 0.06 1.21 ± 0.04 5.52 ± 0.15 mL
s.d.: standard deviation
The total amount of material recovered was 98.1% for carrot and 96.1% for chicory.
Figure 20: Average + standard deviation (n = 3) of the proportions of original
fibre recovered in the insoluble and soluble fractions of pre-cooked and pressure
cooked fibre.

Impact assessment texture processing 36

Impact assessment texture processing 37
4.2 Effects of drying on swelling and water retention
Figure 21. The swelling and the water retention capacities of triplicate samples of
untreated and pre-treated carrot and chicory fibre were measured before and
after fluid bed drying; (a) carrot swelling, (b) carrot water retention, (c) chicory
swelling, (d) chicory water retention.

Impact assessment texture processing 38
The effect of fluid bed drying on the texture measured by penetration tests was investigated. Pastes of untreated and pre-treated fibres with and without drying
were prepared at 20 g/100 mL in water. The force at 10 mm depth was recorded. For the untreated chicory fibre the drying process amounts to a pre-treatment (Fig.
22). For the steam-exploded samples drying does not have much effect. After drying there was some impairment of texture of the precooked and pressure cooked
chicory samples.
Figure 22. Penetration tests at 20 g/100 mL. A single measurement after drying
was compared with duplicate undried samples.
The oil holding experiments to measure swelling before centrifugation were not
reliable. The dried solids do not soften in oil so the settle bed volume contained large oil-filled pores. The oil retention capacities were measured after centrifugation and draining. The results for duplicate samples are shown in Figure 23 for fluid bed
dried samples and freeze-dried samples which had not been fluid bed dried.
Before using pre-treated fibres as ingredients, industrial advice on drying and
milling will be required.

Impact assessment texture processing 39
Figure 23. Oil retention capacities after centrifugation and draining. Filled symbols
freeze-dried samples which had not been fluid bed dried; open symbols, fluid bed
dried samples. (a) carrot, (b) chicory.
Impact assessment texture processing 40
5 Results of chicory fibre from Sensus
5.1 Processing conditions
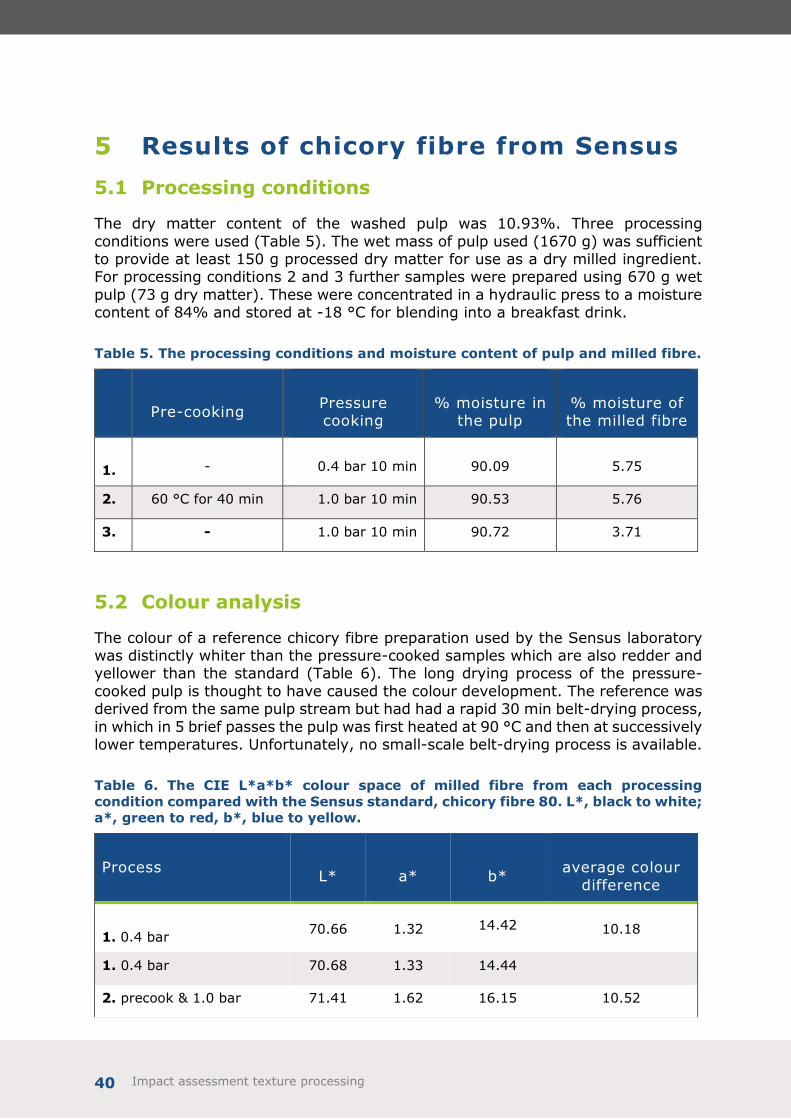
The dry matter content of the washed pulp was 10.93%. Three processing
conditions were used (Table 5). The wet mass of pulp used (1670 g) was sufficient to provide at least 150 g processed dry matter for use as a dry milled ingredient. For processing conditions 2 and 3 further samples were prepared using 670 g wet
pulp (73 g dry matter). These were concentrated in a hydraulic press to a moisture content of 84% and stored at -18 °C for blending into a breakfast drink.
Table 5. The processing conditions and moisture content of pulp and milled fibre.
Pre-cooking Pressure cooking
% moisture in the pulp
% moisture of the milled fibre
1. - 0.4 bar 10 min 90.09 5.75
2. 60 °C for 40 min 1.0 bar 10 min 90.53 5.76
3. - 1.0 bar 10 min 90.72 3.71
5.2 Colour analysis
The colour of a reference chicory fibre preparation used by the Sensus laboratory was distinctly whiter than the pressure-cooked samples which are also redder and yellower than the standard (Table 6). The long drying process of the pressure-
cooked pulp is thought to have caused the colour development. The reference was derived from the same pulp stream but had had a rapid 30 min belt-drying process,
in which in 5 brief passes the pulp was first heated at 90 °C and then at successively lower temperatures. Unfortunately, no small-scale belt-drying process is available.
Table 6. The CIE L*a*b* colour space of milled fibre from each processing
condition compared with the Sensus standard, chicory fibre 80. L*, black to white;
a*, green to red, b*, blue to yellow.
Process L* a* b*
average colour
difference
1. 0.4 bar 70.66 1.32 14.42 10.18
1. 0.4 bar 70.68 1.33 14.44
2. precook & 1.0 bar 71.41 1.62 16.15 10.52

Impact assessment texture processing 41
2. precook & 1.0 bar 71.43 1.62 16.13
3. 1.0 bar 72.81 1.46 14.83 8.60
3. 1.0 bar 72.86 1.46 14.82
4. standard 79.58 0.04 9.70
4. standard 79.58 0.05 9.67
5.3 Water holding capacity
The water holding capacities of the chicory fibre (Table 7) from the 3 treatments
were all similar, but significantly lower than the normal range (6.5 to 8.0) for chicory root fibre that has had no pressure treatment (Ramasamy et al. 2013). The less than ideal drying method might have impaired the water holding capacity.
Table 7. The water holding capacity (WHC) of the pressure-cooked, dried and
milled chicory fibre.
Process WHC g/g
1. 0.4 bar 5.1
2. precook & 1.0 bar 4.8
3. 1.0 bar 5.0
5.4 Dough and bread properties
There was little or no difference in dough behaviour and proofing (Table 8), and in the measured tenderness and resilience of the breads 1 day and 7 days after baking
(Table 9). At 7 days the effects of staling were obvious and there was mould on all of the breads. There were no significant differences in measured properties
between breads with differently treated chicory.
Table 8. Qualitative dough properties.
Process: 1 2 3 Standard
Dough
temperature 25.9 °C 26.2 25.6 26.7

Impact assessment texture processing 42
Dough
properties
Good, a bit
denser Good
Good, a bit
denser Good
Dough
colour
very light
brown with
darker particles
very light
brown with
darker particles
very light
brown with
darker particles
creamy white
Gluten
development good good Good good
Stickiness no no No no
First proof good good Good good
Moulding
behaviour
Good, smooth.
A bit more
pleasant.
Good, smooth
Good, smooth.
A bit more
pleasant.
Good, smooth
Volume final
proof Good, high Good, high Good, high Good, high
Baking Good, high Good, high Good, high Good, high
Table 9. Measured properties of the baked breads.
Process: 1 2 3 Standard
Baked bread properties, average of 4 breads.
Mass g 495 494 496 493
Volume mL 3513 3525 3483 3508
Density g/mL 0.14 0.14 0.14 0.14
Baking loss % 17.5 17.7 17.3 17.8
Texture of bread 24 h after baking, average of 5 slices.
Tenderness g (s.d.) 324 (7) 349 (17) 308 (15) 336 (33)
Resilience % (s.d.) 37 (0.62) 36 (0.89) 35 (1.23) 37 (1.03)
% moisture 47 48 47 47
Water activity, Aw 0.96 0.97 0.97 0.96
Texture of bread 7 days after baking, average of 5 slices.
Tenderness g (s.d.) 1113 (15) 967 (41) 990 (25) 1113 (15)

Impact assessment texture processing 43
Resilience % (s.d.) 47 (0.66) 46 (1.63) 49 (1.83) 47 (0.66)
% moisture 46 47 47 46
Water activity, Aw 0.96 0.96 0.97 0.96
s.d.: standard deviation
Photographs were taken to show the appearance of the dough, the final proof, the
baked bread, the top crust and the structure in the slice (Figure 24). Some black specks could be seen in the top crust of the breads containing pressure cooked fibre and the colour of the slice was slightly greyer.
Figure 24. Photographs of the dough, the final proof, the baked breads, the top
crust and the sliced view. The breads are numbered with the following additions
of fibre: (1) a standard chicory fibre chicory fibre 80; (2) Process 1, 0.4 bar at 10
min, (3) Process 2, precooked and pressure cooked at 1 bar for 10 min, (4)
Process 3, pressure cooked at 1 bar for 10 min.

Impact assessment texture processing 44
5.5 Summary of the baking tests.
The colour of the dough containing milled pressure cooked chicory fibre was
noticeably darker than the reference and dark spots were visible (Figure 24). There was not much difference between the baked breads in this series. The most striking
aspects are the tiny dark spots in the top crust and a crumb colour, which was slightly greyer (Table 10).
Table 10. Sensory properties of the baked breads after 24 h.
Process: 1 2 3 Standard
Shape Good, round top Good, round top Good, round top Good, round top
Crust
colour
Good, light brown.
Small dark spots
are visible.
Good, light brown.
Small dark spots
are visible.
Good, light brown.
Small dark spots
are visible.
Good, light
brown
Crumb
colour light greyish light greyish light greyish very light greyish
Cell
structure
fine and coarse
cells
fine and coarse
cells
fine and coarse
cells
fine and coarse
cells
Texture very soft very soft very soft very soft
Eating
quality good, soft good, soft good, soft good, soft
5.6 Application in a breakfast drink
5.6.1 Sensory analyses
First, the relation between the different attributes and the overall liking was
determined.
Thickness. The percentage addition and the particle size of the chicory fibre both had a significant impact on the thickness appearance of the breakfast drink (P 0,01
< 0,05),

Impact assessment texture processing 45
Flavour. The percentage addition of the chicory fibre had a negative correlation with the banana flavour intensity, regardless of particle size.
Scent. There was no significant influence of the chicory fibre percentage addition and the particle size on the banana scent.
Chewiness. Surprisingly, there was no significant influence of the addition percentage and particle size of the chicory fibre on the chewiness of the breakfast
drink. The average difference between the scores of the chewiness rating and the preferred chewiness is 5.64. The chewiness rating of the breakfast drink always scored higher than the preferred chewiness. Therefore, in order to increase
consumer acceptance for the product, the chewiness must be reduced, even though the direct influence of the percentage addition and particle size seems to be
unclear.
Overall. There was no significant influence of the percentage addition and particle size on the overall experience of the samples. The mean scores of four samples
were higher than 6,00 (samples 424 to 255 in Table 11). A score above 6,5 is objectively deemed acceptable. Samples containing (5%, 0,75 – 1,0 particle
length) and samples containing (15%, 0,5 – 1,0 particle length) scored above a 7,08, with the samples containing (15%, 0,5 – 1,0 particle length) scoring an 8.1, considered an exceptional score for a prototype application product.
Table 11: Significant differences and mean scores between overall experience
results of groups (method: 95,0% LSD).
sample # Count Mean Homogeneous
groups
588 4 3,50 X
935 5 4,74 XX
862 5 4,92 XX
268 4 4,95 XXX
287 5 4,98 XX
656 6 5,42 XXX
374 5 5,58 XXX
698 4 5,65 XXX
849 4 5,85 XXX
424 5 6,06 XXX
375 5 6,46 XXX
821 5 7,08 XX
255 4 8,10 X
Impact assessment texture processing 46
Sensory parameters effect on overall experience. None of the parameters (thickness, banana smell, banana flavour, chewiness) had a significant relationship
with the overall experience (liking). This is interesting in particular when looking at chewiness, due to all sample chewiness ratings scoring higher than the preferred
scores as well as >50% of panellists indicating in the comment section that they particularly dislike the chewiness. Therefore, it would make sense that the
chewiness affects the overall experience ratings, however this hypothesis is denied by the results.
Furthermore, the history of use of the panellists had no significant relation with the
overall experience.
Buy intention. The only significant correlation (p<0,001) was between the buy
intention and the overall experience. It can be said that a high overall experience leads to a high buy intention. Another observation is that females had a significantly higher overall experience than males (6,56 vs. 5,15, p<0,05) which could mean
that this product is more marketable to women than men.
5.6.2 Recipe optimization
The preference results showed no significant differences per sample, therefore the preference results are used as the general preferred recipe.
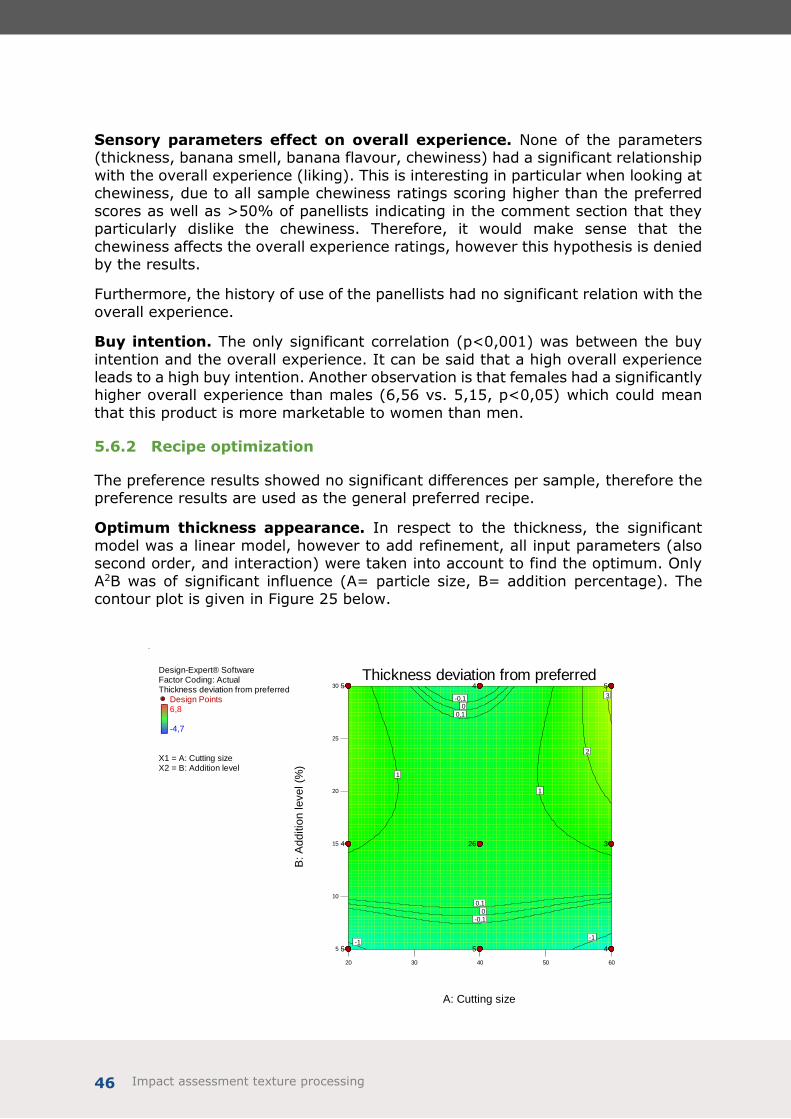
Optimum thickness appearance. In respect to the thickness, the significant
model was a linear model, however to add refinement, all input parameters (also second order, and interaction) were taken into account to find the optimum. Only
A2B was of significant influence (A= particle size, B= addition percentage). The contour plot is given in Figure 25 below.
Design-Expert® SoftwareFactor Coding: ActualThickness deviation from preferred
Design Points6,8
-4,7
X1 = A: Cutting sizeX2 = B: Addition level
20 30 40 50 60
5
10
15
20
25
30
Thickness deviation from preferred
A: Cutting size
B:
Ad
ditio
n le
ve
l (%
)
-1-1
0
0
1
1
2
3
0,1
0,1
-0,1
-0,1
54
26 3
5
4
5
45

Impact assessment texture processing 47
Figure 25: Contour plot of thickness deviation from preferred.
As can be determined from the plot, in respect to optimum thickness appearance
(difference of sample rating and preferred rating = 0) the plot has 2 optima: percentage addition of ca. 27% to 30% with medium particle size (40 s). One
optimum at a percentage addition of 7%, regardless of particle size.
Optimum banana smell. No significant model could be found to describe the results. Therefore, the overall average would describe the data the best. With
respect to optimum conditions, both particle size and percentage addition can be varied freely without significantly influencing the distance to the preferred rating.
Optimum banana flavour. A quadratic model was the most significant descriptor of the data, the percentage addition is a significant influence on the difference between the actual and preferred ratings. In Figure 26 below, the optimum banana
flavour can be obtained at a percentage addition of ca. 5% - 10%, regardless of particle size.
Figure 26: Contour plot of banana flavour deviation from preferred.
Optimum chewiness. No significant model could be found to describe the data; however, it was observed that all actual chewiness ratings were above the preferred
chewiness. Therefore, no optimum combination of the percentage addition and particle size could be found that matches the preferred level of chewiness.
Optimum recipe. For the particle size (0,75 – 1,0 cm length) and percentage addition (7,6%) the resulting attributes are calculated as follows:
- Thickness deviation form preferred = -0,1
- Banana smell deviation from preferred = 0
Design-Expert® Software
Factor Coding: Actual
Flavor deviation from preferred
Design Points
7,6
-5,8
X1 = A: Cutting size
X2 = B: Addition level
20 30 40 50 60
5
10
15
20
25
30
Flavor deviation from preferred
A: Cutting size
B:
Additio
n level (%
)
-2
-1
-1
0
11
-0,10,1
54
26 3
5
4
5
45

Impact assessment texture processing 48
- Banana flavour deviation from preferred = 0 - Chewiness deviation from preferred = 1,8
- Overall rating = 6,6
Based on these results, a realistic possibility exists to create an acceptable
breakfast drink product by utilizing the current ingredients, however the chewiness deviation from preferred needs to be reduced (preferably to 0) by softening the
chicory fibre during processing by washing with citric acid. (Brandt, Jeltema, & Jeltema, 2006)
5.6.3 Nutritional facts of optimized recipe
Based on the optimization results for the breakfast drink recipe the following nutritional facts could be assembled.
Table 12: Nutritional facts of the optimized breakfast drink recipe.
Per 100g Banana Raspberry
Chicory fibre
(fresh)
Yoghurt (0,5%)
Inulin (L85)
Breakfast drink +
chicory fibre
Energy
(Kcal) 89 53
21 38 176 58,9
Fat (g) 0,3 0,7 0,11 0,5 0 0,4
Sat. fat (g) 0,1 0 0 0,5 0 0,3
Carbohydrate
(g) 23 12
0,11 4 13 11,1
Sugars (g) 12 4,4 0,11 4 13 6,9
Fibre (g) 2,6 7 8 0 62 3,0
Protein (g) 1,1 1,2 0,84 3,5 0 2,3
Sodium (g) 0,001 0,001 0 0,0013 0 0,0
This is the prototype recipe for the breakfast drink containing chicory fibre, with 38% banana, 8% chicory fibre (particle size = 0,75 -1,0 cm), 52% yoghurt, and 2% inulin (Frutalose L85), which shows that the optimized recipe would easily
qualify for a “high in fiber” claim in contrast to currently existing breakfast drinks on the Dutch market.

Impact assessment texture processing 49
6 Conclusions
The plant cell wall pulps from inulin manufacture and from carrot juice manufacture
are useable sources of fibre for human nutrition. Neither manufacturing procedure (inulin or juice manufacture) leaves a sterile pulp since they are not high
temperature processes. For use as an ingredient, both pulps require sufficient cleaning for incorporation into cooked and uncooked foods. Provalor and VeggieFiber had achieved this for carrot and chicory pulp respectively.
The chicory pulp waste stream directly from the Sensus inulin factory consists of coarsely chopped roots containing large and inedible particles of toughened
epidermal tissues as well as sand and silt and numerous viable bacterial spores.
Under this project, the uses of thermophysically-treated chicory pulp were trialled. The thermophysically-treated pulp can be incorporated as a milled product into
bread at 2% of the flour with no loss of loaf volume and no impairment of taste or texture.
With respect to the application of undried chicory pulp in a breakfast drink an optimum recipe could be determined. Based on consumer sensory trials, an optimal recipe was determined for a particle size of 7,5 mm – 10 mm and a percentage
addition of 7,6%; the resulting overall score was 6,6, which is objectively considered an acceptable score for the palatability of insoluble chicory root fibre
inside a prototype breakfast drink. Based on these results a business model, including a production process and different commercial scenarios will be established.
The polysaccharide composition and the water holding capacity of chicory pulp, ensiled pulp and partially extracted pulp has been studied previously (Ramasamy
et al. 2013).
The results demonstrate a technologically feasible route for the utilisation of
defined, traceable residues from the food manufacturing industries to impart functional characteristics when reformulating existing product recipes. In both the bread product and the breakfast drink, it was possible to add chicory fibre to
produce a high-fibre product with no adverse effect on product quality when compared against a conventional equivalent product.

Impact assessment texture processing 50
7 References
Blakeney, A. B., P. J. Harris, R. J. Henry, and B. A. Stone. 1983. "A simple and rapid
preparation of alditol acetates for monosaccharide analysis." Carbohydrate Research 113
(2): 291-299.
Blumenkrantz, N., and G. Asboe-Hansen. 1973. "New method for quantitative
determination of uronic acids." Analytical Biochemistry 54 (2): 484-489.
Brandt, L., Jeltema, M. Z., & Jeltema, B. (2006). Effects of Cooking in Solutions of
Varying pH on the Dietary Fiber Components of Vegetables . Journal of Food Science,
900.
Cardoso, C., R. Mendes, and M. L. Nunes. 2007. “Dietary fibers' effect on the textural
properties of fish heat-induced gels.” Journal of Aquatic Food Product Technology 16 (3):
19-30.
Castro, A., B. Bergenståhl, and E. Tornberg. 2012. "Parsnip (Pastinaca sativa L.):
Dietary fibre composition and physicochemical characterization of its homogenized
suspensions." Food Research International 48 (2): 598-608.
Castro, A., B. Bergenståhl, and E. Tornberg. 2013. "Effect of heat treatment and
homogenization on the rheological properties of aqueous parsnip suspensions." Journal of
Food Engineering 117 (3): 383-392.
Femenia, A., A.‐C. Lefebvre, J.‐Y. Thebaudin, J.A. Robertson, and C.‐M. Bourgeois. 1997.
"Physical and sensory properties of model foods supplemented with cauliflower fiber."
Journal of Food Science 62 (4): 635-639.
Kuniak, L., and R.H. Marchessault. 1972. “Study of cross-linking reaction between
epichlorhydrine and starch.” Starch/Stärke 4: 110-116.
Maertens, L., H. Guermah, and A. Trocino. 2014. “Dehydrated chicory pulp as an
alternative soluble fibre source in diets for growing rabbits”. World Rabbit Science 22: 97-
104.
Mehinagic, E., G. Royer, D. Bertrand, R. Symoneaux, F. Laurens, and F. Jourjon. 2003.
"Relationship between sensory analysis, penetrometry and visible–NIR spectroscopy of
apples belonging to different cultivars." Food Quality and Preference 14 (5): 473-484.
Meilgaard, M. C., Civille, G. V., & Carr, B. T. (2007). Sensory Evaluation Techniques
(4th Edition ed.). Boca Raton, FL: CRC Press.
Overend, R., P., E. Chornet, and J. A. Gascoigne. 1987. "Fractionation of lignocellulosics
by steam-aqueous pretreatments." Philosophical Transactions of the Royal Society of
London A: Mathematical, Physical and Engineering Sciences 321 (1561): 523-536.
Ramasamy, U.S., H. Gruppen, and H. A. Schols. 2013. “Structural and water-holding
characteristics of untreated and ensiled chicory root pulp”. Journal of Agricultural and Food
Chemistry 61: 6077-6085.