impact evaluation of 24+ advanced learner loans research ... · 4.6 whether eligible learners who...
TRANSCRIPT

Impact Evaluation of 24+ Advanced Learner Loans Research report November 2018
IFF Research on behalf of DfE

2
Contents List of figures 5
List of tables 7
1. Executive Summary 8
1.1 Background 8
1.2 Research Objectives 8
1.3 Method 9
1.4 Key Policy Findings 9
1.4.1 The participation and profile of learners 9
1.4.2 Impact of loans on learner behaviour and motivation 11
1.4.3 Awareness of loans 12
1.4.4 Impact of loans on provider behaviour 13
2. Introduction 14
2.1 Background 14
2.2 24+ Advanced Learner Loans: Terms and Conditions 15
2.2.1 Eligibility 15
2.3 Loan amounts and what they cover 15
2.4 Payments and repayments 16
2.5 Apprenticeships 17
2.6 The role of learning providers 17
2.7 Existing research 18
2.7.1 24+ Advanced Learner Loans Impact Assessment 18
2.7.2 Process Study of 24+ Advanced Learner Loans 18
2.8 Research Objectives 19
2.9 Method 19
2.9.1. Learners 19
2.9.2. Providers 21
2.10 About this report 21
2.11 Report Interpretation 22
3. Impact on learner volumes 24

3
3.1 Aims of the statistical impact analysis 25
3.2. Using historical data to estimate the impact of the move to a loans-based environment 26
3.3 Net impact of the move to a loans-based environment on learner aims and volumes 29
3.4 Impact on course types 34
3.5 Impact on completion and achievement volumes 38
3.6 Evidence of displacement 42
4. Learners: initial awareness and use of 24+ Advanced Loans 46
4.1 About the Learners Survey 47
4.2 Funding the course through 24+ Advanced Learner Loans 47
4.3 Awareness of and sources of information about 24+ Advanced Learner Loan 50
4.4 Understanding of 24+ Advanced Learner Loans 52
4.5 Reasons why Eligible learners did not withdraw 24+ Advanced Learner Loans 53
4.6 Whether eligible learners who did not apply for a 24+ Advanced Learner Loan would do so now 56
4.7 The 24+ Advanced Learner Loans Bursary Fund 56
5. Learners: Motivations for learning and factors driving decision-making 58
5.1 Motivations for learning 59
5.2 Factors considered when choosing type of learning and provider 62
5.3 Funding information sought and sources used 65
6. Learners: Stated impact of 24+ Advanced Learner Loans on learning decisions 67
6.1 The extent to which Loans open opportunities to learners 67
6.2 The impact of 24+ Advanced Learner Loans on learners’ decision-making 69
6.3 Levels of 24+ Advanced Learner Loans recommendation 71
7. Learners: Satisfaction with course to date and anticipated impacts of learning 72
7.1 Attitudes towards learning and behaviour on courses 73
7.2 Whether would change options if had time again 74
7.3 Benefits of undertaking learning 76
8. Learner: Destinations 79
8.1 Destinations of learners after finishing their course 79
9. Providers: Information provision 83

4
9.1 Dealing with queries raised by students 84
9.2 Provision of information on 24+ Advanced Learner Loans to students and key messages used 88
9.3 Use of materials on the 24+ Advanced Learner Loans practitioner site 90
10. Providers: Views on learner take-up and changes to offers 92
10.1 Learner Volumes 93
10.2 Level of use of loans facility 96
10.2.1 Take-up of loans compared to expectation 97
10.2.2 Applying for an increase in loan facility 100
10.2.3 Trends in the take-up of the loan facility 101
10.3 Bursary fund 103
10.4 Changes to provider offers 106
10.5 Changes in fees 108
11. Providers: Administration process and procedures 110
11.1 Providers workload 110
11.2 The administrative process 111
11.3 Providers: Overall perceptions 115
5
List of figures Figure 3.1: Participation volumes over time: Learners 29
Figure 3.2: Participation volumes over time: Aims 30
Figure 3.3: Aims volumes for each course type over time 36
Figure 3.4: Participation numbers for the eligible group, 24+ level 3 only, and counterfactual group B (aged 24+ on full level 2 course): Aims 43
Figure 3.5: Participation numbers for the eligible and counterfactual group B (aged 24 on full level 2 course) and comparison younger full level 2: Aims 43
Figure 3.6: Participation numbers for the eligible 24 years level 3 and counterfactual group B (24 years on full level 2 course) and comparison younger 23 years full level 2: Aims 44
Figure 4.1: Method of funding study 47
Figure 4.2: Method of funding study by subject 48
Figure 4.3: Proportion of eligible learners who funded or applied for a 24+ loan 54
Figure 4.4: Reasons given by eligible learners for not applying for the loan 55
Figure 5.1: Learner motivations to study 59
Figure 5.2: Main motivations to study 60
Figure 5.3: Main motivations to study, by Loan status 61
Figure 5.4: Extent to which providers met learners’ needs and requirements 63
Figure 5.5: Importance of factors when learner first started to think about studying 64
Figure 5.6: Ease of sourcing general funding information 66
Figure 6.1: Implications if Loans learners had not taken out a Loan 70
Source: learner survey, question F1 71
Figure 7.1: Overall satisfaction with course 73
Figure 7.2: Satisfaction with aspects of the course 74
Figure 7.3: Stated benefits of undertaking learning 76

6
Figure 7.4: Learners’ stated actions if redoing their qualification 77
Figure 8.1: Earnings at the point of participation in the research 81
Figure 8.2: Expectations of reaching a salary of £21,000 82
Figure 9.1: Provider confidence in handling queries from prospective learners 86
Figure 10.1: Change to number of Level 3 or 4 learners aged 24 and over, between 2013/14 and 2014/15 94
Figure 10.2: The breakdown by provider in terms of proportion of initial loan facility committed in 2014/15 97
Figure 10.3: Take up of loans compared to expectation, between 2013/14 and 2014/15. 98
Figure 10.4: Proportion of students using Loans among providers who had any take-up of loans at time of survey, by type of provider 99
Figure 10.5: Changes made as a direct result of 24+ Advanced Learner Loans in 2013/14 and 2014/15 106
Figure 11.1: Difficulties / issues with the SLC faced by institutions that have had any take-up of 24+ Advanced Learner Loans 112
Figure 12.1: Providers’ perception of the Advanced Learner Loan, between 2013/14 and 2014/15 116

7
List of tables Table 2.1 Profile of achieved interviews........................................................................... 20
Table 3.1 Illustration of the difference in differences method (using fictional data) .......... 27
Table 3.2 Participation for the eligible and counterfactual group over time ...................... 31
Table 3.3 Difference in differences impact results for AIMS participation volumes .......... 32
Table 3.3a Difference in differences impact results for AIMS participation volumes (with consideration of gender, LLDD and ethnicity added) ....................................................... 33
Table 3.4 Difference in differences impact results for LEARNER participation volumes .. 33
Table 3.4a Difference in differences impact results for LEARNER participation volumes (with consideration of: gender, LLDD, ethnicity added) ................................................... 34
Table 3.5 Aims achievement and completion volumes for the Loans eligible and counterfactual group A ..................................................................................................... 39
Table 3.6 Difference in differences impact results, Achievement rates ............................ 41
Table 3.7 Difference in differences impact results; Displacement Analysis ..................... 44
Table 4.1: Channels through which learners first heard about 24+ Advanced Learner Loans ............................................................................................................................... 51
Table 4.2: Learners’ understanding of terms and conditions of 24+ Advanced Learner Loans ............................................................................................................................... 52
Table 6.1: Opportunities provided by availability of loan .................................................. 68
Table 6.2: Alternative funding sources had the loan not been available .......................... 71
Table 7.1: Likelihood of taking different course of action, if deciding now........................ 75

8
1. Executive Summary
1.1 Background In recent years, the Government has focused grant funding on those who are likely to face the greatest barriers to learning: young adults (aged 19-23) and adults without basic literacy and numeracy skills. In line with this, from 2013-14, grant funding for individuals aged 24 and above studying at Level 3 and Level 4 was withdrawn, with learners paying the full cost of their learning.
To continue to encourage and facilitate participation of those aged 24 and over, income contingent-repayment loans for provision at Level 3 and Level 4 (called 24+ Advanced Learner Loans) were introduced at the same time. These follow a similar model to Student Loans in Higher Education.
It was also hoped that, besides providing funding to enable learners to continue with their learning, 24+ Advanced Learner Loans would have other benefits; namely, that the availability of loan-funding would incentivise learners to become more informed customers, and to choose courses likely to bring the highest benefits, whilst maintaining or improving the proportion achieving their qualification. Meanwhile, it was hoped that the loans would encourage providers to become more responsive to learner needs and to ensure high quality provision.
This research was commissioned by the Department for Business, Innovation and Skills. Policy responsibility for this topic has since transferred to the Department for Education. As such, the research is being published by the Department for Education.
1.2 Research Objectives The aim of this impact evaluation is to provide a robust assessment of the impacts of the initial roll-out of 24+ Advanced Learner Loans. It covers the Loans made available for those aged 24 and over studying Level 3 and 4 qualifications. Since the commissioning of this research, Advanced Learner Loans have been extended to cover other groups of learners.
The intention was to provide an evaluation that will stand up to scrutiny and serve as evidence for informing future FE policy. In particular, this evaluation seeks to explore: the impact that the loans-based system has had on the participation and profile of learners on eligible courses; the impact the removal of grant-funding has had on learner motivation and behaviour; and the impact it has had on provider behaviour.

9
1.3 Method The research was conducted with two key audiences: learners and providers.
The first strand of research relating to learners involved analysis of the administrative data contained in the Individualised Learner Record (ILR). This involved making comparisons of learner numbers and their demographics between those who had enrolled in the 2014/15 academic year and learners who were enrolled on eligible courses in the academic years preceding the introduction of loans.
A quantitative survey of 6,300 learners who were on eligible courses was conducted between February and May 2016 relating to the learners’ study period in 2014-15. The sample included both those who had and had not taken out loans, and a comparison group of learners aged 19-23 on eligible courses.
The research with providers was both qualitative and quantitative. Twenty face-to-face interviews were conducted with providers holding a loan facility, covering a range of sizes, types and locations. In addition, a quantitative survey was conducted with 250 providers, all of whom had a loan facility, and again from a range of sizes, types and locations. It took place between June and August 2015.
1.4 Key Policy Findings
1.4.1 The participation and profile of learners
The first couple of years of the introduction of a loans-based environment for those aged 24+ has been associated with a marked drop in the volumes of both learners and learning aims being studied on eligible courses.
The number of learners on loans-eligible courses fell from 142,000 in 2012/13 to 98,000 in 2013/14 (and further to 94,000 in 2014/15).
Difference-in-difference analysis was used to estimate the extent to which this fall in numbers can be attributed to the move to a loans-based environment. The difference-in-differences methodology is a trend analysis. It aims to predict what the volume of 24+ learners might have been in the absence of a move from a grant-based to a loan-based environment. It uses the historic trend in learner volumes among a group unaffected by the change (19-23 year olds on loans-eligible courses) to help with estimating what these volumes might have been. The key assumption is that the learner volumes for the Loans and comparison group would have followed the same trend in the absence of the introduction of Loans. This assumption relies on the fact that other than the move to a loans-based environment, there have been no changes that would have been expected to impact on learner volumes and particularly none that would have impacted the loans-

10
eligible and comparison groups differently. Hence, the technique assumes that in the period immediately pre and post the introduction of Loans;
• There were no other changes to funding arrangements for learning at these levels that might have impacted on learner volumes (for example, no other changes to funds that providers can access through the state or through other sources such as the European Social Fund);
• There were no particular changes to the places offered by providers for these courses that would have impacted learner volumes.
These assumptions make it possible to distinguish between the change in learner volumes that can be attributed directly to the introduction of a loans-based environment, and the background change that is likely to be a result of general economic factors. However, these assumptions mean that quantitative results on the impact of the loans have some degree of uncertainty.
This initial analysis indicates that the negative impact on learner volumes that can be directly attributed to the introduction of a loans-based environment is equivalent to a drop of around 33,900 learners (a -26% drop). However, it is important to note that other findings from analysis of sub-groups suggests that this is likely to slightly overestimate the negative impact of the introduction of a loans-based system.
This analysis takes account of the fact that learner volumes among the loans-eligible group were falling slightly over time any way (as were those for 19-23 year olds on loans-eligible courses who were unaffected by the move from a grant-based to a loans-based model). Much of the rest of the change in learner volumes is likely to be the result of changes in learner demand in response to economic conditions – for example, variations in the employment rate and the types of job opportunities available to potential learners, as well as changes in the welfare system.
The learner volumes on Access to HE courses are estimated to be largely unaffected by the move to a loans-based environment1, while aims volumes for other courses (A levels, Level 3 Certificates and Diplomas, Level 4 Certificates and Diplomas) have fallen. This is likely to be partly a result of Access to HE 24+ Advanced Learner Loans being written off for learners who progress to and complete an HE course.
Difference-in-difference impact analysis also shows that the move to a loans-based environment resulted in a very small fall in the achievement rate. This is not the improvement that might have been hoped for as a result of encouraging learners to invest more directly in their learning. This analysis indicates that the introduction of Loans
1 These account for around 18,000 of the 97,000 learning aims undertaken by eligible learners in 2014/15

11
was associated with a fall in the overall achievement rate of 1.3 percentage points between 2012/13 and 2013/14, and 1.9 percentage points between 2012/13 and 2014/15. However, other findings from analysis of sub-groups suggests that this is likely to be a slight overestimate.
There is no evidence of a large displacement effect – whereby those who would have studied at Level 3 have chosen to study at Level 2 instead because these still attracted grant funding, or whereby providers have effectively substituted Level 3 learners with different learners studying at Level 2.
1.4.2 Impact of loans on learner behaviour and motivation
Take up of loans among loans-eligible learners was quite high. Two-thirds (65%) of eligible learners had chosen to take out a Loan.
Without the introduction of Loans alongside the reduction in grant-funding, the fall in learner numbers would have been considerably larger. 44% of those who took out a Loan stated that without access to a Loan they would not have undertaken any learning at all. Many of the remainder suggested that they would have amended their study in other ways, such as by choosing a cheaper course.
In addition, the availability of Loans provided others with more options for their study. Large proportions of those who had taken out a Loan stated that the availability of a Loan enabled them to study at a higher level of qualification than would otherwise have been possible and/or to start their study sooner.
For all learners, when making the decision to learn, the cost of learning was less important than other factors, such as the subject of study and the opportunities it would afford them (though still relatively important).
There is a suggestion that learners become more discerning, motivated and engaged learners when undertaking their study in a loans-based environment. Compared to those aged 19-23 on similar courses, loans-eligible learners tended to: look at a slightly larger number of providers before making their decision; notice a greater difference in cost between provider offers; and were more likely to feel that they have made the most of their time studying. However these differences were small and it is likely that the different ages of the two learner groups plays at least some part in explaining these differences in behaviour.
Similarly loans-eligible learners were slightly more likely to voice dissatisfaction with aspects of their course and were more likely to feel that they would make a different learning decision if making the choice again now. This may reflect that they are setting increased expectations of their learning, given that they are studying within a loans based environment.

12
There is also a suggestion that a loans-based environment leads to more career-focussed learning. Learners undertaking their study in a loans environment were slightly more likely to be motivated by career progression and tangible and immediate employment benefits. They reported being in more senior job roles and tended to be earning more than learners aged 19-23 who had studied similar courses. However, again, the differing ages of the loans-eligible and comparison groups is likely to play a role in explaining this.
However, these changes are not reflected in changes in the achievement rate. As shown above, the move from a grant-based environment to a loans-based one has actually had a small negative impact on the achievement rate.
Overall, learners who took out a Loan feel positively about them. There is a very high reported likelihood to recommend Loans to other learners in similar situations.
1.4.3 Awareness of loans
The majority of learners knew about the availability of the 24+ Advanced Loan before starting their studies, with a further small proportion finding out and applying for a loan upon starting.
However, there remained room to raise awareness of Loans, both overall and with regards to specific terms and conditions, as learners still showed signs of holding misconceptions (for example, few knew about the repayment of the loan being tied to rates of inflation). Over a fifth of learners who did not take out a loan would take one out knowing what they know now.
Providers were a key source of information for learners to find out about funding; both more generally and specifically about the 24+ Advanced Loan. Learners were greatly influenced in their knowledge by what providers told them about Loans. Providers are most comfortable talking to learners about the fact that Loans do not need to be paid back until after learners reach an earnings threshold of £21,000 and that Loans for Access to HE courses are written off if they progress to Higher Education. This is reflected in the fact that learners are most likely to understand these particular terms and conditions, while being more likely to have misconceptions about other aspects of the Loan offer.
Fear of debt is still a key barrier to take up. It was reported by learners as one of the key reasons why they had not applied for a Loan, as well as by providers who reported having learners approach them with concerns. In several cases, providers reported that speaking with learners and reassuring them about the payment terms (particularly in terms of not having to pay back Loans if their earnings do not reach £21,000) helped learners to overcome this fear.

13
1.4.4 Impact of loans on provider behaviour
Providers are still mixed in attitude towards loans, but overall the picture is cautiously optimistic. Most providers see loans as an opportunity (significantly more than did the previous year) for their business. This is particularly the case for private providers who, after having seen a sharp dip in their numbers of learners enrolling in the first year of the introduction of loans, have now seen numbers stabilize.
Providers reported an increased comfort in dealing with queries about Loans and in marketing Loans to students.
There is optimism around providers’ offerings too: more providers have increased their provision this year. This has mainly been in Access to HE and Level 3 qualifications, as this is where most of the demand is.
Providers also appear to have set more realistic expectations of what take-up will be and how much of their loan facility they will use: the proportion applying for an increase in their loans facility has stabilized and a higher proportion said take-up was as they expected. The proportion not changing their fee structure has increased significantly from last year.
Providers seem to have adjusted to the change in processes and different responsibilities that administering loans brings: while they continue to report an increased workload, more providers (compared to the previous year) think it is manageable rather than difficult to manage.
There are still some quirks in the administrative process that need to be ironed out from the provider perspective. For example, the Student Loans Company (SLC) helpline still presents some issues, along with the delayed decision from the SLC on some students’ Loan applications. However, overall, provider interaction with the SLC is reported to have improved since the previous year, particularly among private providers.
Lastly, providers are taking action to better prepare themselves for the loans-based environment. For example, they are adapting and customizing their marketing to students (which, one would hope, would make it more digestible for the small minority of students who report finding the loans application process confusing) by adjusting the timing of their communications to students to earlier in the academic year so that providers are able to predict their funding more reliably as well as raise awareness of loans.

14
2. Introduction
2.1 Background The Further Education (FE) sector provides training programmes and academic courses to help people get the skills required for productive employment. FE colleges and training providers set their own fees, but the Government subsidises learners by providing grant funding. As a result, some learners pay nothing for FE; some pay part of the fee; and others pay the whole fee.
Government funding for FE is allocated in line with evidence showing:
• The returns to different levels (and size and types) of qualifications that individuals realise in employment – which shows that those with higher qualifications realise higher returns; and
• The barriers faced by different types of individuals in participating in learning – which are greatest for younger learners and those with lowest (or no) qualifications.
Following the 2010 Comprehensive Spending Review, the budget for FE grant funding was reduced from £2.8 billion to £2.3 billion between 2010-11 and 2014-15. To ensure this level of funding would realise the maximum benefit for individuals and the economy, the Government focused grant funding on the individuals that evidence suggests face the greatest barriers to learning: young adults (aged 19-23) and adults without basic literacy and numeracy skills. In line with this, from 2013-14, grant funding for individuals aged 24 and above studying at Level 3 and Level 4 was withdrawn, with learners paying the full cost of their learning.
However, to continue to encourage and facilitate participation of those aged 24 and over, the decision was made to offer income contingent-repayment loans for provision at Level 3 and Level 4 (called “24+ Advanced Learner Loans”).
It was also hoped that 24+ Advanced Learner Loans would help incentivise learners to become more informed customers and to choose courses likely to bring the highest benefits.
Specifically, the objectives of loans were to:
• Provide a source of finance for learners to pay for the course fees if they need to;
• Increase the level of private investment in learning to replace funding previously provided by the government;
15
• Empower learners to become more informed customers, with the purchasing power to choose the course of the highest benefit to them;
• Encourage providers to become more responsive to learner needs and ensure high quality provision;
• Improve learners’ motivation to study and maintain or improve the proportion achieving their qualification.
24+ Advanced Learner Loans were based on the pre-existing HE Student Loan system. Both are administered by the Student Loans Company.
2.2 24+ Advanced Learner Loans: Terms and Conditions Prospective learners (aged 24 and over) who were interested in undertaking a Level 3 or Level 4 course in 2013/14 were able to apply for a 24+ Advanced Learner Loan from April 2013.
2.2.1 Eligibility
In order to qualify for a 24+ Advanced Learner Loan a learner needs to be:
• Aged 24 or over on the first day of their course (there is no upper age limit);
• Living in the UK on the first day of their course and have lived in the UK, the Channel Islands or the Isle of Man for three years immediately before this;
• Studying with a college or training organisation in England approved for public funding;
• Enrolling on an eligible Level 3 or Level 4 course.
24+ Advanced Learner Loans are not means tested, nor are they subject to credit checks.
Loans cannot be accessed to fund Degrees or other forms of designated Higher Education.
2.3 Loan amounts and what they cover The amount of money available to the learner depends on: their course and qualification; the fees charged by the training provider; and the maximum loan amounts set by the government. If the course fees set by the provider exceed the cap set by the government,

16
the learner has to fund the difference through another method. The minimum amount of money that can be withdrawn is £3002.
Learners can elect to take out the maximum loan amount to cover the course fee or they can pay all or part of the fee themselves.
Loans are available for fees only. Loans-funded learners can apply for funding from a Loans Bursary Fund to help with costs related to learning (e.g. transport and childcare) but not general living costs.
Learners can only take out one loan at a time for non A Level courses. If they are working towards A Levels, learners can apply for up to four loans at the same time to cover the costs of their A Level Programme (including A Levels, AS and A2 qualifications).
If a learner is funding an Access to HE Diploma with a 24+ Advanced Learner Loan and they go on to complete an HE qualification, the outstanding balance of their 24+ Advanced Learner Loan will be written off. To qualify for this offer, the learner must complete both courses. They do not need to take out a loan for the HE course; however, it must be eligible for funding by Student Finance England. The HE course does not have to relate to the Access to HE course that the learner originally completed.
2.4 Payments and repayments Student Finance England pays the Loan to the learner’s training provider in the form of monthly payments once they have confirmed the learner’s attendance on the course. No money is transferred to the learner3.
If a learner drops out of a course without completing it, payments to the provider stop and the learner is responsible for the fees incurred up to that point only.
The learner makes monthly repayments on the loan based on their income (as opposed to the amount of money that was borrowed). Moreover, learners only begin the repayments once they are earning £21,000 a year. Learners only pay 9% of any income above this repayment threshold.
2 For each qualification listed on the SFA’s Learning Aim Reference System (LARS), the Agency sets a Maximum Funding Rate, based broadly on the ‘size’ (e.g. guided learning hours) and subject area of the qualification. Learners can only apply for loans to the Maximum Funding Rate or to the fee set by the provider (whichever is less). Therefore, if a provider charges a fee above the Maximum Funding Rate, the loan can only be for this rate and not the higher fee. 3 For more details see https://www.gov.uk/advanced-learner-loan (Date of access: August 2016)

17
Repayments start in the April after the learner leaves or finishes their course. Learners can make voluntary repayments at any time.
Any loan amount remaining 30 years after the learner is due to start making repayments will be written off.
Some of the interest on the loan is based on inflation (Retail Price Index (RPI))4.
2.5 Apprenticeships Apprenticeships are not covered by this evaluation.
The funding of advanced-level and higher-level apprenticeships frameworks were originally included in the 24+ Advanced Learner Loans policy when they were introduced in April 2013. However, 24+ Advanced Learner Loans were not the preferred funding route for employers or prospective apprentices, as outlined in the Skills Funding Agency’s Statement dated February 20145. In the first few months of the roll-out of loans, the take up of loans to fund apprenticeships was markedly lower than other types of qualifications and applications to apprenticeships amongst those aged 24+ had dropped considerably in the 2013/14 academic year, in comparison to previous years. As a result, the Government announced that from March 2014, apprenticeships for those aged 24 and over would return to being grant-funded, and any loan dues from apprentices would be disregarded.
2.6 The role of learning providers The role of providers (that is, practitioners responsible for the delivery of learning and training) in the facilitation and delivery of 24+ Advanced Learner Loans is key. As mentioned above, providers receive payments directly from the SLC. Due to this, providers have to send the SLC regular updates of learner attendance.
Providers are expected to explain 24+ Advanced Learner Loans to (prospective) learners who make enquiries about eligible courses. It is the responsibility of providers to ensure that clear information on 24+ Advanced Learner Loans is available. However, providers must not give financial advice to learners.
In 2015/16, 739 providers were given a “loan facility” by the Skills Funding Agency (SFA), which enables them to offer provision funded with a loan and receive loan income
4 Ibid. 5 For more details see http://dera.ioe.ac.uk/19332/1/bis-14-p172a-skills-funding-statement-2013-2016.pdf (Date of access: August 2016)

18
payments from the SLC on behalf of learners. The loan facility also specifies the maximum amount of loan funding a provider can receive from the SLC in an academic year and in 2015/16, this was calculated with reference to providers’ historic levels of delivery of loans-type provision. Providers have the ability to apply to the SFA for an increase in their loan facility as and when they approach the maximum amount within their agreed facility. The role of providers in the introduction of 24+ Advanced Learner Loans and how they have been impacted by the loans will be discussed in Chapters 9-12 of this report.
2.7 Existing research
2.7.1 24+ Advanced Learner Loans Impact Assessment
In order to explore the impact that the introduction of 24+ Advanced Learner Loans would have on learner volumes, a number of impact assessments were undertaken in the lead-up to the implementation of the policy. In the final Impact Assessment6, it was estimated that around 125,000 learner starts would go ahead under the loans system in the financial year 2013-14. This represented 55% of learners who would have been supported had the grants been maintained.
In 2013-14, £129m was made available for loans and the Impact Assessment outlined that this was intended to support around 80,000 starts.
Although the findings are not directly comparable with those from the ILR analysis, the Impact Assessment (which drew on the best research available at the time of publication) estimated that learner numbers may fall by around 50%.
2.7.2 Process Study of 24+ Advanced Learner Loans
IFF Research was commissioned by the Department for Business, Innovation and Skills (BIS) to explore both the processes surrounding the move from a grant-based system to a loans-based system for learning at Level 3 and Level 4, and also to explore the feasibility of a range of approaches to provide a robust impact evaluation.
In order to inform this process evaluation, research was undertaken with three key audiences: stakeholders; learners aged 24 and older studying Level 3 and 4 qualifications; and learning and training providers in receipt of a loan facility.
6 https://www.gov.uk/government/uploads/system/uploads/attachment_data/file/32315/12-873-further-education-advanced-learning-loans-regulatory-impact.pdf (Date of access: August 2016)

19
Findings from the process evaluation helped to inform the design of this impact evaluation.
2.8 Research Objectives The aim of this impact evaluation is to provide a robust assessment of the impacts of 24+ Advanced Learner Loans that will stand up to scrutiny and serve as evidence for informing future FE policy.
In particular, this evaluation seeks to explore the impact that the loans-based system has had on:
• Participation volumes of learners on courses now covered by loans
• Profiles of learners on courses now covered by loans
• Learner behaviour
• Learner outcomes
• Provider behaviour
2.9 Method The following section summarises the methodological approach adopted for the impact evaluation. For a more detailed discussion, including the profiles of the participating respondents, please see the “Methodology and Appendices” document that accompanies this report. As part of this research, views of learners and providers were gathered to comprehensively examine the effects of the introduction of 24+ Advanced Learner Loans. The sections below outline how the perspectives of these key audiences were collected.
2.9.1. Learners
Analysis of ILR Data
The feasibility study that was produced during the first year of 24+ Advanced Learner Loans identified the use of historical ILR data as the best means of establishing a counterfactual (i.e. what would have happened to the volumes of 24+ learners enrolled on Level 3 and 4 courses in the absence of the move from a grant-based approach to a loans-based one). This report covers the outcomes of Difference-in-Difference (DID) analysis using historical ILR data and comparing results for 24+ Level 3 and 4 learners with a comparison group of those aged 19-23 on the same courses who were unaffected by the introduction of Loans.

20
Learner Survey
A quantitative survey of 6,300 learners was conducted by telephone between February and May 2016 relating to the learners’ study period of 2014-15. The sample was drawn from the ILR and consisted of those who started an eligible course between September 2014 and July 2015.
All interviews were conducted from IFF’s telephone centre in London.
Profile of learners
Given that the purpose of the research was to examine the impact of the loans-based environment on learner behaviour, a comparison was needed between learners who were eligible to take out a loan and those who were not eligible. Interviews were therefore conducted with learners aged 24+ who were on eligible courses (A levels, Access to HE, Level 3 Diplomas and Certificates and Level 4 Diplomas and Certificates), covering both those who had and had not taken out loans, and a comparison group of learners aged 19-23 on the same eligible courses. Figure 2.1 shows a breakdown of interviews achieved.
Table 2.1 Profile of achieved interviews
The difference in age between the loans-eligible group and those in the comparison group means that the comparison of findings is imperfect. Some of the differences that are observed may simply be a function of age, and unrelated to the fact that the treatment group is operating in a loans-based environment while the comparison group continues to operate in a grants-based environment. However, the fact that loans were rolled out nationally at the same time means that younger learners on the same types of courses form the best available comparison group.
Type of course
Age of Learner
Total Comparison Group
Loans-eligible group
19-23 24-29 30 A Levels 350 49 113 512 Access to HE 455 450 453 1358 Level 3 Certificates 464 428 472 1364 Level 3 Diplomas 677 675 675 2027 Level 4 Certificates/Diplomas 251 184 604 1039 Total 2197 1786 2317 6300

21
To help to understand the role of age on different outcomes, differences by age of learner within the eligible group have also been explored. Where results are significantly different by age of learner, this has been noted in the report.
For more information about the ways in which the profile of learners varied, please refer to the Methodological Annex that is provided alongside this report.
2.9.2. Providers
Qualitative interviews
The qualitative research involved site visits to providers with a loan facility. A total of 20 face-to-face interviews, lasting approximately 60 minutes each, were conducted. Interviews were conducted with a range of learning providers in terms of type, size, location and location in order to achieve a broad range of perspectives.
Provider Survey
The quantitative survey involved a total of 250 providers, all of whom had a loan facility. It took place between June 2015 and August 2015. These interviews explored how the loans were communicated to potential learners; challenges faced in administering loans; and impacts of take-up, in terms of learner volumes and profiles. Again, interviews were conducted with a range of learning providers in terms of type, size and location.
All interviews were conducted from IFF’s telephone centre in London.
2.10 About this report The findings in this report have been structured into 12 separate chapters:
• Chapter 3 summarises the findings from the statistical impact analysis using ILR data to look at the impact of the introduction of loans on learner volumes.
Chapters 4-8 are based on findings from both the quantitative survey of learners. Differences between the eligible and comparison group of learners are drawn out where applicable / appropriate.
• Chapter 4 looks at how learners explored potential funding options and their initial awareness of 24+ Advanced Learner Loans.
• Chapter 5 explores any early impact of a loans-based environment on students’ motivations for learning in the first instance, and factors considered when choosing what to study and with which provider to study .

22
• Chapter 6 examines learners’ attitudes towards 24+ Advanced Learner Loans and their relative importance in enabling learning.
• Chapter 7 reports on learners’ satisfaction with their course to date and what they perceive to be the future impact of their learning.
• Chapter 8 reports on learners’ destinations and examines early indications of whether undertaking study in a loans-based environment impacts on what learners go on to do after completing their study.
Chapters 9-12 are based on findings from both the quantitative and qualitative survey of providers.
• Chapter 9 explores how providers receive information about 24+ Advanced Learner Loans and raise awareness among and respond to queries raised by learners.
• Chapter 10 reports providers’ views on the change in volume of learners since the introduction of 24+ Advanced Learner Loans.
• Chapter 11 explores the impact of administering 24+ Advanced Learner Loans on existing providers’ set-ups.
• Chapter 12 details providers’ overall views of 24+ Advanced Learner Loans, how their introduction has impacted them thus far and any anticipated future impacts.
2.11 Report Interpretation Comparisons between subgroups are only reported in the text if they are statistically significant, unless otherwise stated. Significance is measured at the 95% confidence level.
Base sizes shown in the report have been rounded to the nearest 10.
Throughout the report, results have not been shown on tables and charts if the unweighted base size is less than 30. Where this is the case, a double asterisk (**) has been used in place of the data.
For reasons of conciseness, not all significant relationships are highlighted in the report and are generally only outlined when they relate to relevant themes and contribute to key findings.
Where an asterisk (*) has been used in the tables, it symbolises a percentage value greater than zero but less than 0.5%. A zero percentage value is denoted by ‘-‘ in the tables.

23
Throughout the report, learners who were eligible for 24+ Advanced Learner Loans (that is, those aged 24+ enrolled on eligible courses) are referred to as “eligible” learners and learners who were on eligible courses but were not eligible for loans due to their age (that is, those aged 19-23) are referred to a “comparison” learners. Among “eligible” learners, those in receipt of a loan are referred to as “Loans learners”; those that did not take out a loan as “eligible non-Loans learners”.

24
3. Impact on learner volumes This chapter details the findings from the statistical analysis of the Individualised Learner Record (ILR) data for the academic years before and after the introduction of 24+ Advanced Learner Loans. It explores the impact on the volumes of learners and learning aims as well as the evidence for a differential impact on different groups of learners. It also looks at the evidence for a displacement effect, whereby learners aged 24+ opt to study Level 2 courses that are still grant funded rather than studying at Level 3.

25
3.1 Aims of the statistical impact analysis 24+ Advanced Learner Loans (ALLs) were introduced in August 2013 with the aim of maintaining Level 3 and above participation levels between 125,000 and 204,000 from
Chapter Summary
The first couple of years since the introduction of a loans-based environment for those aged 24+ has been associated with a marked drop in the volumes of both learners and learning aims being studied on eligible courses.
The number of learners on loans-eligible courses fell from 142,000 in academic year 2012/13 to 98,000 in 2013/14 (and fell further to 94,000 in 2014/15).
Difference-in-difference analysis indicates that the negative impact on learner volumes that can be directly attributed to the introduction of a loans-based environment is equivalent to a drop of around 33,900 learners (a -26% drop).
Much of the rest of the change in learner volumes is likely to be the result of changes in learner demand in response to economic conditions. For example, variations in the employment rate, the types of job opportunities available to potential learners, and changes in the welfare system.
The volumes of Access to HE courses being studied has remained largely unaffected by the move to a loans-based environment (these account for around 18,000 of the 97,000 learning aims undertaken by eligible learners in 2014/15) while aims volumes for the other key course types (A levels, Level 3 Certificates and Diplomas, Level 4 Certificates and Diplomas) have fallen. This is likely to be a function of the fact that Access to HE 24+ Advanced Learner Loans are written off for learners who progress to and complete a HE course.
Difference-in-differences impact analysis also shows that the move from a grants-based environment to a loans-based one resulted in a very small fall in the achievement rate (contrary to the hypothesis that ALLs would encourage learners to invest more directly in their learning).
There is no evidence of a large displacement effect – whereby those who would have studied at Level 3 have chosen to study Level 2 courses instead (which still attract grant funding), or whereby providers have substituted Level 3 learners with different learners studying at Level 2.

26
2014/15 for those aged over 247. A key aim of this evaluation is to estimate the net impact of the 24+ ALLs system on eligible learners. The central question that the evaluation seeks to answer is:
What was the impact on eligible learners of the introduction in August 2013 of 24+ Advanced Learner Loans?
3.2. Using historical data to estimate the impact of the move to a loans-based environment While it is possible to get an indication of the impact of the introduction of a loans-based environment on learner numbers simply by looking at the volumes of learners in the years before and after the change, this is an imperfect measure of impact because there are other factors that may have impacted on learner volumes over this time. To get a better idea of what might have happened to the volumes of 24+ learners on Level 3+ courses without the move from a grant-based to loans-based environment, this analysis uses the trends in volumes of other learner groups to help provide a better estimate of the counterfactual.
The approach used for this analysis is a difference in differences estimator (Blundell and Costa Diaz, 2009). The difference in differences estimator is an econometric approach to estimation.
The difference in differences methodology is a trend analysis. It uses historical data to predict what the volume of 24+ learners might have been in the absence of a move from a grant-based to a loan-based environment. To estimate what these volumes might have been, it uses the trend in learner volumes among a group unaffected by the change. The key assumption is that the learner volumes for the Loans and comparison group would have followed the same trend in the absence of the introduction of Loans. This assumption relies on the fact that other than the move to a loans-based environment, there have been no changes that would have impacted learner volumes and, particularly, no changes that would have impacted the loans-eligible and comparison groups
7 BIS 2012a p48 Table 27. The regulatory impact assessment main estimates for the cost-benefit analysis are based on learner starts of 125,000 (55% take-up of the learners who would have been supported under grant funding will go ahead with learning under a system of income-contingent loans; implying around 70% of loans are taken up) while an upper bound sensitivity analysis is based on 204,000 learner starts (where 90% of learners go ahead; and all loan funding is taken up). This is a maintaining of learner participation as far as possible because key policy alternatives were to reduce grant funding level substantially or remove all grant funding, which would have reduced learner numbers more than might occur under 24+ ALL: “…as without 24+ Advanced Learner Loans we would see a significant fall in learner numbers” BIS (2014: 1).

27
differently. Hence, the technique assumes that in the period immediately pre and post the introduction of Loans:
• There were no other changes to funding arrangements for learning at these levels that might have impacted on learner volumes (for example, no other changes to funds that providers can access through the state or through other sources such as the European Social Fund);
• There were no particular changes to the places offered by providers for these courses that would have had a large scale impact on learner volumes.
These assumptions make it possible to distinguish between the change in learner volumes that can be attributed directly to the introduction of a loans-based environment and the background change that is likely to be a result of general economic factors affecting learner demand.
Table 3.1 helps to illustrate, in a simplistic way, how the difference in differences approach can provide a measure of impact using a counterfactual group.
The basic approach is to measure outcomes before and after Loans were introduced, for eligible and non-eligible learners. This gives four measures: outcomes before and after for learners eligible for Loans, and outcomes before and after for learners not eligible for Loans. Subtracting the ‘after measures’ from the ‘before measures’ for each of the groups gives the reduction in learner numbers for eligible and non-eligible learners. Then subtracting the non-eligible learners’ result from the eligible learners’ result gives the difference in differences estimate of impact. In the example, this final calculation yields a result of 2000 (-20 – -22 = 2).
Table 3.1 Illustration of the difference in differences method (using fictional data)
Participation (1000’s) before 24+ Advance
Learner Loan
Participation (1000’s) after 24+ Advanced
Learner Loan
Difference
Learners eligible for the 24+ Advanced Learner Loan
105 85 -20
Learners NOT eligible for the 24+ Advanced Learner Loan
110 88 -22
Difference in differences estimate
+2

28
A number of tests were conducted to explore the suitability of the ILR data for conducting this type of analysis using learners aged 19-23 on loans-eligible courses as a counterfactual group (this is the comparison group that is as similar to those experiencing the move from a grant-based to a loans-based environment as possible). These tests attempted to assess the extent to which the eligible and non-eligible groups showed common trends prior to Loans becoming operational (Heckman and Hotz, 1989). The assumption is that if the common trends assumption holds prior to the introduction of the Loans, it should hold during the period in which the impact is being evaluated and any difference is the result of the impact of a switch to a loans-based approach.
In summary, the findings from this pre-testing were that, while the use of the ILR administrative data gives good quality information from before 24+ Advanced Learner Loans and the difference in differences approach is considered to be a strong evaluation design (NAO 2013), there are some challenges in using it here:
• The analysis can only use data from 2010-11 onwards due to changes in the definitions of courses/qualifications, which makes it difficult to identify the ‘loans-eligible’ group in the data prior to this point. Only Level 3 and Level 4 qualifications that are part of the QCF (Qualifications and Credit Framework) are eligible for 24+ Advanced Learner Loans. This framework was introduced in 2010/11.
• There is observable volatility during this limited time period (3 years of data prior to the introduction of Loans).
• There is a strong influence on the trends examined by age, but which also varies over time during the periods analysed.
It seems reasonable to assume that there are no other major policy changes (other than the introduction of Loans) that act differentially on the eligible and non-eligible groups within the time period explored. However, this cannot be precluded: learning participation is often the product of the economic choices available and can be affected by differential chances of jobs or differential access to labour market programmes for those aged under 24 compared to those aged over 24 (for example, the Work Programme).
The greatest source of variability in learning take-up during the pre-Loans period is likely to be general economic conditions. Economic shock effects are likely to be asymmetric across comparison and Loans groups (because they are linked heavily to learner age).
As far as possible, these imperfections in using the difference in differences approach have been taken account of by conducting sensitivity analysis where possible.
The comparison used is between all eligible and non-eligible learners on Level 3/4 courses.

29
The sensitivity analysis has been conducted through exploring the impact of different baseline years.
However, overall it is important to note that these assumptions mean that results in Section 3 have some degree of uncertainty.
3.3 Net impact of the move to a loans-based environment on learner aims and volumes Figures 3.1 and 3.2 plot the participation volumes for 24+ loans-eligible learners and those in the counterfactual group (aged 19-23 on loans-eligible courses) from 2010/11 to 2014/15.
Figure 3.1 shows figures based on learner numbers. Figure 3.2 shows figures based on ‘learning aims’. Learning aims are individual learning programmes with particular goals (in this case the achievement of a qualification). Each learner can study for more than one aim simultaneously.
Figure 3.1: Participation volumes over time: Learners
Notes: X axis gives ILR academic year; Y axis gives learner volumes. 24+ Loans group: learners on eligible level 3 and 4 courses aged 24 and above. Counterfactual A:learners on eligible level 3 and 4 courses aged 23 and under.

30
Figure 3.2: Participation volumes over time: Aims
Notes: X axis gives ILR academic year; Y axis gives aims volumes. 24+ Loans group: learners on eligible level 3 and 4 courses aged 24 and above. Counterfactual A learners on eligible level 3 and 4 courses aged 23 and under.
Table 3.2 shows the participation volumes shown in Figures 3.1 and 3.2 in more detail.

31
Table 3.2 Participation for the eligible and counterfactual group over time
2010/11
2011/12
2012/13
2013/14
2014/15
Loans eligible LEARNERS 152,135 153,957 142,437 98,177 94,007 Non-eligible LEARNERS: Learners aged 19-23 on eligible courses
66,721 69,128 70,621 66,860 63,180
Loans eligible AIMS 158,431 159,272 148,965 101,718 96,917 Non-eligible AIMS: Learners aged 19-23 on eligible courses
81,392 82,346 83,711 78,061 74,095
All learners Total on loans eligible courses - learners
218,856 223,085 213,058 165,037 157,187
All AIMS Total on loans eligible courses - AIMS
239,823 241,618 232,676 179,779 171,012
Rate of participation
24+ / Total - learners 0.70 0.69 0.67 0.59 0.60
Rate of participation
24+ / Total - AIMS 0.66 0.66 0.64 0.57 0.57
Notes: 24+ Loans group: learners on eligible level 3 and 4 courses aged 24 and above. Counterfactual A learners on eligible level 3 and 4 courses aged 23 and under. It is clear from looking at Figures 3.1 and 3.2 and Table 3.2 that the first year of the introduction of a loans-based environment for those aged 24+ was associated with a marked drop in the volumes of both learners and learning aims being studied. This is against a backdrop where the volumes for learners aged 19-23 unaffected by the introduction of Loans show much less change (although they have still been quite variable over time). As a result (and as shown in the final rows of the tables), the rate of participation of the 24+ age group among all learners on loans-eligible courses falls considerably. The share of those aged 24+ was 70% of all Level 3/4 learners (66% of all aims) in 2010/11. This share falls slightly to 2012/13 when it is 67% of all learners (64% of all aims). This share continues falling at a more rapid pace from 2012/13 onwards until in 2014/15 the share of those aged 24+ is 60% of all learners (57% of all aims).
The results in Table 3.3 show that the impact of the move to a Loans-based environment was a statistically significant reduction in learning aims. The overall average impact indicates that a fall of -35,700 in aims studied that can be attributed to the move to a loans-based environment during the transition from 2012/13 to 2013/14; and a fall of -

32
38,900 between 2012/13 to 2014/15. As shown in Figure 3.2, aims volumes dropped over this period among both eligible and counterfactual learners. This result indicates that the additional drop in aims for eligible learners over-and-above what might have happened anyway is in the order of 36,000 to 39,000 aims. Hence, it is only a proportion of the reduction in learner numbers over the period between 2012/13 to 2013/14 that can be directly attributed to the move from a grant-based environment to a loans-based one. The rest of the reduction in learners numbers is likely to be related to other background factors such as:
• The overall employment rate • The structure of employment available to potential learners (full-time/part-
time/casual) • (Perceptions of) the value of the course/qualification for the opportunities
available (from both the perspective of potential learners and employers) • Whether the types of jobs that learners could access through learning are
increasing or decreasing in their availability. • The overall structure of welfare programmes
Table 3.3 Difference in differences impact results for AIMS participation volumes
Counterfactual & eligible group definition
Loans Impact result 2012 v 2013
Statistical significance
Loans Impact result 2012 v 2014
Statistical significance
Aims Aims
19-23y counterfactual A v 24 or older -35,769 yes -38,918 yes
Source: ILR data Aims supplied 2016. Notes: 24+ Loans group: learners on eligible level 3 and 4 courses aged 24 and above. Counterfactual A: learners on eligible level 3 and 4 courses aged 23 and under. An impact is observed if the difference in difference interaction term between year and the group is statistically significant. The test is carried out at the 95% level of significance
The overall result indicates that a reduction of 35,700 aims is attributed to the introduction of a loans-based system, although the analysis has some level of uncertainty. Sometimes in this type of analysis, it is valuable to control for some demographic variables to check whether variation in the composition of learners undertaking learning aims over time influences the result. The ILR contains data on gender, ethnicity, and whether or not learners have a learning disability/health condition that affects learning which have been used to explore this. The difference in differences estimates shown in

33
Table 3.3a take these variables into consideration. Because these variables are quite stable over time, the impact estimates produced are quite similar (and sometimes identical) to those shown in Table 3.3. Hence much of the scale and direction of the net impact of Loans on aims participation was not affected differentially by gender, ethnicity, and LLDD (Learners with Learning Difficulties or Disabilities) status.
Table 3.3a Difference in differences impact results for AIMS participation volumes (with consideration of gender, LLDD and ethnicity added)
Counterfactual & eligible group definition
Loans impact result 2012
v 2013
Statistical significance
Loans impact result 2012
v 2014
Statistical
significance
Aims
Aims
19-23y counterfactual A v 24 or older -35,793 yes -38,945 yes Source: ILR data Aims supplied 2016. Notes: 24+ Loans group: learners on eligible level 3 and 4 courses aged 24 and above. Counterfactual A: learners on eligible level 3 and 4 courses aged 23 and under. An impact is observed if the difference in difference interaction term between year and the group is statistically significant. The test is carried out at the 95% level of significance
Tables 3.4 and 3.4a show the same analysis based on learners rather than learning aims. The results in Table 3.4 show that the reduction in learner volumes was similarly a statistically significant negative impact. The overall average impact indicates that a fall of -33,900 learners that can be attributed to the move to a loans-based environment during the transition from 2012/13 to 2013/14; and a fall of -37,900 between 2012/13 to 2014/15. As with the analysis based on aims, these figures are slightly lower once gender, ethnicity and LLDD status is controlled for (-33,200 from 2012/13 to 2013/14 and -36,900 from 2012/13 to 2014/15).
Table 3.4 Difference in differences impact results for LEARNER participation volumes
Counterfactual & eligible group definition
Test result 2012
v 2013
Statistical significance
Test result 2012
v 2014
Statistical significance
Learners
Learners
19-23y counterfactual A v 24 or older -33,899 yes -37,646 yes
Source: ILR data Aims supplied 2016. Notes: 24+ Loans group: learners on eligible level 3 and 4 courses aged 24 and above. Counterfactual A: learners on eligible level 3 and 4 courses aged 23 and under. An

34
impact is observed if the difference in difference interaction term between year and the group is statistically significant. The test is carried out at the 95% level of significance.
Table 3.4a Difference in differences impact results for LEARNER participation volumes (with consideration of: gender, LLDD, ethnicity added)
Counterfactual & eligible group definition
Test result 2012
v 2013
Statistical significance
Test result 2012
v 2014
Statistical significance
Learners
Learners
19-23y counterfactual A v 24 or older
-33,273 yes -36,945 yes
Source: ILR data Aims supplied 2016. Notes: 24+ Loans group: learners on eligible level 3 and 4 courses aged 24 and above. Counterfactual A: learners on eligible level 3 and 4 courses aged 23 and under. An impact is observed if the difference in difference interaction term between year and the group is statistically significant. The test is carried out at the 95% level of significance
The level and scale of change in learner volumes can also be compared to the stated policy target of maintaining level 3 and 4 participation level at 125,000-204,000 for those aged 24 or over8. The estimate of 125,000 learners in the 2013/14 financial year would have corresponded to a fall in volume of -12% from the 2012/13 volumes of learners (-16% for aims). The actual fall in volume was double this with a fall of -26% (-26% for aims).
3.4 Impact on course types This section looks at the individual course types that make up the loans eligible group in more detail. The courses eligible for 24+ Advanced Learner Loans are defined in the FE Loans Regulations as follows:
• a number of A levels/AS/A2 not greater than four;
8 BIS ITT Research Evaluation Specification Evaluation of 24+ Advanced Learner Loans page 3. BIS 2012a p48 Table 27. The regulatory impact assessment main estimates for the cost-benefit analysis are based on learner starts of 125,000 in 2014/15 (55% take-up of the learners who would have been supported under grant funding will go ahead with learning under a system of income-contingent loans; implying around 70% of loans are taken up) while an upper bound sensitivity analysis is based on 204,000 learner starts in 2014/15 (where 90% of learners go ahead; and all loan funding is taken up). This is a maintaining of learner participation as far as possible because key policy alternatives were to reduce grant funding level substantially or remove all grant funding, which would have reduced learner numbers more than might occur under 24+ ALL: “…as without 24+ Advanced Learner Loans we would see a significant fall in learner numbers” BIS (2014: 1).

35
• a Quality Assurance Agency (QAA) Access to HE Diploma;
• a Level 3 Certificate;
• a Level 3 Diploma;
• a level 4 Certificate;
• a level 4 Diploma (SFA 2014a: 11).
The main course types form 4 categories – A levels, Access to HE, Level 3 and Level 4.
Figure 3.3. below shows the trends in volumes of aims studied at each of these levels.
The key picture emerging from looking at these trends is that the aims volumes for Access to HE courses among learners aged 24+ have remained at a similar level both pre and post the introduction of Loans, while the volumes on the other course types have declined quite considerably. For A levels, the aims volumes for learners aged 19-23 have also declined quite considerably, while for Level 3 and Level 4 courses they have remained more stable.

36
Figure 3.3: Aims volumes for each course type over time
0
2000
4000
6000
8000
10000
12000
14000
16000
18000
20000
2010/11 2011/12 2012/13 2013/14 2014/15
A - Levels
Aims for 19-23 learners
Aims for 24+ learners
0
5000
10000
15000
20000
25000
2010/11 2011/12 2012/13 2013/14 2014/15
Access to HE
Aims for 19-23 learnersAims for 24+ learners

37
-10000
10000
30000
50000
70000
90000
110000
130000
150000
2010/11 2011/12 2012/13 2013/14 2014/15
Level 3 Certificates and Diplomas
Aims for 19-23 learnersAims for 24+ learners
0
2000
4000
6000
8000
10000
12000
14000
16000
18000
20000
2010/11 2011/12 2012/13 2013/14 2014/15
Level 4 Certificates and Diplomas
Aims for 19-23 learnersAims for 24+ learners
38
3.5 Impact on completion and achievement volumes As well as learner/aim volumes, it is also possible to look at the impact of the move from a grant-based environment to a loans-based environment on completion and achievement rates. This analysis provides an indication of whether a loans regime has had a positive impact on persistence and achievement in learning9 - which might be expected if a move to a loans-based system results in learners making more informed decisions about courses to study and being more engaged throughout their study period.
Table 3.5 shows change over time in volumes of achieved aims (rows 1 and 2), the achievement rate (rows 3 and 4), completed aims (rows 5 and 6) and the completion rate (rows 7 and 8). As the table shows, there is quite a lot of fluctuation over time in the rates for achievement and completion.
The completion rate is the number of aims marked as completed within the academic year divided by all those that were started within the same academic year.
The achievement rate is the number of aims marked on the ILR as achieved within the academic year divided by those marked as completed by learner within that academic year. Aims marked as continuing, withdrawn, transferred, changed, or temporarily withdrawn are by definition excluded from the achievement rate.
Overall, for the achievement and completion rates, the largest observable change after the introduction of 24+ALL is the fall of 5 percentage points in the completion rate between 2012/13 and 2013/14, and this accompanies an achievement rate fall of 1 percentage point between 2012/13 and 2013/14. This initial fall in completion after the introduction of 24+ALL is not offset by change between 2013/14 and 2014/15 but, in contrast, the achievement rate recovers slightly by 2 percentage points.
9 In considering the choice of achieved, completed and achievement rate, this analysis excludes separate consideration of the success rate and completion rate because the success rate is only for the number of starts, and the more informative achievement rate takes account of both the achievement as well as of those completing.

Table 3.5 Aims achievement and completion volumes for the Loans eligible and counterfactual group A
2010/11
2011/12
2012/13
2013/14
2014/15
Change in volume between years
Rate of change in volume between years
Rate of change in volume between
years 2011/12 2012/13 2013/14 2014/15 2011/12 2012/13 2013/14 2014/15 2012/13 2013/14 2014/15
v v v v v v v v v v v 2010/11 2011/12 2012/13 2013/14 2010/11 2011/12 2012/13 2013/14 2011/12 2011/12 2011/12
Achieved aims A35
1 Eligible: Loans achieved aims 80520 79572 83851 51413 49584 -948 4279 -32438 -1829 -0.01 0.05 -0.39 -0.04 0.05 -0.35 -0.38
2 Counterfactual A:< 24 loans eligible course achieved aims
42047 45088 49646 47090 45090 3041 4558 -2556 -2000 0.07 0.10 -0.05 -0.04 0.10 0.04 0.00
3 % Eligible: Loans achievement rate 0.87 0.87 0.89 0.88 0.89 0.00 0.02 -0.01 0.02 0.00 0.02 -0.02 0.02 0.02 0.00 0.02
4 % Counterfactual A:< 24 loans eligible course achievement rate
0.79 0.82 0.84 0.85 0.86 0.03 0.02 0.02 0.00 0.03 0.03 0.02 0.00 0.03 0.04 0.05
Completed aims A34 5 Eligible: 24+ loans
eligible completed aims
92506 91005 94054 58638 55471 -1501 3049 -35416 -3167 -0.02 0.03 -0.38 -0.05 0.03 -0.36 -0.39
6 Counterfactual A:< 24 loans eligible course completed aims
53186 55254 59343 55285 52722 2068 4089 -4058 -2563 0.04 0.07 -0.07 -0.05 0.07 0.00 -0.05
7 % Eligible: Loans completion rate 0.58 0.57 0.63 0.58 0.57 -0.01 0.06 -0.05 0.00 -0.02 0.11 -0.09 -0.01 0.11 0.01 0.00
8 % Counterfactual A:< 24 loans eligible course completion rate
0.65 0.67 0.71 0.71 0.71 0.02 0.04 0.00 0.00 0.03 0.06 0.00 0.00 0.06 0.06 0.06
9 All Eligible: 24+ loans eligible AIMS 158431 159272 148965 101718 96917 841 -10307 -47247 -4801 0.01 -0.06 -0.32 -0.05 -0.06 -0.36 -0.39
10 All Counterfactual A:< 24 loans eligible course AIMS
81392 82346 83711 78061 74095 954 1365 -5650 -3966 0.01 0.02 -0.07 -0.05 0.02 -0.05 -0.10
11 All AIMS 239823 241618 232676 179779 171012 1795 -8942 -52897 -8767 0.01 -0.04 -0.23 -0.05 -0.04 -0.26 -0.29

40
Notes: 24+ Loans group: learners on eligible level 3 and 4 courses aged 24 and above. Counterfactual A learners on eligible level 3 and 4 courses aged 23 and under. Achievement rate: This is the number of learning aims that have been fully achieved divided by the number of learning aims that have been completed. ILR variable A35 (category: achieved) divided by A34 (category: aim/learner completed); Note that A34 also has categories for aim/learner is continuing, has withdrawn, has transferred, changes in learning, temporarily withdrawn, and so by definition, the achievement rate excludes these. A35 also has categories partial achievement, no achievement, exam taken/assessment completed but, learning activities are complete but, study continuing; and so by definition, the achievement rate excludes these.

The interrelationship between completion and achievement (completion can fall but achievement rise, while conversely completion can rise and achievement fall), means that it is sensible just to look at the achievement rate as a summary to the impact that the introduction of 24+ ALLs has had on learner outcomes.
Difference-in-differences impact analysis shows that the move from a grants-based environment to a loans-based one resulted in a slight fall in the achievement rate (Table 3.6). This analysis indicates that the introduction of loans was associated with a fall in the overall achievement rate of 1.3 percentage points when comparing 2012/13 with 2013/14 and 1.9 percentage points when comparing 2012/13 with 2014/15.
However, it is important to note that the result did not pass the pre-loans tests for stability in the achievement rate. This is likely to be because the scale of the fall in achievement rate for the 24+ group has some age-asymmetric bias due to other variability in the learner population. It seems likely that the completion component of the achievement rate is affected by the types of macroeconomic asymmetries in effects across older learner groups - for example, giving up studies due to a need to gain an income or loss of work affecting studies.
Table 3.6 Difference in differences impact results, Achievement rates
Counterfactual & eligible group definition
Test result 2012 v 2013
Statistical significance
Result 2012 v 2014
Statistical significance
19-23y counterfactual A v 24 or older -1.27pp yes -1.94pp yes Source: ILR data Aims supplied 2016. Notes: 24+ Loans group: learners on eligible level 3 and 4 courses aged 24 and above. Counterfactual A: learners on eligible level 3 and 4 courses aged 23 and under. An impact is observed if the difference in difference interaction term between year and the group is statistically significant. The test is carried out at the 95% level of significance.
Generally this analysis points to a very small reduction in the achievement rate (against a historical achievement rate of close to 90%).

42
3.6 Evidence of displacement Difference-in-difference analysis was also used to explore the issue of displacement: whether the move from a grants-based system to a loans-based system for learners aged 24+ has resulted in learners who might otherwise have chosen to study at this level opting to study at a lower level where they still received grant funding or where by providers have substituted Level 3 learners with different learners studying at Level 2.
For this analysis, the comparison group is those studying at a level just below Level 3. If participation volumes for this comparison group increased after the introduction of Loans (or in the announcement period) relative to what might have been expected, then this could indicate the displacement of learners to lower levels of learning.
Two types of comparative analysis were conducted:
1. Comparing learners aged 24 participating in full Level 2 courses against learners aged 24 participating in Level 3 loans eligible courses.
This analysis of participation volumes explored whether there was evidence that volumes of learners aged 24 or more switched to Level 2 courses that still attracted grant funding, rather than undertaking learning at Level 3 (either directly or through providers taking different Level 2 learners instead of those wanting to study at Level 3). Level 4 courses were not included in this analysis as, while displacement between Level 3 and Level 2 courses seemed plausible, it felt implausible that Level 4 courses might be displaced in this way.
2. Comparing learners aged 24 participating in full Level 2 courses against 23 year olds participating in full Level 2 courses.
This analysis performed a secondary check exploring whether full Level 2 participation volumes changed in a different way for those aged 24 compared to those aged 23 (who would still have received grant funding whether they studied at Level 2 or Level 3).
Figure 3.4 shows the aims volumes pattern over time, for the whole of the 24+ group. This shows that, for both full Level 2 and Level 3 learning, there was a reduction in learner volumes over time between 2010/11 and 2014/15 (and actually there was a greater reduction in full Level 2 aims than is observed for Level 3 aims).
Figure 3.5 focusses just on the comparison between restricted age groups – that is, just those aged 24 studying full Level 2 courses compared with just those aged 24 studying loans-eligible Level 3 courses. Focussing just on this age group makes the different patterns between the groups more obvious. The counterfactual group i.e. 24 year olds participating in full level 2 courses fell from 2011/12 onwards. In contrast, participation

43
levels for 24 year olds on Level 3 courses were rising slightly until 2012/13 under the grants based system but declined after the introduction of 24+ ALLs.
Figure 3.4: Participation numbers for the eligible group, 24+ level 3 only, and counterfactual group B (aged 24+ on full level 2 course): Aims
Figure 3.5: Participation numbers for the eligible and counterfactual group B (aged 24 on full level 2 course) and comparison younger full level 2: Aims
Source: ILR data supplied 2016. Figure 3.6 explores the second comparative analysis, looking just at participation levels in full Level 2 learning and comparing 24 year olds affected by the introduction of Loans with 23 year olds who were not affected. This analysis shows that the aims volumes for the two groups are very similar over time (although there is a little fluctuation in how closely the groups track each other). The closeness with which these figures track each other in the pre-loans period makes this analysis better suited for making an assessment
0
50000
100000
150000
200000
250000
300000
350000
400000
450000
500000
2010/11 2011/12 2012/13 2013/14 2014/15
Counterfactual B:24+ level 2 course AIMS Eligible: 24+ loans level 3 course AIMS
0
2000
4000
6000
8000
10000
12000
14000
16000
18000
20000
2010/11 2011/12 2012/13 2013/14 2014/15
Counterfactual B:Level 2 24 years course AIMS Eligible: 24 years level 3 course AIMS

44
of displacement levels then the comparison between 24 year olds on Level 3 and on full Level 2 courses looked at above.
Figure 3.6: Participation numbers for the eligible 24 years level 3 and counterfactual group B (24 years on full level 2 course) and comparison younger 23 years full level 2: Aims
Source: ILR data supplied 2016.
Similar figures for learners are not included as they show very similar trends and hence do not add greatly to the information presented.
The tests exploring the stability of these figures for the pre-loans period indicated that 2012/13 was the best baseline for the difference in difference impact analysis of displacement. Table 3.7 shows the results for this analysis comparing 24 year olds on full Level 2 courses with 23 year olds on full Level 2 courses.
These results show that the impact of the move to a Loans based environment on those aged 24 and studying at Level 2 was consistently small and negative and not always statistically significant (a fall of 21 full Level 2 aims between 2012 and 2013; and a fall in learners of 20 between 2012 and 2014). This suggests the introduction of Loans was actually associated with a very small decrease in learning volumes among those aged 24 at Level 2 (where as if there had been considerable displacement then these results would have shown positive increases). Hence it seems very unlikely that there has been any large-scale displacement activity as a result of the move to a Loans-based environment.
Table 3.7 Difference in differences impact results; Displacement Analysis
0
2000
4000
6000
8000
10000
12000
14000
16000
18000
20000
2010/11 2011/12 2012/13 2013/14 2014/15
Counterfactual B:Level 2 24 years course AIMS Counterfactual B2:Level 2 23 years course AIMS

45
Counterfactual & eligible group definitions
Change between 2012 v 2013
Statistical significance
Change between 2012 v 2014
Statistical significance
Aims
Comparing 23 year olds on full level 2 courses and 24 year olds on full level 2 courses
-21 Yes -14 No
Learners
Comparing 23 year olds on full level 2 courses and 24 year olds on full level 2 courses
-11 No -20 Yes
Source: ILR data supplied 2016.
The scale and direction of displacement learning activity resulting from Loans was not affected differentially by accounting for gender, ethnicity, and LLDD subgroups.

46
4. Learners: initial awareness and use of 24+ Advanced Loans This section of the report examines learner take up of the 24+ Advanced Learner Loans. It then explores their awareness of the Loan before starting their studies and their knowledge of different aspects of the loan, before looking at why some eligible learners decided not to apply for a Loan, and whether they would make that same decision knowing what they know now. It also looks at learner interaction with the Bursary Fund.
Chapter Summary
Just under two thirds of those eligible took up the 24+ loan. Of those that did not, around a fifth had applied to receive a loan but stated that they had either found an alternative way to fund the course or had had their application rejected. Those that were eligible but did not apply to take up a loan had chosen not to for a variety of reasons, though most commonly because they could fund through a different way (for example, self-funding or funding through an employer), they wanted to avoid getting into debt, or they simply didn’t know about 24+ Advanced Loans.
Access to HE courses had the highest proportion of eligible students funded through a 24+ Advanced Loan.
There is room to raise awareness of 24+ Loans among learners: although awareness levels have significantly improved since the 2013/2014 academic year, the majority of eligible learners who took part in the quantitative survey were not aware of 24+ Advanced Learner Loans before they started their studies. The majority of those who were aware of 24+ Advanced Learner Loans had heard about them via a college or other training provider.
When learner understanding of specific terms and conditions of Loans was tested, some significant gaps were revealed: while the message that learners do not have to pay the Loan(s) back until they are earning a specific wage and that the Loan will be written off for those doing Access to HE Diplomas who progress to Higher Education seems to have resonated strongly, a much smaller proportion of learners were clear on the other terms and conditions. For example, few knew that they would not need a credit check; that any subsequent HE loans would be rolled into one payment; and that interest rates on loans were linked to inflation and based on income.
Take up of the Bursary Fund was quite low; however, most of the learners who did receive financial assistance through this Fund reported that it had enabled them in their learning.

47
4.1 About the Learners Survey The learners’ survey was designed to compare findings between two groups of learners who were studying in the 2014/15 academic year:
• Learners eligible for loans (aged over 24 and on loans-eligible courses);
• A comparison group unaffected by the introduction of loans (learners aged 19-23 and on the same loans-eligible courses).
The eligible group contains both those who took out a 24+ Advanced Learner Loan (65% of eligible learners) and those who were funded through another route.
4.2 Funding the course through 24+ Advanced Learner Loans Learners were asked about how they had funded their learning. As Figure 4.1 shows, two thirds of those who were eligible to do so had used a 24+ Advanced Learner Loan (65%), while for the comparison group, the majority had received government funding which had meant that their course was, in effect, free of charge for them (64%).
A fifth of comparison group learners had elected to self-fund the course and this proportion was similar among those eligible for the 24+ Advanced Learner Loan (19% compared to 13%). The eligible group were more likely to have their course funded by their employer (12% compared to 7%), but this may just reflect that they were more likely to be in employment while undertaking the qualification.
Figure 4.2: Method of funding study
65%*
38%
64%*
6%*
30%
19%*
13%*
16%
7%*
12%*
10%
5%
1%
2%
2%
1%
1%
1%
0% 20% 40% 60% 80% 100%
24+ AdvancedLoan
Governmentfunded
Self-funded
Employer-funded
Paid for byparents
Grant
Personal Loan
Unweighted Base: All(Source: learner survey, question S11b)
Unweighted base:
(2200)
(4100)
Comparison learners
Eligible learners
All learners(6300)
* = significant difference between eligible and comparison learners

48
As Figure 4.2 shows, Access to HE courses had the highest proportion of eligible students funding with the 24+ Advanced Loan: the vast majority (90%) of eligible students on this type of course were using the Loan to fund their studies. This reflects the slightly different offer made to these students: where students who have taken out a loan for an Access to HE course go on to complete an HE course, the value of their loan is ‘written off’.
A levels had the lowest proportion of eligible students funding with the 24+ Advanced Loan: only 40% of those eligible to do so funded in this way. Eligible students studying for A levels were more likely to self-fund: 49% did so.
Among the comparison group, government funding was the most common funding method, with those on A level courses most likely to receive government funding (75% were funded in this way). The exception to this were students on Level 4 qualifications who were more likely to self-fund or fund through an employer. For both groups, employer funding was most common for Level 4 qualifications.
Figure 4.2: Method of funding study by subject
Learners may apply for up to four Loans but are only entitled to receive one Loan at a time and cannot currently apply for another Loan to cover a different course at the same level previously funded through a Loan. A levels are an exception to this as learners can take out a Loan to cover the costs of each A level course (up to a maximum of four A
46%*
65%*
52%*
90%*
40%*
20%*
4%*
68%*
8%*
43%*
4%*
63%*
5%
75%*
5%
32%*
18%*
14%
11%
32%*
24%*
27%*
3%*
11%
49%*
34%
28%
7%
12%
15%
17%
1%
2%
8%
1%
4%
1%
6%
1%
5%
8%*
1%
2%
3%
1%
1%
2%
1%
1%
1%
1%
1%
1%
0% 20% 40% 60% 80% 100%
24+ AdvancedLoan
Governmentfunded
Self-funded
Employer-funded
Paid for byparents
Grant
Personal Loan
Unweighted base:
(790)
(680)
Eligible
Comparison
(160)AS/A2/A-Levels
Access to HE
Level 3 Certificate
Level 3 Diploma
Level 4 Certificate/
Diploma
Eligible
Comparison
Eligible
Comparison
Eligible
Comparison
Eligible
Comparison
(350)
(900)
(460)
(900)
(460)
(1350)
(250)
Unweighted Base: All(Source: learner survey, question S11b)* = significant difference between eligible and comparison learners

49
levels; they may therefore take out a maximum of eight loans simultaneously if studying each A level as two separate courses).10
Of the 22 Loans learners who had taken out a loan(s) specifically to fund AS/A2/A levels: the majority (12) stated they had taken out one Loan; five learners had each taken out two Loans; three learners had each taken out three Loans; and one person had taken out four Loans. One person was unsure.
Among eligible learners, older learners were less likely to have chosen to use a 24+ Advanced Learner Loan. 56% of those aged over 40 had done so – although there was no difference between those aged 24-29 (68%) and those aged 30-39 (69%).
At the time of the consultation about the introduction of Loans, concerns were raised about low uptake among Muslim learners. The survey findings show that eligible Muslim learners were slightly more likely to have taken out a Loan than non-Muslims (73% compared to 65%). However, it is not possible to conclude whether this reflects levels of need, or how the volumes of learners deterred from taking up learning by the move from a grant-based environment varied between Muslim and non-Muslim potential learners.
Loan values covered the cost of course fees to varying degrees. The vast majority (92%) of all Loans learners stated that their Loan(s) covered all of their course fees. Loans learners studying Level 4 qualifications were twice as likely to say that their Loan only covered part of their course fee than average (14% compared to 7% of all Loans learners respectively). On the other hand, just 3% of Loans learners who undertook Access to HE Diplomas stated this was the case.
The 7% of Loans learners who stated that their Loan(s) only covered part of their course fees were asked on a scale of one to five how problematic it was to fund the outstanding costs, where one was not at all problematic and five was very problematic. A quarter (24%) said funding the remaining course fees was problematic (four or five on the scale) but almost three fifths (58%) stated that it was not (one or two on the scale).
10 For courses starting on or after 1 August 2016 this will change. See: https://www.gov.uk/advanced-learner-loan/what-youll-get (Date of Access: August 2016)

50
4.3 Awareness of and sources of information about 24+ Advanced Learner Loan Although awareness levels have significantly improved since the 2013/2014 academic year, the majority of eligible learners who took part in the quantitative survey were not aware of 24+ Advanced Learner Loans when they first started thinking about studying (while 64% were unaware last year this had improved to 57% being unaware this year). Levels of awareness at the point when first considering learning were the same among those eligible learners who went on to take out a Loan and those eligible learners who did not (57% for both).
Although there was no variation in levels of awareness by age among eligible learners, there was by qualification type.
Eligible learners undertaking Level 4 qualifications were more likely to state that they were aware of 24+ Advanced Learner Loans (58%) prior to starting than those undertaking AS/A2/A Levels (45%), Access to HE Diplomas (43%) and Level 3 qualifications (41%).
Levels of awareness were also higher among non-white British eligible learners (47%) than white British eligible learners (41%).
Eligible learners who were aware of 24+ Advanced Learner Loans prior to their studies were asked where they had first heard about them. Their responses are detailed in Table 4.1.

51
Table 4.1: Channels through which learners first heard about 24+ Advanced Learner Loans
B2. How did you first hear about the 24+ Advanced Learner Loan?
Source: Learner Survey All eligible learners
aware of 24+ Advanced Learner
Loans
All eligible learners aware of 24+
Advanced Learner Loans
Base (1850) (1690)
% % College / Training provider 64 78 Friends and / or family 16 10 Gov.uk website 6 4 Through employer 6 4 Online (unspecified) 5 3 Media 3 1 Student Loans Company 2 1 Local authority / other public sector organisation 1 2
24+ Advanced Learner Loans practitioner site 1 2
National Careers Service * 1 Money Advice Service * * Skills Funding Agency * * Other 2 3 Don’t know 1 1
Two thirds (64%) of those who were aware of 24+ Advanced Learner Loans had heard about them via a college / training provider, reiterating the influential role that the provider plays in the learner journey.
The second most common channel through which eligible learners first heard about 24+ Advanced Learner Loans was via their friends and/or family (16%). The proportion of learners who found out about loans via this source has significantly increased from 2014/15 (from 10% in 2014/15 to 16% in 2015/16). Learners undertaking Access to HE Diplomas this year were most likely of all course types to have found out about loans from family or friends (21%).
Overall, small proportions of learners first heard about 24+ Advanced Learner Loans via the Gov.uk website (6%), their employer (6%), the Student Loans Company (2%) or the 24+ Advanced Learner Loans practitioner site (1%).

52
4.4 Understanding of 24+ Advanced Learner Loans Eligible learners who stated they were aware of 24+ Advanced Learner Loans prior to their studies were asked whether they thought various terms and conditions applied to learners who take out a Loan; their responses are shown in Table 4.2.
Table 4.2: Learners’ understanding of terms and conditions of 24+ Advanced Learner Loans
C12: % thinking that each of the following terms and conditions applies to learners who receive a 24+ Advanced Learner Loan?
All eligibl
e
Eligible who took out a loan
Eligible who did not take
out a loan
Base: All those aware of 24+ Advanced Learner Loans before starting study
(1850) (1150) (700)
Learners only begin to pay the Loan back when they earn over a certain amount (NB: this condition does apply)
91% 93% 87%
Learners will still be expected to pay some costs for tuition upfront
26% 24% 31%
Interest rates on loans will be linked to inflation and based on income (NB: this condition does apply)
55% 54% 58%
A credit check will be needed for those taking out a loan 35% 29% 47% High street banks will be involved in processing accounts that receive student loans
23% 20% 28%
(asked to all except Access to HE learners) Learners who take out subsequent Higher Education loans will have all their repayments rolled into one (NB: this condition does apply)
38% 40% 34%
(asked to Access to HE learners only) Learners on Access to HE courses who go on to complete a Higher Education course will have the outstanding balance on their 24+ Loan written off (NB: this condition does apply)
82% 84% 69%
Source: learner survey, question C12
Of the statements that are correct, the message that seems to have resonated most clearly with learners is that they do not have to pay the Loan(s) back until they are earning a specific wage and, among those on Access to HE courses, that the Loan will be written off for those doing Access to HE Diplomas who progress to Higher Education. This is reflected in the fact that a high proportion of learners on Access to HE courses had funded their course through a 24+ Advanced Loan.

53
With regard to the other terms and conditions, some misconceptions still exist among sizeable proportions of all learners: among the five statements that were asked to everyone, only 13% of all learners could correctly say whether they applied or not. 30% of learners got four out of five of the statements correct.
Examples of misconceptions included:
• 35% believed a credit check would be needed for those taking out a Loan (a significant increase from 31% of learners who mistakenly believed this applied in the learner survey that was conducted as part of the Stage 1 evaluation among those studying in the 2013/14 academic year);
• 34% did not think that learners taking out subsequent HE loans will have all of their payments rolled into one (no change from the 33% of learners in 2013/14 who thought that this applied);
• 27% did not think that interest rates on loans will be linked to inflation and based on income (no change from the 25% of learners in 2013/14 who thought that this applied);
• 26% thought that learners will still be expected to pay some costs for tuition upfront (no change from the 28% of learners in 2013/14 who thought that this applied); and
• 23% thought that high street banks would be involved in processing accounts that receive Loans (a significant increase from 20% of learners who mistakenly believed this applied in 2013/14).
Unsurprisingly, as Table 4.2 shows, those who went on to take out a Loan display fewer misconceptions about the terms and conditions of the Loan at the time of participating in the research, despite having a similar level of awareness of the Loan as those that did not take out a loan before starting their study11.
4.5 Reasons why Eligible learners did not withdraw 24+ Advanced Learner Loans As previously mentioned, two thirds of those who were eligible to do so had funded their studies with a 24+ Advanced Loan (65%). Just a fifth (20%) of those who did not fund their studies with a 24+ Advanced Learner Loan had applied for one at any point before
11 Note that it is likely that Loans learners were answering these statements based on what they knew by the time of the interview and not based on what they knew before taking out the loan.

54
or after they had secured their place on the course. As Figure 4.3 shows, this equates to 7% of all eligible learners having applied for a loan but not funding in this way.
Figure 4.3: Proportion of eligible learners who funded or applied for a 24+ loan
Comparing this to the findings from the learner survey that was conducted as part of the Stage 1 evaluation (among those studying in the 2013/14 academic year), the proportion of eligible learners funding their studies with a 24+ loan has significantly grown (from 57% to 65%). The proportion who applied but were not ultimately funded by a 24+ loan has remained consistent (8% in 2013/14 compared to 7% this year).
These learners who made an application but did not go on to take out a Loan were asked why this was the case. One fifth (18%) said they were able to find an alternative / preferred method of funding but most other responses were to do with applications being rejected (39% – comprising 28% who said their application was rejected for an unspecified reason, 5% said they were ineligible due to residency status, 4% said they
65%
7%
28%
0%
10%
20%
30%
40%
50%
60%
70%
80%
90%
100%
Those who did notapply and were notfunded by a loan
Those who applied butwere not funded by a24+ loan
Funded by a 24+ loan
Unweighted Base: All eligible learners (4103)(Source: learner survey, question S11b/B9)

55
were ineligible due to their previous studies and 2% said their household earnings were too high12).
Those who did not apply for a 24+ Advanced Learner Loan, despite being eligible, were asked why this was the case. As Figure 4.4 shows, three fifths (61%) of eligible non-Loans learners who did not apply stated they could pay for the course without having to take a Loan out and around half (49%) did not apply due to a dislike of debt.
Figure 4.4: Reasons given by eligible learners for not applying for the loan
Although they were actually slightly more likely to take out a loan, Muslim learners who had chosen not to were more likely than non-Muslim learners to give a dislike of debt as a reason for not taking out a loan (67% compared to 49% of non-Muslim learners).
Over two-fifths (43%) of those who did not apply stated they were unaware of 24+ Advanced Learner Loans, which reinforces the assertion that more could be done to raise (potential) learners’ awareness of 24+ Advanced Learner Loans. Similarly, a number of the other reasons cited suggest that more could be done to improve the information available on 24+ Advanced Learner Loans provided to learners. A quarter (24%) of those who did not apply said that they did not know enough about the application process to do so. Others thought they were ineligible due to reasons such as
12 Applications for 24+ Advanced Learner Loans cannot be rejected on the grounds that the applicants’ household income is too high but this answer reflects learner perceptions.
3%
2%
4%
4%
7%
9%
10%
13%
13%
17%
19%
21%
24%
43%
49%
61%
0% 10% 20% 30% 40% 50% 60% 70%
I could pay for the course without a loan
I did not want the debt
I was not aware of 24+ loans
I didn’t know enough about the application process
I didn’t think funding was available for the qualification
I didn’t think I was eligible as a continuing learner
I didn’t like / know enough about repayment terms
I didn’t think I was eligible due to my age
The loan process was complicated / difficult to understand
I didn’t think I was eligible due to my previous qual. attainment
The course was employer funded
I thought the information was difficult to understand
I didn’t think I was eligible due to my residency status
I didn’t think I was eligible due to my credit rating
I couldn’t apply for the amount of Loan I wanted
Other
Unweighted Base: Eligible learners who did not take out a loan and did not apply (1050)(Source: learner survey, question B10)

56
being a continuing learner (21%), the type of qualification they were undertaking (13%), their previous education (13%) and their age (13%).
In addition to this, one in ten (10%) did not apply as they thought the Loans process was difficult to understand and 7% struggled to comprehend the information relating to Loans.
4.6 Whether eligible learners who did not apply for a 24+ Advanced Learner Loan would do so now Eligible learners who did not apply for a 24+ Advanced Learner Loan were asked whether they would have applied if they knew what they now know about Loans when they were first thinking about studying.
Around a fifth (22%) said they would have applied if they knew what they know now, but the majority (72%) said they would not and a few (5%) were unsure.
Those doing Access to HE courses were far more likely to say that they would have applied if they knew what they know now (48%) compared to those doing other qualification types (just 25% of those doing Level 3 qualifications, 18% of those doing AS/ A2/ A Levels and 17% of those doing Level 4 qualifications stated the same).
Those who stated they would now apply for a 24+ Advanced Learner Loan were asked why that was the case. The most common responses were:
• It would ease financial pressure (35%)
• It would help to spread the cost of learning (14%)
• It would help with course fees (14%)
• It would help the learner to continue in education (14%)
Some also stated they would now apply as they now have more information about Loans (5%).
4.7 The 24+ Advanced Learner Loans Bursary Fund The 24+ Advanced Learner Loan Bursary Fund exists to help Loans learners continue with, and complete, their course in instances where they would otherwise be unable to do so on financial grounds (even with the help of a 24+ Advanced Learner Loan). Loans learners must meet the necessary criteria to be able to access the bursary fund which can be used to assist with costs such as accommodation and travel, course materials

57
and equipment, childcare and classroom assistance for a disability or learning difficulty. In most circumstances, awards from the bursary fund would not have to be paid back.
The Bursary Fund does not cover tuition, registration and exam fees. Each training provider has their own application process for learners to follow and determines the amount that should be paid to the learner.
Loans learners were asked whether they were receiving/had received any other financial support in addition to the 24+ Advanced Learner Loan. One in six (16%) stated that they were in receipt of additional financial support. Of these, two fifths (40%) stated that this was provided through the 24+ Advanced Learner Loans Bursary Fund.
These findings suggest that just 6% of all Loans learners were in receipt of funds through the Bursary Fund.
Nevertheless, the proportion of Loans learners reporting accessing the Bursary fund was slightly higher than in 2013/14, increasing from 4% to 6%.
Around two thirds (63%) of those in receipt of Bursary funding agreed that receiving financial support through this means helped them to decide to proceed with their course of learning, whereas just one fifth (19%) disagreed.
One fifth of those who were in receipt of Bursary funds (19%) reported receiving less than £200, a quarter (26%) between £200 and £400 and one in eight (13%) between £400 and £800. The remaining learners (42%) were relatively spread in terms of the amount they received.
Bursary funding was most likely to be used by learners to help with course-related costs such as materials and other equipment (66% of those in receipt of Bursary funds), travel costs (63%) and childcare costs (30%).
Despite the fact that a small minority reported actually being in receipt of Bursary funding, the vast majority of Loans learners (86%) stated that they were aware of the 24+ Advanced Learner Loans Bursary Fund; most of these learners (63%) stated that they were made aware of it prior to enrolling on the course and the remainder (23%) after they started their course.
13% of white British Loans learners stated that they were not aware of the Bursary Fund at any point, whereas the proportion of non-white British Loans learners who stated this was significantly lower (9%).

58
5. Learners: Motivations for learning and factors driving decision-making This next few chapters of the report expand on the ILR analysis through information collected in the survey of Learners. This chapter explores the impact of the move from a grants-based to a loans-based environment on the ways in which learners choose their course of learning. It explores learners’ reasons for learning, how they chose the type of learning to undertake and where to study - in order to examine whether the move to a system where learners meet the costs of their course themselves has caused them to be more discerning and better-informed about the decisions they make.
Chapter Summary
There were some differences in the ways in which the eligible and comparison group learners approached their learning: the comparison group were more likely to undertake learning to progress in education (e.g. to university or Further Education), to continue being a student, postpone job hunting or for personal interest, while the eligible group were more likely to be undertaking learning as a way to learn skills for a future job or to change career. This may indicate that when learners have more direct financial investment in learning they become more focused on gaining more immediate employment benefits from their learning.
However, it should be noted that some differences in motivation were driven by age, in that older learners tended to be more motivated by employment-related considerations, reflecting the fact that they were more likely to be working.
There is some evidence to suggest that a loans-based environment rather than a grants-based environment makes learners slightly more demanding/discerning. Eligible learners were more likely than those in the comparison group to say that providers did not meet all of their requirements and were more likely to comment on differences in terms of price by providers considered. Eligible learners were also more likely to give more importance to a range of different factors whilst making their decision about learning. Finally, eligible learners were more likely to look for information on funding than comparison learners. It should be noted, however, that there is still limited evidence of shopping around by eligible learners.
For all learners, when making the decision to learn, the cost of learning was less important than other factors (though still relatively important). Providers are a key source of information about funding in general.

59
5.1 Motivations for learning Learners were presented with a prompted list and were asked to state their motivations for undertaking their course; these are shown in Figure 5.1.
Figure 5.1: Learner motivations to study
Among both groups, the most common reasons for undertaking training were personal interest and to develop employment related skills for a future role or different job. However, there were some differences in stated motivations for learning between eligible and comparison learners, with the latter being more likely to have undertaken learning to continue or progress in education and also simply to postpone job hunting. Around three quarters (72%) of comparison learners stated they undertook learning to progress to university / as a stepping stone to further education compared with 53% of eligible learners. Around a third (35%) of comparison learners wanted to continue being a student / postpone job hunting, compared to just a fifth (20%) of eligible learners. These differences may well reflect the different age profiles of the two groups.
Learners were also asked which of these factors they considered to be the main reason for undertaking study (Figure 5.2).
25%
35%*
36%*
52%
72%*
86%
90%
26%
20%*
33%*
54%
53%*
85%
90%
0% 20% 40% 60% 80% 100%
Eligible learners
Comparison learners
It is something I am interested in
To learn skills for future job / change career
To progress to University / as a stepping stone to further education, training or learning
To help progress in my current job / career
To improve self-confidence, socialise or to help with any health problems or disability
As a way of getting back into the labour market / unable to find a job
To continue being a student / postpone job hunting
Unweighted Base: All (6300), eligible learners (4100), comparison learners (2200)(Source: learner survey, question A1)* = significant difference between eligible and comparison learners

60
Figure 5.2: Main motivations to study
Following previous findings, there was a clear variation between loans-eligible and comparison learners. For learners on loans-eligible courses, the most commonly chosen motivations for study were employment-related:
• To learn skills for a future job or to change career (38% compared to 30% of comparison group); and
• To help progress in a current job or career (27% compared to 17%)
Whereas for the comparison group of learners, the most common motivation was education-related.
Comparison learners were also more likely than eligible learners to be motivated primarily by personal interest (14% compared to 9% respectively).
It seems that, at least in part, these differences in motivations for study are likely to be related to the differences in age between the eligible and non-eligible group.
Among eligible learners, the motivations cited by those aged 24-29 were closer to those of the comparison group. A fifth (21%) of eligible learners aged 24-29 stated that progression to university was the most important reason for them undertaking learning, compared to only 12% of those aged 30+. On the other hand, eligible learners aged 30+ were more likely to cite progression within their current job / career as their main reason for wanting to study (28% compared with 25% of those aged 24-29). However, it is clear
1%
2%
1%
14%*
17%*
35%*
30%*
*%
3%
4%
9%*
27%*
15%*
38%*
0% 20% 40% 60% 80% 100%
Eligible learners
Comparison learners
To learn skills for future job / change career
To progress to University / as a stepping stone to further education, training or learning
To help progress in my current job / career
To improve self-confidence, socialise or to help with any health problems or disability
As a way of getting back into the labour market / unable to find a job
To continue being a student / postpone job hunting
It is something I am interested in
Unweighted Base: All (6300), eligible learners (4100), comparison learners (2200)(Source: learner survey, question A2)* = significant difference between eligible and comparison learners

61
that even looking just at the 24-29 age group, eligible learners are more likely to cite immediate work-based reasons for learning than those in the comparison group.
Within the eligible learners group, reasons for learning also varied between those who had taken out a Loan and those who had chosen to fund their study in another way, as shown by Figure 5.3.
Figure 5.3: Main motivations to study, by Loan status
Two fifths (42%) of Loans learners stated that learning skills for a future job/career was the most important reason for undertaking learning, whereas this was the main reason for just three in ten (30%) eligible non-Loans learners.
Loans learners were over three times more likely than eligible non-Loans learners to say that the main reason for their learning was that it would allow them to progress to university, other education, training or learning (20% compared to 6%).
On the other hand, eligible non-Loans learners were most likely to say that progression within their current job / career was the main reason that they wanted to study (44% – compared to just 18% of Loans learners).
In part, these differences are driven by the fact that some of the eligible learners who did not take out a loan were employer-funded (making the reason for investment to progress in a current job more likely).
Learners who were both in employment at the time of the survey and who stated that they were studying to learn skills for a future job/career, were asked whether they
0%
2%
2%
9%
44%*
6%
30%
*%
3%
4%
9%
18%
20%*
42%*
0% 20% 40% 60% 80% 100%
Loans learners
Eligible non-Loanslearners
To learn skills for future job / change career
To progress to University / as a stepping stone to further education, training or learning
To help progress in my current job / career
To improve self-confidence, socialise or to help with any health problems or disability
As a way of getting back into the labour market / unable to find a job
To continue being a student / postpone job hunting
It is something I am interested in
Unweighted Base: Loans learners (2570), Eligible non-Loans learners (1533)(Source: learner survey, question A2)* = significant difference between eligible and comparison learners

62
expected to earn more money in their prospective new job. Comparison learners were slightly more optimistic with regard to their earning potential: three quarters (76%) thought they would earn more in their prospective job and/or following their planned career change, a slightly lower proportion of all eligible learners expressed the same opinion (72% – although this did rise to 78% of eligible learners aged 24-29).
5.2 Factors considered when choosing type of learning and provider One of the objectives of a move to a loans-based environment was to encourage learners to become more informed customers, using their purchasing power to choose the course of the highest benefit to them. Therefore, to gauge the extent to which learners ‘shopped around’ before signing up to their eventual course, they were asked how many different providers they had considered when they first started to think about studying.
Learners reported limited shopping around when it came to choosing their provider: over half of all learners (56%) had only considered one provider and a further fifth (20%) had considered just two. There was little variation between eligible and comparison learners in terms of the number of providers they considered before undertaking learning, suggesting that eligible learners are no more selective in their choice of provider than learners for whom grant funding is available.
However, there was a slight difference between eligible learners who had and those who had not taken out a loan: 44% of Loans learners had looked at more than one provider, whereas 40% of eligible non-Loans learners had looked at more than one.
Learners who had considered multiple providers were asked whether these providers had met their requirements in terms of course offering. As Figure 5.4 illustrates, a third (35%) of all learners said that there was roughly an even split between providers who met their requirements and those who did not, around three in ten (28%) said that all the providers they considered met all of their requirements and a small minority (5%) said that no providers met all of their requirements.

63
Figure 5.4: Extent to which providers met learners’ needs and requirements
Comparison learners were more likely than eligible learners to be positive about providers and their offering: three in ten (31%) said that all of the providers they considered met all of their requirements (this was the case for just a quarter (25%) of eligible learners) and a fifth (21%) said that the majority of all providers had met all their requirements (compared to just 17% of eligible learners). On the other hand, eligible learners were far more likely to state that the majority of providers did not meet their requirements (15% compared to 7% of comparison learners). This indicates that, where learners did shop around, eligible learners were slightly more discerning than comparison group learners.
Learners who considered more than one provider held mixed opinions about the costs of the courses they looked into. Two fifths (42%) of those who considered multiple providers perceived costs to vary from one provider to another (10% perceived costs to vary by thousands of pounds per academic year, 25% by hundreds and 6% by tens of pounds), the same proportion (42%) stated that costs did not vary at all and around one in six (17%) were unable to comment.
Eligible learners were more likely to state that costs varied between the providers they considered. Only a third (36%) of eligible learners said that costs did not vary, whereas half (49%) of comparison learners stated the same. Comparison learners were also more likely not to be able to comment on variation of prices between the providers they considered (20% – compared to just 14% of eligible learners).
7%*15%*12%
31%*25%*28%
21%*
17%*18%
35%
36%35%
4%5%5%
Comparison learnersEligible learnersAll learners
All met all requirements
Majority met all requirements
Roughtly even split
Majority did not meet allrequirements
No providers met allrequirements
Don't know
Unweighted Base: Those who looked at more than one provider: All (2730), Eligible learners (1750) Comparison Learners (980) (Source: learner survey, question A15)* = significant difference between eligible and comparison learners

64
Overall, learners investigating potential Access to HE courses were most likely to state that costs did not vary. Almost three fifths (57%) of eligible learners who were on Access to HE courses and looked at more than one provider reported this to be the case, compared to just three in ten (31%) of eligible learners on Level 3, and a quarter (26%) of eligible learners on Level 4 qualifications.
Learners were asked to rate, on a scale of one to five, how important various factors were when they first started thinking about studying with one being “Not important” and five being “Very important”. Figure 5.5 shows the proportion of learners who considered each factor important (that is, gave it a score of four or five) and not important (that is, gave it a score of one or two) at that time.
Figure 5.5: Importance of factors when learner first started to think about studying
Each factor was rated as important by the majority of learners and those considered most important were: the subject of study, the opportunities that would result from doing the course and the qualification type.
As Figure 5.5 shows, eligible learners were more likely than comparison learners to consider most factors to be important. This suggests that eligible learners possibly had slightly higher expectations of their course.
The cost of the course, while still felt to be important by more than half of all learners, was nevertheless felt to be important by the lowest proportion of all learners (55%). Following previous findings, eligible learners were slightly more likely to consider cost important (58% compared to 52% of comparison learners). Among eligible learners,
52%
58%
66%
71%
67%
81%
86%
89%
58%
62%
71%
73%
75%
85%
84%
93%
Eligible
Comparison
Time commitment of the course
Subject of study
Support available from the provider
Type of qualification
The opportunities that would open up as a result of completing the course
Reputation of college / training provider
The cost of the learning, training or course
Location of the college / training provider
2%
5%
5%
8%
11%
13%
13%
18%
2%
3%
4%
13%*
11%
13%
16%
23%*
Unweighted Base: All (6300), eligible learners (4100), comparison learners (2200)(Source: learner survey, question A4)
*
*
Not ImportantImportant
*
*
*
*
*
65
those aged 30-39 were more likely to consider cost important than those in other age bands (62% compared to 56% among those aged 24-29, and 57% among those aged 40+).
Those who said that cost was an important factor when they first started to think about studying were asked what cost-related issues were considered at this time13. The most common consideration for these learners was the cost of the course fees (cited by 66%).
Again, compared to comparison learners, eligible learners were more likely to consider…
• cost of course fees (76% compared to 49%)
• cost of course materials (48% compared to 45%)
• cost of living (48% compared to 37%)
• childcare costs (27% compared to 8%)
On the other hand, a higher proportion of comparison learners considered the cost of travel whilst doing the course (56% compared to 48%). Comparison learners were also more likely to state that they did not consider any specific cost-related issues before making the decision to study (18% compared to 10% of eligible learners).
5.3 Funding information sought and sources used Overall, a higher proportion of learners sought information on funding (55%) than did not (44%) and eligible learners were far more likely to have done so than comparison learners (65% compared to 41%, rising to 67% of eligible learners aged 24-29).
All learners who had looked for information on funding were asked which sources they had consulted. For both eligible and comparison learners, the most common source of information by far was from the college/training provider that the learner was applying to (65% of all learners). The proportion of learners for whom this was the case was particularly high among comparison learners (70% – compared to 63% of eligible learners). This highlights the importance of the provider in explaining funding options (including Loans) to potential learners.
The second most common source of information mentioned was the Gov.uk website, which was only accessed by around one fifth of all learners (18%) and accessed by significantly more eligible than comparison learners (20% compared to 13%). Eligible learners were more likely to have sought information by conducting unspecified internet
13 The 24+ Advanced Learner Loan is designed to cover course fees only. Funding for additional costs such as childcare, travel expenses and course materials are not covered by the loan.

66
searches and they were also more likely to have consulted the Student Loans Company website for information than comparison learners (16% compared to 8% and 12% compared to 7% respectively).
On the other hand, comparison learners were slightly more likely to have consulted their friends and / or family for information on how to fund their studies (11% compared to 8% of eligible learners).
Learners were then asked about how easy or difficult it was to find information about funding in general (rather than specifically about 24+ Advanced Learner Loans). The majority (74%) felt that general funding information was easily found. As Figure 4.6 shows, eligible learners were more likely to state that it was easy to find general funding information (76%) than non-eligible learners (71%).
Figure 5.6: Ease of sourcing general funding information
10%
10%
10%
2%
3%
3%
42%
42%
42%
28%*
35%*
33%
Unweighted Base: Those who sought information on funding study(Source: learner survey, question A11)
Unweighted base:
(3510)
(900)
(2610) Eligible learners
Comparison learners
All
Neither / Don’t know Total Easy
(13%)
(18%)
(10%)
71%*
76%*
74%
* = significant difference between eligible and non-eligible learners
Quite difficultVery difficult Quite easy Very easy
67
6. Learners: Stated impact of 24+ Advanced Learner Loans on learning decisions This section of the report examines the impact that taking out a 24+ Advanced Learner Loan had upon learners’ decision-making regarding their learning. It will also explore whether the eligible learners who did not take up a Loan felt that taking out a 24+ Advanced Learner Loan would have had an impact on their learning decisions. Because the questions relate to their take-up of the Loan, this section of the report looks at the difference between eligible learners who did and did not take out the Loan.
6.1 The extent to which Loans open opportunities to learners As Table 6.1 shows, eligible learners who had taken up the Loan felt that it had given them opportunities in a number of areas. It had allowed them to start studying or training sooner (88%), to take a higher level of qualification than they would have been able to otherwise (83%), to take a course that lasted for a longer period of time (73%), and, for those who were studying full-time, it allowed them to undertake studying on a full-time basis as opposed to part-time (79%).
Chapter Summary
In the absence of grant funding, it is clear that the 24+ Advanced Learner Loan has ensured that some learners were able to undertake courses that they would not otherwise have been able to. Eighty per cent of those who took out a loan stated that they would not have been able to undertake their studies without it.
Reflecting this, there were extremely high levels of recommendation among Loans learners: almost all would recommend the loan to others in similar situations.
Non-Loans learners were also asked whether the Loan would have provided them with further opportunities in their learning and they were more mixed in their views, though around half did agree that the Loan would have presented them with the option to study differently. The most common impact was felt to be that a loan would have allowed them to study a higher level of qualification.
The absence of a loan would have a negative impact on substantial proportions of Loans learners: almost two thirds would have had to postpone their studies, while almost half stated that they would have abandoned their study altogether had a loan not been available to them. Learners on Access to HE courses were most likely to report that they would have abandoned study altogether in the absence of a loan.

68
Among Loans learners, only 4% stated that being able to access a Loan had not facilitated their learning in any of the ways shown in Table 6.1.
Table 6.1: Opportunities provided by availability of loan
Source: learner survey, question F1
Those on AS/A2/A level courses were less likely to agree that the Loan had enabled them to undertake a course at a higher qualification level than would have otherwise been possible.
Non-Loans learners were also asked whether taking out a Loan would have changed the learning options open to them in any way. Two fifths (39%) did not feel that taking out a Loan would have changed the options open to them in any of the ways shown in Table 6.1 but this means that three fifths (61%) felt that if they had taken out a loan then it would have enabled them to change their learning approach.
Around half of the eligible learners who had not taken out a Loan agreed that the Loan would have allowed them to take a higher level of qualification than they would have been able to otherwise (52% agreed vs. 40% disagreed), to start studying or training sooner (41% vs. 54%), to take a course that lasted for a longer period of time (46% vs. 48%) and, for those studying part-time, to undertake studying on a full-time basis as opposed to part-time (35% vs. 58%).
Comparison learners were also asked to consider, hypothetically, the opportunities that the availability of a loan would have offered them.
Source Eligible
learners who took up loan
Eligible learners who did not take
up loan
Unweighted base (2570) (1530) % % Start studying or training sooner than would otherwise have been possible
88% 41%
Undertake a course at a higher qualification level than would otherwise have been possible
83% 52%
Undertake a course that lasted for a longer period of time 73% 46%
Start a course or learning on a full-time basis rather than a part-time basis (if currently studying part-time)
79% 35%

69
The answers of comparison learners were closely aligned to those of eligible non-Loans learners, with 62% considering that a Loan might have enabled them to change their learning approach. Between four and five in ten comparison learners felt that the Loan would have allowed them to:
• Undertake a course at a higher qualification level than would otherwise have been possible’ (53% agreed)
• Undertake a course that lasted for a longer period of time (51%, compared to 46% of eligible non-Loans learners)
• Start studying or training sooner than would otherwise have been possible (43%)
• Start a course or learning on a full time basis rather than a part-time basis (40%, compared to 35% of eligible non-Loans learners).
6.2 The impact of 24+ Advanced Learner Loans on learners’ decision-making In order to further assess the effect that Loans have had on decision making, eligible learners were asked what they anticipated they would have done differently if the Loan had not been available to them.
The absence of a loan would have had a negative impact on substantial proportions of eligible learners and their ability to undertake the qualification they eventually chose:
When asked “Do you think that you would have been able to undertake your studies without a 24+ Advanced Learner Loan?”, eight in ten (80%) of eligible learners who had taken up a loan felt that they would not have been able to undertake their course without their Loan.
Loans learners were also asked whether they would have made any of the changes to their plans shown in Figure 6.1 if they had not been able to access a Loan.
As Figure 6.1 indicates, quite high proportions of eligible learners who took out the Loan felt that, if it had not been available to them, they would have postponed studying until a later date (68%), found alternative sources to fund the course (58%), abandoned the idea of studying altogether (44%), chosen a cheaper course (39%), changed career plans or aspirations (38%), and chosen a different course (31% agreed).

70
Figure 6.1: Implications if Loans learners had not taken out a Loan
Those learners on Access to HE courses who had taken out a Loan were most likely to agree that they would have abandoned studying altogether had the loan not been available to them; 49% agreed. This is significant, given that this is the qualification type with the highest proportion of Loans-funded learners.
Loans-learners on Level 3 Certificate were most likely to disagree that they would have abandoned their study without a loan: 53% disagreed.
Among those who would have postponed studying (if a Loan had not been available), the majority would have postponed for more than 12 months (62%).
Of learners who took out a Loan, 58% said that if they had not had access to a Loan then they would have identified alternative funding sources. This may indicate a degree of ‘deadweight’ whereby government funds have been used to provide Loans for learners who could have funded their learning in another way. However, it is not possible to tell from this question how likely it is that learners would actually have been able to secure alternative funding.
Those who thought that they would have found alternative funds if a loan had not been available were asked how. As seen in Table 6.2, the majority felt they would have self-funded (61%), 31% would have funded via a personal loan (e.g. from a bank or building society), 5% through a grant and 3% through employer funding.
68%
44%39% 38%
31%
0%
10%
20%
30%
40%
50%
60%
70%
80%
Postponed studying until alater date
Abandoned the idea ofstudying altogether
Chosen a cheaper course Changed career plans Chosen a different course
Proportion of Loans-eligible learners who agree that without a 24+ Advanced Learning Loan they would have…
Unweighted base: Eligible learners who took out a loan (2570)(Source: learner survey, question F2)

71
Table 6.2: Alternative funding sources had the loan not been available
Source: learner survey, question F1
6.3 Levels of 24+ Advanced Learner Loans recommendation As a final gauge of learner perceptions of 24+ Advanced Learner Loans, eligible learners who had taken up the loan were asked whether or not they would recommend the Loan to other students of a similar age looking to undertake study at Levels 3 or 4.
The vast majority (96%) stated that they were likely to recommend loans with 87% being very likely to do so. Only 1% would be unlikely to recommend the loan.
F4. What sources would you have used to fund the course?
Base: Those who agree that they would have funded a course another way if their Loan had not been available
(1520) %
Self-funded 61 Personal loan 31 Grant or bursary 5 Employer funding 3

72
7. Learners: Satisfaction with course to date and anticipated impacts of learning One of the objectives of the 24+ Advanced Learner Loans is for learners to become more engaged with their learning. Therefore, this section explores levels of learner satisfaction with their studies by the time of the research and examines what they expected to be the longer term outcomes of their learning.
Chapter Summary
Reported satisfaction with the course at an overall level, as well as specific aspects of the course, was very high.
Findings provide some evidence that a loans-based environment rather than a grants-based one drives slightly higher levels of student engagement with the process of learning.
The majority of learners felt that they had made the right decision when it came to their learning choices, with around six in ten stating that it was unlikely that they would choose differently across any of the factors explored. However, there is a sizeable minority (particularly among the loans-eligible group) who felt that they would make different decisions if choosing their course again. For example, around a quarter of the loans-eligible group felt that they would choose another subject or study with another provider if making the choice again.
Loans eligible learners reported a slightly greater level of dissatisfaction with aspects of their course (such as the attitudes of their fellow course mates and the level of difficulty of the course).
At the same time, they reported being slightly happier with their grade outcome and were more satisfied than the comparison group that they had taken every action to participate fully in the course (i.e. fewer learners in the loans-eligible group felt that they would have worked harder, spoken more to tutors, or made more use of resources if given chance to repeat).
However, it is important to remember that loans-eligible learners are, by definition, older than those in the comparison group and this may well be responsible for some of the differences.

73
7.1 Attitudes towards learning and behaviour on courses
In terms of overall satisfaction, eight out of ten learners (80%) stated that they were satisfied with their course at the time of the survey. However, as Figure 7.1 shows, while satisfaction was at a relatively high level across all groups, the comparison group were most satisfied with their course (only 11% were dissatisfied overall compared to 14% of the eligible group). The least satisfied group were the younger eligible learners (only 76% were satisfied, compared with 81% of older eligible learners and 81% of the comparison group).
Figure 7.1: Overall satisfaction with course
Within the loans-eligible group – satisfaction levels were very similar for those who actually took out a 24+ Advanced Learner Loan and those who were funded through other routes (79% and 80% satisfied respectively).
Learners were asked a series of questions about how satisfied they were with a number of different aspects of their learning experience to date:
• The quality of teaching they received;
• The number of teaching / contact hours they had with teaching staff and;
• The attitudes of their fellow course mates.
For each of these three measures, levels of satisfaction were high among both the eligible and comparison group learners.
7%
8%
8%
4%
6%
5%
35%
28%
31%
46%
51%
49%
Unweighted Base: All(Source E1)
Unweighted base:
(2200)
(4100)
Comparison learners
Eligible learners
All learners(6300)
Neither / Don’t know
Total Satisfied
(7%)
(7%)
(7%)
81%
79%
80%
Quite dissatisfiedVery dissatisfied Quite satisfied Very satisfied
* = significant difference between eligible and comparison learners

74
However, the eligible learners were comparatively less satisfied than the comparison group with several different aspects of the course. When it came to the number of teaching hours, the comparison group were least dissatisfied (only 8% were dissatisfied compared to 11% of the eligible group).
Figure 7.2: Satisfaction with aspects of the course
Within the loans-eligible group, satisfaction levels were similar for learners who did and did not choose to take out a Loan for both quality and number of contact hours. However, learners with Loans were slightly less likely to be satisfied with the attitude of their course mates (69% were satisfied compared with 75% of those who did not take out Loans).
Learners were also asked how they found the course in terms of its level of difficulty. The responses given were very similar for the loans-eligible group and the comparison group. The comparison group were slightly more likely to feel it was pitched at the right level (84% believed it was about right, compared to 81% of the loans eligible group), while eligible learners were more likely to think that it was too difficult (10% thought it was too difficult, compared to 8% of the comparison group).
7.2 Whether would change options if had time again
As an additional way of assessing learners’ satisfaction with their learning experience, they were asked a series of questions about how likely it was that they would have made different learning choices if they were deciding again.
As Table 7.1 indicates, the majority of learners felt that they had made the right decision when it came to their learning choices, with around six in ten stating that it was unlikely
4% 5% 4% 4% 5% 3% 3% 3% 2%6% 6% 6% 6% 6% 5% 6% 5% 7%
15% 14% 16% 15% 14% 16% 17% 16% 18%
26% 23%31% 27% 23%
33% 28%24%
33%
48% 52%43% 48% 51%
43% 44%47%
39%
0%
10%
20%
30%
40%
50%
60%
70%
80%
90%
100%
All Eligible Comparison All Eligible Comparison All Eligible Comparison
Very satisfied
Fairly Satisfied
Neither satisfiednor dissatisfied
Fairly dissatisfied
Very dissatisfied
Unweighted Base: All (6300), eligible learners (4100), comparison learners (2200)(Source: learner survey, question A4)
* = significant difference between eligible and comparison learners
E2-2: Satisfaction with the number of teaching / contact hours
E2-3: Satisfaction with attitude of fellow course mates
E2-1: Satisfaction with the quality of teaching

75
that they would choose differently across any of the factors explored. However, the eligible and comparison group differed in their views with the latter more satisfied that they had made the right decision with their choices across all aspects.
The eligible group were more likely than the comparison group to say that if they were to choose now, they would be likely to choose another subject (28% compared to 23%), to study with a different provider (24% compared to 20%) and to choose a different type of qualification (28% compared to 24%). Older eligible learners (aged 30+) were more likely than the younger eligible group (aged 24-29) to say that they would have chosen a different type of qualification (29% compared to 25%), and to have chosen something completely different (18% compared to 15%).
Table 7.1: Likelihood of taking different course of action, if deciding now
E3. If you were to choose now whether or not to study your course, how likely or unlikely is it that you would…?
LIKELY UNLIKELY
Source Eligible Comparison group (not eligible for
Eligible Comparison group (not eligible for
Unweighted Base 2,570 2200 2,570 2200 % % % % Do a different subject 28 23 60 61 Work towards a different type of qualification
28 24 56 57
Study at a different provider 24 20 59 63 Decide to do something completely different
17 17 70 70
The comparison group were more likely to agree that the course they studied was good value for money (68% agreed that it was compared to 64% of eligible learners). Considering that almost two thirds of the comparison group have had their course funded by the government, it may be expected that they would find the course good value for money. The older eligible learners (aged 30+) were more likely to agree that it was good value compared to the younger (aged 24-29) eligible learners (65 vs 61%).
Within the loans eligible group, those who had taken out a Loan were slightly more likely to disagree that their course was good value for money (18% compared with 15% of learners who did not take out a Loan).

76
7.3 Benefits of undertaking learning
In addition to their satisfaction with the course and their behaviour on the course to date, learners were asked to evaluate what they perceived to be the benefits of undertaking their learning. Learners were asked whether they believed gaining their qualification would lead to a number of prompted outcomes. As Figure 7.3 shows, learners were generally positive about the longer-term benefits of their learning both on an employability and personal level. The majority believed that their course would improve their career prospects, develop their job skills and improve their self-confidence.
Loans-eligible learners were more likely to agree that taking their course had allowed them to develop skills that will be of benefit to their current work or the area in which they have experience (74% compared to 56%), or to move into a different type of work (68 vs 62%), while the comparison group were more likely to feel that the course had allowed them to develop the skills or knowledge to set up a new business (53 vs 48%).
The fact that the comparison group were more likely to notice ‘forward-facing’ benefits (i.e. benefits that will help them change their situation going forward) was linked to the fact that, while the eligible group were likely to be working full time whilst studying and to have worked before starting studying, the comparison group were much more likely to be studying full time and not to have worked beforehand, and therefore potentially be looking to start their first job/ a career after finishing the course.
Both groups were equally likely to feel that the course improved their self-confidence.
Figure 7.3: Stated benefits of undertaking learning
29%
53%
45%
62%
82%
89%
91%
19%
48%
54%
68%
81%
88%
89%
23%
50%
50%
66%
82%
88%
90%
0% 20% 40% 60% 80% 100%
All learners
Eligible learners
Comparisonlearners
Learned / developed skills that will help me move into a different type of work
Improved careers prospects
Improved self-confidence
Learned / developed skills that will help me move into the type of work I want to do
Developed skills / knowledge to set up a new business
Learned / developed skills that will be of benefit in the area of work I have experience in
Learned / developed skills that will help me to move into any type of work
Unweighted Base: All (6300), Loans-eligible learners (4100), comparison group (2200)(Source: learner survey, question E6)
* = significant difference between eligible and comparison learners
*
*
*
*
*
*

77
The only difference by age within the eligible group was that the older (aged 30+) learners felt that the course had given them the skills which would benefit them in their current area of work (56 compared to 51%) while the younger (aged 24-29) eligible learners felt that they had gained the skills that would help them to move into a different type of work (70% compared to 67%). This indicates a greater level of stability among the older group of learners, and that they are more likely to be in a job which they expect to be a long-term career at the time of the interview, which is perhaps to be expected.
Learners who had completed their course at the time of the survey were asked whether they were happy with their final grade or course outcome.
Notably, while levels of satisfaction with the final grade were very high across all groups of learners (93% of eligible and 90% of comparison group learners reported being happy), the comparison group were more likely to say that they were unhappy with the final grade or outcome of their course (9% were unhappy compared to 5% of eligible group).
Looking into this further, comparison learners who completed the course were more likely to say that they would have done a range of things differently if they were to have the opportunity to redo the course.
Figure 7.4: Learners’ stated actions if redoing their qualification
35%
43%
49%
50%
20%
24%
40%
36%
27%
31%
44%
41%
0% 20% 40% 60% 80% 100%
All
Loans-eligiblelearners
Comparisongroup
I could have achieved a better grade or outcome from the course if I had worked harder
If I were to study my course again I would make more use of resources
If I were to study my course again I would start revising sooner for exams or assessments
I could have achieved a better grade or outcome from the course if I had spoken more to my tutors
Unweighted Base: Those who completed the course: All (4436), Loans-eligible learners (2854), comparison group (1582)(Source: learner survey, question E8)* = significant difference between eligible and comparison learners
*
*
*
*

78
As Figure 7.4 illustrates, comparison learners were significantly more likely to agree with the following statements when compared with eligible learners:
• If I were to study my course again I would start revising sooner for exams or assessments (50% vs. 36% of eligible learners)
• If I were to study my course again I would make more use of resources (49% vs. 40% of eligible learners)
• I could have achieved a better grade or outcome from the course If I had worked harder (43% vs. 26% of eligible learners)
• I could have achieved a better grade or outcome from the course if I had spoken more to my tutors (35% vs. 20% of eligible learners)
These findings perhaps indicate loans-eligible learners were more likely to have given their course ‘their best shot’ and hence to leave without any regrets about the effort they put in. However, it is hard to separate out the extent to which this is a function of the different ages of learners and the extent to which it is a positive side-effect of a loans-based environment over a grants-based one.
Within the group of loans-eligible learners, those who took out Loans were slightly more likely than those who did not to agree that, if studying again, they would make more use of resources and start studying sooner. They were also more likely to agree that they would have achieved a better outcome if they had spoken more to tutors. However, the differences between these two groups are less marked than the differences between the whole loans-eligible group and the comparison group (who were largely grant funded).
As discussed earlier in Chapter 3, these differences in attitudes between the eligible learners and the comparison group are not reflected in changes in the achievement rate for loans-eligible learners. The impact of the move from a grant-based environment to a loans-based one was actually a small negative one (although this is in the context of achievement rates that have been maintained at close to 90% in the years running up to the introduction of 24+ Advanced Learner Loans).

79
8. Learner: Destinations This chapter will look at the destinations of learners on finishing their studies. It will explore the hypothesis that, if better learning choices and/or more motivated learners are a result of the move from a grants-based system to a loans-based one, then this should lead to better learner outcomes both in the short-term (on completion and attainment rates) and in the longer-term (on employment outcomes, progression to further learning and on wages). The impact on wages is particularly important because the repayment of 24+ Advanced Learner Loans is income-contingent. The extent to which learners on Access to HE courses who received 24+ Advanced Learner Loans progress to HE is also important, since these learners will have their 24+ Advanced Learner Loan written off.
8.1 Destinations of learners after finishing their course
Learners were asked a series of questions about what they are were doing after they had finished their qualification. Overall, eligible learners were likely to be earning more and in more skilled job roles than those in the comparison group. Even comparing the comparison group to the group of eligible learners who are closer in age, the difference is marked: the 24-29 eligible learners earned more and were in more skilled job roles. Compared to the comparison group, more of the 24-29 eligible learners were: managers (4% vs 2%), professionals (7 vs 4%), associate professionals (13 vs 9%) and administrative or clerical staff (17 vs 9%). Meanwhile, the comparison group were more likely to be sales and customer service staff (20 vs 8%) or in elementary roles (17 vs 9%) compared to the 24-29 year old eligible learners.
Chapter Summary
Eligible learners were in more senior, better paid jobs by the time of their participation in the research and were certainly more likely to be in a role they plan to be in long term, while comparison group were more unsure of their career plan and more likely to still be studying at the time of research. It is possible, therefore, that grant funding acts as a “cushion” which means that learners feel able to take longer to decide what career they will pursue or feel less urgency to enter job market. However, it is also likely that the relative younger age of learners in the comparison group may explain this to an extent.
Eligible learners were more likely than the comparison group to say that they did not expect to ever reach a salary of £21,000, with the older (aged 30+) eligible learners most likely to believe this.

80
When those currently working were asked about how their current role fits into their longer-term career plans, the majority said that it was either the job they intend to be doing in the long run (30%) or a stepping stone into the type of work they would like to do in the long term (37%). The eligible group were more likely to be working in the job they intend to be doing in the long run (35% vs 22% of the comparison group), and eligible learners aged 30+ were most likely to already be working in a role that they intend to be doing long term (39% vs 28% of the 24-29 age group). Meanwhile, the comparison group were more likely to be working in a job that does not fit into their career plan (26% of them compared to 20% of the younger 24-29 eligible group), or to not have a career plan yet (13% compared to 10% of the younger 24-29 eligible group).
Instead, the comparison group were more likely to be undertaking further study at the time of the research: almost half of them were undertaking further study (47% compared to 37% of the overall eligible group and 41% of the 24-29-year-old eligible group). Of all learners undertaking further study, the comparison group were more likely to be studying qualifications at a higher level: 55% had gone on to study at Level 5 or above, while only 40% of the Eligible group were studying at this level.
This may indicate that availability of grant funding/government subsidy at Level 3/4 motivates learners to continue with education or enables them to do so to a greater extent than if they have had to fund their own learning. However, the age differences between the eligible and comparison groups are likely to have had a strong influence over these findings.
Perhaps unsurprisingly, those who had studied an Access to HE qualification were most likely to have progressed onto a Level 5 (Higher Education) course: two thirds (67%) of all Access to HE learners had done this. This was consistent between the comparison group (69%) and the eligible group (65%).
Learners who were working were asked how much they were earning in their current job. As Figure 8.1 shows14, the eligible group tended to be earning a greater amount. The comparison group were more likely not to be working at the time of the survey (41% compared to 31% of the eligible group), while the eligible group were more likely to be earning £21,000 or more (14% compared to just 4% of the comparison group). Hence some eligible learners were at the threshold for repayment of the Loan relatively quickly after finishing their eligible course.
14 Note that these percentages do not add to 100%, as a high proportion of learners declined to disclose their salary

81
Figure 8.1: Earnings at the point of participation in the research
Within the loans eligible group, learners who took out a 24+ Advanced Learner Loan tended to be earning at lower levels than those who funded their learning through another route. A third (34%) of those that did not take out a loan were earning more than £21,000 compared to 10% of learners with loans).
Those who were currently earning less than £21,000 were asked when they anticipated they might earn above the threshold of £21,000.
As Figure 8.2 shows, eligible learners were more likely than the comparison group to say that they did not expect to ever reach a salary of £21,000, with the older loans-eligible learners most likely to believe this (16% of overall eligible learners and 21% of the 30+ eligible learners reported this, compared to only 3% of the comparison group). The proportions who felt they would reach this level in the next 1 to 3 years were very similar but, among those who did not feel they would reach the threshold within 3 years, comparison group learners were more likely to feel that they eventually would.

82
Figure 8.2: Expectations of reaching a salary of £21,000
Within the loans eligible group, those who took out loans anticipated it taking longer to reach the £21,000 threshold than those who did not take out loans. A third of those with Loans felt that they would reach this threshold within 3 years compared to 41% of eligible learners who funded their learning through another route.
Although this is stated income rather than robust tracking data, this nevertheless indicates that there is a small but significant proportion of eligible learners who are unlikely to reach the threshold to start paying a Loan back. Particularly for the older learners, the majority are already working in the job they intend to be in in the long term and are therefore likely to have realistic salary expectations, which would mean that they do not have to pay their 24+ Advanced Loan.
All learners 10% 27% 30% 12% 4% 11%
Eligible 9% 27% 27% 10% 5% 16%*
Comparison 11% 28% 36% 16% 2%
3%*
In 1 to 3 yearsIn the next year In 3 to 5 years In 5 to 10 years In more than 10 years Never expect to pay it back
Unweighted base: All currently earning less than £21,000: All (2570), Loans-eligible learners (1690), Comparison group (880)(Source: learner survey, question I9)* = significant difference between eligible and comparison learners
83
9. Providers: Information provision Providers have a key role to play in explaining 24+ Advanced Learner Loans to (prospective) learners who make enquiries about eligible courses. It is the responsibility of providers to ensure that clear information on 24+ Advanced Learner Loans is available. This chapter looks at the flows of information about 24+ Advanced Learner Loans from the provider perspective, exploring how providers acquired information themselves and how they raised awareness among, and answered the queries of, learners. Providers included in these strands of the research are practitioners delivering Level 3 and 4 adult learning and training courses with a 24+ Advanced Learner Loan facility. Student Finance England pays the loan to the learners’ training provider in the form of monthly payments once they have confirmed the learner’s attendance on the course – no money is transferred to the learner.

84
9.1 Dealing with queries raised by students
Providers reported that they felt capable in dealing with queries raised by students and were comfortable when discussing the Loans process. This was captured in both the quantitative and qualitative interviewing.
We are very comfortable – we think that the courses we sell add value. We genuinely believe that by doing the programmes they will get a return - so the loan is an investment in their future. Actually almost more comfortable selling the idea of loans to learners than maybe some of the other funded learning because we can be surer that they will make use of it than some where it is just part of something they are funded to do.
Chapter Summary
Providers were either at least as confident or more confident in dealing with all types of queries from students compared to last year, with the most marked increase in confidence seen when dealing with enquiries about where to seek independent advice and about multiple loans.
Providers were evidently feeling an increased familiarity and comfort with the process as a whole: time spent dealing with enquires was seen as less disruptive and concerns around being seen to ‘sell’ loans to students have abated since last year.
The process of engaging with learners is broadly unchanged from last year (providers were sharing information with learners at several points, such as open days, assessments and interviews). However, over the past year, the format of information provided has been tailored to a greater extent by some providers, to emphasise certain messages or to ensure that it ties in with the format of their own materials. More providers were aware of the 24+ Advanced Learner Loans practitioner site.
The two key messages that providers focus on to promote the loans remain the same as when loans were first introduced: learners will not have to repay the loan until earning at least £21,000, and the Loan will be written off if they go on to complete an HE course after studying an Access to HE course.
However, the timing of communications and target audience has changed slightly. Providers explained that they were starting to introduce the loans in communications to learners at an earlier point in the academic year, and to target current Level 2 students, in order to encourage learners to make their loans applications earlier on. This aimed to reduce the number of students who started courses but withdrew before completing a successful loans application (or upon being refused a loan), thereby helping to give providers a clearer idea of the funding that they would receive.

85
(Private / voluntary sector provider, £50,000 - £249,999)
We are doing a lot of handholding…. We are OK with the students’ queries; it is more the internal organisational problems it gives [which are an issue for us].
(Private sector provider, £50,000 - £499,999)
Once you have done it [once] it is easy.
(Local Authority, <£50,000)
Providers who were less comfortable discussing Loans with potential learners when they were first introduced, had become more accustomed to the process by the second year of Loans and were now feeling more confident.
Our staff had got to get used to it; that was quite a difficult thing to come to terms with – how it all worked and everything. Certainly, to begin with it was a challenge… They’re becoming a little more confident about it.
(Local Authority, £250,000 - £999,999)
During the quantitative interviews, providers were asked to state their level of confidence in handling enquiries from prospective students on a range of aspects of 24+ Advanced Learner Loans (Figure 10.1). Compared to the previous year, providers were more confident handling all types of queries (with the exception of who can/should apply for a Loan where confidence levels remained broadly similar).

86
Figure 9.1: Provider confidence in handling queries from prospective learners
The vast majority of providers had a high level of confidence when dealing with enquiries on the following subjects:
• how to apply (94%);
• who can/should apply (94%);
• amounts and what they cover (91%);
• paying back the loan (91%); and
• the rationale for the introduction of Loans (88%).
There was a significant increase since the previous year in the proportion of providers who felt confident in dealing with enquiries about where or how independent advice should be sought (94% up from 74% last year) and about multiple loans (67% up from 49% last year). Providers who were interviewed in both years showed significantly increased confidence in the second year in terms of dealing with enquiries about multiple loans (up from 42% in 2013/14 to 66% in 2014/15); in dealing with enquiries about the number of loans that can be applied for (up from 63% to 77% this year); and in dealing with enquiries about customer complaints procedures (up to 98% from 91%).
The interaction with HE loans remained the aspect that providers felt least comfortable in addressing, with under half of the providers stating that they felt confident handling this type of enquiry (48%). Nevertheless, there was a slight increase in confidence among providers over the course of the year.
91%95%
87% 88%83%
74%
49%42%
94% 94% 91% 91% 88%94%
67%
48%
0%
10%
20%
30%
40%
50%
60%
70%
80%
90%
100%
How to apply Who can/shouldapply
Amounts andwhat they cover
Paying back theloan
Why loans havebeen introduced
Where/howindependent
advice should besought
Multiple loans Interaction withHE loans
2013/14 2014/15
Unweighted base: All; 2013/14 (250) and 2014/15 (250)(Source: provider survey, questions B14) * = significant difference between academic years

87
Generally, colleges and sixth forms remained the type of provider with the highest level of confidence in handling the range of enquiries. Colleges and sixth forms were more confident than private providers in:
• Dealing with enquiries about how to apply for a loan (99% of colleges were confident vs. 89% of private providers)
• Course enrolment agreements with learners (95% vs. 86%)
• The number of loans that can be applied for (87% vs. 69%)
• Dealing with enquiries about loan amounts (98% vs. 84%)
• The interaction with HE loans (72% vs. 35%)
During the qualitative stage, the majority of providers said that there were no particular student questions they found difficult to handle. Several of the providers attributed this to the Student Loan Company’s (SLC) role in dealing with providing information around repayment terms and amounts; some providers mentioned that when in doubt, they would go to the SLC for clarification. Others felt that it should not be the responsibility of the provider to answer financial questions in case it is seen as encouraging the students to take out a loan; instead, they referred students directly to the SLC.
I just give them the basics really and don’t go into what percentage they are paying back when they start earning. To me, I should only go so far and then it is between the Student Loan Company and the learner. As long as I have got the fee for the course and the application has gone through fine, then that is where I sort of leave it.
(Private / voluntary sector provider, £50,000 - £249,999)
The SLC decide the eligibility so you don’t have to do that. Availability doesn’t fit all sectors – I know it is there and they can access it but they won’t and you are not going to change that overnight. We have the allocation there so we have the availability but we don’t have the learners that want to take that availability.
(Local Authority, <£50,000)
There was further evidence that providers were more confident in their ability to answer queries and they had become more familiar with the system with time. Four-fifths (80%) of providers stated that they were satisfied with the time they devoted to assisting learners with their queries regarding 24+ Advanced Learner Loans. While this figure was consistent overall with the 2013/14 findings, the percentage who were satisfied that they could handle the enquiries without causing too much disruption increased from 76% to 82% between the two years. This was primarily been driven by an increase in satisfaction by colleges and sixth forms, from 67% in 2013/14 to 86% in 2014/15.

88
9.2 Provision of information on 24+ Advanced Learner Loans to students and key messages used During the qualitative stage, providers described how they went about introducing the availability of 24+ Advanced Learner Loans to potential students. Consistent with the findings from last year, the majority of providers stated that they discussed Loans with potential learners at multiple stages of the application process, including at open days, assessments and interviews.
As well as these events, providers used a range of literature in Loans communications such as emails, letters, websites and leaflets. While these were also frequently mentioned in the qualitative stage last year, some providers mentioned that they had started producing their own materials in-house, rather than using those provided by BIS, SLC and SFA. Reasons for doing so varied: some wanted to focus on specific key messages when promoting the loans, while others wanted to merge the information with their own materials to make it more accessible for students. Again, this indicates an increased familiarity and comfort with the process of communicating information about loans to students.
Students can apply for the 24+ Advanced Learner Loan at any time during the course, though they are advised to apply as early as possible. They cannot apply for the loan after completing their studies. Some providers reported students withdrawing from the course before successfully completing the loans application process. As this report will go on to cover, although the numbers of students withdrawing partway through the course has not changed for the majority of providers, a small proportion reported the number of withdrawals increasing. This was a concern for those providers as they then received no funding for these students who withdrew.
In response to this, a few providers had started introducing Loans at an earlier stage in their communications with learners in order to encourage early applications; and to ask learners to provide evidence that they are in receipt of a loan within a specified time frame after enrolling on the course – at which point they are sent an invoice by the provider.
[We] issue Level 3 letters much earlier, they went out in mid-May, and have asked people to confirm they have started the application process early on because it was very late in getting loans through in this academic year. It took an awful long time and then we had some people withdraw their loans and didn’t want to proceed.
(Private / voluntary sector provider, <£50,000)

89
During this round of qualitative research there was also a greater focus reported among providers on targeting prospective Level 3 learners (i.e. existing Level 2 students) with information about the Loans.
We do a number of things – we look at those who are progressing from Level 2 courses and target the older groups. I go and talk to them in a group and tell them about the Loans and how it would impact them…. We have a progression week at the end of June so from mid-May we start discussing Loans with our current students.
(FE and specialist Colleges / 6th Form / HE, £1m+)
What we are doing now is that we go through everyone that has done Level 2 and find out those who are eligible; those are the ones we will target to see if they are prepared to or want to move on.
(Local authority, <£50,000)
The key messages that providers were focussing on to promote Loans remained the same as the previous year and were:
• Learners will not have to repay Loans until they have completed their course and are earning at least £21,000 (in addition to this, a number of providers stated that they were telling learners that they were unlikely to ever have to start repayments, particularly in low-paid sectors such as childcare)
• If students study an Access to HE course and then go on to complete an HE course, their Loan will be written off.
As was the case last year, a number of providers stated that they were anxious not to be seen as ‘selling’ Loans. However, providers cited this issue less frequently than last year which perhaps reflects the fact that they were generally becoming more comfortable and confident with the process of introducing Loans.
Providers felt that potential learners’ reactions to Loans were generally positive, though some noted that the fear of debt among many learners remained a barrier to take-up. A number of providers found that reluctance in taking out Loans was greater among students from a disadvantaged background, with particular mention of students claiming benefits.
“Most of our Learners are disadvantaged anyway or have barriers to learning. They hear the work “loan” or “debt” and they’ve probably got enough on their plate when it comes to things like that”.
(Local Authority, £250,000 - £999,999)

90
“Disabled [learners] have worried about taking on the Loan; if already on benefits, the Loan represents a big sum of money and although in the bigger picture it doesn’t sound that much, it is quite concerning and scary. Many of those who applied have been out of work and on benefits without any other income.”
(Private provider, £<50,000)
Despite the initial reluctance to get into debt among these key groups, most providers experienced few or no negative reactions once the repayment terms (including the likelihood of not repaying) were fully explained.
Providers felt that an exception to this tended to be among Muslim learners. A number of providers stated that they had encountered Muslim learners who were interested in pursuing a qualification but did not end up embarking on the course because they were unable to take out an interest-bearing loan on religious grounds15.
The only group we have had any difference of response from and where we have struggled is Muslims because the Loans are interest bearing. We have had quite a few Muslim people who have been keen to do the qualification but haven’t pursued it or have withdrawn. It must have cost us about 20 learners / £50k worth of business.
(FE and specialist Colleges / 6th Form / HE, <£50,000)
9.3 Use of materials on the 24+ Advanced Learner Loans practitioner site Over the last year, the level of awareness and use of the 24+ Advanced Learner Loans practitioner site16 to distribute materials increased among providers. In the 2014/15 survey, only one-tenth (11%) of providers stated that they were unaware of the practitioner site, compared to 25% in 2013/14, and the proportion of providers who used the site to distribute materials to prospective learners rose from 52% to 65%.
In line with the 2013/14 survey, providers with a higher loans facility were more likely to use the practitioner site: 85% of providers with a loans facility of over £1,000,000, compared to 73% with £250,000-£999,999, 63% with £50,000 - £249,999, and 38% with less than £50,000. Colleges/Sixth Forms were the type of provider most likely to have
15 As mentioned earlier in this report, the proportion of eligible Muslim learners in 2014/15 who had chosen to take out a Loan was at a similar level as for non-Muslim learners. However it remains possible (as providers mentioned here) that a greater proportion of Muslim learners are deterred from learning at all. 16 Referred to as the ‘microsite’ in the 2013/14 survey.

91
used the practitioner site: 75% of colleges had used materials from the site compared to 57% of private providers and 62% of local authorities.
The practitioner site was discussed during the qualitative interviews and overall, providers spoke about it positively.
I used the practitioner bit and I have been in touch with [our regional lead] a couple of times asking for resources and she has referred me back [to the practitioners’ site]. As an institution, we tend to do everything online anyway and don’t tend to print documents so if we can hand out a leaflet saying this is the web address to go to that is what we will do ... [the site] has been quite useful. I use the HE practitioners site which is much bigger but what I liked about this one was it had a lot of documents you could just download and almost give out as they are. In the first year, we provided some of the handouts that were on the practitioners’ site as part of the letter but now we just refer them with the link to find the information themselves”
(FE and specialist Colleges / 6th Form / HE, <£50,000)
As with last year, the way it is tailored for different audiences, such as tutor or Business Development staff member, was noted as a particularly useful feature.
Nevertheless, there remained a small proportion of providers who did not use the practitioner site: in the quantitative survey, 24% of providers reported that they did not use it. Other providers reported having looked at it, but that they did not use it regularly.
We have probably looked at the practitioner site. We also went to a couple of seminars and the information they provided there was very useful.
(Private provider, £50,000 - £499,999)
We have only had the one [Loans] learner so haven’t had to use [the practitioner site] very much.
(Local authority, <£50,000)

92
10. Providers: Views on learner take-up and changes to offers This chapter explores provider experiences of the impact of the loans-based system on the volume of learners enrolled with them. It also examines learner take up of loans and the Bursary Fund, providers’ use of their loans facility and whether they have applied for an increase, as well as looking at how this compares to provider expectation.
Chapter Summary
Although the ILR analysis has shown that learner volumes decreased over the period when Loans were introduced, this appears to have been experienced unevenly across providers. Although the majority of providers who noticed a change in volumes of learners reported a decline, some had experienced no change or even an increase. Compared to in 2013/14 significantly more providers that noticed a change in learner volumes (either an increase or decrease) attribute this change to the introduction of loans.
The biggest shift was seen among private/voluntary training providers, who had gone from 70% noticing a decrease in overall learner volumes since the introduction of Loans to only 37% this year. However, they are still most likely of all types of provider to have not committed any of their loan facility.
Results suggest that providers have set themselves more realistic expectations this year: a significantly higher proportion of providers felt that take up of loans had been about as they expected.
The proportion of providers applying to secure an increase on their initial loan facility remained stable compared to 2013/14, with a fifth reporting that they had applied for an increase. Unlike last year, those offering Access to HE Diplomas were no more likely than those offering other qualifications to apply for an increase, perhaps as the take-up of loans was closer to what providers offering this qualification were expecting this year.
More providers stated that they had introduced new courses or provision in 2014/15 compared with 2013/14 and increased number of places on existing courses or provision, while the proportion of providers stating that they had reduced the number of places on existing courses or provision had decreased.

93
10.1 Learner Volumes In the quantitative survey, all providers (both those that had offered Loans since their introduction in April 2014 and those who were new to offering Loans) were asked whether the number of Level 3 or 4 learners aged 24 or over enrolled at their institution had increased or decreased since they had introduced the 24+ Advanced Loans.
Overall, providers were still very mixed as to whether the volume of learners had increased, decreased or stayed the same, with the largest proportion feeling that the volume had decreased (41% believed it had decreased compared to 30% who believed it had stayed the same and 21% who thought it had increased).
However, the picture was more optimistic than in 2013/14, as a significantly higher proportion of providers stated that their intake of learners aged 24 and over had increased since they had introduced Loans (21% said the volume had increased compared to 11% last year). As discussed earlier in the report, learner volumes overall decreased quite markedly from 2012/13 to 2013/14 and then have remained relatively static. These findings from providers would seem to indicate that this drop in numbers has been experienced quite unevenly across the provider population.
Figure 10.1 shows the comparison between the two years.17
17 Percentages do not sum to 100% as ‘don’t know’ responses are not shown in the figure.

94
Figure 10.1: Change to number of Level 3 or 4 learners aged 24 and over, between 2013/14 and 2014/15
The greatest difference between years was seen among private/voluntary training providers, 23% of whom reported an overall increase in 2013/14 (either by a lot or a little) since the introduction of Loans, compared to 37% who reported an overall decrease.
This shows a reverse of the trend noted in 2013/14, where private/voluntary training providers and local authorities/other public sector providers were both more likely than FE Colleges to report a decrease in the number of learners. This year, however, private/voluntary training providers and local authorities/other public sector providers were equally as likely as colleges/sixth forms to report a decrease in the number of learners (37% and 44% respectively, compared to 43% of FE Colleges).
Overall, almost a third of providers (30%) reported no change in the level of enrolment of Loans learners on eligible courses (similar to 26% last year), while 41% reported a decrease (compared to 55% in 2013/14). Of these, 15% reported a large decrease and 26% a small decrease.18
18 We also looked at the difference between providers who were new to offering loans vs those providers who had been offering since loans were introduced; however, there were only 10 providers taking part in the survey who were new to loans which is too small a base to be included in the analysis. We also looked at providers who took part in both waves of the research; the story was consistent among this sub-group in that a greater proportion of these providers had noted an increase in the volume of learners compared to the previous year.
* = significant difference between academic years
25%19%
15%37%
30%26%
16%7%
5%
4%
Increased a lot
Increased a little
Stayed the same
Decreased a little
Decreased a lot
All (2013 / 14) All (2014 / 15)
(Source: Provider survey, question C1 2013/14, C1a 2014/15)
Unweighted base: (250) (250)

95
Institutions that reported any change in volume of learners, whether that was an increase or decrease, were asked the extent to which this change could be attributed to the introduction of 24+ Advanced Learner Loans. Almost four fifths (79%) of providers that had reported a change attributed the change to the introduction of the Loans (39% to a large extent and 40% to some extent). This is a significantly higher amount than in 2013/14, where 60% attributed a change in volume to the introduction of Loans.
Similarly to 2013/14, private and voluntary training providers were more likely than colleges/sixth forms and local authorities/other public sector bodies to say that the introduction of the Loans had a large impact on the changes in learner numbers that they had observed (50% in comparison to 33% and 21% respectively).
To look at possible displacement effects, providers were asked both whether they had noticed learners aged just under 24 enrolling on loans eligible courses (so perhaps bringing forward planned study to take advantage of grant funding) or learners aged 24+ enrolling on Level 2 courses (so opting to study at a lower level so as to receive grant funding).
In terms of the number of learners aged 22 or 23 on Level 3 or 4 courses: over half of providers (53%) felt that numbers had stayed the same, while an equal proportion felt it had increased (15%) as had decreased (15%).
Similarly, half of providers (45%) said they had not seen any direct evidence of displacement activity towards Level 2 courses occurring. However, one in five (20%) believed this was happening, either at their establishment or elsewhere and just over a quarter (27%) said they had no knowledge of this personally but they thought it was likely this was happening. In the qualitative case studies, some providers pointed out that it is difficult for them to observe this directly if they did not have capacity to increase their volume of learners at Level 2 and below (e.g. if these courses were already full prior to the introduction of Loans and they do not have capacity to increase the numbers of learners, then they cannot directly see any displacement effect).19
In terms of levels of students withdrawing from courses, the majority of providers had noticed no change since the introduction of the loans (74%). But, as mentioned earlier, a small number had observed increases in withdrawals. Only 1% stated that withdrawal from courses had increased a lot but 10% stated that they had seen a small increase.
In the case studies, one FE College described how withdrawal before loans applications are completed was problematic for them:
19 As seen earlier, the administrative data contained in the ILR does not indicate a substantial displacement effect towards Level 2 courses.

96
What we found is that we plan for a certain amount of Loan income and we think we are hitting those targets but then we have learners withdrawing. So people get very savvy to the fact with a Loan you only pay for the time that you are on the course and if you drop out your Loan stops. So some people change their mind or the qualification isn’t going to do what they initially thought so they drop out and that affects our Loan income – whereas before we would get the funding or they’d pay upfront and because there was not as much financial responsibility on the person they were more than likely to see it through until the end but now we’re nowhere near reaching our target. The implication of that is that we have less funding.
(General FE College, £1,000,000+)
Views were mixed in terms of the impact of Loans on completion rates. Half of providers who had Loans learners said that non-completion rates were about the same between non-loans and loans learners (53%), 18% believed they were higher amongst non-Loans learners and 12% lower among Loans learners.
10.2 Level of use of loans facility As Figure 2.2 shows (percentages do not sum to 100 as ‘don’t know’ responses are excluded), there was no change in the proportion of providers committing at least some of their initial loan facility in 2014/15 compared to 2013/14. In total, 66% of providers had committed at least some of their loan facility at the time of the survey (compared to 70% the previous year). However, the proportion of providers who had committed all of their loans facility by the time of the interview had fallen significantly compared to 2013/14 (down to 5% from 14%). There were also a significantly greater proportion of providers who did not know what level of their initial loan facility their institution had committed (16% compared to 7% last year).
This may be explained by the fact that in the case studies, a number of providers stated that their Loans allocation had increased considerably between 2013/14 and 2014/15 despite the fact that they had not managed to use all their 2013/14 facility. Some felt that this was a strategy fuelled by a desire to demonstrate commitment of funding in the knowledge that providers would be unable to use it.
The allocation goes up by a greater percentage than we can respond to in terms of stimulating that additional demand – it is all too quick and our allocation for next year has gone up from £577k to £722k and we found that out in Spring this year and to find the extra £150k worth of learners in six months is just not realistic.
(General FE, £500,000 - £999,999)

97
Figure 10.2: The breakdown by provider in terms of proportion of initial loan facility committed in 2014/15
Private and voluntary providers remained the most likely type of provider not to have committed any of their initial loan facility (34% had not committed any compared to 2% of FE Colleges and 15% of Local Authorities).
Similarly to 2013/14, providers with smaller initial loans facilities were less likely to have used up their loans facility at the time of interview than those with larger loan facilities (51% of those with a loan facility of less than £50,000 reported that they had used none of their loan facility, compared to 17% of those with between £50,000-£249,999, 11% of those with between £250,000 to £999,999 and none of those with loans facilities of more than £1,000,000).
10.2.1 Take-up of loans compared to expectation
Providers were also asked whether the take-up of loans in their institution had matched their anticipated take-up. In 2013/14, views on actual take up of loans against expectations was mixed, with around a quarter of all providers each feeling that take-up had been as expected, had been lower than expected or that they had had no expectations. This year a significantly higher proportion felt that take up had been about as they expected (39%). The comparison between years is shown in Figure 10.3 (percentages do not sum to 100 as ‘don’t know’ responses are excluded).
41%
23%
2%
23%
18%
39%
20%
4%
22%
17%
8%
10%
12%
10%
12%
4%
12%
26%
14%
15%
2%
16%
18%
10%
17%
4%
12%
25%
14%
5%
0% 20% 40% 60% 80% 100%
None of it 1-24% 25-49% 50-74% 75-99% All of itUnweightedbase:
All (2014 / 15)(250)
All (2013 / 14)(250)
FE colleges / sixth forms (2014 / 15)
(100)
Local Authority / other public sector providers (2014 / 15)
(100)
(50) Private / voluntary sector providers (2014 / 15)
(Source: Provider survey, question D2)

98
Figure 10.3: Take up of loans compared to expectation, between 2013/14 and 2014/15.
Nevertheless, a quarter (27%) felt that take up was lower than expected and over one in ten felt that it was higher (11%), showing that there is still a segment of providers who have been unable to predict accurately what their take up of loans will be.
FE colleges / Sixth Forms were most likely of all types of provider to state that take-up had been as they expected (54% compared to 27% of private / voluntary providers and 32% of Local authorities / other public sector bodies). Meanwhile, take-up was more likely to be higher than expected for local authorities / other public sector bodies (23%), which is consistent with last year.
As was the case in 2013/14, there remained some differences in how take-up compared to expectations by types of courses offered (although this picture is complicated by the fact that most providers offered several different types of qualifications). Those offering AS/A2/A- Levels and those offering a QAA Access to HE Diploma were more likely than all other types of qualification to state that take-up of loans had been as they expected it to be (55% and 52% respectively). Last year, those offering a QAA Access to HE Diploma had been significantly more likely to state that take-up had been higher than expected, so the findings this year may reflect that these providers had adjusted their expectations upwards.
Those providers who had any take-up of loans by the time of the survey were asked what proportion of students who were eligible for loans were actually using them. The results are shown in Figure 10.4 (percentages do not sum to 100 as ‘don’t know’ responses are excluded).
* = significant difference between academic years
27%22%
39%29%
11%18%
About as expected
Higher than expected
Lower than expected
All (2013 / 14) All (2014 / 15)
(Source: Provider survey, question C1 2013/14, C1a 2014/15)
Did not have any expectations of take-up (19%)(24%)
Unweighted base: (250) (250)

99
Figure 10.4: Proportion of students using Loans among providers who had any take-up of loans at time of survey, by type of provider
A similar proportion of eligible learners were reported to have taken out loans this year as last year (61% of providers this year reported that at least half of their eligible learners had taken a loan out compared to 66% last year). Among those who had used their loans facility, exactly half (50%) stated that at least three-quarters of those eligible had taken out a loan (including 17% who said that all those who were eligible were using a loan). Over one in ten (11%) said that more than half but less than three quarters were using loans and almost three in ten (29%) stated loans had been taken out by less than half of those who were eligible.
FE Colleges / Sixth Forms tended to report higher proportions of eligible learners taking out loans, compared to Private / Voluntary providers:20 they were more likely to report that more than half of those eligible had taken out loans (77% compared to 43%), while Private / Voluntary providers were more likely to state that less than a quarter of those eligible were using the facility (45% vs. 6%).
One provider in the case studies felt that the low take-up of Loans was a direct consequence of the changes to the entry requirements for those who want to do a course relating to the Care sector at Level 3. They believed that the number of those taking these courses had declined dramatically as they now need to have GCSEs in English and Maths at Grade C to do the course at Level 3. As this course was one of their key
20 Note that the base size for Local Authorities here (n=29) is too low for inclusion in the analysis
41%
23%
2%
23%
18%
39%
20%
4%
22%
17%
8%
10%
12%
10%
12%
4%
12%
26%
14%
15%
2%
16%
18%
10%
17%
4%
12%
25%
14%
5%
0% 20% 40% 60% 80% 100%
None of it 1-24% 25-49% 50-74% 75-99% All of itUnweightedbase:
All (2014 / 15)(250)
All (2013 / 14)(250)
FE colleges / sixth forms (2014 / 15)
(100)
Local Authority / other public sector providers (2014 / 15)
(100)
(50) Private / voluntary sector providers (2014 / 15)
(Source: Provider survey, question D2)

100
loans eligible courses, this subsequently meant a dramatic decrease in learners taking out loans.
The majority of providers (82%) did not have any courses where all the learners were funded by Loans. However, among the providers who had courses where all learners were Loans-funded, there was a split in terms of how much of a challenge this represented for them: an equal proportion agreed (39%) as disagreed (36%) with the statement “It is challenging for us to run courses where the learners are all Loans-funded.”
Providers that had classes that were attended entirely by Loans-funded learners felt that these classes were viable from a business point of view because they had the same amount of funding return. Most providers, however, stated that this could be financially problematic if there were a high number of drop-outs.
10.2.2 Applying for an increase in loan facility
The proportion of providers applying to secure an increase on their initial loan facility was similar in 2014/15 to in 2013/14, with one fifth (20%) of providers reporting this year that they had applied for an increase. Unlike last year, those offering Access to HE Diplomas were no more likely than those offering other qualifications to apply for an increase, perhaps as the take-up of loans was closer to what providers offering this qualification were expecting this year.
In the case studies, the majority of providers had not applied to increase their Loans facility. A number of providers who did not apply reported an ‘automatic’ increase in their allocation. Providers who had received an ‘automatic’ increase felt that it was often unwarranted as they had failed to meet their existing Loans allocation. A number of these providers asked for more transparency from BIS / SFA as to how their Loans allocation had been decided.
It just increased. We were just given a larger [facility], we didn’t apply for it. I think it is some sort of sop for our Adult Skills Budget allocation going down. ‘We have taken away your allocation but hey you’ve got a bigger Loan’.
(Local Authority, £50,000 - £249,999)
There is not a lot of clarity from the SFA as to how that [facility] figure is determined; we only used 75% of the Loan facility in 14/15 but it has been doubled for the next academic year. You don’t just magically double your volume of 24+ Learners in a year – so how could they come to the decision that it was going to be £1.9m this year? It’s got to have come from somewhere and it comes from our adult classrooms budget.
(General FE College, £1m+)
101
Most providers wanted their number of Loans learners to increase and anticipated being able to help facilitate an increase in Loans take-up in the next few years. Providers felt that the advertising and marketing of Loans was key to facilitating an increase in Loans learners. Some felt that a national awareness-raising campaign about Loans was needed to raise awareness among the target population. The Principal of a General FE provider referred to 24+ Advanced Learner Loans as “BIS’s best-kept secret”.
There’s no background, there are no noises off-stage. It’s all left to individual colleges to give these messages out [to learners] and that’s ever so difficult.
(FE and specialist Colleges / 6th Form / HE, £250,000 - £499,999)
It is a high profile [issue] that within the HE sector [a learner] will require a loan for [their] fees but in the FE sector it crept in by the back door and really, it is that lack of awareness that we need help [to address].
(Private provider, £<50,000)
Changes will happen incrementally unless there is something bigger [than individual providers doing their own marketing]. It needs to look attractive. It needs to show how education leads to better outcomes in terms of income, health, happiness, quality of housing, quality of neighbourhoods…it needs to be written large out there.
(General FE College, £250,000 - £499,999)
Of providers that had applied for an increased loan facility, 62% said they found this process to be straightforward. This is lower than in 2013/14 but only because a significantly higher proportion of providers said that they did not know how straightforward the process had been (28% compared with 13% last year).
Of those who had not applied for an increased loan facility, levels of knowledge on how to do so were similar to in 2013/14; 51% said that they were definitely aware of how to do it if they needed to, 17% thought they knew how to apply and 24% were aware that their loan facility could be increased but were unsure how to do it. Almost one in ten (8%) stated that they were unaware that they could apply for the loan facility to be increased.
10.2.3 Trends in the take-up of the loan facility
As well as examining the volumes of learners overall, providers were asked if there had been any noticeable trends concerning the take-up of the Loans for different qualifications, subjects and types of students. Similarly to last year, providers were much more likely to have observed trends in relation to types of courses (qualifications or subjects) than trends in relation to demographics.

102
Since introducing loans at their institution, six in ten (61%) of providers reported a strong take up of Loans in certain qualifications and the same proportion (61%) a strong take up of loans for particular subjects. A much lower proportion, one quarter (26%), stated that they had noticed a strong take up of loans since their introduction among particular types of learners.
However, when providers were asked to compare take up of loans to the same point in 2013/14 only 25% of providers reported a strong take up of loans in certain qualifications, 26% saw a strong take up among certain subjects, and 10% a strong take up among certain types of learner. Again, this suggests that while providers saw a change immediately after loans are introduced, take-up patterns stabilised between 2013/14 and 2014/15.
Compared to 2014/15, a significantly smaller proportion of providers reported seeing a weak take up of loans in particular qualifications (20% this year vs. 44% last year), subjects (21% vs. 40%) and among types of student (11% vs. 22%).
Among providers who had noticed strong take-up of Loans for particular types of qualifications, the most commonly mentioned qualification types were still QAA Access to HE Diplomas (52%), QCF Level 3 Diplomas (52%) and Level 3 Certificates (31%). Indeed, there was a significant increase in the proportion of providers mentioning a strong take-up of loans in Level 3 Diplomas (52% compared to 42% last year).
Providers this year had noticed a strong take-up of Loans within the same subject areas as last year. Two thirds (69%) of the providers that reported a strong up-take in some subjects experienced a strong take up in Health, Public Services and Care, one third (35%) said that they had seen a strong take up in Education and Training subjects and just less than a quarter (24%) saw a strong take up in Business, Administration and Law. The proportion of providers witnessing a weak take up of loans in Retail and Commercial Enterprise has seen a significant drop from 32% last year to 14% this year.21
Although female learners were still the group of learners that providers were most likely to observe a strong take-up of loans among, there was nevertheless a significant drop in the proportion of providers who stated that they had seen increased take-up among these learners (69% this year compared to 87% last year). By contrast, providers in 2014/15 were significantly more likely to state that they had noticed a strong take up among learners aged 24-39 (69% this year compared to 53% last year) as well as a
21 Note that this finding is based on a low base size of 34 providers so should be treated with caution.

103
growth in those who noted strong take up of learners from low socio-economic backgrounds (42% this year compared to 28% last year).22
10.3 Bursary fund Providers were asked for their experiences of take-up of the 24+ Advanced Learner Loans bursary fund, what these funds have been used for, the perceived ease or difficulty of understanding guidance about the bursary fund, and any issues that they had encountered with their allocated bursary funds.
An equal proportion of providers had accessed the bursary fund compared to those who had not accessed it (46% had vs 46% had not). This varied considerably by provider type, with FE Colleges being much more likely to have accessed the bursary fund. Over three quarters (77%) of General FE and specialist colleges, 42% of local authorities / other public sector bodies and just 19% of private / voluntary providers had accessed the bursary fund.
Compared to last year, a significantly greater proportion of providers participating in the quantitative survey had accessed their bursary funds (up from 34% last year to 46% this year). However, though a greater proportion had accessed their bursary funds, fewer had committed all of it: 19% had committed all of it this year, compared to 32% last year.
As seen last year, those with a higher initial loan facility were most likely to have accessed bursary funds (78% of those with a facility of £1m+ had accessed their bursary funds).
Half (51%) of providers who accessed bursary funds stated the level of take-up matched expectations, 16% stated that take-up was higher than expected and 7% said take-up was lower than expected. One in eight (12%) stated they had no expectations for what take-up would be like.
Mirroring the survey findings, providers who took part in the qualitative research reported varied use of their bursary funds: a few stated they had used more than they did in 2013/14 due to students becoming more aware of its availability. A number, however, stated that they had used less than they expected – some of these providers stated this was linked to a reduction in the number of learners taking up 24+ Advanced Learner Loans.
22 Note low base sizes from both years’ surveys. This year, thoughts on strong-take up of particular groups of learners are based on 42 providers who reported this to be the case and thoughts on weak take-up of particular groups of learners are based on 17 providers who reported this to be the case.

104
Some providers stated that they had not used any of their bursary funds as the type of provision they offered and the type of learner they cater to meant that it was not needed e.g. their course delivery was aimed at those in work and took place during working hours so learners did not have additional requirements such as childcare and travel.
One provider stated that they had never heard of the bursary fund because learners funded through 24+ Advanced Learner Loans account for such a small proportion of their provision:
I’ve never even heard of the bursary fund! Loans are such a small part of what we do so we haven’t even looked into that.
(Private provider, <£50,000)
Generally, providers who took part in the qualitative research deemed their bursary fund sufficient. However, a small number of providers had issues with the size of their bursary fund. One provider who had recently started offering Loans stated that their initial allocation of £500 was far too low and that they had found it difficult to get an increase:
This is a bone of contention. Our bursary fund was only £500… a lot of our Loans learning is delivered in London and more bursary funds would be very useful to equalise the disadvantage of delivery to certain learners in certain postcodes but we can’t seem to get our hands on very much bursary money. We can’t access more because we have fallen down the crack between ASB providers and the 24+ Loans provider which means our bursary allocation is very low.
(Private provider, £50,000 - £249,999)
Another provider called for clearer guidelines about how the bursary fund could be used. They felt that they could only use a proportion of their bursary fund that equated to the proportion of their loans allocation that they had used. They stated that they thought other providers had used their entire bursary fund (despite being under target in terms of Loans take-up) but they were unsure if this was acceptable:
There should be clearer guidelines on how much you should be spending. For example, if you’ve spent 50% of your Loans facility, should you have paid 50% of your bursary?
(Specialist College, £50,000 - £249,999)
Providers were asked what proportion of learners with 24+ Advanced Learner Loans had accessed bursary funds; these were reported to be very similar to last year. Over half (52%) reported that less than half of their students with loans had received a bursary and

105
over one quarter (28%) said that half or more had. Again, one fifth (20%) did not know the proportion of 24+ Advanced Learner Loans students with a bursary.
Help with childcare costs was reported as the most common reason for which the money had been used (63%), followed by travel costs (61%) and the cost of materials, equipment and other course costs (46%).
Three quarters (75%) of providers who had accessed the bursary fund stated that the guidance about the fund was clear and easy to understand; just under a fifth (18%) felt it was not easy to understand and 7% did not know.
No providers who took part in the qualitative research reported having any problems relating to the administration of their bursary fund.
Providers expressed differing opinions when asked how successful the bursary fund has been in terms of boosting learner participation. Some providers felt that the bursary fund has had no impact as learners are attracted to the course itself and that the availability of the Loan / bursary is secondary to that:
I don’t think it does. I think it is a nice to have it but it wouldn’t encourage or stop a person getting a Loan ... definitely [the same take-up without a bursary].
(Sixth Form college, <£50,000)
A few providers felt that the bursary has the potential to boost participation but that this is restricted to due learners’ limited awareness of it:
I think in principle it ought to but the take-up suggests maybe there isn’t sufficient knowledge of it amongst the learners ... they all seem to be happy to come along, take-up the loan and don’t ask for the bursary.
(Local Authority, £50,000 - £249,999)
On the other hand, some providers stated that the bursary fund has been integral in encouraging learner participation. They felt that some of their learners would not have been able to afford to undertake learning without this financial assistance and that the bursary was essential for those who need it to pay for childcare:
For those who are coming back into education who are aged 24 and above, childcare is the driver. If there wasn’t that help a lot of them wouldn’t be able to pursue their adult education.
(General FE college, £1m+)

106
Providers stated that young mothers returning to education after raising a family and those with low incomes benefited most from having a bursary.
The majority of providers thought that they would have had the same take-up of courses if the bursary fund had not been available.
10.4 Changes to provider offers In the quantitative survey, a sizeable proportion of providers stated that they had made changes to their provision since the introduction of Loans: 39% had made at least one of the changes asked about (the same proportion as had made changes last year). As with last year, those with a lower Loans facility were less likely to have made changes to their provision.
However, though the proportion making changes to their provision had stayed the same as last year overall, there were higher proportions of providers who were expanding their provision (in terms of increasing courses and places), as shown in Figure 10.5 (percentages do not sum to 100 as ‘don’t know’ responses are excluded).
Figure 10.5: Changes made as a direct result of 24+ Advanced Learner Loans in 2013/14 and 2014/15
Significantly more providers stated that they had introduced new courses or provision this year (23% compared with 13% last year) and increased number of places on existing courses or provision (17% compared to 11% last year), while the proportion of providers stating that they had reduced the number of places on existing courses or provision had
7%
23%
9%
17%17%
13%
11% 11%
0%
5%
10%
15%
20%
25%
Reduced the number ofplaces on existing courses or
provision
Introduced new courses orprovision
Stoppedcompletely/withdrawn courses
or provision
Increased the number ofplaces on existing courses or
provision
2014/15 2013/14
Unweighted base: 2013/14 (250), 2014/15 (250)(Source: provider survey 2013/14 and 2014/15, question E1)

107
decreased (seven% of providers reported this compared to 17% last year). The number of providers who had completely withdrawn courses or provision was comparable with last year (9% versus 11%).
Providers that had applied to increase their loans facility were more likely than those who had not to have introduced new courses (38 vs 19%) and to have increased the number of places on existing provision (24 vs 13%).
When providers that had introduced new courses / provision were asked what types of qualifications this had been the case for, it tended to be for Level 3 qualifications (as was the case in the last academic year): 59% had increased provision of Level 3 Diplomas while 43% had increased provision of Level 3 Certificates. There was growth in the number of providers stating that they had increased provision of QAA Access to HE Diplomas: almost three in ten (29%) stated that this was the case compared to only 14% of providers last year.
However, there remained a mixed picture among providers, as reported last year, particularly when it came to Level 3 qualifications, as 45% of providers who had reduced the number of places on their qualifications said that they reduced numbers / provision on Level 3 Diplomas and the same (45%) said that they had reduced the number of places on the Level 3 Certificates.
In the case studies, some providers stated that their overall provision had ‘shrunk’ as a result of the removal of the Adult Skills Budget, the introduction of Loans and subsequent low take-up of certain courses. Some of the reported changes to provision that had occurred as a result of these included:
• Reduction or changes in Level 3 provision: For example, providers mentioned trialling Level 3 courses unsuccessfully, losing a whole programme of courses and reviewing whether it will be viable to run particular Level 3 courses next year.
o Several providers felt that this might mean the need to diversify provision.
o One provider has increased 16-18 provision to compensate:
In 2012/13 the Education Service had 570 people on Level 3 courses compared to 170 in the first year of the Loans, a drop of 400 learners. That’s a whole programme that we’ve lost; all of those courses we had to close… Instead of having 500 learners, this year we’ve got less than 200, so we can only offer a program for that sort of amount next year.
(Local Authority, £250,000 - £999,999)
• Impacts on staff: Providers reported reductions in staffing budgets directly linked to the reduction in overall funding. In addition, significant reduction in learners on courses had resulted in staff members not being fully utilised in some providers.

108
There are learners who would have previously accessed education that now aren’t so there is now impact on the community and the economy and for us as a college because we have declining funding streams which leads to a negative impact on staffing.
(Non-profit, £250,000- £499,999)
• Having to turn away learners and decline delivery opportunities due to not having an adequate level of funding to accommodate them.
We are having to be very much more thoughtful around the provision that we offer. We are limited in what we can do. We are having to turn away some learners and some opportunities that we would like to deliver because the funding isn’t there to be able to do it.
(Private provider, £50,000 - £249,999)
We have closed courses, we closed programmes and we made people redundant last summer.
(General FE, £250,000 - £499,999)
10.5 Changes in fees During both the qualitative and quantitative stages of the research, providers were asked about the impact the introduction of the Loans has had on course fees.
A quarter of providers said that they had increased their fees since the introduction of Loans (11% substantially and 13% slightly). Most of the remainder said that their fees had remained the same (57%). Small proportions said that they had decreased their fees (5%) or that their fees had changed in a variety of ways (8%). The remainder were unsure (6%).
Results this year contribute to the emerging picture of greater stability with regards to providers being able to predict and plan for the impact of Loans now that the Loans have had time to bed in: the proportion of providers in the quantitative survey who had not changed their fee structure had significantly increased (to 57% this year compared with 34% last year).
Similarly to last year, private / voluntary providers were least likely compared to other providers to have increased their fees.
Providers who had applied to increase their loans facility were more likely to have increase their fees (36% vs 23%) or to have changed their fee structure in some other

109
way (12% vs 8%), whereas those who had not applied for an increase were more likely not to have changed their fee structure (60 vs 46%).
Around two-thirds (63%) of providers were charging the maximum fees for some or all of their courses, a significant increase from the 55% doing the same last year.
The case studies found that a few providers increased costs of co-funded courses in response to their reduced funding allocation; another had reduced the prices of their courses so they were more aligned to the cost of Loans, and one provider had reduced the number of instalment plans they offered:
No, [we haven’t changed our fee structures] – but we’ve changed our instalment plans which were too many and flexible. So we have gone from six back down to three because the fee default rate has gone up.
(General FE college, £1m+)
A number of providers stated that the introduction of Loans had impacted negatively on them as a business. In some cases this was related to a reduction in income from tuition fees, others talked about a rise in administration costs and additional staff training, which they have had to absorb or about problems of late withdrawals from courses impacting on their income (which they felt was a direct consequence of the Student Loans Company taking too long to approve Loan applications).
Unfortunately it has impacted negatively on our tuition fee income and this is all linked to the delays – because the Loans decisions haven’t been coming through in the time we need that has meant that we have students on the course who shouldn’t be and it’s quite difficult to re-coop the costs from them once they drop-out [having found out that their Loans application has been rejected].
(General FE college, £1m+)
A few providers stated that they would not be able to cope with these additional costs in the future if the number of Loans learners that they catered for rose dramatically.

110
11. Providers: Administration process and procedures This chapter of the report explores how the administration of the Advanced Learner Loans affects provider workload and what issues or difficulties they faced during the process.
11.1 Providers workload As with the 2013/14 survey, the providers that had committed at least some of their loan facility (82%) were asked how the introduction of 24+ Advanced Learner Loans had impacted upon their administrative burden.
Similar to in 2013/14, the majority of providers stated that their workloads had increased as a result of the introduction of Loans (91%). However, more positively, a greater number of providers declared that the increase in workload was manageable (67% compared to 55% in 2013/14) and a smaller number declared it difficult to manage (24% compared to 35% in 2013/14).
Providers who stated that their workloads had increased were asked if they thought the change was likely to be temporary or on-going. Between 2013/14 and 2014/15 there was a shift from those who reported it was too early to tell (decreasing from 28% last year to 14% this year), to those reporting that the increased workload was more likely to be ongoing (rising from 65% last year to 78% this year). The proportion of providers who thought the change was more likely to be temporary remained the same as last year (6%).
Chapter Summary
Between 2013/14 and 2014/15, there appears to have been a positive shift in attitudes among providers towards Loans, with the proportion viewing them as an opportunity to their organisation almost doubling, and the proportion viewing them as a threat almost halving.
All provider groups were equally likely to see Loans as an opportunity for their organisation. Unlike last year, private / voluntary sector providers were no more likely than other types of provider to view Loans as a threat.
111
Providers who were new to Loans were more likely to feel that, for them, it was still too early to tell (50%), while those who had been offering Loans for over a year were more likely to say that the increased workload was ongoing (81%).23
Some providers that took part in the case studies felt that, as they went into their second year of handling Loans administration, they had been able to make their processes more efficient, thereby reducing their workload.
We’ve made improvements and tweaked our systems – that’s pretty much around having PCs available so they can actually do the application online, while they are here, rather than sending them home and then not submitting the application. Having staff on hand to make sure that they can answer questions during enrolment – you have got to resource that and we have quite a long enrolment process which started in at the beginning of June and will go on to the end of September.
(FE and specialist Colleges / 6th Form / HE, £1m+)
We’re in the process now of making changes. We’re looking at how we do the application processes with the learners and how we can support them to make sure that goes smoothly from day one.
(Private / voluntary sector provider, £50,000 - £249,999)
11.2 The administrative process As part of the quantitative survey, providers that had committed at least some of their loan facility were asked whether they faced any issues or difficulties in the administration of 24+ Advanced Learner Loans. Providers were overall very positive and reported the same high level of ‘no issues’ as last year’s survey for all almost aspects of administration: issuing Learning and Funding Information Letters to learners (79%), providing students with Unique Learner Numbers (74%) and claiming against their bursary fund allocation (55%).
The key difference was that provider interaction with the Student Loans Company (SLC) had significantly improved. As shown by Figure 11.1, the proportion of providers who reported ‘no issues’ has increased over time (percentages do not sum to 100 as ‘Don’t Know’ is excluded).
23 Note the extremely low base of ‘new’ providers (n=6) which means these findings are purely indicative.
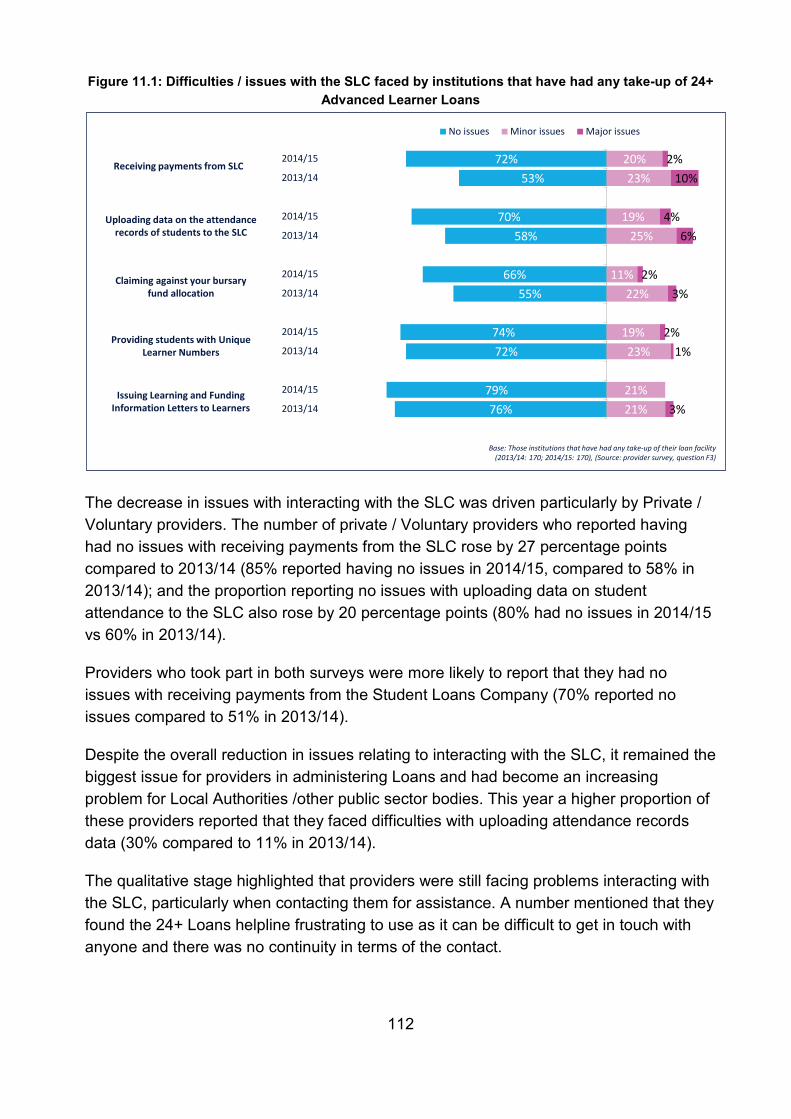
112
Figure 11.1: Difficulties / issues with the SLC faced by institutions that have had any take-up of 24+ Advanced Learner Loans
The decrease in issues with interacting with the SLC was driven particularly by Private / Voluntary providers. The number of private / Voluntary providers who reported having had no issues with receiving payments from the SLC rose by 27 percentage points compared to 2013/14 (85% reported having no issues in 2014/15, compared to 58% in 2013/14); and the proportion reporting no issues with uploading data on student attendance to the SLC also rose by 20 percentage points (80% had no issues in 2014/15 vs 60% in 2013/14).
Providers who took part in both surveys were more likely to report that they had no issues with receiving payments from the Student Loans Company (70% reported no issues compared to 51% in 2013/14).
Despite the overall reduction in issues relating to interacting with the SLC, it remained the biggest issue for providers in administering Loans and had become an increasing problem for Local Authorities /other public sector bodies. This year a higher proportion of these providers reported that they faced difficulties with uploading attendance records data (30% compared to 11% in 2013/14).
The qualitative stage highlighted that providers were still facing problems interacting with the SLC, particularly when contacting them for assistance. A number mentioned that they found the 24+ Loans helpline frustrating to use as it can be difficult to get in touch with anyone and there was no continuity in terms of the contact.
Base: Those institutions that have had any take-up of their loan facility (2013/14: 170; 2014/15: 170), (Source: provider survey, question F3)
76%79%
72%74%
55%66%
58%70%
53%72%
21%21%
23%19%
22%11%
25%19%
23%20%
3%
1%2%
3%2%
6%4%
10%2%
2013/14
2014/15
2013/14
2014/15
2013/14
2014/15
2013/14
2014/15
2013/14
2014/15
No issues Minor issues Major issues
Receiving payments from SLC
Uploading data on the attendance records of students to the SLC
Claiming against your bursary fund allocation
Providing students with Unique Learner Numbers
Issuing Learning and Funding Information Letters to Learners

113
The [SLC] helpdesk has been hit and miss ... every time you ring you get different information. One call handler didn’t know what he was talking about so then I rang the next time and got someone different and got a sensible answer. That is the only thing that makes me cross sometimes.
(Private / voluntary sector provider, £50,000 - £249,999)
Another difficulty was the length of time that it took for many applicants to get a decision on their Loan application from the SLC. As discussed earlier, when learners are rejected from getting a Loan mid-way through their course they are likely to drop out which has financial implications for the provider. One provider stated that they had encountered delays of up to four months when waiting on decisions on Loan applications.
Providers reported that the delay was often caused by the SLC not receiving all of necessary documentation from the learner. Providers felt that if they had been kept informed of this then they could have helped to chase this information and speed up the process:
[Students] think they have sent everything off and then the SLC is trying to contact them to say something is missing, but then the learner is still coming to class and the imperative to complete that information is not quite there. We have had to think of some other ways to get them to do the necessary paperwork so we’ve put in other processes, for example, having their ID card stopped, so that they report into the central admin service to be told why their card has been stopped. So it’s the feedback from the SLC that’s the issue.
(FE and specialist Colleges / 6th Form / HE, £1m+)
As with last year, a few providers also found it difficult to input a ‘change in circumstance’ on the SLC portal and often resorted to contacting the SLC over the phone to resolve the issue.
Change of circumstance I find very frustrating – if you go to make a change in that section alone, nine times out of ten it doesn’t find the learner so we have to do a broad search and find the learner that way.
(FE and specialist Colleges / 6th Form / HE, £50,000 - £249,999)
During the qualitative interviews it was suggested that the portal should send emails directly to the administrator at the provider to reduce the amount of time they spend checking for updates and to decrease the risk of them missing any new information.
Another difficulty identified in terms of administering the loans was dealing with applications from learners who do not own a UK passport. The application process for

114
these learners was reported to be often drawn-out and difficult, particularly as applicants had to provide original copies of identification documents such as birth certificates and passports from other countries. One provider stated that a learner had to send ID documents four times and that a decision on the Loan was only reached one week prior to the end of the course.
Similarly to in 2014/15, only a few providers mentioned difficulties around using unique learner numbers (ULN). These providers mentioned not always having ULNs readily available to reference which therefore slowed down the process of updating attendance records:
We can enter ULN numbers for students, which is fine, but we can’t enter their National Insurance number…It would be really useful if we could do that. It would speed the process up because nine times out of ten we have their national insurance number.
(FE and specialist Colleges / 6th Form / HE, £50,000 - £249,999)
During this round of qualitative discussions there were no mentions of having multiple ULNs per student which would imply that the mechanics involved in issuing them are improving over time.
As part of the quantitative interviews, providers who had any take-up of their loans facility were asked if they had activated the loans flag in the NCS course directory. A third of these providers (34%) had activated the loans flag, a significantly larger proportion than in the 2013/14 survey (27%). Another positive finding was that the number of providers who were unsure of what the NCS course directory was had halved in this year’s survey (from 19% to 10%), indicating that there has been an increase in awareness about the NCS course directory over time. However, there were still a relatively high proportion of providers who responded that they do not know if they have activated the course flag (41%), which suggests that there could be further improvement in raising awareness on this process.
Similarly to in 2014/15, just under half (49%) of the providers who activated the loans flag found it an easy process. There was a decrease in the proportion of providers who stated that activating the flag was difficult (3% compared to 10% last year), all of who reported that was quite, as opposed to very difficult. The most common response remained that the process was neither difficult nor easy (48%).
The qualitative interviews asked providers how they felt about the loans application process overall. The majority stated that they were confident with the process. Some who had been offering Loans for more than a year attributed this to having the experience of delivering Loans in 2013/14 to draw from.

115
I am reasonably confident I can do all I need to do and I have gradually and I have gradually become more confident as I have become more familiar. It is easier second time than first time.
(Local Authority, £50,000 - £249,999)
Most providers who were new to offering Loans also explained that they were reasonably happy with the process overall. Indeed, most had found it easy from the very beginning.
It has been fine from the beginning for us.
(Private provider, £50,000 - £499,999)
A couple of the ‘new’ providers did draw attention to some issues they had experienced, that they were hoped to refine going forward, and explained that it had taken a little more time for them to feel confident with the process.
The processes between us and the SLC are fine and work well. I am sure we will continue to finesse our own internal process. Compared to some other processes it is a joy to administer.
(Private provider, £50,000 - £499,999)
My confidence has increased over the course of the year through sheer hard work but we are getting there by trial, error and hope. There is still always a niggle that I am missing things. There is nothing clear in the link between SLC and the SFA parts that lets you be confident that you are getting it all done properly. There is nobody that we can ring up at SLC or SFA who understands our sort of organisation. We have contacts at SLC, SFA & BIS but nobody is looking after the small providers. There is no flow chart through to help. You are finding your way through a maze in the dark unaided.
(Private provider, £50,000 - £499,999)
11.3 Providers: Overall perceptions This section of the report summarises providers’ overall views of the 24+ Advanced Learner Loans.

116
Overall provider attitudes shifted between 2013/14 and 2014/15 to become more positive towards Loans, as figure 12.1 shows (percentages do not sum to 100 as ‘don’t know’ responses are excluded).
Figure 12.1: Providers’ perception of the Advanced Learner Loan, between 2013/14 and 2014/15
However, providers were still relatively split in terms of whether they saw the 24+ Advanced Learner Loans as a threat or opportunity to their business.
More than four in ten (44% compared to 23% in 2013/14) considered loans to be an opportunity, while those feeling that loans were a threat almost halved (17%, compared to 31% last year). This positivity is in part driven by the views of FE Colleges / Sixth Forms, over half (51%) of whom felt loans represented an opportunity.
17%
31%
44%
22%
50% 30% 10% 10% 30% 50%
Threat Opportunity
All (2013/14)
(Source: provider survey 2013/14 and 2014/15, question G4)
UnweightedBase:
(250)
All (2014/15)(250)
Neither
(45%)
(35%)
Chapter Summary
Between 2013/14 and 2014/15, there appears to have been a positive shift in attitudes among providers towards Loans, with the proportion viewing them as an opportunity to their organisation almost doubling, and the proportion viewing them as a threat almost halving.
All provider groups were equally likely to see Loans as an opportunity for their organisation. Unlike last year, private / voluntary sector providers were no more likely than other types of provider to view Loans as a threat.

117
Interestingly, reversing the trend seen in 2013/14, there were no provider groups who were more or less likely to see Loans as a threat rather than an opportunity. Most strikingly different to last year’s findings was that even those with no up-take of their loans facility at the time of interview were slightly more likely this year to see them as an opportunity (24%) than a threat (19%).
Those providers who took part in the survey for both years were more likely this year to report that they saw Loans as an opportunity (49% saw them as an opportunity this year compared to 22% last year).
Those providers who felt that Loans represent an opportunity stated they allowed learners who cannot afford the cost of the course upfront to get back into education.
An opportunity ... because it is the opportunity to get more learners to come on board and do a Level 3 with us because if there wasn’t an Advanced Learner Loan and they had to pay the fees we wouldn’t get as many people so yes, I see it as a positive. [If the loan didn’t exist] it would be very different; I don’t think there would be as many people doing it.
Private Provider, £50,000-£249,999
On the other hand, there will still some providers that saw 24+ Advanced Learner Loans as a barrier to learner participation and as a threat to their organisation as a result.
I think they’ve been a threat to us. It’s been pretty detrimental really. What saddens us is that they are denying people access to learning opportunities, if we’ve gone down from 500 learners [to 136]…we are putting people at a disadvantage who were already disadvantaged. [Learner Services Manager]
Local Authority, £250,000-£999,999
[It’s] a threat. I think it will start meaning we are not picking our students purely on talent but on their ability to pay. AND some students are being put off applying – they have already told us.
Private Provider, £50,000-£499,999
In the case studies, a few providers were keen to point out that an extension of the scope of Loans would pose a considerable threat to their organisation; one provider stated that an extension of Loans to Level 2 would be a ‘catastrophe’. They stated that an extension of Loans would act as a barrier to already disadvantaged groups of learners.
Generally, providers that felt they had been successful in implementing the Loans put this down to having a proactive attitude, promoting Loans with clear marketing messages and the fact that they had ‘embraced’ Loans. Despite being in the minority, a number of

118
providers stated they had been less successful in 2014/15 when compared with 2013/14 due to a reduction in the number of learners who had taken-up Loans and a small number felt, the forced increase in their loan facility has hindered their chances of success.
In addition, one provider felt that they were restricted in terms of the way they are able to present Loans and could have been more successful, had they been able to market them more effectively:
I think we’ve been discouraged from actually pushing out really positive messages about the loans…if I let my marketing manager loose she’d definitely go mad and drum up more trade…I don’t want her to go mad, but I think it could be a bit more glossy, a bit more appealing.
(General FE, £250,000 - £499,999)
Finally, when providers were asked in the case studies about what BIS could do to ensure greater success of Loans, there were several key points highlighted. Several providers felt that releasing the catalogue of qualifications which are eligible earlier in the year, along with increasing the breadth of eligible courses, would be very useful in allowing them to plan for their Loans provision.
The barrier is the speed at which it has been implemented and our lead time for course development is 12 – 18 months minimum. Six months from notification of allocation to students starting on course which from notification of allocation to our publication of prospectuses is a matter of weeks, so we are just not getting sufficient lead time to be able to develop the curriculum in a way that can then stimulate the demand. If the demand is not there, it needs stimulating but we can't anticipate that and stimulate demand when we don't know what the allocation is going to be. We need at least 12-18 months lead time.
(General FE, £250,000 - £499,999)
If a greater range of qualifications are loan fundable. We know there is demand for retail and it is not fundable.
(General FE, £250,000 - £499,999)
Increase the amount of loan and allow it at Level 2.
(Private Provider, <£50,000)

119
As mentioned previously in this report, there was also appetite for increased marketing in order to raise employer awareness of 24+ Advanced Learner Loans. Some providers suggested that this could be effectively done through a national campaign.
Possibly in terms of promotion BIS could do a bit more ... I’m guessing nationally. I don’t think I have seen or heard anything about it ... bearing in mind the recent changes in employment, a lot of redundancies and people possibly going back into training and it being the older group going back into training, you think they would be shouting about it – there are opportunities available for you to have a change in career and upskill”
(HE University, <£50,000)
Finally, providers felt that having more realistic Loans funding allocations would enable them to plan better and maximise the opportunity presented by Loans.
Give us the fund that makes us feel it’s achievable. Because it makes you feel like you’re not succeeding; it’s a hard mountain to climb. If they made the fund more achievable and gave us the rest of it in our ASB…we’re expected to be business savvy, but what’s happening, when the funds are being given to us doesn’t seem business savvy to me.
(Local Authority, £250,000-£999,999)

120
© Department for Education
Reference: DFE-RR852
ISBN: 978-1-78105-957-9
This research was commissioned under the 2010 to 2015 Conservative and Liberal Democrat coalition government. As a result the content may not reflect current Government policy. The views expressed in this report are the authors’ and do not necessarily reflect those of the Department for Education.
Any enquiries regarding this publication should be sent to us at: www.education.gov.uk/contactus
This document is available for download at www.gov.uk/government/publications