impact evaluation - world food programme · impact evaluation evaluation of the impact of food for...
TRANSCRIPT

mea
suri
ng
res
ult
s, s
ha
rin
g l
esso
ns
IMPACT EVALUATION Evaluation of the Impact of Food for Assets on Livelihood
Resilience in Guatemala
A Mixed Method Impact Evaluation
Evaluation Report
January, 2014 Prepared by Le Groupe-conseil baastel Itée: Dr. Rémy-Claude Beaulieu, Team Leader, Anne Fouillard, M.E.S. Senior Evaluator, Hew Gough,
Statistician, Alexandre Daoust, Data Management , Olga Marina Pinto, Local Research Coordinator Commissioned by the WFP Office of Evaluation
Report number: OEV/2013/003

Acknowledgements
The evaluation team members—Anne Fouillard, Natural Resources Specialist; Hew Gough,
Statistician; Olga Marina Pinto, Local Research Coordinator; Alexandre Daoust, Data
Management, Rémy Beaulieu, Team Leader—would like to thank the Evaluation Manager
Jamie Watts as well as Cinzia Cruciani from the Office of the Evaluation of the World Food
Programme headquarters for their collaboration in the preparation of the Inception
Mission, Inception Report and Draft Methodology Guide between September 18 and
November 16, 2012.
Our gratitude is extended to the whole team of the WFP Country Office in Guatemala,
starting with Guy Gauvreau, the Country Office Director, for his enthusiasm and openness;
Irma Palma, Programme Manager, for her relentless cooperation; and all other WFP
Country Office staff and partners who opened their doors, books and minds to share their
experiences and knowledge.
Finally, we would like to thank all national (MAGA, FIS, FONAPAZ, SESAN, etc.) and
international (FAO, Canada, EU, Spain, USA, etc.) partners who responded to our invitation
to collaborate in this endeavour.
To all: Thank you!
Evaluation Team
Disclaimer
The opinions expressed are those of the evaluation team and do not necessarily reflect those
of the World Food Programme. Responsibility for the opinions expressed in this report rests
solely with the authors. Publication of this document does not imply endorsement by WFP
of the opinions expressed.
The designation employed and the presentation of material in the maps do not imply the
expression of any opinion whatsoever on the part of WFP concerning the legal or
constitutional status of any country, territory or sea area, or concerning the delimitation of
frontiers.
Evaluation Management
Evaluation Manager: Jamie Watts, Senior Evaluation Officer
Evaluation Research Analyst: Cinzia Cruciani
Director, Office of Evaluation: Helen Wedgwood

Table of Contents Fact Sheet: WFP’s FFA Programme in Guatemala .............................................. i
Executive Summary ......................................................................................... ii
Map of Guatemala ............................................................................................ 1
1. Introduction.................................................................................................. 1
1.1 Evaluation Features .......................................................................................................... 2
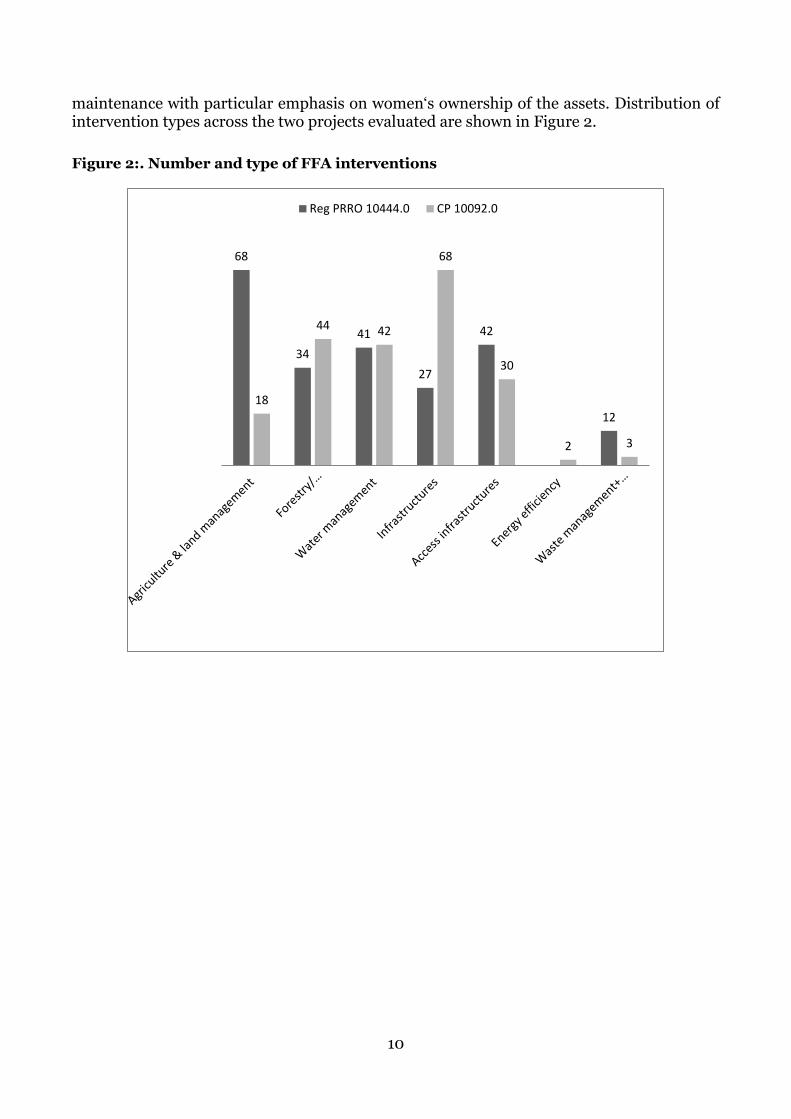
1.2 Context: FFA in Guatemala ............................................................................................. 5
1.3 WFP's FFA activities in Guatemala ................................................................................. 8
2 Results: Outcomes and Impacts of FFA ......................................................... 11
2.1. Characteristics of beneficiaries and comparators ......................................................... 11
2.2. Assets created ............................................................................................................... 12
2.3 Biophysical and productivity outcomes ........................................................................ 16
2.4 Food security outcomes ................................................................................................. 16
2.5 Resilience ....................................................................................................................... 21
2.6 Livelihood and migration outcomes ............................................................................. 22
2.7 Community organisation ............................................................................................... 24
2.8 Women’s empowerment ............................................................................................... 26
3. How does FFA create impact? ..................................................................... 29
3.1. Contextual factors ......................................................................................................... 29
3.2. Implementation factors ................................................................................................ 33
4. Conclusions and Recommendations ........................................................... 41
4.1. Overall assessment........................................................................................................ 41
4.2 Recommendations ......................................................................................................... 42
Acronyms ....................................................................................................... 45
List of Tables
Table 1: Evaluation Point of Reference ..................................................................................... 2 Table 2: Comparison of population and literacy ...................................................................... 11 Table 3: Comparison of poverty, health and malnutrition ...................................................... 11 Table 4: Comparison of household characteristics .................................................................. 11 Table 5: Overview of Assets Found .......................................................................................... 12 Table 6: Asset survival ............................................................................................................. 13 Table 7: Asset use among beneficiaries and community members ........................................ 14 Table 8: Functionality and use of assets (% of respondents among those who reported assets) ........................................................................................................................................ 15 Table 9: Asset Maintenance Responsibilities ........................................................................... 15 Table 10: Days of work in exchange for food ............................................................................ 15 Table 11: Biophysical outcomes ............................................................................................... 16 Table 12: Dietary Diversity and Food Consumption ................................................................ 17 Table 13: Dietary Diversity and Food Consumption (Male respondents) ............................... 17 Table 14. Dietary diversity and food consumption (Female respondents) ............................. 18 Table 15: Further analysis on FCS ........................................................................................... 18 Table 16: Overall health and nutrition indicators ................................................................... 19 Table 17: Overall health and nutrition indicators (Male respondents) .................................. 19

Table 18: Overall health and nutrition indicators (Female respondents) .............................. 20 Table 19: Coping Strategy Index: Weighted score (Mean)...................................................... 20 Table 20: Borrowed food or relied on friends and relatives for food ..................................... 21 Table 21: Shock occurrence ..................................................................................................... 22 Table 22: Reduction in losses due to disasters (% of respondents in participant communities) ........................................................................................................................... 22 Table 23: Impact on livelihood and migration ........................................................................ 23 Table 24: Impact on women’s awareness of community organizations ................................. 24 Table 25: Impact on men’s awareness of community organizations ...................................... 25 Table 26: Participation in community organisations .............................................................. 25 Table 27:: Training on organizational management received and source (% of survey respondents) ............................................................................................................................ 25 Table 28: Types of organisational training received ............................................................... 26 Table 29: Empowerment of women ........................................................................................ 28 Table 30: Asset success by livelihood zone ............................................................................. 29 Table 31: Who participated in the decision-making regarding assets? .................................. 35 Table 32: Proportion of women in leadership positions in food management committees .. 37 Table 33: %of respondents reporting problems with non-food items .................................... 38 Table 34: Budget shortfalls ...................................................................................................... 39 Table 35: Ration for a family of 5 according to Guatemala Work Norms compared to PRRO Project Plan .............................................................................................................................. 39
List of Figures
Figure 1: Seasonal Calendar ....................................................................................................... 7 Figure 2:. Number and type of FFA interventions .................................................................. 10 Figure 3: Numbers of women participants, planned versus actual ........................................ 27 Figure 4: Women in leadership positions in food management committees, planned versus actual ........................................................................................................................................ 27 Figure 5. % of participating communities reporting support (area of support and type of support provider) ..................................................................................................................... 32 Figure 6. % of Comparison communities reporting support (area of support and type of support provider) ..................................................................................................................... 33

Fact Sheet: WFP’s FFA Programme in Guatemala
Guatemala
2002 2003 2004 2005 2006 2007 2008 2009 2010 2011 2012
Reg. PRRO 6089 Reg. PRRO 10212
Reg. PRRO 10444 Reg. PRRO 200043
CP 10092
CP 200031
Operations evaluated
Project Total Budget Areas of intervention
PRRO 10444 Regional PRRO Targeted Food Assistance for People Affected by Shocks and for the Recovery of Livelihoods
$53.45 million ($14.96 for Guatemala)
Agricultural and land management Forestry and agroforestry Water management Infrastructure Assets infrastructure Energy efficiency Waste management and sanitation Training
CP 10092 Country Programme 2001-2009 $20.03 million
Number of Project Participants
WFP Operations in Guatemala
WFP has worked in Guatemala since 1970 and provided assistance to rural farmers and vulnerable people affected by shocks since the early 1980s.
WFP’s activities in Guatemala are geared towards reducing food insecurity, improving the nutritional status of mothers and children under 5 and living conditions of vulnerable groups by increasing agricultural productivity and farmer’s marketing practices
WFP’s current interventions in Guatemala include: o Four on-going projects: Country Programme–200031; P4P; Regional PRRO–20043; Fund for the
Millennium Development Goals; o Two special funds: Gender Project Nutrition Project and VHS; o Four projects in planning stage: P4P and Nutrition, Climate Change Project, Regional Nutrition Project, and
Support to the Zero Hunger Initiative of the Guatemalan government; o Scaling Up Nutrition (SUN) for Guatemala provides for a multi-stakeholder platform (MSP) convened by
CONASAN of various players including government, private sector, civil society, UN agencies, donors and academia.
18
35
18
0
10
20
30
40
2008 2009 2010
Reg PRRO 10444.0

ii
Executive Summary
Introduction Evaluation Features
1. This evaluation assessed the impact of WFP’s food-for-assets (FFA) activities in Guatemala over the period 2003–2010.1 As one of a series, its objectives were to assess the outcomes and impacts of FFA on livelihood resilience, identify changes needed to increase these impacts, and generate lessons for improving the alignment of FFA activities with WFP’s 2011 FFA Guidance Manual and disaster risk reduction policy.2 The evaluation addressed three core questions common to the series:
What positive and negative impacts have FFA activities had on individuals within participating households and communities?
What factors were critical in affecting outcomes and impacts?
How could FFA activities be improved to address the findings from the first two questions?
2. The evaluation tested a theory of change in which food or cash inputs are provided for work on constructing assets or time spent in training, with the aims of: improving household food security in the short term;
improving the biophysical environment, agricultural production and livelihood options in the medium term; and
achieving sustained improvements in livelihoods resilience, including the ability to cope with crises, in the longer term.
3. The factors considered necessary for achieving the intended changes/outcomes include: appropriate situational analysis; FFA activities and assets that meet quality standards;
technical assistance and other capacities;
availability of food and non-food items;
complementary inputs from WFP and other actors; and
community and/or local government ownership, with adequate arrangements for asset maintenance.
4. The evaluation focused on natural resource assets – soil, water, agricultural land and forests – while also recognizing the contributions of infrastructure and access assets to livelihoods resilience. 5. Conducted by an independent team during late 2012 and early 2013, the evaluation
1 In 2013 WFP changed the use of the FFA acronym to mean “food assistance for assets”, covering food, cash and voucher activities for asset creation and training. During the period covered by this evaluation, however, FFA referred exclusively to food-for-asset activities. 2 WFP FFA Guidance Manual (2011) and “WFP Policy on Disaster Risk Reduction and Management” (WFP/EB.2/2011/4-A). The activities evaluated were designed and implemented prior to adoption of the guidance manual and disaster risk reduction policy, but their goals were broadly similar and the evaluation terms of reference emphasized learning.

iii
used a mixed-methods approach for data gathering and analysis, including: a quantitative survey of 1,201 households, of which 809 were in beneficiary
communities and 392 in non-participating communities, for comparison;
assessment of technical and biophysical assets in each community;
qualitative assessment of impacts at the household and community levels; and
social and institutional analysis of networks and linkages at different levels, especially communities.
6. The main challenges to conducting the evaluation included: i) widely dispersed beneficiary communities, and difficult access to sites; ii) the diversity of livelihood zones in which FFA was implemented; and iii) problems with data. The lack of baseline data limited the evaluation’s ability to assess changes in conditions from before to after the interventions. Many assets were household assets, but information about which households received support was not available, so the evaluation relied on self-reporting during the household survey. This challenge was mitigated by triangulating data from different sources and perspectives, including by comparing intervention with non-intervention communities, and participant with non-participant households in intervention communities, using a theory of change to test linkages and assumptions. Context 7. Guatemala is a multicultural, middle-income country with a population of 14.7 million people.3 Following a 36-year civil war, ending in the 1996 Peace Accords, significant progress has been made in macroeconomic and democratic stability, with stronger public institutions and improvements in health and education. 8. However, inequality and poverty persist, especially in rural areas, where stark disparities continue.4 Gross domestic product per capita is about half the average for Latin America and the Caribbean,4 and Guatemala ranked 131st of 187 countries in the 2011 human development index, with one of the world’s highest levels of inequality5 and one in ten Guatemalans at risk of falling into extreme poverty. Gender inequality is the highest in Latin America.6 9. More than 50 percent of Guatemalans live in poverty, with less than USD 2 per day,7 including more than 90 percent of the indigenous population;8 15 percent survive in extreme poverty, with less than USD 1 a day.9 The indigenous population accounts for 55 percent of the poor and 68 percent of the extremely poor.9 Illiteracy is 31.1 percent among women overall, and 59 percent among indigenous women.
3 WFP website – http://www.wfp.org/countries/guatemala/overview – accessed September 2013. 4 World Bank website, accessed 2 October 2012. 5 2012 United Nations Development Programme (UNDP) Human Development Report 62013 Gender Inequality Index in UNDP. 2013. The Rise of the South: Human Progress in a Diverse World (Human Development Report 2013). New York. 7 World Bank. 2009. Guatemala Poverty Assessment Good Performance at Low Levels, Report No. 43920-GT, p. ix. March. Washington, DC. 8 United States Agency for International Development (USAID) Bureau for Latin America and the Caribbean website, July 2011, from USAID Country-Specific Information: Guatemala. 9 National Statistics Institute. 2006. National survey of living conditions. Guatemala City.

iv
10. In indigenous areas, chronic undernutrition among children under 5 is 69.5 percent10 – the highest rate in the region and the eighth highest in the world. Iron deficiency affects 26.3 percent of children under 5. The most vulnerable groups are indigenous women and children living in the highlands and the dry corridor, a semi-arid zone that faces droughts, degraded soils and low agricultural yields. 11. Guatemala is prone to recurrent hurricanes, earthquakes, floods, landslides and droughts, which significantly affect households’ productivity, livelihoods and ability to cope with external shocks. Guatemala is also highly vulnerable to negative effects of climate change.11 Programme Description 12. WFP has worked in Guatemala since 1970, providing assistance to rural farmers and vulnerable people affected by crises and disasters since the early 1980s. Between 2003 and 2011, FFA activities were implemented mainly in three regional protracted relief and recovery operations (PRROs) and two country programmes (CPs). 13. Together, the activities selected for the evaluation – CP 10092 (2003–2005)12 and the Guatemala component of regional PRRO 10444 (2007–2010) – accounted for 34.5 percent of FFA interventions and 38.2 percent of beneficiaries in Guatemala over the period. They provided approximately 52 percent of the total food tonnage distributed by WFP in its FFA activities in Guatemala. 14. The total approved budget for the PRRO was approximately USD 53 million, of which 67 percent was received. The approved budget for the CP was approximately USD 21 million, 70 percent of which was received. WFP’s PRRO financial systems do not break down resources by individual activity, so comprehensive expenditure data on FFA activities in Guatemala were not available. 15. Approximately 500,000 beneficiaries were reported for the CP, and 250,000 for the PRRO Guatemala component. As shown in Table 1, FFA beneficiary numbers ranged from a high of 34,778 in 2009 for the PRRO, to a low of 2,224 in 2005 for the CP. Approximately 45 percent of PRRO beneficiaries and 22 percent of CP beneficiaries were women. Table 1: FFA Beneficiaries
2003 2004 2005 200
8 200
9 2010
CP 10092 activity 4 13 487 5 914 2 224
Regional PRRO 10444, Guatemala component
17 682
34 778
18 046
Source: WFP Standard Project Reports (SPRs).
10 2008–2009 National Maternal and Child Health Survey. 11 Global Facility for Disaster Reduction and Recovery. Climate Risk and Adaptation Country Profile: Guatemala, April 2011. Washington, DC,World Bank. 12 In 2006, the FFA activities under CP 10092 activity 4 were cancelled because of funding shortages.

v
16. The FFA component of the CP targeted vulnerable households living on degraded lands or exposed to adverse climatic conditions. Planned family rations were based on established work norms; delivery was synchronized with the progress of work and timed to be close to the seasonal food gap. PRRO FFA activities lasted for four months; most were implemented during the lean season from April to August. Household selection was based on criteria such as loss of crop production, dependence on subsistence agriculture, status as a single-parent household and the ratio of vulnerable to other household members. Both projects provided training, with the PRRO focusing on disaster response and improving community organizations, and the CP on asset maintenance and women’s ownership of assets.13
Findings
Asset Survival and Functionality 17. Table 2 lists the asset types identified and assessed by the evaluation, including those for agriculture and land management, forestry/agroforestry, water management, access and other infrastructure. Most assets were for households, with trench composting and home gardens being the most commonly reported. Very few community assets were built. Overall, more than 50 percent of assets survived, with lower rates for tree planting, bench terraces and seedling nurseries, and significantly higher rates – of more than 75 percent – for household rather than community assets. Table 2: Asset Types and Survival14
Asset type Ownership No. reported
No. found
% surviving
Home gardens Household 35 31 89
Agroforestry systems/tree gardens Household 25 22 88
Trench composting Household 38 33 87
Dead barriers Household 14 12 86
Opening roads Community 5 4 80
13 WFP project documents. 14 In a bench terrace nearly horizontal benches are cut into a steep slope to reduce runoff and control soil erosion. Barriers are laid along the contours of agricultural land to reduce water erosion and runoff; live barriers are of vegetation, and dead barriers of non-vegetative materials such as stones. Improved agricultural infrastructure is the patio hogar system, designed to address household nutrition and food security. Massal selection is a breeding method wherein a large number of plants having the desirable traits are harvested individually from a standing crop. The seeds from all selections are then bulked; a seed sample is taken and used to plant a population from which desirable plants are selected at maturity. The procedure is repeated for several cycles. For more information, see Rapid Technical Reference and Toolkit for FFA, Annex D in the 2011 WFP FFA Guidance Manual.

vi
Asset type Ownership No. reported
No. found
% surviving
Live barriers Household 21 16 76
Continuous terraces Household 4 3 75
Drainage/infiltration ditches Household 22 16 73
Household terraces Household 6 4 66
Forestry/tree gardens Community 5 3 60
Improved agricultural infrastructure Community 12 7 58
Massal selection of basic grains Community 13 7 54
Retaining walls Community 4 2 50
Tree planting Household 12 5 42
Seedling nurseries Community 4 1 25
Bench terraces Community - 3 -
No slash and burn Community - 16 12
18. Data on the functionality of assets were inconclusive; household surveys reported high functionality, but the asset assessment found fully functional assets in only 5 percent of communities. Triangulation among different evidence sources suggested that larger infrastructure such as stonewalls and terraces achieved greater productivity and long-term potential, but was also more difficult to construct and maintain. Consistent with the emphasis on household assets, respondents reported that families had an important role in asset maintenance, with non-maintenance reported in fewer than 7 percent of cases. However, the inconsistencies between assets reported and assets found should be kept in mind when considering these data. Biophysical Environment and Productivity
19. Most household respondents reported improved soil conservation, agricultural productivity and vegetation coverage (Table 3). Results indicate a positive association between the number of assets received and the percentage of households reporting improvements, suggesting cumulative effects. On average, participant households reported 2.27 assets each, including both the assets they worked on and those that were built for them.

vii
Table 3: Biophysical Outcomes Reported by Survey Respondents
Biophysical benefit % of households reporting benefits
Overall One type of asset
Two types of
asset
Three types of
asset
Four types of
asset
Less soil loss 75.4 56.5 67.6 96.7 94.8
Better agricultural production 74.1 54.8 70.5 85.7 91.4
More vegetation coverage 67.0 48.4 64.7 74.7 84.5
More trees 48.2 37.1 40.7 60.4 72.4
More products from trees 36.7 35.5 29.5 46.2 53.4
Less flooding 29.2 24.2 22.0 42.9 43.1
More water available 24.3 24.2 17.0 37.4 34.5
Food Security 20. Assessment of food security effects was constrained by the absence of monitoring data, but comparative analysis of participants, non-participants and respondents from comparison communities indicated few to no significant differences in food consumption scores (FCS) or dietary diversity. FCS scores – taken during the harvest season – were all in the acceptable range, but diets included only 3–7 percent vegetables, fruits and animal proteins, including milk products. Dietary diversity scores did not differ among the three respondent groups, although beneficiaries consumed significantly more beans than respondents from non-intervention communities. 21. As home gardens and composting were the most frequently found assets, more beneficiaries than respondents from comparison communities reported consuming vegetables produced on their own land. Respondents in comparison communities were significantly more likely to have borrowed food or relied on friends or relatives for food than FFA participants. However, more than half of all respondent households reported having insufficient food or means to purchase it at the time of the survey, regardless of programme participation. 22. Although the evaluation found that the overall coping strategies index (CSI) did not improve with FFA participation (see Table 4), there were differences in the coping strategies used. Participant households relied on consuming less preferred and less expensive food, while those in the comparison group restricted adults’ consumption to enable small children to eat. However, caution is needed in interpreting these results because CSI trend data are lacking and the scores do not capture the many influences that may affect behavioural responses.

viii
Table 4: Coping Strategies Index
In the last seven days how often has your household had to:
Score: participants
(mean)
Score: comparison
(mean)
rely on less preferred and less expensive food? 4 3
borrow food, or rely on help from a friend or relative?
3 3
limit portion size at mealtimes? 2 2
restrict adults’ consumption to enable small children to eat?
4 5
reduce number of meals eaten in a day? 1 1
TOTAL CSI 14 14
Livelihoods and Migration 23. Highly significant differences in effects on livelihoods were recorded (see Table 5), with 77 percent of participant households reporting livelihood improvements in recent years, against only 31 percent in comparison groups. More than 95 percent of participants attributed improvements to WFP’s FFA, with 56.6 percent stating that the assets created helped to increase income. However, the small difference in monthly income between participants and comparison groups was not statistically significant (at P < 0.1). 24. While there was no significant difference in the proportion of households farming their own land, the evaluation recorded significantly lower rates of migration among participants. Overall, these findings provide reasonably strong evidence of FFA having a significant effect on the livelihoods of participant households. Table 5: Impact on Livelihoods and Migration
Impact Participants Comparison Difference
Improvement in overall livelihoods 76.9 31.4 P < 0.01
Household earning more than 500 quetzals monthly
54.7 48.7 NS*
Household farms its own land 72.6 74.7 NS*
Migration of household member in last 12 months 30.5 37.5 P < 0.05
Overall migration reduced in last 12 months 16.0 8.9 P < 0.01
* Not statistically significant.

ix
25. Consistently more survey respondents in beneficiary than comparison communities reported access to community, farmers’, youth or women’s organizations, with 46.5 percent of FFA participants reporting participating in such organizations, compared with 34.9 percent in comparison groups (P < 0.01). The differences were statistically significant for men and women analysed separately. Thirty-two percent of men and 36 percent of women in beneficiary communities reported receiving training to improve organizational and management capacities, compared with 18 percent of men and 14 percent of women in comparison communities. Women’s Participation and Empowerment 26. In four of the six years covered by the evaluation, more women than planned participated in FFA activities (see Figure 1). However, over all six years, women constituted an average of only 34 percent of total participants, compared with the planned 42 percent. WFP included a higher percentage of women participants than planned in only two years during the period evaluated.15 Figure 1: Numbers of women participants, planned versus actual
27. The country office planned that women would assume leadership positions in food distribution committees, but annual goals for women’s leadership were not usually met (see Figure 2). However, the percentage of household food rations received by women at distribution points rose to 90 percent. Figure 2: Women in leadership positions in food management committees, planned versus actual (%)
Source: WFP Standard Project Reports
15 All figures in this paragraph are from WFP Standard Project Reports.
0
5 000
10 000
15 000
2003 2004 2005 2008 2009 2010
CP PRRO
Planned participants Actual participants
0
20
40
60
80
100
2003 2004 2005 2008 2009 2010
CP 10092 PRRO 10444
Planned
Actual

x
28. The theory of change envisaged a wide range of impacts on women and girls, including some negative ones. For example, the health of pregnant or lactating women could be compromised by participation in heavy manual labour for FFA activities, with potential spillover effects on infants and young children. Recognizing this, WFP adjusted its programmes. However, 40 percent of women reported the need to reorganize their daily activities or allocate them to other household members, to participate in the FFA programme, compared with only 17 percent of men. 29. Substantially more participants than comparators thought that women’s empowerment had increased, with greater roles in community affairs, better access to credit and more important roles in community decision-making. Community leaders and representatives of women’s organizations in beneficiary communities considered women’s increased participation to be the most important outcome and impact of FFA activities. In comparison communities, representatives of women’s organizations reported limited participation in community affairs. 30. In many focus group discussions a more active role for women was considered a key factor in family nutrition status. Home gardens – among the most common assets created – were well targeted to women, who are responsible for gardening and home food production. The women interviewed tended to perceive positive outcomes and impacts from growing their own vegetables and fruit. 31. More men than women reported participating in community organizations – 24 compared with 8 percent – with no significant difference between beneficiary and comparison communities. Approximately 18 percent of women in all communities reported participating in women’s organizations. Less than 5 percent of respondents reported participating in agriculture organizations, regardless of sex or type of community. Resilience 32. Both beneficiary and comparison communities reported facing climate hazards and natural disasters, with droughts, frosts, earthquakes and hurricanes being the most frequently cited. Between 17 and 26 percent of participants reported that FFA interventions had reduced losses from disasters. 33. The evaluation found that self-assessed disaster preparedness was significantly higher among participant households, at 30.4 percent, than comparison households, at 21.4 percent. More than 85 percent of respondents rated the training received – covering technical asset management, disaster preparedness, literacy and general capacity development – as very useful. However, further assessment of FFA disaster training effects was constrained because both participants and comparison groups had received training. 34. It was therefore notable that community and women’s leaders in both beneficiary and comparison communities reported feeling unprepared, with few resources at their disposal to face the challenges of recurring disasters. Factors Affecting Impact Partnerships and Alignment 35. The Government of Guatemala was WFP’s main partner during the evaluation period, with a variety of roles. FFA activities were implemented in collaboration with the

xi
Fondo de Inversión Social (FIS) in the CP, and the Ministry of Agriculture in the PRRO. The Government was responsible for providing technical assistance, storage, handling and transportation to distribution points. Its frequent inability to assume these responsibilities because of resource constraints resulted in delays and post-delivery losses, affecting efficiency and effectiveness. More positively, WFP’s work with government organizations enabled it to influence policy-level dialogue on food security, disaster preparedness and response. 36. Adequate technical assistance was identified as critical for successful asset development, which requires specialized knowledge of engineering and agricultural development. The Food and Agriculture Organization of the United Nations (FAO) was WFP’s main United Nations collaborating partner for technical assistance and agricultural inputs under the PRRO, funded by the European Union (EU) Food Facility. Respondents judged this relationship as successful and well institutionalized through complementary roles, with FAO providing the necessary support for the technical design of agriculture-based interventions and for food production. 37. In response to the resource limitations of government agencies, WFP developed relationships with local non-governmental organizations for field-level delivery. Municipal governments also became increasingly important partners, in line with government efforts to strengthen capacities at the municipal level. Resources 38. Both programmes were underfunded throughout the evaluation period; only 55 percent of the CP budget was actually funded (by 2005) and 71 percent of the PRRO budget (by 2010). Although corporate financial records16 do not disaggregate among activities, communication with the WFP country office indicated that the FIS FFA activities were suspended in 2005 because they were less than 25 percent funded. Funding gaps and uncertainty reduced the ability of the country office and its partners to plan, deliver, follow-up and monitor activities. According to reports and interviews, implementation was frequently postponed, and rations were not received on time, or of the expected quality and condition. The problems most frequently mentioned by respondents were inadequate technical assistance, by 15.3 percent; tools not available, by 23.7 percent; and lack of knowledge, by 11.9 percent. Positioning 39. Most respondents reported a high regard for WFP’s role in humanitarian assistance, but noted that its role in more development-oriented activities was not well differentiated from other United Nations agencies. Nonetheless, WFP appears to have filled a gap, as most comparison communities received very little or no support in emergency preparedness, emergency response or food aid from other institutions. WFP’s clear comparative advantage in emergency response and disaster preparedness was relevant to the range and frequency of disasters in Guatemala, with climate change effects emerging as an additional risk factor.
16 WFP Standard Project Reports

xii
Implementation Approach 40. In a context of historical mistrust between government entities and local communities, WFP maintained a positive reputation. Working at the municipal level with the mayor, the Office of Women and the Office of Planning, WFP’s cooperating partners were effective in facilitating community engagement with the Government. Recent national government efforts to develop municipal capacities, including in women’s affairs and nutrition, offer opportunities for WFP to engage further at the municipal and community levels. 41. Most evaluation respondents praised WFP’s delivery capacity and ability to react and execute its work quickly, although community focus groups reported some long delays between expected and actual food deliveries. The quantity of food available was also reported to have been unpredictable and less than appropriate for the work done. WFP’s records show that the amounts of food delivered were less than planned in four of the six years evaluated, dropping to only 19 percent in one year.16 Many respondents identified sustained technical assistance after initial asset construction as essential for success. Counterparts were responsible for technical assistance, which was often under-resourced and insufficient. 42. A wide range of FFA activities were implemented through short interventions with wide geographic coverage. PRRO interventions lasted only a few weeks or months, and although CP projects were planned for longer durations, limited funding and partner capacity prevented these plans from being realized. WFP records, validated by the evaluation team, found that an average of eight types of assets were built per community in the CP and five types in the PRRO. Most of these assets were for general agricultural productivity and land stabilization. Home gardens and composting – which are improved practices rather than physical assets – respond to the needs of individual women, who often control them, but they are small-scale interventions that tend to address the disaster risks facing communities only indirectly. 43. WFP’s recent FFA programme guidance recognizes that environmental considerations are intrinsically linked to FFA success. Respondents linked environmental conditions to adaptation, resilience and rehabilitation efforts, and raised concerns that climate change will exacerbate the risks of disasters such as floods and droughts. However, despite the environmentally appropriate approach to individual asset formation – such as avoidance of slash and burn, protection of diverse tree species, reforestation and composting – the absence of a comprehensive watershed approach limited impact. The evaluation also found that the environmental awareness of communities and partners remained low despite participation in FFA activities and training. Conclusions and Recommendations 44. As outlined in the logic model guiding the evaluation, FFA was expected to address short-, medium- and long-term objectives. The evaluation found that WFP reached approximately 90,000 people in underserved communities, providing food assistance during periods of post-conflict rebuilding and natural disaster and building useful assets, most of which are still functional. 45. Despite the limited monitoring data, the evaluation found medium- and longer-term positive impacts on the biophysical condition of land and on livelihoods, including

xiii
migration. However, food security did not improve significantly, and communities remained highly vulnerable to disaster risk, despite greater awareness of disaster preparedness. Although the PRRO and the CP implemented FFA interventions in different ways, both projects built assets that aimed to contribute to medium- or long-term food security, livelihoods and resilience. 46. WFP’s approach was characterized by large numbers of small interventions, mainly to create private assets such as home gardens and composting. These assets were maintained by households and did not require costly and sophisticated planning or follow-up. However, although they addressed the needs of individual women, they were too small to stimulate significant improvement in food security or affect watershed-level change. 47. Climate change is expected to have various effects, requiring different coping strategies for affected people in Guatemala’s diverse eco-geographical environment. To enhance impacts, FFA programming should pay more attention to environmental factors, with asset selection more explicitly based on a watershed approach. Larger, landscape-level community assets would likely have had a more transformative effect on communities than the micro-level household assets created, but strong partnerships and agreements for technical assistance and asset maintenance would be needed to realize these benefits. Focusing on fewer, more substantial assets through longer-term interventions could help ensure that the limited technical capacity and resources available are not overstretched. The WFP country office also needs adequate human and technical resources to inform project planners, managers and cooperating partners. 48. FFA interventions contributed to improving women’s roles in their families and, to a certain extent, in community affairs, and many addressed women’s situations and needs. However, targets for women’s participation in work and management were often not met. Working with the municipal gender support units that are being developed provides an opportunity to improve performance in achieving gender goals. 49. The WFP country office was seen as an active and fair player in Guatemala, especially at the national policy level; overall, WFP’s FFA interventions in Guatemala complemented government plans and priorities. The institutional environment for food and nutrition security is dynamic, given the evolving national and international economic and political climates. While the country office worked successfully with a variety of national governmental and non-governmental organizations and international institutions, the long-term sustainability of FFA interventions depends more on the capacity of national actors. More binding and mutually accountable agreements for FFA partnerships would be helpful. 50. As Guatemala is a middle-income country, traditional donors are reluctant to provide resources for long-term development programmes, but remain well disposed to fund humanitarian assistance. The WFP country office’s capacity to deliver humanitarian assistance quickly, swiftly and professionally in emergency situations is recognized by all. It could build on this reputation to reframe its FFA activities as disaster risk reduction and response, helping communities to build assets that maintain food security during recurrent natural disasters, including flooding, seasonal drought, landslides and frosts, and linking these activities more directly to disaster response capacity at the local, municipal and national levels. This reframing would also bring activities more into line with WFP’s current policy and guidance.

xiv
Recommendations 51. Recommendation 1: Building on its experience and reputation, the country office should reframe its FFA programming towards disaster risk reduction and response. This will involve developing a strategy and action plan for its FFA approach and then prioritizing, designing and aligning these to Guatemala’s diverse environmental, risk and vulnerability contexts. It should include specific plans for enhancing disaster risk reduction and response capacity tailored to the community, municipal and national levels; establishing effective partnerships to ensure the requisite technical skills; and developing staff capacity to enable WFP to play a leadership role with national government and international institutions. 52. Recommendation 2: To increase the effectiveness of FFA interventions and achieve greater impact and sustainability, the country office should concentrate its efforts on fewer, larger and longer-term interventions in fewer communities, with clear criteria for targeting communities at risk of food insecurity and disasters. The types of assets: i) should be those that are likely to help prevent disaster damage and maintain food security when disaster strikes; ii) must be selected according to the particular conditions of each area; and iii) should ensure balance among short-, medium- and longer-term benefits. 53. Recommendation 3: The country office should develop a broad vision and framework for gender issues in FFA, focusing on household food and nutrition requirements during and after emergencies and taking into consideration women’s needs, interests and roles in food and nutrition security. Rigorous analysis should be undertaken to identify barriers to women’s empowerment and ways of engaging men in the elimination of these barriers. Women should be fully integrated into FFA decision-making processes so that they can benefit from the empowerment brought by such engagement. 54. Recommendation 4: The country office should develop longer-term and stronger partnerships at the national, municipal and community levels to ensure that assets are well designed and constructed according to appropriate technical standards and that there is adequate maintenance for the long-term sustainability of its FFA interventions. The country office should implement a strategy for the knowledge transfer of successful FFA interventions to government partners, emphasizing sustainability at the national, municipal and community levels. It should also develop a clear cooperation strategy for the municipal level, setting out clear actions to be undertaken. Protocols for cooperation should be developed to clarify conditions and responsibilities for food delivery, divisions of labour regarding technical assistance, and the involvement of municipalities in follow-up, maintenance and monitoring at the community level. 55. Recommendation 5: The country office should develop and implement a robust and systematic FFA monitoring and evaluation system to measure the intended biophysical and socio-economic effects and provide adequate data at the community/municipal level to facilitate ownership and sustainability.

Map of Guatemala
Guatemala is a mountainous country in Central America covering an area of 108,890 km². Two mountain chains divide the country into three major regions: the highlands, the Pacific coast and the Petén region. Varying in climate, elevation and landscape, these regions provide dramatic contrasts. The Tajumulco volcano mountain, reaching 4,220 metres, is the highest in the country and Central America.

2
1. Introduction
1.1 Evaluation Features
1. This evaluation assesses the intended and unintended outcomes and impact to date of Food for Assets (FFA) activities within two project activities of the World Food Programme in Guatemala, as shown in the following table.
Table 1: Evaluation Point of Reference
Subcomponent Project Department coverage
Technical partner
Overview
Fondo de Inversión Social (FIS)17
CP 10092 Activity 4 2003–2005
Quiche, Huehuetenango, Jalapa
FIS 270 communities 14 departments
EU-funded food facility
PRRO 10444 2007–2010
Baja Verapaz, Quiche, el Progresso, Jalapa
FAO 248 communities 2 departments
2. The evaluation is one of five (5) evaluations in a series addressing WFP’s work on FFA that have been commissioned by the WFP Office of Evaluation (OEV). FFA programmes are one of WFP’s largest areas of investment over time. Measured by food tonnage, and the level of direct expenses during 2006-2011, FFA programmes are the second largest of WFP’s food distribution modalities after General Food Distribution (GFD).
3. The evaluation was conducted in order to identify changes that might be needed to improve the impact of FFA on livelihoods resilience and to indicate areas in which FFA activities might be better aligned with new 2011 FFA Guidance Manual and Disaster Risk Reduction (DRR) policy 18. It focused on three main evaluation questions:
Q1. What positive or negative impacts have FFA activities had on individuals within participating households and communities? Q2. What factors were critical in affecting outcomes and impact? Q3. How could the FFA activities be improved to address findings emerging from the analysis in key questions 1 and 2?
4. The evaluation used a logic model for FFA that was developed for the evaluation based on WFP programme guidance and policy, and further validated during the evaluation design (Annex 3). The methodology, (Annex 2) presents how the selected methods address the different evaluation questions. The logic model was used as the basis for an analysis of the contribution of FFA activities to outcomes and impact. A theory of change, developed by the OEV, presents a linkage between inputs, activities, outputs, outcomes and impact and the assumptions that underlie the expected achievement of impact. This was supplemented by an evaluation matrix which included the three fundamental evaluation questions. The impacts are expected to occur over different timeframes:
Short Term: inputs and outputs - the cash/food distribution process and the immediate creation of the asset;
Medium Term: the outcome level result, which is achieved on livelihoods through the operation of the asset for around 3 – 5 years. This is the period during which an
17 Fondo de Inversión Social. Please note that Activity 4 was cancelled in 2006 due to lack of funding. 18 The programmes being evaluated were designed and implemented prior to the adoption of the 2011 FFA Guidance and DRR policy. However goals are broadly similar and the evaluation TOR emphasis is on learning.

3
asset, if appropriately designed is likely to function and remain in working condition with minimal maintenance (although returns may diminish) and provide benefits;
Long Term: the impact level results, translates into benefits on livelihoods through the operation of the asset for more than 5 years. In many situations this will require a degree of formality around the longer term operations and maintenance of the asset without which the utility of the asset will decline over time.
5. The focus of the evaluation was natural resource assets (soil, water, agricultural and forests) while also recognizing the contributions of infrastructure and access assets to livelihoods resilience.
6. Stakeholders specific to the evaluation include bilateral partners, Guatemala government officials at national, district and municipal levels and NGOs. The WFP Country Office (WFP-GCO) in Guatemala will benefit from the evaluation by virtue of new information regarding the outcomes and impacts of the FFA interventions, and from the recommendations for the improvement of operations. Similarly, other actors partnering with WFP in the delivery of FFA interventions (including national institutions and international organizations, both bilateral and multilateral) should also benefit from the evaluation. The ultimate stakeholder is the FFA beneficiary and the associated communities. Because the evaluation report is presented to the WFP Executive Board, it is an important stakeholder in terms of benefitting from the insights provided to improve its oversight role.
7. The WFP Office of Evaluation (OEV) managed the process, providing oversight and ensuring the quality of all products. Additional quality control was also provided by the firm commissioned to conduct the evaluation Le Groupe-conseil baastel (Baastel).
Methodological approach
8. The evaluation used a mixed-methods approach for data gathering and analysis19 and four main methodologies:
A quantitative survey at the household level (1201 households (HH) of which 809 HH were from beneficiary communities and 392 HH were from comparison communities);
A qualitative assessment of impacts at household and community levels;
A technical appraisal of assets in each community and associated biophysical changes;
A social and institutional analysis of networks and linkages at different levels in the country, but primarily at the community level.
9. The analysis of the household surveys (HHS) was done using three categories of respondents: participants, living in beneficiary communities and who actively participated in the program; non-participants, living in the beneficiary communities but did not actively participate in the program and the comparison group communities.
10. The team visited 40 beneficiary communities, a total population of 28,824 with an average 779 people per community. Total population for the comparison communities was 6,234, with an average of 346 people per community.
11. Secondary data (e.g., national household level surveys, census data and WFP monitoring data on inputs and activities) complemented primary data collected.
19 For more information on the methodology, see Annex 2.

4
12. Nine data collection tools were used: Community Profile (CP), Asset Assessment (AA), Institutional Analysis (IA), Household Survey (HHS), Focus Group (FG), Semi-structured Interviews (SSI), Document Review (DR), Secondary Data Analysis (SDA) and Institutional Analysis (IA).
13. Data from all sources and methods were systematically checked and cross-checked to verify data quality. A narrative and photographic presentation of assets observed by the evaluation team and field supervisors further documented the findings.
Evaluation team
14. The evaluation was conducted by an independent team hired through Baastel, consisting of the following members:
Dr. Rémy-Claude Beaulieu: Team Leader (Specialist in program evaluation)
Anne Fouillard, M.E.S.: Senior Evaluator (Specialist in Natural Resources and Environment)
Hew Gough: Statistician (Specialist in Quantitative Analysis)
Alexandre Daoust: Data Management
Lic. Olga Marina Pinto: Head of Cambios and Local Coordinator (Specialist in conducting field surveys)
Timing and Duration of Fieldwork
15. Two visits to Guatemala were undertaken by the Baastel Team: the first one, to develop the methodology, took place from 22-28 September 2012; the second, for data-gathering purposes, took place from 25 November to 14 December 2012. The local team “Cambios”, hired by Baastel undertook field work from 23 November to 16 December 2012 for the household survey and assets assessments. A second round of data-gathering for assets assessment took place from 12-20 April 2013.
Limitations
16. The main limitations of the evaluation include the following:
Geography: Beneficiary communities are widely dispersed throughout the country and access to many sites is difficult.20
Sampling: The evaluation was conducted in five of the 20 diverse livelihood zones in which the FFA was implemented. Even with a well-designed sampling methodology, it was a challenge to ensure that the sample was representative of the full population, given the constraints of time and resources for the evaluation.
Data quality: Inconsistencies in the raw data provided by WFP required verification or addition of complementary information (FIS-Geographical location, etc.). In some instances data were not available at the community level. Determining the exact number of assets built with WFP support was also difficult given some weaknesses of the information system. Available data was mainly based on aggregate information at the municipal level, while the evaluation survey and data gathering were based on the community level. A significant number of assets were household assets but information was not available about which households received support, therefore this information was recreated based on self-reporting by survey respondents. Furthermore, a full data set for PRRO-10444 was available, but not for CP-10092. In addition, the methodology suggested by WFP for the Household Asset
20 Due to the nature of the projects (mainly PRROs) the dispersion of the sites is explained by the fact that these were where emergencies occurred.

5
Score (HAS) and the Community Asset Score (CAS) required an approximate percentage of the segment of the community benefitting from the assets and not necessarily the number of assets built.
Lack of Baseline: There was no useable baseline data available upon which to compare present day results, therefore the evaluation compared data taken from programme sites, including direct beneficiaries and other community members, with data from comparison communities.
Attribution: Because WFP often intervenes through national counterparts, some community leaders and respondents had difficulty clearly identifying the provenance of the FFA support provided.
The lack of useable baseline information21 limited the extent to which the evaluation was able to assess changes in conditions before and after the intervention. This was mitigated by triangulation of data from a range of sources and perspectives including comparison of intervention areas against comparison communities, and beneficiaries and non-beneficiaries in intervention communities and the use of a theory of change to test linkages and assumptions.
1.2 Context: FFA in Guatemala Basic socio-economic situation
17. Guatemala is a multicultural, middle-income country with a population of 14.7 million people.22 It ranks 131 out of 187 in the 2012 UNDP Human Development Index and has one of the highest levels of inequality in the world, with a Gini coefficient of 53.7.23 The richest 20% of the population accounts for more than 51% of overall consumption.24 Gross national income per capita is US$2,680. GDP per capita is roughly one-half the average for Latin America and the Caribbean.25
18. Guatemala is a complex, multi-cultural country with 23 language groups; many people do not speak Spanish. About half the people live far from urban centres and depend on agriculture for their livelihoods. Although the country has modernised during the past decade, gaps between rich and poor remain wide. Significant progress has been achieved with respect to macroeconomic and democratic stability after a 36-year civil war. The signing of the 1996 Peace Accords ushered in a period of stronger public institutions and improvements in health and education. It also boosted Guatemala’s economy on the heels of several trade agreements—notably the Central America Free Trade Agreement-Dominican Republic (CAFTA-DR)—and has expanded its access to foreign markets.
19. One of the main objectives of the Government’s agricultural policy26 is to support the transition of subsistence farmers and their families from subsistence to profitability through diversified and increased production and improved access to markets. However, although Guatemala has maintained macroeconomic stability, low levels of tax revenue and public
21 Baseline and endline reports were made available to the evaluation team for the EU Food Facility programme, but it was not useable as a strict comparison because of differences in approach and methodology, although it was used as a source of secondary information for more general purposes. 22 WFP website, http://www.wfp.org/countries/guatemala/overview, accessed September 2013 23 World Bank website, accessed 2 October 2013 24 UNIDO. October 2013. Country Briefing Note. p.1 25 IndexMundi. 2013. Guatemala Economy Profile 2013. Online (site last visited December 9th 2013). http://www.indexmundi.com/guatemala/economy_profile.html 26 WFP project document CP 2010–2014

6
expenditures limit the investments in physical and human capital needed to help lift large numbers of people out of poverty.27
20. The overall picture remains one of inequality and poverty—especially in rural areas, where stark disparities remain in terms of access to health, basic education, social services and opportunities.28 Income of more than 90% of the indigenous population is less than $2 per day.29 Some 51% of the total population lives in poverty (less than $2 per day)30 and 15% in extreme poverty (less than 1$ a day). The latter affects mainly the indigenous population, who comprise 55% of the poor and 68% of the extreme poor.31 Illiteracy is 31.1% among women 15 years of age and older (59% among indigenous women). Among Latin American and Caribbean countries, only Haiti has levels of poverty and social indicators worse than Guatemala. The percentage of the population living in poverty decreased in 2006, but rose again in 201132.
21. The most vulnerable group in Guatemala comprises indigenous women and children living in the highlands and the so-called dry corridor—areas characterised by drought, degraded soils and low agricultural yields.. The majority of the poor households depend on non-irrigated subsistence agriculture,33 with few options for generating income.34 The area of land available to a farmer is usually limited to about 0.35 hectares,35 often of low quality and agricultural productivity, with steep slopes and subject to erosion. These small producers are unable to access credit, while the costs of agricultural inputs such as seeds, fertilisers and agricultural tools are increasing rapidly.
22. The global economic crisis exacerbated the situation, especially for the poor, by reducing remittances.36 The lack of subsidised fertilisers and high-quality seeds, in turn negatively affected subsistence farmers. These impacts all have the effect of restricting access to food for already impoverished and food-insecure families.
Disaster Risk and Occurrence
23. Guatemala is prone to recurrent disasters such as hurricanes, earthquakes, floods, landslides and droughts that significantly affect the productivity of households, their livelihoods and their ability to cope with external shocks. Extreme and recurrent weather events make rural people more vulnerable because they depend on subsistence farming and/or daily agricultural wage labour for their food and source of income. Floods and hurricanes damage infrastructures, assets, and limit access to markets. Finally, they cause crop losses and force people to become more dependent on food purchases. The 2001 drought resulted in crop losses of between 60 and 80% in the driest areas37. The following figure shows the range of natural disasters including droughts, floods and hurricanes that have stricken the country in recent years along with the seasonal variation in agricultural production, which the lean season between April and July.
27 World Bank, 2009 Guatemala Poverty-Assessment Good Performance at Low Levels, report No. 43920-GT March Washington DC 28 World Bank website, accessed October 2, 2012 29 USAID Bureau for Latin American and the Caribbean website, July 2011 from USAID Country Specific Information: Guatemala 30 Guatemala Poverty Assessment, World Bank, March 2009 (report 43920) p. ix. 31 National Statistics Institute. 2006. National survey of living conditions .(Encuesta nacional de condiciones de vida) Guatemala City 32 World Bank Data, 2013 http://data.worldbank.org/country/guatemala#cp_wdi 33 USAID, 2010, Biodiversity 34 USAID website on food security, accessed October 1, 2012 35 EFSA, 2009Red Alimentaria Informe: Resultados de la Valoracion de Inseguridad Alimentaria y Nutricional en los departamentos del Corredor Seco del Oriente Quiche y Izabal, Guatemala November 2009 36 Guatemala is the top remittance recipient in Central America, with inflows serving as a primary source of foreign income equivalent to nearly two-fifths of exports or one-tenth of the GDP. 37 WFP Project Document Regional PRRO 10212.0

7
Figure 1: Seasonal Calendar
Nutritional insecurity and vulnerability
24. Currently, more than 410,000 families in Guatemala are classified as being at high to very high risk of food and nutrition insecurity. According to UNFPA, 50% of children (defined as those under 12 years of age) and 30% of pregnant and lactating women suffer from chronic malnutrition.
25. The rate of chronic under-nutrition for children under five is 49.8%—the highest in the region, the fourth highest in the world.38 The 2008 height census of first-grade students showed that more than 51% of elementary students in half of the country’s 333 municipalities suffered from either moderate or severe stunting, the latter being a clear indicator of chronic malnutrition. Stunting among under-fives reaches 69.5% in indigenous areas.39
26. Ultimately, an estimated 1.8 million (12%) Guatemalans are food-insecure, with the majority of these, about 1.7 million, receiving food aid.40 Nearly 500,000 children are enrolled in government school-feeding programs.41
27. Staple foods consist primarily of corn and beans, and during the estimated three to six unproductive months of every year, farmers must rely on market purchases and remittances to feed their families; remittances from abroad are estimated at about 10% of GDP.42 Rising costs of commodities have also had an impact on food accessibility for the poor. Hundreds of thousands of members of the high-vulnerability groups thus become seasonal migrant workers on coffee and sugar cane plantations to generate income to feed their families.
28. In 2004, the Mesoamerican Famine Early Warning System (MFEWS) reported that in Guatemala, 72% of the affected population reported serious difficulties with access to food following food stock reductions and crop losses caused by Hurricane Stan.43
29. At current rates it will take more than 80 years to eliminate stunting due to chronic malnutrition among Guatemala’s indigenous populations and 20 years among non-indigenous people. In the past six decades, malnutrition among children has cost 38 United Nations Development Programme, 2010. Human Development Report. New York. 39 The National Statistics Institute (INE). 2002. National Mother and Child Health Survey (ENSMI) 40 This figure is based on several discussions held during the Inception Mission, including one with the director of WFP-GCO in Guatemala. 41 USAID food security website, 2012 42 Gross Domestic Product/Producto Interior Bruto (PIB) from the Organización de remesas y desarollo, Informe de la Situatión de remesas para Guatemala, 2009. Sourced from EFSA, 2009. 43 PRRO, 2007, Project Document 10444

8
Guatemalan society an estimated $3.13 billion in additional expenses for health and education as well as lost productivity.44
30. A 2011 report issued by the Guatemala’s Ministry of Agriculture (MAGA) provides an overall assessment of the food and nutrition situation in Guatemala.45 According to this report the education levels of mothers as the single most important variable for chronic malnutrition, and protein deficiency, nutritional anaemia and vitamin A deficiency as the three main nutritional problems.46 Maternal and child nutrition is the underlying cause of more than a third of all deaths of children of less than 5 years of age. Many of these deaths could be prevented through effective interventions addressing malnutrition, where cyclical and structural factors underpinning this phenomenon are complex and interrelated.
1.3 WFP's FFA activities in Guatemala
31. WFP has worked in Guatemala since 1970 and has provided assistance to rural farmers and vulnerable people affected by crises and disasters since the early 1980s. Between 2002 and 2011, FFA activities took place mainly within three Protracted Regional Recovery Operations (PRROs) and two Country Programs (CPs).
32. The present evaluation focuses on CP 10092 (2003–2005)47 and the Guatemala component of regional PRRO 10444 (2007–2010). Together, the activities selected for the evaluation accounted for 34.5 percent of FFA interventions and 38.2 percent of beneficiaries in Guatemala over the period. A total of 222 FFA projects were undertaken in 14 districts and 86 municipalities. FFA beneficiary numbers ranged from a high of 34,778 in 2009 for the PRRO, to a low of 2,224 in 2005 for the CP. Approximately 45 percent of PRRO beneficiaries and 22 percent of CP beneficiaries were women.. Approximately 500,000 beneficiaries were reported for the CP, and 250,000 for the PRRO Guatemala component.48 Approximately 45 percent of PRRO beneficiaries and 22 percent of CP beneficiaries were women.
33. CP-10092 was originally put in place for 2001–2004, subsequently rescheduled (2003-2005). Components and objectives included:
i) food assistance and training for pre-school children, ii) primary school feeding, iii) support for food-insecure households in resettlements, iv) creation of assets to cope with natural disasters, and v) disaster mitigation and emergency preparedness.
34. Under Activity 4 of CP-10092, FFA activities targeted the creation of assets to cope with natural disasters through developing and preserving assets for food production and disaster mitigation. The targeted beneficiary groups were vulnerable households living in degraded lands and those exposed to adverse climatic conditions. Planned family rations were based on established work norms; delivery was synchronized with the progress of work and timed to be close to the seasonal food gap. Assets created were mainly related to agriculture and land management (rehabilitation of soil and bench terrace construction), forestry (tree planting) and water management (small irrigation schemes and water system
44 USAID website on Food Security, accessed October 1, 2012 from A. León, et al., Poverty, Hunger and Food Security in Central America and Panama. ECLAC and WFP, 2004 45 Vulnerability to Food and Nutritional Insecurity Index in Guatemala (IVISAN) 2011 Exerpts translated from the IVISAN Report entitled Priorización de municipios a través del indice de vulnerabilidad a la inseguridad alimentario y nutricional de la población de Guatemala. (MAGA, May 2011) 46 More recently, the issue of obesity related to new nutritional habits of youth and adults has emerged. 47 In 2006, the FFA activities under CP 10092 activity 4 were cancelled because of funding shortages. 48 WFP Standard Project Reports (SPRs).
9
construction). The approved budget for the CP was approximately USD 21 million, 70 percent of which was received.
35. Fondo de Inversión Social (FIS) was the key partner organisation for the FFA activities being evaluated in the CP49. FIS was created in 1996 with the support of the Inter-American Development Bank (IADB) to help local communities in the implementation of local infrastructure and development projects that would improve their quality of life through participatory planning.
36. PRRO-10444 was approved in 2007 with a budget of US$32.3 million to distribute 46,486 metric tonnes (MT) of food, later increased to US$53million (of which 67 percent was received) and distribution of 60,218 MT of food. It was established to address the food needs of the most vulnerable populations affected by frequent natural disasters, and had the additional goal of developing capacities at the community level for coping with disaster. PRRO-10444 was designed to assist some 471,000 beneficiaries in four Central American countries (Guatemala, Honduras, Nicaragua and El Salvador). Household selection was based on criteria such as loss of crop production, dependecen on subsistence agriculture, status as a single parent household and the ratio of vulnerable to other household members. FAO and VISAN-MAGA were the main technical partners in the implementation of the PRRO.
37. FFA activities took place during the lean season from April to August. The two projects evaluated (CP-10092 and PRRO-10444) comprised 34.5% of all WFP-FFA in Guatemala, in terms of number of interventions for 2002–2011 and 38.2% of the total number of beneficiaries in Guatemala over the period. These two programs also represented 52.6% of the total MT of food distributed in FFA interventions.
38. The top five departments (Quetzaltenango, San Marcos, Huehuetenango, Baja Verapaz, Chimaltenango) received 61.5% of the total of FFA interventions in terms of metric tonnes of food received. CP-10092 was most active in Huehuetenango, Quiché, Alta Verapaz and Chimaltenango, where 73.5% of its interventions were concentrated, while PRRO-10444 was most active in Quiché and Baja Verapaz, where 56% of the activities were concentrated.
39. The main areas of FFA interventions in Guatemala within the two projects, in terms of number of activities, were:
Infrastructures (20%);
Water management (17%);
Forestry/agroforestry (16%);
Access infrastructures (15%);
Agriculture/ land management (18%);
Waste management /sanitation (3%)50.
40. Both projects also conducted training as a part of their overall strategy. Training to strengthen community responses to disasters and improving community organization was an important feature of the PRRO. In the CP, training was provided to participants on asset
49Other FFA activities were conducted under the CP in partnership with the Fondo Nacional para la Paz (FONAPAZ). FONAPAZ was created after the Peace agreements signed in December 1996 to help displaced communities and repatriation of rebels. FONAPAZ was a partner in Activity 3 of the CP, it was excluded from the evaluation because of the focus on infrastructure assets. 50 WFP. 2012. Country Annexes (to Terms of Reference. 1.
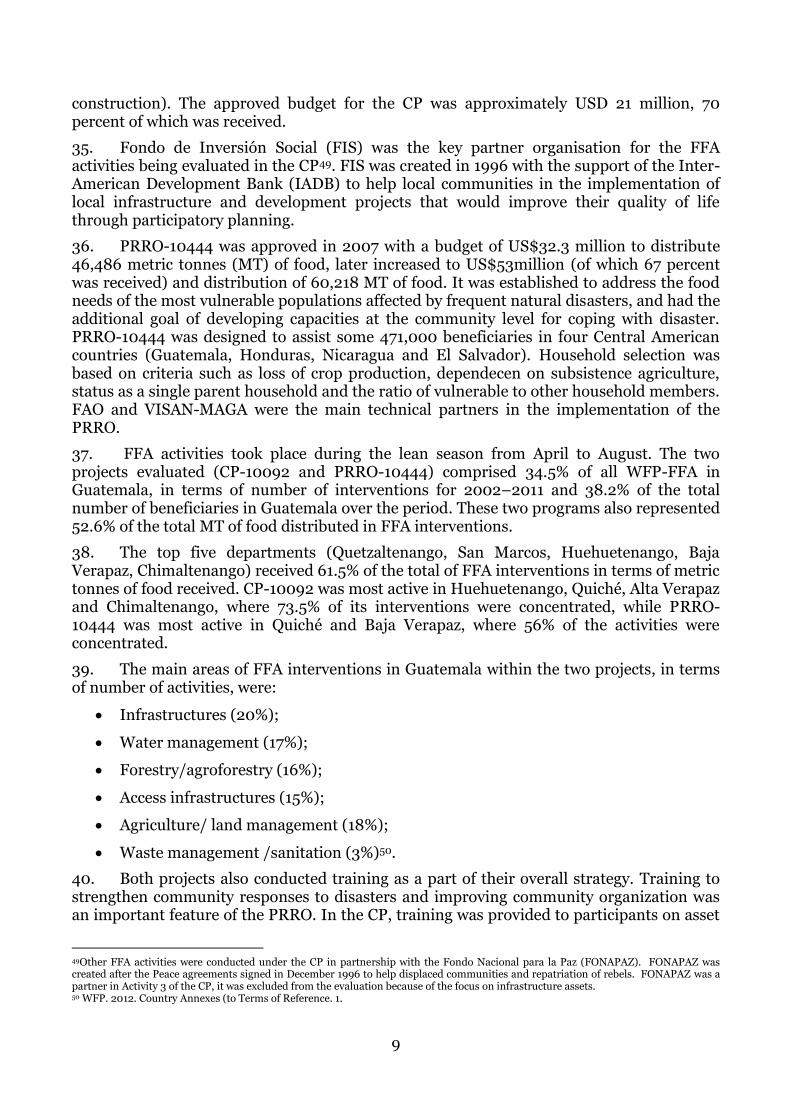
10
maintenance with particular emphasis on women‘s ownership of the assets. Distribution of intervention types across the two projects evaluated are shown in Figure 2.
Figure 2:. Number and type of FFA interventions
68
34
41
27
42
12
18
44 42
68
30
2 3
Reg PRRO 10444.0 CP 10092.0

11
2 Results: Outcomes and Impacts of FFA
2.1. Characteristics of beneficiaries and comparators
41. Characteristics of beneficiary and comparison communities included in the evaluation are shown in Table 2.
42. Literacy levels were similar in both beneficiary and comparison group communities at just over 61%. In both groups, literacy rates for men are 12% higher than for women. Illiteracy is often used as an explanation for the lower levels of participation of women in the community. Women’s literacy levels also have an impact on child malnutrition—the higher the level of women’s literacy, the lower will be the level of malnutrition in a family (IVISAN 2011).
Table 2: Comparison of population and literacy
Criteria
Beneficiary Communities Comparison Communities
Men Women Total Men Women Total
Average community population
382 397 779 170 176 346
Total population 14,127 14,690 28,824 3,059 3,170 6,234
Literacy rate 67.2% 55.2% 61.1% 67.2% 55.4% 61.2%
Source: VAM 2012
43. Women constitute 51% of the population for beneficiary and comparison groups, identical to the whole population. Women were head of household for 30.5% of the beneficiary group and 27.5% for the comparison group, the main reason being husbands lost during the civil war. Some women were managing the household because the man had migrated for work.
44. Poverty was broadly similar for the two groups, with the percentage below the poverty line slightly higher in the beneficiary communities than in the comparison communities (29.6% vs 26.8%). The rate of chronic malnutrition was roughly similar (65.3% vs 64.5%). See Table 3.
Table 3: Comparison of poverty, health and malnutrition
Criteria
Beneficiaries Comparison
% people living below poverty line 29.6 26.8
Health units per 10,000 population 2.1 1.9
% chronic malnutrition 65.3 64.5
Source: VAM 2012
45. Household characteristics for participants and non-participant households in the beneficiary communities were similar to one another and to the comparison households for many measures as would be expected due to sample selection. See Table 4. However, participants were significantly more likely to have electricity than non-participants (but not compared to comparison households). Participants were more likely than non-participants and comparisons to have a household toilet and to have running water in the home.
Table 4: Comparison of household characteristics

12
Characteristic Beneficiary Group Comparison Group
Difference
Participants A
Non-participants B
C
A-B
A-C
Household size (mean)
5.51 5.40 5.31 NS NS
No adult male in the HH (%)
12.3 11.5 13.0 NS NS
Adult male with secondary education (%)
43.2 37.6 43.1 NS NS
Adult female with secondary education (%)
66.0 63.6 61.8 NS NS
House floor is concrete (%)
34.3 29.1 31.1 NS NS
Have electricity (%)
71.0 61.6 65.6 P<.01 NS
Have sanitary waste disposal system (%)
51.9 36.5 44.0 P<.01 P<.05
Have running water (%)
77.2 56.7 59.7 P<.01 P<.01
2.2. Assets created
46. A range of asset types including agriculture and land management, forestry/agroforestry, water management, access infrastructure and other infrastructure were found in the villages visited by the evaluation team, as shown in Table 5 below. These included household level assets, community assets and activities classified as assets by the WFP-GCO—the latter were considered by the evaluation team to be better classified as demonstrations of new practices or training rather than physical assets. In order to assess these, it is useful to consider the extent to which the practice is still being employed in communities in which is introduced and the extent to which the practice is spread.
Table 5: Overview of Assets Found
Asset Asset Category Type of asset
Demonstrations
Home gardens Agriculture/land management
Household X
Trench composting Agriculture/land management
Household X
Live barriers Agriculture/land management
Household
Dead barriers Agriculture/land management
Household
Household terraces Agriculture/land management
Household

13
Asset Asset Category Type of asset
Demonstrations
Continuous terraces Agriculture/land management
Household
No slash and burn Agriculture/land management
Community X
Massal selection of basic grains51
Agriculture/land management
Community X
Bench terraces Agriculture/land management
Community
Tree planting Forestry/agroforestry Household
Agroforestry systems/tree gardens
Forestry/agroforestry Household
Forestry/tree gardens Forestry/agroforestry Community
Seedling nursery52 Forestry/agroforestry Community
Drainage/ infiltration ditches
Water management Household
Improvement of agricultural infrastructure
Infrastructure Community
Opening roads Access infrastructure Community
Retaining walls Infrastructure Community
47. The ET’s assessment of whether assets reported to have been created are still surviving is presented in Table 6. Survival of the different assets overall was generally good, above 50% (with 3 exceptions; Tree-planting, Bench terraces and Seedling nurseries). Rates of survival over 75% were found mostly in household owned assets as compared to community assets. Different kinds of assets would have different expected years of useful life. So, for example, well-constructed and well-maintained bench terraces would be expected to survive for many years, while a seedling nursery might justifiably be abandoned once it has served its purpose of supplying trees for outplanting. In semi-structured interviews, WFP personnel said that although larger infrastructure assets such as stone walls and continuous and bench terraces offered greater productivity and long-term potential, they were also more difficult to construct and maintain.
Table 6: Asset survival
Asset Category Type of asset
No. of assets
reported
No. of assets found
% surviving
Home gardens Agriculture/land management
Household 35 31 89
Agroforestry systems/tree gardens
Forestry/Agroforestry Household 25 22 88
Trench composting Agriculture/land Household 38 33 87
51 Selección masal: Massal selection is a breeding method wherein a large number of plants having the desirable traits are harvested individually from a standing crop. The seeds from all selections are then bulked. From the bulk, a seed sample is taken and used to plant a population from which desirable plants are selected at maturity. The procedure is repeated for several cycles until the population becomes uniform and homogeneous. 52 The idea is to build a seeding nursery big enough to raise 1500 seedlings.

14
Asset Category Type of asset
No. of assets
reported
No. of assets found
% surviving
management
Dead barriers Agriculture/land management
Household 14 12 86
Opening roads Infrastructure Community 5 4 80
Live barriers Agriculture/land management
Household 21 16 76
Continuous terraces Agriculture/land management
Household 4 3 75
Drainage/ infiltration ditches
Water management Household 22 16 73
Forestry/tree gardens Forestry/Agroforestry Community 5 3 60
Improvement of agricultural infrastructure
Forestry/Agroforestry Community 12 7 58
Massal selection of basic grains
Forestry/Agroforestry Community 13 7 54
Retaining walls Infrastructure Community 4 2 50
Household terraces Agriculture/land management
Household 2 1 50
Tree planting Forestry/Agroforestry Household 12 5 42
Seedling nursery Forestry/Agroforestry Community 4 1 25
No slash and burn Forestry/Agroforestry Community 16 12
Bench terraces Infrastructure Community 3 1
48. Individual survey respondents reported trench composting and home gardens as the two most common assets created. On average, each participant household reported 2.27 different assets (that they either worked to build or that were created for them) from which they have benefitted. Drainage and infiltration ditches were commonly shared among the community, while most of the other assets reported were generally not shared as shown in Table 7.
Table 7: Asset use among beneficiaries and community members
Type of assets % of respondents who reported the asset is for
household use
% of respondents who share asset with community
Drainage/infiltration ditches 93.4 91.2
Tree planting 92.0 17.4
Live barriers 85.7 19.1
Dead barriers 82.5 22.7
Trench composting 66.1 28.9
HomeHome garden 59.5 32.3
49. As shown in Table 8, assets were reported to the ET as remaining functional and being “very useful”. Household contributions to the maintenance of the asset depended on

15
the nature of the asset. For example, drainage and infiltration ditches were well maintained, home gardens to a lesser extent. This may be because family nurseries, having generated seedlings for planting out, had outlived their usefulness.
Table 8: Functionality and use of assets (% of respondents among those who reported assets)53
Type of assets Asset functional
Asset very useful
Asset for household usea
Asset shared with communityb
Home gardens 97.6 97.5 59.5 32.3
Trench composting 98.9 97.2 66.1 28.9
Live barriers 100.0 98.5 85.7 19.1
Dead barriers 100.0 98.3 82.5 22.7
Tree planting 95.6 100.0 92.0 17.4
Drainage/infiltration ditches
93.0 100.0 93.4 91.2
50. Overall, based on the triangulation of information from various sources, including WFP personnel the most successful interventions, both in terms of percent surviving and utility, were home gardens and trench composting. Assets with poor survival were more frequently community assets than household assets. As shown in the following table, respondents to the household survey reported variable participation in asset maintenance. Most reported that WFP assists in asset maintenance. 51.3% of respondents reported maintaining assets by the beneficiaries themselves, 39.5% said that it was a family responsibility and 6.6% reported that nobody was maintaining the assets.
Table 9: Asset Maintenance Responsibilities
Type of assets
Household participates in maintenance (%)
WFP assists in maintenance (%)
Home gardens 57.7 96.7
Trench composting 62.1 96.8
Live barriers 98.6 96.4
Dead barriers 65.0 93.9
Tree planting 87.2 97.8
Drainage/infiltration ditches 92.3 89.5
51. Days of work dedicated to building assets in exchange for food varied from less than 5 days to more than 40 days. Most respondents worked for between 5 and 20 days. See Table 10.
Table 10: Days of work in exchange for food
1–5 days 5–10 days 10–20 days 20–40 days > 40 days
15.5% 26.3% 25.9% 13.9% 18.4%
53 Assets acknowledged by less than 1% of the beneficiaries are not presented in the table

16
2.3 Biophysical and productivity outcomes
52. Outcomes and impacts in relation to geophysical and productivity changes were assessed through respondent perceptions, because baseline biophysical data were not available at the community level. HH survey results were triangulated with information from the FG and the AA.
53. With respect to positive biophysical changes, 75.4% said that they had experienced less soil loss and 67% said that vegetation coverage was better. Overall agricultural productivity had increased for 74.1% of respondents, and 48.2% said that there were more trees thanks to the WFP program. Production of tree crops had improved for 36.7% of the beneficiaries, while other productive activities, such as animal husbandry, had improved for 27.7%. On the negative side, 75.7% of respondents said that water availability had not improved, while flooding remained a problem for 70.8%. Table 11 gives a more detailed breakdown, by number of assets that the respondent had benefitted from. This suggests that the more assets, the more likely to report an improvement.
Table 11: Biophysical outcomes
Biophysical benefit % of households reporting benefits
Any One type of asset
Two types of assets
Three types of
asset
Four types of assets
Less soil loss 75.4 56.5 67.6 96.7 94.8
Better agricultural production 74.1 54.8 70.5 85.7 91.4
More vegetation covered 67.0 48.4 64.7 74.7 84.5
More trees 48.2 37.1 40.7 60.4 72.4
More products from trees 36.7 35.5 29.5 46.2 53.4
Less flooding 29.2 24.2 22.0 42.9 43.1
More water is available 24.3 24.2 17.0 37.4 34.5
2.4 Food security outcomes
54. Table 12 below summarises the outcomes with respect to diet. In the previous week, participants had consumed beans more often than non-participants, and participants and non-participants had consumed beef, eggs or fish more often than comparison communities.
55. Dietary diversity scores did not differ among the three groups although, participants consumed statistically significantly more beans than participants in non-intervention communities, and non-participants in beneficiary communities consumed more beef, egg and fish than comparisons. Similar findings come up when the data is disaggregated by sex with some slight differences: in addition to beans and beef, egg and fish, men from the participant group eat more oil or other fat than comparison group. As for women, the difference in consumption of beans is no longer significant and at a low significance rate, women from the beneficiary group eat less green vegetables than women from the comparison group. Food consumption scores (FCS) did not show any statistically significant difference between beneficiary communities and comparisons. All FCS were in the acceptable range, but caution should be used in interpreting this, since the survey was taken during the harvest season. Even during the harvest season dietary diversity was less than

17
optimal, with vegetables, fruits, animal proteins including milk products making up only a small proportion of the diet (between 3-7%).
Table 12: Dietary Diversity and Food Consumption
Beneficiary Group Comparison Group
Difference
Participants
A
Non-participants
B
C
A-C
B-C
In the past week, number of days had food items (mean) a
Cereals 6.89 6.86 6.94 NS NS
Potatoes 1.33 1.37 1.44 NS NS
Beans 5.33 5.04 4.99 P<0.05 NS
Green vegetables 2.14 2.21 2.30 NS NS
Fruits 1.47 1.52 1.66 NS NS
Beef, egg, fish 1.54 1.63 1.36 NS P<0.05
Milk or milk products 0.89 0.85 0.86 NS NS
Sugar/ sugar products 6.49 6.54 6.48 NS NS
Oil or other fat 3.61 3.48 3.41 NS NS
Dietary diversity score b 29.61 29.23 29.38 NS NS
a-The figures are average number of days had each food item in the last seven days. b-Dietary diversity score is the sum of number of days had all 9 food items in a 7 day period (score ranges from 0 to 63).
Table 13: Dietary Diversity and Food Consumption (Male respondents)
Beneficiary Group Comparison Group
Difference
Participants
A
Non-participants
B
C
A-C
B-C
In the past week, number of days had food items (mean) a
Cereals 6.96 7.00 6.95 NS NS
Potatoes 1.67 1.80 1.78 NS NS
Beans 5.19 4.81 4.68 P<0.10 NS
Green vegetables 2.28 2.11 2.25 NS NS
Fruits 1.68 1.59 1.78 NS NS
Beef, egg, fish 1.61 1.27 1.27 P<0.05 NS
Milk or milk products 0.89 0.67 0.93 NS NS
Sugar/ sugar products 6.59 6.73 6.55 NS NS
Oil or other fat 3.83 3.62 3.22 P<0.05 NS
Dietary diversity score b 30.63 29.47 29.39 NS NS

18
Beneficiary Group Comparison Group
Difference
Participants
A
Non-participants
B
C
A-C
B-C
a-The figures are average number of days had each food item in the last seven days. b-Dietary diversity score is the sum of number of days had all 9 food items in a 7 day period (score ranges from 0 to 63). c-
Table 14. Dietary diversity and food consumption (Female respondents) Beneficiary Group Comparison
Group difference
Participants A
Non-participants
B
C A-C B-C
In the past week, number of days had food items (mean)
Cereals 6.85 6.80 6.93 NS NS Potatoes 1.18 1.21 1.27 NS NS Beans 5.39 5.11 5.15 NS NS Green vegetables 2.08 2.25 2.32
P<0.10 NS
Fruits 1.38 1.48 1.60 NS NS Beef, egg, fish 1.50 1.75 1.40 NS P<0.05 Milk or milk products 0.89 0.92 0.82
NS NS
Sugar/sugar products 6.45 6.47 6.45
NS NS
Oil or other fat 3.51 3.43 3.51 NS NS Dietary diversity score 29.16 29.13 29.37
NS NS
Table 15: Further analysis on FCS54
Participant Non-participant Comparison
Poor 1.56 1.02 1.02
Borderline 13.62 17.63 19.13
Acceptable 84.82 81.36 79.85
Among beneficiaries, 38.2% consumed vegetables produced on their own land compared to only 28.4% respondents from comparison group communities. 23% of respondents from beneficiary communities produced their own potatoes compared to 13% from comparison
54 FCS’ % were calculated according to WFP VAM technical guidelines. Food Consumption Score uses weighted values for each food group (Poor 0-21; Borderline 21.5-35; Acceptable >35). The thresholds for Guatemala are generally 28-42 as there is a high consumption of sugar and oil.
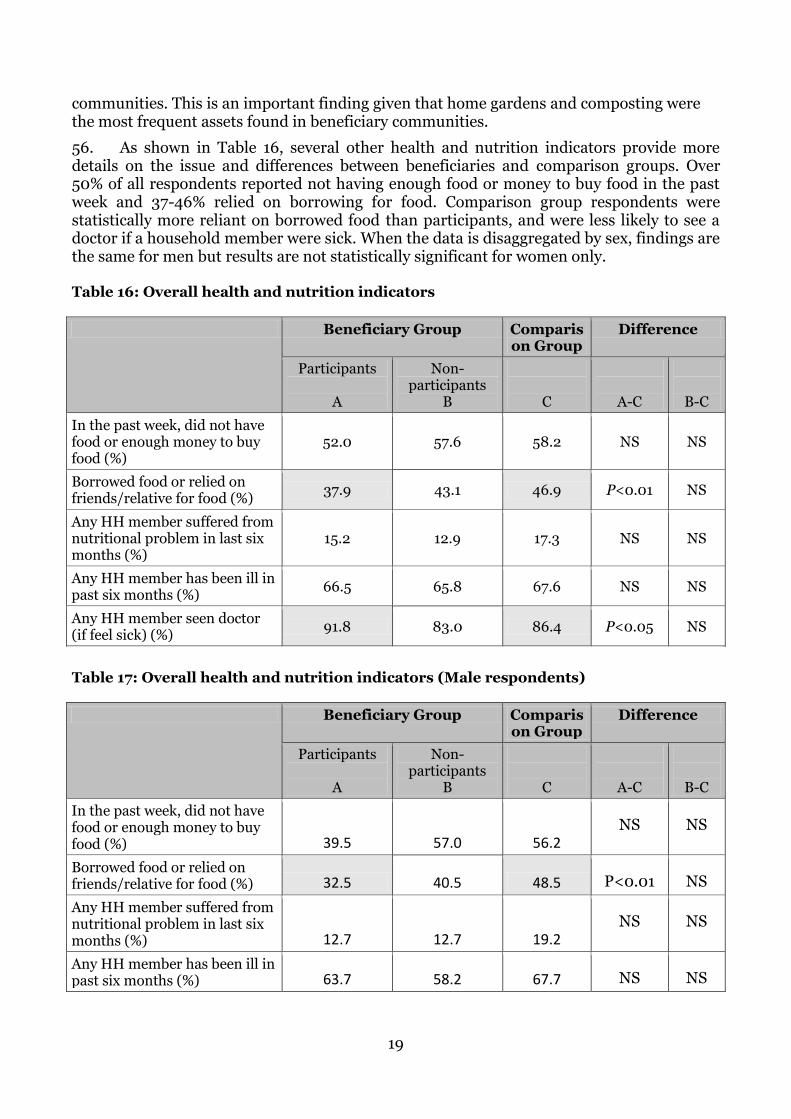
19
communities. This is an important finding given that home gardens and composting were the most frequent assets found in beneficiary communities.
56. As shown in Table 16, several other health and nutrition indicators provide more details on the issue and differences between beneficiaries and comparison groups. Over 50% of all respondents reported not having enough food or money to buy food in the past week and 37-46% relied on borrowing for food. Comparison group respondents were statistically more reliant on borrowed food than participants, and were less likely to see a doctor if a household member were sick. When the data is disaggregated by sex, findings are the same for men but results are not statistically significant for women only. Table 16: Overall health and nutrition indicators
Beneficiary Group Comparison Group
Difference
Participants
A
Non-participants
B
C
A-C
B-C
In the past week, did not have food or enough money to buy food (%)
52.0 57.6 58.2 NS NS
Borrowed food or relied on friends/relative for food (%)
37.9 43.1 46.9 P<0.01 NS
Any HH member suffered from nutritional problem in last six months (%)
15.2 12.9 17.3 NS NS
Any HH member has been ill in past six months (%)
66.5 65.8 67.6 NS NS
Any HH member seen doctor (if feel sick) (%)
91.8 83.0 86.4 P<0.05 NS
Table 17: Overall health and nutrition indicators (Male respondents)
Beneficiary Group Comparison Group
Difference
Participants
A
Non-participants
B
C
A-C
B-C
In the past week, did not have food or enough money to buy food (%) 39.5 57.0 56.2
NS NS
Borrowed food or relied on friends/relative for food (%) 32.5 40.5 48.5 P<0.01 NS
Any HH member suffered from nutritional problem in last six months (%) 12.7 12.7 19.2
NS NS
Any HH member has been ill in past six months (%) 63.7 58.2 67.7 NS NS

20
Beneficiary Group Comparison Group
Difference
Participants
A
Non-participants
B
C
A-C
B-C
Any HH member seen doctor (if feel sick) (%) 91.0 80.4 81.8 P<0.10 NS
Table 18: Overall health and nutrition indicators (Female respondents)
Beneficiary Group Comparison Group
Difference
Participants
A
Non-participants
B
C
A-C
B-C
In the past week, did not have food or enough money to buy food (%) 57.4 58.1 59.2
NS NS
Borrowed food or relied on friends/relative for food (%) 40.3 43.7 46.2 NS NS
Any HH member suffered from nutritional problem in last six months (%) 16.2 13.0 16.4
NS NS
Any HH member has been ill in past six months (%) 67.8 68.4 67.6 NS
NS
Any HH member seen doctor (if feel sick) (%) 92.1 83.7 88.7 NS NS
57. As shown in Table 19 below overall Coping Strategies (CS) did not differ between beneficiary and comparison groups. However, there were differences in some elements. Beneficiaries rely more on “less preferred and less expensive food” while members of the comparison group rely more on “restriction of consumption by adults in order for small children to eat”. Restriction of food consumption by adults is considered to be the highest severity weight of different coping options. When data is disaggregated by sex, in the beneficiary group, men use these coping mechanisms less than women. Men have a lower overall CSI than women in both intervention and comparison groups. Caution should be used in interpreting the CSI because it is affected by short term factors and because the data was collected during the harvest period.
Table 19: Coping Strategy Index: Weighted score (Mean)
In the last seven days how often has your household had to:
Beneficiaries Comparison
Overall Male Female Overall Male Female
Rely on less preferred and less expensive food?
4 3 4 3 4 3

21
In the last seven days how often has your household had to:
Beneficiaries Comparison
Overall Male Female Overall Male Female
Borrow food, or rely on help from a friend or relative?
3 3 3 3 3 4
Limit portion size at mealtime?
2 2 2 2 2 2
Restrict consumption by adults in order for small children to eat?
4 3 5 5 4 5
Reduce number of meals eaten in a day?
1 1 1 1 1 1
Total Coping Strategy Index (sum of the weighted scores)
14 11 13 14 12 14
58. Considering only those respondents who had indeed borrowed food, the percentage who borrowed was similar for both groups up to 12 months in the past, but was substantially greater for comparison communities in the more distant past between 18 months and 2 years ago, as shown in Table 20.
Table 20: Borrowed food or relied on friends and relatives for food
Did your household borrow food or rely on friends and relatives for food?
3 months 6 months 12 months 18 Months 2 years
Beneficiaries 83.9% 23.6% 11.2% 3.7% 5.7%
Beneficiary Male 74.7% 22.9% 8.4% 3.6% 4.7%
Beneficiary Female 85.7% 23.8% 7.9% 3.2% 6.1%
Comparison 83.2% 23.4% 11.4% 4.9% 10.6%
Comparison Male 87.0% 23.9% 12.2% 3.8% 6.0%
Comparison Female 81.8% 23.1% 13.2% 5.8% 12.6%
2.5 Resilience
59. As shown in Table 21 beneficiary and comparison communities alike were at moderate risk of becoming victims of climate hazards and natural disasters over the past decade, with drought, frost, earthquake and hurricane being the disasters that most affected both participant and comparison communities. Beneficiaries had faced flooding significantly more often than comparisons, but earthquakes significantly less often. Drought was reported somewhat less often among beneficiary households than among comparison households and more often in comparison communities.

22
60. Preparedness for disaster was significantly higher among participant households than among comparison households.
61. The focus groups, like the households, shared a perception of vulnerability to natural disasters. Although some communities from beneficiary and comparison groups had received training in disaster preparedness, overall community leaders and women’s leaders in both groups felt unprepared, with few resources at their disposal to face such challenges.
Table 21: Shock occurrence
Beneficiary Group Comparison Group
Difference
Participants
A
Non-participants
B
C
A-C
B-C
Whether faced any crisis in last two years (%)
67.5 60.3 66.1 NS NS
Whether faced hurricane (%) 20.8 23.4 21.2 NS NS
Whether faced flooding (%) 9.5 7.1 5.1 P<0.05 NS
Whether faced landslides (%) 18.5 19.7 18.1 NS NS
Whether faced earthquake (%) 20.4 23.4 31.6 P<0.01 P<0.05
Whether faced drought (%) 35.0 33.6 41.1 NS P<0.05
Whether faced frost (%) 30.4 30.5 30.6 NS NS
Households better prepared for disasters (%)
32.3 27.1 21.4 P<0.01 NS
62. Some survey respondents reported that their losses due to disasters had been reduced since or because of the WFP FFA intervention but the majority reported no reduction as shown in Table 22 below.
Table 22: Reduction in losses due to disasters (% of respondents in participant communities)
Type of disaster Reduced a lot Reduced Not reduced Hurricane 3.0 26.0 71.0 Flood 1.6 26.4 72.0 Landslide 3.5 21.0 75.5 Earthquake 1.7 17.2 81.1 Drought 5.3 22.7 72.0 Frost 3.3 24.4 72.3
2.6 Livelihood and migration outcomes
63. Secondary data from the VAM 2012 indicate that similar proportions of beneficiary households and comparison households live below the poverty line (29.6% vs 26.8%). HHS data reveal that 47% of households live on less than 500 quetzals per month (about US$64 or €45), 37% live on 501 to 1,000 quetzals per month, and 15% live on more than 1,001 quetzals (US$128 or €101) per month.
64. Total money earned by all household members during the past 12 months (not including credit) averaged 644 quetzals (US$82.37) for beneficiaries and 638.90 quetzals (US$81.70) for comparisons. The difference, in real terms is not significant. (P<0.01).

23
65. Data from household surveys related to several livelihood indicators are shown in Table 23. There was no difference between participant beneficiaries and comparisons in the proportion of households that farmed their own land, but this proportion was significantly lower among non-participant beneficiaries than among comparisons (67.5% vs 74.7%, P<0.05).
66. Significantly more participants in beneficiary communities report that their livelihoods improved in the past few years than non-participants and comparisons, and the vast majority of beneficiary survey respondents 95.4%) attribute the improvement to WFP-FFA work. More than half of the participant households (56.6%) say that the WFP asset helped to increase income. Actual earnings, however, did not differ significantly among the groups, although there was some suggestion that the number of households earning more than 500 quetzals per month was higher among participants than comparisons (P<0.1).
67. Migration was reduced among participant beneficiaries, both in terms of the number reporting any household member migrating and in the number saying that migration had reduced over the past year. In focus group discussions, community leaders said that WFP-FFA interventions did not have a major impact on the livelihoods of the community as a whole, but that they may have had an impact on specific families. Women interviewed tended to perceive more positive outcomes and impact from the benefits of growing their own vegetables and fruit, which may be related to the lead role that women have in gardening. In comparison communities, both leaders and women expressed an acute vulnerability to climate hazards such as frost and drought, resulting in privation during these periods and the need to migrate in order to generate enough income to survive.
Table 23: Impact on livelihood and migration
Beneficiary Group Comparison
Group Difference
Participants
A
Non-participants
B
C
A-C
B-C
Livelihood has improved in the past few years (%)
76.9 35.3 31.4 P<0.01 NS
Household earned more than 500 quetzals monthly last year (%)
54.7 50.2 48.7 P<0.1 NS
Household farm own land (%)
72.6 67.5 74.7 NS P<0.05
Whether any HH member migrated last year (%)
30.5 29.2 37.5 P<0.05 P<0.05
Migration has reduced in the last one year (%)
16.0 14.9 8.9 P<0.01 P<0.05

24
2.7 Community organisation
68. Awareness of organisations serving the community was assessed for women and men separately. Among women, there were significant differences between participant beneficiaries and comparison communities in their awareness of community organizations, women's organizations and farmers' organizations. All households were equally unaware of youth associations and other groups. See Table 24.
Table 24: Impact on women’s awareness of community organizations
Beneficiary Group Comparison Group Difference
Women,
% aware of:
Participants
A
Non-participants
B
C
A-C
B-C
Community organization
99.2 96.3 88.2 P<0.01 P<0.01
Women’s organization
67.8 47.9 52.3 P<0.01
NS
Farmers' organization
15.7 13.0 7.3 P<0.01
NS
Youth association
5.0 4.7 3.1 NS NS
Other groups 7.6 6.5 7.3 NS NS
69. Men showed the same pattern of awareness about community organizations as women, although awareness of youth associations and other groups seems marginally higher. See Table 25.
25
Table 25: Impact on men’s awareness of community organizations
Beneficiary Group Comparison
Group Difference
Men,
% aware of:
Participants
A
Non-participants
B
C
A-C
B-C
Community organization
100.0 97.5 86.9 P<0.01 P<0.01
Women’s organization
74.5 48.8 49.2 P<0.01 NS
Farmers' organization
24.8 16.3 6.9 P<0.01 NS
Youth association
8.9 3.8 4.6 NS NS
Other groups 13.4 8.8 11.5 NS NS
70. Participation in community organizations was more prevalent among beneficiary participant households than among comparison households for both men and women. Among women, those in beneficiary participants were more likely than those in beneficiary non-participants and comparison groups to participate. See Table 26.
Table 26: Participation in community organisations
Beneficiary Group Comparison
Group Difference
Any member of the household participates
Participants
A
Non-participants
B
C
A-C
B-C
Among all respondents 46.5 28.5 34.9 P<0.01 NS
Among female respondents 42.3 20.9 31.7 P<0.01 P<0.05
Among male respondents 56.1 48.8 41.5 P<0.05 NS
71. Both men and women in beneficiary communities received more training in organizational management than in comparison communities, whether from WFP and from local organisations or other international organizations. See Table 27.
Table 27:: Training on organizational management received and source (% of survey respondents)

26
Men Women
Yes No Yes No
Beneficiaries
WFP 33.2 66.8 43.8 56.2
Local organisations 41.8 58.2 35.9 64.1
Other international organisations 23.3
76.7 30 70.0
Comparison
WFP 9.7 90.3 7.2 92.8
Local organisations 32.0 68.0 24.5 75.5
Other international organisations 13.0
87.0 11.3 88.7
72. One of the WFP-FFA activities was to deliver training intended to improve organisational and management capacities. Women from the beneficiary communities received significantly more of this type of training than women in the comparison groups. For men, figures did not differ. See Table 28. Table 28: Types of organisational training received
Have you receive training on one of the following subjects?
Men Women
Beneficiaries
Strengthening your organisation 41.5% 31.4%
Managing your organisation 31.5% 31.9%
Managing the finances of your organisation
17.7% 24.5%
Comparisons
Strengthening your organisation 44.3% 17.3%
Managing your organisation 30.2% 21.6%
Managing the finances of your organisation
16.5% 9.2%
2.8 Women’s empowerment
73. In four of the six years covered by the evaluation, more women than planned participated in FFA activities (see Figure 3). However, over all six years, women constituted an average of only 34 percent of total participants, compared with the planned 42 percent. WFP included a higher percentage of women participants than planned in only two years during the period evaluated.55
55 All figures in this paragraph are from WFP standard project reports.

27
Figure 3: Numbers of women participants, planned versus actual
74. The country office planned that women would assume leadership positions in food distribution committees, but annual goals for women’s leadership were not usually met (see Figure 4). However, the percentage of household food rations received by women at distribution points rose to 90 percent.
Figure 4: Women in leadership positions in food management committees, planned versus actual
75. 70.7% of HHS respondents were women in beneficiary communities and 66.8% in comparison communities. 32.3% of women in beneficiary communities reported being household heads, as compared to 23.5% in comparison communities.
76. FFA activities were expected to have a wide range of impacts on women and girls, some of them negative. For example, in some situations, pregnant or lactating women might take part in heavy manual labour through FFA activities, which could compromise their health or nutritional status and consequently have negative effects on infants and young children. More women than men (40.4% vs 17.1%) indicated that they needed to re-organise or reassign their daily activities, allocating chores to another household member, to participate in the FFA program.
77. The greatest difference in responses between beneficiary and comparison groups was related to women’s role in the community. As shown in Table 29, women in participant communities were more inclined than men to think that their empowerment had increased. Whereas women in the non-participant group were much less likely than men to believe
02 0004 0006 0008 000
10 00012 000
2003 2004 2005 2008 2009 2010
CP PRRO
Planned participants Actual participants
0%
10%
20%
30%
40%
50%
60%
70%
80%
90%
2003 2004 2005 2008 2009 2010
CP 10092 PRRO 10444
Planned
Actual

28
they were empowered. Substantially more participants than non-participants thought that women's empowerment had increased for all indicators presented in the table below for both men and women.
Table 29: Empowerment of women
% who think that:
Participants Non-participants
Male Female Diff Male Female Diff
Respondents’ roles in community affairs have improved
66.0 70.7 NS 6.9 7.2 NS
Women have more important roles in community affairs after interventions
82.0 89.0 P<0.1 25.0 19.8 NS
Women have better access to credit after interventions
61.2 66.1 NS 30.8 21.1 NS
Women play more important role in HH decision making
79.6 88.5 P<0.05 33.3 27.4 NS
Women play more important role in community decision making
76.7 85.2 P<0.05 28.1 27.5 NS
78. Focus groups of community leaders and representatives of women's organizations in beneficiary communities confirmed that the increased participation of women was the most important outcome and impact of FFA activities. In comparison communities, representatives of women's organisations spoke of their limited participation in community affairs.
A more active role of women was considered by many in the focus groups as a key factor contributing to the positive nutritional status of the family in comparison and beneficiary groups.

29
3. How does FFA create impact?
3.1. Contextual factors
79. Contextual factors include a number of background events and activities, including disaster frequency and partnerships at national and international level, might be expected to influence the impact of FFA activities.
Frequency of disaster and shocks affecting communities
80. Guatemala is a disaster-prone country, one of the 10 countries most vulnerable to climate change and natural disasters. Natural disasters appear with increasing frequency, associated with climate change, deforestation and population growth. Droughts or floods, for example, cause loss of crops or damage to roads that give access to markets. Disasters frequently push marginal households into acute food insecurity. Moreover, prevalence of acute malnutrition among children under five years old may increase by more than 10 per cent in the event of a shock.56 National institutions are minimal or absent in remote regions of the country and local authorities are the closest, most-accessible government presence.57
81. In response to disasters, poor people must resort to purchasing food and migrating to work on commercial farms in the country or abroad. The resilience and disaster preparedness of communities are affected by economic volatility, rising food prices and reductions in contingency food stocks and reserves, factors that are exacerbated by climate change.
Livelihood Zones
82. The evaluation assessed WFP’s work in five different departments, which covered six livelihood zones, including the vast central area of the “dry corridor”. As shown in the following table, the evaluation found that successful interventions where assets reviewed still existed and were fully functional were located in three livelihood zones; Basic grain cultivation/wage labour on the frontier with Honduras and El Salvador, High altitude fruits and vegetables, and Subsistence agriculture. Variable success was found in Zone 9. Basic grains and wage labor. Less successful on average were communities in the Zone 18. Mountains of Cuchumatanes, and the Zone 11. the coffee production zone. Significant proportions of the populations of all zones are poor or extremely poor, with no clear pattern emerging as to the relationship between poverty and asset success.
Table 30: Asset success by livelihood zone
Livelihood zone Asset
existence Asset
functionality % extreme
poor %
poor Zone 8. Basic grains/ Frontier with Honduras & El Salvador 100% 100%
60% 30%
Zone 16. High altitude fruits & vegetables 100% 95-100% 25% 53%
Zone 5. Subsistence Agriculture 95% 95% 25% 52%
Zone 9. Basic grains/ Wage labor 79-100% 79-100% 20% 50%
Zone 18. Mountains of the Cuchumatanes 35% 35% 40% 50%
Zone 11. Coffee production area 33% 33% 30% 45%
56 EUFF, 2011 57 USAID. April 28, 2011. Feed the Future FY 2011-2015 Multi-year Strategy. 46 pages

30
Complementarity with national and international institutions
83. The logic model for FFA impact assumes that WFP efforts are complementary to actions of other actors. This includes appropriate integration into local and national planning processes and addressing sector priorities and that complementary activities are undertaken to address other social and institutional issues aside from the assets themselves that contribute to food security. The ET interviewed international and national partners to assess the relevance of WFP-FFA interventions in relation to their own objectives.
Government of Guatemala: Food Security
84. In the FFA programs evaluated, the government of Guatemala was responsible for providing technical assistance, storage and handling and internal transportation to distribution points. However, the government was often unable to successfully assume these responsibilities, because of inadequate financial and personnel resources. This resulted in delays and post-delivery losses registered in warehouses. Elections resulted in very high turnover in government staff. Since WFP depended on government inputs that were not always forthcoming, this constrained WFP’s ability to act and affected WFP's efficiency and effectiveness.
85. WFP's requirement to work with government organisations gave it the opportunity to be influential at the policy level, especially with the most recently-elected government. The Comisión de Seguridad Alimentaria,58 el Frente Parlamentario Contra el Hambre,59 and la Mesa de Apoyo Técnico y el Observatorio del Derecho a la Alimentación60 recently (2012) collaborated with WFP to address the problem of lack of awareness about FNS on the part of public servants. WFP helped these entities to instruct public servants on the four key pillars: availability of food; access to food (physical and financial); consumption; and access to health care.
86. Since 2009, WFP has been a very active player in the Group of Agencies of Cooperation in the area of Food and Nutrition Security (Grupo de Cooperantes en Seguridad Alimentaria y Nutricional-GCSAN) that brings together nine bilateral agencies and four multilateral agencies and functions mainly as an information-sharing and action-coordinating network. It provides support and complements the more formal body called Group of Supporting Institutions (Grupo de Instituciones de Apoyo-GIA), which brings together government institutions and bilateral and multilateral institutions. Both networks work in compliance with the National Food and Nutrition Security System and the Food and Nutrition Policy and Strategic Plan. Since the adoption of the National Food Security Act in 2005, Guatemala has one of the most comprehensive institutional frameworks on FNS in Central America including a Law on National Food and Nutritional Security.
Government of Guatemala: Emergency Preparedness and Response
87. WFP worked closely with Coordinadora Nacional para la Reducción de Desastres (CONRED), mostly in crisis situations. CONRED comprises the National Council for Disaster Reduction, the Executive Secretariat and Board for Disaster Reduction and the Regional Coordinators at the departmental, municipal and local levels. CONRED coordinates 80 institutions, working together to support the population and follow a shared plan before, during and after any type of natural disaster or emergency.
58 Food Security Council 59 The Parliamentary Front Against Hunger 60 The Technical Round Table and Monitoring of Rights to Food Security

31
Multilateral organisations
88. WFP collaborates with many international organisations involved in FNS in Guatemala, including FAO, UNICEF, WHO, UNDP and IMO under the framework of UNDAF. Among those, FAO is particularly complementary to WFP’s role through its work in food production and commercialization. FAO was the main collaborating partner with WFP in the delivery of FFA under the PRRO, and provided technical assistance and agricultural inputs. According to interview respondents, collaboration with FAO had been fluid and based on common interests. Currently, the two organisations are working together on PRRO in six departments with 22,000 families. In the field, WFP and FAO shared and collaborated using common resources, and conducted joint visits and often cooperate on joint projects. WFP food assistance allowed FAO easier entrance into communities and helped FAO to sustain community interest with periodic distributions of food.
89. The majority of the members of the international community interviewed reported a high regard for WFP’s role in humanitarian assistance. Numerous national and international partners praised WFP's logistical capacity for the warehousing distribution and management of food, in both emergency and development responses. Many respondents from partner organizations argued for a differentiation between humanitarian assistance and recovery, or between reconstruction and development activities. Many considered that WFP’s interventions in long-term development activities overlapped with the role of other UN agencies and international donors.
90. In June 2011 WFP, FAO and IFAD signed a new Strategic Framework of Cooperation. Its main objective is “to increase the capacity of the international community to deliver effective, coordinated, timely and sustainable support to food security and nutrition”.61 The agreement should renew and broaden the collaboration among the three organisations.
91. By contrast, UNICEF's partnership with WFP is based on personal relationships rather than institutional collaboration, and this recent link between key personnel has improved the partnership. The latter was related to the school feeding component (i and ii) of, and to cross-cutting activities related to gender (pregnant and lactating women) in the CP. UNICEF was also a key national partner for the PRRO 10444. However, according to interviews, there is a lack of information sharing and openness to collaborating broadly. Given the potential for joint approaches and programs, especially related to disaster-risk management, this may result in missed opportunities.
Municipalities
92. Historically, relations between all governmental entities and local communities have been based on mistrust. Against that background, WFP benefitted from its positive reputation. Recent political processes have ushered in a new generation of municipal leaders. At the same time, new government strategies aim to strengthen the capacity of municipal bodies. The appointment at the municipal level of new extension staff from MAGA, responsible for technical assistance in the area of agriculture and nutrition, demonstrates this new commitment. Increasingly, municipalities are forming committees on women’s affairs and nutrition, and these offer opportunities for WFP to engage further.
93. Strengthening municipal FNS activities was crucial especially as their officials have a unique depth and breadth of knowledge about people’s needs, vulnerabilities, customs and preferences. Working with the mayor, the Office of Women, and the Office of Planning,
61 FAO, online. http://www.fao.org/news/story/en/item/80748/icode/ Accessed July 15th 2013.

32
COCODES proved to be effective, especially recognizing the communities’ capacity to decide, assess, prioritize and do the work.
Perspective on support provision at community level
94. The evaluation also assessed the complementarity of support from the perspective of the communities themselves, through focus group discussions specifically related to institutional support.
95. As shown in the figure below, overall few communities of the municipalities visited reported having received support from various sources. Most reported far fewer support in areas most closely associated with areas where WFP worked. At most 25% of communities reported any support for disaster assistance from other sources, less than 10% of communities reported support with disaster response and less than 25% in terms of food aid. There is little duplication of effort at the community level, most communities who reported support at all, reported that it was provided by only one type of provider for each support area. Government was the most important provider of support.
Figure 5. % of participating communities reporting support (area of support and type of support provider)
96. Comparing the situation in beneficiary communities with non-intervention communities as shown in Figure 6 below, most comparison communities received very little support in emergency preparedness, emergency response or food aid and overall less support was reported than from beneficiary communities. Thus WFP appears to have filled a gap that otherwise might not have been filled. Government was fairly active in comparison communities in terms of provision of health and hygiene activities.
05
101520253035404550
Multilateral Organization - Beneficiary
International Bilateral Organization -Beneficiary
International NGO - Beneficiary
Government Institution (national) -Beneficiary
National NGO - Beneficiary

33
Figure 6. % of Comparison communities reporting support (area of support and type of support provider)
3.2. Implementation factors
97. The success of WFP-FFA interventions depended on a variety of implementation factors. An analysis of some of these is presented in this section.
Targeting
98. WFP GCO made substantial effort to target the “right” beneficiary communities. At the beginning of 2000, in collaboration with national and international institutions, WFP-GCO became a major actor in the development of better knowledge on nutrition in Guatemala. In 2002, the first Vulnerability Analysis and Mapping (VAM) report was issued in collaboration with SESAN and others. VAM was intended to permit identification of the level of food insecurity at departmental and municipal levels. VAM was a valuable tool that enabled WFP and others to target those areas where food assistance was most needed and to do so with greater efficiency and effectiveness.
99. While the VAM helped to identify areas of interventions with high chronic malnutrition, when they were hit by natural disasters, entire municipalities may be “most in need”. In emergencies, the needs of families already suffering chronic malnutrition were compounded by the natural disaster. WFP therefore had a dual role: respond to the neediest in chronic nutrition as well as respond to all in emergencies.
Technical quality and technical assistance
100. WFP played a major role in establishing standards and good practices for the implementation of the FFA programs. The Manual de Consulta de Normas Técnicas para la Implementatión de Actividades del Tipo Alimentos por Trabajo y Alimentos por Capacitación, issued by WFP in collaboration with FAO, SESAN and ProRural in 2010, was compiled on the basis of 15 years of WFP and MAGA experience in soil management and water conservation technologies.

34
101. The Manual has the potential to contribute to improved quality standards in Guatemala. However, the newly elected and appointed municipal authorities and technical advisors consulted knew little of the manual. Most of these advisers had recently been trained by MAGA in the capital for their new positions, and yet did not know of the Manual. Nor did MAGA staff in Guatemala City.
102. This raises the issue of who should provide the technical assistance needed in FFA activities. Interviews, discussions and focus groups all raised the need for on-going monitoring and extension in the construction and use of assets. When asked “What are the most important conditions to ensure the success and sustainability of asset construction, building and implementation?”, the most frequent answer was “Good sustained technical assistance”. MAGA was forced to dismantle its extension services in the mid-1980s by international financial institutions, who favoured a private-sector approach for food production and marketing based on medium and large producers. As a result, all government-related technical and agricultural extension assistance provided to poor farmers was eliminated. The burden then fell on WFP, FAO, USAID and other international organisations, which obviously raises a sustainability issue. These organisations either used their own technical expertise or contracted with local and international providers to deliver technical assistance. USAID was able to contract American VSO-NGOs. However, WFP was mandated and obliged to work with government institutions such as FIS, FONAPAZ and others who were essentially incapable of providing full support. Eventually, given the duress of this restriction, and the difficulties of finding a government partner, WFP was eventually legitimately allowed to work with NGOs.
103. Because of its limited presence in the field, WFP did not control all the elements of its interventions. WFP was in charge only of food distribution and monitoring, while the counterpart (e.g. the FONAPAZ and the FIS and other NGO partners) was responsible for technical assistance. In the organizational system observed through this evaluation, WFP had the ultimate responsibility for the projects including technical assistance but no direct control over it.
104. When WFP worked with a partner in technical assistance, an annual work plan was agreed. NGOs generally proved to be good at implementation when WFP paid for their participation. In the case of government partners, it was understood that the government would provide technical assistance as stated in the WFP country agreement. However, the nature, timing, adequacy and quality of technical assistance varied and it was sometimes less systematically implemented because of under-resourcing of the government partners.
Duration of interventions
105. A general consensus emerged from focus groups and interviews at the municipal level that interventions in their community were very short. Based on the information provided by WFP staff about WFP programme types, PRRO projects are more short-term, lasting a few weeks or months. CP projects, by contrast, last longer, but may be hampered by the level of partner capacity and interest, and most importantly, by donor funding. Two desk reviews carried out by the evaluation team illustrate the different approaches to length of engagement with communities. USAID tends to support longer projects with an on-going presence of technical assistance. Santa Rosa Pixabaj is exceptional as the longest WFP intervention, support having been provided for a 5 year period, which WFP staff consider one of their best interventions.
106. There is a fine balance to be struck. Not staying long enough may affect the success of the intervention or the sustainability of the assets built. Staying too long poses the risk of

35
dependency, where communities keep waiting for external assistance rather than mobilizing their own capacity and resources.
Decision making
107. Community organisations of different types played a role in making decisions about FFA activities. COCODES community organisations were most frequently involved, cited by 84% of respondents. Women’s organisations were mentioned less often (39.8% of respondents) but women also participate in community organisations such as COCODES. See Table 31 and note that respondents could indicate more than one decision-maker, hence the total is greater than 100%.
Table 31: Who participated in the decision-making regarding assets?
Decision-makers Frequency participation mentioned
Community organisation (COCODES) 84.0%
Local authorities 40.9%
Women’s organisation 39.8%
Families 36.2%
Development agency 11.8%
Political leaders 1.8%
Others 1.5%
108. While they recognized the value of WFP activities for community organisations, community leaders and representatives of women's groups said that the lack of follow-up and technical assistance were setbacks for the program. Beneficiary communities felt they were left to themselves after a quick in-and-out distribution. Women emphasised that assets must be diversified so as to respond more directly to their needs and interests (e.g., poultry production, seeds for home gardens, farmyard fences).
Training and Capacity Building
109. The implementation of FFA also included training and capacity-building efforts. Training aimed to meet immediate food security requirements as well as improve knowledge and contribute to maintenance of assets62. According to document reviews the use of food transfers stimulated participation in training and capacity building. 83% of survey respondents reported having received training on technical topics related to the assets, 14% on disaster preparedness and 5.7% in literacy. Over 85% of respondents reported that the training was very useful.
110. Several types of interventions, although classified as assets in WFP’s records, would be more accurately classified as demonstration activities to introduce new practices including, home gardens, trench composting, no slash and burn and massal selection of basic grains. In most cases these continue to “survive” i.e. be practiced in the communities. In fact home gardening and composting were the most frequently reported and appreciated in the communities visited.
62 Ibid. p. 2

36
111. In addition to benefitting the participating household, the introduction of new practices if successful might be expected to spill over onto non-participant households, and there was evidence that this was the case. For example, in Sutun, a beneficiary community in the municipality of Cubulco, some families said that although they had not benefitted from food distribution they had taken advantage of training opportunities offered to the whole community and as a result had learned to grow home gardens. In the community of Cantzela, following the WFP intervention, a sizeable proportion of the community began composting. This could also be an indirect effect of community members sharing assets with other members of the community. The survey data points to the fact that 31.5% of beneficiaries share their home gardens, 28.9% share their trench composting and 18.6% share their live barriers.
112. In the community of Las Guayabitas (in San Bartolomé Jocotenango, Quiché), a comparison community, the ET found evidence of live barriers, home gardens and trench composting among 50% of the families. Focus groups suggested that these families were influenced by the neighbouring community of Las Cuevas, a direct participant in the WFP program.
Type of assets
113. Household assets were generally more sustainable than community assets, because people “owned” their assets. In CP-10092 and PRRO-10444, there were in fact very few community assets built.
114. There are exceptions for example, some roads built to connect villages were damaged or destroyed by natural forces. Rehabilitating these community assets was in demand as communities need access to markets, schools, hospitals, etc. Despite their precariousness, roads as assets had an important impact. Communities also valued other built assets, such as community centres and health centres. However, the maintenance of potable water cisterns for the centres remains a concern. Assets that seem to work the best are those that contribute to food security, such as irrigation and terracing to minimize erosion, where productive benefits are soon visible.
115. The majority of beneficiary families live in mountainous areas, so the FFA interventions targeting—soil conservation, reforestation and agricultural productivity—remain the most highly functioning and beneficial assets.
Follow-up and monitoring systems
116. Monitoring processes and information management on interventions in the field are weak. The current lack of systematized data within the WFP office was highlighted by WFP staff as well as others, and is especially relevant given the lack of information at the municipal level. The difficulties encountered by the evaluation team in trying to establish a clear portrait of WFP-FFA interventions at the community level is an example. Much of the data and documentation was not was not readily retrievable. Until recently, monitoring had not been systematized. Furthermore, most (if not all) of the monitoring activities of the WFP-GCO, including the Standardized Project Report, focus on inputs and outputs instead of results. Some input and output data cannot be disaggregated for specific activities rather they are reported at the project level.
Participation of women
117. WFP is dedicated in its efforts to promote the participation of women in FFA interventions in Guatemala. In the planning and implementation of CP-10092 and PRRO-10444, women were clearly identified as beneficiaries, for example approximately 50% of FFA beneficiaries in the CP were women.

37
118. Standard Project Reports specifically mention the heavy workload and long hours often required of women, and how that limits the degree to which they could engage in extra activities. The project indicated that it supported the creation and control by women of assets that improved women’s livelihoods. Training was to be provided to strengthen women’s leadership and decision-making. PRRO-10444 was planned for equal participation of men and women as beneficiaries and participants, and results were generally positive. The Enhanced Commitments to Women Component prioritized the role of women in leadership positions in food distribution committees. As shown in the table below, most times, the annual goal was not met. However, participation of women in receiving household food rations at distribution points rose to 90%.
Table 32: Proportion of women in leadership positions in food management committees63
Project Year Planned Actual CP 10092.0 Activity 4
2003 50% 10% 2004 50% 30% 2005 0% 20%
PRRO 10444.0 Overall
2007 84% 50% 2008 40% 34% 2009 83% 22% 2010 33% 20%
119. In the creation of assets, changes were made to accommodate the fact that some work can be too strenuous for women. Originally in CP-10092 men were expected to help carry the heavy bags64 while women had to sign a receipt for the food delivered directly to them. In order to lighten the load for women, WFP monitors have tried to distribute food monthly. This is also easier to monitor and can minimize losses, which often occur through selling or through being intercepted in the process of larger distributions. Some women’s committees also participated in the food distribution, in which case additional food rations were given to women committee members for their efforts. Furthermore, experience in Guatemala demonstrated that when women are fully involved in the distribution of food, there was less potential for favouritism, political abuse of rations and sale of rations.
120. WFP chose to focus on the creation of home gardens, one of the most common assets created, in order to respond to the needs of women and their families.
121. NGO partners working in FFA said that it is important to work with women through COCODES. COCODES do, however, present a challenge for women’s participation as the organisations are usually composed of men. A majority of the COCODES visited by the ET included a relatively small proportion of women. The women’s committees, often a sub-entity of COCODES, serve as a space where women can play a more active and autonomous role. There are also cases where men and women decided together on agricultural and health issues. In some communities, a nutrition committee under the name of COCOSAN offers a greater possibility of ensuring a higher level of women’s participation.
122. One of the prevailing assumptions is that traditional gender roles (“machismo”) contribute to the difficulties in achieving results on the ground. These norms can be changed. IVISAN demonstrated that where women are trained and educated, there is less
63 Source: WFP Standard Project Reports 64 FFA bags traditionally weighed 50 kilos and women needed assistance in carrying these back home.
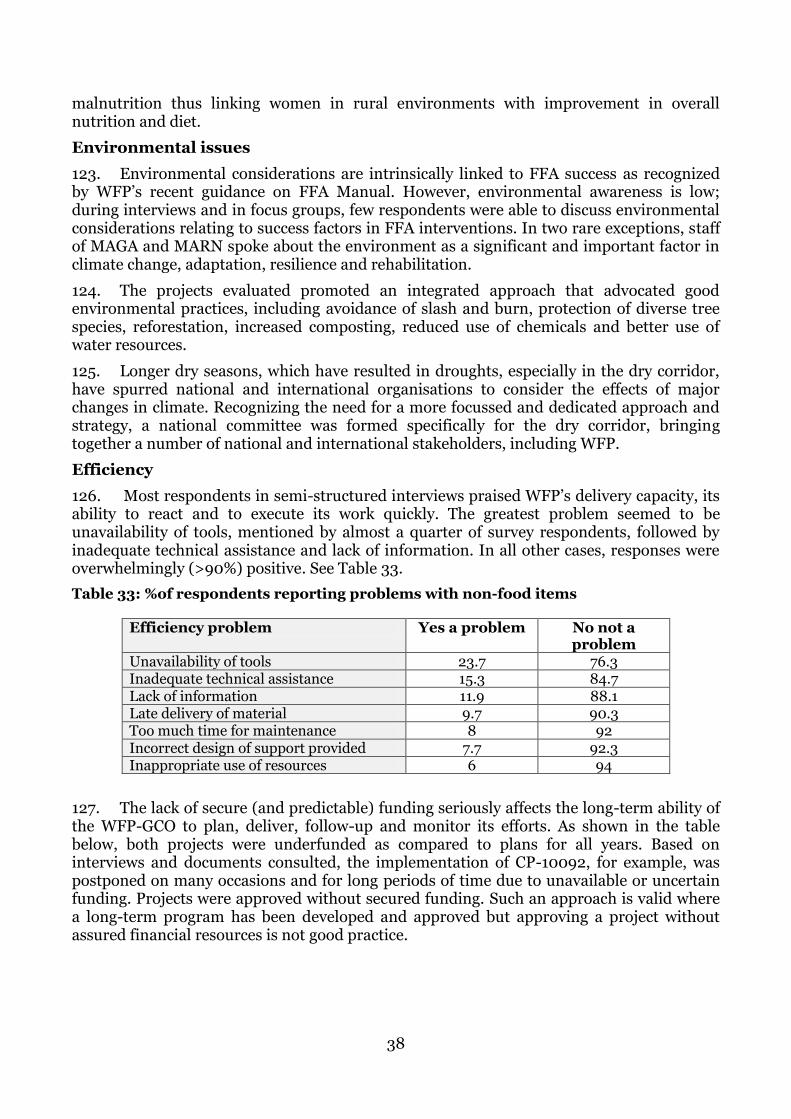
38
malnutrition thus linking women in rural environments with improvement in overall nutrition and diet.
Environmental issues
123. Environmental considerations are intrinsically linked to FFA success as recognized by WFP’s recent guidance on FFA Manual. However, environmental awareness is low; during interviews and in focus groups, few respondents were able to discuss environmental considerations relating to success factors in FFA interventions. In two rare exceptions, staff of MAGA and MARN spoke about the environment as a significant and important factor in climate change, adaptation, resilience and rehabilitation.
124. The projects evaluated promoted an integrated approach that advocated good environmental practices, including avoidance of slash and burn, protection of diverse tree species, reforestation, increased composting, reduced use of chemicals and better use of water resources.
125. Longer dry seasons, which have resulted in droughts, especially in the dry corridor, have spurred national and international organisations to consider the effects of major changes in climate. Recognizing the need for a more focussed and dedicated approach and strategy, a national committee was formed specifically for the dry corridor, bringing together a number of national and international stakeholders, including WFP.
Efficiency
126. Most respondents in semi-structured interviews praised WFP’s delivery capacity, its ability to react and to execute its work quickly. The greatest problem seemed to be unavailability of tools, mentioned by almost a quarter of survey respondents, followed by inadequate technical assistance and lack of information. In all other cases, responses were overwhelmingly (>90%) positive. See Table 33.
Table 33: %of respondents reporting problems with non-food items
Efficiency problem Yes a problem No not a problem
Unavailability of tools 23.7 76.3 Inadequate technical assistance 15.3 84.7 Lack of information 11.9 88.1 Late delivery of material 9.7 90.3 Too much time for maintenance 8 92 Incorrect design of support provided 7.7 92.3 Inappropriate use of resources 6 94
127. The lack of secure (and predictable) funding seriously affects the long-term ability of the WFP-GCO to plan, deliver, follow-up and monitor its efforts. As shown in the table below, both projects were underfunded as compared to plans for all years. Based on interviews and documents consulted, the implementation of CP-10092, for example, was postponed on many occasions and for long periods of time due to unavailable or uncertain funding. Projects were approved without secured funding. Such an approach is valid where a long-term program has been developed and approved but approving a project without assured financial resources is not good practice.

39
Table 34: Budget shortfalls65
Project Year Approved Budget
Confirmed Contributions
Actual financing
CP 10092.0
2003 16,255,867 4,355,020 26.79%
2004 16,225,610 6,104,555 37.62%
2005 15,728,492 8,657,519 55.04%
PRRO 10444.0
2007 32,304,021 3,476,679 10.76%
2008 40,230,002 16,481,679 40.97%
2009 42,372,410 35,306,668 83.32%
2010 51,628,711 36,781,325 71.24%
128. Financial deficit often put the WFP-GCO into survival mode. Communities said that their rations were not all received on time or in the quality and condition expected. Community focus groups said that they sometimes waited months for rations (food and seeds), especially during droughts, and the quality of seeds was also questionable (i.e. the seeds did not germinate). This contradicts survey respondents 95% of whom reported that food aid was received “on time”.
129. Certain WFP partner NGOs elaborated, saying that because WFP food assistance is not always available, they cannot properly plan and implement the project.
130. Other issues also affect efficiency. For example, Guatemala's status as a middle-income country potentially poses an additional challenge for WFP from a funding perspective. Further, this categorization also affects how funders and donors perceive the role of WFP in Guatemala.
131. At the municipality level, some participants asked whether it was worth investing so much time and energy in the asset construction for so little compensation, especially given that community members are expected to commit to work without receiving any reciprocal commitment from WFP as to the exact quantity of food or the exact date it is to be received. In one interview, government officials suggested that the FFW-FFA approach was not consistent with public policies regarding minimum salary, although that work undertaken is not really “remunerated” by food. As compared to planned norms, the planned ration for the PRRO was less for the maize commodity than the Guatemala work norms, as shown in Table 35 below.
Table 35: Ration for a family of 5 according to Guatemala Work Norms66 compared to PRRO Project Plan
Guatemala Work Norms PRRO Project Plan Kg % Kg % Maize 2000 71 1500 65 Beans 200 7 200 9
65 WFP Standard Project Reports - Project Overview Table
66 Manual for Technical Norms for Guatemala Food for Work and Food for Training 2010

40
Corn Soya Blend 500 18 500 22 Oil 100 4 100 4 Total 2800 100% 2300 100%
132. As a result of all the factors outlined above, the ET believes that WFP’s credibility with local, national and international could be at stake, a concern which was also documented in the SPRs.

41
4. Conclusions and Recommendations
4.1. Overall assessment
133. As outlined in the logic model that guided the evaluation, impacts were expected to address short term, medium term and long term objectives. The evaluation found that in the short term, WFPwas effective in reaching some 25,764 households in over 500 under-served communities with its FFA work, providing food in periods of both civil unrest and natural disaster and building useful assets. WFP’s was seen as an active and efficient player in the delivery of food assistance.
134. Three categories of community emerged from the data, with approximately equal number of communities in each:
a. Communities that completely or partially maintained the assets, which are still in use by more than 50% of the population. These were mostly from PRRO-10444;
b. Communities with partially maintained assets that benefitted fewer than 50% of the community;
c. Communities where the ET found no evidence of remaining assets; these were mostly from CP-10092. Time elapsed since the intervention and limited recall may explain this result.
135. Medium and longer term positive impacts were apparent in biophysical condition of land, disaster preparedness and livelihoods, including migration. Food security however did not seem to be improved substantially. These findings must be considered in light of the limitations of data. More details are discussed below.
The Food Consumption Score (FCS) and Dietary Diversity (DD) did not differ significantly between beneficiary and comparison communities, although significantly more beneficiaries grew their own vegetables, for personal consumption and sometimes for sale.
Beneficiary communities report being better prepared for natural disasters than comparison communities and they reported a reduction in losses due to disasters.
Beneficiary communities claimed their lives had improved in the past few years, and most people believed this was attributable to WFP-FFA intervention.
Migration was lower in beneficiary communities in the past year than in comparison group communities.
Decisions regarding choice of assets was mostly made in the communities and not imposed from the outside. COCODES and women’s organisations were more prevalent in beneficiary than comparison communities, and training opportunities were more available in beneficiary communities.
Women in beneficiary communities play a more active role. Their participation rate is significantly higher than the comparison group communities. Respondents in beneficiary communities agreed that the most important outcome and impact on community organisations was the increased participation and decision making of women.
136. Issues of concern include the following:
Improvement was not fully evident in FCS, dietary diversity or coping strategies.
Overall, communities maintain a sense of vulnerability and lack of preparedness.

42
External support of different kinds from different providers is sparse, although it appears to be somewhat better in beneficiary communities than comparisons.
Maintenance arrangements for assets are not clear. This is less of an issue for easily maintained household assets such as gardens for example.
137. WFPs efforts were characterized by large numbers of small interventions, many of which were private assets such as home gardens. Though well targeted to individual women, these types of assets are too small to stimulate significant changes in livelihoods or food security.
138. Evidence pointed to problems with asset maintenance and functionality, partly linked to poor quality of asset construction and a lack of clarity as to responsibilities for asset maintenance and technical oversight during planning and construction. These issues are particularly important for larger assets that could have a more transformative effect on communities. A smaller number of longer term interventions could also help to ensure higher technical quality and enable maintenance arrangements to be developed.
139. Because FFA interventions targeted women as participants, and in decision making, they contributed towards improving the role of women in family and community affairs. WFP-GCO should go even further, in terms of analysing and targeting FFA projects in relation to the complexity of women’s situation, with adequate diversity to respond most directly to their needs. The municipal gender support units being developed could contribute to such a process.
140. Environmental factors should be addressed more directly and assets targeted better to the geophysical, ecological and environmental diversity found in Guatemala. Climate change is expected to have differential effects requiring different coping strategies for affected people in Guatemala’s diverse eco-geographical environment. In order to address these issues, WFP-GCO must have the human and technical resources to properly alert and inform project planners and managers on environmental and climate effects.
141. Overall communities maintain a sense of vulnerability and lack of preparedness. External support of different kinds from different providers is sparse, although it appears to be somewhat better in beneficiary communities than comparisons.
142. WFP-GCO was seen as an active and fair player within Guatemala, especially at the national policy level. Overall, the WFP-FFA interventions in Guatemala were complementary with the Guatemalan governmental plan and priorities. The institutional environment of food and nutrition security in Guatemala is dynamic, given evolving national and international economic and political climates. While the WFP-GCO successfully worked with a variety of national governmental and non-governmental organizations and international institutions, the long-term sustainability of its interventions depends more on the capacity of national actors. More binding agreements would be helpful.
4.2 Recommendations
143. The following seven recommendations apply primarily to WFP-GCO but could have broader implications for other similar programs. The various recommendations are inter-related and are best considered as a comprehensive package.
144. Background: Since Guatemala is a middle income country, donors are more reluctant to provide resources for long-term development programs but are well disposed to fund humanitarian assistance. WFP-GCO is recognised by all for its capacity to deliver humanitarian assistance quickly, swiftly and professionally in emergency situations. WFP-

43
GCO could build on this circumstance and consider reframing its FFA activities as Disaster Risk Reduction and Response activities, which means helping communities build assets that would maintain their food security following recurrent natural disasters including flooding, seasonal drought, landslides and frosts and linking these activities to building disaster response capacity at local, municipal and national levels. This would also bring the activities more in line with WFP’s current policy and guidance.
145. Recommendation 1: Building on its experience and reputation, the country office should reframe its FFA programming towards disaster risk reduction and response. This will involve developing a strategy and action plan for its FFA approach and then prioritizing, designing and aligning these to Guatemala’s diverse environmental, risk and vulnerability contexts. It should include specific plans for enhancing disaster risk reduction and response capacity tailored to the community, municipal and national levels; establishing effective partnerships to ensure the requisite technical skills; and developing staff capacity to enable WFP to play a leadership role with national government and international institutions.
146. Background: The number of communities and beneficiaries of FFA interventions is impressive. However, these interventions are too small in size and scope and too limited in duration to contribute to significant livelihoods improvements or community or landscape level changes. Given the limitations of resources, WFP-GCO should engage in fewer interventions and in fewer communities, at the same time dedicating more resources, attention and time in each in order to achieve greater impact and sustainability. A smaller number of longer term interventions would also help to ensure higher technical quality and enable maintenance arrangements to be developed.
147. Recommendation 2: To increase the effectiveness of FFA interventions and achieve greater impact and sustainability, the country office should concentrate its efforts on fewer, larger and longer-term interventions in fewer communities, with clear criteria for targeting communities at risk of food insecurity and disasters, and selecting the types of assets that are likely to help prevent disaster damage and maintain food security when disaster strikes. Assets must be selected according to the particular conditions of each area and should ensure balance among short-, medium- and longer-term benefits.
148. Background: Women play a key role in improving food security in Guatemala and elsewhere. WFP-GCO has done well in targeting women as beneficiaries and potential partners in the delivery of FFA interventions, but WFP-GCO should go even further, in terms of analysing and targeting FFA projects in relation to the complexity of women’s situation, with adequate diversity to respond most directly to their needs. The municipal gender support units being developed could contribute to such a process.
149. Recommendation 3: The country office should develop a broad vision and framework for gender issues in FFA, focusing on household food and nutrition requirements during and after emergencies and taking into consideration women’s needs, interests and roles in food and nutrition security. Rigorous analysis should be undertaken to identify barriers to women’s empowerment and ways of engaging men in the elimination of these barriers. Women should be fully integrated into FFA decision-making processes so that they can benefit from the empowerment brought by such engagement.
150. Background: The institutional environment of food and nutrition security in Guatemala is dynamic, given evolving national and international economic and political climates. While the WFP-GCO successfully worked with a variety of national governmental and non-governmental organizations and international institutions, the long-term

44
sustainability of its interventions depends more on the capacity of national actors. More binding agreements would be helpful.
151. Recommendation 4: The country office should develop longer-term and stronger partnerships at the national, municipal and community levels to ensure that assets are well designed and constructed according to appropriate technical standards and that there is adequate maintenance for the long-term sustainability of its FFA interventions. The country office should implement a strategy for the knowledge transfer of successful FFA interventions to government partners, emphasizing sustainability at the national, municipal and community levels. It should also develop a clear cooperation strategy for the municipal level, setting out clear actions to be undertaken. Protocols for cooperation should be developed to clarify conditions and responsibilities for food delivery, divisions of labour regarding technical assistance, and the involvement of municipalities in follow-up, maintenance and monitoring at the community level.
152. Background: Systematic and effective monitoring and evaluation is vitally important to demonstrate the outcomes and impact of interventions. A year and half ago, WFP-GCO put in place a reinforced Monitoring and Evaluation Unit, which unfortunately was not able to substantively contribute to the period in which this evaluation was focused. This unit should be adequately staffed and resourced, and information collected as needed to track changes over time and link these to WFP inputs and activities.
153. Recommendation 5: The country office should develop and implement a robust and systematic FFA monitoring and evaluation system to measure the intended biophysical and socio-economic effects and provide adequate data at the community/municipal level to facilitate ownership and sustainability.

45
Acronyms
AA Asset Assessment CAFTA-DR Central America Free Trade Agreement-Dominican Republic CAS Community Asset Score CO Country Office COCODES Consejos Comunitarios de Desarollo COCOSAN Community Council for Food Nutrition and Security CONASAN Food Security and Nutrition Council CONRED Coordinadora Nacional para la Reducción de Desastres CP Country Programme CS Coping Strategies CSI Coping Strategy Index DD Dietary Diversity DRR Disaster Risk Reduction EFSA Estudios de Seguridad Alimentaria en
Emergencias/Emergency Food Security Assessment Reports EM Evaluation Manager EQAS Evaluation Quality Assurance System ET Evaluation Team EU European Union EUFF European Union Food Facility FAO Food and Agriculture Organisation FCS Food Consumption Score FFA Food for Assets FFW Food for Work FIS Fondo de Inversión Social FG Focus Groups FNS Food Nutrition Security FONAPAZ Fondo Nacional para la Paz GCO Guatemala Country Office GCSAN Grupo de Cooperantes en Seguridad Alimentaria y
Nutricional/Group of Agencies of Cooperation in the area of Food and Nutrition Security
GDP Gross domestic product GFD General Food Distribution GIA Grupo de Instituciones de Apoyo/Group of Supporting
Institutions HAS Household Asset Score HH Household HHS Household Survey IFAD International Fund for Agriculture and Development IMO International Maritime Organization (UN) IR Inception Report IVISAN Vulnerability to Food and Nutritional Insecurity Index in
Guatemala MAGA Ministerio de Agricultura, Ganadería y Alimentación MARN Ministry of Environment and Natural Resources MFEWS Mesoamerican Famine Early Warning System MT Metric Tons

46
NGO Non-governmental organisation OEV Office of Evaluation P4P Purchase for Progress PRORURAL Programa Presidencial por el Desarollo Rural PRRO Protracted Relief and Recovery Operation SESAN Secretaría de Seguridad Alimentaria y Nutricional SPR Standardized Project Report SUN Scaling Up Nutrition TOR Terms of Reference UN United Nations UNDAF United Nations Development Assistance Framework UNDP United Nations Development Programme UNFPA United Nations Population Fund UNICEF Fondo de Naciones Unidas para la Infancia/ United Nations
Children's Fund USAID United States Agency for International Development VAM Vulnerability and Assessment Mapping WFP World Food Programme WHO World Health Organisation

Office of Evaluation www.wfp.org/evaluation
Ro
me
, Ja
nu
ar
y 2
014
, OE
V/2
013
/00
3