impact of flavour solvent on biscuit micro-structure as ... · used flavour solvent in the food...
TRANSCRIPT
ORIGINAL PAPER
Impact of flavour solvent on biscuit micro-structure as measuredby X-ray micro-Computed Tomography and the distributionof vanillin and HMF (HPLC)
Ni Yang • Ian D. Fisk • Robert Linforth •
Keith Brown • Stuart Walsh • Sacha Mooney •
Craig Sturrock • Joanne Hort
Received: 6 July 2012 / Revised: 7 September 2012 / Accepted: 15 September 2012 / Published online: 4 October 2012
� The Author(s) 2012. This article is published with open access at Springerlink.com
Abstract The influence of flavour solvent, propylene
glycol (PG) and triacetin (TA), was investigated on the
micro-structure (as measured by X-ray micro-Computed
Tomography, X-ray lCT) and aroma compound distribu-
tion (as measured by HPLC) within shortcake biscuits.
X-ray lCT scanning showed biscuits made with PG had
smaller pores and higher porosity than biscuits made with
TA. Vanillin distribution across the biscuits was not
homogeneous and was found at higher concentrations in
the centre of the biscuits than the edge or bottom. The
baked aroma compound 5-hydroxymethyl-furfural (HMF)
was present at higher concentrations at the surface of the
biscuits where Maillard chemistry is presumed to occur at
its highest rate. The type of solvent had a significant effect
on the total concentration and distribution of aroma com-
pounds (p \ 0.05). TA biscuits retained greater vanillin
and more HMF was formed during baking when compared
to PG biscuits. The core of TA biscuits had (on a relative
scale) a much greater vanillin and lower HMF concentra-
tion than PG biscuits when compared to their periphery.
Although this may be due to different physicochemical
properties of the two solvents and varying levels of
interactions with other ingredients, the micro-structure
differences indicated by X-ray lCT image analysis illus-
trate one potential route by which the flavour solvent may
be influencing the generation and stability of biscuit aroma
compounds.
Keywords Food structure � Snack foods � Aroma �Biscuit � X-ray lCT
Introduction
Flavourings are commonly divided into classes based on
their physical states, for example, liquid, emulsions, pow-
der or paste. Typically liquid flavourings are made by
blending the required flavouring substances, in the desired
concentration, with particular food-grade solvents. Select-
ing an appropriate solvent for a liquid flavouring is nor-
mally based on its ability to dissolve the required
flavouring compounds and its solubility in the food prod-
ucts to which it is to be applied. Two commonly used
solvents in the global flavouring industry are propylene
glycol (PG) and triacetin (TA), which are the main solvents
of interest in this study.
Propylene glycol (1,2-propanediol) is a colourless,
slightly viscous liquid with a faintly sweet taste [1]. Since
it is miscible with water, alcohol and many flavour com-
pounds, and relatively inexpensive, it is an extensively
used flavour solvent in the food industry. The chemical
structure of propylene glycol is well known and contains
two hydroxyl groups that can directly react with some
flavour compounds including vanillin. The flavour carrier
solvent can also interact with the food matrix in a number
of ways either through chemical reactions or physical
modifications [2].
N. Yang � I. D. Fisk (&) � R. Linforth � J. Hort
Division of Food Sciences, University of Nottingham,
Sutton Bonington Campus, Sutton Bonington,
Loughborough, Leicestershire LE12 5RD, UK
e-mail: [email protected]
K. Brown � S. Walsh
Aromco Ltd, Bell Farm Industrial Park Nuthampstead,
Hertfordshire SG8 8ND, UK
S. Mooney � C. Sturrock
Division of Agricultural and Environmental Sciences,
University of Nottingham, Sutton Bonington Campus,
Loughborough, Leicestershire LE12 5RD, UK
123
Eur Food Res Technol (2012) 235:1083–1091
DOI 10.1007/s00217-012-1837-1
PG can react specifically with aldehydes and ketones to
form acetals and ketals [3]. For instance, cinnamaldehyde
and vanillin could form cinnamaldehyde propylene glycol
acetal and vanillin propylene glycol acetal [4, 5]. In addi-
tion to PG-acetal formation, Elmore [5] summarised two
other reaction pathways that can occur during the storage
of PG flavourings: reactions between PG and organic acids
commonly used in flavourings (e.g. acetic and butyric acid)
to form both monoesters and diesters; and the transesteri-
fication of lactones to give dihydroxy esters in stored
flavourings.
Compared to PG, triacetin (1,2,3-propanetriol triacetate)
is a colourless, slightly viscous liquid with a very faint
ethereal-fruit odour [1]. TA is less polar than PG and more
oil soluble. Since TA does not react with aldehydes, it can
be used in flavourings where the use of PG is restricted or
avoiding acetal formation becomes vital. TA has also been
shown to enhance flavour stability, and Choi [6] success-
fully incorporated TA into oil-in-water emulsions to alter
the stability of citral to chemical degradation. Their results
indicated that TA improves the chemical stability of citral
in a beverage emulsion.
Choice of the flavour solvent may also impact the physical
properties of the food. Dr Roos [7] suggested that PG can act
as a plasticiser in glassy state systems, and for hard candies, it
can make the product sticky. Triacetin is widely used in the
chewing gum flavouring as the gum formulated with triacetin
is often softer than when formulated with propylene glycol
[8]. Although there is a variety of unconnected research in
different food types, it is clear that solvent choice does have
the potential to impact not only product flavour but also
structure. In this work, the impact of biscuit structure on
flavour stability will be studied.
Food structure can be examined from a three-dimen-
sional prospective using X-ray micro-Computed Tomog-
raphy (X-ray lCT). This is a non-destructive technique for
visualising solid interiors, where the X-ray attenuation of
the solid food is a function of density of the material [9].
The technique involves the acquisition of a series of 2D
radiograph images over a 360� rotation of the sample [10].
These radiographs are then reconstructed using filtered
back projection algorithms [11] resulting in the creation of
a volumetric dataset of the sample’s X-ray attenuation.
Image processing software permits the visualisation and
quantification of the internal structure of the sample. X-ray
lCT scanning has previously been applied on different
types of biscuits and breadsticks [12]. Due to the novel
nature of the technique and recent advances in image
processing power, the impact of solvent on biscuit micro-
structure by X-ray lCT analysis and aroma stability has
never previously been reported in the literature.
In this study, it is proposed that the combined knowl-
edge of the spatial microstructure of shortcake biscuits and
their aroma chemistry may explain the impact of solvent on
the concentration of added vanillin and the generation of
5-hydroxymethyl-furfural (HMF).
Materials and methods
Materials
Food-grade vanillin, propylene glycol (PG) and triacetin
(TA) were supplied by Aromco Ltd. (Nuthampstead, UK).
Two simple vanilla flavours were made by mixing vanillin
(10 % w/w) with PG or TA as the flavour solvent. Both
flavourings were made on the day of application, the
standard application dosage for both flavourings was
0.2 % w/w in the biscuit dough (i.e. 200 ppm of vanillin
was added initially).
Acetovanillone (C98 %, SAFC Supply Solutions, St.
Louis, USA) was used as the internal standard (IS) for
HPLC detection. Methanol (HPLC Grade C99.9 %) was
ordered from Fisher Scientific UK Ltd, Loughborough,
UK. Acetic acid (C99.85 %) and 5-hydroxymethyl-furfural
(HMF, C99 %) were purchased from Sigma Aldrich, UK.
Preparation of standard biscuits
Standard dough was prepared from the ingredients listed
below: (1) shortening 15 g/100 g; (2) icing sugar, 15 g/
100 g; (3) invert sugar, 2 g/100 g; (4) skimmed milk pow-
der, 0.3 g/100 g; (5) salt, 0.3 g/100 g; (6) lecithin, 0.3 g/
100 g; (7) sodium bicarbonate, 0.14 g/100 g; (8) ammonium
bicarbonate 0.03 g/100 g; (9) water 11 g/100 g; (10) biscuit
flour 56 g/100 g; (11) flavouring, 0.02 g/100 g. Shortening
was supplied by Cardowan Creameries Ltd (Glasgow, UK),
and the biscuit flour was sourced from Rank Hovis (High
Wycombe, UK). All other ingredients were supplied by C
Holland & Sons Ltd. (Royston, UK).
The ingredients from No. 1 to No. 6 were weighed and
blended by a spade blender (Hobart, Windsor, UK). A fat
base was then formed after 2 min of continuous mixing of
these ingredients. A water base was prepared by dissolving
the Ingredients No. 7 and No. 8 in cold tap water. Standard
dough was made by gradually mixing flour into the fat base
then added the water base into the fat base using a spade
blender. The flavouring (PG or TA) was then added and
blended to homogeneity by spade blender. Each dough
preparation was then rolled to 40 mm thickness using a
Pastry Brake (Seewer Rondon, Burgdorf, Switzerland) and
shaped by a model cutter (36 mm diameter, round with
fluted edge) to produce individual biscuits.
The biscuits with PG and TA flavouring were positioned
in alternating rows, with equal separating distances on the
1084 Eur Food Res Technol (2012) 235:1083–1091
123
same tray to reduce baking variation. The tray of biscuits
was placed on the top layer of a Deck Oven (Sveba-dahlen,
Fristad, Sweden) and baked at 230 �C for 8 min on the top
layer and were then dried on the bottom layer of the oven
for 3 min at 100 �C. Finally, the baking tray was removed
from the oven to allow the biscuits to cool for 10 min at
room temperature (25 �C). Biscuits at the edge of the tray
were discarded to minimise baking variation that was
known to occur in these positions [13]. The biscuits were
then carefully packed and stored in sealed aluminium bags
with a minimum headspace within the bag, moisture con-
tent was analysed as per Fisk [14].
X-ray lCT analysis
The microstructure of three PG biscuits and three TA
biscuits was analysed by X-ray lCT using a Pheonix
Nanotom NF180 X-ray CT System (GE Sensing &
Inspection Technologies GmbH, Wunstorf, Germany).
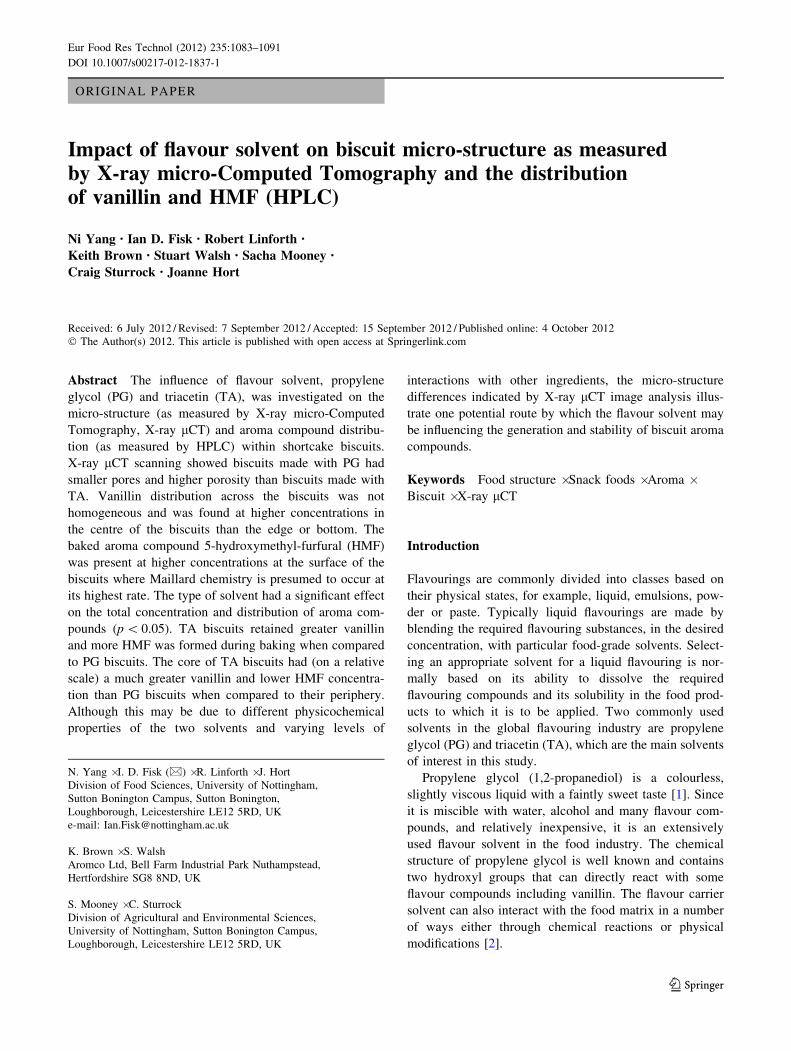
Triplicate biscuits were fixed together in the position
shown in Fig. 1a, in order to be rotated and scanned as one
stack. The scan consisted of 1,440 projection images col-
lected over a 360� rotation using an electron acceleration
energy of 80 kV, a current of 180 lA and a scan resolution
of 22.5 lm. A 3D rendered model of the biscuit after
reconstruction is illustrated in Fig. 1b.
Image analysis
All images were analysed by ‘Image J’ processing software
version 1.44 (public domain Java analysis programme,
developed by National Institute of Health, Maryland, US) [15].
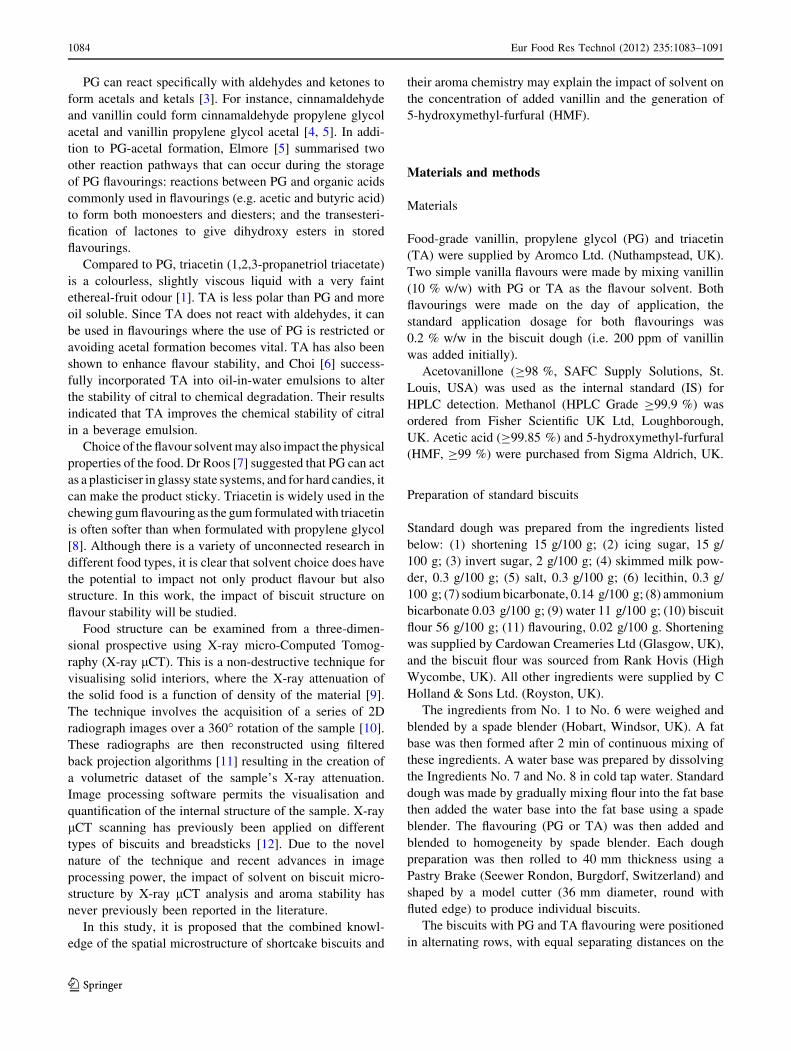
Without any physical destruction, a cross-sectioned
view of the top (XY slice) and the front slice (ZX slice) for
both PG and TA biscuit were extracted from the CT scan,
illustrated in Fig. 2. The white areas (high X-ray attenua-
tion) show the biscuit matrix, and the black areas (low
X-ray attenuation) inside the biscuits indicate pores (air
space).
A ‘remove dark outliers’ filter with a radius of 0.5 pixels
was applied to reduce binary noise in the images. Image J
was then used to analyse the average size of all the pores in
a defined region of the biscuit and area fraction (also
known as the porosity) using the ‘Analyze Particles’
function in Image J.
Hundred reprehensive XY slice images were selected
per biscuit. The central region (area = 25 9 25 mm) was
used in every biscuit layer and the exterior was discarded.
The image analysis settings as described were applied for
all six biscuit samples. A total of 300 images were gen-
erated for either PG or TA biscuits based on triplicate
samples.
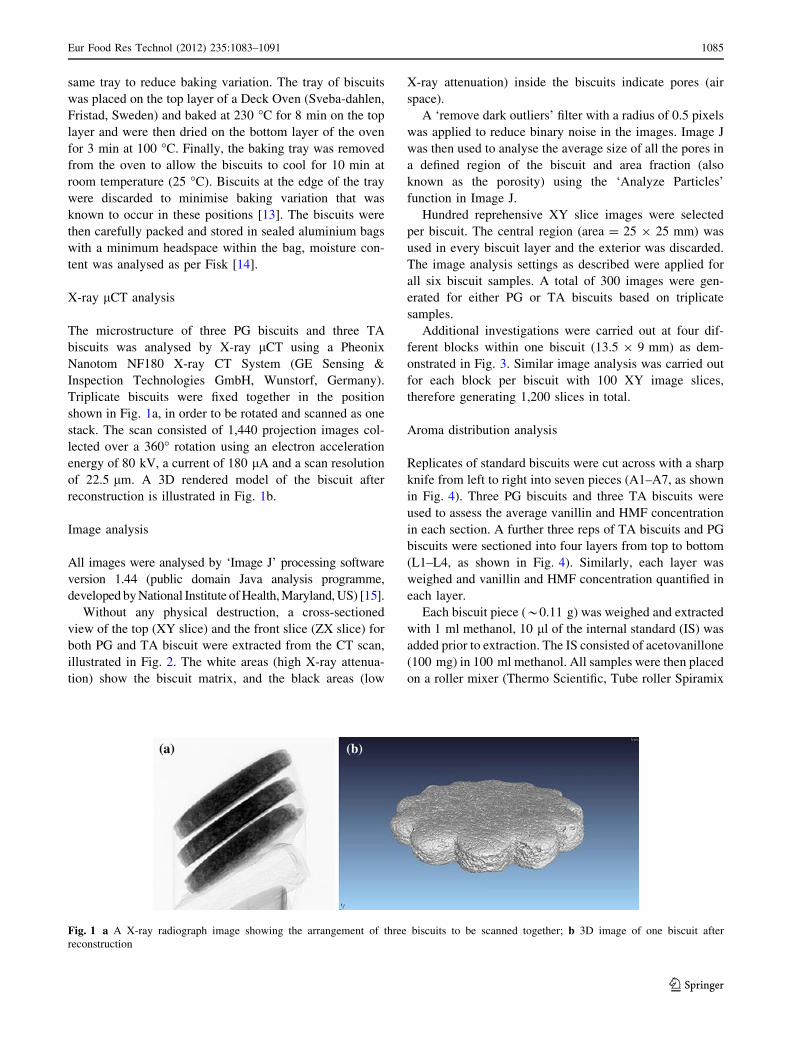
Additional investigations were carried out at four dif-
ferent blocks within one biscuit (13.5 9 9 mm) as dem-
onstrated in Fig. 3. Similar image analysis was carried out
for each block per biscuit with 100 XY image slices,
therefore generating 1,200 slices in total.
Aroma distribution analysis
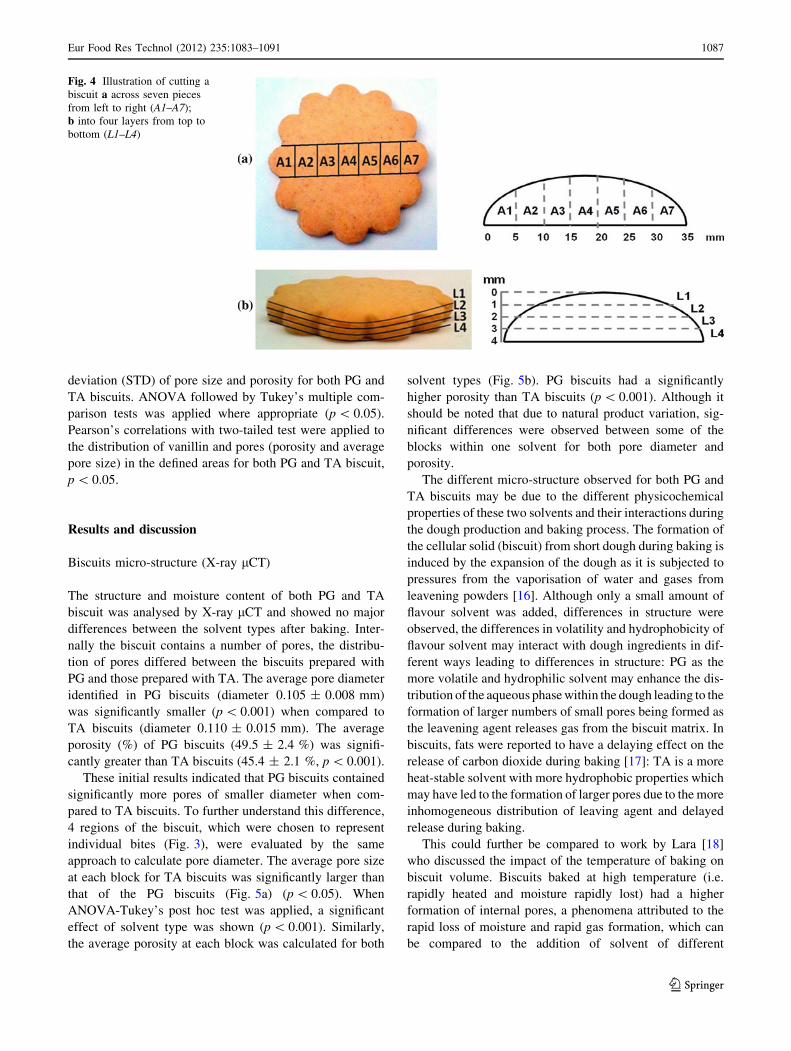
Replicates of standard biscuits were cut across with a sharp
knife from left to right into seven pieces (A1–A7, as shown
in Fig. 4). Three PG biscuits and three TA biscuits were
used to assess the average vanillin and HMF concentration
in each section. A further three reps of TA biscuits and PG
biscuits were sectioned into four layers from top to bottom
(L1–L4, as shown in Fig. 4). Similarly, each layer was
weighed and vanillin and HMF concentration quantified in
each layer.
Each biscuit piece (*0.11 g) was weighed and extracted
with 1 ml methanol, 10 ll of the internal standard (IS) was
added prior to extraction. The IS consisted of acetovanillone
(100 mg) in 100 ml methanol. All samples were then placed
on a roller mixer (Thermo Scientific, Tube roller Spiramix
Fig. 1 a A X-ray radiograph image showing the arrangement of three biscuits to be scanned together; b 3D image of one biscuit after
reconstruction
Eur Food Res Technol (2012) 235:1083–1091 1085
123
10) to roll side by side for 30 min and then centrifuged at
1,3009g for 20 min at 5 �C (Thermo CR3i Multifunction
Centrifuge, KeyWrite-DTM). The upper solvent layer was
isolated, and 0.5 ml of the extract was filtered (nylon syringe
filter 4 mm 0.4 lm) into 2-ml amber vials, capped with
Teflon-coated lids and analysed by HPLC.
The HPLC (Alliance� Waters 2095, Waters Corpora-
tion, Massachusetts, USA) fitted with a photodiode array
detector (PDA, Waters 996) was used. Compounds were
measured at an absorption wavelength of 270 nm and
separated by a C18 column (C18 Techsphere, 5 lm,
250 9 4.6 mm, Thermo Scientific, Manchester, UK). The
instrumental settings were as follows: injection volume
10 ll; flow rate 1 ml per min; gradient elution with (1)
water (1 % acetic acid) and (2) methanol (ramped from
20 % B v/v to 50 % B v/v over 30 min then to 100 % B v/v
over 1 min and held for 2 min). The chromatography data
were analysed by Millennium32 software (Waters, USA).
The retention time for authentic standard of HMF, vanillin
and acetovanillone was 5.1, 15.0 and 17.9 min, respec-
tively. Concentration (ppm, lg/g) was calculated from the
ratio of the peak area of compound of interest to the peak
area of internal standard.
Data analysis
All results were analysed by SPSS 16.0 (SPSS Inc., Chi-
cago, USA) to calculate the average (AV) and standard
Fig. 2 Image from a top slice (XY) and a front slice (ZX) of PG and TA biscuit with 5-mm scale indicator
PG biscuit
B1
B2 B3
B45 mm
TA biscuit
5 mm
B1
B2 B3
B4
Fig. 3 Demonstration images
of four blocks (B1–B4) selected
for both PG and TA biscuit
1086 Eur Food Res Technol (2012) 235:1083–1091
123
deviation (STD) of pore size and porosity for both PG and
TA biscuits. ANOVA followed by Tukey’s multiple com-
parison tests was applied where appropriate (p \ 0.05).
Pearson’s correlations with two-tailed test were applied to
the distribution of vanillin and pores (porosity and average
pore size) in the defined areas for both PG and TA biscuit,
p \ 0.05.
Results and discussion
Biscuits micro-structure (X-ray lCT)
The structure and moisture content of both PG and TA
biscuit was analysed by X-ray lCT and showed no major
differences between the solvent types after baking. Inter-
nally the biscuit contains a number of pores, the distribu-
tion of pores differed between the biscuits prepared with
PG and those prepared with TA. The average pore diameter
identified in PG biscuits (diameter 0.105 ± 0.008 mm)
was significantly smaller (p \ 0.001) when compared to
TA biscuits (diameter 0.110 ± 0.015 mm). The average
porosity (%) of PG biscuits (49.5 ± 2.4 %) was signifi-
cantly greater than TA biscuits (45.4 ± 2.1 %, p \ 0.001).
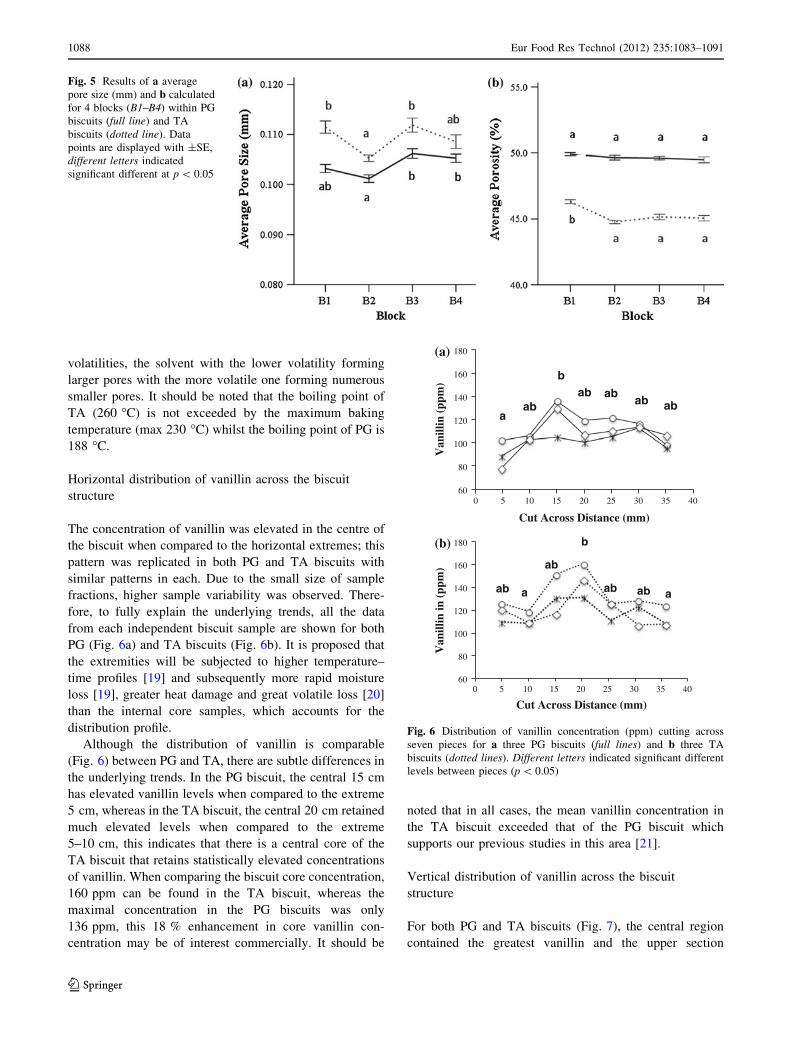
These initial results indicated that PG biscuits contained
significantly more pores of smaller diameter when com-
pared to TA biscuits. To further understand this difference,
4 regions of the biscuit, which were chosen to represent
individual bites (Fig. 3), were evaluated by the same
approach to calculate pore diameter. The average pore size
at each block for TA biscuits was significantly larger than
that of the PG biscuits (Fig. 5a) (p \ 0.05). When
ANOVA-Tukey’s post hoc test was applied, a significant
effect of solvent type was shown (p \ 0.001). Similarly,
the average porosity at each block was calculated for both
solvent types (Fig. 5b). PG biscuits had a significantly
higher porosity than TA biscuits (p \ 0.001). Although it
should be noted that due to natural product variation, sig-
nificant differences were observed between some of the
blocks within one solvent for both pore diameter and
porosity.
The different micro-structure observed for both PG and
TA biscuits may be due to the different physicochemical
properties of these two solvents and their interactions during
the dough production and baking process. The formation of
the cellular solid (biscuit) from short dough during baking is
induced by the expansion of the dough as it is subjected to
pressures from the vaporisation of water and gases from
leavening powders [16]. Although only a small amount of
flavour solvent was added, differences in structure were
observed, the differences in volatility and hydrophobicity of
flavour solvent may interact with dough ingredients in dif-
ferent ways leading to differences in structure: PG as the
more volatile and hydrophilic solvent may enhance the dis-
tribution of the aqueous phase within the dough leading to the
formation of larger numbers of small pores being formed as
the leavening agent releases gas from the biscuit matrix. In
biscuits, fats were reported to have a delaying effect on the
release of carbon dioxide during baking [17]: TA is a more
heat-stable solvent with more hydrophobic properties which
may have led to the formation of larger pores due to the more
inhomogeneous distribution of leaving agent and delayed
release during baking.
This could further be compared to work by Lara [18]
who discussed the impact of the temperature of baking on
biscuit volume. Biscuits baked at high temperature (i.e.
rapidly heated and moisture rapidly lost) had a higher
formation of internal pores, a phenomena attributed to the
rapid loss of moisture and rapid gas formation, which can
be compared to the addition of solvent of different
Fig. 4 Illustration of cutting a
biscuit a across seven pieces
from left to right (A1–A7);
b into four layers from top to
bottom (L1–L4)
Eur Food Res Technol (2012) 235:1083–1091 1087
123
volatilities, the solvent with the lower volatility forming
larger pores with the more volatile one forming numerous
smaller pores. It should be noted that the boiling point of
TA (260 �C) is not exceeded by the maximum baking
temperature (max 230 �C) whilst the boiling point of PG is
188 �C.
Horizontal distribution of vanillin across the biscuit
structure
The concentration of vanillin was elevated in the centre of
the biscuit when compared to the horizontal extremes; this
pattern was replicated in both PG and TA biscuits with
similar patterns in each. Due to the small size of sample
fractions, higher sample variability was observed. There-
fore, to fully explain the underlying trends, all the data
from each independent biscuit sample are shown for both
PG (Fig. 6a) and TA biscuits (Fig. 6b). It is proposed that
the extremities will be subjected to higher temperature–
time profiles [19] and subsequently more rapid moisture
loss [19], greater heat damage and great volatile loss [20]
than the internal core samples, which accounts for the
distribution profile.
Although the distribution of vanillin is comparable
(Fig. 6) between PG and TA, there are subtle differences in
the underlying trends. In the PG biscuit, the central 15 cm
has elevated vanillin levels when compared to the extreme
5 cm, whereas in the TA biscuit, the central 20 cm retained
much elevated levels when compared to the extreme
5–10 cm, this indicates that there is a central core of the
TA biscuit that retains statistically elevated concentrations
of vanillin. When comparing the biscuit core concentration,
160 ppm can be found in the TA biscuit, whereas the
maximal concentration in the PG biscuits was only
136 ppm, this 18 % enhancement in core vanillin con-
centration may be of interest commercially. It should be
noted that in all cases, the mean vanillin concentration in
the TA biscuit exceeded that of the PG biscuit which
supports our previous studies in this area [21].
Vertical distribution of vanillin across the biscuit
structure
For both PG and TA biscuits (Fig. 7), the central region
contained the greatest vanillin and the upper section
Fig. 5 Results of a average
pore size (mm) and b calculated
for 4 blocks (B1–B4) within PG
biscuits (full line) and TA
biscuits (dotted line). Data
points are displayed with ±SE,
different letters indicated
significant different at p \ 0.05
60
80
100
120
140
160
180
0 5 10 15 20 25 30 35 40
Van
illin
(pp
m)
Cut Across Distance (mm)
aab
bab ab
ab ab
60
80
100
120
140
160
180
0 5 10 15 20 25 30 35 40
Van
illin
in (
ppm
)
Cut Across Distance (mm)
a a
b
ab
ab
ab ab
(a)
(b)
Fig. 6 Distribution of vanillin concentration (ppm) cutting across
seven pieces for a three PG biscuits (full lines) and b three TA
biscuits (dotted lines). Different letters indicated significant different
levels between pieces (p \ 0.05)
1088 Eur Food Res Technol (2012) 235:1083–1091
123
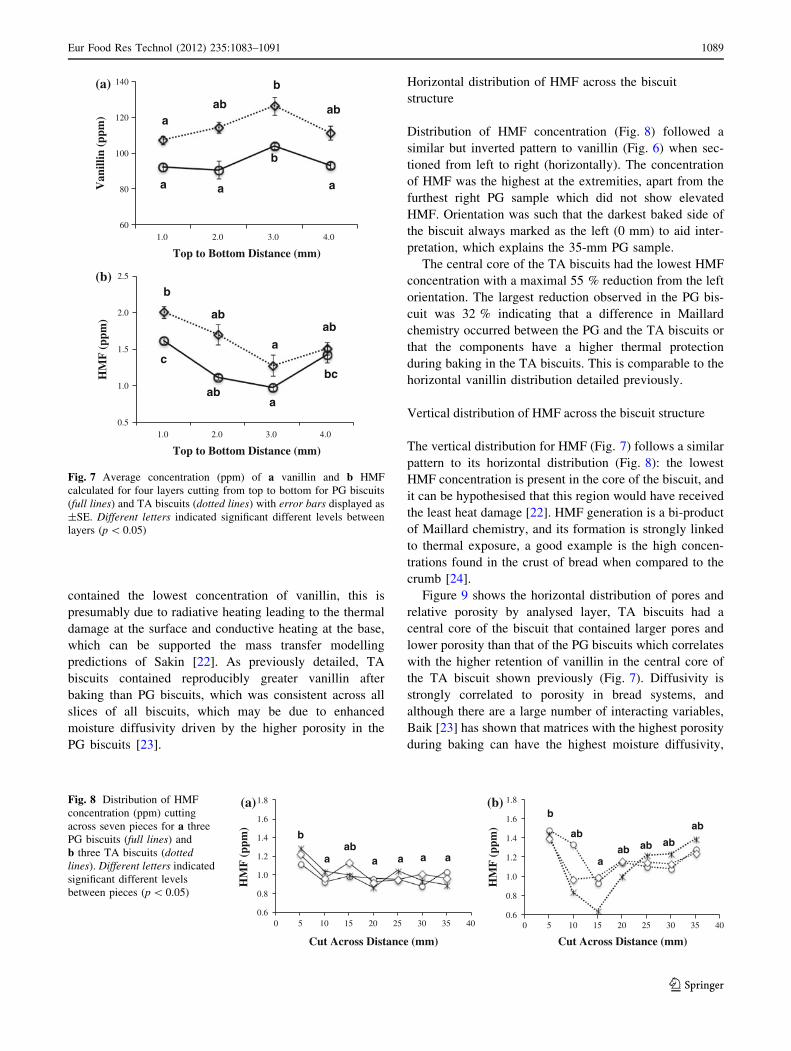
contained the lowest concentration of vanillin, this is
presumably due to radiative heating leading to the thermal
damage at the surface and conductive heating at the base,
which can be supported the mass transfer modelling
predictions of Sakin [22]. As previously detailed, TA
biscuits contained reproducibly greater vanillin after
baking than PG biscuits, which was consistent across all
slices of all biscuits, which may be due to enhanced
moisture diffusivity driven by the higher porosity in the
PG biscuits [23].
Horizontal distribution of HMF across the biscuit
structure
Distribution of HMF concentration (Fig. 8) followed a
similar but inverted pattern to vanillin (Fig. 6) when sec-
tioned from left to right (horizontally). The concentration
of HMF was the highest at the extremities, apart from the
furthest right PG sample which did not show elevated
HMF. Orientation was such that the darkest baked side of
the biscuit always marked as the left (0 mm) to aid inter-
pretation, which explains the 35-mm PG sample.
The central core of the TA biscuits had the lowest HMF
concentration with a maximal 55 % reduction from the left
orientation. The largest reduction observed in the PG bis-
cuit was 32 % indicating that a difference in Maillard
chemistry occurred between the PG and the TA biscuits or
that the components have a higher thermal protection
during baking in the TA biscuits. This is comparable to the
horizontal vanillin distribution detailed previously.
Vertical distribution of HMF across the biscuit structure
The vertical distribution for HMF (Fig. 7) follows a similar
pattern to its horizontal distribution (Fig. 8): the lowest
HMF concentration is present in the core of the biscuit, and
it can be hypothesised that this region would have received
the least heat damage [22]. HMF generation is a bi-product
of Maillard chemistry, and its formation is strongly linked
to thermal exposure, a good example is the high concen-
trations found in the crust of bread when compared to the
crumb [24].
Figure 9 shows the horizontal distribution of pores and
relative porosity by analysed layer, TA biscuits had a
central core of the biscuit that contained larger pores and
lower porosity than that of the PG biscuits which correlates
with the higher retention of vanillin in the central core of
the TA biscuit shown previously (Fig. 7). Diffusivity is
strongly correlated to porosity in bread systems, and
although there are a large number of interacting variables,
Baik [23] has shown that matrices with the highest porosity
during baking can have the highest moisture diffusivity,
60
80
100
120
140
1.0 2.0 3.0 4.0
Van
illin
(pp
m)
Top to Bottom Distance (mm)
aab ab
b
a a
b
a
0.5
1.0
1.5
2.0
2.5
1.0 2.0 3.0 4.0
HM
F (
ppm
)
Top to Bottom Distance (mm)
b
abab
ac
bc
aba
(a)
(b)
Fig. 7 Average concentration (ppm) of a vanillin and b HMF
calculated for four layers cutting from top to bottom for PG biscuits
(full lines) and TA biscuits (dotted lines) with error bars displayed as
±SE. Different letters indicated significant different levels between
layers (p \ 0.05)
0.6
0.8
1.0
1.2
1.4
1.6
1.8
0 5 10 15 20 25 30 35 40
HM
F (
ppm
)
Cut Across Distance (mm)
a
bab
a aa a
0.6
0.8
1.0
1.2
1.4
1.6
1.8
0 5 10 15 20 25 30 35 40
HM
F (
ppm
)
Cut Across Distance (mm)
ab
abab
b
ab
aba
(a) (b)Fig. 8 Distribution of HMF
concentration (ppm) cutting
across seven pieces for a three
PG biscuits (full lines) and
b three TA biscuits (dottedlines). Different letters indicated
significant different levels
between pieces (p \ 0.05)
Eur Food Res Technol (2012) 235:1083–1091 1089
123
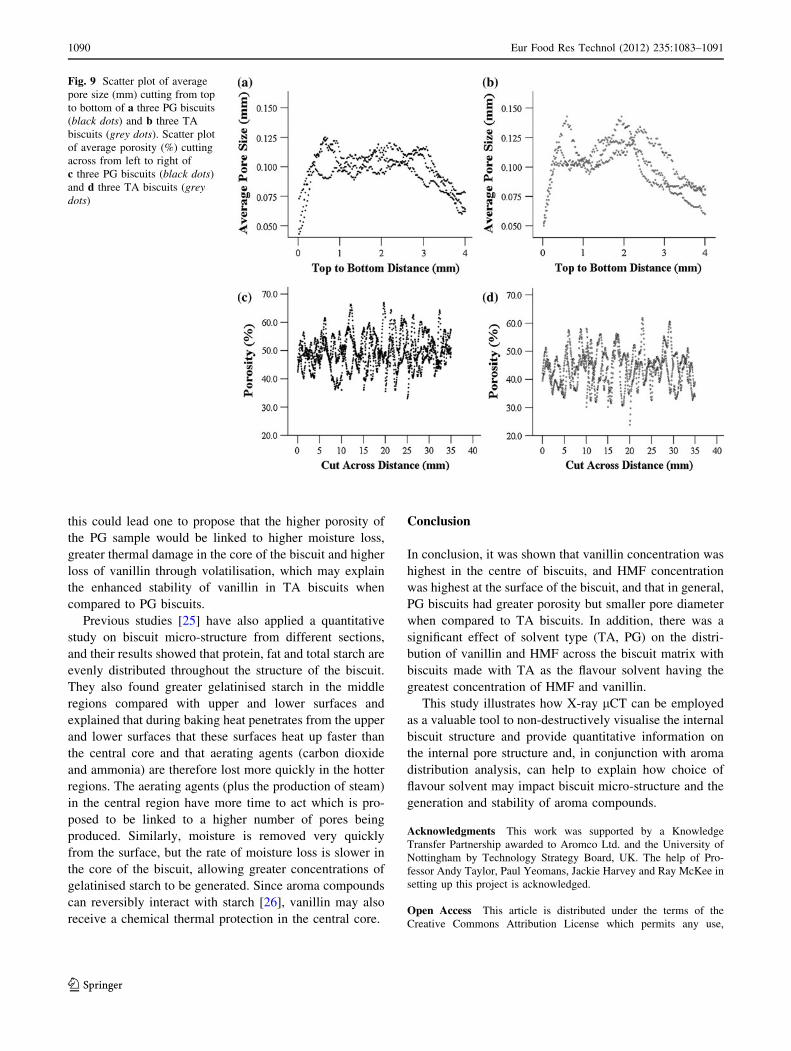
this could lead one to propose that the higher porosity of
the PG sample would be linked to higher moisture loss,
greater thermal damage in the core of the biscuit and higher
loss of vanillin through volatilisation, which may explain
the enhanced stability of vanillin in TA biscuits when
compared to PG biscuits.
Previous studies [25] have also applied a quantitative
study on biscuit micro-structure from different sections,
and their results showed that protein, fat and total starch are
evenly distributed throughout the structure of the biscuit.
They also found greater gelatinised starch in the middle
regions compared with upper and lower surfaces and
explained that during baking heat penetrates from the upper
and lower surfaces that these surfaces heat up faster than
the central core and that aerating agents (carbon dioxide
and ammonia) are therefore lost more quickly in the hotter
regions. The aerating agents (plus the production of steam)
in the central region have more time to act which is pro-
posed to be linked to a higher number of pores being
produced. Similarly, moisture is removed very quickly
from the surface, but the rate of moisture loss is slower in
the core of the biscuit, allowing greater concentrations of
gelatinised starch to be generated. Since aroma compounds
can reversibly interact with starch [26], vanillin may also
receive a chemical thermal protection in the central core.
Conclusion
In conclusion, it was shown that vanillin concentration was
highest in the centre of biscuits, and HMF concentration
was highest at the surface of the biscuit, and that in general,
PG biscuits had greater porosity but smaller pore diameter
when compared to TA biscuits. In addition, there was a
significant effect of solvent type (TA, PG) on the distri-
bution of vanillin and HMF across the biscuit matrix with
biscuits made with TA as the flavour solvent having the
greatest concentration of HMF and vanillin.
This study illustrates how X-ray lCT can be employed
as a valuable tool to non-destructively visualise the internal
biscuit structure and provide quantitative information on
the internal pore structure and, in conjunction with aroma
distribution analysis, can help to explain how choice of
flavour solvent may impact biscuit micro-structure and the
generation and stability of aroma compounds.
Acknowledgments This work was supported by a Knowledge
Transfer Partnership awarded to Aromco Ltd. and the University of
Nottingham by Technology Strategy Board, UK. The help of Pro-
fessor Andy Taylor, Paul Yeomans, Jackie Harvey and Ray McKee in
setting up this project is acknowledged.
Open Access This article is distributed under the terms of the
Creative Commons Attribution License which permits any use,
Fig. 9 Scatter plot of average
pore size (mm) cutting from top
to bottom of a three PG biscuits
(black dots) and b three TA
biscuits (grey dots). Scatter plot
of average porosity (%) cutting
across from left to right of
c three PG biscuits (black dots)
and d three TA biscuits (greydots)
1090 Eur Food Res Technol (2012) 235:1083–1091
123
distribution, and reproduction in any medium, provided the original
author(s) and the source are credited.
References
1. Acrctander S (1969) Perfume and flavor chemicals, 6th edn.
Steffen Arctander’s Publications, Las Vegas
2. Bartlett GR (1959) Phosphorus assay in column chromatography.
J Biol Chem 234:466–468
3. Heydanek MG, Min DBS (1976) Carbonyl-propylene glycol
interactions in flavor systems. J Food Sci 41:145–147
4. Potineni RV, Peterson DG (2008) Mechanisms of flavor release
in chewing gum: Cinnemaldehyde. J Agric Food Chem 56:3260–
3267
5. Elmore JS, Dodson AT, Mottram DS (2011) Reactions of pro-
pylene glycol with the constituents of food flavourings. In: The
thirteenth Weurman Flavour Research Symposium. Book of
Abstracts: Zaragoza, Spain, p 137
6. Choi SJ, Decker EA, Henson L, Popplewell LM, McClements DJ
(2009) Stability of citral in oil-in-water emulsions prepared with
medium-chain triacylglycerols and triacetin. J Agric Food Chem
57:11349–11353
7. De Roos KB (2007) Modifying flavour in food. In: Taylor AJ,
Hort J (eds) Woodhead Publishing Ltd., Cambridge, pp 243–273
8. Potineni R, Peterson D (2008) Influence of flavor solvent on
flavor release and perception in sugar-free chewing gum. J Agric
Food Chem 56:3254–3259
9. Babin P, Della Valle G, Dendievel R, Lourdin D, Salvo L (2007)
X-ray tomography study of the cellular structure of extruded
starches and its relations with expansion phenomenon and foam
mechanical properties. Carbohydr Polym 68:329–340
10. Kerckhofs G, Schrooten J, Van Cleynenbreugel T, Lomov SV,
Wevers M (2008) Validation of X-ray microfocus computed
tomography as an imaging tool for porous structures. Rev Sci
Instrum 79:13711
11. Feldkamp LA, Davis LC, Kress JW (1984) Practical cone-beam
algorithm. J Opt Soc Am A-Opt Image Sci Vis 1:612–619
12. Frisullo P, Conte A, Del Nobile MA (2010) A novel approach to
study biscuits and breadsticks using X-ray computed tomography.
J Food Sci 75:E353–E358
13. Ledl F, Severin T (1978) Browning reactions of pentoses with
amines.13. Investigation of the Maillard reaction. Z Lebensm-
Unters-Forsch 167:410–413
14. Fisk ID, Linforth RST, Taylor AJ, Gray DA (2011) Aroma
encapsulation and aroma delivery by oil body suspensions
derived from sunflower seeds (helianthus annus). Eur Food Res
Technol 232:905–910
15. Abramoff MD, Magalhaes PJ, Ram SJ (2004) Image processing
with image. J Biophoton Int 11:36–42
16. Chevallier S, Colonna P, Buleon A, Della Valle G (2000)
Physicochemical behaviors of sugars, lipids, and gluten in short
dough and biscuit. J Agric Food Chem 48:1322–1326
17. Chevallier S, Colonna P, Lourdin D (2000) Contribution of major
ingredients during baking of biscuit dough systems. J Cereal Sci
31:241–252
18. Lara E, Cortes P, Briones V, Perez M (2011) Structural and
physical modifications of corn biscuits during baking process.
LWT- Food Sci Technol 44:622–630
19. Sakin M, Kaymak-Ertekin F, Ilicali C (2007) Simultaneous heat
and mass transfer simulation applied to convective oven cup cake
baking. J Food Eng 83:463–474
20. Kayaci F, Uyar T (2012) Encapsulation of vanillin/cyclodextrin
inclusion complex in electrospun polyvinyl alcohol (pva) nano-
webs: prolonged shelf-life and high temperature stability of
vanillin. Food Chem 133:641–649
21. Yang N, Hort J, Linforth R, Taylor A, Brown K, Walsh S, Fisk ID
(2011) Aroma and flavour solvent: impact on the matrix. XIII
Weurman Flavour Research Symposium, Zaragoza
22. Sakin-Yilmazer M, Kaymak-Ertekin F, Ilicali C (2012) Modeling
of simultaneous heat and mass transfer during convective oven
ring cake baking. J Food Eng 111:289–298
23. Baik O-D, Marcotte M (2003) Modeling the moisture diffusivity
in a baking cake. J Food Eng 56:27–36
24. Ramirez-Jimenez A, Guerra-Hernandez E, Garcia-Villanova B
(2000) Browning indicators in bread. J Agric Food Chem
48:4176–4181
25. Burt DJ, Fearn T (1983) A quantitative study of biscuit micro-
structure. Starch Starke 35:351–354
26. Kant A, Linforth RST, Taylor AJ (2003) Flavour retention and
release from starch solutions Flavour research at the dawn of the
twenty-first century. Editions Tec & Doc, Dijon, pp 103–106
Eur Food Res Technol (2012) 235:1083–1091 1091
123