impact of co-morbidities and treatment on newly diagnosed ... · • ipss low- and intermediate-1...
TRANSCRIPT

Impact of Co-Morbidities and Treatment on newly diagnosed lower risk MDS patients from the EU MDS Registry
Theo de Witte, Louise de Swart#, Alex Smith, Pierre Fenaux, Raphael Itzykson*, Guillermo Sanz, Eva Hellström-Lindberg, Argyris Symeonidis, Jaroslav Cermak, Ulrich Germing, Reinhard Stauder, Otilia Georgescu, Marius MacKenzie, Luca
Malcovati, Mette Skov Holm, Krzysztof Mądry, Sophie Park, Odile Beyne-Rauzy, Jackie Droste, and David Bowen
#: Poster #3830 Monday 10-12-12
*: Oral #700 Monday 10-12-12

Background of Low-risk MDS
• Elderly population (75 years!)
• Reluctance to complete diagnostic work-up, such as cytogenetics and marrow biopsy/aspirate
• Main problem: cytopenias, especially anemia
• Therapeutic guidelines based on eminence (experts?) rather than evidence
• Lack of prospective interventional studies
• Solution: Longitudinal observational studies linked with translational studies

Study Design EU-MDS Registry I
• Newly diagnosed MDS patients (<3 months after diagnosis): no selection!
• IPSS low- and intermediate-1
• Total 1000 patients in 14 countries, 118 sites
• Primary objective: to analyze the impact of various disease and patient related factors, including co-morbidity and the impact of disease-management on the outcome

Study design EU-MDS Registry II
Secondary objectives
Investigate correlation between:
• Clinical characteristics at inclusion
• Secondary iron overload due to transfusions
• Administered treatment
and
• Overall survival & progression-free survival
• Performance status, quality of life

Number of Patients by Country
0 100 200 300
PLPODNIT
RONDAUGECZ
SWSPGRUKFR
Males Females
• 14 Countries
• 118 Centres
• Recruited:
• Jan 2008-Dec 2010
• Number of days from diagnosis to inclusion: – 42 median (0 to 98)

Age at Diagnosis 20
4060
8010
0A
ge a
t Dia
gnos
is (Y
ears
)
(total) SP FR GR PO UK SW PL DN IT AU RO GE CZ ND
Median age: 74 (19-95)

MDS Classification WHO 2001 MDS Classification Total Female Median Age (years)
N 1000 (100%) 40% 74
RA 176 (18%) 36% 75
RARS 182 (18%) 45% 76
RCMD 358 (36%) 35% 74
RCMD-RS 71 (7%) 37% 76
RAEB-1 116 (12%) 35% 72
RAEB-2 4 (0.4%) 50% 74
MDS-U 31 (3%) 39% 73
Del(5q) 62 (6%) 81% 74

IPSS & Cytogenetics IPSS Score Total
N 1000 (100%)
0 488 (49%)
0.5 312 (31%)
1 135 (14%)
Not Known 65 (7%)
Cytogenetics Total
N 1000 (100%)
Good 777 (78%)
Intermediate 145 (15%)
Poor 13 (1%)
Not Done 65 (7%)
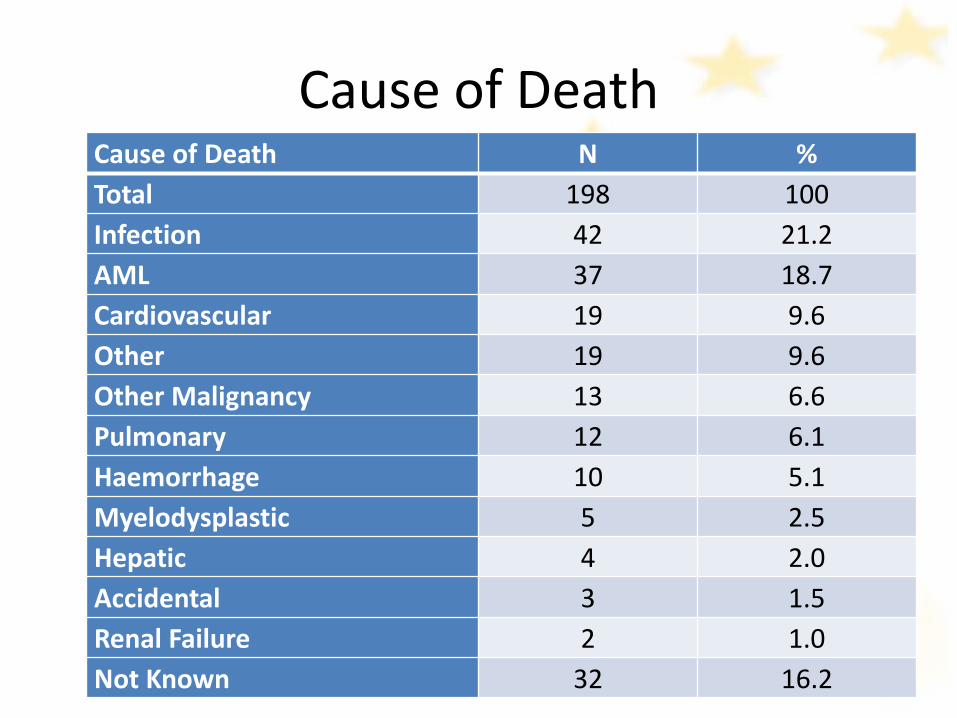
Cause of Death Cause of Death N % Total 198 100 Infection 42 21.2 AML 37 18.7 Cardiovascular 19 9.6 Other 19 9.6 Other Malignancy 13 6.6 Pulmonary 12 6.1 Haemorrhage 10 5.1 Myelodysplastic 5 2.5 Hepatic 4 2.0 Accidental 3 1.5 Renal Failure 2 1.0 Not Known 32 16.2

Outcome
Overall Survival
0.00
0.25
0.50
0.75
1.00
surv
ival
0 1 2 3 4Time - years
Kaplan-Meier survival estimate
Progression Free survival
0.00
0.25
0.50
0.75
1.00
surv
ival
0 1 2 3 4Time - years
Kaplan-Meier survival estimate
Died n=198 Progression to AML/High Risk MDS n=82

Overall Survival
IPSS WPSS
0.00
0.25
0.50
0.75
1.00
surv
ival
0 1 2 3 4Time - years
0 0.51
p<0.0001
Kaplan-Meier survival estimates
0.00
0.25
0.50
0.75
1.00
surv
ival
0 1 2 3 4Time - years
Very Low LowIntermediate High
p<0.0001
Kaplan-Meier survival estimates

Transfusions: Section Completed

Pre-transfusion Hb per Country Country Hb (g/dL)
Austria 8.3
Czech Republic 7.8
France 7.5
Germany 7.5
Greece 7.8
Italy 8.4
Netherlands 8.4
Poland 7.9
Rumania 7.0
Spain & Portugal 8.1
Sweden & Denmark 8.8
UK 8.0

Transfusion Status
Baseline
020
4060
8010
0pe
rcen
t
PO RO GR FR AU IT UK ND GE CZ DN SP SW PL
Yes No
Over Time
0.1
.2.3
Pro
porti
on T
rans
fuse
d
V1 V2 V3 V4 V5 V6 V7

Overall Survival Impact of transfusion dependency
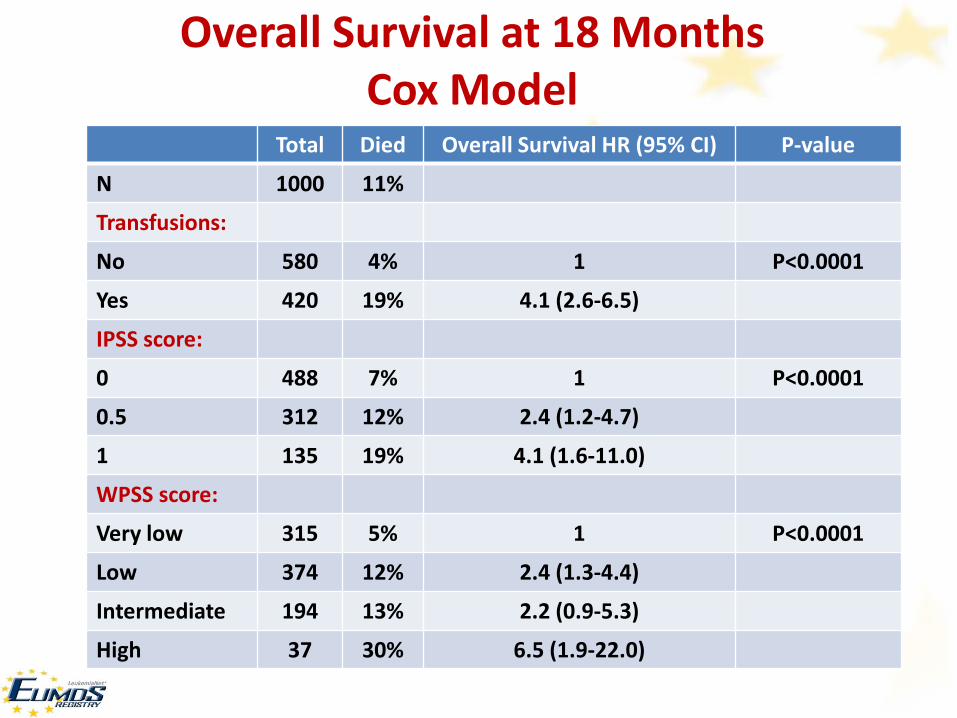
Overall Survival at 18 Months Cox Model
Total Died Overall Survival HR (95% CI) P-value
N 1000 11%
Transfusions:
No 580 4% 1 P<0.0001
Yes 420 19% 4.1 (2.6-6.5)
IPSS score:
0 488 7% 1 P<0.0001
0.5 312 12% 2.4 (1.2-4.7)
1 135 19% 4.1 (1.6-11.0)
WPSS score:
Very low 315 5% 1 P<0.0001
Low 374 12% 2.4 (1.3-4.4)
Intermediate 194 13% 2.2 (0.9-5.3)
High 37 30% 6.5 (1.9-22.0)

Overall Survival with or without progression percentage of blasts
Impact of transfusion dependency

MDS Treatment

Impact of Response to ESA treatment in transfusion naive MDS patients
Time to first post-ESA transfusion for all ESA-treated patients that had received no transfusions prior to ESA treatment stratified by the presence of a Response to ESA treatment.
p=0.052

Iron Chelation
N Percent
Total 74 100
Deferasirox 64 86.49
Deferoxamine 9 12.16
Deferiprone 1 1.35
• Days from Transfusion to start of chelation – 280.4 (6 -1087)
• Mean Ferritin Values – 1829.7 µg/L

Iron Chelation Therapy Planned analyses
• Control-group with:
- Transfusion-dependent patients
- Ferritin >1000
- No iron chelation therapy
• Compare two groups (iron chelation vs. control-group):
- Look at progression-free survival, overall survival at 12/18 months of follow-up
- Compare total units transfused between the two groups at each visit

adjusted for: age at diagnosis, sex, country, WHO Category, cytogenetics, number of cytopenia,% blasts, number of transfusions, ferritin levels (at registration or start of chelation)
Iron Chelation Therapy - Overall Survival at 18 Months by Chelation Status
Nr Median Ferritin Levels
HR (95% CI)
Adjusted HR (95% CI)
Chelation: No Yes
945 55
281
1779
1
2.05 (1.15-3.64)
1
0.36 (0.15-0.88) Mean number of units
Total No Chelation Chelation
5.9 4.6
28.9
- - -
- - -
- - -
Chelation & Transfusion Status (any visit)
No Transfusion / No Chelation Transfusion / No Chelation Transfusion / Chelation No Transfusion / Chelation Transfusion & Ferritin > 1000 No Chelation Chelation
570 375 52 3
134 94 40
345 377
1838 1224
- -
1 4.71 (3.01-7.36)
5.27 (2.71-10.26) -
1 0.75 (0.38-1.51)
1 3.61 (1.96-6.66) 1.47(0.50-4.31)
-
1 0.51 (0.19-1.32)
*
*

Prognostic relevance of the kinetics of worsening of cytopenias in lower-risk
MDS: a study from the European Leukemia Net low risk MDS registry
ASH Annual Meeting, Dec 10th 2012, Atlanta Abstract #700
Raphael Itzykson, Alex Smith, Theo de Witte, Jackie Droste, Reinhard Stauder, Argyris Symeonidis, Eva Hellstrom-Lindberg, Guillermo Sanz, Jaroslav Cermak, Otilia Georgescu, Mette Skov-Holm, Ulrich Germing, Marius MacKenzie, Odile Beyne-Rauzy, Luca Malcovati, David Bowen, and Pierre Fenaux.

Survival influenced by worsening of cytopenias
ELN registry n=1000
Study Cohort n=530
< 3 visits n=316
LEN, G-CSF, HMA or HY n=154
THb TANC TPLT ≥ 3 measurements: n= 508 495 509
Stable or declining (slope ≤0): n= 250 258 301
Median follow-up (months) 21.8 21.8 21.7
Median time to lose… (months) 1 g/dL 1.0 x10⁹/L 50 x109/L
23.5 28.7 26.9

TANC below median: Loss of 1.0 x10⁹/L in < 28.7 months
Equivalent to: Loss of > 0.42 x10⁹/L in 12 months
TPLT below median: Loss of 50 x109/L in < 26.9 months
Equivalent to: Loss of > 22 x109/L in 12 months
120 3624 48
0%20
%40
%10
0%60
%80
%
Time (months)
Ove
rall
Surv
ival
(%)
120 3624 48
0%20
%40
%10
0%60
%80
%Time (months)
Ove
rall
Surv
ival
(%)
TANC TPLT
above median below median
above median below median
HR=5.5 [2.3-13.4] P<10-4 HR=3.3 [1.7-6.4] P<10-4

Sorror Score of Co-morbidity
Mean Score 2.4, range (0 to 11)
AU
CZ
DN
FR
GE
GR
IT
ND
PL
PORO
SP
SW UK
0.5
11.
52
2.5
33.
54
4.5
Mea
n S
orro
r Sco
re

EQ-5D: Completeness of Data (First Visit)

Quality of Life by Transfusion Status
EQ-5D Dimension N (%)
Transfusion No Yes
P-value
Total 861 (100%) 608 (71%) 253 (29%)
Mobility No Problems 63% 44%
Problems 37% 56% P<0.0001
Self-Care No Problems 90% 79%
Problems 10% 21% P<0.0001
Usual activities No Problems 70% 53%
Problems 30% 47% P<0.0001
Pain/Discomfort No Problems 53% 41%
Problems 47% 59% P=0.002
Anxiety/Depression No Problems 62% 54%
Problems 38% 46% P=0.080

Mobility Self-care
EQ-5D Dimensions and Survival

Quality of Life by Transfusion Status
Blue: transfusion independent Red: transfusion dependent (any time)

Conclusions
• Transfusion-dependent patients have a worse overall survival, specially in patients without progression to leukemia
• Responding patients to ESA treatment have a longer transfusion-free period which may translate in a better survival
• Rapid decline of cytopenias predicts shortened survival
• Transfusion dependency is associated with decreased quality of life and a faster decline of quality of life
• The EU-MDS registry contains a unique data base in low risk MDS patients

Biobanking
The steering committee of the EU-MDS Registry agreed ( EHA; June 15th, 2012) :
• To focus our new studies within the ELN EUMDS registry on biobanking.
• To collect DNA prospectively in the patients still alive (>1,000 patients) and to collect retrospectively on the stored material: smears, biopsies (available in 50% of the patients), locally stored DNA samples
• To focus molecular studies on prognostic markers in a limited set of genes (32) with known relevant mutations
• Additional interesting set of genes might be genes involved in epigenetics, iron metabolism and hematopoiesis
• A grant application has been submitted to the 7th Framework Program of the EU (September 2012): 2-step procedure (first stage: outcome 12th December 2012)
