impact of decision support tools available for dairy farm
TRANSCRIPT

Improving cost-efficiency and profitability
2014 ADSA-ASAS-CSAS JAM Joint Annual Meeting, Kansas City MO, 20-24 July 2014!
Impact of Decision Support Tools Available for Dairy Farm Management
Victor E. Cabrera University of Wisconsin-Madison
Supported by several USDA National Institute of Food and Agriculture and Hatch USDA Grants from College of Agriculture and Life Sciences from the University of Wisconsin-
Madison


> 40 tools!

Elements of Decision Support Tools!UW-Dairy Management!
Category!
Name!
Short description!Link!
Supplementary !documentation!
Video!demonstration !

Decision support tools!Farm-specific assessments!
Every farm is different!
Farm conditions change!Decisions should adjust!
Market conditions change permanently!Prices and cost impact decisions!
Applications should be user-friendly!Still scientifically sound and robust!

DairyMGT.info!Established in 2008!
Mechanism to deliver !Science-based,!user-friendly,!and!practical-application!decision support tools!
Google Analytics!Registered in December 2009!
Own Tracking system!Implemented in!March 2011!

DairyMGT.info!
0 !10 !20 !30 !40 !50 !60 !70 !80 !90 !
100 !110 !120 !130 !140 !150 !160 !170 !180 !190 !200 !210 !
Dec
-09!
Jan-
10!
Feb-
10!
Mar
-10!
Apr
-10!
May
-10!
Jun-
10!
Jul-1
0!A
ug-1
0!Se
p-10!
Oct
-10!
Nov
-10!
Dec
-10!
Jan-
11!
Feb-
11!
Mar
-11!
Apr
-11!
May
-11!
Jun-
11!
Jul-1
1!A
ug-1
1!Se
p-11!
Oct
-11!
Nov
-11!
Dec
-11!
Jan-
12!
Feb-
12!
Mar
-12!
Apr
-12!
May
-12!
Jun-
12!
Jul-1
2!A
ug-1
2!Se
p-12!
Oct
-12!
Nov
-12!
Dec
-12!
Jan-
13!
Feb-
13!
Mar
-13!
Apr
-13!
May
-13!
Jun-
13!
Jul-1
3!A
ug-1
3!Se
p-13!
Oct
-13!
Nov
-13!
Dec
-13!
Jan-
14!
Feb-
14!
Mar
-14!
Apr
-14!
May
-14!
Jun-
14!
*Jul
-14!
Sess
ions
and
Pag
evie
ws
(1,0
00)!
Sessions = 64,500!

DairyMGT.info!

DairyMGT.info!
116 ~55%!
5.2!
7.4!
6.4!
4.9!
2.7!4.3!
2.4!2.8!
3!3.4!
2!
1.8!
1.4!1.7!
1.3!
1.2!
Pageviews (1,000), Dec09-Jul14!
All Other: 37.7!

DairyMGT.info!
55 ~50%!
Pageviews (%), Dec09-Jul14!
All Other: 5.9!
4.8!
4.2!
3.5!
3.3!
3.2!2.7!2.3!
1.4!
1.4!
1.4!
1.4!
1.3!
1.1!
0.9!0.8!
0.7!
0.7!0.7!
0.7!
0.7!
0.7!
0.6!
0.5!

DairyMGT.info!36%!
30%!
20%!
11%!
2%!
1%! 1%!

DairyMGT.info!
Computer!
Mobile!Tablet!
Not defined!
Pageviews (1,000)!
(94%)!
(2.3%)!
(2.0%)!
(1.5%)!

DairyMGT.info: Email lists!
Total! Monthly!
Total email registered! >6,000! >150!
FeedVal email list! >2,000! >50!

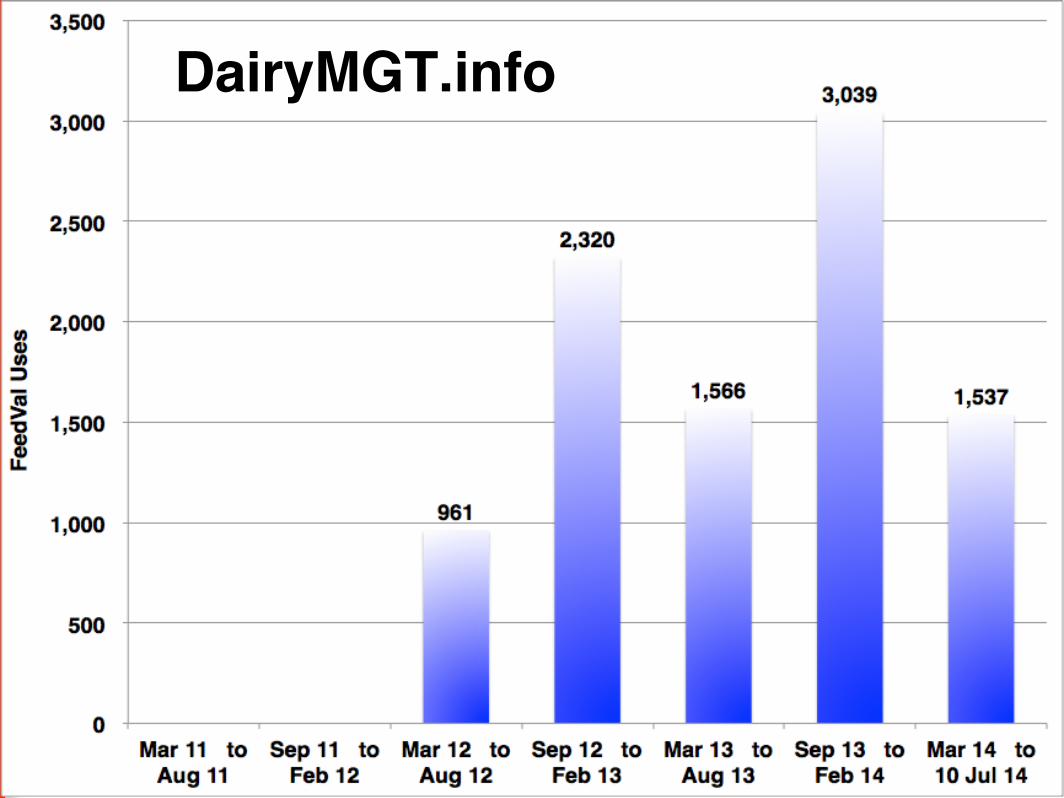
Decision Support ToolMar 11
to Aug 11
Sep 11 to
Feb 12
Mar 12 to
Aug 12
Sep 12 to
Feb 13
Mar 13 to
Aug 13
Sep 13 to
Feb 14
Mar 14 to 10 Jul 14
Grand Total
1. LGM-Dairy Insurance Related Tools 658 658 399 362 168 146 20 2,4112. Economic Value of Sexed Semen Programs for Dairy Heifers 78 167 1,406 239 107 69 1 2,0673. Wisconsin Dairy Farm Ratio Benchmarking Tool 769 504 177 211 140 200 118 2,1194. Dairy Reproductive Economic Analysis 528 501 359 278 283 286 256 2,4915. UW-DairyRepro$: A Reproductive Economic Analysis 338 251 574 660 78 279 59 2,2396. Grouping Strategies for Feeding Lactating Dairy Cattle 161 288 691 889 953 732 303 4,0177. FeedVal - - 961 2,320 1,566 3,039 1,537 9,4238. Strategic Alternatives to Corn Feeding Strategies 319 334 266 297 211 82 13 1,5229. The Economic Value of a Dairy Cow - - 424 741 618 935 321 3,03910. Economic Analysis of Switching from 2X to 3X Milking 140 339 267 290 185 90 77 1,38811. Optigen® Evaluator 277 205 230 163 78 28 - 98112. Heifer Replacement 236 214 223 263 111 96 24 1,16713. Milk Curve Fitter 17 296 266 220 126 106 49 1,08014. Lactation Benchmark Curves for Wisconsin 205 209 86 232 101 106 37 97615. Heifer Break-Even 182 163 144 263 118 96 26 99216. Decision Support System for DairyExpansion 147 105 97 137 50 56 27 61917. Herd Structure Simulation2 31 197 125 178 49 64 28 67218. Dairy Extension Feed Cost Evaluator - 43 305 450 286 332 123 1,53919. Cost-Benefit of Accelerated Liquid Feeding for Calves 102 128 83 85 51 43 - 49220. Milk Component Price Analysis 116 127 67 64 18 36 12 44021. Exploring Timing of Pregnancy Impact on IOFC 104 91 108 117 82 46 - 54822. Dairy Ration Feed Additive Break-Even Analysis 102 136 46 235 61 83 8 67123. Dynamic Dairy Farm Model 64 92 119 106 37 41 5 46424. Economic Evaluation of using rbST 32 58 100 93 57 55 15 41025. Dairy Nutrient Manager 49 49 55 99 22 32 9 31526. Grazing-N: Nitrogen Balance in Grazing Systems 55 42 26 27 17 15 1 18327. Working Capital2 - - 117 77 8 15 10 22728. Alfalfa Yield Predictor 33 21 32 46 13 11 7 16329. Heifer Pregnancy Rate - - - - 502 356 259 1,11730. Other 300 314 145 372 162 507 216 2,016Grand Total 5,043 5,532 7,898 9,514 6,258 7,982 3,561 45,788
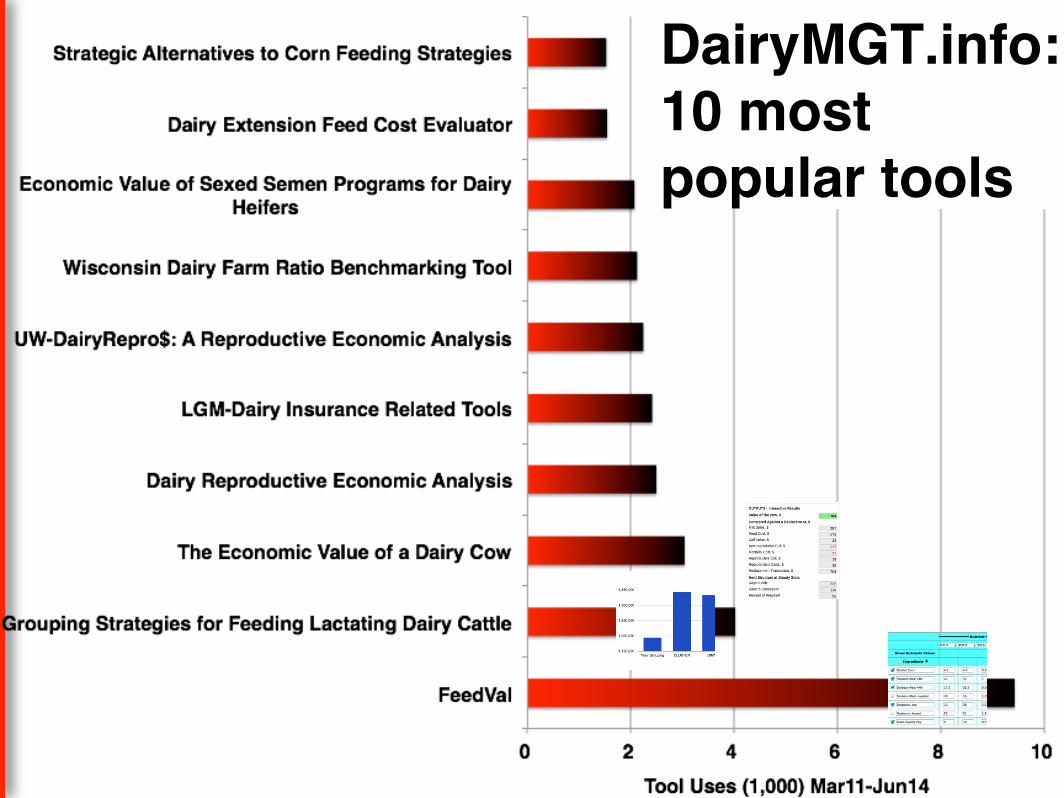
DairyMGT.info: 10 most popular tools!

DairyMGT.info!
DairyMGT.info!

DairyMGT.info!

DairyMGT.info: Units and languages!
Tool! Units! Language!
Economic value of sexed semen! Arg$!
UW-Dairy Repro! Arg$!
Income over feed supplement! metric, Arg$!
Heifer replacement, 2X to 3X milking! metric!
Economic value of a cow! metric, £!
FeedVal! metric!
CholiPEARL! metric, R$, €!
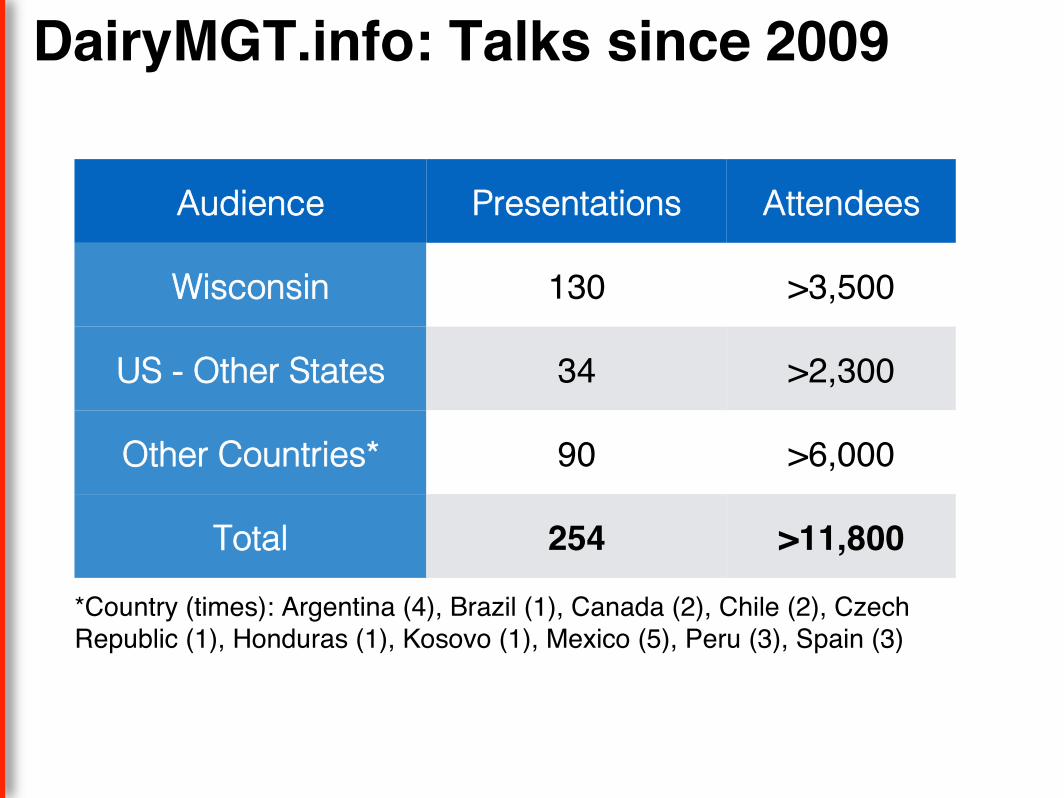
DairyMGT.info: Talks since 2009 !
Audience! Presentations! Attendees!
Wisconsin! 130! >3,500!
US - Other States! 34! >2,300!
Other Countries*! 90! >6,000!
Total! 254! >11,800!
*Country (times): Argentina (4), Brazil (1), Canada (2), Chile (2), Czech Republic (1), Honduras (1), Kosovo (1), Mexico (5), Peru (3), Spain (3)!

ReproMoney!Team-based program!To improve reproductive performance!
Farm-directed team!Farmer and advisors working together with common goals!
Self-operated !Facilitated by UW-Dairy Science:!María C. Cordoba !
"This project is supported by Agriculture and Food Research Initiative Competitive Grant no. 2010-85122-20612 from the USDA National Institute of Food and Agriculture.”!

Frequent meetings!Managers and advisors with specific focus on reproduction!
Assessing and improving repro!
Action items!! Baseline performance
levels!! Detect problems!! Set goals and target
dates!! Responsibilities of each
team member!! Evaluate progress!! Monitor improvement!! Motivate change!
Team members!Manager, owner, veterinarian, nutritionist, extension agent, etc.!

Reproduction is multifactorial!Many other areas of management are involved!
Looking at the big picture !
Improvements!! Overcrowding and cow
comfort!! Health issues!! Heat stress!! Nutrition!! Genetics and genomics!! Milk quality!! Reproduction programs!! New technologies in
reproduction!! …!

Group of committed advisors !From UW-Dairy Science and other departments!
Participant additional benefits!
Decision support tools available!Support in the use and application of tools!
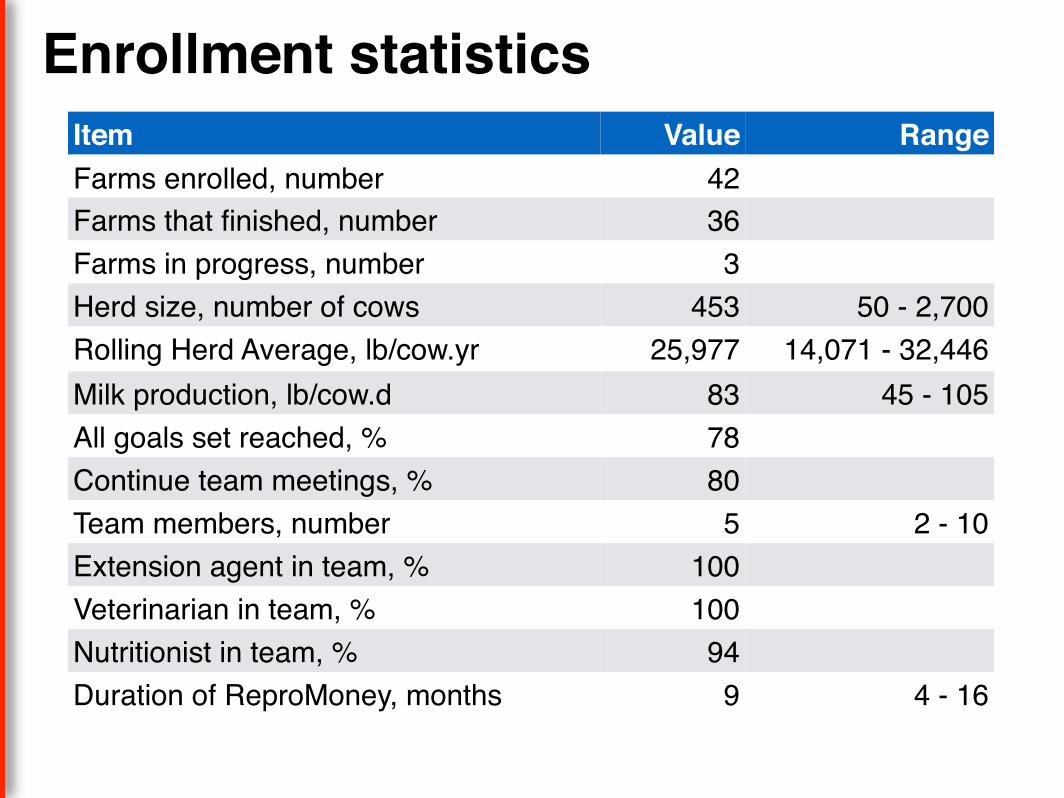
Enrollment statistics!Item Value! RangeFarms enrolled, number! 42Farms that finished, number 36Farms in progress, number 3Herd size, number of cows 453 50 - 2,700!Rolling Herd Average, lb/cow.yr 25,977 14,071 - 32,446!Milk production, lb/cow.d! 83 45 - 105All goals set reached, % 78Continue team meetings, %! 80Team members, number 5 2 - 10!Extension agent in team, %! 100Veterinarian in team, %! 100Nutritionist in team, % 94Duration of ReproMoney, months 9 4 - 16

Reproductive efficiency!
ReproMoney! Improvement Because
ReproMoney!p-value!
Item! Before! After!
21-d Pregnancy Rate*, %! 19 (7-29)! 22 (11-30)! 3 ! <0.0001!
Service Rate, %! 53 (30-70)! 56 ( 42-70)! 3 ! 0.007!
Conception Rate, %! 36 ( 21-60)! 36(21-48)! 3 ! 0.5!
Cows serviced 21-d past Voluntary Waiting Period, %!
78 (39-100)! 87 (55-100)! 9 ! 0.004!
Inter-breeding interval, d! 44 (29-64)! 41 (29-56)! -3 ! 0.03!
DIM for milking cows, d! 187 (244-152)! 179 (209-142)! -8 ! 0.02!
*58% (21/36) farms improved pregnancy rate, 22% (8/36) maintained same pregnancy rate!

Estimated Economic Gain!
Item! Value! Range!
Economic Gain, $/cow.yr! 61! 11 - 165!
Economic Gain, $/herd.yr! 16,865! 1,188 - 56,364!
Gain of participants, $/year! 354,165!

Success story!Dairy farm in South Central Wisconsin!! 400 cows!! 28,000 lb/cow.yr!
Description of original reproductive program!! Double Ovsynch for first service!! Ovsynch for second and subsequent services!! Heat breeding in between re-synchronizations!! Main goal: Improve their 18% 21-d pregnancy rate!

Success story!Improvements made by team consensus!! Record and treat cystic cows with 7-d CIDR Synch
protocol!! Changed OvSynch-48 to OvSynch-56 to better sync
AI to ovulation!! Focus on transition:!
! Stall improvements!! 15% more bedding stalls!! Special care to heifer reproductive program!
Outcomes after a year!! 21-d Pregnancy Rate = 24%!! Economic gain a year = $100/cow = $40,000/herd!! Team-based still part of dairy management program!

© 2011 Wisconsin Milk Marketing Board, Inc.
Thanks!