impact of india-asean free trade agreement: a cross … no. 107.pdf · optical and photographic...
TRANSCRIPT

Impact of India-ASEAN Free Trade Agreement: A cross-country analysis using applied general equilibrium
modelling
By
Chandrima Sikdar*
Biswajit Nag**
*Associate Professor, Narsee Monjee Institute of Management Studies, Mumbai and **Associate Professor Indian Institute of Foreign Trade (IIFT), New Delhi The authors are grateful to Mia Mikic, ESCAP Trade and Investment Division, and anonymous experts for their valuable comments. The technical support of the United Nations Economic and Social Commission for Asia and the Pacific and ARTNeT Secretariat is gratefully acknowledged. The opinion, figures and estimates are the responsibility of the authors and should not be considered as reflecting the views or carrying the approval of the United Nations, ARTNeT, IIFT or NMIMS. Any remaining errors are the responsibility of the authors, who can be contacted at [email protected] and [email protected]
The Asia-Pacific Research and Training Network on Trade (ARTNeT) is aimed at building regional trade policy and facilitation research capacity in developing countries. The ARTNeT Working Paper Series disseminates the findings of work in progress to encourage the exchange of ideas about trade issues. An objective of the series is to get the findings out quickly, even if the presentations are less than fully polished. ARTNeT working papers are available online at www.artnetontrade.org. All material in the working papers may be freely quoted or reprinted, but acknowledgment is requested, together with a copy of the publication containing the quotation or reprint. The use of the working papers for any commercial purpose, including resale, is prohibited.
Asia-Pacific Research and Training Network on Trade Working Paper Series, No 107, November 2011

1
Contents
EXECUTIVE SUMMARY .........................................................................................................2
INTRODUCTION ......................................................................................................................4
A. Objective of the study.......................................................................................................................... 8
B. Literature review ................................................................................................................................. 8
C. Methodology..................................................................................................................................... 11
D. Analytical framework........................................................................................................................ 12
E. Results of the simulations .................................................................................................................. 14
F. Other impacts of FTA in India and ASEAN....................................................................................... 32
G. Rules of origin .................................................................................................................................. 35
H. Effect of FTA on trade with other important partners of India and ASEAN ........................................ 37
I. Extension of original GTAP framework to incorporate increasing returns to scale and imperfect
competition in India................................................................................................................................ 38
J. Conclusion ........................................................................................................................................ 40
ANNEXES................................................................................................................................44
Annex 1. Summary of Literature review.................................................................................................. 44
Annex 2. Tables showing some data and results of various simulations.................................................... 47
Annex 3. Understanding the welfare decomposition for a developing economy........................................ 56
Annex 4. Simple model for India’s welfare gain/loss from India-ASEAN FTA........................................ 59
REFERENCES .........................................................................................................................62

2
Executive summary
The India-ASEAN Free Trade Agreement (AIFTA) came into effect on 1 January 2010
with regard to Malaysia, Singapore and Thailand. For the remaining ASEAN members it will
come into force after they have completed their internal requirements. With this background, the
present study analyses the impact of this free trade agreement (FTA) on India and the ASEAN
members.
Using the Global Trade Analysis Project (GTAP) database, several simulations were
undertaken, involving different scenarios, of India’s trade liberalization with the ASEAN region.
The results of the simulations were used to assess the impact of this liberalization, both on the
external sector and on domestic macroeconomic variables in India and ASEAN. The welfare
implications of the FTA for the countries were also studied and the impact on the trade of other
countries, including selected South Asian countries, was investigated.
The simulation results reveal that post-FTA, India’s exports to ASEAN increase
substantially, with the largest accesses gained in Thailand, Cambodia, Viet Nam, Malaysia, the
Philippines and the Lao People’s Democratic Republic. The main sources of imports are Viet
Nam, followed by the rest of ASEAN, the Philippines, Malaysia, Singapore and Thailand.
However, India experiences a welfare loss due to both allocative inefficiency and negative terms
of trade effect.
In the ASEAN region, Malaysia, Singapore and Thailand show positive welfare gains
with the largest gain accruing to Singapore. The smaller countries all enjoy positive welfare
gains except Cambodia, the Lao People’s Democratic Republic and the Philippines. This welfare
gain by ASEAN countries is primarily due to their improved terms of trade.
The simulation results also reveal that the rest of the world experiences a significant
market share loss in India and the ASEAN members. In particular, China is affected by a loss of
market share in Cambodia, India, Malaysia, the Philippines, Thailand, and Viet Nam. A similar

3
impact of the FTA is seen in the case of the South Asian developing countries, particularly
Bangladesh. Thus, trade diversion occurs in the India-ASEAN region as a result of the FTA.
The study also attempted to analyse the long-term effects of the FTA on India. It is
argued that after full trade liberalization, India’s allocative efficiency will increase, but the terms
of trade effect will worsen continuously and remain negative. India will be able to arrest the
worsening in terms of trade once the gain in allocative efficiency is used to improve productivity
in the export-oriented sectors as well as achieve economies of scale.
4
Introduction
India announced its “Look East” policy in 1991 in an attempt to increase its engagement
with the East Asian countries. Consequently, in 1992, it became a sectoral dialogue partner of
the Association of Southeast Asian Nations (ASEAN). ASEAN, which is a geo-political and
economic organization with 10 member countries, was formed in August 1967 by Indonesia,
Malaysia, the Philippines, Singapore and Thailand. Since then, the membership has expanded to
include Brunei Darussalam, Cambodia, the Lao People’s Democratic Republic, Myanmar and
Viet Nam. ASEAN’s objectives are to accelerate economic growth, social progress and cultural
development among its members, protect the peace and stability of the region, and provide
opportunities for the member countries to discuss their differences peacefully.
India became a Full Dialogue Partner of ASEAN in 1995and a member of the ASEAN
Regional Forum (ARF) in 1996. India and ASEAN signed a Framework Agreement – the
Comprehensive Economic Cooperation Agreement (CECA) – on 8 October 2003 with a view to
providing an institutional framework that would enable economic cooperation to come into
effect. Negotiations on a trade in goods agreement between India and ASEAN were started in
March 2004. The negotiations continued for six years and finally the India-ASEAN Free Trade
Agreement (AIFTA) was signed on 13 August 2009 in Bangkok during a meeting of the
Economic Ministers of ASEAN. The agreement, which only covers trade in goods between India
and the ASEAN members, came into effect on 1 January 2010 in the case of Malaysia,
Singapore and Thailand. For the remaining ASEAN members it will come into force after they
have completed their internal requirements.
AIFTA will boost bilateral trade between the two regions. ASEAN is a major trading
partner of India and it accounted for 9.27 per cent of India’s global trade in 2008. In 2008/09,
bilateral trade between India and ASEAN was worth almost US$ 45 billion. India and ASEAN
set a target of achieving bilateral trade of US$ 50 billion by 2010, a goal that is likely to be
achieved (Dash, 2010). India’s trade with ASEAN is mainly concentrated in Indonesia,
Malaysia, Singapore and Thailand. These four countries remain the largest markets for Indian
5
exports in the ASEAN region as well as the largest sources for India’s imports from the ASEAN
region. Among them, Singapore is the largest destination for Indian goods (45.6% of total
exports to ASEAN in 2008) and the largest source of imports for India (31.1% of India’s total
imports from ASEAN in 2008), followed by Malaysia, Indonesia and Thailand.

6
Table 1. India’s exports to, and imports from ASEAN members, 2004-2008 (Unit: US$ ’000)
Source: International Trade Centre trade maps.
Exports Imports ASEAN members 2004 2005 2006 2007 2008 2004 2005 2006 2007 2008 Brunei Darussalam 4 956 4 395 44 462 8 814 17 155 455 832 225 719 234 094 325 861
Cambodia 16 74 21 350 48 089 44 826 53 854 234 425 1 482 1 245 4 271
Indonesia 1 205 594 1 390 066 1 869 806 1 878 196 2 659 314 2 427 665 3 018 949 3 610 443 4 840 346 6 431 337
Malaysia 1 040 207 1 143 775 1 331 365 1 850 254 3 034 408 2 214 486 2 435 996 4 655 925 5 725 558 7 461 390
Myanmar 112 698 117 246 124 088 162 757 237 333 410 685 489 162 702 698 809 067 906 267
Lao People's Democratic Republic 953 6 540 2 362 2 939 4 591 92 72 376 80 525
Philippines 362 923 482 110 596 836 571 413 755 025 180 851 203 196 208 768 173 536 227 640
Singapore 3 416 459 5 427 555 6 127 250 6 390 068 8 853 900 2 492 155 3 159 416 5 184 562 6 901 607 8 304 751
Thailand 856 828 1 059 267 1 350 985 1 673 337 2 005 280 750 164 1 196 597 1 550 809 2 192 368 2 664 791
Viet Nam 534 846 633 465 874 098 1 241 477 1 812 607 73 208 127 378 159 826 153 134 371 605
Total 7 552 218 10 285 769 12 369 341 13 824 081 19 433 467 8 549 995 10 632 023 16 300 608 21 031 035 26 698 438
Per cent share in India's total exports9.95 10.25 10.21 9.48 10.69 - - - - -
Per cent share in India's total imports- - - - - 8.64 7.55 9.15 9.62 8.46

7
The trade agreement between India and ASEAN has already come into effect with regard to all these countries, with the exception of Indonesia. Starting from January 2010, the tariff liberalization under the India-ASEAN FTA was to gradually cover 75% of the two-way trade between India and the ASEAN member countries. The FTA will lead to the elimination of tariffs on some 4,000 products including electronics, chemicals, machinery and textiles. Of these 4,000 products, 3,200 products will have duties reduced by the end of 2013, while duties on the remaining 800 products will be lowered to zero or almost zero by the end of 2016.
Under the Trade in Goods Agreement, the Schedules of Tariff Commitments has been
drawn up by all the member countries, indicating product-wise tariff concessions or no concessions. The tariff commitments of India are divided in the three categories (table 2).
Table 2. India’s tariff commitments under India-ASEAN trade in goods agreement
Tariff elimination Tariff reduction Negative
List/Exclusion List
Normal Track 1: 7,775 products (at the HS 8-digit level) through annual cuts between 1 January 2010 and 31 December 2013.
Normal Track 2: 1,252 (at the HS 8-digit level) products through annual cuts between 1 January 2010 and 31 December 2016.
Sensitive Track: Reduction to 5% on 1,805 (at HS 8-digit level) products through annual cuts between 1 January 2010 and 31 December 2016.
Highly Sensitive Track: Reduction to 37.5% on crude palm oil, 45% on refined palm oil, coffee, tea and 50% on pepper through annual cuts between 1 January 2010 and 31 December 2019.
No tariff concession is offered for 1,297 products (at the HS
8-digit level).
Source: Dash, 2010.
The main exports by India to the ASEAN region include meat, edible vegetables and fruit, cereals, cotton, tobacco, mineral fuels, salt, sulphur, organic chemicals, pharmaceutical products, iron and steel, copper, electrical and electronic equipment, and machinery. The main imports by India from the ASEAN region include mineral fuels, animal and vegetable fats, chemicals, pharmaceutical products, rubber products, wood products, iron and steel, wearing apparel, electrical and electronic equipment, machinery, ships, boats and floating structures, optical and photographic equipment, and musical instruments. With the implementation of the trade in goods agreement, most of these goods will be granted duty-free entry to the markets of the partner countries in the ASEAN region as well as in India.

8
A. Objective of the study
Against the above backdrop, the present study analysed the impact of the trade agreement on India and the ASEAN members. The study used the Global Trade Analysis Project (GTAP) for this purpose. The GTAP model is a comparative, static multi-regional computable general equilibrium (CGE) model that uses a common global database. This is an analytical tool used to understand the dynamics of major economic variables in a simulated environment. Using this database, a number of simulations were carried out by this study, involving different scenarios of (a) India’s trade liberalization with regard to Malaysia, Singapore and Thailand; (b) liberalization with all 10 ASEAN countries (as will be the case by 2019); and (c) full liberalization if tariffs on all products traded between India and the ASEAN members are completely eliminated.
The results of the simulations were then used to assess the impact of liberalization on India
and ASEAN members as well as on some other countries. The welfare implications of the FTA for the countries involved were studied in the case of where (a) perfect competition and constant returns to scale and imperfect competition, and (b) increasing returns to scale characterize the production structure in the Indian economy. Thus, the study revealed different possibilities of welfare and other macroeconomic implications, which will help policymakers to assess the actual situation so that a proper domestic policy can be formulated as this agreement gradually takes effect.
B. Literature review The negotiations between India and the ASEAN representatives during the past few years
have created considerable interest among researchers across the world. Pal and Dasgupta (2009) studied the tariff schedule of India and made a preliminary evaluation of the India-ASEAN FTA. By analysing India’s commitment schedule, and by studying the production structure of the ASEAN members, the present study concluded that sectors such as tea, spices, coffee and rubber will be negatively affected. The marine products, textiles and garments, and auto components industries are also likely to face increased competition. The study points out that the net effect of the trade agreement crucially depends on the ability of the Government of India to redistribute some of the increased wealth gained from this trade agreement to those industries negatively affected by the agreement. Pal and Dasgupta (2008) concluded that, on the basis of a similar study, India was unlikely to benefit in the short term from the India-ASEAN FTA. They pointed out that ASEAN was not a natural trading partner of India, and, unlike China, has not established close relations with the region. However, the agreement may make strategic sense in the long term, if India looks at the option of becoming a hub for services exports to the ASEAN region.
Harilal (2010) made a similar study that assessed the likely impact of the India-ASEAN
agreement on the economy of Kerala in southern India. In fact, southern India, particularly Kerala, and South-East Asia have many features in common. This is especially true in the case of the agricultural and allied sectors and the agro-based industries. The agro-climatic conditions and cropping patterns are almost the same in the two regions. On the basis of India’s tariff schedule and the provision for rules of origin (RoO) under AIFTA, the study concluded that AIFTA would be detrimental to the interests of tropical commodity producers in Kerala. This is due to the competitive nature of the production structure of Kerala vis-à-vis the ASEAN members. Free
9
trade in tropical commodities under the provision of AIFTA is likely to add to the already existing problem of severe price instability with regard to these products, in addition to pushing down the share of the producers in the value chain.
Lee and Liew (2007) also attempted to measure the impact of the then proposed India-
ASEAN Free Trade Area (FTA). They used the Augmented Dickey-Fuller (ADF), and the Phillips and Perron (PP) test results to indicate that India and ASEAN were relatively integrated with regard to goods and services markets; however, they found that the Purchasing Power Parity (PPP) evidence to be comparatively weaker. Financial market integration, however, was found to be significantly incomplete. The main implication of this finding is that the impact of liberalization will be great on financial markets. Due to the weak PPP evidence, the goods and services markets will also experience a substantial impact from liberalization. Therefore it was suggested that the two regions could further exploit their FTA partnership in their complementary areas, particularly in both the goods and services markets, and financial markets.
Sen, Asher and Rajan (2004) studied the then status and future prospects of India-ASEAN
economic relations, and suggested that significant potential existed for greater economic cooperation between the two sides. However, their study was not based on any theoretical model-building exercise. Karmakar (2005) analysed the opportunities in services trade that might arise out of Indian-ASEAN economic cooperation, and assessed the net gains that could arise from liberalization of the service sector. They analysed the economic scenario in the Asia-Pacific region and took a macro overview of the trade creation potential of an agreement on trade in services between India and the members of ASEAN. They suggested that, at least in the medium term, much could be gained from a bilateral engagement between India and ASEAN in services, especially as the latter region remains relatively closed to foreign service providers. However, their study was also not based on any theoretical model. Although some studies attempted to study the possible impact of the India-ASEAN FTA, few were based on theoretical model-building. Some of the more recent studies that have used models to analyse the likely impact of India-ASEAN FTA are discussed below.
Kawai and Wignaraja (2007) used a CGE model to examine the economic impact of forming various types of FTAs in East Asia among such groups as ASEAN+1 (ASEAN+China, ASEAN+Japan, ASEAN+Republic of Korea, ASEAN+India and ASEAN+CER) mainly in the form of free trade agreements (FTAs) or comprehensive economic partnership agreements, ASEAN+3 (ASEAN, China, Japan and the Republic of Korea), ASEAN+6 (ASEAN+3, Australia, New Zealand and India). They concluded that of the plausible regional trade arrangements, consolidation at the ASEAN+6 level would yield the largest gains for East Asia. For such a consolidation to occur, ASEAN must act as the regional “hub” by further broadening and strengthening ASEAN economic integration, while the plus-three countries (China, Japan and the Republic of Korea) need to collaborate more closely, and India needs to pursue further structural reforms. Thus, Kawai and Wignaraja (2007) looked at the impact of multilateral trading agreements to which India and the ASEAN members are parties, rather than bilateral trading agreement between India and ASEAN region.
Similarly, using a gravity model and a CGE model, Sasatra and Prasopchoke (2007)
examined the trade potential and the economic impact of bilateral free trade agreements between
10
the ASEAN-5 member countries (Indonesia, Malaysia, the Philippines, Singapore and Thailand) and the seven-candidate FTA partners (Australia, India, Japan, New Zealand, the Republic of Korea and the United States). Their study suggested that the strategic FTA partners of ASEAN-5 to be the ASEAN+3, ASEAN-China, ASEAN-United States, ASEAN-Japan and ASEAN-India FTAs. Sasatra and Prasopchoke (2007) also showed that ASEAN-5 would gain greater benefits from the FTAs if they fully liberalized trade among themselves. This would be due in part to less trade diversion, better resource allocation and terms-of-trade effect improvement. The results clearly indicated the potential for gains from intraregional free trade and pointed towards the importance of ASEAN regional cooperation.
Veeramani and Saini (2010) carried out a quantitative assessment of the impact of AIFTA on selected plantation commodities, i.e., coffee, tea and pepper, in India. A partial equilibrium modelling approach (SMART and gravity models) was used to simulate the likely increase in imports of the plantation commodities by India under the proposed tariff reduction schedules of the India-ASEAN FTA. The results suggested that AIFTA would lead to a significant increase in such imports by India, driven mainly by trade creation rather than trade diversion. The analysis showed that the proposed tariff reductions under the India-ASEAN trade agreement might lead to a significant loss of tariff revenue for the Government of India. However, the gain in consumer surplus (due to falls in domestic prices and the consequent reduction in dead-weight loss) would outweigh the tariff revenue loss, leading to a net welfare gain. However, Veeramani and Saini (2010) only discussed and analysed the likely impact and welfare implications of the India-ASEAN FTA for India for some selected plantation commodities only, using a partial equilibrium model to do so.
Ahmed (2010) investigated the sectoral dimensions of the India-ASEAN FTA as a result of tariff liberalization. Using GTAP and SMART models, the study showed that both India and ASEAN would gain in terms of welfare while the terms of trade for India would deteriorate. The study revealed that, in the case of India, the processed food products, grain crops, textiles and wearing apparel, light manufacturing goods and heavy manufacturing sectors were likely to be significantly affected. ASEAN’s exports of processed food items, and agricultural and fisheries products were likely to increase, which could have an adverse impact on employment and wages among the Indian working class. Ahmed also found that the present FTA would adversely affect India’s trade balance and cause revenue losses for the Government. To understand the impact on unskilled workers, the study considered sticky wages and allowing factors of production to adjust accordingly. The study analysed the impact of the FTA with complete tariff elimination with regard to bilateral trade between India and ASEAN. It is important to note that none of the above studies take into account the final tariff schedule as agreed by India and ASEAN members. Also, no analysis has been made of the overall impact on India as well as ASEAN members under the phased liberalization schedule as agreed in the FTA. The objective of the present study therefore was to fill this gap by using a general equilibrium methodology to help in assessing the possible impact of this trade agreement on the India economy as well as on ASEAN members. The literature survey is summarized in table 1 in the annex.

11
C. Methodology A complete analysis of trade and trade-related issues requires an analytical framework that takes into account a holistic view of the economies across the world. This is because not only are interlinkages present between various sectors of an economy; sectors in an economy are also linked to the rest of the world through, for example, exports and imports of final products, intermediate goods, capital goods. Thus, linkages are present at the national, regional and global levels both in terms of products and in the input markets. Thus, in order to fully take into account these interlinkages, the present study used the Global Trade Analysis Project (GTAP) as the analytical tool. The CGE modelling framework of GTAP is one of the best possible ways of analysing, ex ante, the economic consequences and trade implications of multilateral and bilateral trade agreements.
The present study used version 7 of the GTAP database and the GTAP modelling framework to study the impact of India-ASEAN trade liberalization on important macroeconomic variables such as output, employment, wages, prices and welfare of the economies of India and the ASEAN member countries. The impact of trade liberalization on trade structure and bilateral trade between India and ASEAN members was also studied, and the extent of trade creation and trade diversion effects were examined. Finally, by incorporating features of imperfect competition and scale economies for certain manufacturing sectors in India, the study investigated the implications of trade liberalization on the selected economies. In order to assess the possible impact of AIFTA, various simulations were carried out for the following two scenarios (table 3):
(a) When the FTA has come into force between India, Malaysia, Singapore and Thailand only:
(b) When the FTA is eventually implemented with all the ASEAN members.
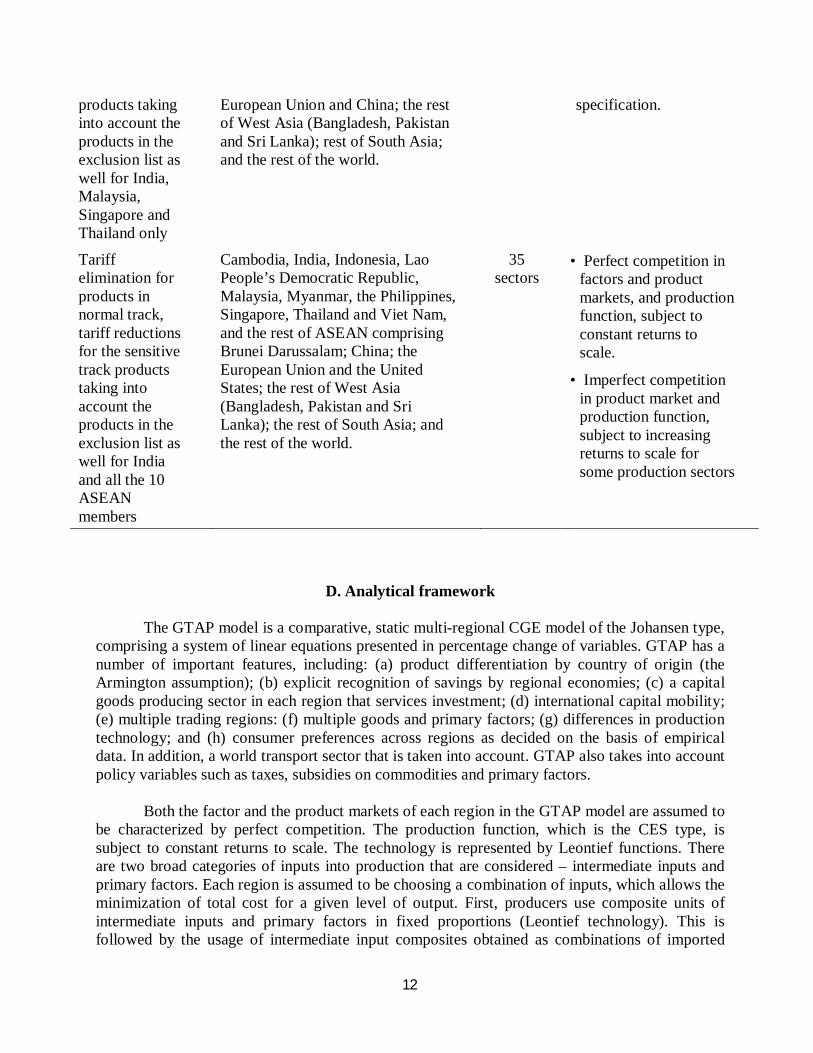
Table 3. Various simulations using the GTAP 7 database
Simulations Regional aggregation Sectoral
aggrega
tion
Model specification
Full liberalization
35 sectors
Perfect competition in factors and product markets, and production function, subject to constant returns to scale – this is standard GTAP specification.
Tariff elimination for normal track products, tariff reductions for sensitive track
Cambodia, India, Indonesia, Lao People’s Democratic Republic, Malaysia, Myanmar, the Philippines, Singapore, Thailand and Viet Nam, and the rest of ASEAN (Brunei Darussalam); the United States,
35 sectors
Perfect competition in factors and product markets, and production function, subject to constant returns to scale – this is standard GTAP
12
D. Analytical framework
The GTAP model is a comparative, static multi-regional CGE model of the Johansen type, comprising a system of linear equations presented in percentage change of variables. GTAP has a number of important features, including: (a) product differentiation by country of origin (the Armington assumption); (b) explicit recognition of savings by regional economies; (c) a capital goods producing sector in each region that services investment; (d) international capital mobility; (e) multiple trading regions: (f) multiple goods and primary factors; (g) differences in production technology; and (h) consumer preferences across regions as decided on the basis of empirical data. In addition, a world transport sector that is taken into account. GTAP also takes into account policy variables such as taxes, subsidies on commodities and primary factors.
Both the factor and the product markets of each region in the GTAP model are assumed to be characterized by perfect competition. The production function, which is the CES type, is subject to constant returns to scale. The technology is represented by Leontief functions. There are two broad categories of inputs into production that are considered – intermediate inputs and primary factors. Each region is assumed to be choosing a combination of inputs, which allows the minimization of total cost for a given level of output. First, producers use composite units of intermediate inputs and primary factors in fixed proportions (Leontief technology). This is followed by the usage of intermediate input composites obtained as combinations of imported
products taking into account the products in the exclusion list as well for India, Malaysia, Singapore and Thailand only
European Union and China; the rest of West Asia (Bangladesh, Pakistan and Sri Lanka); rest of South Asia; and the rest of the world.
specification.
Tariff elimination for products in normal track, tariff reductions for the sensitive track products taking into account the products in the exclusion list as well for India and all the 10 ASEAN members
Cambodia, India, Indonesia, Lao People’s Democratic Republic, Malaysia, Myanmar, the Philippines, Singapore, Thailand and Viet Nam, and the rest of ASEAN comprising Brunei Darussalam; China; the European Union and the United States; the rest of West Asia (Bangladesh, Pakistan and Sri Lanka); the rest of South Asia; and the rest of the world.
35 sectors
• Perfect competition in factors and product markets, and production function, subject to constant returns to scale.
• Imperfect competition in product market and production function, subject to increasing returns to scale for some production sectors

13
bundles and domestic goods of the same input-output class, and primary factor input composites that are obtained as combinations of skilled labour, unskilled labour, capital, land and natural resources. A CES function is used to create both the composites. Finally, imported bundles are created with the help of CES aggregation of imported goods of the same class from each region.
With regard to the demand side, GTAP uses a sophisticated specification of consumer behavior that allows for differences both in price and in income responsiveness of demand in each region. This depends on the level of development of the region and the region-specific demand patterns. Each region is characterized by a single representative household that receives all income that is generated from payments to primary factors and net tax revenue. The representative household is governed by an aggregate utility function over private household consumption, government consumption and savings. The aggregate utility function is the Cobb-Douglas type where the utility is derived from demand for a composite of commodities (the demand being a CES aggregation of imports and domestic goods). Private household consumption is represented by a CDE expenditure function. The bundles of commodities purchased by households are a CES aggregation of imported bundles and domestic goods.
Capital accumulation occurs in each region, the technology for which is similar to producing current goods except that it requires only domestic and imported intermediate inputs. It is this capital accumulation that helps in investment in the region that is financed by a global pool of savings. Each region considered in the model contributes a share of its income to a savings pool maintained at a global bank. The global bank mediates world savings and investment.
A competitive equilibrium in the global economy (as presented above) is such that, given the prices of the commodities and factors, demand and supply of goods are equal at the regional and global levels. The factor markets clear at both the regional and the global level, and consumers in each region maximize their utility, subject to their income constraints and the government budget, and trade is balanced for each region.
1. GTAP database The database used for the study was taken from the Global Trade Analysis Project
(GTAP) as compiled by the Centre for Global Analysis, Purdue University, United States. The database used was version 7. The reference year for the database corresponds to the global economy in 2004. The database is compiled for bilateral exports and imports, and tariffs inclusive of other flows for 113 regions across the world and for 57 tradeable commodities of the world. Of the 113 regions, 94 are primary regions that are developed from contributed I-O tables of the respective countries; the remaining 19 are composite regions. All the trade flows across the 57 commodities are distinguished by their regions of origin and destination, and are based on agents such as intermediate demand, final demand by private households, government and investment. It provides a method for allowing for varying import intensities by different economic agents within a region. The tariff data are mainly in the form of applied ad valorem rates.
14
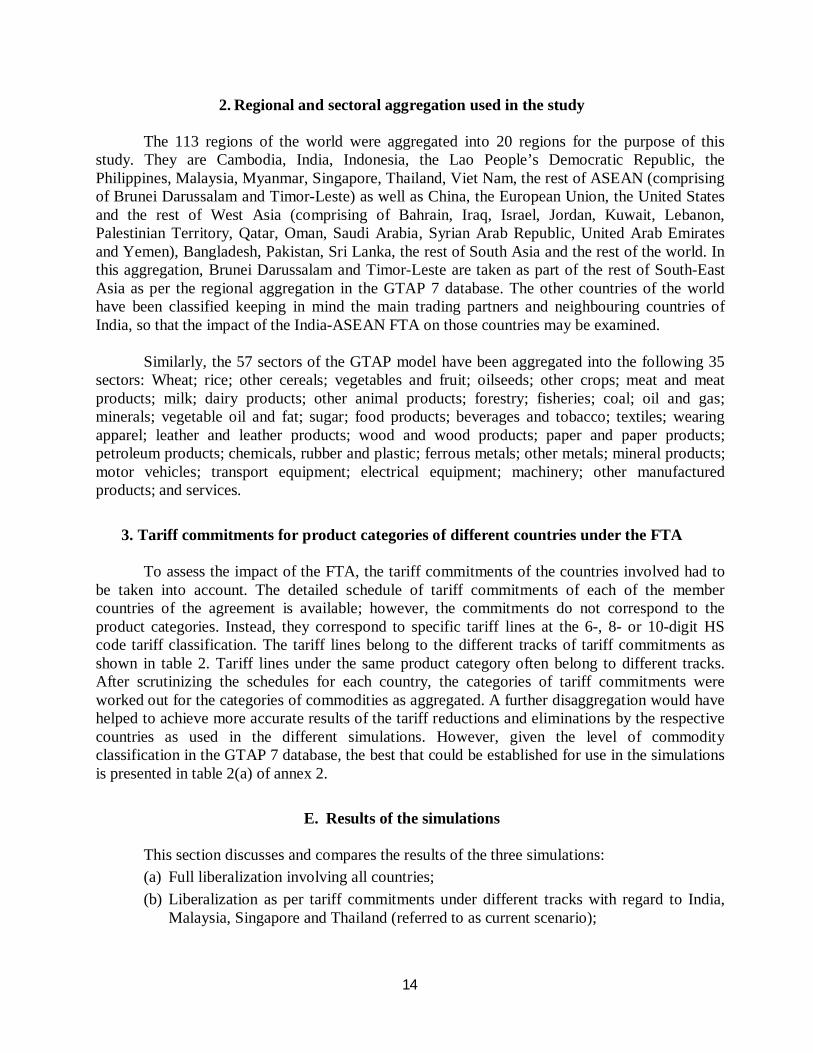
2. Regional and sectoral aggregation used in the study The 113 regions of the world were aggregated into 20 regions for the purpose of this
study. They are Cambodia, India, Indonesia, the Lao People’s Democratic Republic, the Philippines, Malaysia, Myanmar, Singapore, Thailand, Viet Nam, the rest of ASEAN (comprising of Brunei Darussalam and Timor-Leste) as well as China, the European Union, the United States and the rest of West Asia (comprising of Bahrain, Iraq, Israel, Jordan, Kuwait, Lebanon, Palestinian Territory, Qatar, Oman, Saudi Arabia, Syrian Arab Republic, United Arab Emirates and Yemen), Bangladesh, Pakistan, Sri Lanka, the rest of South Asia and the rest of the world. In this aggregation, Brunei Darussalam and Timor-Leste are taken as part of the rest of South-East Asia as per the regional aggregation in the GTAP 7 database. The other countries of the world have been classified keeping in mind the main trading partners and neighbouring countries of India, so that the impact of the India-ASEAN FTA on those countries may be examined.
Similarly, the 57 sectors of the GTAP model have been aggregated into the following 35
sectors: Wheat; rice; other cereals; vegetables and fruit; oilseeds; other crops; meat and meat products; milk; dairy products; other animal products; forestry; fisheries; coal; oil and gas; minerals; vegetable oil and fat; sugar; food products; beverages and tobacco; textiles; wearing apparel; leather and leather products; wood and wood products; paper and paper products; petroleum products; chemicals, rubber and plastic; ferrous metals; other metals; mineral products; motor vehicles; transport equipment; electrical equipment; machinery; other manufactured products; and services.
3. Tariff commitments for product categories of different countries under the FTA To assess the impact of the FTA, the tariff commitments of the countries involved had to
be taken into account. The detailed schedule of tariff commitments of each of the member countries of the agreement is available; however, the commitments do not correspond to the product categories. Instead, they correspond to specific tariff lines at the 6-, 8- or 10-digit HS code tariff classification. The tariff lines belong to the different tracks of tariff commitments as shown in table 2. Tariff lines under the same product category often belong to different tracks. After scrutinizing the schedules for each country, the categories of tariff commitments were worked out for the categories of commodities as aggregated. A further disaggregation would have helped to achieve more accurate results of the tariff reductions and eliminations by the respective countries as used in the different simulations. However, given the level of commodity classification in the GTAP 7 database, the best that could be established for use in the simulations is presented in table 2(a) of annex 2.
E. Results of the simulations This section discusses and compares the results of the three simulations:
(a) Full liberalization involving all countries;
(b) Liberalization as per tariff commitments under different tracks with regard to India, Malaysia, Singapore and Thailand (referred to as current scenario);

15
(c) Liberalization as per tariff commitments under different tracks with regard to all countries (referred to as ultimate scenario), with perfect competition in product and factor markets and production function exhibiting constant returns to scale.
1. Impact on select macroeconomic and trade variables of India and ASEAN
region A scenario of a full FTA between India and the 10 ASEAN countries was simulated.
Under this scenario all tariffs on imports from all the ASEAN member countries to India were reduced to zero and, similarly, tariffs on all products imported by the ASEAN members from India were brought down to zero. However, as indicated in table I.2 in annex 2, under AIFTA there would be tariff elimination for some products (those in the normal track) but only tariff reduction for other products (those in the sensitive track); there are also exclusion lists of no tariff reductions for all the countries involved. Moreover, as mentioned above, for ASEAN members other than Malaysia, Singapore and Thailand, the FTA has yet to come into force. However, in the current study it was decided to begin by simulating a scenario of full liberalization (implying complete elimination of all tariffs between India and the ASEAN region) in order to place an upper limit on the gains that might be achieved through the FTA.
The implications of full liberalization on select macroeconomic indicators for the countries
are presented in table 4. It can be seen that India would experience a 1.07% fall in GDP and a 58.6% fall in employment. However, the GDP price index1 falls by -1.25%. Among the ASEAN members, the highest increases in GDP are experienced by Myanmar (3.18%) and Indonesia (1.08%). Among the bigger countries, Singapore and Malaysia show increases in GDP of 0.61% and 0.54%, respectively. Cambodia, the Lao People’s Democratic Republic and the Philippines experience falls in GDP. On the employment front, the rest of ASEAN shows a phenomenal increase in employment levels. Malaysia, Singapore and the Lao People’s Democratic Republic also show high increases in employment. Myanmar shows the largest decrease in employment followed by Indonesia, Viet Nam and Cambodia. The GDP price index increases in all countries excepting Cambodia, the Lao People’s Democratic Republic and the Philippines. The highest increase is recorded by Myanmar (3.19%).
Thus, in terms of the selected macroeconomic indicators (table 4), Cambodia appears to be
most adversely affected by full liberalization of bilateral trade between India and the ASEAN region. The Philippines and the Lao People’s Democratic Republic are also affected, but their employment and price situations improve. Myanmar, Viet Nam and Indonesia only suffer in terms of falls in employment levels. Malaysia, Singapore Thailand and the rest of ASEAN are better off in terms of all indicators except prices, which rise slightly in all three countries. India also appears to experience a larger negative impact except for a decline in its GDP price index. Therefore, under the full liberalization scenario, Malaysia, Singapore, Thailand and the rest of ASEAN stand to gain the most in terms of macroeconomic indicators.
1 The GDP deflator that measures the price levels of final goods and services produced in an economy during a
particular period.

16
On 1 January 2010 India’s FTA with Malaysia, Singapore and Thailand came into force. Each of these countries has its respective schedule of tariff commitments under the FTA. These schedules comprise tariff lines classified under normal track, sensitive track and exclusion list. For all the normal track products, the tariffs were to be reduced to zero with immediate effect on 1 January 2010 or between 1 January 2010 and 31 December 2010 through annual cuts. The sensitive track comprises goods for which the tariffs were to be reduced to 5% by end of the FTA implementation period (31 December 2019). Some of the tariff lines for which the MFN base rate was already 5% were to be lowered to 4.5%. The exclusion lists comprises those tariff lines/products on which no tariff concessions are offered to the partner countries. Thus, a simulation was run to capture the effects of the trading arrangement that is currently in place by taking into account the normal tracks of the schedule of tariff commitments, the sensitive track and the exclusion list of India, Malaysia, Singapore and Thailand. The rest of the ASEAN countries were excluded from this FTA simulation.
The results of the simulation representing the current scenario showed a slight
improvement in India’s GDP position, with a smaller decline compared with the full liberalization situation. Malaysia, Singapore and Thailand continue to experience increases in the value of GDP, but Singapore’s increase becomes slightly greater while that of Thailand and Malaysia are smaller than in the full liberalization scenario. India experiences a slight improvement in its employment position but a smaller fall in its average prices. For the ASEAN countries, employment still increases, but at a lesser rate. The increase in the level of employment in Singapore is remarkably less (7.52% compared with 31.79% under full liberalization). Prices continue to rise in these countries, for Malaysia and Thailand at a relatively lower rate than under full liberalization.
Thus, under the current scenario simulation where trade between India and the ASEAN
region has been liberalized, in the case of tariff commitments by India, Malaysia, Singapore and Thailand only (while other ASEAN member countries continue to be beyond the scope of the FTA), Singapore and Malaysia gain the most in terms of all the selected macroeconomic indicators. Conversely, India benefits the least. The ASEAN countries that are beyond the scope of FTA are adversely affected, except that they all experience employment increases and falls in average prices.
The inclusion of the remaining seven ASEAN countries in the FTA arrangement referred
to as the ultimate scenario shows that India’s GDP still falls but at a marginally lesser rate while its price fall remains more or less the same. However, the improvement in its employment position is not as much as in the current scenario. Malaysia, Singapore and Thailand show virtually no change compared to the current scenario. However, Singapore’s employment position improves notably. The situation among the smaller countries is more or less the same as under the full liberalization scenario except that the GDP increases for Indonesia and Myanmar become slightly lower. In terms of falls in employment and increases in average prices they are slightly better off.

17
Table 4. Change in select macroeconomic variables (%)
Full liberalization (All ASEAN members and
India)
Current scenario* involving FTA between India, Malaysia,
Singapore and Thailand
Ultimate scenario* involving FTA between India and all
ASEAN members
Country
Change in
value GDP
Change in
employment
Change in GDP
price index
Change in
value GDP
Change in
employment
Change in GDP
price index
Change in
value GDP
Change in
employment
Change in GDP
price index
India -1.07 -58.62 -1.25 -0.125 3.24 -0.09 -0.09 0.31 -0.08 Malaysia 0.54 52.70 0.57 0.37 42.13 0.39 0.36 40.25 0.38 Singapore 0.61 31.79 0.59 0.65 7.52 0.63 0.62 15.48 0.60 Thailand 0.31 4.82 0.29 0.27 2.41 0.26 0.23 4.14 0.23 Cambodia -0.14 -4.29 -0.12 -0.04 3.60 -0.03 -0.13 -5.18 -0.11 Indonesia 1.08 -21.53 1.06 -0.01 1.77 -0.01 0.30 -12.74 0.29 Lao PDR -0.05 18.7 -0.04 -0.06 9.47 -0.05 -0.04 18.17 -0.04 Myanmar 3.18 -172.68 3.19 -0.1 7.28 -0.1 0.32 -26.19 0.31 Philippines -0.02 7.53 -0.02 -0.01 0.54 -0.01 -0.0001 7.52 -0.001 Viet Nam 0.34 -15.00 0.37 -0.02 1.09 -0.02 0.37 -15.43 0.39 Rest of ASEAN
0.45 209.77 0.43 .001 2.07 0.002 0.44 -5.32 0.42
Source: Based on simulation results * The current and ultimate scenarios take into account the different tracks of tariff commitments by the countries
To sum up, as far as the selected macroeconomic indicators of GDP, employment and average prices are concerned, India’s gains are virtually none whether there is complete tariff elimination (full liberalization) or tariff changes as per tariff commitments of the countries (as in the current or ultimate scenarios). Under full liberalization, Malaysia, Singapore Thailand and the rest of ASEAN are better off. Singapore and Malaysia gain the maximum benefit. Among the smaller countries, Cambodia is the most adversely affected while Myanmar, Viet Nam and Indonesia experience considerable positive impact. In the current scenario, the same three ASEAN countries benefit substantially, with Singapore and Malaysia gaining the most. In the ultimate scenario, Singapore still gains notably among all the ASEAN countries. Among the smaller countries, the changes in the macroeconomic variables are the same as under full liberalization. The corresponding changes in trade-related variables for the countries under the three different scenarios are detailed in table 5.

18
Table 5. Change in trade variables (%)
Full liberalization
(All ASEAN members and India) Current scenario* involving FTAs
between India, Malaysia, Singapore and Thailand
Ultimate scenario* involving FTA between India and all ASEAN members Country
Change in
volume of
exports
Change in
volume of
imports
Change in trade balance as % of GDP
Change in
terms of trade
Change in
volume of
exports
Change in
volume of
imports
Change in trade balance as % of GDP
Change in terms
of trade
Change in
volume of
exports
Change in
volume of
imports
Change in trade balance as % of GDP
Change in terms
of trade
India 5.39 4.70 -0.002 -0.65 1.51 1.41 -0.001 -0.13 2.24 2.29 -0.001 -0.15 Malaysia -0.09 0.35 -0.003 0.32 0.07 0.34 -0.001 0.22 0.07 0.32 -0.001 0.21 Singapore -0.01 0.24 -0.001 0.21 0.01 0.30 -0.001 0.24 -0.01 0.26 -0.001 0.22 Thailand 0.06 0.58 -0.004 0.14 -0.05 0.51 -0.004 0.13 -0.01 0.48 -0.004 0.11 Cambodia 0.27 0.32 -0.004 -0.13 0.02 -0.05 0.0003 -0.05 0.27 0.34 -0.0005 -0.10 Indonesia 0.22 0.88 0.0003 0.76 -0.04 -0.08 0.000 -0.03 -0.05 0.21 -0.0001 0.26 Lao PDR 0.11 -0.09 0.002 -0.09 0.06 -0.09 0.0001 -0.08 0.09 -0.08 0.0002 -0.08 Myanmar -0.34 0.73 0.004 1.94 0.06 -0.11 0.0001 -0.13 -0.13 0.27 -0.0003 0.33 Philippines 0.13 0.16 -0.0003 -0.02 0.01 -0.02 0.0001 -0.02 0.07 0.10 -0.002 -0.01 Viet Nam
0.25 0.49 -0.0003 0.23 -0.0002 -0.05 0.0002 -0.02 0.24 0.45 0.000 0.23
Rest of ASEAN
-0.09 0.13 -0.001 0.31 0.01 -0.09 0.0003 -0.07 -0.10 0.14 -0.0006 0.33
Source: Based on simulation results. • The current and ultimate scenarios take into account the different tracks of tariff commitments by the countries.
19
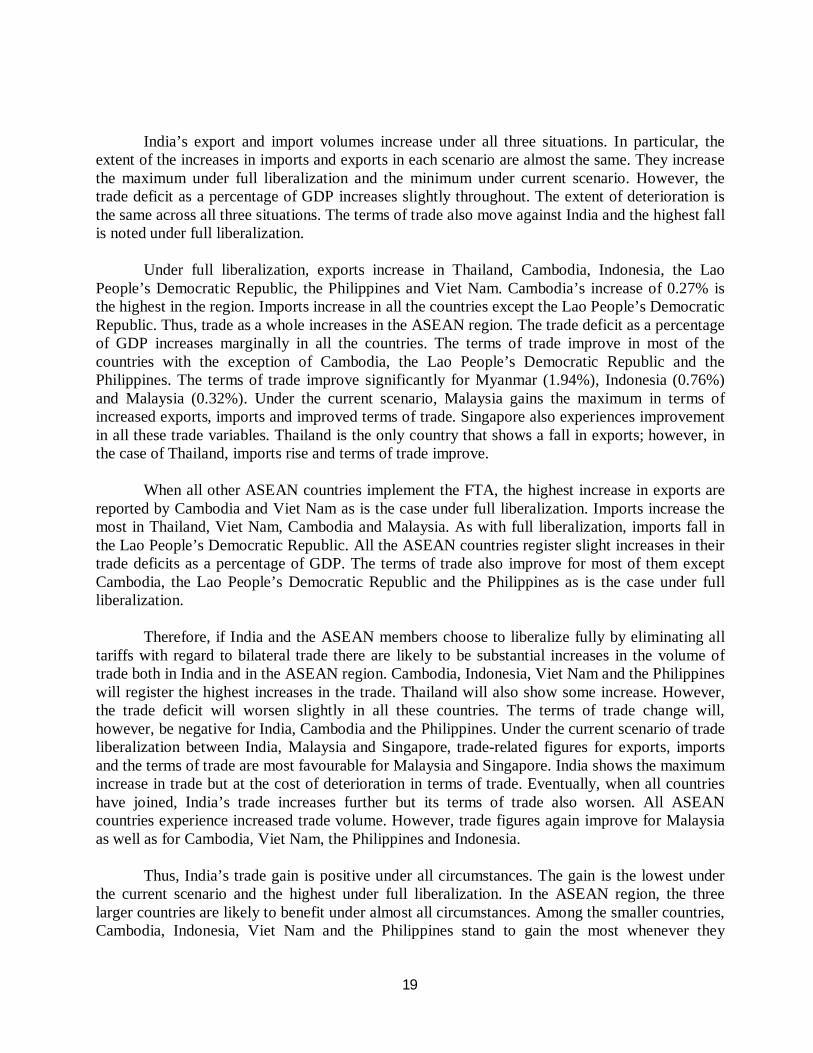
India’s export and import volumes increase under all three situations. In particular, the extent of the increases in imports and exports in each scenario are almost the same. They increase the maximum under full liberalization and the minimum under current scenario. However, the trade deficit as a percentage of GDP increases slightly throughout. The extent of deterioration is the same across all three situations. The terms of trade also move against India and the highest fall is noted under full liberalization.
Under full liberalization, exports increase in Thailand, Cambodia, Indonesia, the Lao People’s Democratic Republic, the Philippines and Viet Nam. Cambodia’s increase of 0.27% is the highest in the region. Imports increase in all the countries except the Lao People’s Democratic Republic. Thus, trade as a whole increases in the ASEAN region. The trade deficit as a percentage of GDP increases marginally in all the countries. The terms of trade improve in most of the countries with the exception of Cambodia, the Lao People’s Democratic Republic and the Philippines. The terms of trade improve significantly for Myanmar (1.94%), Indonesia (0.76%) and Malaysia (0.32%). Under the current scenario, Malaysia gains the maximum in terms of increased exports, imports and improved terms of trade. Singapore also experiences improvement in all these trade variables. Thailand is the only country that shows a fall in exports; however, in the case of Thailand, imports rise and terms of trade improve.
When all other ASEAN countries implement the FTA, the highest increase in exports are reported by Cambodia and Viet Nam as is the case under full liberalization. Imports increase the most in Thailand, Viet Nam, Cambodia and Malaysia. As with full liberalization, imports fall in the Lao People’s Democratic Republic. All the ASEAN countries register slight increases in their trade deficits as a percentage of GDP. The terms of trade also improve for most of them except Cambodia, the Lao People’s Democratic Republic and the Philippines as is the case under full liberalization.
Therefore, if India and the ASEAN members choose to liberalize fully by eliminating all
tariffs with regard to bilateral trade there are likely to be substantial increases in the volume of trade both in India and in the ASEAN region. Cambodia, Indonesia, Viet Nam and the Philippines will register the highest increases in the trade. Thailand will also show some increase. However, the trade deficit will worsen slightly in all these countries. The terms of trade change will, however, be negative for India, Cambodia and the Philippines. Under the current scenario of trade liberalization between India, Malaysia and Singapore, trade-related figures for exports, imports and the terms of trade are most favourable for Malaysia and Singapore. India shows the maximum increase in trade but at the cost of deterioration in terms of trade. Eventually, when all countries have joined, India’s trade increases further but its terms of trade also worsen. All ASEAN countries experience increased trade volume. However, trade figures again improve for Malaysia as well as for Cambodia, Viet Nam, the Philippines and Indonesia.
Thus, India’s trade gain is positive under all circumstances. The gain is the lowest under
the current scenario and the highest under full liberalization. In the ASEAN region, the three larger countries are likely to benefit under almost all circumstances. Among the smaller countries, Cambodia, Indonesia, Viet Nam and the Philippines stand to gain the most whenever they

20
liberalize their bilateral trade with India, under both the ultimate scenario and full liberalization. The welfare position of each of these trade partners is discussed in the following subsection.
2. Welfare implications of the FTA for India and the ASEAN region
In the GTAP modelling framework, regional household behaviour is governed by an
aggregate utility function specified over per capita private household consumption, per capita government spending and per capita savings. The percentage change in this aggregate per capita utility for a region is the welfare change variable that is computed in a standard GTAP model during simulations. The model computes a money metric equivalent of this utility change and any change in population in the region. This convenient measure, referred to as equivalent variation (EV), summarizes the regional welfare changes resulting from any policy shock and is given in United States dollar values. The regional household EV is given by the difference between the expenditure required to obtain the post-simulation level of utility at initial prices and that available initially. Decomposition of EV shows it as a function of the population growth rate and regional real income. The effect of population growth rate on EV is obvious, but the link between the change in total real income in the region and the EV is very interesting and calls for a detailed understanding.
In a comparative static applied general equilibrium model with population, endowment and technology being fixed, the only way to increase welfare is to reduce the excess burden arising from existing distortions. Any change in allocative efficiency may be directly related to tax/tax changes interacting with equilibrium quantity changes. Thus, the components that result in changes in real income arising due to the policy simulation under study are: (a) change in income due to change in endowments net of depreciation (this is normally zero in a comparative static situation); (b) tax on output of any good; (c) tax on use of any endowment in any industry; (d) tax on use of intermediate input in any industry; (e) tax on private household and government consumption of any good; (f) trade taxes (export and import) on any good; (g) changes in regional terms of trade (ToT); and (h) changes in relative price of savings and investment (Inv-Sav) (Huff and Hertel, 2000).
Intuitively, increasing the level of a relatively taxed activity is welfare improving, as this involves the reallocation of a commodity or endowment from a low value use to a relatively high social marginal usage. Conversely, reducing the level of a subsidized activity will tend to benefit the particular economy as this involves reallocation of resources away from low social marginal value product use. The same is true for endowments and goods traded. Any good that yields trade tax benefits the economy. The ToT for a region, which is defined as the ratio of export price index of the region to its import price index, contributes positively to society if post-simulation export prices rise more than import prices. Savings-investment term does not contribute to welfare changes, but both investments and savings appear in welfare decomposition. This is because investment sales generate income but do not enter into regional utility unlike savings, which enter regional utility but do not generate current income.
The welfare figures are given in table 6. The total welfare, which is measured as a regional equivalent variation as per GTAP modelling framework, is positive for India only under full liberalization. India’s total welfare gain is substantially higher and next to Indonesia whose

21
welfare gain is the highest at US$ 651.46 million. Malaysia, Singapore and Thailand also show substantial welfare gains. The smaller countries also show reasonable gains except Cambodia, the Lao People’s Democratic Republic and the Philippines, which show welfare losses. Although Indonesia and India have the highest absolute welfare gains, in terms of share of GDP, the largest welfare gain from full trade liberalization accrues to Malaysia, Myanmar and Singapore. Indonesia’s increase in welfare as a percentage of its GDP is only 0.25% compared with 0.72% for Myanmar, which is the highest among the 11 countries. India’s welfare increase as a percentage of its GDP is only 0.075%.
When India’s trade is liberalized as per each country’s tariff commitments (only with regard to Malaysia, Singapore and Thailand), India’s total welfare gain turns negative. Singapore’s welfare gain increases substantially while that of Malaysia falls to a large extent. The welfare gain accruing to Thailand remains more or less at the same level. The loss in welfare as a percentage of GDP in India is now almost as much as its welfare gain under full liberalization. The welfare increases as percentages of GDP in the three ASEAN countries are similar to that observed under full liberalization.
As the FTA is implemented with regard to all 10 ASEAN countries, India’s welfare position improves slightly (welfare loss declines from US$ 399.34 million to US$307.57 million) compared to the current scenario, but it continues to experience welfare loss as in the current scenario. The welfare gains for Malaysia, Singapore and Thailand remain the same, with Singapore earning the highest welfare among the three countries, both in terms of total welfare and welfare as a percentage of GDP. However, Indonesia again realizes significant gains as it does under full liberalization. However, in the case full liberalization, Indonesia’s gain is the highest in the region while under the ultimate scenario this gain comes down by almost 50%. Viet Nam shows significant welfare gains.

22
Table 6. Total welfare and its decomposition
(Unit: US$ million) Full liberalization
(All ASEAN members and India) Current scenarioa involving FTA between India, Malaysia, Singapore and Thailand
Country Allocative efficiency
effect
ToT effect
Inv-Sav
effect
Total welfare
Change in
welfare as % of
GDP
Allocative efficiency
effect
ToT effect
Inv-Sav
effect
Total welfare
Change in
welfare as % of
GDP India 1 252.66 -695.62 -78.7 478.33 0.075 -229.26 -139.45 -30.63 -399.34 -0.062
Malaysia -40.99 517.10 -
68.60 407.51 0.35 -19.49 354.16 -42.03 292.65 0.25
Singapore 13.81 349.04 -
10.60 352.24 0.33 22.71 396.47 -11.41 407.77 0.38
Thailand 24.57 180.78 -
28.79 176.55 0.11 18.10 165.56 -27.61 156.04 0.10
Cambodia -1.18 -4.61 0.54 -5.26 -0.11 -0.35 -1.68 -0.006 -2.04 -0.04
Indonesia 38.31 667.49 -
54.34 651.46 0.25 -0.40 -23.62 0.71 -23.3 -0.10
Lao PDR -0.23 -0.85 -0.07 -1.15 -0.05 -0.13 -0.76 -0.06 -0.95 -0.04 Myanmar -0.65 56.31 2.13 57.78 0.72 -0.08 -4.1 -0.08 -4.26 -0.06 Philippines
-1.77 -11.29 1.42 -11.64 -0.014 0.72 -10.44 0.19 -9.54 -0.01
Viet Nam -12.02 73.16 3.68 64.81 0.15 -0.59 -7.73 0.02 -8.30 -0.02 Rest of ASEAN
1.25 18.03 -4.50 14.77 0.26 -0.07 -0.87 -0.95 -1.88 -0.03
Country Ultimate scenariob involving FTA between India and all ASEAN Members
Allocative efficiency
effect
ToT effect
Inv-Sav effect
Total welfare
Change in welfare as % of GDP
India -124.3 -171.18 -12.1 -307.57 -0.048 Malaysia -18.00 337.45 -40.6 278.84 0.24

23
Singapore 23.95 375.93 -11.12 388.76 0.36 Thailand 15.85 139.74 -25.18 130.41 0.08 Cambodia -0.98 -3.62 0.36 -4.20 -0.09 Indonesia 21.58 226.2 -16.7 231.11 0.09 Lao PDR -0.17 -0.72 -0.04 -0.92 -0.04 Myanmar 0.33 9.5 0.55 10.37 0.13 Philippines 1.12 -5.93 0.94 -3.86 -0.005 Viet Nam -6.03 74.3 3.67 71.95 0.17 Rest of ASEAN 1.19 17.95 -4.44 14.70 0.26 Source: Based on simulation results. a Current scenario takes into account the different tracks of tariff commitments by countries. b Ultimate scenario takes into account the different tracks of tariff commitment by countries.

24
The decomposition of the welfare effects presented in table 6 suggests that India’s welfare
gain from the full trade liberalization is entirely due to a gain in allocative efficiency while its terms of trade are negative. The ASEAN members show positive welfare gains that are due to larger terms of trade gains. Some of the ASEAN countries such as Indonesia, Singapore and Thailand, also gain to some extent due to positive allocative efficiency. Cambodia, the Lao People’s Democratic Republic and the Philippines show welfare losses due to both negative allocative efficiency and negative terms of trade.
Under the current scenario, when bilateral trade is liberalized with regard only to India and
the three bigger ASEAN countries, India’s allocative efficiency turns negative and its terms of trade continue to be negative. This results in a total welfare loss for the country. The situation is similar under the ultimate scenario but the extent of its loss in allocative efficiency is slightly less (US$ 124.3 million compared with US$ 229.06 million under the current scenario). However, India’s terms of trade situation deteriorates further under the ultimate scenario. For the ASEAN members, the larger positive terms of trade continue to result in positive welfare gains; however, with the large exclusion list of India included, the terms of trade effects for many of these countries are relatively smaller under the current and ultimate scenarios. Indonesia, Malaysia, Singapore and Thailand gain the most on account of large positive terms of trade. Cambodia, the Lao People’s Democratic Republic and the Philippines continue to incur welfare losses on account of the losses in allocative efficiency and in negative terms of trade.
Singapore is one country in the ASEAN region that consistently earns large positive
welfare gains under all three scenarios, mostly on account of terms of trade gains. This is due to the fact that even prior to the FTA the tariffs offered by Singapore to India were very low for almost all the products exported by India. As such, the schedule of tariff commitments by Singapore under the FTA is very small, comprising only six tariff lines under the product category of beverages, spirits and vinegar. So for Singapore this FTA is almost like a unilateral liberalization on the part of India. In the case of full liberalization Singapore shows large welfare gains that increase further under the current and the ultimate scenarios with the inclusion of the sensitive and negative lists of other countries of the ASEAN region. Singapore, which does not have a negative list, enjoys increased allocative efficiency in the latter situations compared to the full liberalization scenario.
The terms of trade gains accruing to most of the ASEAN countries are due to the relatively
larger falls in the prices of their import items, relative to their exports, as a result of bilateral trade liberalization under the FTA. The loss to India on account of the negative terms of trade effect is as high as US$ 695.62 million under full liberalization. The FTA lowers India’s export prices much more than the import prices, resulting in the negative terms of trade effect. This is because the prices of most Indian exports to the ASEAN countries fall as much as the tariff shock, or sometimes more than that, when they reach the ASEAN markets. This is because domestic demand for most of these goods falls in India, consequently pushing down their world (CIF) prices.
For goods reaching India from the ASEAN countries, the fall in the prices of the goods in
India is less than the tariff schocks . This is explained by the rise in the CIF prices of most of
25
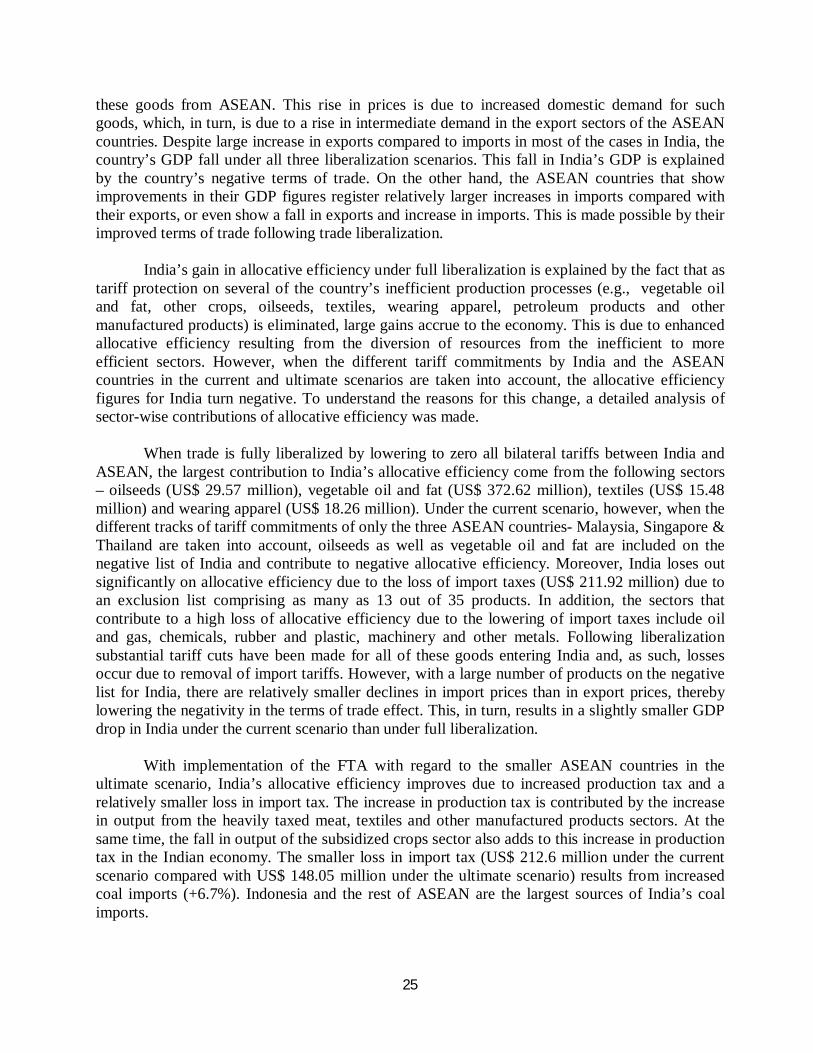
these goods from ASEAN. This rise in prices is due to increased domestic demand for such goods, which, in turn, is due to a rise in intermediate demand in the export sectors of the ASEAN countries. Despite large increase in exports compared to imports in most of the cases in India, the country’s GDP fall under all three liberalization scenarios. This fall in India’s GDP is explained by the country’s negative terms of trade. On the other hand, the ASEAN countries that show improvements in their GDP figures register relatively larger increases in imports compared with their exports, or even show a fall in exports and increase in imports. This is made possible by their improved terms of trade following trade liberalization.
India’s gain in allocative efficiency under full liberalization is explained by the fact that as
tariff protection on several of the country’s inefficient production processes (e.g., vegetable oil and fat, other crops, oilseeds, textiles, wearing apparel, petroleum products and other manufactured products) is eliminated, large gains accrue to the economy. This is due to enhanced allocative efficiency resulting from the diversion of resources from the inefficient to more efficient sectors. However, when the different tariff commitments by India and the ASEAN countries in the current and ultimate scenarios are taken into account, the allocative efficiency figures for India turn negative. To understand the reasons for this change, a detailed analysis of sector-wise contributions of allocative efficiency was made.
When trade is fully liberalized by lowering to zero all bilateral tariffs between India and
ASEAN, the largest contribution to India’s allocative efficiency come from the following sectors – oilseeds (US$ 29.57 million), vegetable oil and fat (US$ 372.62 million), textiles (US$ 15.48 million) and wearing apparel (US$ 18.26 million). Under the current scenario, however, when the different tracks of tariff commitments of only the three ASEAN countries- Malaysia, Singapore & Thailand are taken into account, oilseeds as well as vegetable oil and fat are included on the negative list of India and contribute to negative allocative efficiency. Moreover, India loses out significantly on allocative efficiency due to the loss of import taxes (US$ 211.92 million) due to an exclusion list comprising as many as 13 out of 35 products. In addition, the sectors that contribute to a high loss of allocative efficiency due to the lowering of import taxes include oil and gas, chemicals, rubber and plastic, machinery and other metals. Following liberalization substantial tariff cuts have been made for all of these goods entering India and, as such, losses occur due to removal of import tariffs. However, with a large number of products on the negative list for India, there are relatively smaller declines in import prices than in export prices, thereby lowering the negativity in the terms of trade effect. This, in turn, results in a slightly smaller GDP drop in India under the current scenario than under full liberalization.
With implementation of the FTA with regard to the smaller ASEAN countries in the
ultimate scenario, India’s allocative efficiency improves due to increased production tax and a relatively smaller loss in import tax. The increase in production tax is contributed by the increase in output from the heavily taxed meat, textiles and other manufactured products sectors. At the same time, the fall in output of the subsidized crops sector also adds to this increase in production tax in the Indian economy. The smaller loss in import tax (US$ 212.6 million under the current scenario compared with US$ 148.05 million under the ultimate scenario) results from increased coal imports (+6.7%). Indonesia and the rest of ASEAN are the largest sources of India’s coal imports.

26
In summary, with regard to all 11 countries, FTA implementation under both the current and ultimate scenarios will result in India and some of the smaller ASEAN countries (i.e., Cambodia, the Lao People’s Democratic Republic and the Philippines) incurring welfare losses. While the loss for India is due to negative terms of trade, for Cambodia and the Lao People’s Democratic Republic the loss is due to both allocative inefficiency and the negative terms of trade effect. The Philippines experiences some gain from increased allocative efficiency but the negative terms of trade effect is relatively stronger. For other ASEAN countries, the terms of trade effect is positive and stronger, resulting in large welfare gains. For India, the welfare position improves with the expansion of the trade liberalization process, both with regard to the number of ASEAN countries with which its trade is liberalized as well as the number of products for which tariffs are lowered or eliminated. However, although total welfare improves, the terms of trade for India continue to be negative, resulting in the lowering of its GDP in all three trade liberalization scenarios. Therefore, the import and export prices of India following FTA implementation need to be given more attention.
3. Impact on bilateral trade between India and ASEAN
Section E shows the total trade increase in India and the ASEAN region following FTA implementation, whether with either full trade liberalization or with liberalization taking into account the tariff commitments of the countries under the current scenario or the ultimate scenario. This subsection takes a closer look at bilateral trade between the two partners, India and ASEAN, under the different scenarios. It is evident from figure 1 that bilateral trade between India and ASEAN steadily increases (from 32.79% under the current scenario to 62.69% under full liberalization) as the scope of the FTA widens with regard to the number of countries and products involved.
Figure 1. Total bilateral trade between India and ASEAN
(Unit: US$ million)
Source: Based on calculations from simulation results.
Both India and the ASEAN members gain substantial access to each other’s’ markets following the implementation of the FTA (table 7). However, under all circumstances the market access gained by the ASEAN region in India is substantially higher compared to India’s access in their region.
27
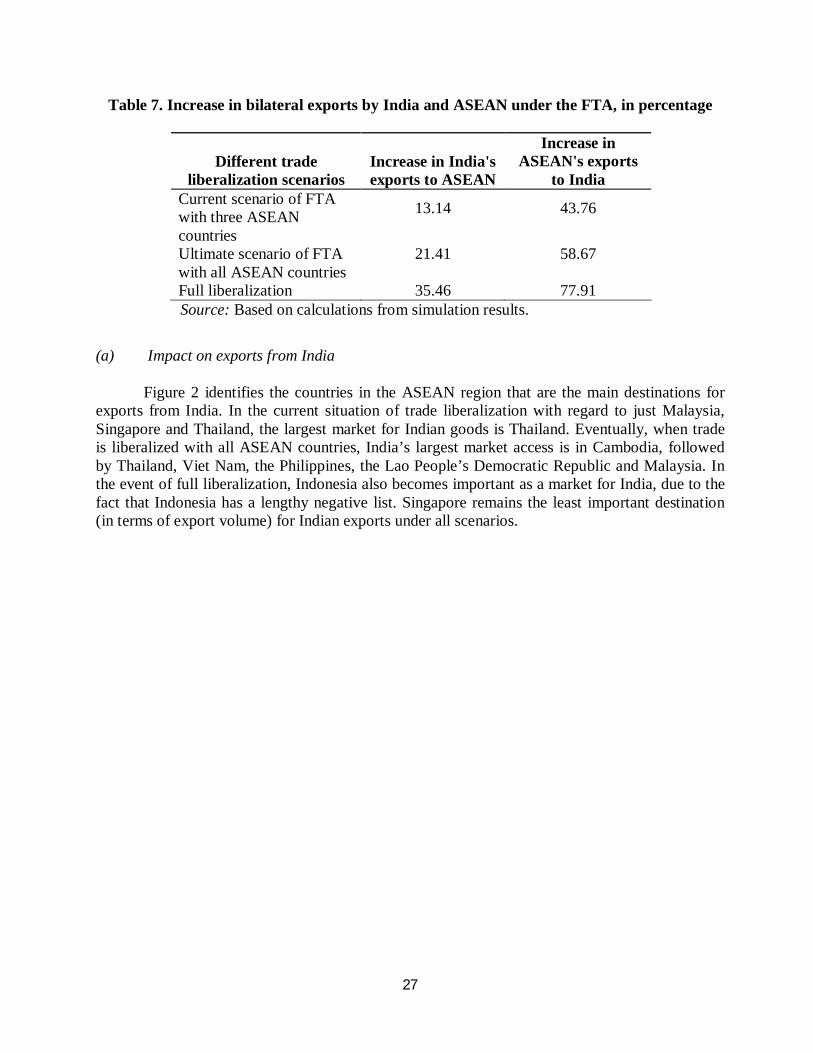
Table 7. Increase in bilateral exports by India and ASEAN under the FTA, in percentage
Different trade liberalization scenarios
Increase in India's exports to ASEAN
Increase in ASEAN's exports
to India Current scenario of FTA with three ASEAN countries
13.14
43.76
Ultimate scenario of FTA with all ASEAN countries Full liberalization
21.41
35.46
58.67
77.91 Source: Based on calculations from simulation results.
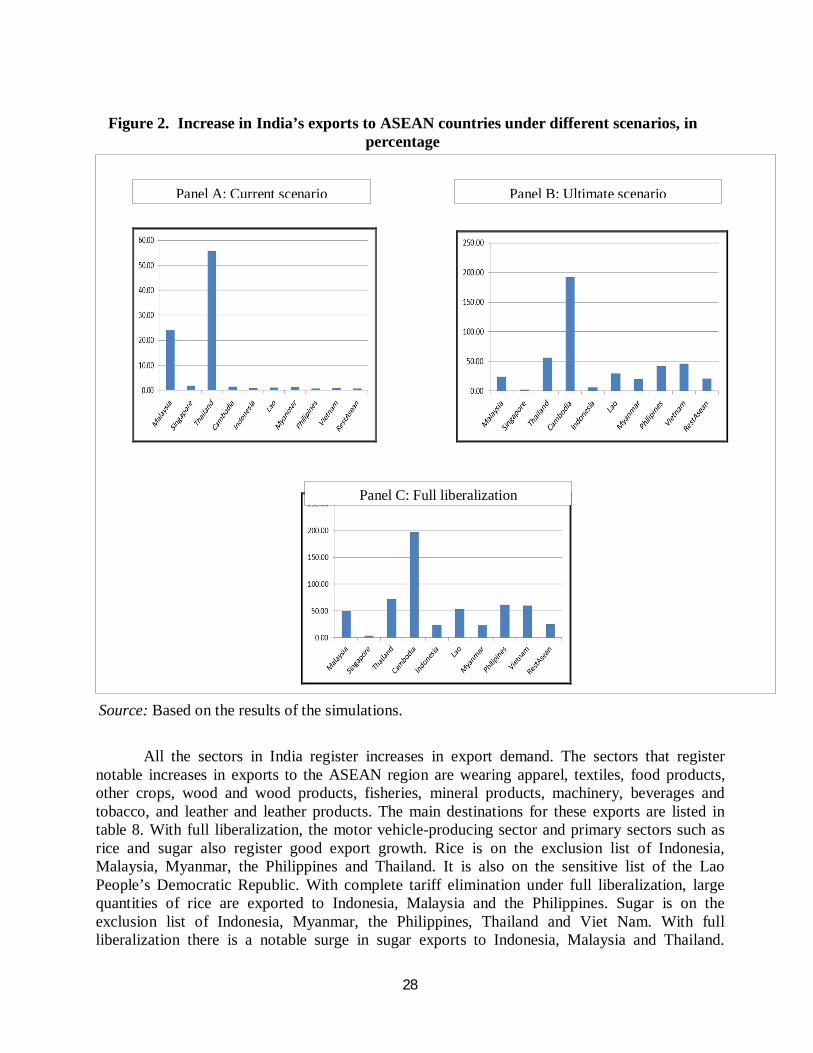
(a) Impact on exports from India
Figure 2 identifies the countries in the ASEAN region that are the main destinations for exports from India. In the current situation of trade liberalization with regard to just Malaysia, Singapore and Thailand, the largest market for Indian goods is Thailand. Eventually, when trade is liberalized with all ASEAN countries, India’s largest market access is in Cambodia, followed by Thailand, Viet Nam, the Philippines, the Lao People’s Democratic Republic and Malaysia. In the event of full liberalization, Indonesia also becomes important as a market for India, due to the fact that Indonesia has a lengthy negative list. Singapore remains the least important destination (in terms of export volume) for Indian exports under all scenarios.
28
Figure 2. Increase in India’s exports to ASEAN countries under different scenarios, in
percentage
Source: Based on the results of the simulations.
All the sectors in India register increases in export demand. The sectors that register
notable increases in exports to the ASEAN region are wearing apparel, textiles, food products, other crops, wood and wood products, fisheries, mineral products, machinery, beverages and tobacco, and leather and leather products. The main destinations for these exports are listed in table 8. With full liberalization, the motor vehicle-producing sector and primary sectors such as rice and sugar also register good export growth. Rice is on the exclusion list of Indonesia, Malaysia, Myanmar, the Philippines and Thailand. It is also on the sensitive list of the Lao People’s Democratic Republic. With complete tariff elimination under full liberalization, large quantities of rice are exported to Indonesia, Malaysia and the Philippines. Sugar is on the exclusion list of Indonesia, Myanmar, the Philippines, Thailand and Viet Nam. With full liberalization there is a notable surge in sugar exports to Indonesia, Malaysia and Thailand.
Panel A: Current scenario Panel B: Ultimate scenario
Panel C: Full liberalization

29
Exports of motor vehicles are largely to Malaysia and Thailand. Under the current and ultimate scenarios both Malaysia and Thailand have this product on their exclusion list.
As noted in table 8, those sectors in India that register notable increases in the demand for their exports to ASEAN are mostly concentrated in the three bigger countries of Malaysia, Singapore and Thailand. Among the smaller countries, Viet Nam is also an important destination for many of these products.
In summary, India’s export markets in the ASEAN region following FTA implementation record the largest demand in Thailand under the current scenario, and in Cambodia when all countries implement the FTA. Smaller countries such as Viet Nam, the Lao People’s Democratic Republic and the Philippines also become large markets. Indonesia has the potential to become a major market if there is full liberalization. Among the bigger countries, Malaysia shows reasonable growth as an important market. Thus, growth in total exports from India is mainly concentrated in the smaller countries of the ASEAN region with the exception of Thailand, but when it comes to markets for Indian products that register the highest increase in exports to ASEAN, Malaysia, Singapore and Thailand become important destinations. Among the smaller countries, Viet Nam is also an important destination for many of these products. However, in terms of growth of both total exports and markets for important export items, Thailand becomes the most important market for India.
Table 8. Sectors in India showing highest export growth and their destinations
Sectors Main destinations
Wearing apparel Malaysia, Singapore and Thailand Textiles Malaysia, Thailand and Viet Nam Food products Malaysia, Thailand and Viet Nam Other crops Malaysia and Thailand Wood and wood products
Singapore, Thailand and Viet Nam
Fisheries Singapore and Thailand Mineral products Indonesia, Malaysia and Thailand Machinery Malaysia, Singapore and Thailand Beverages and tobacco
Malaysia and Singapore (if there is full liberalization)
Leather and leather products
Cambodia, Malaysia, Thailand and Viet Nam
Source: Based on simulation results.
(b) Impact on imports by India
The countries in the ASEAN region that register notable increases in their exports to India under the current scenario are Malaysia and Thailand. However, when all countries implement the FTA, Viet Nam and the rest of ASEAN register phenomenal increases in their exports to India. Malaysia, the Philippines, Singapore and Thailand register moderate increases in their exports. With full liberalization, Indonesia and Myanmar, to some extent, experience manifold increases in

30
their exports to India. However, Cambodia and the Lao People’s Democratic Republic gain virtually no additional market access in India under any of the three discussed above. The sectors in the ASEAN region that register notable growth in their exports to India are listed below:
(a) Under all three scenarios of trade liberalization – meat and meat products, other metals, food products, oil and gas, machinery, wearing apparel, other manufactured products, chemicals, transport equipment and ferrous metals;
(b) In addition, when the other countries implement the FTA, sectors producing other crops, coal, and leather and leather products assume importance as exports to India;
(c) With full liberalization, further sectors such as rice, dairy products, sugar, beverages and tobacco, and vegetable oil register manifold increases in their exports to India.
The ASEAN members where these sectors register export growth are listed in table 9.
Figure 3. Increase in ASEAN exports to India under different scenarios, in percentage
Panel a: Current Scenario
Panel b: Ultimate Scenario
Panel c: Full Liberalization

31
Source: Based on simulation results.
Table 9. Sectors in ASEAN region showing highest export growth and their originating countries
Sectors Main source countries Meat and meat products
Malaysia and Thailand
Other metals Malaysia and Singapore Food products Malaysia, Thailand and Viet Nam Oil and gas Malaysia and the rest of ASEAN Machinery equipment
Malaysia, Singapore and Thailand
Wearing apparel Indonesia, the Philippines, Singapore and Thailand,
Other manufactured goods
Singapore and Thailand
Chemicals, rubber and plastic
Indonesia, Malaysia, Singapore and Thailand
Transport equipment Indonesia and Singapore Ferrous metals Malaysia, Singapore and Thailand Other crops Indonesia and Viet Nam Coal Indonesia (mainly) and Viet Nam (to some
extent) Leather and leather products
Indonesia and Thailand
Rice Malaysia Dairy products Indonesia and Singapore Sugar Indonesia and Thailand Beverages and tobacco
Singapore and Thailand
Vegetable oil Indonesia and Malaysia Source: Based on simulation results.
Table 9 shows the ASEAN members that will export the goods featured on the list of top
imports in India’s import basket are Indonesia, Malaysia, the Philippines, Singapore, Thailand and Viet Nam, plus the rest of ASEAN. They are also the countries in the ASEAN region that experience substantial increases in their total exports to India.
In summary, following implementation of the FTA, bilateral trade between India and
ASEAN increases phenomenally. While Cambodia, Indonesia, the Lao People’s Democratic Republic, the Philippines and Viet Nam provide additional markets for almost all Indian exports, Malaysia, Singapore and Thailand provide markets for some of the fastest growing exports from India. Malaysia, Thailand and Viet Nam become major importers of Indian goods in terms of total exports by that country to ASEAN. They also provide markets for the fastest growing items

32
exported by India. In particular, Thailand consistently provides a large market for Indian products under all three scenarios. The increase in India’s imports from ASEAN is due to increased exports by Indonesia, Malaysia, the Philippines, Singapore, Thailand and Viet Nam, plus the rest of ASEAN. These countries also supply the items that register the largest increases in India’s imports from ASEAN following the implementation of the FTA.
F. Other impacts of FTA in India and ASEAN
1. Import prices
Under the FTA, India lowers the tariff on products listed under the normal and sensitive tracks. The obvious consequence of the tariff shock is a fall in the import prices of those products in India. Thus, the ASEAN exporters definitely have the advantage of supplying their products cheaply to the Indian market and thereby enjoy a position of equality with domestic suppliers in India. However, although the import prices of goods from the ASEAN region fall significantly, the prices of the import composite (comprising a bundle of all imports of a product from different countries of the world, including the ASEAN region) for the same products available in India do not come down as much (table 10). The reason for this situation is the relatively lower market share (table 11) of the ASEAN countries in the total imports of these products by India.
Table 10. Market share of ASEAN in important imports by India and relative fall in
import prices offered by them
Sectors registering highest increases in imports
in India
ASEAN region market share in
total composite* of good imported by
India (%)
Fall in prices of import composite
available in India
(%)
The % fall in price (relative to average price
of import composite) offered by the main
exporters from ASEAN
Meat and meat products
5 4.12 Malaysia (23.5) and Thailand (18.8)
Other metals 2 0.35 Malaysia (12.3) and Singapore (12.5)
Food products 20 9.74 Malaysia (17.7), Thailand (17.1) and Viet Nam (31.4)
Oil and gas 3 0.53 Malaysia (7.3) and rest of ASEAN (8.1)
Machinery 5 1.06 Malaysia (11.6), Singapore (9.9) and Thailand (11.4)
Wearing apparel 8 1.79 Indonesia (-11.1), Philippines (-11.2) Singapore (11.1) and Thailand (11.1)
Other manufactured products
5 0.88 Singapore (11.9) and Thailand (10.8)

33
Chemicals, rubber and plastic
13 2.53 Indonesia (12.3), Malaysia (11.2), Singapore (9.7) and Thailand (10.9)
Transport equipment 8 1.26 Indonesia (11.2) and Singapore (8.3)
Ferrous metals 5 1.5 Malaysia (14.6), Singapore (14.2) and Thailand (14.8)
Other crops 17 18.43 Indonesia (19.4) and Viet Nam (22.0)
Coal 12 6.69 Indonesia (19.5) and Viet Nam (6.0)
Leather and leather products
9 1.32 Indonesia (8.6) and Thailand (11.2)
Source: Based on results of simulation involving the ultimate scenario. * Bundle comprising total imports of a product from different sources.
2. Agents contributing to increased import demand in India
The products from ASEAN are likely to be available at a price substantially lower than the
average import price from other destinations at which these goods are available in India. This results in increased imports of these products by India from the ASEAN region. These imports are used by all agents of the economy. For products such as other metals, oil and gas, machinery, other manufactured goods, chemicals, transport equipment, ferrous metals, other crops and coal, the bulk of the increase in import demand is by firms in India (table 11). This indicates that firms are gradually substituting domestic input with foreign inputs, thereby increasing the allocative efficiency in the system (table 10). For other imported products, private households account for a larger share of the increased import demand.
Table 11. Firm shares in import demand by India for various commodities
Sector
Share of domestic firms in
increased import
demand (%)
Sectors contributing to increase in demand for these imported inputs (%)
Metals 100.0 Other manufacturing (42.1) and metal (29.8)
Oil and gas 100.0 Petroleum products (100)
Machinery 99.1 CGDS* (67.2) and machinery (14.3)
Other manufacturing 79.3 Services (32.5), CGDS (29) and other manufacturing (21.3)
Chemicals, rubber and plastic
87.9 Chemicals (44.3), textiles (11.6), services (7.2), food products (5.5) and wheat (4)

34
Source: Based on results of simulation involving ultimate scenario. * Capital goods.
3. Effect of increased imports on domestic production in India
With import prices coming down and import demand increasing in India, domestic production of those goods is likely to suffer. With regard to domestic output by the sectors that register the highest import growth following the tariff liberalization, the simulation shows that India’s demand for domestically produced goods falls for all sectors of India. In fact, some of these sectors (i.e., oil and gas, chemicals, transport equipment, ferrous metals, other crops and coal) experience such large decreases in domestic demand that their total outputs register decreases. For the other sectors, the increase in export demand compensates for the loss in domestic demand. 4. Effect on factor demand in the Indian economy
For all sectors that register declines in domestic output in the face of increased imports from ASEAN, the demand for all the mobile factors, i.e., capital and labour (both skilled and unskilled), also falls. Given their mobility, these factors move across sectors and manage to find employment in sectors where domestic output has increased. As such, total demand for unskilled labour shows an increase of 0.93% while that of capital rises by 0.53%. For the sluggish factor, land demand falls among most of the sectors experiencing declines in domestic production. However, on the whole, demand rises by 14.86%. Demand for natural resources also increases by 0.12%. The only factor to show a fall in demand is skilled labour, which declines by 0.62%. Among the sectors that contribute to large declines in demand for skilled labour are coal, oil and gas, transport equipment and other crops.
After the FTA implementation, total domestic output for all 35 sectors in India shows an increase of 2.78%. This results in an increase in demand for primary factor composite (comprising land, labour, capital and natural resources) for all production sectors in the country taken together. This is the positive expansionary effect, which results in an increase in demand of 2.78% for the primary factor composite. This, in turn, leads to simultaneous increases in the price of the primary factor composite in the region and in relative prices of the mobile endowments (unskilled labour – 9.86%, skilled labour – 11.58% and capital – 10.27%). This increase in relative prices of the factors results in a negative substitution effect on demand for the factors. The negative substitution effect of a relative price change outweighs the positive expansion effect of an output increase in the case of unskilled labour, and results in a fall in total demand by 0.62%
Transport equipment 94.8 CGDS (76) and services (3.8)
Ferrous metals 100.0 Ferrous metals (40.9) and other manufactured products (32)
Other crops 52.5 Textiles (75.7)
Coal 98.2 Other manufactured products (74.4) and petroleum products (11)

35
5. Effect of increased import from India on the ASEAN region
As in the case of India, prices of products imported from India for ASEAN markets decline substantially following FTA implementation. However, as the share of Indian goods in total imports by most of the ASEAN members is much smaller, the fall in prices of imports from India fails to push down the prices of the total imports of these goods (import composite comprising the imports of similar products sourced from different countries of the world) in the respective countries (table 2(b) of annex 2).
The increased imports in each of those countries are not only due to increased household demand but also increased input demand by firms. The domestic demands in sectors that show the highest increase in imports from India generally register a decline in most countries. To a large extent, this results in a fall in the sectors’ domestic production. Some of the sectors, despite the decline in the size of domestic markets manage to register increased production due to increased export demand for their products. For some countries such as Indonesia and Myanmar as well as the rest of ASEAN, total output falls in all sectors due to declines in domestic demand. With the exception of the Philippines and the Lao People’s Democratic Republic, total domestic output for all the small ASEAN members decline following FTA implementation. In contrast, Malaysia, Singapore and Thailand show increases in total domestic output (table 2(c) of annex 2).
Due to the expansion effect of total production, the demand for the mobile factors of
production rises in the Lao People’s Democratic Republic, the Philippines, Malaysia, Singapore and Thailand, while it falls in the other ASEAN members. Due to increased demand, the prices of the mobile factors also rise in Malaysia, Singapore and Thailand. However, the price of the factors in Cambodia, Indonesia, Myanmar, the Philippines and Viet Nam, as well as the rest of ASEAN, rises despite a decline in total demand for the factors.
G. Rules of origin
For goods to be eligible for preferential treatment with regard to tariffs under AIFTA, they are required to conform to the following origin requirements:
(a) The goods must be wholly obtained or produced in the exporting country, or
(b) If the good is not wholly produced or obtained in the exporting country, but if the final process of the manufacture is performed within the territory of the exporting country, it would be eligible under either one of the following requirements: (i) The AIFTA content should not be less than 35 per cent of the FOB value. The
formula for the 35 per cent AIFTA content is calculated under either the direct method or the indirect method (see below);
(ii) The non-originating materials must have undergone at least a change in tariff sub-heading (CTSH) level of the Harmonized System. The value of the non-originating materials will be: a. The CIF value at the time the materials, parts or produce are imported; or b. The earliest ascertained price paid for the materials, parts or produce of undetermined origin in the territory of the country where the working or processing takes place.
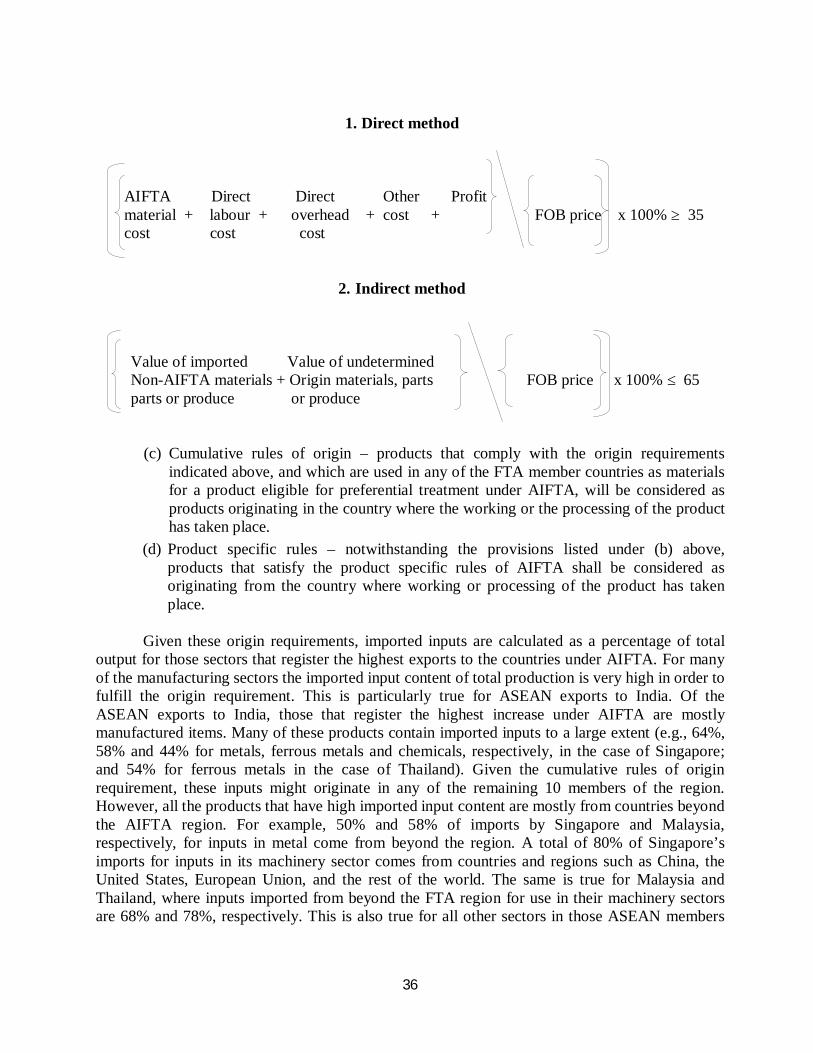
36
1. Direct method
AIFTA Direct Direct Other Profit material + labour + overhead + cost + FOB price x 100% ≥ 35 cost cost cost
2. Indirect method
Value of imported Value of undetermined Non-AIFTA materials + Origin materials, parts FOB price x 100% ≤ 65 parts or produce or produce
(c) Cumulative rules of origin – products that comply with the origin requirements indicated above, and which are used in any of the FTA member countries as materials for a product eligible for preferential treatment under AIFTA, will be considered as products originating in the country where the working or the processing of the product has taken place.
(d) Product specific rules – notwithstanding the provisions listed under (b) above, products that satisfy the product specific rules of AIFTA shall be considered as originating from the country where working or processing of the product has taken place.
Given these origin requirements, imported inputs are calculated as a percentage of total
output for those sectors that register the highest exports to the countries under AIFTA. For many of the manufacturing sectors the imported input content of total production is very high in order to fulfill the origin requirement. This is particularly true for ASEAN exports to India. Of the ASEAN exports to India, those that register the highest increase under AIFTA are mostly manufactured items. Many of these products contain imported inputs to a large extent (e.g., 64%, 58% and 44% for metals, ferrous metals and chemicals, respectively, in the case of Singapore; and 54% for ferrous metals in the case of Thailand). Given the cumulative rules of origin requirement, these inputs might originate in any of the remaining 10 members of the region. However, all the products that have high imported input content are mostly from countries beyond the AIFTA region. For example, 50% and 58% of imports by Singapore and Malaysia, respectively, for inputs in metal come from beyond the region. A total of 80% of Singapore’s imports for inputs in its machinery sector comes from countries and regions such as China, the United States, European Union, and the rest of the world. The same is true for Malaysia and Thailand, where inputs imported from beyond the FTA region for use in their machinery sectors are 68% and 78%, respectively. This is also true for all other sectors in those ASEAN members

37
that register large increases in their exports to India and which use large amounts of imported inputs for production.
Of India’s exports to ASEAN, those that increase significantly following FTA implementation comprise many primary products such as beverages, tobacco, crops, fisheries and minerals. These products normally have very low imported input content. Therefore, for India, fulfilling the origin requirements for these exports under AIFTA does not appear to be very difficult. However, in the case of manufactured items, the situation appears similar to that of the ASEAN members. The products have high imported input content with most of the inputs being sourced from beyond the AIFTA region. For machinery, only about 12% of the inputs come from within the region.
Thus, for India, which exports large quantities of primary products, the rules of origin
requirements may be easily fulfilled. However, ASEAN members export mostly manufactured goods, and they are likely to find it difficult to meet this requirement. A larger disaggregation of the product category would have definitely given a better insight into this aspect; however, even at this level of disaggregation, such large figures for imported input content do not project a very comfortable picture for the exporting countries.
The provision of regional value cumulation may be of some advantage, but many of the products exported by ASEAN contain inputs obtained from outside the region. Therefore, following implementation of the FTA, countries may thus switch sources and obtain similar inputs from within the region in order to adhere to the rules of origin requirements. This might be a much more viable proposition for ASEAN members who possibly have production networks in the region already in place. For India, though, developing such a production network involving the ASEAN members could initially be difficult and may take some time to establish.
H. Effect of FTA on trade with other important partners of India and ASEAN
There is some indication of trade diversion occurring in the rest of the world, following the FTA implementation between India and the ASEAN region. Under all scenarios, all other countries of the world lose substantial market access in India. This loss of markets increases as the process of trade integration between India and the ASEAN members expands. Among the South Asian countries, the extent of market loss in India is highest for Bangladesh, ranging between 5.49% in the current situation to 14.21 % under full liberalization, while Pakistan’s loss is the lowest. China’s market loss in India is also considerable.
Although other countries do lose some market access in the ASEAN region, the extent of that loss is not much. None of those countries lose any market share in Singapore while all the countries lose some export market share in Cambodia. This conforms to the fact that India’s exports to the ASEAN region increase the most in Cambodia and the least in Singapore. The United States and the European Union also experience some market loss in the Philippines and Cambodia. China’s market size declines in Cambodia, Malaysia, the Philippines, Thailand and Viet Nam. Bangladesh and Pakistan experience decreases in Malaysia, Myanmar, Thailand and Viet Nam. Sri Lanka’s market access declines only in Cambodia and Viet Nam.

38
Thus, the India-ASEAN FTA results in considerable decreases of India’s imports from neighbouring developing countries and important developed trade partners. The ASEAN members also register some reduction of their imports sourced from those countries, but the reduction is much smaller than that experienced by India. The exact figures indicating the changes in market shares of these countries in India and ASEAN are shown in table 2(d) of annex 2.
I. Extension of original GTAP framework to incorporate increasing returns to scale and imperfect competition in India
The entire analysis of the implications of AIFTA on India and the ASEAN region assumes
perfect competition and constant returns to scale (CRS) in the countries involved. However, given the developing status of the countries involved, that assumption may not fully reflect the real picture. Many of the production sectors of developing economies, particularly manufacturing, are characterized by the existence of relatively few firms with barriers to entry. The market size also happens to be small with the existence of unexploited scale economies. Thus, increasing returns to scale (IRS) is an important feature in developing economies.
At the same time, advocates of FTAs have often argued that the gains from such
agreements accruing to a country would be larger if features of imperfect competition and increasing returns to scale are taken into account while carrying out an impact analysis. Thus, given the fact that many Indian manufacturing sectors are subject to imperfect competition, and are characterized by the existence of scale economies, the study now examines that claim by the advocates of FTA. This exercise takes the two new features of imperfect competition and IRS for the India economy only, while the ASEAN region is allowed perfect competition and CRS production functions for its production sectors. The welfare implication using the IRS model is explained in details in annex 2. 1. Additional data for existence of scale economies and imperfect competition in India Of the 35 sectors considered in this study, 12 sectors – i.e., textiles and wearing apparel, petroleum products, chemicals, rubber and plastic, ferrous metals, other metals, mineral products, motor vehicles, transport equipment, electrical equipment, machinery and other manufactured goods – are considered to be oligopolistic in nature with the presence of scale economies for the Indian economy. The calibration of the oligopoly model and scale economies for these 12 manufacturing sectors is based on the data obtained from the Centre for Monitoring the Indian Economy.2
2. Results
2 The firm-level data for the Indian corporate sector is available in the Prowess database of the Centre for Monitoring
the Indian Economy, which was used to calculate various cost-related variables used in the model.

39
The results of the simulation involving a scenario when some of India’s manufacturing sectors are characterized by IRS and imperfect competition are shown in table 12. Figures are also given in table 12 for the scenario involving assumptions of CRS and perfect competition for the same sectors (the ultimate scenario as discussed above) in order to facilitate the comparison of the impact of the FTA on the economy under two different scenarios.
India’s GDP and welfare position improves considerably with IRS and imperfect
competition, while the country’s total trade and bilateral trade with ASEAN remains, by and large, unchanged. The country’s level of employment, however, worsens to some extent. Its GDP price index also rises compared to the earlier scenario of CRS.
The improvement in welfare in this simulation is mainly attributable to the scale economies. The output per firm of many of the oligopolistic sectors (such as textiles, petroleum products, chemicals, mineral products, motor vehicles, electric equipment and other manufactured products) rise, providing large positive scale economies for the country. Many of those firms now source cheaper raw materials and inputs from the ASEAN region and produce efficiently. In fact, 46% of the increase in total import demand for all goods in India is due to the increase in input demand by the domestic firms, with 21.5% of this increase accounted for by the Indian firms showing IRS.
Table 12. Performance of the Indian economy under assumption of IRS and imperfect competition
Indicators for performance of the economy
IRS and imperfect
competition
CRS and perfect competition
Per cent change in value GDP 0.48 -0.09 Per cent change employment (labour) -12.47 0.31 Per cent change in GDP price index 0.28 -0.08 Per cent change in volume of exports 1.80 2.24 Per cent change in volume of imports 2.32 2.29 Change in trade balance as per cent
of GDP -0.002 -0.001
Per cent change in terms of trade -0.034 -0.15 Total exports to ASEAN (US$
million) 8 924.54 8 915.01
Total imports from ASEAN (US$ million)
17 824.29 17 850.65
Total welfare (US$ million) • Allocative efficiency • Scale economics • Terms of trade • Investment-saving
1 279.72 -21.44
1 294.87 -44.62 -12.1
-307.57 -124.30
0.0 -171.18 -12.10
Change in welfare as per cent change in GDP
0.198 0.048
Source: Based on simulation results.

40
Table 13. Decomposition of allocative efficiency involving IRS and imperfect competition in India
(US $ million) Allocative efficiency -21.44 Profit shifting 44.37 Input tax 13.79 Consumption tax 65.13 Export tax -7.34 Import tax -137.40
Source: Based on simulation results.
India still continues to lose on account of the negative terms of trade effect and negative allocative efficiency effect. However, its allocative efficiency loss is now less compared with the results of the simulation under the current and ultimate scenarios. This is on account of the profit shifting effect (table 13). This is positive to the tune of US $ 44.37 million. This is positive when the profit-generating imperfectly competitive sectors expand output. The largest increase in output occurs in chemicals, followed by petroleum products and motor vehicles. Except for motor vehicles, the increase in domestic output of these sectors is due to increases in export demand from ASEAN countries.
Given that the number of firms is constant in the industry, and market size is increasing
with additional market access to the ASEAN region, Indian producers gain more profit due to the increased volume of demand for exports. The biggest markets for Indian chemicals are in Thailand (19.4%), the Lao People’s Democratic Republic (18.7%) and the Philippines (12%). Cambodia (53.7%) and Malaysia (20.6%) constitute the largest markets for petroleum products. Indonesia (56.2%) and Cambodia (42.7%) are the largest markets for motor vehicles. Textiles find the biggest markets in Viet Nam (45.5%) and Thailand (20.3%). Thailand (37.2%) and Malaysia (31.9%) are the biggest markets for mineral products. Exports of electric equipment from India find the biggest markets in Cambodia (37.5%) and Thailand (12.3%).
An increase in consumption tax mostly from the petroleum products sector plus an increase in production tax mostly from the chemicals sector contribute to a significant increase in efficiency. The macroeconomic, trade and welfare indicators of the ASEAN countries remain unaltered (as in earlier simulations detailed in section E) under the present assumption of IRS and imperfect competition for selected manufacturing sectors in India (table 2(e) of annex 2).
J. Conclusion
The present study provides an analysis of, and insight into the impact of the India-ASEAN FTA on the macroeconomic variables, trade variables and welfare position of India and the countries of the ASEAN region. The trade consequences of this FTA for the important trading partners of India, i.e., the United States, European Union, China, the rest of West Asia and the other developing countries of South Asia are also examined.
Three simulations of different scenarios were made, involving different stages of the FTA (current for implementation of the FTA between India, Malaysia, Singapore and Thailand;

41
ultimate as of December 2019 when all countries of the region will have implemented the FTA; and a hypothetical scenario of full liberalization). In addition, a simulation of the ultimate scenario with IRS assumption for some of the manufacturing sectors in India was made, and the impact on the economy noted and compared with the results obtained under the simulations with the assumption of CRS. The impact of the FTA according to the simulation results is summarized below.
1. Impact on India
India’s welfare gain appears to be negative at the initial stage due to both negative
allocative efficiency and negative terms of trade. The loss in allocative efficiency is due to a loss of import tax resulting from tariff reduction/elimination, while the negative terms of trade is explained by a larger fall in India’s export prices relative to its import prices. However, the country’s welfare improves as liberalization expands and the markets of the rest of ASEAN open up substantially. However, this gain is possible only when India is able to arrest the negative ToT effect through better usage of the benefits derived from large allocative efficiency. A scale economy effect will further ensure this. Thus, with the availability of better quality imported intermediary goods, India needs to invest in technology with a proper redistribution of the factor of production to achieve a sustained benefit through the India-ASEAN FTA.
India’s total bilateral trade with the ASEAN region increases considerably, with its
imports from ASEAN rising more than its exports to ASEAN members. This is true under all the scenarios, including the scenario where some of India’s manufacturing sectors exhibit imperfect competition and increasing returns to scale.
India gains the largest market accesses in Cambodia, the Lao People’s Democratic
Republic, Malaysia, the Philippines, Thailand and Viet Nam. The Indian exports that register the biggest increases are wearing apparel, textiles, food products, other crops, wood and wood products, fisheries, minerals, meat and meat products, some other manufactured products, beverages and tobacco, and leather and leather products.
The biggest increases in imports by India from ASEAN are from Indonesia, Malaysia, the
Philippines, Singapore, Thailand, Viet Nam and the rest of ASEAN. The sectors in India showing the biggest imports from ASEAN include meat, metals, food products, oil and gas, machinery, wearing apparel, other manufactured products, chemicals, transport equipment, ferrous metals, other crops and coal. These products would be available in India at much lower prices compared with prices prior to trade liberalization.
Although increased imports of these goods lowers their domestic production in India, in general, gross domestic output in India increases; this creates increased demand for most of the factors of production and their prices. The only factor for which demand falls (by 0.62%) is skilled labour. Although the country’s GDP rises with IRS in the manufacturing sectors, the level of labour employment worsens considerably – unskilled labour unemployment rises to 4.9% and skilled labour employment shows a 7.6% decline. The country’s GDP price index also rises compared to the earlier scenario of CRS.

42
2. Impact on ASEAN countries
Malaysia, Singapore and Thailand experience positive welfare gains, with the largest gain
accruing to Singapore. This is due to the fact that Singapore’s schedule of tariff commitments only comprises six items; as such, the FTA is tantamount to a unilateral liberalization by India for Singapore. These countries gain substantial market access in India, with Thailand experiencing the largest increase. Malaysia enjoys the largest welfare gain if there is full liberalization. The other countries, except Cambodia, the Lao People’s Democratic Republic and the Philippines, enjoy positive welfare. The gains accruing to all these countries are due to large positive terms of trade gain. This is because the prices of their exports to India fall much less than India’s export prices to their markets. This is explained by their relatively smaller market sizes compared to the Indian market. The welfare losses experienced by Cambodia, the Lao People’s Democratic Republic and the Philippines are also due to large negative terms of trade. Despite increased imports from India, total domestic production rises in Malaysia, Singapore and Thailand, causing their input demand and input prices to rise. However, in the smaller markets, increased imports from India lower total domestic output in all of them except the Lao People’s Democratic Republic and the Philippines. Demand for mobile factors and their prices in all these countries still register increases, except the Lao People’s Democratic Republic which registers a fall in factor prices.
3. Trade impact on other countries of the world
AIFTA results in much trade diversion occurring in India and the ASEAN members. All
countries lose a substantial share of their market in India – especially the South Asian countries of Bangladesh and Sri Lanka, and China – as well as in some of the ASEAN members. However, the extent of their losses is much less in the ASEAN region than in India. The market loss is virtually none in Singapore and highest in Cambodia.
To conclude, it could be said that, in general, the India-ASEAN FTA is likely to provide
many of the desired results for the countries involved, i.e., improved welfare for most of the countries, increased trade engagement, better market access in the partner country and, to a large extent, trade diversion in the India-ASEAN region. However, the relatively larger ASEAN members will derive more benefits in terms of GDP and welfare growth. India is expected to enjoy higher benefits only when the agreement has been fully implemented. India’s exports to smaller ASEAN markets are expected to grow faster as the agreement enters its final stage. ASEAN members will gain from a higher ToT effect while India’s gain will mainly be from resource reallocation and change in domestic production activities reflected through allocative efficiency. India’s import demand for several intermediate goods will remain high and ASEAN will have the advantage of supplying such goods at higher prices that are still lower than the average prevailing import prices in India. As a result, India will continue to experience a negative ToT effect.
However, the situation will change significantly if IRS is assumed for some sectors in
India. With this assumption, the fall in ToT slows down and, together with other effects such as ‘scale effect’ and ‘profit sharing’, helps the Indian economy to boost production efficiency and

43
increase overall welfare. This indicates that India’s benefit lies in its attempts to link allocative efficiency to further investment and production efficiency gain in export-oriented sectors (see the model in annex 3). Through this approach, India can increase its exports to ASEAN and specifically in the rest of ASEAN, and neutralize the net negative effect of terms of trade. The situation becomes further strengthened if the Indian economy is able to leverage positive scale effect through investment and upgrading of technology.

44
Annexes
Annex 1 Table Summary of Literature review Study Main research question Data and technique used Main findings
Pal
and
Das
gupta,
2009
What is the impact of the India-ASEAN
trade in goods agreement on India’s
plantation sector, marine products and
light manufacturing sector?
Studies the tariff schedule of
India under the trade
agreement and the production
structure of the ASEAN
countries
Short term: Plantation sectors such as tea, spices,
coffee and rubber would be negatively affected.
The marine products, textiles, garments, and auto
components industries are also likely to face stiff
competition.Long term: There are intersectoral
tradeoffs as far as impact is concerned. Thus, the total
welfare gain will crucially depend on the redistributive
measures adopted by the Government of India.
Pal and
Das
gupta,
2008
Does a free trade agreement with ASEAN
make sense for India?
Based on detailed study
of India’s tariff profile
Short term: No gain for India.. Long term: Agreement may make strategic sense,
especially if India wishes to become a hub for
service exports
Harilal, 2010 What is the likely impact of the India-
ASEAN trade in goods agreement (AIFTA)
for the economy of Kerala in southern India?
Based on a study of India’s
tariff schedule and the
provision for Rules of
Origin under AIFTA.
AIFTA would be detrimental to the interests of the
tropical commodity producers of Kerala. AIFTA is
likely to add to the already existing problem of severe
price instability with regard to these products, in
addition to pushing down the share of the producers
in the value chain.
Lee
and
Liew,
2007
What would be the impact of the then-
proposed India-ASEAN Free Trade Area on both India and the ASEAN members?
Used the Augmented Dickey
Fuller (ADF) and Phillips and Perron (PP) tests.
India and ASEAN are relatively integrated with
regard to the goods and services markets, but financial market integration was found to remain significantly
incomplete. The impact of liberalization will be great

45
on financial markets.
Sen,
Asher
and
Rajan,
2004
What is the potential for economic
cooperation between India and the ASEAN
region?
Descriptive study of the status and future prospects of India-
ASEAN economic relations.
Suggests that there exists significant potential for
greater economic cooperation between the two sides.
Karma
kar,
2005
What are the net gains that could arise
from liberalization of the commercially
traded service sector between India and
the ASEAN region?
Based on an analysis of the opportunities in services trade
that may arise out of India-
ASEAN economic cooperation. Also analyses the economic
scenario in the Asia-Pacific
region and takes a macro
overview of the trade creation
potential of an agreement on
trade in services between
India and ASEAN members.
In the medium term, much can be gained from a
bilateral engagement between India and the ASEAN
members in services, especially as the region
remains relatively closed to foreign service providers.
Kawai
and
Wigna
raja,
2007
What is the economic impact of forming
various types of agreements in East Asia
among ASEAN+1 groups such as ASEAN
+China, ASEAN+Japan, ASEAN+
Republic of Korea, ASEAN+India and ASEAN+Cmainly in the form of
FTAs or comprehensive economic
partnership agreements, ASEAN+3
(ASEAN, China, Japan and Republic
of Korea) ASEAN+6 (ASEAN+3,
Based on CGE model Among plausible regional trade arrangements,
the consolidation at the ASEAN+6 level would yield
the largest gains for East Asia.
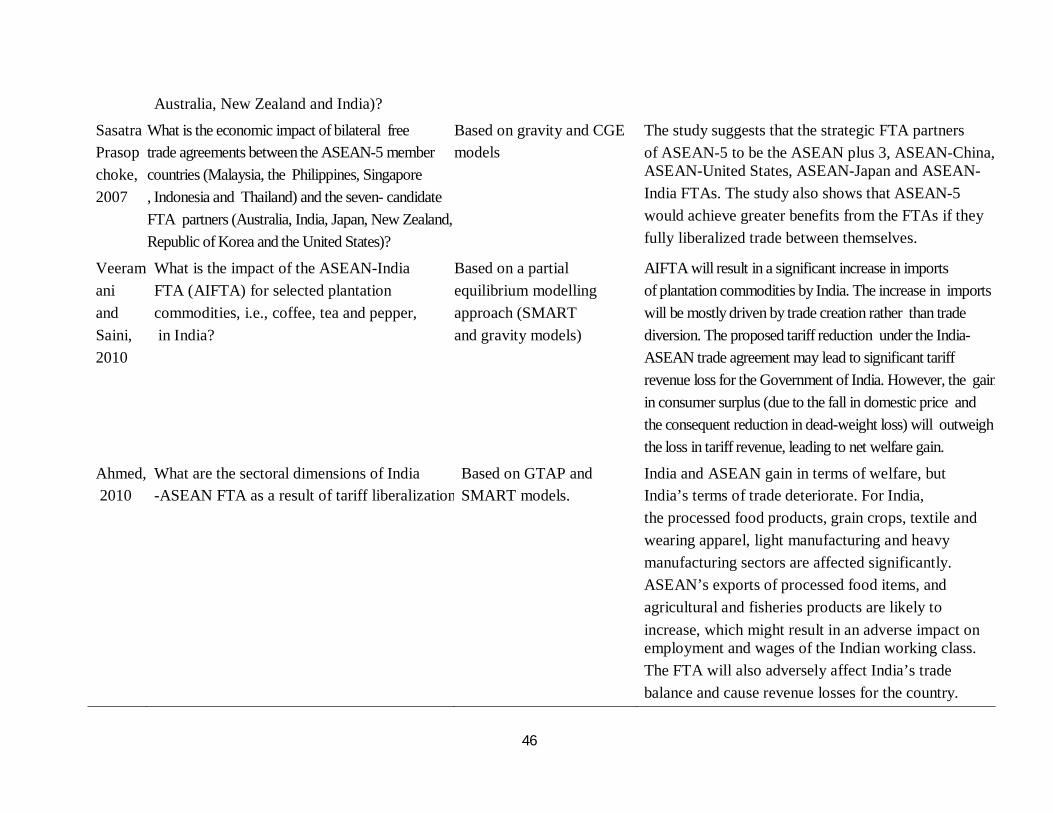
46
Australia, New Zealand and India)?
Sasatra and
Prasop
choke,
2007
What is the economic impact of bilateral free
trade agreements between the ASEAN-5 member
countries (Malaysia, the Philippines, Singapore
, Indonesia and Thailand) and the seven- candidate
FTA partners (Australia, India, Japan, New Zealand,
Republic of Korea and the United States)?
Based on gravity and CGE
models
The study suggests that the strategic FTA partners
of ASEAN-5 to be the ASEAN plus 3, ASEAN-China, ASEAN-United States, ASEAN-Japan and ASEAN-
India FTAs. The study also shows that ASEAN-5
would achieve greater benefits from the FTAs if they
fully liberalized trade between themselves.
Veeram
ani
and
Saini,
2010
What is the impact of the ASEAN-India
FTA (AIFTA) for selected plantation
commodities, i.e., coffee, tea and pepper,
in India?
Based on a partial
equilibrium modelling
approach (SMART
and gravity models)
AIFTA will result in a significant increase in imports
of plantation commodities by India. The increase in imports
will be mostly driven by trade creation rather than trade
diversion. The proposed tariff reduction under the India-
ASEAN trade agreement may lead to significant tariff
revenue loss for the Government of India. However, the gain
in consumer surplus (due to the fall in domestic price and
the consequent reduction in dead-weight loss) will outweigh
the loss in tariff revenue, leading to net welfare gain.
Ahmed,
2010
What are the sectoral dimensions of India
-ASEAN FTA as a result of tariff liberalization?
Based on GTAP and
SMART models.
India and ASEAN gain in terms of welfare, but
India’s terms of trade deteriorate. For India,
the processed food products, grain crops, textile and
wearing apparel, light manufacturing and heavy
manufacturing sectors are affected significantly.
ASEAN’s exports of processed food items, and
agricultural and fisheries products are likely to
increase, which might result in an adverse impact on employment and wages of the Indian working class.
The FTA will also adversely affect India’s trade
balance and cause revenue losses for the country.

47
Annex 2. Tables showing some data and results of various simulations Table 2. (a) Product categories belonging to normal (NT), sensitive (ST) tracks and exclusion list (EL) for India and ASEAN members
Commodities
India (to all countries except the Philippines)
Malaysia Singapore Thailand Brunei Darussalam
CambodiaIndonesia Lao PDRMyanmarPhilippines Viet Nam
India to the
Philippines
Wheat EL ST EL EL EL
Rice EL EL EL EL ST EL EL EL
Cereals EL ST EL EL EL
Vegetables and fruit
EL EL ST EL EL
Oilseeds EL EL
Other crops
Meat and meat products
ST ST ST
Milk EL EL EL EL EL EL
Dairy
products EL EL EL EL EL
Other animal products
Forestry
Fisheries EL EL EL
Coal
Oil and gas EL EL
Minerals
Vegetable oil and fats
EL EL EL EL

48
Sugar EL EL EL EL EL EL
Food
products ST ST
Beverages and tobacco
EL EL EL EL EL EL EL EL EL EL
Textiles ST ST ST ST
Wearing
apparel ST ST EL
Leather and
leather
products ST ST ST
Wood and
wood
products ST ST
Paper and
paper products ST EL
Petroleum
products EL EL EL
Chemical rubber and plastic
ST
Ferrous metals EL EL EL
Other metals
Mineral products
ST ST
Motor
vehicles EL EL EL EL EL EL EL
Transport ST ST EL

49
Source: Ministry of Commerce, New Delhi. Notes: (1) Calculated on the basis of the tariff commitment schedules of each country under India-ASEAN Free Trade Agreement; (2) Blank cells denote normal track.
equipment
Electrical
equipment EL
Machinery
Other Manufactured products
ST

50
Annex table 2(b) Top imports of the different ASEAN countries corresponding to their respective import prices and agents contributing to increased
Country Top 10 products Fall in prices of import composite available in the country (%)
Fall in prices (relative to average price of import composite) offered by Indian exporters (%)
Share of main agent/agcontributing to increased import Demand (%)
Sectors contributing to increase in demand for these imported inputs (%)
Malaysia Wood and wood products Other crops Wearing apparel Mineral products Textiles
0.04 -0.83 -1.34 -0.10 -0.49
-16.55 -13.17 -9.84 -11.90 -8.10
- Firms (70) Households (84.4) Households (68.5) Firms (75.5)
Food products, textiles, services Wearing apparels, textiles
Singapore Beverages and tobacco Rice Other crops Metals Chemicals
-0.05 0.09 0.37 0.06 0.03
-23.89 -0.20 -0.68 -0.21 -0.40
Households (138.4) -
Firms (60.6) Firms (100) Firms (94.7)
Other crops, services Metals, machinery equipment, other manufacturing
Thailand Meat and meat products Wearing apparel Wheat Food products Vegetables and fruit
-0.31 -1.18 -0.08 -1.28 -0.50
-32.64 -27.46 -21.32 -33.63 -6.57
Firms (93.2) Households (100)
- Households (51.5) Households (65.8)
Meat and product and leather product
Cambodia Other manufactured productsDairy products Leather Wearing apparel Wood and wood products
-1.51 0.04 -3.21 -0.17 0.06
-27.90 -25.87 -21.87 -25.77 -25.93
Firms (73.1) Firms (100) Firms (59) households (51.8)
-
Apparels, manufacturing, servicesLeather, services, food Leather, manufacturing, services
Indonesia Motor vehicle products Wood and wood products Meat and meat products Other manufactured productsPaper and paper products
-0.03 0.03 -0.01 -0.02 0.01
-15.36 -7.01 -4.92 -4.94 -4.42
Households (75.5) Households (85.1) Households (81.8) Firms (80.4) Firms (58.9)
Services, electric equipment, chemicals Paper, services
Lao PDR Textiles Chemicals Electrical equipment Machinery equipment Mineral products
0.02 -0.08 -0.02 0.05 0.17
-9.10 -8.04 -5.15 -5.38 -5.07
- - - - -
Myanmar Wearing apparel Textiles Meat and meat products
-0.22 -0.05 -6.82
-12.12 -9.16 -5.83
Households (100) - Households (74)

51
Leather and leather productsMetals
-0.20 -0.06
-6.75 -5.88
Households (61.9) Firms (99.7)
Services, manufacturing
PhilippinesTransport equipment Wearing apparel Wood and wood products Other manufactured productsChemicals
-0.92 -0.22 0.55 -0.09 -0.09
-16.88 -12.88 -8.76 -6.43 -5.47
Firms (84.6) Households (58.9)
- Firms (82.9) Firms (83.9)
CGDS, services Services, metals Services, chemicals, textiles
Viet Nam Wearing apparel Meat and meat products Other manufactured productsVegetables and fruit Food products
-0.13 -0.53 -0.05 -0.29 -1.26
-33.16 -15.73 -27.14 -14.75 15.33
Firms (63.1) Households (96.2) Firms (89) Firms (96.4) Households (58.9)
Apparels, services Electricals, manufacturing, services Food products
Rest of ASEANMachinery Other crops Leather and leather productsOther manufacturing Chemicals
0.02 -0.38 0.13 0.06 0.18
-14.77 -14.58 -2.89 -2.98 -1.82
Firms (80.8) Households (73.7) Households (100) Firms (53)
-
CGDS, services, machinery Services, manufacturing, CGDS
Source: Based on results of simulations involving the ultimate scenario.
Annex table 2(c) Top 10 imports of ASEAN countries, changes in their domestic demand, domestic output and factor demand
Country Top 10 products Directional change in output
Directional change in domestic demand
Directional change in total domestic output in country
Changes in demand for mobile factors in the country (%)
Malaysia Wood and wood productsOther crops Wearing apparel Mineral products Textiles
Falls Falls Rises Falls Rises
Falls Falls Falls Falls Rises
Rises Unskilled labour: 19.5 Skilled labour: 20.75 Capital : 15.46
SingaporeBeverages and tobacco Rice Other crops Metals Chemicals
Falls Falls Rises Rises Rises
Falls Falls Falls Rises Falls
Rises Unskilled labour: 6.56 Skilled labour: 8.92 Capital: 8.08
Thailand Meat and meat products Wearing apparel Wheat Food products Vegetables and fruit
Falls Falls Falls Falls Falls
Rises Falls Falls Falls Rises
Rises Unskilled labour: 2.39 Skilled labour: 1.75 Capital : 2.59
CambodiaOther manufacturing Dairy products Leather
Falls Rises Rises
Falls Rises Falls
Falls
Unskilled labour: -3.03 Skilled labour: - 2.15 Capital : -2.44

52
Wearing apparel Wood and wood products
Rises Falls
Rises Falls
Indonesia Motor vehicle products Wood and wood products Meat and meat products Other manufactured productsPaper and paper products
Falls Falls Falls Falls Falls
Falls Falls Falls Falls Falls
Falls Unskilled labour: - 6.12 Skilled labour: - 6.62 Capital : - 6.33
Lao PDR Textiles Chemicals Electrical equipment Machinery Mineral products
Falls Falls Falls Rises Rises
Rises Rises Falls Rises Rises
Rises Unskilled labour: 8.58 Skilled labour: 9.59 Capital: 8.88
Myanmar Wearing apparel Textiles Meat and meat products Leather and leather productsMetals
Falls Falls Falls Falls Falls
Falls Falls Falls Falls Falls
Falls Unskilled labour: - 13.44 Skilled labour: -12.75 Capital: – 17.46
PhilippinesTransport equipment Wearing apparel Wood and wood productsOther manufactured productsChemicals
Falls Falls Falls Rises Rises
Falls Falls Rises Rises Falls
Rises Unskilled labour: 3.87 Skilled labour: 3.65 Capital : 3.19
Viet Nam Wearing apparel Meat and meat products Other manufactured productsVegetables and fruit Food products
Falls Falls Falls Falls Falls
Rises Falls Falls Rises Falls
Falls Unskilled labour: - 9.43 Skilled labour: -6.00 Capital: – 5.09
Rest of ASEAN
Machinery Other crops Leather and leather productsOther manufactured productsChemicals
Falls Falls Rises Falls Falls
Falls Falls Falls Falls Falls
Falls -
Unskilled labour: - 2.01 Skilled labour: -3.31 Capital: – 4.00
Source: Based on results of simulations involving the ultimate scenario.

53
Annex table 2(d). Change in exports of other countries of the world to India and ASEAN members (Unit: Per cent)
United States of America European Union Rest of West Asia China Bangladesh Country
Current
Ultimate
Full liberalization
Current
Ultimate
Full liberalization
Current
Ultimate
Full liberalization
Current
Ultimate
Full liberalization
Current
Ultimate
Full liberalization
India -3.81 -4.86 -5.81 -2.7 -3.06 -3.44 -4.78 -5.27 -5.45 -4.83 -6.16 -7.40 -5.49 -12.29 -14.21
Malaysia 0.16 0.18 0.09 0.29 0.31 0.23 3.78 3.79 3.96 -0.24 -0.20 -0.64 -0.81 -0.81 -1.58
Singapore 0.58 0.61 0.72 0.50 0.51 0.59 0.86 0.74 1.24 0.31 0.37 0.51 0.52 0.58 0.68
Thailand 0.05 0.05 0.15 0.28 0.26 0.33 1.39 1.59 1.64 -0.15 -0.12 -0.10 -1.01 -0.93 -0.72
Cambodia -0.62 -0.63 -1.02 -1.00 -0.07 -0.07 -0.63 -0.60 -7.53 -7.53
Indonesia 0.36 2.36 0.43 0.70 1.26 1.25 0.27 0.27 0.41 0.18
Lao PDR 0.00 0.00 0.35 0.33 0.12 0.12 0.30 0.31 0.00 0.00
Myanmar 0.29 0.74 0.19 0.53 0.47 1.01 -0.08 0.48 -0.53 -0.80
Philippines -0.16 -0.29 -0.26 -0.26 0.92 0.96 -0.06 -0.08 0.00 0.00
Viet Nam 0.27 0.23 0.06 0.05 0.15 -0.26 -0.32 -0.44 -0.22 -0.22
Rest of
ASEAN
0.62 0.70 0.63 0.76 0.57 0.68 0.41 0.51 0.00 0.00
Annex table 1(d) (continued)
Sri Lanka Pakistan Rest of South Asia Rest of the world Country
Current
Ultimate
Full liberalization
Current
Ultimate
Full liberalization
Current
Ultimate
Full liberalization
Current Ultimate Full liberalization
India
-3.49 -6.35 -11.37 -1.8 -3.25 -10.06 -4.2 -6.48 -11.32 -3.87 -5.02 -6.75
Malaysia
-0.18 0.06 0.59 -0.72 -0.62 -0.95 0.92 1.18 1.96 0.25 0.31 0.14
Singapore
0.52 0.69 1.27 0.59 0.64 0.82 1.29 1.68 2.68 0.43 0.47 0.64

54
Source: Based on results of simulations involving the ultimate scenario
Thailand
0.06 0.10 31.47 -1.19 -1.17 -1.17 -1.86 -1.40 -0.48 0.00 0.01 -0.02
Cambodia
-1.59 -1.59 -1.02 -0.82 0.00 0.00 -0.96 -0.94
Indonesia
0.56 1.51 0.14 0.96 1.19 2.28 0.42 0.49
Lao PDR
0.00 0.00 0.00 0.00 0.00 0.00 0.26 0.22
Myanmar
0.00 3.03 -3.13 -1.74 0.00 8.33 -0.53 -0.28
Philippines
0.20 0.59 0.04 -0.04 1.02 1.36 0.03 0.03
Viet Nam
-0.39 -0.08 -0.78 -0.84 1.29 1.72 -0.30 -0.41
Rest of
ASEAN
0.00 0.00 0.00 0.00 0.00 0.00 0.50 0.59
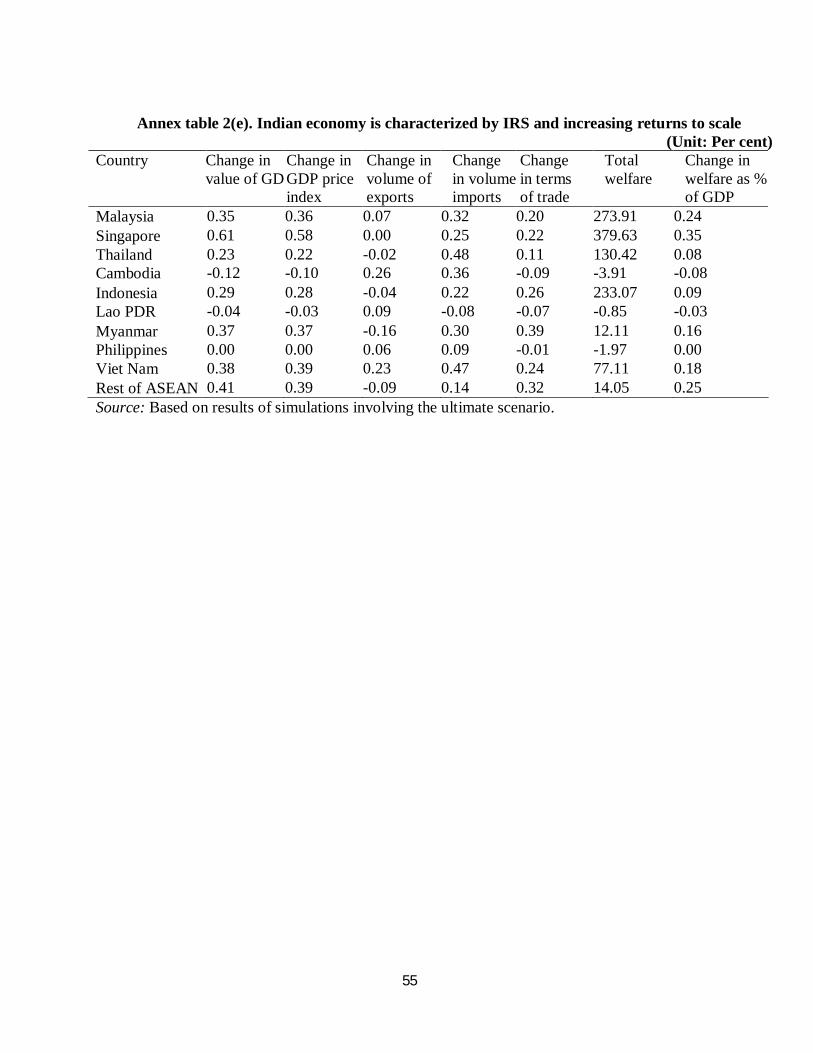
55
Annex table 2(e). Indian economy is characterized by IRS and increasing returns to scale
(Unit: Per cent) Country Change in
value of GDP Change in GDP price index
Change in volume of exports
Change in volume of imports
Change in terms of trade
Total welfare
Change in welfare as % of GDP
Malaysia 0.35 0.36 0.07 0.32 0.20 273.91 0.24 Singapore 0.61 0.58 0.00 0.25 0.22 379.63 0.35 Thailand 0.23 0.22 -0.02 0.48 0.11 130.42 0.08 Cambodia -0.12 -0.10 0.26 0.36 -0.09 -3.91 -0.08
Indonesia 0.29 0.28 -0.04 0.22 0.26 233.07 0.09 Lao PDR -0.04 -0.03 0.09 -0.08 -0.07 -0.85 -0.03
Myanmar 0.37 0.37 -0.16 0.30 0.39 12.11 0.16 Philippines 0.00 0.00 0.06 0.09 -0.01 -1.97 0.00 Viet Nam 0.38 0.39 0.23 0.47 0.24 77.11 0.18 Rest of ASEAN 0.41 0.39 -0.09 0.14 0.32 14.05 0.25 Source: Based on results of simulations involving the ultimate scenario.

56
Annex 3. Understanding the welfare decomposition for a developing economy
This annex presents a brief explanation of the main channels of welfare changes that result from implementation of an FTA involving a developing country. This is done by using the decomposition proposed by Baldwin and Venables (1995) and by implementing this decomposition in the GTAP model. This helps in understanding the forces that determine the impact of an FTA on a developing country. Following Baldwin and Venables, the welfare decomposition for a developing economy may be represented as follows:
dV/VE = t.dm – m.dp + [p + t –a ]. dX – X.ax .dx + [(r/ρ) – 1].dI (1)
where V is indirect utility function of the regional household, VE is marginal utility of expenditure, m is net imports, p is prices, t is tariffs, a is average cost, X is industry output, ax is δa/δx, x is output per firm, r is social rate of return augmenting capital stock and ρ is rate of discount.
The first term on the RHS of equation (1) – t. dm – represents the trade volume effect. Net
imports “m” are subject to a price wedge that is created by trade barriers “t’. Thus, changes in imports following FTA implementation have first order effects on welfare. This trade volume effect implies that trade liberalization will increase welfare of a country by increasing imports by those sectors of the economy where domestic prices are above world prices.
The second term – m. dp – represents the “terms-of-trade” effect. A decrease in the world
price (dp<0) of net imports (m >0) as a result of tariff liberalization creates a welfare increase. The third term on the RHS in equation (1) is “(p + t – a). dX”. This is referred to as the
profit-shifting effect. This term captures the welfare consequences of changes in total output (dX) in those industries that are characterized by IRS, i.e., where the domestic prices (p + t) differ from average cost (a). All other things being constant, reallocation of resources to those sectors having excess profits is no doubt desirable. However, this might create conflict with the much desired outcome of the trade volume effect captured by the first term (t. dm) of the equation. Take, for example, an economy that has more of its import-competing sectors characterized by oligopoly rather than the sectors that are export-oriented. In such a case, with tariff liberalization more imports should come in to replace the output of the domestic oligopolistic sectors, thereby increasing welfare as suggested by the trade volume effect. However, the profit-shifting effect, as represented by the third term, suggests just the opposite – output of oligopolistic sectors should increase in order for welfare to rise.
The fourth term of equation (1) – X. ax. dx – is the scale effect. This implies that increase in output per firm (dx > 0) lowers the average cost of production (ax < 0). Thus, the cost of producing total output (X) falls and total welfare increases. This term captures the effect of economies of scale that are unrealized. The implications of this term might also result in a conflict with the implications of the first trade volume term. As per the scale effect, the expansion of average output of a firm is needed to increase welfare, but as suggested by the trade volume effect the total output in import-competing industries should fall if welfare is to increase from trade liberalization. However, these two terms might work in synchronization if an industry is characterized by exit. As firms exit, output per firm will increase (as required by scale effect), even when total output falls (as required by trade volume effect).

57
The last term on the RHS in equation (1) – [(r/ρ) – 1].dI – is the accumulation effect.
Change in investment, although costly, instantaneously results in augmenting capital stock at the social rate of return “r”. This is discounted back to the present at the rate of discount “ρ” to obtain the present value, “r/ρ”. If this ratio is greater than one, then investment flows that occur in a country following an FTA implementation has a first order effect on welfare. The present study was interested in the static welfare effect, which includes volume-of-trade, profit-shifting and scale effects. Due to the lack of information on “r/ρ”, it is difficult to analyse the welfare implication of the inflow of foreign capital that follows implementation of an FTA. Thus, this aspect of the welfare decomposition represented by equation (1) was ignored and the focus was on understanding and analysing the welfare implications of the first three static effects of welfare.
As was the case with the simulations explained in section E above, the results of this simulation will show welfare being measured by Equivalent Variation (as done in GTAP model), which is decomposed into allocative efficiency, terms of trade, scale economics and labour endowment effects [this is not shown in equation (1)]. The allocative efficiency in the GTAP welfare decomposition includes trade volume effect [(term 1 of equation (1)] and profit shifting effect [term 3 of equation (1)]. The terms of trade effect in GTAP is the same as term 2 in equation (1) and the scale economies is the same as term 4 in equation (1). The allocative efficiency effect as shown in the GTAP simulations also includes the interactions between trade and domestic policy taxes or subsidies with regard to input use, consumption and tax replacement. These are not explicitly included in equation (1).
How are scale economies and imperfect competition modeled?
Scale economies for the selected sectors of an economy are modelled by combining the fixed costs with the average variable cost function, which is independent of scale. The average total cost is then given as: AC = FC/x + AVC = FC/x + MC (2) where AC is fixed cost, AVC is average variable cost, FC is fixed cost, MC is marginal cost and x is output per firm. In the literature, fixed cost (Francois, 1998) is most often calibrated via the cost disadvantage ratio (CDR). CDR measures the extent to which total cost exceeds marginal cost: CDR = [AC (x) –MC (x)]/AC(x) = FC/TC(x) (3)
In the present study, scale economies are modelled by linking percentage change in output to percentage change in input composite, assuming homothetic technologies (Francois, 1998; and Elbehri and Hertel, 2004):
xˆ= [1/1-CDR] zˆ (4)

58
where xˆ and zˆ are the percentage changes in output per firm and composite input levels, respectively.
In India, many of the manufacturing sectors are oligopolistic and quite concentrated. Given this high concentration, it is assumed that the firms engage in strategic behaviour with regard to each other. It is assumed that each oligopolistic firm holds Cournot conjecture with regard to its rivals’ behaviour. Calibration of Cournot markups is done on the basis of the following equation:
P – MC/P = (1 – 1/M) = 1/(ηε) (5) where P is price, MC is marginal cost, M = P/MC is the power of mark-up over marginal cost, η is the Cournot equivalent number of firms, ε is the market demand elasticity, and is given as:
ε = σ + (1 – σ) Σ (X r,s /X r) Sr,s (6) where σ is the elasticity of substitution between products from different sources, X r,s /X r is the sales share originating from region “r” sold in market “s”, Sr,s is the demand share of region “s” claimed by region “r”goods in total purchases of commodity.
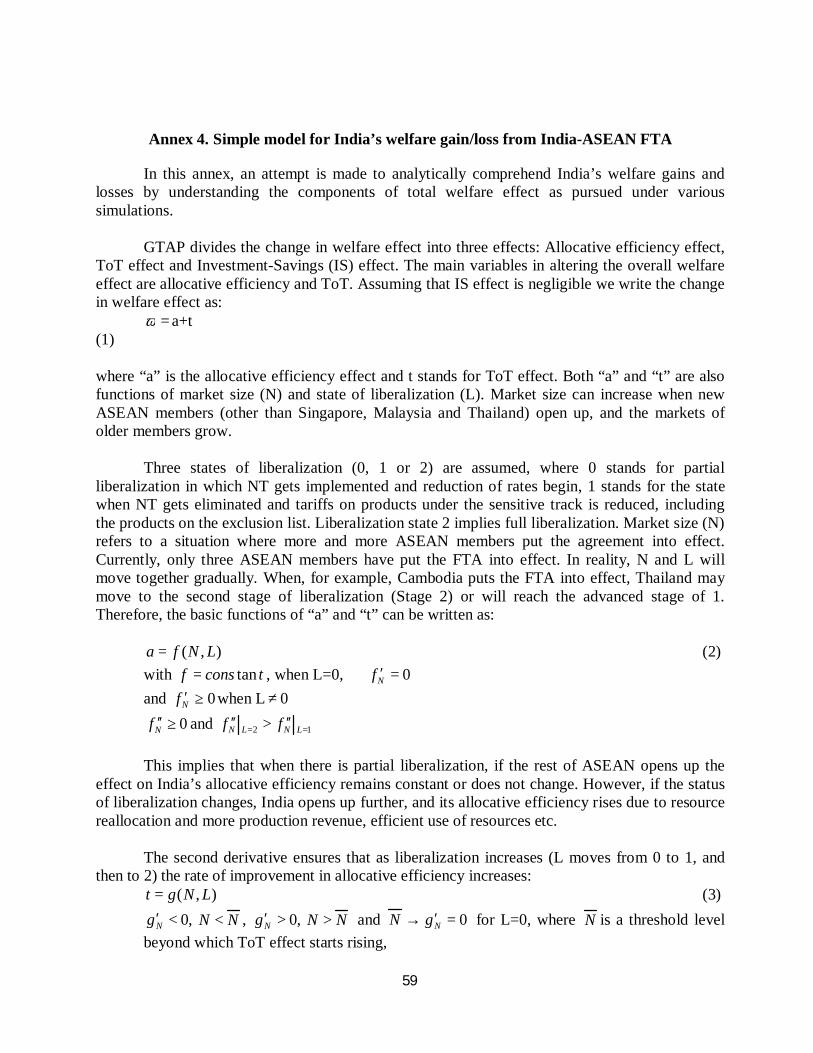
59
Annex 4. Simple model for India’s welfare gain/loss from India-ASEAN FTA
In this annex, an attempt is made to analytically comprehend India’s welfare gains and losses by understanding the components of total welfare effect as pursued under various simulations.
GTAP divides the change in welfare effect into three effects: Allocative efficiency effect,
ToT effect and Investment-Savings (IS) effect. The main variables in altering the overall welfare effect are allocative efficiency and ToT. Assuming that IS effect is negligible we write the change in welfare effect as:
=ω a+t (1)
where “a” is the allocative efficiency effect and t stands for ToT effect. Both “a” and “t” are also functions of market size (N) and state of liberalization (L). Market size can increase when new ASEAN members (other than Singapore, Malaysia and Thailand) open up, and the markets of older members grow.
Three states of liberalization (0, 1 or 2) are assumed, where 0 stands for partial liberalization in which NT gets implemented and reduction of rates begin, 1 stands for the state when NT gets eliminated and tariffs on products under the sensitive track is reduced, including the products on the exclusion list. Liberalization state 2 implies full liberalization. Market size (N) refers to a situation where more and more ASEAN members put the agreement into effect. Currently, only three ASEAN members have put the FTA into effect. In reality, N and L will move together gradually. When, for example, Cambodia puts the FTA into effect, Thailand may move to the second stage of liberalization (Stage 2) or will reach the advanced stage of 1. Therefore, the basic functions of “a” and “t” can be written as:
),( LNfa = (2)
with tconsf tan= , when L=0, 0=′⇒ Nf
and 0≥′Nf when L ≠ 0
0≥′′Nf and 12 ==
′′>′′LNLN ff
This implies that when there is partial liberalization, if the rest of ASEAN opens up the
effect on India’s allocative efficiency remains constant or does not change. However, if the status of liberalization changes, India opens up further, and its allocative efficiency rises due to resource reallocation and more production revenue, efficient use of resources etc.
The second derivative ensures that as liberalization increases (L moves from 0 to 1, and then to 2) the rate of improvement in allocative efficiency increases:
),( LNgt = (3)
,0<′Ng NN < , ,0>′
Ng NN > and 0=′→ NgN for L=0, where N is a threshold level
beyond which ToT effect starts rising,

60
0,0 ≠<′ LgN
and ,0≤′′Ng and 12 ==
′′<′′LNLN gg
Given that there is partial liberalization (L=0), this implies that as the rest of ASEAN
opens their markets initially India’s ToT effect will worsen; however, eventually India achieves market access, and its ToT starts improving and eventually becomes positive. However, when the state of liberalization changes, India needs to open up further by reducing the tariffs on sensitive list products as well as reducing the size of the exclusion list. In that case, India’s import increases significantly and its ToT worsens.
The second derivative ensures that the rate at which the ToT effect worsens will speed up
as more countries join and export to India. The overall welfare effect depends on the strength of these two opposing forces (“a” and
“t”). Annex figure 3.1 summarizes the behaviour of these two equations. Panel A and B describe the “f” and “g” functions under different states of L. The vertical sum of “f” and “g” provides the welfare effect, which is described in annex figure 3.2.
Annex figure 4(a) Allocative efficiency and ToT effect for India with respect to market size given the state of liberalization
Panel A Panel B
It is important to note that, in reality, the increase in market size and state of liberalization
moves together and what is seen is the combined effect. At the initial stage, if the rest of ASEAN starts opening up under a partial liberalization scheme, positive ToT dominates and India tends to gain marginally. However, India’s gains are short-lived. As the liberalization expands, India’s benefit from market access becomes neutralized by the negative terms of trade effect, which is due to a high influx of imports from ASEAN. The relocation of resources, higher production revenue etc. help India to enjoy a positive allocative efficiency effect, but that is not sufficient to cover the negative ToT effect. As a result, the overall welfare effect produces a negative figure.
f
N
f, L=2
f, L=1
f, L=0
g
N
g, L=2
g, L=0
g, L=1

61
Annex figure 4(b) Welfare gain and loss for India under different state of liberalization
Panel A
Panel B
In the Panel A of annex figure 3.2, separate welfare effects are drawn for different states
of liberalization. The dotted line shows the combined effect, which is properly drawn in the Panel B. During full liberalization, as described in simulation 1, India’s welfare will increase
substantially. This is depicted by the curve w1. The underlying assumption for that is NN gf ′′>′′
especially at L=2, which a careful look at annex figure 3.1 will explain. This implies that India’s long-term benefit is dependent on the increase in its allocative efficiency effect compared to its loss in ToT as the rest of ASEAN joins and the state of liberalization expands. This is possible when the allocative efficiency gain leads to better production and thereby some gain in the export
market. If it does not occur or the condition reverses [ NN gf ′′<′′ ] we get a curve like w2. In this
case, the TOT effect supersedes allocative efficiency as liberalization expands. In the conclusion, therefore, it can be argued that India’s benefit lies in its attempts to link the allocative efficiency to further investment and production efficiency gain in export-oriented sectors. Through this approach, India can increase its exports to ASEAN and specifically in the rest of ASEAN . This will help India to arrest the effect of negative ToT. Further investment in technology will produce positive scale effect and India can derive higher gain.
w
L=0
L=1
N
L=2
L=0 L=1
N
w
L=2
w1
w2
62
References
Ahmed, S. India-ASEAN Free Trade Agreement: A sectoral analysis, SSRN Working paper 1698849 (2010). Accessed November 2010. http://ssrn.com/abstract=1698849.
Baldwin, R. E. and A. J. Venables (1995). ‘Regional economic integration’, in G. M. Grossman and K. Rogoff (eds.), Handbook of International Economics, vol. II. Elsevier, North Holland.
Dash, P. K. (2010). ‘India-ASEAN: Trade in goods agreement’, SME Times, 20 January 2010. New Delhi, India.
Elbehri, A. and T. Hertel (2004). ‘A comparative analysis of the EU-Morocco FTA vs. multilateral liberalization’, GTAP Working Paper No. 30. Centre for Global Trade Analysis, Department of Agricultural Economics, Purdue University, Indiana, United States.
Francois, J. F. (1998). ‘Scale economies and imperfect competition in the GTAP Model’, GTAP Technical Paper No.14. Centre for Global Trade Analysis, Department of Agricultural Economics, Purdue University, Indiana, United States.
Harilal, K. N. (2010). ‘ASEAN-India Free Trade Area – noises of dissent from deep south’, State Planning Board Occasional Paper, Kerala State Planning Board, Thiruvananthapuram, India.
Huff, K. M. and T. W. Hertel (2000). “Decomposing welfare changes in the GTAP Model”
, GTAP Technical Paper No. 5. Centre for Global Trade Analysis, Department of Agricultural Economics, Purdue University, Indiana, United States.
Karmakar, S. (2005). India-ASEAN cooperation in services – an overview”, ICRIER Working Paper No. 176. Indian Council for Research on International Economic Relations, New Delhi.
Kawai, M. and G. Wignaraja (2007). ‘ASEAN+3 or ASEAN+6: Which way forward?’ Asian Development Bank Institute Discussion Paper No. 77, September 2007. Tokyo.
Lee, H. and V. K. S. Liew (2007). ‘India-ASEAN-5 economic integration: Impact of liberalization’, IUP Journal of Applied Economics, vol. VI, No. 6; pp. 7-20.
Pal, P. and M. Dasgupta (2009). ‘The ASEAN-India Free Trade Agreement: An assessment’, EPW, vol. XLIV, No. 38. Mumbai.
63
——— (2008). ‘Does a free trade agreement with ASEAN make sense?’, Economics & Politics Weekly, November 8, .Mumbai.
Sasatra, S. and M. Prasopchoke (2007). ‘Go with the Gang, ASEAN!’ ASEAN Economic Bulletin, vol. 24, No.3, pp. 339-335. Institute of Southeast Asia Studies, Singapore.
Sen, R, M. G. Asher and R. S. Rajan (2004). ‘ASEAN-India economic relations: Current status and future prospects’, Discussion Paper no. 73, Research and Information System for Non-Aligned and Other Developing Countries (RIS), New Delhi
Veeramani, C. and G. K. Saini (2010). ‘Impact of ASEAN-India FTA on India’s plantation commodities: A simulation analysis’, IGIDR working paper 2010-004. Indira Gandhi Institute of Development Research, Mumbai.