impact of information technology on management...
TRANSCRIPT

Impact of Information Technology on Management Efficiency
(A Case Study Of Pakistani Firms)
THESIS SUBMITTED TO THE INSTITUTE OF MANAGEMENT SCIENCES,
BAHAUDDIN ZAKARIYA UNIVERISITY, MULTAN PAKISTAN IN FULFILLMENT
OF THE REQUIREMENTS FOR THE DEGREE OF DOCTOR OF PHILOSOPHY IN
BUSINESS ADMINISTRATION
Muhammad Shaukat
Institute of Management Sciences Bahauddin Zakariya University, Multan(Pakistan)
2009

Impact of Information Technology
on Management Efficiency (A Case Study Of Pakistani Firms)
MUHAMMAD SHAUKAT
Ph.D.
Institute of Management Sciences Bahauddin Zakariya University, Multan(Pakistan)
2009

Certificate of Supervisor
It is certified that Mr. Muhammad Shaukat s/o Malik Imam Bakhsh has carried out
research on the topic entitled “Impact of Information Technology on Management
Efficiency: A Case Study Of Pakistani Firms” under my supervision.
His research work is original and distinct and his dissertation is worth of presentation to
Bahuddin Zakariya University, Multan for the award of Ph. D. Degree in Business
Administration. It is also to certify that he has incorporated all the changes/corrections/
suggestions in his thesis as pointed out by foreign referees in his previously submitted
thesis dated 21.12.2006, and desired by Advanced Studies and Research Board of
Bahauddin Zakariya University Multan, in its meeting held on 9th October, 2008. It is
further to certify that he has also incorporated all those changes/corrections/suggestions
in the format and otherwise in his thesis as desired by the local examiner in his evaluation
and viva/defense reports to my entire satisfaction.
His research work is now approved for submission and award of Ph.D degree in Business
Administration.
Prof. Dr. Muhammad Zafarullah 24/11/2009 Supervisor

Declaration I, Muhammad Shaukat s/o Malik Imam Bakhsh hereby declare that I have carried out
research titled “The Impact of Information Technology on Management Efficiency: A
Case Study Of Pakistani Firms” under the supervision of Professor Dr. Muhammad
Zafarullah for award of Ph.D. in Business Administration. I further solemnly declare that
according to my knowledge and belief, no research work pertaining to this topic has ever
been submitted in this university or in any other university.
I also hereby declare that before the present study, I have neither submitted any work
pertaining to this topic in this university or in any other university for any degree. I have
incorporated all the changes/corrections/suggestions in this thesis as pointed out by
foreign referees in my previously submitted thesis dated 21.12.2006, and desired by
Advanced Studies and Research Board of Bahauddin Zakariya University Multan in its
meeting held on 9th October, 2008. Moreover, I have also incorporated all those
changes/corrections/suggestions in the format and otherwise in my thesis as desired by
the local examiner in his evaluation and viva/defense reports.
Muhammad Shaukat 24/ 11 /2009 (Candidate)

Chapter 1 Introduction

Chapter 2 Information Technology Concepts
Development And Impact on Management

Chapter 3 Information Technology
In Pakistan

Chapter 4 Factor Affecting Information Technology Adoption

Chapter 5 Research Model

Chapter 6 Research Methodology

Chapter 7 Data Analysis And
Interpretation

Chapter 8 Findings, Conclusions And
Recommendations

Annexures
i
Abstract
Technology is seminal to the progress of any country. It helps to catalyze efficiency in
the provision of better production and services. It is the major enabler of social change
and development in the world. One of the major developments which had profound
impact on the economic growth pattern in the world in the new millennium has been the
strides in the domain of Information Technology(IT) sector. The world has observed
significant growth of applications in diverting areas of IT. This technology has drastically
changed the working of today’s organizations by increasing efficiency and effectiveness
over the past decades. Now Information Technology permeates nearly every aspect of
modern business operations and communications. It is being used over globe by all the
organizations of developed and developing countries for performance improvements.
Similar to other developing countries, this technology is also being applied by majority of
the organizations of Pakistan. Due to its increasing importance, the Information
Technology is one of the most exciting areas of research that has been the focus of
intense interest throughout the world over the decades but little has been devoted to
examining the impact of IT on Pakistani organizations.
The purpose of this study was to explore the relationship of IT with management
performance(efficiency and effectiveness) of Pakistani organizations. The manufacturing
and banking sectors of Pakistan are most progressing sectors and back bone of Pakistan
economy. Both the sectors have experienced different reforms from time to time and at
present are great user of IT, therefore, are selected for this research. These sectors have
made massive investments in IT by installing different IT systems from time to time. But
despite all this, they are still unable to find the most suitable systems, to achieve its full
benefits. They are experiencing with different systems and facing difficulties in
implementing various IT systems. This study examined the organizational performance
of banking and manufacturing sectors of Pakistan over decade from different angels in
addition to indicating the real problems these sectors are encountering in IT usages.
Various aspects associated with the topic have been explored and discussed in the
literature review and the primary data for detail study was collected from in-depth

ii
interviews and field surveys of 48 companies, 24 in manufacturing sector(12 local and
12 foreign) and 24 in banking sector(12 local and 12 foreign).
The data was tested by applying different financial and statistical techniques and the
results of the research have led to the conclusions that IT investments have positive
impact on the organizational performance and the banking sector performance outstrips
the performance of manufacturing sector. Although all the good performing companies
are using IT and most of them working with in-house developed IT systems, but the
performance of the companies which are using standard applications in both the sectors is
found to be excellent. However, it is highly dependent on the use of type of information
systems. The socio-cultural/organizational/systemic factors like cultural, social, political,
economic and human factors have impeded a lot to the implementation of IT in Pakistan.
In addition, various other problems like Pakistan inadequate telecommunication
infrastructure, lack of talented employees, improper planning, unjustified investment and
wrong selection of hardware and software are found to be the major constraints in
implementation of IT in Pakistani organizations. The employee education, training,
motivation, and reward were revealed as some of the measure the sample companies have
taken to overcome employee resistance in IT adoption. Moreover, top management
commitment and support were found to be the major reasons for IT success in the
organizations.
Considering the policy issues, it is suggested that the companies should install standard
customized systems for their core areas with compatible hardware, across the
organization. The IT project cost is to be properly categorized and rationalized so that it
should not exceed the expected benefits. The selection of software and hardware is to be
made more prudent. The increasing operating cost could be minimized by outsourcing
certain IT functions. Proper authenticity and security of the electronic transactions also is
to be ensured. There is also need from the government to further reduce communication
charges and expand telecommunication infrastructure to all areas. It is also suggested that
the specialized training for the world renowned standard E.R.P application packages such
as SAP, Oracle, Misys etc., is needed to be started at the mass level on low cost basis by

iii
educational institutions/universities by establishing E.R.P centers in collaboration with
leading E.R.P providers. The E.R.P application systems give more efficiency to the
organization, therefore, are getting popularity in the world and in Pakistan too. Due to
their better performance results the organizations are converting their old IT systems to
these new E.R.P solutions rapidly. So there is a great need for trained human resource in
this field in the organizations.
The government should also support these training initiatives and give more grants to
those educational institutions who want to establish such E.R.P centers. The same type of
training should also be started by E.R.P vendors by establishing some training academies
through out Pakistan or at least in its all big cities.
The procedures to retain the loyalty of the customer with increasing IT based e-business
popularity, in absence of physical contact, are also to be devised. The top management,
though very well aware of IT importance should also involve the IT division/department
head in the company’s strategic planning, product innovations, and in all other
managerial activities.

iv
Acknowledgements I am thankful to Allah Almighty, who is most beneficent and merciful, who blessed me
with courage, patience and enabled me to successfully complete this study with devotion
and spirit.
First and the foremost of all I am highly indebted to my talented supervisor,
Prof. Dr. Muhammad Zafarullah, for his inspiration to me to undertake this research. His
continuous guidance, expert attentions, critical insights, kindness, maximum support and
sympathetic generous attitude through out the research have been a great source for me to
make this research possible.
My profound thanks are for Prof. Dr. Rana Abdul Wajid, Director Center for Statistic
Lahore School of Economics, for extending all his generous guidance in bringing this
thesis to its final shape. I am highly grateful for his invaluable guidance and encouraging
discussions to accomplish this task. I also thank him for his hospitality which he showed
whenever I visited him in L.S.E for the purpose of my research.
I also owe my thanks to Prof Dr. Hayat M. Awan, Professor of Operations Research,
Institute of Management Sciences, for his valuable guidance in research design and
questionnaire formulation stages of my thesis. The unconditional support and efforts of
Mr. Liaqat Durrani, Managing Director SBP, for providing me all facilities from Sate
Bank of Pakistan to carry out this research are also highly appreciated. He deserves very
special thanks for helping me to make this manuscript possible.
I owe a special debt to Mr. Javed Iqbal, Country Corporate Head Allied Bank Ltd, for
arranging my surveys in different manufacturing companies across the country. I
gratefully appreciate the help extended to me by Mr. Amjad Bashir, Uniliver, Mr. Anwar
Chaudhary, LUMS, Mr. Bashir Ahmad, SBP, Mr. Rehman Mirza, SBP and Mr. Farooq
Khizar, KSE, in various ways for collection of relevant data. I believe without their
help, I would have not been able to compile my thesis.

v
I also appreciate the sincere help, cooperation and encouragements I received from my
dear friends Shumail Abbas, Muntazir Mehdi, and Raheem Malik whose support made
things less perplex for me in this precarious environment.
Last but not the least I bow my head to my mother, whose sincere love, care and prays
always had been source of my success. My wife Rukhsana, daughter Fizza and sons
Faraz and Sameer also deserve thanks for their patience and sacrifices which they made
during the course of my research work.
In closing, I wish to thank my student Ejaz Asalm, institute fellows Quratulain Bosan,
Nomeeta Zainab, A.B Malik and all other people who directly or indirectly helped and
assisted me during my study. I sincerely wish all of them best in their pursuits.
Muhammad Shaukat

vi
DEDICATED
TO
the memories of my
loving father , mother
and
dearest sister,
Who passed away
during my thesis
work.

vii
Table Of Contents
Page No Chapter 1.
Introduction
1.1.0. Background 01 1.2.0. Significance of the study 05 1.3.0. Specific objectives of the study 07 1.4.0. Organization of the study 08
Chapter 2.
IT-Concepts, Developments & Impact on Management 16 2.01 Introduction 16 Section 1 Information Technology and its Developments 17 2.1.1 Definition of Information Technology 17 2.1.2 Information Technology Developments 19
2.1.2.1 Historical Developments 19 2.1.2.2 Recent Developments 23
Section 2 Organizational Performance and its Assessment 28 2.2.1 Defining Organizational Performance 28 2.2.2 Assessment of Organizational Performance 29
2.2.2.1 Defining Management Efficiency 29 2.2.2.2 Types of efficiency 31
2.2.2.3 Measuring Efficiency 32 2.2.2.4 Defining Management Effectiveness 33 2.2.2.5 Approaches for Assessing Org. Effectiveness 33
2.2.2.5.1 System Resource Assessment 34 2.2.2.5.2 Internal Process Assessment 34 2.2.2.5.3 Goal assessment 34 2.2.2.5.4 Strategic Constituency Assessment 35
2.2.2.6 Comparison of Approaches of Effectiveness 35 2.2.2.7 Relationship between Efficiency and Effectiveness 36

viii
Table Of Contents
Page No Section 3
Information Technology And Organizational Performance 38
2.3.1 IT Impact on Management Performance: An Overview 38 2.3.2 IT and business process reengineering 42
2.3.2.1 IT as Strategic Weapon 42 2.3.2.2 IT and Organization Reengineering 44 2.3.2.3 IT and Organization Transformation 46 2.3.2.4 IT and Innovations 47 2.3.2.5 IT and Social & Economic Changes 48
2.3.3 IT and Management functions 51 2.3.3.1 IT and Planning 52 2.3.3.2 IT and Organizing 52 2.3.3.3 IT and Leading 56 2.3.3.4 IT and Control 57
2.3.4 Information Systems and Manager 59
2.3.4.1 Operational Level Systems 59 2.3.4.2 Knowledge Level Systems 59 2.3.4.3 Management Level Systems 59 2.3.4.4 Strategic Level Systems. 60 2.3.4.5 Transaction Processing Systems 61 2.3.4.6 Office Automation Systems 62 2.3.4.7 Management Information Systems 62 2.3.4.8 Decision Support Systems 63 2.3.4.9 Executive Support Systems. 66
2.4.0 Conclusions 67
Chapter 3.
Information Technology in Pakistan 79 3.01 Introduction 79 Section 1 Information Technology status in Pakistan 80
3.1.1 Historical Developments 80 3.1.2 Recent Developments 83

ix
Table Of Contents Page No
3.1.3 Pakistan Information Technology Infrastructure 86
3.1.3.1 Hardware Industry in Pakistan 87 3.1.3.2 Software Industry in Pakistan 88
3.1.4 Internet Status in Pakistan 91 3.1.5 E-Commerce Status in Pakistan 93 3.1.6 Telecommunication Status in Pakistan 96 3.1.7 International Communication: Internet Infrastructure 101 3.1.8 IT Human Resources Status in Pakistan. 103
3.1.9 Conclusions 106
Section 2
IT in Banking and Manufacturing Organization 108 3.2.0 General 108 3.2.1 IT in Banking Organization 110
3.2.1.1 Banking Sector Of Pakistan & IT: An Overview 115 3.2.2 IT in Manufacturing Organization 119
3.2.2.1 Manuf.Sector of Pakistan & IT: An Overview 121 3.3.0 Conclusions 123
Chapter 4. Factor Affecting Information Technology Adoption 131
4.1.0 Introduction 131 4.1.1 Cultural factors 132 4.1.2 Human factors 137 4.1.3 Social factors 140 4.1.4 Organizational structural factors 142 4.1.5 Political factors 144 4.1.6 Economic factors 146
4.2.0 Conclusions 147 Chapter 5.
Research Model 154 5.1.0 General 154 5.1.1 Propositions Derivations 157 5.2.0 Conclusions 158

x
Table Of Contents Page No Chapter 6. Research Methodology 159 6.1.0 General 159 6.2.0 Objective of Research 161
6.3.0 Collection of Information 162 6.4.0 Methods for collection of data 162
6.4.1 Methods to collect secondary data 162 6.4.2 Methods to collect primary data 164
6.5.0 Data Limitation 169 6.6.0 Sample Size 171
Chapter 7.
Data Analysis And Interpretation 176 7.1.0 General 176
7.2.0 Data Analysis Methods 176 7.3.0 Analysis Of Research Hypothesis No 1 178 7.4.0 Analysis Of Research Hypothesis No 2 201 7.5.0 Analysis Of Research Hypothesis No 3 210 7.6.0 Analysis Of Research Hypothesis No 4 225 7.7.0 Analysis Of Research Hypothesis No 5 229 7.8.0 Analysis Of Research Hypothesis No 6 233 7.9.0 Overall Conclusions of all Hypothesis 234
Chapter 8.
Findings, Recommendations And Conclusions 240
8.1.0 General 240 8.2.0 Major findings 240 8.3.0 Recommendations 246 8.4.0 Overall Conclusions 258
8.5.0 Directions for future research 259 Appendices i-xxxvii

xi
List Of Figures Figure Page No. 2.1 The Exponential Growth of Computing 1900-2100 22
2.2 History of Information Technology Development 26
2.3 A road map of efficiency decomposition 32
2.4 Kind of Information Systems 60
2.5 Types of Information Systems 64
5.1 Research Framework 155
7.1 Income & IT expense comparison of all companies n=20 184
7.2 Income & IT expense comparison of all companies n=32 184
7.3 Income & IT expense comparison of all companies n=32 184
7.4 Schematic diagram for ordered means-Customer Satisfaction 192
7.5 Schematic diagram for ordered means-Customer Links 194
7.6 Schematic diagram for ordered means-Job Interest of employee 197
7.7 Functions IT playing in organizations 203
7.8 Application software usage Analysis 206
7.9 Information System Levels in organizations 209
7.10 IT Adoption Problems 211
7.11 Schematic diagram for ordered means-Governmental 220
7.12 Schematic diagram for ordered means-Social 221
7.13 Schematic diagram for ordered means-Political 223
7.14 Schematic diagram for ordered means-Economic 224
7.15 Measures to Overcome IT Adoption Problems 228
7.16 IT Investment Trends 231
7.17 Reasons for IT Success 232
xii
List Of Tables
Tables Page No.
2.1 Changing role of IT over years 44
3.1 Statistic Of Pakistan’s IT/ITES Industry 97
3.2 Approximate no of IT professional in Pakistan 105
3.3 Pakistan’s e-Banking Infrastructure Statistic 118
3.4 Sector Share in G.D.P up to 2002 122
4.1 Information Technology Barriers Summary 145
6.1 List of Group 1 Companies Surveyed 172
6.2 List of Group 2 Companies Surveyed 173
6.3 List of Banking Sector Surveyed 173
6.4 List of Manufacturing Sector Surveyed 174
7.1(a) Regression Results For Banking Sector 179
7.1(b) Regression Results For Manufacturing Sector 179
7.1(c) Regression Results For All Companies 180
7.1(d) Regression Results For All Companies 2 180
7.2(a) Regression Results For Banking Sector 1990-2004 180
7.2(b) Regression Results For Manufacturing Sector 180
7.2(c) Regression Results For All Companies 180
7.2(d) Regression Results For All Companies 1999-2004 181
7.3 Regression Results For Total & IT Employees. 181
7.4(a-c) Income & IT expense comparison for different years 183
7.5 Results of one sample t-test Customer Satisfaction 191
7.6 Results of one way ANNOVA-IT Adoption Benefits 192
7.7 Results of one sample t-test Better Customer Links 193
7.8 Results of one sample t-test Company Image 195
7.9 Results of one sample t-test Job Interest of Employees 196
7.10 Results of one sample t-test Stake Holder Confidence 198
7.11 Results of one sample t-test Interoffice Links 199

xiii
List Of Tables Tables Page No.
7.12(a) Reg. Results IT Levels Vs Quantitative variable 202
7.12(b) Reg. Results IT functions Vs Quantitative variable 202
7.13 Chi-square Results of Different Problems 203
7.14 Chi-square Results of Different Problems - 211
7.15 Results of one sample t-test Culture 215
7.16 Results of one way ANNOVA-All Factors 215
7.17 Results of one sample t-test Human 212
7.18 Results of one sample t-test Organizational 218
7.19 Results of one sample t-test Governmental 219
7.20 Results of one sample t-test Social 221
7.21 Results of one sample t-test Political 222
7.22 Results of one sample t-test Economical 224
7.23 Results of Measures to overcome IT adoption 227
7.24 Results of one sample z-tests-IT success reasons 230
7.25 IT Investments Trends-Sector Wise 232

xiv
Acronyms
ABC Atanasoff Barry Computer
ABL Allied Bank Ltd
ACBL Askari Commercial Bank Ltd
ASCI Application Specific Integration Circuit
ATM Automated Teller Machine
ANOVA Analysis Of Variance
CAD Computer Aid Designing
CAM Computer Aid Manufacturing
CBR Central Board Of Revenue
CIM Computer Integrated Manufacturing
DSS Decision Support System
DSL Digital Subscriber Line
E-Business Electronic Business
E-Commerce Electronic Commerce
E.R.P Enterprise Resource Planning
ESS Executive Support System
FBL Faisal Bank Ltd
FWBL First Woman Bank Ltd
HBL Habib Bank Ltd
IBM International Business Machine
ICT Information And Communication Technology
ICL International Computer Ltd
IS Information System
ISDN Integrated Services Data Network
ISP Internet Service Provider
IT Information Technology
KWS Knowledge Worker System
LAN Local Area Network

xv
Acronyms
MCB Muslim Commercial Bank
NCR National Cash Register
NBP National Bank Ltd
PASHA Pakistan Software Houses Association
PTC Pakistan Telecommunication Corporation
PTA Pakistan Telecommunication Authority
PESB Pakistan Software Export Board
MOST Ministry Of Science And Technology
MIT Ministry Of Information Technology
MIS Management Information System
OA Office Automation
OFC Optical Fiber Cable
RDBM Relational Data Base Management
R&D Research And Development
S&T Science And Technology
SBP State Bank Of Pakistan
SDC Skill Development Centre
SECP Security & Exchange Commission Of Pakistan
TAN Tiny Area Network
TPS Transaction Processing System
VAN Value Added Network
VPN Virtual Private Network
VSAT Very Small Aperture Terminal
WAN Wide Area Network
WWW World Wide Web

1
Chapter
Introduction
Background
1.1.0. Information Technology(IT) is a powerful force in today’s global society. The
advent of computers and IT has been perhaps the single massive drive impacting
organizations during past few decades. IT is a diversified version of computer sciences
and it is not only a conventional keypunching, data storing, manipulation and report
printing but it is information collection, transmission, logging, recording, intelligent
decision-making and presentation in desired form at desired place. Greaves(2005)
explains that the IT is revolutionizing all the living ways. It is changing all aspects of life
and life style. The digital revolution has given mankind the ability to treat information
with mathematical precision, to transmit it at very high accuracy and to manipulate it at
will. Marshall(2002) views that the amount of calculation power which is available to
mankind is increasing at an exponential rate. Computers and communications are
becoming an integral parts of every days lives. Arguably, no area is as promising in its
potential as IT. No doubt, it has given a new meaning to the word “Convenience”.
Information Technology has drastically changed the business landscapes and word “IT”
has become the “Catchword” of the modern life today. Long and Long(1999) identify
computer as the key technological device producing the third greatest revolution in
human history. Automation via computerization is one of the highest priorities and
objectives in modern organizations. Morton(1998) highlights that IT applications impact
task productivity, task innovation, consumer satisfaction and management control.
Computer can have an important role in leveraging productivity and efficiency in various
organizations, government and private alike. Morton(1998) further argues that computer
ensure a fast, reliable way to execute all tasks, and organizations with successful IT
adoption and implementation processes are generating significant performance gains and
competitive advantages.
1
2
The business world today stands on the threshold of revolutionary change, change that
will affect every aspect of doing business in future. The technology of today and rapidly
changing technology of tomorrow is leading the way to a truly global marketplace. The
factors of geographical locations, time and distance are no longer the barrier that they
were in the past. Today, IT influences the structure and operations of organizations more
profoundly than any other technology ever had (Mahmood and Mann, 1993). IT has not
only changed the work styles of the organizations but also has significantly increased the
efficiency and output, resulting therein the increase in profits of the firms. The growth of
any company, in addition to capital, intelligent human resources and good production
techniques, is now highly dependable on the use of computers or Information Technology
specifically (Gupta, 2000;Reyonld, 1995; Morgen, 1998).
It has been argued by many researchers that IT use has become an important part of the
world productivity in the recent years(Agouram ang Ingam, 2003; Martin et. al 1999).
The IT revolution has transformed the world at such a pace and in ways that only a few
had the vision to contemplate just a decade ago. Dadashzadeh(2002) points out IT rapid
progress in a ways that in January 1996, 30 million people were using the Internet but at
the dawn of the new century, however, more than 400 million people were online. This
1333 percent change over only five years is a harbinger of how the Internet will continue
to alter the way, how the work is done, how business is transacted, how government
services are delivered, how children learn, how health care is received, even how social
affairs are conducted. Though the IT revolution began in the United States, but it has
affected the entire world by producing a new, Internet-based, digital economy in which
geographical distance and borders have become less of an obstacle to global trade.
These advances in IT have also opened up market niches for competitors from
unexpected places. A study by the joint Economic Committee of the United States
Congress concludes that the Information Technology is an important factor in the recent
acceleration of productivity growth and that both the production and the use of IT
contribute to the productivity revival. Indeed, the new generation of IT, especially web-
based electronic business technologies have dramatically changed the nature of business
competition and have altered the structure of markets in a number of industries. Over the

3
past two decades, large global corporations have made enormous investments in
IT(William and Sawyar, 2000).
The developing countries are increasingly deploying IT to solve their developmental
problems by investing in it from their own sources as well as by borrowing from different
institutions (Odedra and Kluzer, 1988). Lending for IT by the World Bank has also been
quite pervasive and growing at six times growth rate of total banks’ lending. A study has
shown that the significant IT components were present in over 90% of all World Bank’s
lending in developing countries (Harris and Davison, 1999). It is also estimated that total
annual worldwide expenditure on IT probably exceeds one point five trillion US $ per
year and is growing at about 10% compounded annually(Anandarjan and Anakwe, 2002).
Information Technology also creates a serious dilemma for management today. IT
innovations have the potential for changing the competitive game for any organization.
On the other hand, the size of IT investments put increasing pressure on managers to
asses its business value. One key to this dilemma is to improve the ability to measure and
track the impact of IT on productivity. Alongside, the seemingly inexorable rise in IT
investment in the last 20 years, there have been considerable uncertainty and concern
about the productivity and efficiency impact of IT being experienced in work
organization. However, in quest of improving efficiency and effectiveness, the companies
are making heavy investments in IT. These enduring magnitudes of investment in IT have
drawn attention of many researchers, managers and policy makers to the impacts of IT on
growth and productivity. The expectation was that increased investment in IT would
naturally lead to increase performance of organization. But despite the massive
investments in IT both in the developed and developing economies, the impact of IT on
productivity and business performance continued to be questioned(Winter and Tylor,
1998). Despite hundreds of studies carried out, scholars remained deeply divided into two
groups which can be identified as “Productivity Paradox-IT has no impacts on
productivity” (Loveman, 1994; Mitra & Brendt 1990; Dasgupta et. al(1999) etc.), and
“Productivity Payoff- IT does improve productivity” (Bender, 1986; Harris & Katz, 1991,

4
Brynjolfsson, 1993; Brynjolfsson, & Hitt, 1996, 1998; Attewel & Rule, 1984; Dewan &
Kraemer, 1998; Weill, 1992; Mehmood & Mann, 2000).
It has also been debated in the literature that the differences in results of both the groups
are not real but may be due to different measures and methods used by different
researchers for measuring IT performance. The issues seem also be highlighted that it is
not the impact of IT on productivity and efficiency that makes the difference but it is on
the deficiencies of measurement of both productivity measurement indicators and IT
measurement indicators. There are methodological issues. However, the group that
believes that the IT improve productivity argues that productivity paradox findings are
misleading, and do not capture many elements related to actual productivity
measurements, thus leaving a gap in between (Dawett and Jones, 2001; Bhatt 2000 etc.).
The “Payoff” group’s finding is complemented by a third group whose research on
specific areas of impact of IT on productivity such as on knowledge workers, on
employment, and on manufacturing processes, did find persuasive evidence of gains in
productivity (Kelly,1994);Savoie & Raisinghani(1999); Gader(1996). Synthesizing the
work of various studies in IT research, the final conclusion in this regard can be made
that “Yes” IT investment is productive but there is yet little empirical evidence of this
increased productivity besides that most of the above refered researches have applied
statistical or financial techniques to measure the efficiency of IT.
The literature on IT related to the developing countries has expanded and varied to
include both optimistic and pessimistic opinions as well as critical apologetic views of
changes and forces driving them. The literature shows that IT generates many benefits
and is a key to progress if it is accepted and used warmly by the concern employees in
organizations (Venkatesh & Davis, 2000). There is a significant resistance to adopting
and using computer resources in developing countries. In many countries, organizations
experience difficulty and even failure in transferring IT into practice despite spending
billions of dollars (Hill et. al, 2002). The problems seem to be worst in developing
countries (Mehta & Shah 1998; Davis, 1993). The goal of every information systems,
based in any organization is to improve performance on the job and this performance

5
efficiency is only achieved when IT is deployed properly. The slow IT diffusion in
developing countries could be attributed to poor infrastructure, language barriers,
sociopolitical, cultural and economic risks and conflicts (Chan 2000; Gader, 1999;
Odedra & Kluzer, 1998). In their quest for development, many developing countries put
great hope in use of IT. Yet, the challenges of IT diffusion in these countries are by no
means identical to the ones in the developed countries. The challenges faced by
developing countries in harnessing the full potential of IT are not really very different
from those of that confronted by the developed countries or rather these are more critical.
IT now is the most preferred choice of all the countries to upgrade their economies and
become competitive in the global market place. The IT based economies have
streamlined the most complex economies of the world and enhanced the productivity to
the level where an economy such as US has wriggled out of the entire trillion plus dollars
national deficit and turned into a surplus in recent years. The world economy now has
moved from low-value basic industries to a fast paced high-value information based
economy.
Significance of the Study
1.2.0. The impetus for this research came from the main reason that in modern
organizations technology is a key to competitiveness and economic growth. Among all
the technologies of this time, progress in IT has no doubt had and continues to have the
greatest influence on the global economy, making it possible to collect, process, and
transmit information at breathtaking speed and declining cost, thereby increasing
productivity and improving quality and efficiency in all types of industries and services
in the entire world. Pakistan has also accepted this challenge of 21st century by making
efforts in the development of IT. A decade ago IT had very little introduction in the
country, but very soon with the efforts both on private and government fronts the concept
of IT has become very popular with all Pakistani organizations.
At present IT has become a reality in all most all the activities of all Pakistani
organizations and Pakistan now is one of those developing countries, which is trying to
put all its efforts to get maximum benefits of IT. Many organizations, which are working

6
in Pakistan, now are using IT to increase their efficiency and productivity. The latest
information about the new inventions, going on around the globe and the knowledge
about the high-tech advanced products available in the world market is being spread
widely in the country. Many business entities of Pakistan that have deployed IT are able
to some extent to optimize cost, reduce wastage, serve their clients better and make
timely decisions. They become capable to serve their customers in a better way and
ultimate benefit they receive is in improvement in profit margins and better return on
investment. The savings made are far higher than the investments made in technology but
still a lot more has to be done to make full use of IT in Pakistan’s core industries.
The banking and manufacturing industries of Pakistan constitute a major portion of
Pakistan’s economy and have experienced continuous structural and technological
changes in different regimes. The manufacturing and banking industries are the major
users of IT products and have also gone through innovations and shocks throughout the
1990s either due to the rapid changing technology or unexpected shocks, such as
economic sanctions and ban on Pakistan after nuclear explosion on supply of some new
technologies from advanced countries. However, by somehow, both the sectors i.e.
manufacturing and banking have managed, to some extent, the pace with new
technologies for their growth and performance increase.
This study is therefore a modest yet significant attempt to explore the importance of the
role which IT currently is playing in the organizations and its impact on organizational
performance i.e efficiency “minimum utilization of resources and getting maximum
output” and effectiveness “how well the job is gets done” Robbins and Coulter(2003), of
Pakistani banking and manufacturing industries, over time period of 1994-2004. Various
studies have been undertaken to measure the impact of IT on organizational performance
of business organizations using different performance indicators which are considered
key factors. These variables include income, customer satisfaction, supplier/customer
links, company image, job interest of employees, stake holders confidence and interoffice
links e.t.c. Researchers like Parthasamthy & Sethi(1993), Kelly(1994), Earls &
Fenney(1996), Rumizen(1998), O’Dell(1999) etc. have investigated the impact of IT on
7
overall incomes/profits of the companies and found positive impact. Whereas,
Franklin(1997), Olalla(2000), Schmid et. al(2001), Zee(2004) etc. have seen the
increase/decrease in customer satisfaction, company image, job interest of employees,
stake holders confidence, interoffice link etc. after implementation of IT and have
concluded that IT ultimately has positive impact . This study measured the relationship
of IT with organizational performance (based upon above variables) of Pakistani
companies operating in banking and manufacturing sectors. The study also centered on
the identification of type and characteristics of IT available in the world, and that IT,
which is being used in Pakistani organizations. Identification of factors affecting proper
IT implementation, potential barriers, strategies to overcome these barriers, an
identification of suitable world level IT infrastructure and the proper direction of
investments flow on this resource to exploit its full potential were also other focuses of
this study. The researcher believes that no study of similar nature has ever been
conducted so far in Pakistan.
Specific Objectives Of the study
1.3.0 The central objective of the present study was to sought the relationship of
Information Technology with organizational performance of Pakistani companies in term
of both efficency and effectiveness. It has also focused on the problems faced by different
business firms in Pakistan in coping with the new IT developments and in successful
implementation of IT systems. It is almost desire of each and every company to increase
its performance i.e efficiency and effectiveness, by incurring less cost and by applying all
latest technologies, techniques and tools. But to achieve so, the organizations do face
many problems in the way of adoption and implementation of any new technologies in
their setup. These problems may arise as a result of deploying technologies without
planning, incompetent human resources, poor management, lack of financial resources,
culture, political, social, governmental and other organizational, systemic and
environmental pressures.
This research has tried to identify those factors which facilititate or limit the firms
operating in Pakistan’s banking and manufacturing sectors in IT adoption. As the IT

8
includes computer hardware, software, personnel, telecommunications and resources
assigned to supporting IT, investigations therefore are focused on such issues as
identifying that which part of IT and what IT mix is most important and suitable for
organization success and has the grater effect on increasing organizational performance.
It has also examined that how this effect is achieved by deploying proper IT.
The study highlighted the importance of training and user involvement in IT projects. It
also identified the reasons for slow pace of IT implementation in Pakistani firms. It
examined the investments of firms in IT and its comparable usefulness/ benefits. It
exploited IT as strategic asset, management tool and a success factor for Pakistani firms
and identified a suitable infrastructure for successful implementation of IT in business
firms to increase their efficiency. Lastly, the study has also identified the role of Pakistani
Government to boost up IT sector and its economical and quality availability to the
organizations.
Organization of the Study.
1.4.0. This study is divided into following chapters. A brief description of each chapter is
presented as under. Following the introduction is,
Chapter 2: IT- Developments & Impact on organizations.
This chapter deals with the definition, development and management impact of IT. It
presents a number of views relating to Information Technology together with a discussion
that how IT is developed over time and what is its present state?. IT is playing an
important role in the society and in organizations. Therefore, it has profound effects on
the performance of the managers and overall organizations. IT has transformed the nature
of international business and it is one of the largest and fastest growing industrial sectors
for the coming century. Electronic commerce, electronic data interchange, electronic
government and development in telecommunication are main forces in IT revolution. All
the national governments have the aim of bringing the benefits of IT to every segment of
the economy, government and public life. There is no sector, manufacturing, service,
trade or government activity where IT can not be applied. It gives many advantages and
benefits in term of productivity, safety, efficiency, reliability as well as savings in cost

9
and time. The IT role in increasing organizational performance in all management
functions with different IT based information systems is also presented in this chapter.
This chapter is divided into three sections Section 1. Defines Information Technology
and describes its development over the time. Section 2. Discusses the organization
performance, its components and different methods for its assessment. Section 3.
Examines the importance of IT in increasing organizational performance. Emphasizes is
also made to view the IT impact on business processes and on management functions. An
overview of different management systems, which are available to the managers to
perform their jobs effectively in the organizations, is also given in this chapter.
Chapter 3: Information Technology in Pakistan
5.0.1 This chapter presents discussion on Information Technology status in Pakistan.
Information Technology is the key enabler of change in today’s rapidly evolving business
environment. IT revolution has changed the life style of people in every part of the world. It
has eliminated the geographical distances and due to advance communication facilities, the
entire world can be viewed on computer screen by just a click of a button. IT is the major
contributor to the progress of the developed countries. The effective use of IT is an essential
element of competing in a fast-paced, knowledge based economy. IT ‘cross-cuts’ all
operational functions within the organization and acts as the fabric that knits together
business processes. Today governments and private companies around the world are working
on IT solutions required for their growth. This technology has emerged as a very fast growing
sector in Pakistan as well and obviously IT sector is a deep resowant sound. With continuous
and concerted patronage of the government, there has been unmatched development in IT
infrastructure in the recent years. The government, in the IT sector, is making sizeable
investments and a huge chunk of this budget is meant for human resource development and
provision of enabling infrastructure. Majority of the organizations working in Pakistan are
making use of IT to increase their performance but of course there is a performance variance
among different industries.
This chapter consists of two sections. Section I examines IT history in Pakistan, Pakistani
Government contributions to support IT diffusion in the country, IT usage in Pakistan
industry, Pakistan IT infrastructure i.e. Pakistan’s hardware and software industry, status of

10
Internet, E-Commerce, Human Resources and Telecommunication in Pakistan. It also
discusses growth and potentials of IT in Pakistan. Section II first brings into prominance the
importance of IT usages in business organizations and then it leads to the core areas of
research and discusses IT usage status in Pakistan’s Manufacturing and Banking Industry.
Chapter 4: Factors Affecting Information Technology Adoption.
The use of technology and IT in particular is essential to the successful operations of the
today’s organizations. Information Technology now is one of the major factors improving
productivity and performance of the organizations. As the introduction and adoption of any
new technology is encountered with many challenges and obstacles, so is the case with IT. A
number of factors appear to impede/facilitate the diffusion of IT, in both developing and
developed countries and this is particularly true for small and big organizations.
This chapter discusses different factors that may affect an organizations’ decision to adopt
an innovation. These factors include organizational factors like culture, structural, human
resources and systemic factors like social, governmental, economical, political etc. It also
discusses different issues relating to these factors and the ways to make these factors more
favorable for IT adoption particular in Pakistani context. The conclusion of the discussion is
given at the end of the chapter.
Chapter 5: Research Model
This chapter presents the research framework which is drawn based upon the literature
review (Theoritical, empirical and Pakistan specific).This framework graphically depitch
the relationship of IT usage and organiozationa performance and the factors impacting
that usage. The research questions drawn from this framework are also presented in this
chapter.
Chapter 6: Research Methodology
This chapter describes the methodology used to collect data for the purpose of this
research. Various methods of collecting data are discussed and the the survey through
questionnaire methods with a structured close ended questionnaire in personal interview

11
method was considered to be the most appropriate for fulfilling the objectives of this
study, therefore, it was used for this research. In the sample a total of 48 companies (24
locals and 24 foreign) are selected both from banking and manufacturing sectors of
Pakistan. Data limitation, problems of researcher in data collection, and list of sample
companies are also discussed in this chapter.
Chapter 7: Data Analysis And Interpretations
This chapter presents analyses of the data and interprets the finding of the surveys. This is
done by developing six hypotheses based upon the research questions developed in
chapter 5. A sperate discussion on results of each hypothesis is made and the overall
conclusion of all the hypothese is made at the end of this chapter.
Chapter 8: Findings, Conclusions And Recommendations
This chapter presents main conclusions and findings of the research together with the
researcher’s recommendations i.e. IT is key technology for the world today and and for
Pakistan as well. Pakistni Government now is fully supporting the use of IT in the
country but to more boost the use of IT, still there exist a need for Government to act
more quickely with newer plans and polices by overcoming existing barriers. Based upon
the literature review and the data analysis collected through survey, various
recommendations of this study are made in this chapter for improvement of IT utilization
for Pakistan banking and manufacturing sectors in particular and for other organizations
in general.
12
References
Agourram H. and Ingam John(2003), “National Culture and the Meaning of Information systems Success”, Business Strategies for Information Technology Management, IRM Press,USA. Pp 242-263.
Anadarajan, M. & Anakwe, U.P(2002), “IT acceptance in a less-developed country: A
motivational factor perspective,” International Journal of Information Management, 2002, pp. 47-65.
Attewell, P and Rule, J(1984), “Computing in Organizations: What we know and what we
don’t Know”, Communication of the ACM, 1184-1192. Bender, D(1986), “Financial impacts of information processing”, Journal of MIS, Vol 3,
no 2, pp 232-238. Bhatt, G.D(2000), “Exploring the relationship between information technology,
infrastructure and business process re-engineering”, Business Process Management Journal, Vol. 6, pp139-163.
Brynjolfsson, E(1993), “Information Technology and efficient Management of modern
enterprise”, Journal Of Organizational Computing, pp 41-51. Brynjolfsson, E(1993), “Productivity paradox of information technology”, Comm. ACM,
(12), pp66-67. Brynjolfsson, E and Hitt L.M(1996), “Paradox lost? Firm Level evidence on the return to
information systems”, Management Sciences, 42(4), pp24-36. Brynjolfsson, E and Hitt L.M(1998) “Beyond the productivity paradox”, Comm. ACM,
41(8):49-55. Chan Stephen L(2000), “Information Technology in Business process”, Business Process
Management Journal, Vol 6, no 3, pp. 224-237. Dadashzadeh Mohammad(2002), “Information Technology Management in Developing
Countries”, IRM Press, U.S.A, pp92,134, 206. Dasgupta S., Sarkis Joseph and Talluri Srinivas(1999), “Influence of information
technology investment on firm productivity: a cross sectional study”, Logistic Information Management, Vol. 12, pp. 120-129.
Davis, F.D(1993), “User Acceptance of Information Technology: System Characteristics,
User perceptions and behavioral Impacts, “ International Journal of Man-Machine Studies. Vol. 38. pp.475-487.

13
Dewan, S. and Kraemer, K.L(1998),”International dimensions of the productivity paradox”, Communication of the ACM, Vol. 41, no 8, August. Pp 55-62.
Dewett, T. & Jones, G(2001), “The Role of Information Technology in the Organization:
a Review, Model and Assessment,” Journal of Management: Managing in the Information Age, pp313-346.
Earl, M., Edwards B., & Feeny, D(1996), “Configuring the IS Function in Complex
Organizations, Information Management”, The Organizational Dimension edited by Earl, M., pp201-230, Oxford University Press, Great Clarendon Street, Oxford, NY.
Franklin, C.F.Jr(1997), “Emerging Technology: Enter the Extranet”, CIO Magazine, May 15, Available online: www.cio.com/archive/051597_et_content.html.
Gader, H(1996), “The Impact of user satisfaction on Computing-Mediated
Communications Acceptance: A Casual Path Model,” Information Resources Management Journal, Winter 1996, pp 17-26.
Greaves Jennifer(2005), “Effective IT with limited resources”, Central Banking XV(3),
Feb-2005, pp79-82. Gupta Uma G(2000), “Information Systems: Success in the 21st Century”, Prentice_hall
International U.S.A. pp. 17, 360-372. Harris, R. & Davison, R(1999), “Anxiety and Involvement: Cultural Dimensions of
Attitudes toward Computers in Developing Societies,” Journal of Global Information Management, PP.26-38.
Harris S.E and Katz, J.L(1988), “Profitability and Information Technology Capital
Intensity in the Insurance Industry”, in the proceeding of the twenty first Hawaii International Conference on System Sciences”, pp 124-138.
Hill Carole E. Straub Detmar W & Loch Karen D(2002), “Transfer of Information
Technology to the Arab World: A Test of Cultural Influence Modeling”, Published in Information Technology Management in Developing Countries, IRM Press, U.S.A. PP. 92-134.
Kelley, M. R(1994), “Productivity and information technology: The elusive connection”,
Management Sciences. 40(11), pp 1406-1425. Long Larry and Long Nancy(1999), “Computers”, Prentice Hall Inc. U.S.A. pp71. Loveman, G.W(1994), “An assessment of the productivity impact on information
technologies”, Research Studies, Minformation Technology Press, Cambridge, MA, pp 84-110.

14
Mahmood, M.A & Mann, G.J(1993), “Measuring the organizational impact of information technology investment: An exploratory study”, Journal of Management Information Systems. 10(1), pp97-122.
Mahmood, M.A & Mann, G.J(2000), “Special Issue: Impacts of information Technology
investment on organizational performance,” Journal of Management Information Systems pp.3-10.
Marshall Tom(2002), “E-Finance: An Ill tempered fight for supremacy”, Euromoney,
33(401), Sep-2002, pp138-139. Martin, E.W., Brown, C.V., DeHayes, D.V., Hoffer, J., Perkins, W.C(1999), “Managing
Information Technology: What Managers need to know”, Prentice-Hall, Upper Saddle River, NJ. Pp24.
Mehta Kamlesh T. & Shah Vivek(1998), “Workforce, Information Technology and
global unemployment”, Industrial Management & Data Systems, Vol 98, no. 5, pp. 226-231.
Morgen Witzel(1998), “Dictionary of Business and Management”. Thomson Learning
Inc. U.S.A. Morton, S.M(1998), “The Corporation of the 1990s: Information Technology and
Organizational Transformation”, Oxford University Press, Oxford. Morton, S.M(1988), “Information Technology and Corporate Strategy”, Planning
Review, Sept-Oct, pp 28-31. Michalak S.C, Julio C.F, and Clifford J. Drew(1999), “Decentralized Information
Technology requires Central Coordination”, Cause/Effect Journal, Vol. 22-4 pp. 1-7. Mitra, S and Brendt, E.R(1990), “Analyzing cost-effectiveness of organizations: the
impact of information technology spending”, Journal of Management Information Systems. Vol 13, no 2, pp 29-57.
Odedra, M. & Kluizer, S(1988), “Bibliography for Information Technology in
Developing Counties,” Information Technology for Development. pp. 297-356. O’Dell,Elliot, S.,C(1999), “Sharing knowledge and best pratices: the hows and whys of
tapping your organization’s hidden reservoirs of knowledge”, Health-care Forum Journal, Vol 42, pp. 34-37.
Olalla, Marta Fossas(2000), “IT in business process reengineering”, International
Advances in Economic research, Vol. 6, issue 3, pp581-590.

15
Parthasarthy, R and Sethi, S.P(1993), “Relating strategy and structure to flexible automation: A test of fit and performance implications”, Strategic management Journal, 14(7). Pp 529-549.
Reynolds George W(1995), “Information Systems for Managers”, 3rd edition, West
Publishing Company. U.S.A, pp. 2-23, 65-138,186-277. Roache, G(1987), “Investment in Information Technology and Firm Productivity”,
Academic management Journal, Vol 30, no 1, pp 51-70. Robbins Stephen P. & Coulter, Marry(2003), “Management”, 7th Edition, Prentice Hall,
Int. U.S.A. pp.79., 204,301 Rumizen, M(1998), “Site Visit: how Buckman Laboratories’ shared knowledge sparked a
chain reaction”, Journal of Quality & Participation, Vol 21, pp34-38. Savoie, M.J & Raisinghani, M, S(1999), “Identifying Future Trends in Information
Technology”, Industrial Management & Data Systems, Vol 99, no 6, pp. 247-250. Schmidt, J.B, Montoya-Weiss, M.M. and Massey, A.P(2001), “New product development
decision-making effectiveness: Comparing individuals, face-to-face teams, and Virtual teams”, Decision Sciences, 32(4), pp 575-600.
Venkatesh, V., & Davis F.D(2000), “A theoretical extension of the Technology
Acceptance Model,” Journal of Management Sciences Vol. 2, pp. 186-204. Winter, S and Taylor, S(!996), “The role of IT in the transformation of work: a
comparison of post industrial, industrial, and proto-industrial organization”, Information Systems Research, 7, 1, pp5-21.
William, B.K & Sawyar, S.C(2005), “Using Information Technology”, 6th edition,
McGra- Hill Publishing Co. U.S.A, pp 3-4,147, 446-457. Zee, Han, V.D(2002), “Measuring the value of Information Technology”, IRM press,
U.S.A, pp 7, 47-48,64,67-70,82,86

16
Chapter
Information Technology: Concept, developments and Impact on organizational management
Introduction
2.01. This chapter deals with the definition, development and management impact of IT.
It presents a number of views relating to Information Technology together with a
discussion that how IT is developed over time and what is its present state?. IT is playing
an important role in the society and in organizations; therefore, it has profound effects on
the performance of the managers and overall organizations. Information Technology has
transformed the nature of international business and it is one of the largest and fastest
growing industrial sectors for the coming century. Electronic commerce, electronic data
interchange, electronic government and development in telecommunication are main
forces in IT revolution. All the national governments have shifted their strategies with the
aim of bringing the benefits of IT to every segment of the economy, government, and
public life. There is no sector, manufacturing, service, trade or government activity where
IT can not be applied. It gives many advantages and benefits in term of productivity,
safety, efficiency, reliability as well as savings in cost and time.
The IT role in increasing organizational performance in all management functions with
different IT based information systems is also presented in this chapter. The conclusions
of the discussion are presented at the end. The chapter is divided into three sections:
Section 1 Defines IT and describes its development over the time. Discusses the impact
of IT on management and organizations’ performance. Section 2 Explains the four
management functions and how IT helps managers in performing these functions.
Section 3 Gives an overview of different IT based management systems, which are
available to the managers to perform their jobs in the organization.
2

17
Section 1
Information Technology and its Development
Defining Information Technology
2.1.1. Information Technology has been defined in various ways by different authors.
Over the years, IT has been conceptualized and measured differently by different
researchers. The majority of the authors, however, parallel Information Technology with
computer systems. Whisler (1970), for instance, defines IT as “The computer based
technology of sensing, coding, transmitting, translating and transforming information”.
Robey (1977) describes IT as “The installation of computer based information systems”.
Cash et al.(1983) wider IT scope and define Information Technology as “The integration
of, data processing, telecommunications and office automation”.
Buchanan and Boddy (1983) define IT as “All technology dealing with computer aided
manufacturing and computer aided administration”. According to Reynold (1997) “IT is
any computer based system used in transferring of information from one person to
another person or group of persons who requires that information for diversified
activities”. Mehta and Shah (1998) define IT as “Information Technology is a
combination of technologies as computer networks, imaging technology, massive data
storage and artificial intelligence”. Long and Long (1999) have tried to link all above
definitions and give definition of IT in this way that “IT is a collective reference to the
integration of computing technology and information processing. Any form of computer
based system that has the capability of collecting, processing, and outputting information
is called Information Technology”.
According to another definition “IT means the use of hardware, software services and
supporting infrastructure for management of delivering information. IT is using the
hardware and software used to store, retrieve, process and transmit data.”(Laudon and
Laudon, 1998).
18
According to Frenzel (1999) “Information Technology is the term that describes the
organization’s computing and communications, infrastructure, including computer
systems, telecommunication networks, and multimedia (combined audio, text, and video)
hardware and software”. Gupta (2000) narrates that “IT includes hardware, software,
databases, networks, and other related components which are used to build information
systems” Kendall & Kendall (2000) also comes up with the same idea and say that “IT is
the technology that supports activities involving the creations, storage, manipulation and
communication of information together with their related methods and management
applications”.
Chan (2000) gives another definition of IT that “IT is the convergence of computing,
telecommunication and imaging technologies”. He further says that “Information
Technology has arisen as a separate technology by the convergence of computing,
telecommunications and video techniques. Computing provides the capability for
processing and storing information, telecommunication providing the vehicle for
communicating it and video providing high quality display of images.”
William and Sawyar (2005) define IT as a general term that describes any technology that
help to produce, manipulate, process, store, communicate, and/or disseminate
information. This definition may be regarded as the comprehensive definition, as it
covers all aspects discussed by different researchers above and includes all the
components and processes needed to carry out information processing work in the
organization.
It can be summarized from above definitions that IT concept came from a merging of
computer with telecommunications technologies. Many researchers have defined
Information Technology as a term that encompasses all forms of technology utilized to
create, capture, manipulate, communicate, exchange, present, and use information in its
various forms(business data, voice conversation, still image, motion pictures, multimedia
presentation, an other forms, including those yet not conceived (Poku & Vlosky, 2002).
Some authors like King and Teo (1996) and Stump and Sriram (1997) also include

19
personnel and resources dedicated to supporting these capabilities. It has been noted from
the above discussions that there are two important parts of IT i.e. computers and
communications which are further segregated into five basic components i.e computers,
communications technology(including networks), workstations, robotics and computer
chips(storage) (Morton,1988). Thus as a whole it can be said that when computer and
communications technologies are combined, the result is Information Technology or
‘infotech’.
Information System Management is another term, which is used synonymously for
Information Technology and these two terms have become so linked to each other that
they are often used interchangeably(Shelly et. al, 2005). Oliner and Sichal (2000) also
argued that the terms ‘Information System’ and ‘Information Technology’ have become
so interrelated that they are often used in substitute to each other.
In nutshell it can be said that IT is a convenient term which includs both telephony and
computer technology in same ways. IT has become the generally accepted term that
encompasses the rapidly expanding range of equipment (Computers, data, storage
devices, network and communications devices).
2.1.2 Information Technology Developments.
Historical Developments
2.1.2.1. The Information Technology is not new. The history of computers began about
2000 years ago, following the birth of the abacus, a wooden rack holding two horizontal
wires with beads strung on them. When these beads were moved around, according to
programming rules memorized by the user and all regular arithmetic problems were done.
Another important invention around the same time was the Astrolabe, used for
navigation. Blaise Pascal is usually credited with building the first digital computer in
1624 which added numbers entered with dials. In 1671, Gottfried Wilhelm Von Leibniz
started assembling a computer which was completed in 1694. It could add, and, after
changing some gadget around, multiply. Leinbniz invented a special stepped gear

20
mechanism for introducing the addend digit, and this still being used. Thomas of Colmar
created the first successful mechanical calculator that could add, subtract, multiply and
divide. By 1890, a range of improved desktop calculators were available (Mayer, 2001;
Shelly et. al, 2004).
Electronic information processing has, therefore, been evolved through several
identifiable phases. Beekman(1999) while discussing about the development history of IT
says that while the computer has been with us for only half a century, its roots go back to
a time long before Charles Babbage conceived of the Analytical Engine in 1823, which
served as a blueprint for the first real programmable computer a century later. Virtually
every computer in use today follows the basic plan laid out by Babbage but with more
modest goals. Between 1850 and 1900 great advances were made in mathematical
physics, and it came to be known that most observable dynamic phenomena can be
identified by different equations. A step towards automated computing was the
development of punch cards, which were first successfully used with computers in 1890
by Herman Hollerith and James Powers, who worked for the US Census Bureau. The
start of World War II produced a large need for computer capacity, especially for the
military. In 1939 a young German engineer named Konard Zuse finalized the first
programmable general-purpose computer but military establishment didn’t welcome him.
In 1943 a British mathematician Alan Turing and others, designed “Colossus”,
considered by many to be the first electronic digital computers. John Atanasoff, of U.S,
invented first high speed electronic digital computer , the Atanasoff Berry Computer
(ABC) in 1939, providing the foundation for advances in electronic digital computer. The
first general purpose commercial computer ENIAC(Electrical Numerical Integrator And
Computer) was invented in 1942 by Eckert and Mauchly and was used from 1946-1955.
This group of computer included EDVAC and UNIVAC(Universal Automatic
Computer)-the first commercially available computer. Until that time computer had been
found in labs for scientific and defense work. Computer hardware evolved rapidly from
those early days, with new technologies replacing old every few years(Beekman, 1999;
Shelly et. al. 2004).
21
Historian & Researchers have marked the development of IT in four generations. Laudon
& Laudon(1998) narrate that in the computer history the beginning years to the year
1950, is called the first generation of computers, which were based upon vacuum tube
technology. These were very big in size, expensive and finicky and were affordable only
by large corporations. The period from 1951 to 1960 is the period of second-generation
computers, which were based upon transistors technology. These computers were
radically smaller, more reliable, and less expensive than tube based computers. Mid 1960
to 1969 is the era of third generation computers, which were based upon silicon chip.
These were smaller in size than second-generation computers but less expensive, more
reliable, more accurate and had high speed. Microprocessors based computers (a
complete computer housed on a tiny silicon chip) in 1969 replaced these third generation
computers.
The invention of microprocessor marked the beginning of fourth generation of computer
and for all practical purposes, the end of an era when it made sense to count computer
generation. The microprocessor revolution didn’t just increase the number of computers
in office but it also opened up entirely new possibilities for computer inhabitants.
Each generation of computer has dramatically expanded computer processing power and
storage capabilities while simultaneously lowering costs. Rynolds (1995) points out that
the cost of performing 100,000 calculations plunged from several dollars in the 1950s to
less than $0.025 in the 1980s and approximately $.00004 in 1995. These generational
changes in computer hardware have been accompanied by generation changes in
computer software that have made computers increasingly more powerful, inexpensive,
and easy to use. Over the last 30 years, computing costs have been dropped by a factor of
10 each decade and capacity has increased by a factor of at least 100 each decade.
Today’s microprocessors can put a mainframe on a desktop, and eventually into a
briefcase or shirt pocket (Laudon & Laudon, 2005). It is possible to distinguish
historically three phases in the development of commercial computer systems, roughly
correlated with the declining cost of computer hardware and the development of data
communications. Phase one dates from the beginning of modern data processing in early

22
1960s. It involves centralized computing: an expensive main frame housed in a data
center. Phase two, dating from the early 1970s is decentralized computing: the data center
is augmented by minicomputers in departments and subsidiaries connected to the
mainframe by telecommunications lines. Phase three is distributed cooperative computing
where computers of various sizes are linked by a network and cooperate to process a
company’s data. Cooperative processing is the basis of the computer-integrated company
(Cane, 1992).
Figure 2.1 shows graphically how computer-processing power has grown, particularly
during the last two decades of the 20th century. More importantly, this growth will not
come to an end when “Moore’s Law”1 on integrated circuit growth runs its course in
2020 ( when silicon based chip technology will have reached its operational limits).
Figure 2.1 The Exponential growth of computing 1900-2100
Source: Kurzweil (1999) pp104
1 In 1965 Gordon Moore, the Chairman of Intel, predicted in jest that the power of a silicon chip of the same price would double about every eighteen months and will continue to hold for another two decades. So far Moore’s prediction has been uncannily accurate. (Beekman & George, 1996). pp7. Gilders law predicts that doubling of communication power every 6 months due to the advances in fiber optic technology. Varian(2001).

23
Recent Developments
2.1.2.2. Information Technology is the outgrowth of the microelectronics revolution and
is one of the advanced and fast growing technology of the world. The modern data
processing business dates from about 1963 when International Business Machine (IBM),
already a leader in mainframe computer systems, introduced system/360, a family of
machines that was broadly compatible and which had the facility to use the same
operating software. The computer became more central to business operations with the
evolution of the minicomputer in the early 1970s. The microprocessor’s invention caused
immediate and radical changes in the appearance, capability, and availability of
computer(Cane, 1992; Shelly et. al, 2004).
The microcomputer revolution began in the mid 1970s when companies like Apple,
Tandy, and Commodore introduced low cost, typewriter sized computers as powerful as
many of the room-sized computers that had come before. Major developments in the
1970s included microcomputers, interactive display devices, price tags on different items,
user friendly software and improvements in data base technology. Personal computers, or
PC, as microcomputers have come to be known, are now commons in offices, factories,
home, schools, and just about everywhere. IBM released the very first PC in 1981 and
then there is a great boom by different companies. The 1950s and 1960s represented an
ear of institutional computing, 1960 to 1995 was a personal computing era but now it is
interpersonal computing era and computerization is found everywhere. Today’s world is
familiar with the variety of computers, each particularly well suited to specific tasks and
are classified as super computer, main frames, minicomputer(mid range servers) and
micro computers but revenues from personal computers are greater than those from every
other kind of computer systems (Frenzel, 1999).
The term electronic data processing (EDP) was frequently used to describe business
computing environments of the 1990s. As computers became more common, the
“electronic” and “automated” adjectives were looked upon as redundant, and the term
data processing (DP) evolved to describe both types of applications. The development
and refinement of operating systems (the programs that manage and control the

24
operations of computer equipment) enabled computers to run with less manual
intervention. Also entering jobs from terminals at remote sites became commonplace. In
general, people began to accept computers and to rely on the outputs that they produced.
Each of these development-and others-contributed to the rise of the so-called
management information system(MIS). During the 1960s and 1970s, this term was used
in a very limited way to apply to the set of programs that generated periodic printed
reports(Oldach et.al, 1993). The Figure 2.2 shows the development history of computers
over time.
Spilling and Lundh (2004) observed that the concept of computer networking started in
the early 1960s. The invention of timesharing in the 1960s allowed multiple users to
connect to a single computer through LAN (Local area network), WAN (Wide area
network) etc., to share common resources and information. A few visionary computer
scientists and engineers, with financial backing from the U.S. government, built an
experimental network called ARPANET2 in 1960. This groundbreaking network would
become the INTERNET—the global collection of networks that is radically transforming
the way the world uses computers (Spilling & Lundh, 2004).
The development in Internet technology continued and in 1990s Internet software took
giant leaps forward in usability. The biggest changes came with the development of the
World Wide Web (WWW)3 in 1991 by Tim Berners-Lee, a vast tract of the Internet
accessible to just about anyone who could point to buttons on a computer screen (Shelly
et. al, 2004). The Web4, as it often called, led the Internet’s transformation from a text-
only environment into multimedia landscape incorporating pictures, animation, sound,
and even video. Millions of peoples connected to the Web each day through Web
browser -easy to use software programs that, in effect, serve as a portal into the Web’s
information space. The Internet today is not just for scholars and scientists, it is used by
mom and pop business and multinational corporations who want communication with
2 Advanced Research Project Agency Net Work. Of U.S. Defense department(Spilling & Lundh, 2004). 3 The World Wide Web is made up of millions of interlinked documents called Web pages. Some Web pages are stand-alone; others are grouped in related collections called Web sites. Some Web sites are commercial enterprises; others are educational; still others are just for fun(Laudon and Laudon, 2004). 4 The first net browser called MOSAIC was launched in 1993(Shelly et. al, 2004).

25
their stakeholders (Gasos and Thoben, 2003). The Internet has become so pervasive that
now many organizations are rebuilding their entire information-processing systems
around Internet technology by replacing their old mainframe and PC-based systems.
Vinton Cerf, who is commonly regarded as the father of Internet says that “it is very clear
that the Internet now is playing an important role in the growth of business” (Savoie and
Raisinghani,1999). Indeed the world is on the verge of creating a whole new generation
of personal digital assistant-PDAs, smart cards and others-that will make use of digital
information pervasive primarily due to the improvement in Internet technologies that are
giving us worldwide connectivity (Varian, 2002). The proliferation of computers and
networks today is transforming the world rapidly and irreversibly.
E-Commerce(EC)5 now is replacing the traditional commerce(Segars and Grover, 1995).
Savoie and Raisinghani(1999) comment that the widespread use of the Internet and
related technologies is dramatically reducing transaction costs, leading to a growth in e-
Commerce and productivity and increases in profits.
It can be concluded from all above discussions that over the past four decades, both the
variety and diversity of information systems technology and also its uses have been
changed accordingly. From 1950s to mid-1960s (The first and second generation of
computer hardware and software technologies) the computer was used primarily for data
processing. In 1970s computer technologies evolved into third and fourth generations and
use shifted to management information systems. With the arrival of microprocessor and
network technologies in 1980s, the information systems expanded beyond the earlier
parameters to integrate with an organization’s information-service functions, systems and
technologies to enhance office automation, which includes word processing, e-mail,
facsimile, desktop publishing and other computer and communication based
technologies.
5 E-Commerce is a generic term for application of IT. It is a commercial activity that takes place by means of connected computers. It is buying and selling of the goods and services on the internet, especially World Wide Web. It is Online shopping via Internet or doing online transactions on internet. Source (www.whatis.com/ E-commerce. htm, e-commerce Premier, http/devshed.com) & Ray & Achariya(2004).

26
Figure 2.2: Development history of IT over years: Source Beekman (1999). pp16

27
The integration of these systems and technologies within a single office setting is now
commonly called an office information systems(OIS). From the 1990s, IT is playing a
vital role in the achievement of a wide range of business objectives. IT has become
increasingly pervasive in society now. It has spread to the point that nearly everyone uses
some form of IT every day. It has become common in schools, libraries, homes, offices,
and shops.
The Internet and the World Wide Web have particularly contributed a lot to the rapid
expansion of IT. Thomas Wantson, Sr., the founding father of IBM, delivered in 1953
that the world wouldn’t need more than five computers to work all around and now it is
reality that it’s an era of technology revolution. Bill Gate’s of Microsoft (1999) prediction
that “this century would be full of cataclysmic technological changes, particularly in the
area of information and communication and business is going to change more in the next
ten years than it has in the last fifty years”, is becoming true.
IT is the technology of the present and of future too. There is a flow of digital
information. The standard hardware combined with a standard software platform have
created economies of scale that make powerful computing solutions available at
affordable prices to companies of all sizes now. The growth in IT is still continued and it
is perceived that it would take new shape in the future to come.

28
Section 2
Organizational Performance
Definign Organizational Performance
2.2.1. Management as defined by Robbin and Coulter(2003), is the process of getting
activities completed efficiently and effectively with and through other peoples. The
process represents the functions or primary activities engaged in by manager. These
functions are typically labeled planning, organizing, leading, and controlling. Each
organization has certain objectives and main objective of every organization is to earn
profits by increasing performance. According to Gilgeous and Gilgeous(2001), the main
business objectives can be achieved through the use of range of different “initiatives”.
They define initiatives as company programs that directly support the achievement of the
main objective of getting high performance. According to them these initiative are 1)
Innovation and change 2) Empowerment 3) Customer focus and commitment 4)
Commitment to quality 5) Win-win relationship with suppliers 6) The learning
organization 7) Re-engineering and 8) Technology & information systems. Gilgeous &
Gilgeous(2001) stress that last of the above mentioned initiatives i.e Information
Technology, contributes a lot for use of other initiatives for achievement of main business
objectives. Almost all the managers at all levels, in all kinds of firms, and in all kinds of
industries are using IT now to improve their performance.
Sushil and Agrawal(2003) discuss that organizations are now composed of five major
components: IT, organizational structure & corporate culture, management & business
processes, organization’s strategy, individuals and roles. These components are in stable
condition, called equilibrium, as long as no significant changes occur in the environment
or in any of the components. However, as soon as a significant change occurs, the
systems become unstable and it is necessary to adjust some or all of the internal
components since all are inter-related. Unstable organizations may be unable to excel or
even survive, therefore, organizations need to respond by what it is called critical
response activities, which deal not only with long term strategies, but also with the basic

29
daily business activities. Now IT has become a major facilitator of business activities in
the world today to make organizations responsive and remain stable(Mandel et. al, 1994).
Assessment of organizational performance
2.2.2 The performance as stated by Wheelen and Hunger(2000) is an end result of an
activity and an organizational performance is accumulated end result of all the
organization’s work process and activities. Managers measure and control organization
performance because it leads to better asset management, to an increased ability to
provide customer value, to improve measures of organizational knowledge and measure
of organizational performance do have an impact on an organization’s reputation. When
the performance of the organization is assessed, the past management decisions that
shaped investments, operations and financing are measured to know weather all resources
were used effectively, weather the profitability of the business met or even exceeded
expectations, and weather financing choice were made prudently.The most frequently
used organizational performance measures include organization efficiency(productivity),
organizational effectiveness and industry ranking (Wetherbe et. al. 1999). The following
discussion gives a clear understanding of these measures.
Management Efficiency 2.2.2.1 According to Robbins & Coulter(2003) the word ‘Efficiency’ entered in the
management lexicon about a hundred years ago by Harrington Emerson, an engineer and
management consultant, who worked with the father of scientific management, Fredrick
Winslow Taylor. Actually, the ideas of two men were quite separate and distinct.
Taylor’s scientific management system was based on concept what is now called
technical efficiency: break work down into its separate component tasks, then re-engineer
each task to the optimum performance level. Emerson, who referred to his own set of
ideas as the ‘efficiency system’, saw efficiency as a natural rather than a mechanical
concept.
In the academic literature efficiency is defined by many ways, Witzel(1998) for example
looks at the origin of the term and finds that it has two meanings: technical efficiency or

30
ensuring that systems and process work to their optimal level, and total efficiency, or
ensuring that the organization as a whole is fit to meets its goals.
Edwards(2001) defines it that “Efficiency is minimum utilization of resources and getting
maximum output”. It is getting the least amount of input and getting high outputs bettered
to as doing things right. Aldag and Stearns(1987) define efficiency by cost point of view
that “Efficiency is the relationship between inputs and outputs, seeks to minimize
resource costs.” Druker(1982) defines efficiency as “It is doing job successfully without
wasting time or energy. Efficiency means compatibility between inputs and outputs. It is
saving time, money or efforts”
In economics, efficiency is also defined in a number of ways. The one which is
commercially used is referred as the “Pareto-Koopman’s” definition which is articulated
as “A Decision Making Unit (DMU)-firm, institution, hospital is efficient if and only if it
is not possible to improve some of its inputs or outputs without worsening of some of its
other inputs or outputs”. A Decision Making Unit is technical efficient if it “either
maximizes output for a given amount of input Or minimizes input to achieve a given
level of output”(Anderson, 1986). Modern Economists define it, as “Efficiencies require
that any given output is produce at minimal cost, which means that both waste and
technological inefficiencies are avoided and that appropriate input is used to find the cost
minimizing production process”. In other words efficiency of a production unit means a
comparison between the observed and the optimal values of its outputs and inputs.
Daft(1999) argues that the term productivity is commonly used as a synonym for
efficiency. However, productivity specifically refers to the efficiency of human
resources. Productivity improves when fewer workers are required to produce same
amount of output, or, alternately, when the same number of workers produces a large
number output.
So to conclude, it can be said that since managers deal with input resources that are scare-
mainly peoples, money, and equipment-they are concerned with the efficient use of these

31
resources. Management therefore is concerned with minimizing resources costs.
Management efficiency, therefore, is the degree to which organizational resources
contribute to productivity. The proportion of total organizational resources used during
the production process measures the efficiency. Higher this proportion is the more
efficient is the management.
Types Of Efficiency
2.2.2.2. There are many types of efficiency and many methods to measure it. Before
outlining the different methods to measure efficiency, it is necessary to first look at the
number of types of efficiency and the way they relates to each other. Terms used to
measure the efficiency are cost efficiency and X-efficiency. These are concisely described
as under: Cost efficiency means that a firm minimizes its expenditures given the services
it provides without reducing the service quality. X efficiency can also be termed as over
all efficiency(Nunamaker, 1985).
Overall efficiency means that the cost of producing observed output of both technical and
allocative efficiencies are assumed relative to observed cost (Forsand, and Sarafoglou,
1998). They used the term overall efficiency for all technical and allocative efficiencies
of individual firms distinguishing from scale and scope efficiencies. It can further be
decomposed into technical efficiency and allocative efficiency. Allocative efficiency
measurement is the extent to which inputs choices of a firm fail to satisfy the marginal
equivalences for cost minimization.
The technical efficiency as defined by Nunamaker(1985) that “a firm is technical efficient
if it can produce existing level of output with at least one less unit of input, or with
existing inputs it can produce at least one more output”. Technical efficiency can further
decomposed into scale efficiency and pure technical efficiency. Scale efficiency is
defined relatively to the form of the locus of technical efficiency production plans. It is
investigated by analysis of the shape of the frontier. Pure technical efficiency can be
obtained by dividing the technical efficiency by scale efficiency. Pure technical
efficiency is composed of congestion efficiency and other effects.

32
The congestion efficiency is the measure of the component of pure technical efficiency
due to the existence of negative marginal returns to input and inability of a firm to
dispose of unwanted input costlessly. The following diagram sets out the progression of
efficiency measures outlined above.
Figure 2.3
A road map of efficiency decomposition
Economic/cost/overall Efficiency
Allocative efficiency Technical efficiency
Scale efficiency Non scale or Pure technical efficiency
Non congestion efficiency Congestion efficiency
Measuring Efficiency
2.2.2.3 Efficiency can be measured by many ways. The organizational efficiency is a
measure of the "productivity" of the aid intervention process, i.e. to what degree the
outputs achieved derive from efficient use of financial, human and material resources. In
principle, then, it means comparing outputs against inputs. It takes the limited operational
perspective of the key implementing institutions. Broadly speaking, assessment of
organizational efficiency can be drawn from two types of data i.e. 1) Performance
indicators, which measure specific factors thought to provide a partial reflection of
underlying efficiency 2) Comprehensive measures, designed to provide an indication of
overall organizational efficiency(Tofallis, 1999). In a project, efficiency will be measured
as an aggregate of the efficiency associated with individual outputs. In larger evaluations
at sector or country level the efficiency will have to be expressed as an aggregate of the
efficiency associated with all the aid interventions involved. This study measures the

33
efficiency of the organization by applying both of the above types of data by applying
financial and statistical techniques.
Management Effectiveness
2.2.2.4 Many authors have defined effectiveness in many ways. McClenahen (2000) says
that “Effectiveness means how well the job gets done”. He also defines effectiveness in
an other way that “It is extent to which an organization realizes its goal”. Oz (2002)
defines effectiveness, as “It is the degree to which a goal is achieved”.
According to Robbins and Coulter(2002) “Effectiveness is “doing the right things” to
achieve organization goal. Laurindo and Shimizu(2000) narrate that “effectiveness is a
measure of the extent to which the formally agreed objectives have been achieved, or can
be expected to be achieved. It takes the perspective of the users or those formally
designated as the beneficiaries of the aid interventions: the target group”.
To conclude it can be said that effectiveness can be understood as the ability to “do the
right things” to achieve the organization objectives.
Approaches For Assessing Organizational Effectiveness.
2.2.2.5. As compare to assessment of efficiency, it is difficult to assess the organizations’
effectiveness. Yuchtman and Seashore(1967) in an early study narrated that comparing
intended goal performance with actual goal performance is perhaps the most common
method to assess the organization effectiveness. Other ways to evaluate organizational
effectiveness as narrated by Aldag & Stearns(1997) and Robbin & Coulter(2004) include
examining an organization’s ability to acquire the resources it needs, operate in a smooth
and efficient manner, optimize goals, and satisfy external constituencies who have an
interest in the organization. Each of these approaches is discussed below separately.

34
System Resource Assessment.
2.2.2.5.1. The systems resource assessment of organizational effectiveness is an
approach, which examines the performance of the organization in acquiring the resources
it needs. Measures and evaluations of effectiveness in this approach come from assessing
the organization’s ability to obtain necessary inputs for transformation into a product or
service. An inability to acquire necessary inputs will constrain or curtail organizational
activities. This approach includes two important assessments: 1) the amount of resources
acquired from the external environment, and 2) the bargaining position the organization
has with resource providers in the external environment. The first assessment directs
managers to goals that will increase resource acquisition and the second assessment
directs manager attention to goals that will optimize the bargaining position with
suppliers.
Internal Process Assessment.
2.2.2.5.2 The internal process assessment of organizational effectiveness focuses on
goals related to productivity and member development. The organization is evaluated in
term of production efficiency, integration of departmental activities, satisfaction of
members, and level of conflict within the organization. In other words effective
organization from an internal process assessment is one that operates smoothly and
efficiently without cost disruptions. Internal process assessment is concerned with both
production efficiency goals and member goals. Thus manager make decisions concerning
the tradeoffs between competing goals in order to maximize effectiveness.
Goal Assessment.
2.2.2.5.3 Goal assessment focuses on the outputs of the organization. Outputs are the
products or services that the organization produces to distribute to consumers in the
environment. Output goals are usually described in terms of sales growth, market share,
volume, revenues, or profits. Effectiveness is achieved when the organization has attained
the desired level or target of the output goal. Many organizations evaluate their
effectiveness of output by comparing current goal achievement with goal achievement
from a prior period or by comparing goal achievement to that of organization with which
they compete.
35
Strategic Constituency Assessment
2.2.2.5.4 A strategic constituency assessment of organizational effectiveness places less
emphasis on the inputs, the outputs, and the internal processes of organization and
more emphasis on groups that have a stake in the organization. A strategic constituency is
any group internal or external to the organization that has more than a passing interest in
how the organization performs. Stockholders, owners, creditors, suppliers, employees,
communities, and customers can all be considered to be strategic constituencies of an
organization. In this respect, effectiveness is determined by the degree to which the
organization satisfies the expectations and demands of all these groups.
A strategic constituency assessment of organizational effectiveness is usually more
difficult to make the assessment using the system resource, internal processes, and goal
assessment approaches. As each groups can very widely in their expectations and
demands on the organization. Often the demands and expectations of these groups are
inconsistent and contradictory, which reduces an organization’s ability to be effective.
Comparison Of Approaches Of Assessing Effectiveness.
2.2.2.6 Stress(1986) outlined a detailed comparison of all the above approaches of
measuring effectiveness. He says that managers are usually interested in assessing
organizational effectiveness by all four approaches. At times, managers may focus on one
type of assessment, depending on circumstances. For instance, when inputs are difficult
to obtain due to a lean resource environment, managers may emphasize systems resource
assessment. A drop in production efficiencies may direct managers to an assessment of
internal processes. Decline sales would require an assessment of output goals. A
lessening of satisfaction among stockholders and communities would encourage an
evaluation of strategic constituencies. Regardless, organization managers must recognize
that the four different assessments of organizational effectiveness are interrelated.
Adjustments of goals in one approach may require adjustments in other approaches to
effectiveness. Although each of this approach may have merit in measuring certain
aspects of organizational effectiveness, the bottom line for managers continues to be how
well the organization accomplishes its goals. That’s what guides managerial decisions in
36
designing strategies, work processes, and work activities, an in coordinating the work of
employees.
Relation Between Efficiency And Effectiveness
2.2.2.7 Walrad & Moss(1993) state that efficiency and effectiveness do not means the
same thing. In fact, they are often natural enemies. Often one can have one, or the other,
but not both (Unless one is lucky or one want to spend a lot of money). Being efficient
means that one spends less time on something, one spends less money on something or
one spends less efforts (or number of workers) on something. Being effective means that
one does his job well. In other words, the output (finished product) is of high quality. It is
a rare and delightful occasion where a solution to a problem is both efficient and
effectiveness; one usually has to decide which he prefers, because one usually cannot
have both. Efficiency and effectiveness can be entirely unrelated, so as their
measurement.
Oz(2005) says that one may assume that organizational effectiveness can be determined
by comparing the actual performance with the intended performance for each goals and
totaling the results. However this would not provide a manager with an accurate picture
of overall effectiveness. For instance, the organization may achieve the goal of increased
market share, product innovation, product quality, consumer satisfaction, and social
responsibility. Yet, the organization may fail miserably at achieving the goals of
profitability, forcing the organization into bankruptcy. As the organizational goals are not
necessarily equal in importance and their importance can fluctuate over time. In addition,
a measure of organizational effectiveness must incorporate factors both inside and
outside the organization. If the organization were to achieve the goal of high profits at the
expense of consumer satisfaction, managers of other organizations might conclude that
the organization is ineffective and decide to enter the industry. Thus, the diversity and
inequality of organizational goals make measurement of effectiveness a highly complex
problem.
37
Seddon et. al(2003) say that efficiency is less problematic for managers to assess in most
organization. Organization efficiency as defined in above discussions is the ratio of an
organization’s outputs to its inputs. Inputs consist of raw material, labor, and capital.
Outputs consist of products or services. When compared to similar organizations, an
organization is considered more efficient when fewer inputs are used to achieve an
equivalent number of outputs. Thus, efficiency is an internal measure of organization
performance which focuses on how the organization achieves its goals rather than
whether the organization achieve its goal.
To sum it up it can be said that generally measures of efficiency are related to
organizational effectiveness, as reduced costs in production can enhance the survival of
the organization. For example, in a road project, effectiveness could be measured in terms
of traffic flow, or transport of different commodities and the users of the road. In a sector
programme to support agriculture, effectiveness could be measured in terms of the scope
of productive investments made by the farmers involved, development of human
resources through training and institutional development in the sector. In an IT context
effectiveness, is the measurement of the capacity of the outputs of information systems or
of an IT application to fulfill the requirements of the company and to achieve its goals,
making this company more competitive. Whereas, in the same road project efficiency is
measured in terms of the construction of the road (the physical output); based on its
quality, cost and the timeliness of construction. In an IT project it could be measured that
how cheaply can you get things done, and are the people to whom you provide IT
services (the stakeholders) happy with the levels of service being delivered? and does it
reduced the operational expenses?. This study measured both efficency and effectiveness
of the organization and all this is refered to, in all the ensuing discussions as an
organizational performance. In all following discussions word ‘performance’ represents
both efficiency and effectiveness.

38
Section 3
Information Technology and Organizational Performance
IT impact on Management Perfromance: AN Overview
2.3.1. Various studies have been undertaken to observe the important role IT plays in
business organizations. The researchers have been studying IT impact on management
performance since long. For example in an early empirical study, Boddy and Buchanan
and Boddy(1983) found that IT produces significant productivity gains at the operational
level. IT is a variable that can enhance the timeliness and quality of organizational
intelligence and decision-making promoting organizational performance (Huber, 1990).
Parthasarthy and Sethi(1993) found that flexible manufacturing technology has
significant impact upon a firms’ cost and quality performance. Later, Kelley (1994)
verified that IT is positively related to production efficiency and productivity. Few of the
other studies which confirm IT’s positive influence upon aspects of corporate financial
performance, such as return on investment are the studies conducted by Mahmood and
Mann(1993) and Byrd and Marshall(1997) etc. Earls(1996) also notes that the efficient
performance of an organization is dependant very much on the internal performance of
the organization resources and IT plays an important role for right utilization of these
resources.
Rumizen(1998) confirms that the IT applications help workers to produce more in less
time. The closer the result of an effort is to the ultimate goal, the more effective are the
effort. The fewer the resources spread on achieving a goal, the more efficient the effort
and IT does this job. Rumizen(1998) also argues that IT is used to speed communications
between trading partners, shorten product life cycle, establishing better relationships with
customers, suppliers and partners and to reduces expenditures.
Oz(2005) in his recent research found that IT contribute both to the effectiveness and
efficiency of business, especially when positioned in specific business functions, such as
accounting, finance, production and engineering. When IT is used it helps companies
achieve their goals more quickly by facilitating collaborative products and services
accessible, they can make innovative products and services accessible such as Web-based

39
customer service available 24 hours per day, 365 days per year. IT can shorten routine
processes, such as issuing purchase orders; and it can improve an organization’s strategic
position, such as maintaining a Web site for selling products directly to consumers before
the competitor does.
According to Laudon and Laudon(2005), from an economic standpoint, IT can be viewed
as a factor of production that can be freely substituted for capital and labor. As the cost of
IT falls, it is substituted for labor, which historically has been raising cost. IT, especially
the use of networks, can help firms lower the cost of market participation (Transaction
costs), making it worthwhile for firms to contract with external suppliers instead of using
internal sources. It is remarkable contribution of IT as according to transaction cost
theory6, firms and individuals seek to economize on transaction costs, much as they do on
production costs. Traditionally, firms have made efferts to reduce transaction costs by
getting bigger, hiring more employees, or buying their own suppliers and distributors, but
now IT is helping the firms contract in size through networks and reduce transaction
costs. IT also can reduce internal management costs(Agency Cost) by reducing the costs
of acquiring and analyzing information, because it becomes easier for managers to
oversee a greater number of employees (Laudon & Laudon, 2005).
The IT as being a modern management tool helps the manager now in various ways to
efficiently deploying the organization resources and to become more efficient. Dewett
and Jones(2001) demonstrates that though IT has revolutionized the working of
organizations over the past half-century, but its impact on increasing organization
efficiency for the last decade are tremendous. The availability and use of information
systems and technologies have grown enormously over the last decade.
A large number of researchers have also highlighted various other vibrant reasons of
introducing IT in organizations. Anderson(1986), for example, outlined that IT is used
into an organization a) to save time and money b) to improve information handling and
6 Economic theory stating that firms grows larger because they can conduct marketplace transactions internally more cheaply than they can with external firms in the market place.

40
provision c) to increase revenue d) to improve the competitive position of the business e)
to expand the business by enabling easy interaction between business units at different
geographical locations. Oldach et. al(1993) argue that IT has become the generally
accepted term that encompasses the rapidly expanding range of equipment (computers,
data storage devices, network and communications devices), application, and services
(e.g., end-user computing, help desk, application development) used by organizations to
deliver data, information, and knowledge. IT provides strategic value to all parts of the
business. Support of the administrative infrastructure (responsibilities and authority
structure of the enterprise), key business processes (how important business functions
operate or flow), and operational skills (day to day support of staff) represent three
significant areas where IT is used to reduce costs, enhance product and service quality,
improve customer service, integrate supplier and customer operations, and enable
organizational learning(Oldach at al, 1993).
Moreton and Chester(1997) note that the efficiency through IT can be achieved because it
can enable information sharing, support business processes and transactions and link
customer’s information. By applying IT, the organizations can have closer links with
suppliers, customers and other business partners and IT can also have strong influence on
the bargaining relations between buyers and sellers.
Ives and Jarvenpaa(1999) emphasize that global information sharing through IT has
increased firm’s efficiency. IT assisted many companies in meeting the need to convert
from an international organization into a global organization. With the rapid development
in broadband communication technologies, global virtual teams are now increasing in
popularity and are considered the most effective decision-making mechanisms in new
product development process, conduct joint research and development, plot new business
strategies, and do any work traditionally required face-to-face meetings, thus it is
facilitating firms’ globalization activities.
Olalla and Fassas(2000) indicate some more reasons for IT introduction in organizations,
these are 1) cost savings and improving the accuracy of exchanging information 2)

41
avoiding human mistakes inherent when complex repetitive tasks are used 3) saving
money by reducing time and errors 4) integration of several functions 5) improving
organization’s efficiency and effectiveness by eliminating delay, administrative
intermediaries and redundant processing steps and by providing better access and
information. According to Dewett and Jones(2001), IT is being deployed in the firms
because 1) it makes links and enabling employees through electronic communications.
Through IT, employees can interact with each other and it has promoted horizontal
communication, which results in increased alienation of employees and increasing their
efficiency. 2) it also increases boundary spanning. An individual can access desired
information in any part of the organization with the aid of IT. This eliminates the need for
the repetition of information and thus promotes non-redundancy. Corporate databases
attached to telecommunications networks allow employees around the world to access
data on customers, products, and services. 3) manager can communicate with employees
and each other more easily. The teamwork and group collaboration is also made easier.
Information can also be stored, retrieved and communicated far more easily and
effectively through IT.
Dewett and Jones (2001) further say that IT not only has provided operational benefits to
the managers but it has also greatly facilitated organizational memory which is subject to
erosion and error. Organizational information is easier to store, retrieve, communicate,
codify and assimilate with IT. Expert systems are good examples of IT systems that
memorize facts. Also, the amount of information that is available to the organization is
increased significantly by the use of IT particularly the Internet. Greengard(1998) also
asserts that the developments in the information and communication technology sector
have now made it easier and cheaper to store, reuse and share valuable information than
have to reinvent it as it is needed.
Schmidt et. al(2001) submit that IT improves customer relations. IT benefits customers
as it initiates the need to improve the company’s competitiveness. For example, it enables
quick responses to customer’s need. Moreover, they add, that IT facilitates a wider
availability of information about products and services. This is increasingly important to

42
customers as it facilitates a lower cost for the customer to switch between suppliers,
obtaining products specifications or information on services offered via the Internet is an
example. Information Technology has become the most pervasive technology of this time
Zee(2004) found in his research that the higher management performance in the
organization is achieved through business activities, grouped together in business process
and through the organization and allocation of resources to these business processes. He
reports that IT is playing an important role in all business processes now. The business
performance is attained through well-designed business activities that need to be changed
as per requirement of customer and market need. IT now is an important tool for
organization change and efficiency, for business process reengineering for effectively
supporting all business processes activities and employees. The ensuing discussion
elaborates the IT role in increasing business processes activitiesc in detail.
2.3.2 IT and Business Processes
2.3.2.1 IT as Strategic Weapon.
Karake(1999) linked up the revolution in IT to the industrial revolution in terms
of its potential scope and impact on society. He adds that now it has been called
the digital revolution or it can be refered to as the Network Economy. But
whatever it is called, there is no denying that a veritable tide wave of IT is rolling
across the business landscape. Caught up in the undertow, the competitive terrain
is being reshaped, with the new companies arising, market leaders capsizing, and
new industries being uncovered. Another researcher Bhatt(2000) asserts that
today IT is an essential tool. It’s no longer support functions. It’s a fundamental
part of business. Only a few years ago IT was treated by many in the boardroom
as a mere servant that helped companies to automate tasks. No more “Not too
long ago IT was viewed as a support system to business, today IT is a strategic
weapon. During the short span of time it has acquired momentous place in almost
all aspect of human life. Oldach et al.(1993) submit that using IT for strategic
advantage implies the application of IT to enable strategies that enhance the
43
critical success factors or core competencies, or both of the business. Here, IT can
be used to strengthening the business in achieving its objectives (e.g., systems and
technical infrastructure or architecture are in place to support the business by
providing the opportunity to compete, improve productivity and quality, and
enable new ways of managing and organizing). Strategic advantage is represented
by the ability of the IT function to effect the choice that determine the
infrastructure and processes of the organization to run the business better.
Rockart and Short(1999) put forward their views regarding this discussion that
business needs are incessantly driving the demands for increased capabilities of
IT. In turn, increasingly advanced IT is being utilized in more and more
sophisticated ways by the businesses to outdo competitions. Porter and
Miller(1985) also state that IT is transforming the nature of competition, by
restructuring the industry. IT, which is being deployed as a solution to the
increased complexity and uncertainty of the environment, has paradoxically
contributed to the situation by “compressing time and distance”. Segars & Grover
(1995) and Byrd(2001), in their longitudinal studies to see the impacts of IT on
industry structure, found strong evidence that IT can restructure strategic groups,
and thus improving a firm’s competitive position.
Chan(2000) discusses that IT has now taken new role to play in the organizations.
IT with new innovations is now viewed as a change agent and has significant
strategic position in the organization rather than performing support role. It is
playing roles of 1) an initiator-an agent of change and it lets people recognize a
powerful solution before seeking the problem it may solve, 2) a facilitator-it may
serve as something to make work or a workload easier and 3) an enabler-as it
offers the ability or the necessary assistance to accomplish something. It provides
rapid processing and analytical capabilities, parallel access and information
capture. Table 2.1 on next page shows these changing views of IT over time.

44
Table 2.1: Changing role of IT over the years: Source: James & Smith, 2003: pp171
Rameesh(2003) from his research concludes that strategic advantage of the
organization is represented by the ability of the IT function to affect the choices
that determine the infrastructure and process of the organization to run the
business faster..
Leon and Leon(2002) submit their views in this regard by saying that IT can also
deliver competitive advantage by being a proactive contributor to mission-critical
systems. Here, IT can be used to create new marketing opportunities. In both
cases (competitive advantage and strategic advantage), it is imperative that the
company is at least as faster as its competitors are, in applying IT.
2.3.2.2 IT and Business Process Reengineering.
Business process reengineering is a top down process driven approach managed
by senior executives. It aims to improve performance by radical change in the
system over short time period. It is an important tool / technique for
organizational change and efficiency enhancement. It’s theme covers changing
not only internal operations but also interactions with suppliers and customers
external to the organizations(Gunasekaran and Nath, 1997).

45
Reengineering involves a change of mindset. It is defined by Hammer(1990) that
“it is the fundamental analysis and design of every thing associated with a
business to achieve dramatic performance improvement and the management of
associated business”. Managers need information systems that distribute critical
operating information enabling them to redirect, accelerate, and sharpen their
planning, decision-making, and control. In another definition Hammer &
Champy(1993) say that “reengineering is the fundamental rethinking and radical
redesign of business processes to achieve dramatic importance in critical
contemporary reasons of performance, such as cost, quality, service and speed”.
Huff(1992) indicates that the basic concept behind reengineering is to reorganize
tasks with the aid of IT through greater automation of processes. Information
Technology plays a key role in reengineering.
Cooper and Rondolph(2000) also point out that there are four enablers for
reengineering i.e total quality management, human resources(workers),
organization(structure & culture) and Information Technology. But IT is regarded
as an important enabler in reengineering process among all as every application
of IT is invariably accompanied by some organizational or human resources
management changes(Love & Gunasekaran,1997; Davenport & Short,1990;
Hammer,1990;Harrington1991). Using IT, organizations can make reassessments
and can streamline their business processes to improve speed, service and quality.
Technology removes limits to the way employees perform their work allowing
companies to redefine the way work is done and ultimately achieve a competitive
advantage for earning higher profits(Gordon, 2002). In an earlier study Hammer
and Champy(2003) also pointed out that the real power of IT lies in its ability to
enable an organization to break old rules and create new ways of working. IT
serves as a facilitator in the reengineering of a process. IT can reduce the
complexity of communicating effectively across organizations. Through the
reengineering of strategic and value added business processes, done with the
support and assistance of IT, the company can implement innovative and radical
changes(Choi and Chan, 1997; Hall et.al, 1993). As it has been discussed above it
46
is very clear that IT plays a censorious role in reengineering. The IT staff acts as a
catalyst in the reengineering process, providing input on what the limits of IT are
and how to use it most effectively?.
Champy(2003) in his recent research found that company by restructuring, layoff
or changing operations process, may reap the benefits of improved productivity
and when combined with the power of IT, much of the productivity improvements
are gained. Chapmy(2003) predicts that present and future productivity will come
from the redesign of the process that operate between a company, its customers,
suppliers, partners and possibly its competitors and he named this concept as X-
Engineering. He further says that three principles are necessary for successful X-
Engineering i.e. transparency, standardization and harmonization, and IT can
make it possible.
2.3.2.3 IT and Organization Transformation
Moreton and Chester(1997) have discussed another impact of IT on organizations
by saying that “IT is a vital component in the transformation of an organization
and crucially important”. Gouillart and Kelly(1995) define business
transformation as “the simultaneously-although at different speed-along the four
dimensions of reframing, restructuring, revitalization and renewal”. Farrbey et.
al(1994) say that IT has power to transform organization and during this process
IT increases the ability to change and to respond for immediate and direct
economic benefits. It facilitates the streamlining of the administrative processes
and enables the decentralization of the scope and scale of business. Morton(1998)
also adds to this by saying that adoption of IT in an organization not only enable
changes in the job routine itself but also lead to organization transformation.
According to another researcher Meyer(1987) IT may not automatically transform
organizations but it may act as instrument in accomplishing the organization
transformation goals. Oldach et al.(1993) also note that IT has transformed the
basic nature of many industries. IT is enabling business processes to be
redesigned which aere were thought impractical or impossible.

47
Wetherbe et. al(1999) disclosed that the role of IT in transforming the enterprise
is dependent on its perceived importance to the business as viewed by top
management. The importance of IT is reflected in the way in which it participates
in the strategy formulation process. The IT function has become more influential
during the creation of business strategies and the trend now is to integrate IT into
the formal strategy framework of organization.
2.3.2.4 IT and Innovations
IT is also promoting innovations(Dewett & Jones,2001). Innovation as defined by
Roger(1983) is “an idea, product, practice, or service that is perceived as new
by the organization or the unit of adoption”, Dosi(1988) demonstrates that “an
innovation is a process that allows the invention (new idea or new system) to be
used in a particular context”. Myers et. al(1998) define innovation as “a complex
activity that proceeds from the conceptualization of a new idea to solution of a
problem and then to the actual utilization of economic or social value”. Another
way to view innovation is to view it as the process of bringing any new problem-
solving ideas into use”(Kanter, 1989). Daft(1999) broadly defines innovation in a
way that “it is the intentional introduction and application within a role, group or
organization of idea, processes, products or procedures new to the relevant unit of
adoption designed to significantly beneficently benefit the individual, the group,
organization or wider society”. According to Gilgeous and Gilgeous(2001) “an
innovation may be something that never previously existed, or it could be some
thing new to our own personal situation”, Spence(1994) describes innovation in
these words that “an innovation could be an invention, something produced which
is strikingly different to anything already in existence; however an innovation
might be a fundamental change in practice because it puts an entirely different
emphasis on well-established procedures”.
Dewett and Jones(2001) emphasize the role of IT in innovation in a way that, “IT
is a major source of innovation because it brings new problem solving ideas into

48
the use of an organizations. The successful introduction of IT into organizational
processes constitutes innovation, and the widespread and general acceptance of IT
into organizational operations constitutes diffusion”. They elaborated that
knowledge or information availability on its own will not lead to innovation. It is
the ability to use the knowledge creativity that leads to innovation and thus gives
competitive advantage. The design process of IT projects has traditionaly
involved sequential phases(Dewan and Kraemier, 1998). Parallel processing and
concurrent engineering is made possible through the application of IT. Employees
are allowed to work simultaneously with continual interaction through electronic
communication and this can promote innovation throughout the organization. The
ability of IT to enhance a person’s domain relevant skills is also an indispensable
part of the innovation process( Ray and Acharya, 2004).
Ray and Acharya(2004) further argue that IT facilitates a company to retain/gain
operation efficiency by innovating different IT products for improve processes
and enables improvements by process innovation for expediting the firms’
procedure, and allows the maintenance of high labor productivity through
consolidation, for example, in the process of bank loan approval, IT products of
document imaging enables the banks to process loan applications more efficiently
as multiple employees are permitted to access the same documents
simultaneously, if they wish. Also loan officers can use electronic documents to
evaluate the customers’ credit history, employment status and loan eligibility,
concurrently. Moreover, it helps to reduce the number of intermediate steps in
these complex processes, allowing necessary tasks to be accomplished more
independently and efficiently.
2.3.2.5 IT and Social & Economic Changes.
Winter and Taylor(1996) recognized IT as a influential agent for social and
economic change as it offer many new products and ways of doing the things. IT
applications, such as shared databases, networking, and telecommunications, are
able to meet the need for ever-closer coordination in the business arena. Shared

49
databases greatly ease the information dissemination process, providing an online
environment for those who seek information as well as standardize the format in
which all receive such information. While shared databases facilitate the
distribution of information, networking assists both collection and dissemination.
The former is a storehouse and the latter are exchange. For example, multinational
firms, once constrained by geographical and technological limits, now enjoy the
benefits of networking which enables round the clock exchange of information on
production performance, among other things. Networking also facilitates rapid
implementation of business decisions made at one level of an organization by
permitting the timely conveyance of such decisions to all affected parties. Such
communications takes place most commonly through telecommunication, such as
voicemail, e-mail, or video and teleconferencing(Devenport, 1993).
Srinvasan and Jayarman(1999) effectively argue that now IT is not just having a
support role. It is now becoming a change catalyst. Through time saving and
efficient applications such as computer-aided design, IT is used simultaneously to
coordinate the design directions among several functional participants and to
begin the process of product design. Computer-Aided Systems Engineering
(CASE) tools are another examples of aids that include a broad range of
functions, including graphical modeling, data analysis and sharing, process
analysis and modularity(Naisbitt & Abardene,1985).
IT has also become the tool used to manage change in business strategies and
internal corporate processes by many companies (Poku and Vlosky, 2002).
Gates(1997) considers IT as the nervous system of a company. Companies using
IT are able to learn about the market, the competition, the internal and external
customers, leveraging it for competitive advantage to increase market share and
profits (Mahmood & Soon, 1991). Al-Ansari(1999) also observed in his research
on Kuwait industries that in addition to the other factors, IT has also been one of
the major factors causing changes in the way people communicate, locate,
retrieve, process and use information.

50
As discussed IT provides a large number of benefits to the organization. The most
commonly noted operational benefits of IT as discussed above ultimately are efficiency
and productivity increase, cost reduction, customer satisfaction, product quality and profit
improvement. Therefore, it can be resulted from above discussion that the use of IT has
improved many facets of people lives. It permits them to perform a range of activities
with greater efficiency by taking less time, incurring a lower cost or acquiring fewer
efforts. With the help of IT, work may be completed by attaining greater accuracy. Long-
term survival and growth of an organization can be achieved through an efficient and
effective organization that satisfies all the needs of its customers and other stakeholder
and IT plays an important role, in the internal functioning of organizations. IT is seen in
all functions of the organization and it supports in all tasks performed by the managers. It
helps managers in business processes of re-engineering, innovations, organization
transformation and change management.
So, it is concluded that technology is no longer impediment in information-rich society,
infact technology like IT is the important link to business success. Therefore,
organizations should emphasize on IT’s relationship to coordination, control, and
business performance. The business opportunities emerging through the development and
application of IT are enormous, but it all depends upon managers of that organization that
how efficiently and effectively they can reap benefits through IT by applying it properly
in business processes of their organizations. AT the same time the managers also have to
care about vulnerability of IT systems failures, misuse or errors. All in all IT is a
powerfull toll for organizations’ success but at the same time it is needed to be
managed/monitored carefully in the organizations.
51
IT and Management Functions
IT and Management Functions 2.3.3. Managers play key and multiple roles in organizations. Their responsibilities range
from minor to major tasks performed in the organization. While determining how IT can
benefit managers, it is essential first to examine that what manager do in the
organizations and what information they need for carrying out different jobs. A French
industrialist Henri Fayol, in the early part of 20th century indicated that all managers
perform five management functions in the organization i.e planning, organizing,
command, coordinate, and control7. Later, Robbins and Coulter(2003) have grouped
these five functions into four i.e. 1) planning 2)organizing 3) leading and 4) controlling.
(Hitt and Brynjolfsson,1997) discusses that there is a vast difference between how
traditional managers performed these functions, and how contemporary managers are
doing so. The concept of traditional management has also been changed and
contemporary management styles are more common now. Technology like IT has greater
impact on managerial practice than before. It is beyond doubt that IT is playing a vital
role in the changing process of management by providing powerful tolls for managers to
carry out their all jobs efficiently and effectively(Hitt and Brynjolfsson,1997).
Buyukazkan(2003) has proved in his research that by using IT applications a manager
can get increased accuracy, reduced cost of carrying out certain business operations,
timely output, improved customer satisfaction, improved control of business, reduced
errors, and faster availability of information among all units of business. They conclude
that today IT is directly effecting on manager plan, decision making, organizing, leading
and controling. The following discussions give an insight that how IT helps the managers
to perform their organizational function in more effective ways.
7 In the mid 1950s, two professors at the University of California-Los Angeles drew upon Fayol’s work and used the functions of planning, organizing, staffing, directing and controlling as the framework for a textbook on management that was the most widely sold text book for 20 years. Koontz H. and O’Donnel C(1955), “Principles Of Management: An analysis of Managerial functions. McGraw-Hill, New York.

52
2.3.3.1. IT and Planning
Planning as defined by Robbins and Coulter(2003) is the process of identifying
the firms’ goals, establishing an overall strategy for achieving those goals, and
developing a comprehensive hierarchy of plans to integrate and coordinate
activities. Planning and decision making have rightly been called the primary
management tasks and these tasks occur at every level of management, although
naturally the type of planning and decision making will vary between the levels.
Chow(2001) says that IT is playing a vital role in planning process. Wide variety
of software packages and computer programs are available to the managers in the
organizations, which help them to store, retrieve and analyze information for
making plans. According to Korson et. al(1992) IT helps managers in creating
plans by defining the paths through which the organization’s goal can
successively be achieved. Formal plans are made and are made available to other
organizations’ members in the form of hard, soft and on-line copy. Hedlin and
Allwood(2002) also highlight that in planning computers and Internet provide
quick information, which are useful for top managers to make quick decisions.
With the help of IT, today’s managers can accurately scan, forecast budget for
correct planning. Software programs are also available for operational planning
tools, which help a lot in applying scheduling, breakeven analysis, linear
programming, queuing theory and probability theory etc. Among others
simulation is the best example of computerized planning tools in which with the
great help of a computer a model of real-world phenomenon is created and then
manipulation of one or more variables is done in the model to assess their
impacts(Ives & Jarvenpaa, 1999).
In order to provide appropriate information to different level manager,
computerized management information systems are designed, which help
different managers in planning and have profound effects on their
working(Adeoti-Adekeye, 1997). In addition, managers of all levels can share
information freely through integrated computer network, Intra and Internet, for
making all type of plans. Therefore, it can be said overall that IT is a vital element

53
in planning, both in the design of product and services and in their development
and distribution. Computer aided designing, computer aided manufacturing and
computer aided planning are core to success of any today’s organization(Dewett
& Jones(2001; Moreton & Chester (1997).
2.3.3.2. IT and Organizing
Daft(1999) defines organizing in a way that “ organizing is to determine what
tasks are to be done, who is to do them, how the tasks are to be grouped, who
reports to whom, and where decision are to be made. Chandler(1962) in his early
study defined structure as “the design of organization through which the
enterprise is administered”. It maps out the logical relationship of hierarchical
levels, formal communication channels and functional areas arranged in such a
way as to enable effective achievement of the objectives and goal..
An early researcher named Woodward(1965) conducted a survey of 100 British
manufacturing plants and indicated that organization structure tends to vary with
the type of technology employed. In other words, certain structure appears to be
more successful with certain kind of technology. Oil producing and refining
companies for example are organized in a way that reflects the special technology
of their operations. An automobile company, with its engine, parts and body
plants and assembly lines is to be organized differently from the way railroads
and airlines, with their different technologies, are organized. Nance(1992)
investigated that with the introduction of IT traditional approaches to organizing
work are being questioned and reevaluated as managers searched out structured
designs that can best support and facilitate employees doing the organization’s
work. IT always has affected organization’s structure. Technology is efficiently
providing the facility to all managers that make organizational designs in a way
that will support and facilitate employees. It has really become an easy task to
organize with the help of IT. Olson(1982 notes that work specialization and larger
span of control to reduce costs, cut overhead, speedup decision making, increase
flexibility, get closer to customers, and empowering employees is possible now

54
with IT. Information Technology, by standardization of coordination would
facilitate larger spans of control or work unit, which would be characterized by
extensive lateral communication and self-contained authority structures.
Olson(1982) also narrates that IT may change lateral relations within the existing
organizational structure, since communication across departmental boundaries are
easier to establish. One might predict improved interdepartmental relations and
increased accessibility of experts within an organization as a result of electronic
communications. Olson(1982) further states that formal management may be
adopted with more reliance on formal rules and procedures and less
discrimination. Manager will also have more time for decisions and delivering
more to organization.
Mckeen and Heather(2003) argue that new Information Technologies allow
managers to handle more functions and widen their span of control. Fewer levels
of management hierarchy are required, enabling companies to flatten the pyramid
of today’s management structure. The new IT allows decentralization of decisions
making without loss of management awareness; thus employee at all levels can be
encouraged to be more creative and entrepreneurial. The key responsibility of the
CEO will be leadership; to capture the light or energies of the organization like a
lens and focus them on the key strategic objectives.
IT enables an organization to be more reactive and proactive in an environment.
Ciborra(1997) describes how a shapeless organization employs IT to remain
flexible in highly uncertain environments. For highly unstable environments, she
advanced that the traditional environment structure linkage fails to create
flexibility for organizations that are highly centralized and formalized. So to
alleviate this tension created between the environment and structure, IT is
implemented to provide organizations with greater flexibility, allowing them to
process more information about the environment.
55
The findings of Dibrell and Miller(2002) confirm that IT has been a catalyst in the
development of new forms of organization structure. IT has gone from a support
mechanism to a substitute for organizational structures in the form of the shadow
structure. The span of control and levels of the organization were each reduced
through the introduction of computers to the organization. IT has allowed
numerous organizations to reorganize several tasks through the automation of
tasks. The reorganization of tasks resulted in a greater centralization of
information. Another theme which is presented in Dibrell and Miller(2002) study
is IT’s influence on the revolutionary rate of change in organizational structure.
According to them within only the last 25 years, as organizations have adapted to
the requirements of changing markets and technologies, there has been dramatic
changes from the bureaucratic structure to the matrix, to the network, and now
possibly to the shadow structure. Based on historical trends, the volatility of the
environment is expected to increase, and, consequently, the demand for
organization forms that can handle demands for increased information processing.
Thus, one can reasonably project the continued application of advanced
Information Technologies to future organizational designs. As manager strive to
reduce the uncertainty of doing business in tomorrow’s market.
Bhatt(2000) demonstrates that IT has changed the traditional forms of
organizational structure such as hierarchies are no longer appropriate. He further
highlights the importance of communication technology by saying that IT has
great effect on organizational design and has changed work patterns. Employee,
teams or individuals need information to make decisions. IT has significantly
affected the way organization members communicate, share information, and do
their work. It has significantly improved a manager’s ability to monitor
individuals or teams performance, and it has allowed employees to have more
complete information to make faster decisions.
Buyukozkan(2004) while narrating the importance of an organizational
information network also submits that the sharing of information among

56
organizational members is a fundamental requirement for effective management
and IT has made it possible by providing the information manager need, in the
desired format and when they need. The networked computer systems and
wireless capabilities has enhanced organizational communication systems among
members. The communication applications such as e-mail, voice-mail, facsimile,
teleconferencing, video conferencing, electronic data interchange, intranets,
internets etc. are giving greate help to managers for decisions making. Wireless
products such as personal pagers, cellular phones, and specially equipped laptop
computers are making it possible for peoples in organizations to be fully
accessible to each others, at any time or any place now. Now employees don’t
have to be at their desks with computers plugged in and turned on in order to
communicate with others in the organization.
In short, IT permits simultaneous centralization-with-decentralization. The parts
of an organization that are best suited to be centralized are centralized while other
parts may be best rewarded by a decentralized approach. Homburg et al. (2000)
discovered that IT enables an organization to employee a more decentralized
structure, as employees are not geographically bound to projects within a local
proximity. Lal(1994) and Hitt & Brynjolfsson(1997) also found that extensive
use of IT has flattered and more decentralized organization structures. The same
is observed by Michalak et al.(1999). They report that IT may influence the
centralization/decentralization of decision making and control systems. New
technology has typically resulted in a flatter organizational pyramid with fewer
levels of management required.They further add that IT affects the nature of
individual jobs and the formation and structure of work groups. There is a
movement away from large scale centralized organization to smaller working
units.
2.3.3.3. IT and leading
Each and every organization is consisted of peoples, and management’s major job
is to direct and coordinate these peoples. This is the function of leading. Leading
also includes motivating subordinates, directing others, selecting the most

57
effective communication channels, and resolving conflicts(Strassman, 1985). IT is
playing an important role in leading process as well. Paug(1986) puts forward a
view that IT is motivating the employees or subordinates of an organization by
clearly defining the outcome of their job. Due to various computer programs and
using the information of the past this technology timely clarifies the outcome or
result that gives motivation to employees for getting the work done. This results
in greater performance and organization starts moving towards its goals speedily.
Besides this as Meyer(1986) also noted, IT professionals are more skilled and can
better perform their work as compared to other employees. They are highly paid
and rewarded due to their performance, and hence, they are appreciated. It
ultimately gives them motivation to perform better for more rewards, positions
and appreciations. Similarly, the managers or leaders having skills of IT can better
communicate with their employees, since they have technical skills, therefore,
they can influence their subordinates and can resolve their conflicts more rapidly
and easily as compared to non IT base skilled managers. Managers with IT
knowledge can effectively utilize expert and referent powers and are more
regarded by their subordinates. It is therefore, concluded that IT has opened new
possibilities for leading.
2.3.3.4. IT and Controlling.
Controlling is to monitor activities to ensure that they are being accomplished as
they were planned and correcting any significant deviation. Control is the means
to determine wheather the organization’s goals and objectives are met(Robbins &
Coulter, 2002). Information Technology has made this job smooth and more
effective for the managers. IT is resulting in measuring actual performance,
comparing and taking managerial actions to correct deviations through different
systems. Attewell(1989) has talked about computerized monitoring that through
video-cameras manager while sitting in his office can check the work and
movements of all the employees and also can better alter security guards if any
thing goes wrong. Evan(1999) also narrates that computer based application
packages such as Microsoft Office programs are being used by the managers for

58
graphical presentations of the graph and charts of companies performance. Most
computers are programmed to provide operators with immediate response, if an
error is made. This helps the subordinates to monitor their own activities and to
remove any disorder. Similarly, many organizational quality programs rely on
concurrent controls to inform workers if their performance output and levels are
of insufficient in quality and it ensure that quality standards are met.
McFarlan(1984) in this regard says that technological advances in computer
hardware and software have made the process of controlling much easier. Now
among other things managers can read their e-mails, tap telephones, monitor work
by computers, and store and review computer files. Computer monitoring is an
excellent control mechanism to manage work teams. For instance, AT&T
computer-monitoring technology is being used by self managed work teams in
operation telephone call centers. Computer monitoring systems can be used to
collect, process, and provides performance feedback information about employees
work that can help managers with performance improvement suggestions and
with employee’s development. Hoos(1990) pointed out that IT has also been used
to help managers identify employee work practices that might be unethical or
costly. For instance, many hospitals and other health care organizations use
computer monitoring to control costs of medicals procedures and accessed to
controlled medication. Likewise many organizations use computer-monitoring
systems for controlling costs, employee work behavior, and any number of other
areas of organizational activities(Henderson, 1993)
Hence, it can be concluded from the above discussions that IT is a helping tool for
managers in performing all their functions well. Information Technology is recasting the
management process, providing new capabilities to help managers plan, organize, lead
and control. But doing so, IT does not eliminate or decrease any layer of manager, rather
it performs a support cum strategic role in all managerial levels, thoughts and acts. In
short, it is rightly to say that all managers use IT to increase their efficiency and it does
not decrease their importance. IT helps the management in all ways in centralized or
decentralized decision making.

59
Information Systems and Managers
Information Systems and Managers 2.3.4. As there are different interests, specialties, jobs and levels in an organization for
smooth working, so there are different kinds of systems. No single system can provide all
the information that an organization and managements needs(Allen and Andrew(1991).
Peter(1993) indicates that there are various IT systems and sub-systems, which can be
used by the managers of different levels for carrying out their jobs to increase their
efficiency. Following discussion provides an insight to all those systems, which are
available to the managers. Shelly et. al(2004) narrate that four main types of information
systems serve different organizational levels: These systems are Operational-Level
systems, Knowledge-level systems, Management-level systems, and Strategic level
systems as discussed below.
2.3.4.1 Operational-Level systems. These systems support operational managers by
keeping track of the elementary activities and transactions of the organization,
such as sales, receipts, cash deposits, payroll, credit decisions, and the flow of
materials in a factory. The principal purpose of systems at this level is to answer
routine questions and to track the flow of transactions through the organization.
2.3.4.2. Knowledge-Level systems. These systems support the knowledge and data
workers in an organization. The purpose of knowledge-level systems is to help the
business firm discover, organize, and integrate new knowledge into the business
and to help the organization control the flow of paperwork.
2.3.4.3. Management level systems. These systems are designed to serve the monitoring,
controlling, decision-making, and administrative activities of middle managers.
These systems provide periodic reports rather than instant information on
operations.

60
2.3.4.4. Strategic-Level systems. These systems help senior management in long range
planning activities. Their principal concern is matching changes in the external
environment with existing organizational capability(Laudon & Laudon, 1999).
Figure 2.4: Kind of different information systems at different levels of Managers
Source: Loudon & Loudon, 1999 pp79
Keen(1995) differentiate the information systems by functional specialty i.e major
organizational functions, such as sales and marketing, manufacturing, finance, accounting
and human resources. Each function is served by its own information system. In large
organizations, sub functions of each of these major functions also have their own
information systems. For example, the manufacturing functions might have systems for

61
inventory management, process control, plant maintenance, computer-aided engineering,
and material requirements planning.
Dhar and Roger(1997) state that a typical organization has operational, management,
knowledge and strategic-level systems for each functional area. Different organizations
have different information systems for the same functional areas. Because no two
organizations have exactly the same objectives, structure, or interests. There is no such
thing as a universal information system that can fit all organizations. Every organization
does the job somewhat differently. Therefore, these information systems can be classified
by functional specialty or by the organizational level they serve.
As there are different levels of managers, so different types of information they need to
work, and there are different computerized systems to fulfill their information need. The
following discussion gives an analysis of specific types of computerized information
systems that correspond to each organizational level. The organization has executive
support systems (ESS) at the strategic or upper level management, MIS-management
information systems and DSS-decision support systems at the middle level management,
Knowledge worker systems (KWS) office automation (OA) and transaction processing
systems (TPS) at operational or lower level management. Each of the different kind of
systems may have different components that are used by organizational levels and groups
other than their main constituencies. A secretary may find information on a MIS, or a
middle level manager may need to extract data from TPS(Oz, 2002).
2.3.4.5. Transactions Processing Systems TPS- are the basic business systems that serve
the operational level of the organizations. These are computerized system that
performs and records the daily routine transactions necessary to conduct the
business. A transaction processing system is a computer-based information
system that keeps track of the transactions needed to conduct business
(Marakas, 2004). At the operation level, tasks, resources, and goals are
predefined and highly structured; therefore theses systems cater only operational
level tasks. These systems do have clearly predefined inputs and outputs, and
there is an emphasis on efficiency and accuracy. TPS record data but they do
little in the way of converting data into information of knowledge. Since TPS
62
collect and store the basic operational data of a company, so they are the
foundation on which other information systems are built. Early computerised
systems were primarily TPS(Laudon& Loudon, 1999).
2.3.4.6. Knowledge Work and Office Automation Systems: KWS-is an information
system that aids knowledge workers in the creation and integration of new
knowledge in the organization. A knowledge worker job consists primarily of
creating new information and knowledge, One example of a KWS is the
computer-aided design system. Office Automation System (OAS) is a computer
system, such as word processing, electronic mail system, and scheduling system
that is designed to increase the productivity of data workers in the office. They
assist primarily of secretaries, accountants, filing clerks, or managers whose
jobs are principally to use, manipulate, or disseminate information (Ray &
Acharya, 2001).
2.3.4.7 Management Information Systems: An MIS is a computer oriented system that
optimize the collection, transfer, and presentation of information throughout an
organization by using an integrated structure of databases and information
flow(Long & Long, 1999; Adeoti-Adekeye, 1997). It is a management system at
middle management level. MIS usually serves managers who are interested in
weekly, monthly, and yearly results not day-to-day activities. These systems
generally are not flexible and have little analytical capability. Some researchers
use the term MIS to manipulate all the information systems that support the
functional areas of the organization (Davis and Olson, 1985). But Loudon &
Loudon (2005) use the term as CBIS (Computer Based Information System) as
the umbrella term for all information systems and to consider MIS as those
specifically dedicated to management level functions. Adeoti-Adekeye(1997)
observes that a management information system(MIS) is generally thought of as
an integrated, user-machine system providing information to consider operations,
management decisions-making functions in an organization. It is an accessible
and vigorous conveyor belt for appropriate high quality information from its
generation to its users.

63
2.3.4.8. Decision Support Systems. DSS-are also information systems at the management
level of an organization that accumulate data and sophisticated analytical
models to support semi-structured and unstructured decisions. DSS typically
fames on the future, and are designed to help decision makers with messy or
unstructured decisions(Marakas, 2004). The main feature of DSS is its
interactive nature i.e its capability of allowing managers to ask ‘What-if’
questions and to build various scenarios to understand better what the real
problem or opportunity is as much as to come up with an action plan to address
it(Schiesser, 2003).
2.3.4.9. Executive Support Systems. ESS-are the information systems at the strategic
level of an organization designed to address unstructured decision-making
through advanced graphics and communications. ESS are computer-based
systems that provide top managers with the capability to attain easy access to
internal and external information which is relevant to strategic decision making
and other executive responsibilities(Ray & Acharya, 2004). The term “executive
support system” and “executive information systems(EIS) are often used
interchangeably(Nord & Nord, 1995). The ESS or EIS (Executive information
systems) supposedly offers the same decision support tools as the DSS, but each
tool is designed specifically to support decision-making at the executive levels
of management, primarily the tactical and strategic levels(Long and Long,
1999). These systems were developed in late 1980s and early 1990s to help
support the information needs of top-level executives. ESS implies the most
advanced graphics software and can deliver graphs and data from many sources
immediately to senior executive officers for review and decisions
making.(Rockart and Treacy, 2002). The ESS can be interlinked with ES
(Expert Systems), which are considered generally a subset of artificial
intelligence. The intent of an ES is to try to capture the knowledge and
reasoning capabilities of human expert and transfer this expertise to computer
systems. Expert systems are being used successfully in a wide variety of fields
including medicine, financial planning, loan granting, stock trading, tax
assessment, order picking and inventory control(Marakas, 2004).
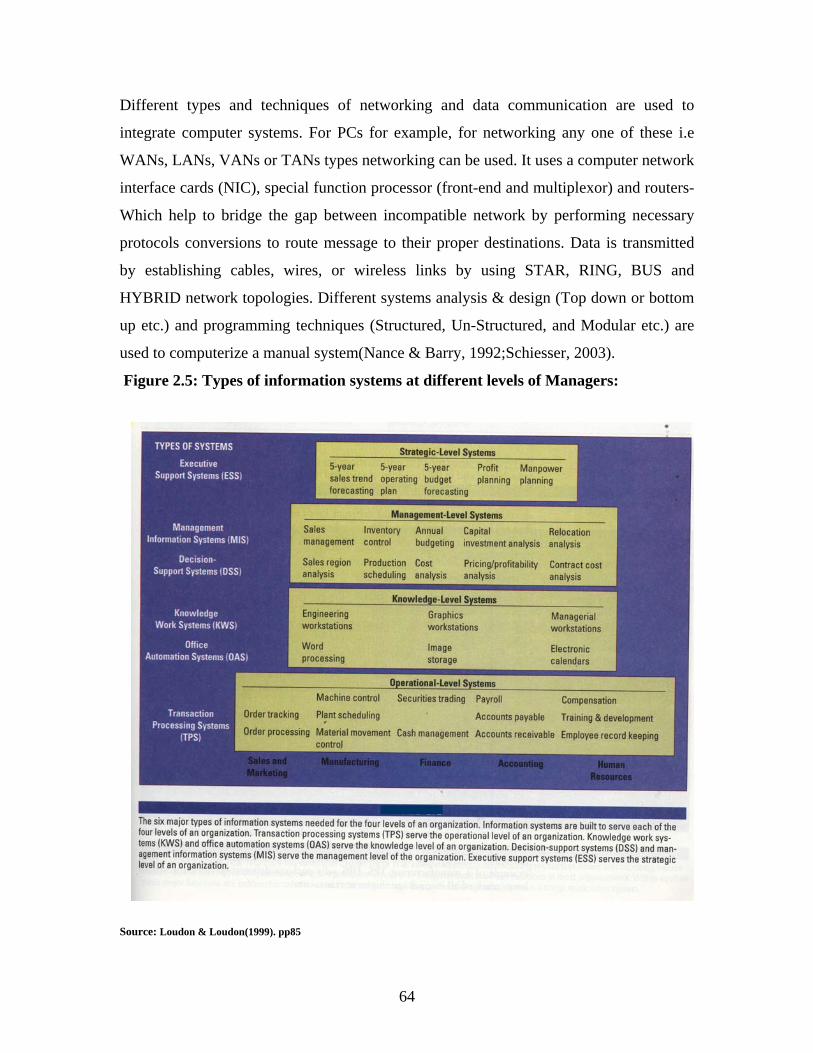
64
Different types and techniques of networking and data communication are used to
integrate computer systems. For PCs for example, for networking any one of these i.e
WANs, LANs, VANs or TANs types networking can be used. It uses a computer network
interface cards (NIC), special function processor (front-end and multiplexor) and routers-
Which help to bridge the gap between incompatible network by performing necessary
protocols conversions to route message to their proper destinations. Data is transmitted
by establishing cables, wires, or wireless links by using STAR, RING, BUS and
HYBRID network topologies. Different systems analysis & design (Top down or bottom
up etc.) and programming techniques (Structured, Un-Structured, and Modular etc.) are
used to computerize a manual system(Nance & Barry, 1992;Schiesser, 2003).
Figure 2.5: Types of information systems at different levels of Managers:
Source: Loudon & Loudon(1999). pp85

65
Chan(2000) effectively argues that an efficiency of an organization and its manager can
not be fully achieved if systems working in the organization on various levels are not
interlinked. A TPS is typically a major source of data for other applications whereas the
ESS is primarily a recipient of data from lower-level systems. The other type of systems
may exchange data among one another as well. It all required that how much can or
should these systems be integrated with each other?. Chan(2000) further says that it is
definitely advantageous to have some measures of integration so that information can
flow easily among different parts of the organizations.
Each organization weighs its need for integrating systems against difficulties of mounting
a large-scale systems integration effort. There is no one “right level” of integration or
centralization (Allen and Andrew1991; King, 1984). Each organization interlinks its
systems as per its requirement. The systems discussed above are developed and
programmed by using different configuration of hardware(Super, main frame, mini &
micro computers) and software(Operating Systems such as DOS, Windows 98, Window
NT, OS/2, Unix, Mac OS, Linux etc., Programming Languages such as FORTRAN,
Cobol, RPG, Basic, pl/1, Pascal, Ada, LISP, C, structured query languages-SQL & most
recent Object Oriented Programming, Visual Programming languages like Java etc. and
Programming Packages such as FoxPro, spreadsheets packages like Lotus , Microsoft
office products- Microsoft excel, MS Word, WordPerfect and Web browser etc(Fayad &
marshall,1996; Reynolds, 1995; Gupta, 2000). The systems are tide to databases and are
made on-line, off-line or interactive as per need. (Vassiliou, 1985; Korson & Vijay 1992;
Flynn and Bill,1996).
In addition to the above systems for better performance some customize standardize
packages like SAP, Oracle, etc and a broad array of communication media and devices
which link information systems and people including Internet, e-mail, voice mail, voice
conferencing, video conferencing, group ware and corporate intranets, car phones, fax
machines, personal digital assistant etc., are also available to all levels of managers
(Franklin, 1997; Ray & Achariya, 2004).

66
Almost all the organizations, which are using computers, have their own data processing
(Computer, MIS, IT) department working with different employees with different
expertise of hardware and software. This data processing department plays a vital and
strategic role for the growth of an organization. The IT departments are required to
develop and monitor corporate-wide applications to improve organizational work
performance. This corporate responsibility has given IT department a new mandate to
seek broader corporate-wide synergies and to link existing functional areas in new ways.
Thus, the computer department now has broader corporate responsibilities and is getting
the top positions in the company hierarchy. The heads of IT department are being placed
at top in hierarchy(Fazio,2000).
As discussed before, every organization has different objectives and needs and has some
unique features. Therefore, they use different IT systems. Some IT systems are developed
in-house by the company’s own IT experts or by hiring the services of different computer
consultancy firms. While other software, which required standardization and external
usage, are purchased from outside vendors who are expert and have developed those
systems after long research and comprehensive analysis. Such as some computer systems,
which are used in airlines for ticket reservations or in banks for ATM usages8, have
common features and users, therefore required standardization for industry linkage for
information sharing and communication. So, same software is used across the
organizations of that industry.
Conclusions 2.4.0 IT is a general term that describes any technology that helps to produce, manipulate,
store, and/or disseminate information. IT is playing a vital role in development of the
organizations and increasing management performance i.e efficiency and effectiveness.
Although the term IT originated in the computer industry but it extends beyond
computing to include telecommunications and office equipments. IT has gone under
various developments phases so far to reach at present stage. Computing hardware
technology has come a long way since vacuum tube technology (1946-1956) and 8 PHONIX- Package is being used in banking sector of Pakistan for ATM links.

67
transistor (1957-1963). It is only integrated circuits (1964-1979) and the very large scale
circuits (VLSCI; 1980-present) that made the multimedia and network technology of
today possible. In the last decade, there seen a continuously increase in computing
power(storage, capacity, computing power and speed) and a tremendous decrease in
physical size and cost, thus allowing the complex software program and bulk of data.
Then it come the development of World Wide Web as a vehicle through which all
dispersed information can be shared. The Internet together with advances in network
technology particularly with large bandwidth has created new potentials for information
management and communication. Now communication particularly wireless
telecommunication is converging with IT to create even bigger potential to change the
business scene. All organizations now are extremely dependent on Information
Technologies due to its various tangible benefits.
The performance is an outcome of efficiency and effectiveness. Though efficiency and
effectiveness are two separate terms but there exists some relationship between them i.e
efficiency is concerned with the means of getting things done and effectiveness is
concerned with the end, or attainment of organizational goals and both go side by side in
successful organizations. The job of management of any organization is not only getting
activities completed and meeting organizational goals (effectiveness) but also to do so as
efficiently as possible. In successful organizations, high efficiency and high effectiveness
typically go hand in hand. Poor management is most often due to both inefficiency and
ineffectiveness or to effectiveness achieved through inefficiency. Therefore, it is the
management job to get high efficiency and high effectiveness by all means.
The use of Internet and standard application packages is increasing day by day. The
organizations are required to update continuously their IT systems to incorporate
sophistication of newly emerging technologies to get steady competitive advantages. A
significant contribution of IT has been its capability in providing unprecedented
opportunities for sophisticated and advanced levels of interaction. IT applications are
increasingly becoming integral parts of a corporate-wide IT infrastructure which directly
connect the company to customers and suppliers, as well as connects the various

68
organization sub-units. Different IT systems are increasingly being used by firms to gain
competitive advantages in the form of cost savings, product/service quality improvement
differentiation, and overall customer satisfaction. The recent advances in IT have
changed the way organization work. Personal computers do the work done earlier by
mainframes. Computers are linked together in organizations and user share programs,
files, databases and electronic messages. Telecommuting is on the boom with the
attribute to connect to organizational computer systems from home.
There are different information systems i.e TSS, MIS, DSS & ESS in the organizations to
help managers to perform their tasks effectively as per their level. The organizations are
using there abilities to achieve new goals and processes and perform the things that were
not already done. In short, IT is helping the managers in performing all their functions
with different information systems developed in different software programs/packages
for their performance increase. Though it is very difficult to evaluate what kind of IT
solution will be most advantageous to the individual company but it is true that IT
systems lead to improve broad improvements in productivity/efficiency and overall
performance when it is intelligently managed.
69
References
Adeoti-Adekeye W.B(1995), “The importance of Management Information Systems”, Library Review. Vol. 46, No. 5, pp 318-327.
Aldag R.J and Stearns T.M(1987), “Management”, South-Western Publishing Co, Ohio
U.S.A, pp87-198. Agourram H. and Ingam John(2003), “National Culture and the Meaning of Information
systems Success”, Business Strategies for Information Technology Management, IRM Press,USA. pp 242-263.
Al-Ansari Hussain A.(1999), “Improving the organizational structure for an electronic
environment: a case analysis of Kuwait University Libraries”, Library Review, Vol. 48, no, 3. pp 131-139.
Anderson, R. (1986), “Management Information Systems and Computers: An Introduction”.
Macmillan Education Ltd. London, England. pp 131-140. Anadarajan, M. & Anakwe, U.P (2002), “IT acceptance in a less-developed country: A
motivational factor perspective,” International Journal of Information Management, 2002, pp. 47-65.
Allen, Brandr R., and Andrew C. Boynton (1991), “Information Architecture: In Search of
Efficient Flexibility,” MIS Quarterly 15, no. 4. pp 61-67. Attewell, P and Rule, J. (1984), “Computing in Organizations: What we know and what we
don’t Know”, Communication of the ACM, 1184-1192. Beekman, George. (1999), “Computer Confluence”, Addison-Wesley Longman publishing,
Inc. pp. 11-13, 4-7. Bhatt, G.D (2000), “Exploring the relationship between Information Technology,
infrastructure and business process re-engineering”, Business Process Management Journal, Vol. 6, pp139-163.
Bharadwaj A.S, Bharadwaj S.G and Konsynski B.R (1999), “Information Technology Effects
on Firm Performance as Measured by Tobin’s q”, Management Sciences, Vol. 45, no. 7 pp1008-1024.
Buchanan, D.A and Boddy, D. (1984), “Information Technology and productivity: Myths and
realities”, Omega, 12(3), pp112-140. Brown, R.M, Gatian, A.W and Hicks, Jr(1995), “Strategic Information Systems and financial
performance”, Journal of Management Information Systems, Vol. 11, no 4, pp 215-248.

70
Buchanan, D.A and Boddy, D. (1983), “Organizations in the Computer Age”, Gower, Farnborough.
Buyukozkan G.(2003), “An organizational information network for corporate responsiveness
and enhanced performance”, Journal of Manufacturing Technology Management, Vol 15, no 1 pp 57-67.
Brynjolfsson, E (1993), “Information Technology and efficient Management of modern
enterprise”, Journal Of Organizational Computing, pp 41-51. Byrd, T.A. (2001), “Information Technology: Core competencies and sustained competitive
advantage”, Information Resources management Journal, 14(2), pp 27-36. Byrd, T.A. & Marshall, T.E. (1997), “Relating Information Technology investment to
organizational performance:A casual model analysis”,Omega, 25(1), pp. 43-56. Cash, J. I, McFarlan, F.W. and McKinney. J.L. (1983), “Corporate Information System
Management:Text & Cases”, Irwin Homewood. IL. Cane, Allen(1992), “Information Technology and Competitive Advantage: Lesson from the
Developed Countries”, World Development, Vol 20, No 12. pp 1721-1736. Care Alan(1992), “IT and competitive advantages: Lesson from the developed countries”,
Wrld development vol 20, no 12, pp1721-1736, pp 1722. Crown, W. and Sobol, M(1983) “The relationship between Computerization and
performance: A strategy for maximizing Economic Benefits of Computerization”, Information and Management, Vol. 6, pp 171-181.
Champy James A.(2003), “Is technology delivering on its productivity promise?”, Financial
Executive, pp34-39. www.fei.org Chan Stephen L.(2000), “Information Technology in Business process”, Business Process
Management Journal, Vol 6, no 3, pp. 224,237. Chandler, A.D., Jr.(1962), “Structure & Strategy”, London: The MIT press. Chow W.S(2001), “Ethical belief and behavior of managers using Information Technology
for decision making”, Journal of Management Psychology, Vol. 16, no 4, pp258-267. Choi, C.F & Chan, S.L(1997), “Business process re-engineering: evocation, elucidation and
exploration”, Business Process management Journal, Vol 3, no 1, pp. 39-63. Ciborra, C.U(1997), “Improvising in the shapeless organization of the fuyure”, Steps to the
future: Fresh thinking on the Management of IT-based organizational Transformation, Jossey-Bass Publishers, San Francisco, CA, pp257-77.
Cooper, Randolph, B(2000), “IT development creativity: A case study of attempted radial
changes”, MIS Quarterly, Vol. 24, Issue 2, pp245-277.

71
Daft, R, L(1992),”Organization theory and design”, West Saint Paul, PP 112-150, 283-314. Dadashzadeh Mohammad(2002), “Information Technology Management in Developing
Countries”, IRM Press, U.S.A, pp92,134, 206. Davenport, T.H and Short, J.E (1990), “The new industrial engineering: Information
Technology and business process redesign”, Sloan Management Review, Vol 32 pp 11-27, 488-512.
Dewan, S. and Kraemer, K.L(1998),”International dimensions of the productivity paradox”,
Communication of the ACM, Vol. 41, no 8, August. Pp 55-62. Dewett, T. & Jones, G. (2001), “The Role of Information Technology in the Organization: a
Review, Model and Assessment,” Journal of Management: Managing in the Information Age, pp313-346.
Doug ,Bartholomew(2000), “Information Technology & Management efficiency,” MIS
Quarterly, Vol.2, pp. 23-29. Dosi, G.91988), “The nature of the innovation process,” in G. Dosi et al., Technical Change
and Economic Theory, New York: Printer Publishers, pp 221-238. Dibrell C.Clay & Miller Thomas R(2002), “Organization design: the continuing influence of
Information Technology”, Management Decision, 40/6, pp 620-627. Drucker, P.F.(1982), “New Templates for today’s organizations”, Harward Business Review,
Jan-Feb, 1972. Dhar, Vasant, and Roger Stein (1997) “Intelligent Decision Support Methods. Upper Saddle
River. Prentice-Hall, U.S.A. Earl, M., Edwards B., & Feeny, D. (1996), “Configuring the IS Function in Complex
Organizations,” Information Management”, The Organizational Dimension edited by Earl, M., pp201-230, Oxford University Press, Great Clarendon Street, Oxford, NY.
Evan, P.B. & Wurster, T.S (1999), “Getting real about virtual commerce”, Harward
Business Review, pp. 84-94. Farrbey, B, Land, F, Target, D(1994), “A taxonomy of information systems applications: the
benefits’ evaluation ladder”, European Journal Information Systems, 4, pp 41-50. Fayad, Mohamed, and Marshall P. Cline (1996), “Aspect of Software Adaptability”.
Communications of the ACM 39. no. 10. Fazio Maruca,R(2000), “Are CIOs Obsolete?”.Harward Business Review. Mar-Apr pp 60-63.

72
Flynn, Jim, and Bill Clarke (1996), “How Java Makes Network Centric Computing Real”, Communications of the ACM 39. no. 10.
Forsund, Finn R., Nikias Sarafoglou(1998), “The Diffusion of Reseacrh of Productive
Efficiency: The Economist’s Guide to DEA Evolution”, Discussion Paper no. D-02/1999, Department of Economics and Social Sciences, NLH.
Frenzel Carroll W.(1999), “Management Of Information Technology”, 3rd edition. pp 10,
23,132. Franklin, C.F.Jr(1997), “Emerging Technology: Enter the Extranet”, CIO Magazine, May 15,
Available online: www.cio.com/archive/051597_et_content.html. Gasos J. & Thoben K.D(2003), “E-Business Applications”, Springer-Verlag, Berlin
Heidelberg, Germany. Gates, Bill(1997), “The digital Nervous System. Extract from a speech at the Microsoft CEO
Summit in Seattle, Washigton on 8th May 1997. In Web-Weaving, Intranet, Extranets and Strategic Alliances.” (Lioyd and Paula Boyle eds.) pp 271-281.
Gates, Bill(1999), “Business at the speed of thoughts”, Penguine Books, London. Gilgeous V. & Gilgeous M(2001), “A survey to assess the use of a framework for
manufacturing excellence”, Integrated Manufacturing Systems Journal,12/1, pp48-58. Greengard, S.(1998), “How technology will change the workplace”, Workforce, Vol 77,
pp78-84. Gouillart, Francis, J. & Kelly James N.(1995), “Transforming the organization”, New York,
NY, McGraw-Hill, Inc. Gordon, J.R(2002), “Organiztional Behaviour: A Diagnostic Approach 7th edition”. Upper
Saddle River, N.J., Prentice Hall. Pp477. Gunasekaran, A. & Nath, B(1997), “The role of Information Technology in business process
Reengineering”, International Journal of Production Economics, 50(2/3) pp 91-104. Gupta Uma G.(2000), “Information Systems: Success in the 21st Century”, Prentice Hall
International U.S.A. pp. 17, 360-372. Hall, G., Rosenthal, J., Wade, J(1993), “How to make re-engineering really work”, Harward
Business Review, Vol 71, no. 6, pp. 119-131. Harrington, H.J(1991), “Business Process Improvements”, McGra-Hill, New York. Hammer, Michael(1990), “ Reengineering work:Don’t Automate, Obliterate.”, Harward
Business Review Vol 68, no 4. pp. 104-112.

73
Hammer, M., Champy, J, (1993), “Reengineering the Corporation- A Manifesto for business Revolution” Harper Business, New York. Pp. 31-51.
Hedelin, L.& Allwood C.M(2002), “IT and strategic decision making”, Industrial
Management & Data Systems, Vol 102, no 3, pp. 125-139. Henderson, J.C (1993), “Strategic alignment: Leveraging Information Technology for
transforming organizations”, IBM Systems Journal, pp 4-16. Hitt, L.M and Brynjolfsson, E(1997), “Information Technology and internal firm
organization: an exploratory analysis”, Journal of Management Information Systems, Vol. 14, no 2, pp81-101.
Hoos, I.R (1980), “When the computer takes over the office”, Harward Business Review, pp
102-112. Huff, S.L.(1992), “Reengineering the business”, Business Quarterly, Vol. 56, no. 3, pp38-42. Ives B. and Learmonth, G.P (1994). “The Information System as a Competitive Weapon”,
Communications of the ACM, 27(12), pp1193-1201. Ives, B., & Jarvenpaa, S.L(1994), “The global network organization of the future:
information management opportunities and challenges”, Journal of Management Information Systems, Vol 10, no. 4, pp. 25-57.
Kanter, R.M. (1989),”The new Managerial Work”, Harvard Business Review”, pp 85-92. Karake Zainab A. (1994) “Relative Information Technology Index: IT performance,
Company Control and Governance”, Logistics Information Management , Vol 7, no 4, pp 6-14.
Kelley, M. R (1994), “Productivity and Information Technology: The elusive connection”,
Management Sciences. 40(11), pp 1406-1425. Keen, P.G.W(1991), “Shaping the future: Business Design through Information
Technology”, Harvard Business School press, Bostan, MA. Keen, P.G.W (1995), “Every manager’s Guide to Information Technology.”, Harvard
Business School Press. Kendall & Kendall (1999), “Systems Analysis & Design”, Prentice Hall International Inc.
New Jersey, U.S.A. pp 134. King, John. (1984), “Centralization Vs. Decentralization Computing: Organizational
Considerations and Management Options.”. Computing Survey. King, W.R., Teo, T.S.H.,(1996), “Key dimensions of facilitators and inhibitors for the
strategic use of Information Technology”, Journal of Management Information systems, Vol 17. pp5-53.

74
Korson, Timothy D., And Vijay K. Vaisnavi. (1992), “Managing Emerging Software
Technologies:A Technology Transfer Framework”Communication of ACM 35. no. 9. Lal, M.(1991), “Organizational size, structure of activities, and control information system
sophistication levels: an empirical study”, Management International Review, Vol 31, no 2, pp 101-113.
Laudon, Kenneth C. & Laudon, Jane P. (1998), “Management Information Systems,” Fifth
edition, Prentice Hall, Inc. New Jersey. pp. 189,334. Laudon, Kenneth C. & Laudon, Jane P. (2005), “Management Information Systems:
Managing the digital firm”, 8th edition, Prentice-Hall, Inc, New Jersey, pp78,84,261, 424-430.
Leon Alxis & Leon Mathens(2002), “Fundamentals of Information Technology”, Vikas
Publishing House, New Delhi. Pp47. Long Larry and Long Nancy (1999), “Computers”, Prentice Hall Inc. U.S.A. Loveman, G.W(1994), “An assessment of the productivity impact on information
technologies”, Research Studies, MInformation Technology Press, Cambridge, MA, pp 84-110.
Love, P.E.D; Gunasekaran A.(1997), “Process reengineering: a review enablers,”
International Journal of Production economics, 50, 2/3, pp183-197. Mahmood, M.A & Mann, G.J. (1993), “Measuring the organizational impact of Information
Technology investment: An exploratory study”, Journal of Management Information Systems. 10(1), pp97-122.
Mahmood, M.A & Mann, G.J. (2000), “Special Issue: Impacts of Information Technology
investment on organizational performance,” Journal of Management Information Systems pp.3-10.
Mahmood, M.A and Soon S.K(1991), “A comprehensive Model for measuring th ptential
impact of Information Technology on Organizational Strategic Variables”, Decision Sciences, 22(4), pp 869-897.
Mandel, M.J(1994), “The information revolution”, Special report, Business week, June 13,
1994. Marakas George M(2004), “Decision Support Systems in the 21st Century”, 2nd edition.
Prentice-Hall India, pp1-10,89-95,172-228,573-590. Mayer, Jermey(2002), “A short history of the computer”, www.softlord.com McClenahen J.S(2000), “Unstoppable improvement,” Industrial Week, pp85-95.
75
McFarlan, W.E (1984) “Information Technology changes the way you compete”, Harvard Business Review, pp 98-103.
Mckeen James and Heather Smith (2003), “Whither IT? A look at IT in 20005”, IT
Management, Butterworth-Heinemann, U.K. Mehta Kamlesh T. & Shah Vivek(1998), “Workforce, Information Technology and global
unemployment”, Industrial Management & Data Systems, Vol 98, no. 5, pp. 228. Meyer, M.W. (1986), “Automation and Bureaucratic Structure,” American Journal of
Sociology, pp. 256-264. Morton, S.M(1998), “The Corporation of the 1990s: Information Technology and
Organizational Transformation”, Oxford University Press, Oxford. Morton, M.S. Scott (1988), “Information Technology and Corporate Strategy”, Planning
Review, Sept-Oct, pp 28-31. Michalak S.C, Julio C.F, and Clifford J. D(1999), “Decentralized Information Technology
requires Central Coordination”, Cause/Effect Journal, Vol. 22, no 4 pp. 1-7. Mitra, S and Brendt, E.R(1990), “Analyzing cost-effectiveness of organizations: the impact of
Information Technology spending”, Journal of Management Information Systems. Vol 13, no 2, pp 29-57.
Moreton, R. & Chester, M. (1997), “Transforming the Business: The IT Contribution”,
McGraw-Hill Publishing Co, England. Myers, B, L, Kappelman, L.A & Prybutok, V.R. (1998) “A Comprehensive Model for
Assessing the Quality and Productivity of the Information Systems Functions:Towards a theory for Information Systems Assessment”. Hershey, PA:Idea Group Publishing.
Nance, Barry. (1992), “Windows NT and OS/2 compared”, Byte. pp 31-33. Naisbitt, J. & Abardenes P.(1985), “Reinventing the Corporation”, Warner Books, New
York. Nord Jeretta H. & Nord G.D(1995), “Why Managers use executive support systems”,
Industrial Management and Data systems, Vol 95. no. 9. pp24-28. Nunamaker, Thomas R(1985), “Using data enveloping analysis to measure the efficiency of
non-profit organizations: A critical evaluation” Journal of Managerial and Decision economics”, Vol 6, pp50-58.
Olalla, Marta Fossas(2000), “IT in business process reengineering”, International Advances
in Economic research”, Vol. 6, issue 3, pp581-590.

76
Oldach S.H, Lewis P.R & Luftman J.N(1993), “Transforming the enterprise: The alignment of business and Information Technology strategies”, IBM Systems Journal, Vol 32, no. 1. pp198-221.
Olson M.H.(1982), “New Information Technology and Organizational Culture”, MIS
Quarterly, Vol. 6, Special Issue, pp 71-92. Oliner, S.D., and Sichel, D.E.(2000), “The resurgence of growth in the late 1990s: Is
Information Technology the story?”, The journal of Economic perspectives, 14(4), pp 3-22.
Oz, Effey(2002), “Management Information Systems”, 3rd edition, Course Technology-
reprinted by Thomson Asia Ltd. Singapore. Pp267-271, 166-204, 210-224, 353-391. Parthasarthy, R and Sethi, S.P. (1993), “Relating strategy and structure to flexible
automation: A test of fit and performance implications”, Strategic management Journal, 14(7). Pp 529-549.
Peter G.W. Keen (1993) “Information Technology and the management difference: a fusion
map – Technical”, IBM Systems Journal, pp 61-93. Porter, M.E. and Miller, V.E. (1985), “How information gives you competitive advantage”,
Harward Business Review, 63(4). Pp 149-160. Poku K & Vlosky R.P(2002), “A model of the impact of corporate culture on Information
Technology adoption”, Working paper no 57, School of Renewable Natural resources, Louisiana State University Agriculture Centre, Baton Rough, LA.
Pugh, D.S,Hickson, D.F and Turner, C. (1986) “Dimensions of Organizational Structure”,
Administrative Sciences Quarterly, pp. 65-105. Ramesh Chandra(2003), “Information Technology in 21st Century”, Kalpag Publication, New
Delhi, 2003. PP 71. Ray Ajoy K & Acharya Tinku(2004), “Information Technology-principles and Applications”,
Prentice-Hall India, pp4,47-72,151-166,437-454,455-471. Reynolds George W.(1995), “Information Systems for Managers”, 3rd edition, West
Publishing Company. U.S.A, pp. 2-23, 65-138,186-277. Robey. D. (1977), “Computers and Management Structure: Some Empirical findings
Reexamined”, Human Relations. Vol. 30. no. 11 pp. 963-76. Rockart, J.F & Short, J.E (1989), “IT in the 1990s:Managing Organization
Interdependence,” Sloan management Review, pp 7-17. Rockart, James E., and Michael E. Treacy (2002). “The CEO goes On-line”. Harvard
Business Review.

77
Rumizen, M.(1998), “Site Visit: how Buckman Laboratories’ shared knowledge sparked a chain reaction”, Journal of Quality & Participation, Vol 21, pp34-38.
Savoie, M.J & Raisinghani, M, S(1999), “Identifying Future Trends in Information
Technology”, Industrial Management & Data Systems, Vol 99, no 6, pp. 247-250. Schiesser Rich(2003), “IT systems Management”, Perntice-Hall India, pp3-28,31-41,71,169-
192,235-247,375,383. Seddon Peter B, Sandy Staples, Patnayakuni Ravi Bowtell(2003) “Dimensions of Information
Technology success in efficient management”, Communication of the Association for Information Systems”, Vol 2, pp 38-59.
Segars, A.H. and Grover, V. (1995), “The industry-level impact of Information Technology:
An empirical analysis of three industries.”, Decision Sciences. 26(3), pp337-368. Schmidt, J.B, Montoya-Weiss, M.M. and Massey, A.P. (2001), “New product development
decision-making effectiveness: Comparing individuals, face-to-face teams, and Virtual teams”, Decision Sciences, 32(4), pp 575-600.
Shelly G.B, T.J.Cashman, M.E. Verment(2004), “Discovering Computers:A gateway to
information Web Enhanced”, Thomson Course Technology Boston, U.K Srinvasan, K, Jayaraman, S, (1999), “The changing role of Information Technology in
manufacturing”, IEEE Computer, 32, 3, 42-49. Stress R.M(1986),“When is an organization effectiveness”, Organizational Dynamic,pp50-63 Stump, R.L., Sriram, V.(1997), “Employing Information Technology in purchasing: buyer-
supplier relationships and size of the supplier base”, Industrial Marketing Management, 26, 126-36.
Spilling Pall & Lundh Y.(2004), “Features of the Internet history”, 100th Anniversary Issue-
Perspective in Telecommunications, Telektronikk, Vol 100, no. 3, pp113-133. Spence, W.R.(1994), “Innovation: The communication of Change in Ideas, Practices and
Products”, Chapman & Hall, London. pp171. Strassman, P. (1985), “Information payoff”, free press, New York, pp 5-38. Sushil, Aleem A & Agrawal V.K(2003), “The contribution of IT to critical response
activities in business transformation”, Working paper, Indian Institute of Technology, Dehli, India.
Tofallis, C(1999), “Model building with multiple dependent variables and constraints”, The
Statistican, 48(1/2): pp183-210. Vassiliou, Yannis, (1985), “On the interactive use of databases: Query Languages.”, Journal
of Management Information Systems.
78
Varian Hall(2002), “Future of IT”, Newsweek special issue, 2002. Venkatesh, V., & Davis F.D. (2000), “A theoretical extension of the Technology Acceptance
Model,” Journal of Management Sciences Vol. 2, pp. 186-204. Wantson R. & Myers M.D(2001), “IT Industry success in small countries”, Journal of Global
Information Management, Vol. 9, no 2, Idea Group Publishing. Pp 71 Walrad, C,. & Moss, E. (1993), “Measurement: The key to application development quality”,
IBM Systems Journal. 32(3), pp. 445-460. Wheelen T.L and Hunger J.D(2000), “Startegic Management”, 7th edition, printice Hall,
U.S.A, pp231-235. Whitman, U.E. & Gibson, M.L(1997), “Factors Affecting the use of IT in business process
reengineering”, Information Resource Management Journal, 10,3, pp5-16. Whisler, T.L. (1970), “The impact of Computers on Organizations”, Praeger Publishers, New
York. NY. William, B.K & Sawyar, S.C(2005), “Using Information Technology”, 6th edition, McGra-
Hill Publishing Co. U.S.A, pp 3-4,147, 446-457. Winter, S, & Taylor, S, (!996), “The role of IT in the transformation of work: a comparison
of post industrial, industrial, and proto-industrial organization”, Information Systems Research, 7, 1, 5-21.
Witzel M(1998), “Dictionary of Business and Management”, Thomson Learning Inc. U.S.A.
pp41-45. Woodward J. (1965), “Industrial Organization: Theory and Practice”, Oxford University
Press London. pp 71-79, 174-176. Wetherbe J, Turban E, & Mclean E(1999),”Information Technology for management:
Making connections for strategic advantages”, 2nd edition, New York, NY: John Wiley and Sons Inc.
Yuchtman E. and Seashore S.E(1967), “A system resource approach to organizational
effectiveness”, The Wharton Financial Institutions Center. Zee, Han, V.D(2002), “Measuring the value of Information Technology”, IRM press, U.S.A,
pp 7, 47-48,64,67-70,82,86

79
Chapter
Information Technology In Pakistan Introduction
3.0.1 Information Technology is the key enabler of change in today’s rapidly evolving
business environment. IT revolution has changed the life style of people in every part of the
world. It has eliminated the geographical distances and due to advance communication
facilities, the entire world can be viewed on computer screen by just a click of a button. IT is
the major contributor to the progress of the developed countries. The effective use of IT is an
essential element of competing in a fast-paced, knowledge based economy. IT ‘cross-cuts’ all
operational functions within the organization and acts as the fabric that knits together
business processes. Today governments and private companies around the world are working
on IT solutions required for their growth. This technology has emerged as a very fast growing
sector in Pakistan as well and obviously IT sector is a deep resowant sound. With continuous
and concerted patronage of the government, there has been unmatched development in IT
infrastructure in the recent years. The government, in the IT sector, is making sizeable
investments and a huge chunk of this budget is meant for human resource development and
provision of enabling infrastructure. Majority of the organizations working in Pakistan are
making use of IT to increase their performance but of course there is a performance variance
among different industries.
This chapter presents discussion on Information Technology status in Pakistan. It consists of
two sections. Section I examines IT history in Pakistan, Pakistani Government contributions
to support IT diffusion in the country, IT usage in Pakistan industry and Pakistan IT
infrastructure i.e. Pakistan’s hardware and software industry, status of Internet, E-Commerce,
Human Resources and Telecommunication in Pakistan. It also discusses growth and
potentials of IT in Pakistan. Section II first brings into prominence the importance of IT
usages in business organizations and then it leads to the core areas of research and discusses
IT usage in Pakistan’s Manufacturing and Banking Industry.
3

80
Section I
Information Technology Status in Pakistan
Historical Development
3.1.1. Pakistan is a developing country. It got its independence on 14th August 1947 as a
result of the division from the former British India. It encompasses 796,095 Square. km
with about 152.53 Millions population9. Pakistan is the first 5 in GDP in Asia and top 10
in total economic development in Asia. It is the 7th most populace country in the world,
stands at 147th place in the literacy rate, 128th place as per the Human Development index
and 132nd position on GDP per capita basis among a total of 160 nations10.
Pakistan is on the wake of its progress. In development, adoption and diffusion of
technology, it has been facing the same problems like other developing countries. As it
depended on the technologies mostly transferred from the developed countries. At the
time of inception of Pakistan in 1947, there was no base of Information Technology in
the country. The office work was carried out manually and office documents were
prepared on manual typewriters. There was not even a single electric typewriter. Post,
telegram and telephone department (PT&T) established during British rule in 1885 was
already working in the areas that came under the jurisdiction of Pakistan. At that time the
only fastest communication link available was through telephone and telex.
The process of computerization in Pakistan started in 1957, when a company named
‘Packages Ltd.” started using computer for its work. It is considered the first company in
Pakistan, which started using computer11. In 1960 an IBM main frame computer was
installed in PIA for flight reservation and by 1967, there were about 17 mainframes
working throughout Pakistan in different organizations (Aslam, 2001).
9 www.pakistan.gov.pk 10 The Dawn, January 23, 2006. 11 Zaidi and Naeem (2001), “Growth of IT education in Pakistan”, Pakistan & Gulf Economist, September 24-30, pp 28. and www.moitt.gov.pk

81
The IT met slow introduction in Pakistan right from beginning because in the initial
period of 1960s, the import of computers was not opened and it used to take almost two
years for a software company to get import license from Government of Pakistan. The
custom duties and other import taxes on computers/electronic items were also very high.
It was an era of mainframe computers and prices of computers were very high. Because
of high import taxes and customs duties, the purchase of computers was out of the reach
of even government departments with huge budgets (Mahmood, 2006).
In 1964, Water and Power Development Authority (WAPDA) took the lead and
established its computer center in WAPDA house, Lahore by installing IBM-360
mainframe computer. Then after the main commercial banks in private sector i.e. Habib
Bank, United Bank and Muslim Commercial Bank started acquiring computers to
regulate their banking work. Quaid-e-Azam University Islamabad, Atomic Energy
Commission and University of Engineering & Technology, Lahore and PIA-Karachi also
acquired IBM Mainframe Computers. At that time, International Business Machines
(IBM) was the biggest computer company in Pakistan and IBM-360 & 370 models of
mainframe computers were popular during 1960s & 1970s. A British computer company
named as International Computers Limited (ICL), also started selling mainframe
computers in Karachi, Lahore & Islamabad. KPT, KESC, Karachi Gas, PNSC, AIOU &
State Life Insurance Corporation were some of the organizations that purchased ICL
mainframe computers. National Cash Register (NCR) was the 3rd biggest IT Company in
Pakistan to sell computers especially the data entry machines at that time(Aslam, 2003).
In software development side in 1977, the first private software company “Systems
Private Limited”12 was formed by “Packages Limited” in Lahore. In 1980s, the personal
computers brought a revolution not only in the world but also in computing environment
of Pakistan. The technology was miniaturized and desktop computers were introduced
having cheapest technology (Ghauri, 2003).
12 www.systemsltd.com.pk, www.moit.com.pk, The Dawn, 02.04.2006
82
As in the advanced world the governments had influenced the use of IT through its role
as investor, as a consumer, and as a strategist or a regulator, the government of Pakistan
too, after realizing the IT benefits, has been playing all these roles in the country.
Implicitly, through its investments and consumption activities, or exploiting through
“National Strategies”, the government has been trying to determine the pace of IT usage
in the country.
Imam(2002) demonstrates that as the advent of IT euphoria has taken over the policy
makers and masses in the world, in Pakistan too, realizing the global revolution in IT, the
Government of Pakistan liberalized the hardware & software imports in 1985. The
custom duties on electronic goods were reduced drastically due to which personal
computers flooded the hardware markets and people started using personal computers in
offices and homes. In 1990s, the P.C servers became stronger & stronger and started
replacing Mini & Main frame computers in offices. The network technologies started
flourishing and the Main frame & Mini computers started vanishing from the offices and
were replaced by P.Cs & P.C Server LAN environments.
In 1991-92, heavy custom duties on computers were completely removed. The real
quantum jump was experienced in early 90s, which can be termed as IT revolution in
Pakistan as satellite communication technology was introduced. In 1991, 90% telephone
lines were converted to digital. In 1995, Internet Service Providers (ISPs) started
providing Internet facility to Internet users and now with rapid growth there are more
than 132 ISPs in operation all over the country providing internet facility to more than
3,000,000 users13.
It is all in 2000s, that the government gave a lot of emphasis to IT Sector. New IT
educational institutes are opened and IT professionals are hired to impart IT training in
universities. Nationwide IT seminars, forums, exhibitions and competitions are being
arranged to create IT awareness among the people. Computer as a subject has been
introduced in schools & colleges. Cyber Cafes are opened to create awareness for Internet
13 www.moitt.gov.pk

83
use. Telephone network has been enhanced and in rural areas, telecommunication
facilities are being provided through small exchanges and PCOs. Links between Pakistan
and other countries have been improved significantly (Imam 2002, Aslam, 2001a).
Recent Developments
3.1.2. As discussed, computer is introduced in Pakistan though in 1960s but its use was
restricted to scientific purpose and to some extent for processing of data relating to
traditional accounting, billing, payroll, and inventory control systems in very large
organizations. The massive computerization in the country started after 1980s when most
of the companies started using computers for their business growth. They started using
computer for other functional areas, in addition to the areas mentioned above. The
government started fully backing computer use at the same time.
The government of Pakistan is taking all steps to make Pakistan an IT super power by
adopting IT as a national program so as to enable personal and national growth. The
country’s current IT policy and action plans intend to involve all walks of life, e.g.,
industry and commerce, banking and insurance, finance, revenue, communication, media,
human resource development, and defense etc.(Rehman,2001).
The computerization in the country initially was monitored by the Ministry of Science &
Technology(MOST). The national focal point for IT, which was previously missing of
diffused, was rectified with the creation of new IT and Telecommunication Division in
March, 2000 under Ministry of Science and Technology (MOST). All IT related
organizations were placed under this Division. The MOST was constituted of two
divisions i.e. Science and Technological Research Division (S&TR) and IT & Telecom
(IT&T) Division. The S&TR Division was focused on Science and Technology areas
other than IT & Telecommunications. But in November 2002, a separate ministry for
Information Technology was created and IT & Telecommunications Division became a
part of Ministry of Information Technology (MOIT). The principal agenda of the
Ministry of Information Technology (MOIT) is, building Pakistan’s IT competency in the
twenty first century. Its major objectives are: Transformation to Electronic Government,

84
Development of software Industry, Building a state of art Infrastructure and Development
of a qualitative pool of Human Resource14.
Ministry of Information Technology (MOIT) is the national focal ministry and enabling
arm of the Government of Pakistan for planning coordinating and directing efforts to
initiate and launch IT and Telecommunication programs for economic development of
the country. It is working on national agenda to have a sound and sustainable Information
Technology and Telecommunications base which will result in the socio economic
development of the country and the attainment of the vision for better Pakistan. The
Ministry is maintaining firmness and viscosity with the policy and achievements made in
the IT and telecommunications sectors since its inceptions and to cope with modern
challenges and meet requirements of the IT and tele-communications, the policy is
regularly updated. Many other departments/ institutions like Electronic Government
Directorate, Pakistan Computer Bureau, Pakistan Software Export Board, Pakistan
Telecommunication Authority, Computer Society Of Pakistan, Pakistan Software Houses
Association (PASHA)15 etc. are working side by side the Ministry of Information
Technology to help forward IT in the country(NET Mag Cover Story, 2005).
Pasha(2005) also discusses some more efforts of the governmental for uplift of IT in the
country. He argues that the IT has become the focal point of the government now. The
government has set up technology parks and IT boards in all provinces to promote
economic growth in IT enabled services sector. New IT institutions are also being
established in the country and separate IT directorate at each district level has also been
set up to diffuse IT in each department. The government has also started at mass level a
talent hunt program to attract IT experts to work for Pakistan. A handsome budget has
been allocated for the young graduates for local and overseas advance IT education and
training. To promote and implement e-Government concept, computer training and
education for every government employee has been made compulsory in federal
14 www.moitt.gov.pk 15 PASHA is a representative body of software developer of Pakistan. It was found in late 1992 by 9 software hoses and now have about 350 members national wide: www.moitt.gov.pk
85
ministries and record of all ministries and departments is now being computerized on
priority basis.16 IT has now been inducted at all level of government.
To embark upon an aggressive program to improve efficiency and provide quality
services to the citizen of Pakistan, in line with their efforts to improving organizational
performance and achieve high standard of work ethics, P.T.A, C.B.R and S.E.C.P and
various other public organizations have started to automate all their operations. Key
projects landed include citizen online, electronic processing of internal files, e-filing of
income tax return, electronic government projects and e-Commerce networks. To provide
protection and enhance the confidence of users, providers and facilitators of information
services, legislation based on the recommendation of the working group comprising IT
and legal experts have been framed. Action in the area of digital signature act intellectual
property and copy rights act and the consumer protection act has been started(Kazmi,
2005, Ismail, 2003).
As argued by Osama(2005), the IT revolution is the fastest emerging revolution seen by
the human race and the Internet surpasses all. Electricity was first introduced in 1873 and
it took 46 years for its mass scale use, telephone introduced in 1876 and took 35 years for
mass use. Television introduced in 1926 took 26 years for mass use. PC introduced in
1975 took 16 years, mobile phone in 1983 took 13 years for mass use while the web
introduced in 1994 took only 4 years for mass use17. The IT revolution thus has given a
new vision of the future. It is estimated that in Pakistan presently there are around 2,100
mainframe and minicomputers in the country with nearly half of them are in the
Government sector. Liberal import policy and reduction/removal of duties have led to a
burgeoning usage of PCs and servers. It is estimated that nearly half a million PCs are
added each year, representing a three fold increase in annual volume over the decade
straddling the 21st Century. Analysts estimate that this rate of growth could very well
quadruple by the end of 2010. The Federal Government of Pakistan has laid great
16 A decision taken in the first meeting of National E-Government Council under president ship of Prime Minister of Pakistan Mr. Shaukat Aziz on April 27, 2005. (The Jang, April, 28, 2005). 17 Kofi Annan, Secretary General U.N, commented on 17th May, 2004, on world telecommunication day.

86
emphasis on expedition towards the intensity of Information Technology in a variety of
fields.(Ghauri, 2003; Pasha, 2005).
Kazmi(2000) rightly noted that in Pakistan, IT is becoming a necessity. The market of
Pakistan today buzzes with IT activities and the current boom in IT dates back to early
1996 with introduction of Internet which opened up a communication channel between
Pakistan and rest of the IT world and there has been no looking back since.
To conclude all above, it can be said that the Government of Pakistan now is giving all-
out support and push to IT sector. Millions of dollars are being invested by the
Government in IT, and majority being spent on human resource development and
enabling infrastructure provision. The Government of Pakistan is leading the technology
revolution in the country in various projects aimed at improving infrastructure, human
resource development and integrating IT in the public and private sector.
Pakistan’s Information Technology Infrastructure
3.1.3 IT as discussed earlier today encompasses a wide range of areas and covers a whole
gamut of hardware, software, networking producers & services and telecommunications
technologies (William and Sawyar, 2005). IT thus is a hybrid technology that results
from a synergy between telecommunications infrastructure, software & hardware
development, standards and human skills. Infrastructure of IT sector in Pakistan consists
of following segments(Imam, 2002);
a. Hardware & Software
b. Telecommunication
c. Human Resources
As William and Sawyar(2005) comment that an established IT infrastructure is a
necessity for development of an organization and a country thereof, so is the case for
Pakistan development. All the developed countries have well established IT infrastructure

87
and self-sufficiency in all IT tools but underdeveloped countries like Pakistan are still
striving to have most of them. Many developing countries lack the required IT and
telecommunication infrastructure to become true IT user. Therefore, to cope with the
rapidly advancing IT world during last ten years, Pakistan has been developing IT human
resource and necessary infrastructure. With the continuous efforts and patronage of the
government and private companies, IT is considered to be in the take off stage and is
catching up with the regional and global industry18. This technology has emerged as the
fastest growing sector in Pakistan now(NetMag August, 2005).
The ensuing discussion highlights the salient features of IT infrastructure of Pakistan. It
thorough light on all segments of Pakistan’s IT sector i.e. IT Hardware & Software,
Telecommunication, Internet and Human Resources.
Hardware Industry in Pakistan
3.1.3.1. Gupta(2000) defines computer hardware industry as “designing, development,
manufacturing and maintenance of all products, modules and components that form the
building blocks of an IT infrastructure”. A thriving hardware industry is pivotal to the
growth of IT infrastructure and services. Computer hardware manufacturing is extremely
capital-intensive industry. This is a relatively young industry, and is facing lot of
problems with regards to getting recognition in computer manufacturing in Pakistan.
Khan(2004) demonstrates that presently, there is no computer hardware manufacturing
activity in Pakistan in true sense. The reason is that imported hardware components are
available in abundance and on fairly cheaper rates. Especially after the emerging of China
as a big computer hardware manufacturer and supplier, the prices of hardware
components have been reduced. In this scenario, the computer hardware manufacturing in
Pakistan is currently not feasible. Khan(2001) further adds that hardware industry is
profitable if it works on economy of scales, which depends upon vast markets. In
Pakistan, the market is negligible for hardware consumption and it will not be
competitive with China, so this industry has not reasonable prospects in Pakistan to
18 “Pakistan to hold global IT moot”, The Nation, 23rd May, 2002.

88
develop & flourish at present. Another researcher Ghauri(2006) argues that there is also
no much encouragement by the Government for consumption of locally manufactured IT
products as China. Mostly the computer vendors are assembling the imported parts and
components to produce the personal computers. Some companies like INBOX,
RAFFLES, MICRO PAK etc. have developed organized assembly lines and are
producing small components like casings of PCs. and M/s Enabling Technologies are
doing some hardware designing activity(Khan & Shah, 2004; Ghauri, 2006b; Money
plus, 2006).
Software Industry in Pakistan
3.1.3.2. Software is Information Technology’s Achilles heel. Software Industry in
Pakistan has developed a lot during last ten years. Due to liberalized IT policy, a
mushroom growth of software houses has been registered in IT sector. The Government
of Pakistan is taking very significant steps to develop IT culture in Pakistan and lots of
incentives have been given to software houses to start software business. In a short period
of three decades, computer science has developed from a branch of electronics to one of
the largest engineering disciplines itself. IT now consists of many branches and software
engineering is considered to be the largest. The reason for the rapid growth in the demand
for software development is lead by the widespread use of computers in everyday life,
evolution of high-powered general-purpose computers and low cost of maintaining,
debugging and duplication of software products. The potential in the field of software
development is still growing worldwide and is expected to continue to grow for decades
to come19(Imam, 2002).
The computer software can be grouped into two types i.e 1) Systems Software(Operating
systems etc. and 2) Application Software(Business programs etc.) (Shelly et.al, 2004). In
Pakistan system software for micro, mini and mainframes comes largely of the packaged
variety from the vendors who supply hardware to the companies or in some case these
software are imported directly from the producing firms, which all are based in developed
countries. Except one or two (Urdu version of a typing software), most of the operating
19 “Software exports booming”, 2001, The Business Recorder, 31st May, 2001.

89
systems and languages/packages are being imported from developed countries. As far as
application/business software development is concerned, there are lot of development
activities in Pakistan. According to conservative estimates, there are about 660 software
houses based in Pakistan which are busy in developing and exporting software to the
developed world in areas as diverse as database management, Internet applications, e-
Commerce, CAD/CAM management systems, etc. The fields in which these companies
are involved are virtually unlimited. More and more opportunities are being thrown open
to them every passing day as their skills, potential and strategic advantages are getting
accepted in major software markets around the world including but not limited to USA,
UK and the rest of Europe, South Africa, Japan and Australia20. But this is only the tip of
the iceberg, as vast potential still exists for the local IT industry to become a formidable
force in the global arena. So the Government is taking all possible measures to spur
activity in the IT sector and the framework is now more conducive than ever before for
investments in the sector.
The software industry has become one of the fastest growing industries in the world,
capturing billions of dollars in the global market. Its contribution to the socio-economic
development of the country is also very significant, especially for the developing
countries. So realizing this importance of the Software Exports, the Government of
Pakistan has established Pakistan Software Export Board in 1995, with main objective of
encouraging software exports in the country. Taking a step further the Government
declared the Computer Software Information Technology as “Industry” by a notification
in March 1997. The Software Houses, though established in the 80s, but software market
in Pakistan came in the limelight in early 1996 with the introduction of Internet which
opened a communication channel between Pakistan and rest of the IT world (Khan and
Shah,2004).
The Government of Pakistan has extended very liberal fiscal and monetary incentives for
software exports. With the efforts of PSEB, software exports are now picking up and it
20 Federal Bureau Of Statistic(2002), “Census Of Software Industry and related services of Pakistan”, reproduction and printing unit, FBS, Karachi, Pakistan.
90
has gone up to US$ 32.88m during 2003-2004 from US$22.62m during year 2001-200221
and it has further grown upto US$ 48.50m during 2004-2005 (Ayub, 2006). This vibrant
sector has set an export target of $70m during the current financial 2005-2006 year22.
Ahmad(2005) estimates that Pakistan has worth US$50-100M software industry and this
software growth in the country has been contributed to the liberal and supportive polices
of the government. Ismat and Hasan(2005) say that the ability of Pakistan to produce
quality software is 1) its abundant pool of IT professionals 2)emphasis on software
quality and well-managed processes. Currently though a few software companies have
either ISO 9000 or CMM(Capability Maturity Model) certifications but this number is
being increased. The quality of Pakistan's IT technicians is not always of the desired level
because a number of substandard training institutions claiming to be training people in IT
have mushroomed all over but they actually teach very little. However, the government is
aware of these constraints and deficiencies and is trying to remove them to improve the
overall training facilities (Khan, 2005).
Since the declaration of the IT sector as an industry, the Government is giving significant
benefits to this industry to promote investment and it has positive results. Although some
of the top names like IBM, NCR and Siemens are present in the country for decades, the
world wide boom in IT, especially in the 1990s spurred investment by many other
companies from North America, Europe and the Middle East. These companies were
looking for a well-fitted environment for their operations at a lower cost margin. In
Pakistan they have found a suitable climate with highly qualified individuals to help them
grow their businesses internationally23. Ghauri(2006b) says that companies are making
heavy investments to benefit from emerging technologies in hardware, software and
communications areas. As a result Pakistan in recent years has seen considerable growth
in its IT sector. It is at the forefront of this industry with more than two million computer
literate people and a state of the art infrastructure. But a researcher Kolachi(2004) argues
21 1. “Fifteen year IT relief to software exports(2001), The Business Recorder, 21st May 2004. 2. “IT relief to software companies to help boost forex earnings(2005), The Business Recorder, 18th May. 22 These are estimated figure of PSEB, as State Bank of Pakistan claims with reference to PSEB that since export of IT is not carried out through the formal letter of credit. 23The Business Recorder “Private sector urged to play role in promoting IT(2001), 6th May, 2001.

91
that at the same time a lot more than innovation is required for strengthening the
computer software industry. The Pakistani IT industry centers on a strong national
revolution towards developing the country as a major player in the international forum.
Support programs from the Government coupled with an established private sector are
creating many opportunities for realizing this goal. IT professionals trained in a variety of
disciplines from abroad and locally are applying their innovative ideas to maximize the
benefit obtained from the information revolution24. More and more international
companies are seeking solutions from Pakistani professionals to remain competitive in
the global economy. Kolachi(2004) with the shrinking global scenario suggests that,
Pakistan urgently needs to further revolutionize its IT sector.
Another researcher Ghauri(2006b) is also of view that there is more need to improve
quality of Pakistani software and timely completion of projects. In his recent survey on
Pakistani software usage, he found that some companies are reluctant to use Pakistani
software because in few systems, there were horrifying statistic for the number of
software systems which are delivered too late for use or with so many bugs (errors) that
they are unserviceable or a proportion of the systems do not carry out the task for which
they are designed. Ghauri(2006b) says that the fault lies both with the software industry,
which is still an amateurish, craft-based discipline, and with the customers who rarely
know what they want of a computer system or how to specify it. Much of the
dissatisfaction with IT is the result of software-late, inappropriate or useless and there is
need to overcome these problems he adds. Hydir(2006) notes that with all efforts of the
government and private concerns, though the use of Pakistani business software is
increasing both in local and foreign market but still the industry is tended to consolidate
into a few large multinational companies, which are having most of the software industry
share.
Internet Status in Pakistan
3.1.4. The Internet has been described as a “Network of Networks” or as a “Loose
collection of related computers networks” (Kendal and Kendal,2000). Measurement of
24Pakistani software Company named NetSol Ltd is also listed on the Nasdaq stock exchange.

92
internet diffusion are usually based on several indicators such as : Connectivity, number
of hosts, no of websites, number of users and other compound indices(Willam and
Ronalds(2000).Based upon these indicators the following discussion gives us true status
of Internet usage in Pakistan.
Hussan(2005) has investigated that though Internet entered in Pakistan in 1995 but it got
real boom in the year 2000 when the government started backing e-Economy in real
sense. Cyber Net and DIGICOM both are the first Internet Service Providers in Pakistan,
which were established in 1996 and can rightly be termed as the most proactive ISPs in
the country. Over the last one-decade, several others like Brain Net, COMSATAS, WOL
Net, Pak Net, Cyber Net etc have joined the fray. Today, about 1900 cities of Pakistan
have been connected through Internet. About 138 companies have been awarded ISPs
license, and are providing Internet connectivity and other web-related services in the
country. COMSATS Internet Services also took an initiative to train and transfer the IT
workforce of Pakistan in Cisco Network Training.
The growth rate in Internet and information services in developed countries is
unprecedented, varying up to 100% per annum, depending on socioeconomic level. The
Internet growth rate in Pakistan is 30%, whereas IT growth rate is estimated at 40% p.a.25
Today more than 2.426 millions people of Pakistan can access Internet and other
information networks of the entire world27. Access to medical, research and university
databases etc is of very high value. Latest information can be quickly retrieved and down
loaded from remotest corners of the world. It is necessary to share information, on best
practices of development, usage of information and communication technologies between
public and private sectors. Pakistani government also estimates explosive growth and aim
at information network capacity(Ismail, 2003, Khan and Shah, 2004).
The IT market in advance countries like USA, Canada, UK, Germany, Australia, Japan
and Far East has matured and still growing faster. The E-Mail and Internet network
development in Asia region continues to be still slow. However, developments efforts 25 Minister for Information Technology, The Jang, 15th May, 2005. 26 World wide internet user reached 1b, India has 6M and China has 100M internet users. C.N.N 17/01/05 27 www.bbcurdue.com

93
around the region demand for added capacity, increased access and better network to
support new services for Internet users. Around the globe IT and telecom products and
services are in heavy trade. This volume is estimated to be over US$ 1000 billion p.a.
around the world. The IT growth rate is about 50% p.a. (compounded annual growth rate
including growth in Internet.28
Keeping international telephone and Internet access statistics in view, Pakistan still has
low access to information network. Today global ratio of public access to telephones
compared to Internet is about 12:1 which is improving every year. While looking at the
information society in Pakistan with a vision up to 2010, it is anticipated phenomenal
growth in computer terminals, multi-media, and information terminals and in allied
fields. The deregulation policy and participation by more than 50 private sector licensees
in data and Internet services with large number of equipment vendors is expected to
accelerate growth and awareness in the society.29
E- Commerce status in Pakistan
3.1.5. E-Commerce stands for electronic commerce. It is new way of doing business in
this IT revolution world where physical boundaries have no meaning. E-Commerce offers
many inherent benefits. It enables trade efficiencies by eliminating the delays, helps cuts
the documents costs by allowing trade partners to exchange transaction data digitally and
reduces errors to increase productivity and efficiency. Most importantly, it removes
geographical barriers to have a real time online access to international markets at
affordable costs(Laudon and Laudon, 2005; SAMEDA, 2005).
Choi(2001) argues that a firm that employs IT, and especially real time networking in its
various activities is called e-business firm. Thus most firms will qualify as an e-business
firm in its broadest sense. E-business firms include not only those that sell products
online but also those that use computer and network technologies in their manufacturing,
operations, supply chain management, marketing, sales automation and customer support.
28 “Internet May offer Boost to developing Countries”, The Dawn, May 9, 2001. 29 “Turning Internet promises into profits” The Dawn, May 9, 2001.

94
In short, he says that any firm that applies digital technologies and networking to
organize it and manage its business operations and relationships is an E-business firm.
Rab(2004) demonstrates that commerce on the Internet reached $3 trillion globally in the
year 2003. Many countries have yet to draw up a proper set of operating principles to
govern legal, regulatory, and enforcement issues. With the emerging dot.com culture in
Pakistan, there has been a mushroom growth of information web portals, specialized
search engines and commercial websites in the last couples of years. The number of
Internet users in Pakistan is constantly increasing and is likely to soar manifold in the
next couple of years. Internet Service Provider Association of Pakistan (ISPAK) claimed
that the by the end of year 2005, number of Internet subscribers have reached about 2.4
millions and there are about 4.0 millions e-mail accounts, and current number is much
more. There is huge decline in bandwidth rates for high speed internet services across the
country and this will help in the growth of broad band subscriber. On IT infrastructures
side, as on November 2005, 1900 cities and towns have been connected to Internet via
local PSTN loop30.
The Government is taking all measures to promote commerce on Internet. As
Mujahid(2003) pointed out that Government of Pakistan has been on the forefront to
trigger the IT and E-Commerce revolution in Pakistan through virtual and distance
learning and e-commerce enabling initiatives. The most jutting out E-Commerce
initiatives taken by the Government of Pakistan are as follows:
- An establishment of E-Commerce working group and E-Commerce cell at the
Ministry of Science and Technology (MOST).
- Facilitation of Internet merchant accounts by the State bank of Pakistan
- Legal recognition to digital signatures and electronic documents, records,
information, communication and transactions.
30 www.ptcl.org.pk , Aslam(2002) , PTA Telecom status report 2003-2004, 2004-2005 & Khan & Shah(2004).

95
- Protection of the intellectual property rights through Electronic Transaction and
Governance Ordinance31.
- Electronic Fund Transfer (EFT) through 2000 branches in major cities.32
Farooq and Mahmood(2005) argue that with an E-Commerce plan envisaged by the
government, the financial sector will become the springboard for developing b2b E-
Commerce in Pakistan. The plan takes an aim for an E-Commerce network, known as
EC-Pak Network services to connect about 2,487 branches of 25 local banks and all
foreign banks, in 12 big cities of Pakistan. All these banks will be linked to the State
Bank of Pakistan and, to public and private stakeholders such as the tax collecting
agencies, provincial governments, national saving centers, post offices, utility companies,
government bodies, money changers, trading houses, airlines, shipping lines, clearing
agents and insurance companies. Hence EC-Pak will allow stakeholders to communicate
with each other and it will provide specialized value-added services essentials for an E-
Commerce such as security, message distribution, audit trial, acknowledgement and other
related services that are more extensive and more advance than provided by a
conventional Internet Service Provider (ISP) (Khan, 2001).
Kazmi(2004) posits that although a lot has been done to promote E-Commerce in the
country but still much more is expected in this regard. He while narrating the E-
Commerce status in Pakistani banks says that though 1-Link net (ATM network of all
banks except MCB) and M-NET(ATM network of MCB) links are connected since
March 16, 2004. Still lacks of other E-Banking facilities have become a serious constraint
in achieving the ultimate objective of E-Commerce and Pakistan has not been able to
establish the network to facilitate E-Commerce in its true spirit. Kazmi(2004) terms this
slow pace to the low literacy rate, lack of reading, research and development, still high
cost of computers, lack of basic understanding of how-to use Internet, lack of
entrepreneurial spirit, unstable economic, political and legal environment, absence of
regulatory frame work for E-Commerce and absence of interactive websites which allow
31 Electronic Transactions Ordinance 2002, Announced by President Pervaiz Musharaf on 11-10-2002. 32 “Pakistan May do well to join E-Commerce”, The Dawn, May 9, 2000 & The Dawn, January 23, 2001.

96
E-Commerce transactions. Rizvi(2005) rightly points out in this regard that it is true that
Pakistani Government taking some steps already and people in Pakistan are learning fast
to use the IT but still there is a need to act more quickly to over come all barriers. Table
3.1 provide a brief overview of Pakistan’s IT industry status upto December, 2005.
Telecommunication Status in Pakistan
3.1.6. Telecommunications today is a product of technology and politics. The first
electronic telephone switching was installed in the United States in 1965. It used a
computer for control. In the past 25 years, computer hardware and software have driven
telecommunications networks to dramatically increased speeds, capacity and functions.
Business demands for data communications began to grow in the early 1970s. At that
time the fastest rate at which data could be transmitted was 1200 bits per second.
Table 3.1: Pakistan’s IT Industry Status
Source Pakistan & Gulf Economist, December 5-11, 2005. pp 11.
Now a combination of transmission media-terrestrial copper cable, microwave radio,
satellite and optical fiber has removed the earlier constraints of cost and speed that helped
up the large scale commercial use of telecommunication. For the business user, several
kinds of network and communication links have to be considered including LAN, WAN,
MAN, ISDN, DXX, DSL, RADIO and VSAT33 etc(Cane 1992).
33 VSAT: Very Small Aperture Terminal. This proprietary network is based upon satellite technology.

97
The other censorious element shaping IT is politics, the regularity control exerted over
telecommunication. Here there are many market differences between countries. In
developed countries, telecommunications regulations were traditionally aimed at the
provision of the universal service through a network controlled by one regulated
company, the advantages of innovation, competition and freedom of choice being traded
for social equity, integration and integrity of the network. The approach is changing now,
countries like USA, Japan,U.K with passing the reforms laws, have liberalized their
entire telecom infrastructures. The innovation and development in ICT’s over the last
decade have changed the face of the Telecom business globally. As a result,
telecommunication sectors world over are confronted with new challenges of
restructuring and are working towards incorporating the latest technological change to
keep pace with the changing time(Choi, 2001).
Pakistan at the time of its inception in 1947 owned a meager telecom base with just 7000
telephone lines. Telecom service was meant just to meet the needs of country
administration. The year 1962 saw the first big sector change when Post Telegraph and
Telephone services were separated by establishing independent T&T and Postal
Departments. Since the mid-1980s, a number of countries including Pakistan overhauled
telecommunications sector, to arrange / mobilize additional capital, improve performance
of operating enterprises and respond to rapidly growing pressures for more varied
services. The pace and scope of sector reforms have varied considerably in South, Latin
America and Asia. A number of countries opted to privatize their telephone entities. In
the Far East (early 1990s) there have been initiatives on partial privatization (Thailand &
Malaysia etc) including liberalization of non-basic services. The results achieved were
found to be beneficial. This brought the wave of change in South Asia also. To begin,
Pakistan in 1990 also started taking gradual sector reform measures within the existing
legal and regulatory framework. In line with emerging trends, private sector participation
and deregulation initiatives were taken in between 1989-199134.
34 “Private sector urged to play role in promoting IT”, The Business Recorder, 6th May, 2001.

98
Pasha(2005) discloses that the current strategy of government of Pakistan is like the
advanced countries, which includes the restructuring of the telecommunications sector to
improve its performance. Therefore, efforts are being made to eliminate constraints on
the development of the economy. The government of Pakistan is continuing to encourage
private sector and awarded licenses for cellular, pay phones and paging services. By these
efforts some improvements have became possible in the availability and quality of
telecom services followed by revenue growth. The PTC Act of 1991 opened the venues
for new entrants in telecom service market. Some non-basic services are given to private
service providers. Since 1991 the Ministry of Communication started granting operating
licenses also for data and Internet services and removed controls on telecom terminal
equipment manufacturing. Khan(2005) also reports that this trend is still continuing.
Private sector is encouraged in the sector development including some new telephony
services, either through licensing or by outsourcing. One of the major milestones is
achieved (in restructuring the sector) by introducing the new legal framework in the form
of Pakistan Telecommunication (Reorganization) Ordinance, which was later enacted by
the Parliament with some amendments as an Act in October 1996. Today, this new law is
governing the telecommunication sector in Pakistan and under this law the Government
has privatized PTCL, to help inject private capital and skills into the mainstream service
business.
Now the Ministry of IT is responsible for policy and sector monitoring of telecom sector.
The Pakistan Telecommunication Authority (PTA) assumed the responsibility for
regulation of the telecom sector. Frequency Allocation Board (FAB) was made
responsible for frequency spectrum management and its monitoring. National
Telecommunication Corporation (NTC) was established to provide telecommunication
services to public sector (govt & defense) organizations. Pakistan Telecommunication
Employees Trust (PTET) was created as a trust to takeover statutory function to disburse
pension and other benefits to the employees of the PTCL. Pakistan Telecommunication
Company Limited (PTCL) was incorporated as a public limited company under the
Companies Ordinance 1984, with the principal object of provision of domestic and
international telecommunication and related services. About 95% of the assets and

99
liabilities of PTC, at net book value, were transferred to PTCL whereas the remaining 5%
assets were vested in PTA, FAB, NTC and PTET(Aslam, 2002b; Rehman, 2002).
In 2003, Pakistan’s economy has witnessed yet another year of exceptional growth and
telecom sector has acted as a catalyst for it. Pakistan’s government has declared telecom
as a priority area for the inflow of foreign investments, provision of employment, better
telecom services to the people and reduction in poverty in the country. To materialize this
end telecom sector was liberalized in 2003 and since then a number of multinational
telecom operators have started investing in the country35. For the years, Pakistan’s
telecom sector has plodded along, seemingly stuck in the mid-20th century. From 2.1
phones per 100 Pakistan in 1999, the number of fixed lines has caught up to just 3.5 per
100 today. And while cellular has been more dynamic, only about 20% of Pakistanis have
cell phones. Mobile subscribers reached about 30 millions at the end of August 2006,
whereby total mobile penetration reached 17.16%. The mobile sector thus grew by
195.6% in one year, which is the highest ever annual growth in the history of Pakistan’s
mobile sector. Since July 2003, PTA has handed out more than 200 fixed, mobile and
long distance licenses to different companies. More than 360 cities all across the country
are covered by mobile operators’ services(Netmag-September 2006).
Share of telecom sector in the gross domestic product has also touched 1.9% last year.
Teledensity of Pakistan Jumped to 13.67%(August 2005) breaking a record of percentage
growth of 105% in just one year. Total investments made in telecom sector after
liberalizing is estimated to be US$ 1.02 billion till the end of year 2004-2005. In 2004-
2005, telecom sector remained one of the major contributors in governmental revenue
and the government collected Rs 20.5 billions as GST/CED from the sector36. Similarly,
approximately 202947 direct and 233266 indirect employment opportunities were
created during the year37. Share of telecom in GDP reached 1.9%. The pace of its growth
is more than 100%. (Bhatti, 2006; Sargana, 2006).
35 Growth of Telecom sector in 2004: The News International, Wednesday, January 26, 2005. 36 Pakistan has won the “Government leadership award 2006” for rapid progress in the field of telecommunication. After Brazil, Pakistan is the 2nd country to receive the honor(The Dawn Jan 28, 2006). 37 Pakistan Telecommunication Authority online quarterly report 2005.

100
Pakistan Telecom Authority (PTA) has shown concerted efforts to make this sector
fastest growing in the region. While turning liberation into reality, PTA was faced with a
number of challenges. The Authority however was fully prepared to successfully go
through this transitional phase. The authority took diversified steps to enhance
competition after the implementation of deregulation polices by providing all facilities
and conduce environment to private entrance. Keeping in view the huge untapped
potential that this sector offers for growth and encouraged by a vibrant growth and
enormous development over the last few years, PTA proposed to the Government to
award “industry” status to the telecom sector. The government very positively responded
to PTA’s proposals and the sector was declared as an “Industry” in 2005 with the aims to
bring certain benefits allied with this status, such as borrowing of foreign companies from
local market, no minimum investment requirement for manufacturing, subsidized utilities
etc.(NetMag-November 2005).
Following its liberalization policy Pakistan has ultimately privatized its national
telecommunication services i.e PTCL in 2005. Though, in 1994, 12% shares of PTCL
were sold through capital market, while Etisalat a U.A.E based company won bid of
PTCL on 18/6/2005 for purchase of 1.3 billion shares(26 % of total share) of PTC @
$1.96(Rs 117) per share, with PTC’s controlling management rights. The Etisalat after
finalizing the payment schedule with government of Pakistan has taken over charge of
PTCL since 12th April, 200638.
Rab(2005) says that Pakistan likes to promote a business-oriented policy to associate
private entrepreneurs in telecom sector. The options are based on interconnect and
revenue sharing arrangements with licensed operators or through rebates and markup in
outsourcing contracts with private sector operators. PTCL has successfully entered into
collaborative arrangements with foreign and local telecom companies. The Information
Technology and global super-highway network is opening up new possibilities for the
38 Etisalat-PTC deal finalized: PAGE- March 20-27/2005 & DAWN 3 April, 2006.Money Plus Nov 28, 2005-“What’s scaring Etisalat”,

101
future of telecommunication the world over. Pakistan did lag behind in this area but now
it is improving fast. The most advanced telecom network owned and operated by PTCL
now, which can help the society. Major initiatives have been taken to liberalize telecom
and Information Technology market of the country. The Information Technology &
Telecom Policy stresses the importance of building sophisticated infrastructure to face
the challenges of Information Technology of the 21st century.
The IT infrastructure covers most part of the country by using fiber optic channels,
satellite systems and digital switches to create a strong, permanent and reliable IT
infrastructure. This infrastructure will support private players in IT and Internet area.39.
PTCL tariffs have been reduced keeping business needs in mind along with the future
competitiveness of telecom giant. Recent modifications in the hierarchy of PTCL own
ISP, PakNet, also bode well for the ISP industry in general, with the positive change
being made in ISP with the widest national outreach. Competition among ISP’s is sure to
rise, leading to improving better and quality of service for the consumer. Internet
bandwidth consumption, internet access via ISDN, DSL, services, CDML, GPRS etc. are
just some of the technologies that have either grown exceptionally in Pakistan or have
had a favorable reception by the local consumers(Hydir, 2006).
The success story telecom sector has been recognized world over and Pakistan has
received GSM award of government leadership among 60 regulators of the world in 2006
and ITU awarded G-Rex award to PTA, which is the testimony of its success (Sargana,
2006).
Internet Infrastructure
3.1.7. Rizvi(2005a) argues that international telecom traffic has almost been doubled in
last three years (726m-minutes in 1998/99 to 1250 m-minutes in 2001/02). Initiatives
were taken to increase the network capacity through up-gradation of SEA-ME- WE-340
from 0.4 m to 2.8 million MIU kms. The Pakistan second cables SEA-ME-WE-4 has also
39 “P.T.C.L introduced new value added services”, The Business Recorder, 21st May, 2001. 40 South, East Asia, Middle East, Western Europe-PTCL 38000 KM long submarine trunk cable which allows internet links of Pakistan with rest of world. Pakistan is member of consortium financing the cable.

102
started operating since January 2006. Two more optic fiber cables are also planned to be
laid down in this year in private sector.(One by TWA Transworld Associates (Pakistan’s
first private undersea optic fiber cables operator-TWA-1 has landed its cabling station in
Karachi which has also started working to meet the urgent need for reliable international
connectivity)). Pakistan has direct bilateral arrangements with 52 countries, whereas
connectivity to remaining countries is through transit arrangements. Pakistan is offering
Internet dial-up access (local call of no time limit) for Universal Internet using numbering
scheme e.g. UIN (131-XXXXX).Rapid expansion of ISPs resulted in small enterprises, to
date 85 ISPs have planned services using 131 Access-Code & 65 ISP’s are in actual
service(NetMag,Feb 2006).
The Internet bandwidth obtain ability in Pakistan has increased from 35 Mbps to 410
Mbps in last three years. An educational Intranet ranging from 256Kbps to 6Mbps has
been initiated for 56 HEC accredited universities. In addition to the local content, an
aggregate 4 Mbps international connectivity (up-gradable to 32 Mbps) will also be
provided. Optical Fiber Cables (OFC) have been laid for 16 universities, out of which six
universities are ready for using Intranet/Internet facilities.41.
About 70% reduction in long distance (NWD) and international call rates has been done
during past three years. Tariff reduced thrice during the year 2003-2005 and new
telephone installation charges are reduced by 50% and in some areas it has been made
free. Furthermore, substantial savings on telephone shifting charges and other services is
offered to customers. Tariff of domestic bandwidth/ leased lines reduced giving more
incentive to ISPs and mobile operators. Bandwidth rates reduced from US$
90,000/E1/month (1998) to 6000/E1/month (present). In addition “Econo-Bandwidth” is
available at US$ 3000/E1 per month42.
In short, it can be said that technological advance brought forward by the many
dimensions of the IT revolution, has completely transformed the telecommunication
41 1. “Prospects for Pakistan IT industry”, The News International, May 6, 2001. 2. “Status Of Pakistan IT Industry”, The Dawn, February 28, 2005. 42 “Significant Potential for IT” ,The Dawn, 20th April, 2005,

103
industry defined in the broadest possible way in the world and in Pakistan as well. The
relative advantages of the IT revolution lies in the optic fiber infrastructure in advanced
countries like U.S, Japan, U.K and other. It is also adequately present in Pakistan.
Telecommunication infrastructure of Pakistan does not necessary lag behind that of
advanced countries and have all latest technologies in telecommunication being used by
all these countries.
IT Human Resources Status in Pakistan
3.1.8. Human resource is the major element of success of any system. Human resource
development is central to adoption of technology and promotion of sustained
development. Pakistan having about 140 millions population has great talent to be used in
IT projects. No doubt, it has late entry in IT but it is now at that level, where its
neighboring country India was 14 years before. Among others, one of the major problems
as Ali(2005) indicates to this slow IT diffusion in the country is lack of IT trained and
expert manpower. The literacy rate and the number of skilled workers available to
provide technical support in IT are comparatively low in Pakistan.
Therefore, to realize the need of time, in order to take-up the challenge and as a part of a
comprehensive master plan for manpower development, an aggressive program to
upgrade IT education at various levels has been undertaken by the government under the
auspicious of IT policy and action plan. Over 200 institutions including 26 recognized
universities have started different IT education programs. Free Internet connections are
being extended to public sector universities under an agreement with the private sector
ISPs & PTCL. The setting up of virtual university43 is one step forward in extending the
frontiers of quality IT education in the country(Zaidi & Tahir, 2002).
A large number of educational and professional institutions have been established in the
country for imparting IT education and few others are on way(Khan and Shah, 2004).
Kazmi(2005) argues that human resource development has been assigned the top priority
43 Virtual University has been established under an ordinance promulgated by President Pervaiz Musharaf on October 11, 2002, to provide education & training in Information Technology, Business Management and emerging sciences through satellite, television & Internet.

104
for the development of local IT industry and to position Pakistan as an important player
in the international IT market. Under this plan a large pool of academically as well as
technically skilled IT manpower is being developed to meet the local and expert need.
The policy envisage the establishment of specialized IT educational institute, offering of
scholarships for higher IT education in the filed of IT, establishment of IT boards,
establishment of IT parks, Software houses, IT cities, in all major cities, National Testing
and accreditation services of educational intranet, strengthening of existing IT institute
and hiring faculty from abroad. Hundred of millions of rupees are also being payout in
upgrading existing public sector universities for IT education. Table 3.2 exhibits an
approximate no of available IT professionals in Pakistan. In this regard Hussan(2005),
however, criticizes the large scale establishment of IT institutions by saying that there are
serious imbalances at various skill levels and these institution are giving low level and
sub standard education and producing only lower level white-collar labor force. This has
lead to critical shortage of highly skilled workers, on the one hand and surplus of while-
collar labor force at lower skill levels, on the other hand. He urges that a proper policy
formulation to improve IT education quality from the government side could avoid these
mismatches.
Zaidi & Tahir(2001), Bhatti(2003), Ali(2005), Hussain(2005) and Syed(2006) also
indicate the presence of following pitfalls in IT education systems going predominant in
Pakistan 1) proliferations of standard in IT education 2) lack of competent IT faculty in
universities 3) obsolete material is taught by most of the universalities in Pakistan 4) lack
of imparting adequate analysis and design skills 5) lake of latest teaching methods with
video conference concept 6) outdated text books etc.
Zaidi and Tahir(2001) say that this pathetic state of IT education can be overcome by
appropriate curriculum development, faculty development, students scholarship and
financial support, quality assurance through monitoring and accreditation system, market
links through internships, projects, placements services, IT application etc. They further
say that by establishing world class computer laboratories, contacts, and collaboration
with other universities in the world, development of strong and cohesive industry

105
oriented educational and research programs help organizations to accelerate their
productivity through computerization, involving industry in helping IT educations like in
advance country44, to impede the outflow of valuable human resources, and to attract and
retain competent IT peoples in the country by offering them high salary.
Table 3.2: Approximate Number of IT professional in Pakistan
Source Pakistan & Gulf Economist, December 5-11, 2005. pp 16.
Pasha(2005) also suggests that the government can assure the quality education in private
and public institution by developing quality assurance tools and procedure, asking the
institutions to update curriculum in the light of international recommendations, start new
and demand oriented programs, maintaining academic level of excellence in light of
voice of industry and developing materials and processes to propagate IT.
To sum it up, it can be said that like all other components, human capital is also
indispensable for IT systems. Pakistan is rich in human resources, which matter most for
economic advance, as well as other natural resources. Its’ 140 million population has
enormous potential to be trained in any specialized field including IT. Pakistan has talent
but there is a need to properly train and provide directions to the people. Human
resources need to be developed in the right direction. The government of Pakistan now is
trying at all level best to train the masses to become IT experts by offering different
programs. However, there is a need to check the quality of the IT education and the usage 44 In America AT & T in 2003, has committed $150 millions to provide Internet access to all schools.

106
of the funds being reserved for IT uplift. In order to put its economy on track and to
compete with the growing economies of the world, Pakistan needs to quickly take steps
to train and bring its workforce to the international education standards, incorporate new
technologies and modern management practices into its existing industries, and to bring
extreme focus on building an information based economy by upgrading the technical and
managerial skills of its people.
Conclusions
3.1.9. Information Technology has proven to be the key technology of the past three
decades. Over last two decades it has developed at a breakneck speed and has brought
tremendous opportunities for mankind globally. In Pakistan IT is comparatively a recent
arrival but it is progressing smoothly. Realizing its importance, Pakistan started
introducing IT to meet challenges of globalization era. Pakistan has accepted the
challenge of the 21st century by making efforts in the development of Information
Technology. IT has been introduced in every discipline, from shopping to banking and
education, entertainment or travel etc. Every activity has been made possible by the use
of advanced technology. Large satellite dishes, mobile phone, Internet and cable systems
have been penetrated into the Pakistani culture. Newer and IT friendly methods are being
acquired to keep people abreast of the latest information about the innovation and
inventions, going on around global. The growth in Pakistan IT industry has been
unleashed in the past years. Almost every organization working in Pakistan now is using
IT for its work. The Government of Pakistan has laid great emphasis on enlarging the
scope and intensity of IT in a variety of filed. IT has got massive attention from the
government at present. The government has liberalized its rules with regards to IT and
offering different incentives to boost up IT usage, through comprehensive policies
regarding IT, telecom deregulation, cellular mobile and broadband. These policies have
given strategies direct and set objectives for improvements of Information and
Communication Technology in the country. Pakistan's IT industry has everything one
may need. A modern and rapidly expanding telecommunication system, experts from
various disciplines, highly skilled and economical workforce - all this backed by an

107
unmatched investment package offered by the Government of Pakistan. The government
is building IT skills by liberalizing its laws for establishing IT institution.
Despite having all this the IT industry in Pakistan has not yet achieved sufficient maturity
for it to fulfill its needs and to face severe competition in the international market. The
country has people with technological skills but need to be refined. Pakistan has a relative
advantage for telecommunication but it is rather week in hardware and software. The IT
hardware industry is facing death while its counterpart-the software industry is
flourishing. It is urgent need, therefore, to create business models and new plans for
growth of hardware and quality software in the country. The substandard educational
institutions are imparting low quality IT education in the country and earning a bad name
to it. . These institutions are needed to be monitored for quality education to produce
world class IT experts.
All in all it is no secret now that Pakistan has emerged as one of the most technological
enhanced nation in the region. In very small span of time the government has managed to
turn around the economy to make its base more along the lines of technology oriented
industry rather than conventional industries of yore. One of the core changes has been the
shift of the government from telecom service provider to market regulator. But, the
success of future technology industry in Pakistan is directly linked with the success of
Pakistan’s image and stability. In this era of globalization the country is taking a tempo
towards the contemporary epoch of telecom revolt. The growth rate in each and every
division of the sector is remarkable.
To conclude all above discussions it can be said that though IT comparatively got late
and slow introduction in Pakistan but the journey which started from 1960s is still going
on. IT has priority on government’s every policy and agenda now. The government of
Pakistan now is taking each necessary step for diffusion of IT in the country. Pakistan no
more remains a silent observer to the spiraling growth of the IT globally but it is a true
user of all its latest tools and techniques.

108
Section II
IT In Banking & Manufacturing Organizations.
General
3.2.0 Information Technology has become, within a very short time, one of the basic
building blocks of modern industrial society. IT has become an integral part of the
economy of every country, and is playing an ever-increasing role in the industrial and
service sector. Drucker(1992) pointed out in early 1990s that the classical factor of
production, land, labor and capital are becoming secondary and knowledge as the primary
resource for the new economy. Lang(2002) also observed that a transformation is
occurring from the old economy to the new economy, from an emphasis on the main
factors of production, namely capital, land and labor, to an emphasis on information,
knowledge and technology. The new economy is moving beyond bulk material
manufacturing to designing new technologies, beyond processing physical resources to
processing knowledge, beyond applying raw energy to applying ideas. Vasudevan(2003)
predicts that now obsolete business principles, practices and technologies will not survive
in the knowledge economy. Thus a review of management principles, concepts and tools
is timely. Organizations need to be innovative to survive and IT can be a great tool for all
those innovations and of course survival.
Significant advances in the related technologies of computers, telecommunications, data
access and storage devices, and software packages have created a wide spectrum of new
opportunities for organizations in the world as well as in Pakistan. The speed, cost, size,
and capabilities of the new IT continue to improve rapidly and there appear to be
unlimited applications that could be computer-enhanced.
The Pakistani Government and the business community in the country have fully
understood the value that automation can adds to their commercial concerns, by driving
down costs, improving products, reducing time to market and providing quality services
to their customers. Therefore, IT is being used in almost all government and private

109
organizations. According to a study conducted by the ministry of Manpower, Labor and
Overseas government of Pakistan in the year 2004, it revealed that the introduction of IT
in the country has influenced positively the organizations in term of increased
productivity, marketing and reducing per unit cost. It leads to varying degrees of
improvements in job, living standards, fair treatment to employees, level of worker’s
satisfaction, capability enhancement, balancing family life with work etc. in almost all
sectors of Pakistan. By emphasizing the importance of IT Sohal et. al(2001) say that IT
now is being applied throughout all areas of both manufacturing and service industries
including banks. However, companies are only achieving moderate benefits from their IT
investments. Predominantly the major benefits achieved across both industries have been
limited to improvements in productivity and reduction in costs.
It has been observed in the literature that IT is now not being used only as a traditional
cost reduction tool but also as a strategic tool. This trend seems more apparent both in
manufacturing and service sectors. For attaining greater productivity from IT,
organizations in the service industry are employing IT to enhance the value of product
and services to a greater extent than that of manufacturing. There is less utilization of IT
in manufacturing sector and possible indicators of poor IT utilization by manufacturers
are due to a result of failing to match IT capabilities to organizational needs. Conversely,
IT departments in manufacturing organizations have more of a reporting, consultant type
role to those responsible for strategic planning and do not have as direct a role in strategy
development as seems to be the case in service industries (Poku, 2002, Anadarajan.
2000). It has also been noted that economic factors, insufficient top management supports
and difficulty to justify cost were the greatest impediments to IT success in both
industries in the past, but now with top management commitment having a higher
response in the industries, these problems are being reduced gradually(Sohal et. al,
2001;Sherer, 2004). As a backbone of Pakistan economy, the manufacturing and banking
industries are the biggest beneficiary of all the IT innovations. Although Pakistan is not
yet self sufficient in all IT tools and relies mostly on imported hardware, software and
telecommunication equipments but its IT industry is on take off stage with all push up of
Pakistan’s Government.

110
The ensuing discussion highlights in detail the status of Information Technology usage in
banking and manufacturing industries of Pakistan.
Information Technology In Banking Organizations
3.2.1. Arthur(1996) says that service, the ‘tertiary sector’ of the economy comprises of
four distinct groups: 1) distribution services, 2) producer services, 3) social services and
4) personal services. Within the producer services sector, it has been the financial
(including banking & finance) and other business, accounting, engineering, and
architectural services that have grown most rapidly. Service sector also covers a wide
gamut of other activities like trading, infotainment, real estate, transportation, security,
courier, management and technical consultancy etc. Akhter(2006a) posits that technology
helps to catalyze efficiency in the provision of financial services and ultimately in
determining the winners in the intensely competitive financial markets of the future.
Technological breakthroughs have forced fundamental changes in the financial industry.
Strategic business plans have taken into account new ways of doing businesses,
launching e-banking, and using information and technology for developing better internal
control, more sophisticated risk management systems and better and convenient customer
services.
According to Akhtar(2006a) in addition to product innovation, globalization,
deregulation, macroeconomic performance and priorities, universal banking, risk
management, changing role of and demands on the regulator, the technological
advancement is also one of these factors which are generally believed to have been the
major drivers of change in the financial industry world over. Biswas(2005) reports that
during the last two decades there has been revolution in the technology of banking. The
micro electronic technology has dramatically reduced the costs of transmitting,
processing and storing information. Bruce(2005) narrates that IT has basically been used
under two different avenues in banking. One as communication and connectivity and the
other is as business process reengineering. IT enables sophisticated product development,
better market infrastructure, implementation of reliable techniques for control of risks and

111
helps the financial intermediaries to reach geographically distant and diversified
markets(Bruce, 2005).
Poku(2000) submits that computerization is a positive step to bank’s growth as with the
aid of computer bank work can be faster. Tremendous rises can be expected to be
obtained in the business after the use of computer. Efficient and prompt service to the
customer, timely completions of statutory requirement, timely required information are
possible. Banking sector is one sector where the all-invasive influence of IT is felt very
strongly. Banking is no longer confined to brick and mortar firm. There are alternative
delivery channels now, essentially technology driven like ATMs, Internet banking,
mobile banking, tele banking, e-banking etc., which have ushered in the era of
convenience banking. Technology use no doubt has resulted in tremendous reduction of
transaction costs, speedy execution of voluminous transaction, introduction of new
innovative products and services (Khan, 2002).
Shere(2004) demonstrates that IT has made possible the creation, valuation, and
exchange of new complex financial products on a global basis. Technology synergies
have enlarged the set of productive capital investments while lofty equity values and
declining prices of high tech equipment have reduced the cost of capital. The result has
been a veritable explosion of spending on high tech equipment and software, which has
enlarged the growth of the capital stock dramatically over the past five years. In the
banking industry inter-branch and inter-bank transactions take place electronically.
Millions of account holders and thousands of internal users can access and transfer
electronic information and make online transactions(Shere, 2004).
Information Technology in banking is not new, as according to the banking world of
Finland the systems and connections between banks have based on the use of IT for a
long time. All over the world banks are increasingly deploying IT to their operations to
improve productivity and enhance customer services. The role of Information
Technology has grown and simultaneously changed in the banking sector over time and
financial institutions are one of the largest investors in information systems (IS). In

112
1960’s IT was used to raise the cost-effectiveness. In the 1970’s IT was used as a
strategic competitive possession and in the 1980’s and onward IT became a key-factor in
increasing new services(Bhide,1997). The significance of delivering financial services is
enormous for efficiency both in terms of cost of product and customer satisfaction.
Modern technology like IT has completely changed the channels of delivering financial
services.
The financial services, particularly banking have been the major users of IT and
communication technologies. According to a survey by Ernst and Young and the
American Banker, the industry’s Information Technology (IT) spending is expected to
reach unprecedented heights in the late 2000s. Sievewright(2003) says that financial
service firms continue to spend heavily on technology. He investigated that worldwide
spending top $337 billion in 2003, and it is a 2.3% increase over 2002.
In the last decade alone, bank’s spending on IT has risen rapidly from some $14bn in
1990 to 20bn in 1995 and 30bn(approximate) in 2000(Gupta & Collins, 2001). This
diffusion of IT has began to derive benefits in term of lower cost, employee
productivity(Strachman, 1994), increase in transaction throughput(Karr, 1996); overall
profitability(Teixeira, 1995). Current statistics shows that workers in the finance industry
use computers more than any other industry45.
According to Terry(2005) technology has changed the contours of three major functions
performed by banks, i.e., access to liquidity, transformation of assets and monitoring of
risks. Further, IT and the communication networking systems have a crucial bearing on
the efficiency of money, capital and foreign exchange markets(Terry, 2005). Many
successful financial institutions have clearly demonstrated that information systems and
technologies can be a powerful competitive weapon that can be used to capture market
share, improve customer service, reduce operating costs, and create new products and
services(Lederer & Mendelow, 1988). Therefore, it can be said that IT is the means of
45 Bureau of the Census, Computer Use in the United States: October 2003:

113
increased production in the banking industry, with technology revolutionizing the moving
and storage of money, and the distribution of financial products have become easier.
Mayer(1987) while narrating the history of computer usage in banking demonstrates that
the use of computers in banking first began in the early 1950s, when the first large
commercial computer was built for Bank of America. Initially, computers were used to
process check transactions through magnetic ink character recognition. With the
introduction of first automated clearing house in the early 1970’s electronic funds transfer
(EFT) was made possible, and then ATM was introduced. Automated Teller Machine
(ATM)46 is one of the most significant technological investments made by the
commercial banks. ATM’s introduced the power of computer technology to the general
public and made banking convenient for consumers. Today, ATMs deliver banking
service 24 hours a day, 7 days a week to more than 22 millions peoples only in USA.
Koepp(2002) says that banks increasingly have turned toward ATM and other computer
technology like prepaid cards, loyalty cards, debit cards and even chip cards, to reduce
the high costs associated with maintaining traditional “brick and morter” branches staffed
by tellers. ATM transactions, along with transactions made by telephone, have replaced
transactions formerly made with human teller. Computer Technology is used by
commercial banks to reduce costs and survive the competitions. Consumer acceptance of
ATM’s and touchtone telephones to make financial transactions has allowed banks to
reduce the number of costly transactions made with human teller. Subsequently, banks
have reduced the employment of tellers and have converted many of the remaining teller
positions into part time jobs. In view of this Koepp(2002) predicts that in the future
commercial banks are expected to achieve a rise in real output, while providing more
services with fewer employees.
Franke(1987) also put forwards his view to the importance of IT in banking by saying
that financial sector appears to be a clear leader in the growth of IT. It was among the
46 Don Wetzel developed ATM in 1973 and it was first installed at Chemical Bank in New York (Shelly et. al(2004) pp5.39.
114
first to incorporate electronic data processing in its operations, through check handling,
bookkeeping, credit analysis and ATMs. Across all industry sectors, the earliest
applications of IT were directed towards reduction of personnel costs in such labor-
intensive operations as accounting, payroll and purchasing. Since then, computing and
communication technologies have effected all functions of the modern corporation,
gradually displacing traditional labor and capital inputs, through such applications as
electronic order entry, electronic data interchange, office automation, telecommuting,
expert systems, robotics, object oriented programming and point of sale settlement,
among others. The recent trend of IT-led restructuring and reengineering has accelerated
the transformation of business process. Martini(1999) has also found that the banking
industry has used IT to enable increase in the volume of transactions as well as the
development of new products and services to attract customers.
The banking applications have ranged from back-office (check and accounts) processing,
mortgage and loan application processing, and the electronic funds transfer to more
strategic innovations such as automated teller machines and new kinds of securities. The
management information systems, distributed computing devices, open systems, high-
speed data networks (LAN, MAN, WAN, ISDN, DSL, etc.) relational database
management services (RDBMS) have been important development milestones in IT with
major impact on financial services. All these technologies are being used extensively by
the banking and financial services sector. Nsouli(2002) notes that IT expenditures by the
US banks have recorded a compounded annual growth rate of about 8.5 per cent. He says
that given the magnitude of the banking industry’s growing investments in IT over last
two decades, large increases in productivity might have been expected.
As discussed above IT has been an integral part of banking system since almost four
decades. IT has always helped the banking industry to serve its customers in better way in
direct deposit, online loan applications, ATM withdrawals etc. However the arrival of
Internet Technology in banking system has taken a new shape and style with a blend of
convenience and satisfaction. Banking from a customer’s bedroom, office or anywhere in
the world has made its way into banking system with the advent of Internet technology.

115
Sievewright(2003) also highlights the importance of usage of Internet in banks and say
that the Internet with its potential has changed the very nature of banking and therefore
growth potential for online consumer banking is enormous. According to his estimates,
there are over 10,000 banks operating on the Internet in the United States, performing a
variety of banking services. A large part of banking now is being conducted online.
Sievewright(2003) further adds that this growth of Internet banking has also raised a host
of legal issues, including security, authentication, consumer protection and privacy and
the banks have to overcome these problems.
Many other researchers have also investigated the impacts of IT on banking, Zhu et al
(2004) for example have found that overall impact of technology on the banking industry
is positive. They investigated that the only need is that banks need to carefully consider
where they target their technology efforts and expenditure. Their research specifically,
has indicated that an investment in customer-focused technologies provides a good return
on investment. Other researchers including Shaanhan(1995) through light on IT impact
on banking employment. According to them technology has had an impact on
employment in the banking industry but it is not the only cause for the job declines. The
numerous mergers and failures that have occurred in the industry also have taken their
toll on employments. Prasad and Harker(1997) proposes in their study that additional
investments in IT capital may have no real benefits and may be more of a strategic
necessity to stay even with the competition. However the results of their study indicated
that there are substantially high returns to increase in investment in IT labor, and the
retail banks need to shift their emphasis in IT investment from capital to labor.
Information Technology & Banking Sector Of Pakistan. 3.2.1.1 The financial sector in Pakistan can be grouped into banking and non-banking
financial institutions(NBFIs). Banking institutions include large public sector scheduled
banks, private sector banks and foreign banks, while NBFIs include development finance
Institutions (DFIs), private sector investment banks, leasing companies and modarbas.
The financial system in Pakistan has grown substantially, benefiting from multi-pronged
reforms. These reforms have been pursued persistently and vigorously over a decade or

116
so and have supported economic growth. The inefficiencies and weaknesses which were
typical of banks’ operations in the pre-reform era have been reduced radically.
Liberalization and deregulation, core pillars of the reform measures, have served to
enhance the size of the banking system both in terms of the number of banks and growth
in credit, besides instilling a degree of competition in the banking industry. (Akhter,
2006). Banking industry in Pakistan has seen great transition during fifty-nine years of
his history, especially since early 1970s. The banking nationalization in 1974 and then
privatization and liberalization in early 1990, are termed as major restructuring years of
the entire banking industry of Pakistan. At the time of inception of Pakistan in 1947, only
few bank branches existed in the country, which were concentrated mainly in the urban
areas. Moreover, Pakistan was without a central bank of its own till June 30, 1948.
However, by early 1990s the banking sector had spread to every nick and corner of the
country.
The market for banks is diverse in Pakistan comprising Nationalized Bank, Private Banks
and Foreign Banks. In 1993 there were 33 commercial banks in Pakistan 14 being local &
19 foreign. By the end of 2001 due to government liberalization policy to setup a private
bank, the number has increased to 43, 24 being local & 19 as foreign. But by the end of
2005, with some mergers there were 38 commercial banks 14 being foreign and 24 being
local. In addition to these commercial banks, there are four specialized banks to meet the
specific requirements of different sectors of the economy. These includes: Agriculture
Development Bank of Pakistan, Federal Bank for Co-Operatives, Industrial Development
Bank of Pakistan & Punjab Provincial Co-Operative Bank Ltd. Total number of
scheduled banks branches stood at 7,075 as on 30th September, 2005. There is a
phenomenal progress in banking sector of Pakistan. It recorded an increase of 99%
growth in profit in only one year i.e 200547. NBP, HBL, MCB, ABL,UBL are considered
five large banks and are very dominant in the banking industry , in term of total number
47 The daily Dawn: “Banks profit grew 99pc in 2005”, Tuesday March 21, 2006. pp9. Mahmood Javed (2006) “Another productive year for Banks” Money Plus July 17,2006.

117
of branches, deposits and advances, collectively accounting for 78% and 77% of total
deposit and advances respectively. Most of the local banks are in private sector now, and
many of them have started business since 199248.
The banking sector of Pakistan has a number of challenges to face in this century,
encompassing economic, social and policy and procedural fields and IT etc. In Pakistan
almost all national and multinational banks are using IT to increase their performance.
The introduction of computer in banks in Pakistan started in 1965 when the main
commercial banks in private sector i.e. Habib Bank, United Bank and Muslim
Commercial Bank started acquiring computers to regulate their banking work. Since that
time there is a massive investment in IT in banking sector (Akhtar, 2006b). This is bore
out by the fact that during fiscal year 2003-2004, over US$ 200 millions was invested by
the financial services sector into IT products and services49. Shafiq(2001) says that not
only this but also the banking sector has dramatically increased its dependence on use of
IT, and it is evident by the growth in the number of branches that are connected online.
Most of the Pakistani banks (local and foreign), have launched their web sites and have
uploaded many things on web including accounts opening forms and loan applications.
Likewise, the number of Automated Teller Machines(ATMs) and the use of automated
cheque clearing and other back end systems within the banking community have
increased50.
There have been great advances in Pakistan banking technology in the past several years.
The most recent automated banking systems like Misys, Sibel, and Fidility etc are being
installed in many of the Pakistani banks. Kazmi(2004) points out that most of the banks
operating in Pakistan however, have been making huge investments in three key areas
namely 1) expansion of the branch network 2) up gradation of the existing infrastructure
3) adaptation of the new technologies with their ultimate objective is to offer a complete
electronic banking facility.
48 Pakistan banking infrastructure statistic: State Bank of Pakistan’s report 30-09-2005. 49 “Status Of IT Industry Of Pakistan, The Dawn, 28th February, 2005. 50 Approximately 1400 ATMs have been installed by different banks till July 2006 in different cities of Pakistan (The Dawn, August 22, 2006).

118
Table 3.3

119
Syed(2006) however argues that electronic banking does exist in Pakistan but its use at
present is restricted to big companies and multinationals and the pace of automation in
multinational banks is greater then the local bank.Further, in banking software foreign
companies are the real beneficiaries of IT projects in Pakistan and about 75 per cent of all
software spending on most recent 12 projects in the country, especially those by large
banks, are awarded to foreign companies51. Syed(2006) stresses on equal participation of
the local software companies as well.
Ahmed(2003) effectively argues that huge investments by the commercial banks in
technology has ushered a new era of convenience and improved quality of services. The
banks are offering Internet and mobile banking that has made major impacts on their
performance. In the end to mention another big achievement in payment area is RTGS
setup by State Banks of Pakistan for interbank settlement. All above discussion can be
concluded in a way that a lot has been achieved and lot more remains to be done and at a
much faster pace in banking technology. It is encouraging that the IT initiative is being
fully supported by the regulators very cautiously towards development of complete e-
banking status in Pakistan. It is therefore, predicted that the future of the banking
industry’s IT efforts and its spending will continue to increase in importance for the
transition of traditional banks into virtual banks. The recent statistic revealed that with
this aim the total spending on IT is projected to increase by about 100 percent by next
five years. Table 3.3 presents a real picture of e-Banking infrastructure statistic of
Pakistan.
Information Technology in Manufacturing Organizations
3.2.2 Manufacturing is the process of converting raw material into products. It
encompasses the design and production of goods, using various production methods and
techniques. Manufacturing is the backbone of any industrial society. The world
manufacturing is derived from the Latin ‘man factus’, meaning made by hand. Before
industrial revolution most things were made by hand but only the very rich could afford
51 The State Bank Of Pakistan’s automation project (Total volume of 34 million US$) has been awarded to M/s Hyundai Information Technology Co. Ltd. That is the biggest IT projects in Pakistan: NetMag Aug05.

120
to have things designed and made for them. Today every body can afford most of
machine made things(Morisi, 1998).
Automation in manufacturing organizations goes back to 1900, around the year 1900,
factory mechanization facilitated mass production to meet the consumers’ demands for
improve products. In the year 1930, transfer lines and fixed automation were created to
facilitate mass production. This resulted in the development of programmable
automation. By the year 1950, numerical control (NC) was developed as an innovative
approach to programmable automation. With the development of commercially available
computer technology, the application of computer in manufacturing started to emerge by
producing a variety of new technologies. By the year 1955, the introduction of computer
aided design(CAD) and development of NC resulted which lead to the evolution of
system like computerized numerically controlled machine tolls (CNC). By the year 1970,
development in CAD applications and Computer Aided Manufacturing (CAM) based
systems, Computer Aided Engineering(CAE),Material Resource Planning(MRP),
Flexible Manufacturing Systems (FMS),which are collectively named as AMTs-
Advanced Manufacturing Technologies was made. AMT provided flexibility as well as
data driven computer integration for a manufacturing organization, in which the
manufacturing technology utilized is intelligent enough to urge forward the activities
with less human interventions. Industrial robots, automated guided vehicles, and
automated storage and retrieval systems are also introduced. These applications can be
connected via Local Area Networks(LAN) to from Computer Integrated
Manufacturing(CIM) and externally, across organizations and space, via Electronic
Documented Interchange(EDI) (Sohal, 2001).
For every industry, each decade is blessed with a particular buzzword or a set thereof. In
the manufacturing sector, the pride of place has been occupied by the world ‘technology’.
The technology advancement in the world over is so rapid and wide spread that isolates
manufacturing and technology from each other is merely an impossible proposition. IT is
becoming critical to many manufacturing organizations that want to be a world-class
manufacturer as IT often provides a manufacturing-based advantage. IT can assist

121
manufacturing firms in developing their strategic roles. In today’s competitive global
market, for the survival of any industry, manufacturing companies need to be pliable,
adaptive, responsive to change, proactive and be able to produce a variety of products in
short time at a lower cost (Ho, 1996). Hence, manufacturing companies are compelled to
seek advanced technologies by integrating manufacturing facilities and systems in an
enterprise through computers, its peripherals and communication network to transform
island of enabling technologies in to a highly interconnected manufacturing systems.
Today, the capability of producing high quality products according to diverse customer
requirements with short delivery times has become the characteristic of order-qualifiers
for manufacturing industries. Furthermore, non price factors, such as quality, product
design, innovation and delivery services are the primary determinants of product success
in today’s global arena. Implementing integrated advanced technologies is an effective
approach towards solving the problems of decreased productivity, labor cost and
consequent rise in unit costs, which are continually plaguing present day manufacturing
manager. Implementing advanced manufacturing technologies(AMTs) provides
opportunities to achieve competitive advantage in an intermediate-to long-term time
frame (Sohal, 1999).
The Internet based distributed systems motivated the industries to utilize IT in all areas.
Advance in software technologies have been transforming the world of integration into
compatibility systems and devices by establishing an open connectivity standards, agreed
by the manufacturers, which will provide plug-and-play communication and
interoperability between field devices, control systems, and enterprise wide business
applications(Lang, 2002).
Pakistan Manufacturing Sector And IT
3.2.2.1 Pakistan industrial sector remains a relatively small part of the total economy.
Pakistan’s manufacturing sector has grown rapidly but remains inefficient and lacks
diversification. In practice, Pakistan’s industrialization process has largely been governed
by trade and tariff policies which are driven by revenue and/or balance of payments
considerations rather than by a coherent industrial policy framework (Kemal, 1999). The

122
Pakistan developed a substantial industrial sector in a very short time. The share of
manufacturing in GDP was 14.8 % in 1999-2000 but increased to 18% in 2004-05.
Almost 24% increase in six year. Pakistan’s economy, which grew at 6.4% in fiscal year
2003-2004, achieved a broad based growth of 8.4% in 2004-2005. The overall
manufacturing accounting for 18.5 % of GDP, registered an impressive growth of 12.5%
against the target of 10.2% and last year’s achievement of 14.1%. Overall, manufacturing
is growing at a much faster pace than agriculture and services and if this pace is
sustained, its share in GDP is likely to rise further in the medium term52. Various factors
including accommodative monetary policy, financial discipline, consistency and
continuity in policies, strengthening of domestic demand are continuously improving to
improve contribution of manufacturing sector. In Pakistan both large-scale,
multinationals, local and small scale domestic and international companies are operating
which are producing goods of almost all kinds(Saeed, 2003).
Table 3.4 Sectoral Shares in GDP 1999-2000 and 2000-2002. Sr.
No
Sector Percentage
(1999-2000)
Percentage
2000-2001 (R)
Percentage
2001-2002 (P)
1 Services 49.1 50.2 50.9
2 Agriculture 25.9 24.6 24.1
3 Manufacturing 16.7 17.5 17.7
4 Others 8.30 7.70 7.3
Total 100.00 100.00 100.00
Source: Economic Survey of Pakistan, 2000-2001, & 2001-2002 pp. 10 Though the introduction of IT in Pakistan started in 1960’s but it’s wide spread diffusion
has started in the last few years. Much attention has been focused by the government on
development of IT infrastructure in the country on all levels. The government also
encouraged and promoted to the manufacturing sector to use IT at all levels. Revolutions
beget openings of one kind or the other. The IT revolution would semblance to have
opened a beneficial window of opportunity for the Pakistani manufacturing
organizations. In manufacturing sector of Pakistan, Packages Ltd. was the first company,
52 Pakistan Federal Bureau Of Statistics, 2004.

123
which started using computer in 1957. After that many other companies in this sector
started using computer to increase their productivity. Now IT usage in manufacturing and
industrial sector is very common. Within the industrial sector, the use of Enterprise
Resource Planning software packages such as SAP and Oracle has become
commonplace, companies such as ICI, Caltex, PSO, Packages, Simens, KSB pumps,
Pakistan Tabacco, Honda Atlas and tens of others have deployed high end ERP (SAP)
solutions. All manufacturing organizations including textile are investing heavily into
specialized software and IT solutions to reduce costs and improve quality. Saphhier
Textile, Kohinoor, Nishat, Mehmood and Hasni Hosiery etc. have ongoing IT projects
worth millions of rupees53.
Conclusions
3.3.0. IT has revolutionized and redefined all aspects of human interaction in social and
business scenario. It has turned the world into global village where limits of time and
location no more apply. The companies use IT to get improved efficiency and
effectiveness. This use has grown at an astonishing rate over the past three decades. Now,
Information Technologies permeate nearly every aspect of modern business operations
and communications. As computing and networking machinery proliferated into every
aspect of business life, the pressing need to manage these technologies effectively has
grown accordingly.
Realizing the need of time like other countries, in Pakistan, banking & manufacturing
industries are also using IT to increase their performance in almost all areas. IT has
become means of better production and services in these industries. Advancement in
production and communication through IT has changed the nature of working for both
the industries. In addition introduction of Internet and advancement in computer
connectivity have given companies an opportunity to conduct their business on-line.
According to above discussions, the banking and manufacturing industries are seemed to
be more benefited with IT. Moreover, it is also observed that IT has changed the nature of
business of both the industries. In banking, IT is being used mostly for customer oriented
applications and in manufacturing for traditional systems. 53 Report from Federal Ministry of Industries, 2004.

124
References Ahmad Nisar Sh.(2001), “IT: Impact on the business and way of life”, Pakistan & Gulf
Economist, July 30-August 05, 2001. Ahmed Tasawar(2003), “E-Banking and its status in Pakistan”, Economic Review, pp30-33 Ahmad Khalil(2005), “Demise of IT Education”, Pakistan & Gulf Economist, Vol xxiv, no
49, December 5-11, 2005.pp 17. Ahmad Khalil(2005), “Better Late Than never”, Pakistan & Gulf Economist, Vol xxiv, no 49,
December 5-11, 2005.pp 32. Akhtar Shamshad(2006a), “Roadmap of financial sector of the country”, Business Recorder”,
Wednesday, 17 May ,2006. Akhtar Shamshad(2006b), “Pakistan’s Financial Services Sector – A Future Perspective”,
Money Plus”, July 31, ,2006. Ali Rafay(2005), “IT education: Time for a radical change”, Pakistan & Gulf Economist,
Vol XXIV, no 5, January 31-February 6, 2005, page 37-38. Anandarajan, M, Igbaria, M & Anakwe U.P(2000), “Technology acceptance in banking
Industries” Information Technology and people, Vol 13, no 4, 2000 pp. 298-312. Aslam Syed M(2001a), “Information Technology: Moving in the right direction”, Pakistan &
Gulf Economist, Vol XX, No 31, July 30-August 5, 2001 Page 12-14. Aslam Syed M(2001b), “Information Technology: What NEXT”, Pakistan & Gulf Economist,
June 18-24, pp 14-16. Aslam Syed M.(2002a), “Telecommunications”, Pakistan & Gulf Economist, Vol XXI, No
41, October 14-20, 2002, Page 12-14. Aslam Syed M(2002b), “The Internet”, Pakistan & Gulf Economist, Vol XXI, No 10, March
11-17, Page 12. Aslam Syed M.(2003), “Information Technology”, Pakistan & Gulf Economist, Vol XXII,
No 20, May 19-25, 2003, Page 30. Arthur, B.(1996), “Increasing returns and the new world of business”, Harvard Business
Review”, July-August, pp 100-09. Ayub, Imran(2006), “Software exports jump 50 per cent”, Business Recorder, July 2006.

125
Bhatti Naseem A.(2003), “The State of Information Technology Teaching in Pakistan”, Technology & Development in the New Millennium, Published by University of Karachi, Department of Botany. Page 263-268.
Bhide M.G(1997), ”Information Technology in Banks”, Journal of Indian Institute of Banker.
6894), December-1997. pp 149-152. Biswas Soumitra(2005), “Information Technology in services sector-A vision for India”,
Technology information, forecasting and assessment council. Department of Science & Technology, New Delhi, pp2.
Bruce Summers(2005), “Managing IT as a business”, Central Banking, Xv(3), February
2005, pp79-82. Bhatti Bushra(2006), “Pakistan’s telecom sector: Future prospects”, Business Recorder,
Monday, November 14, 2005. Cane, Allen(1992), “Information Technology and Competitive Advantage: Lesson from the
Developed Countries”, World Development, Vol 20, No 12. pp 1721-1736. Choi Soon-Yong & Whinston Andrew B.(2001), “Internet-Based Globalization and
International Division of Labor”, The IT revolution and developing countires: Late comer advantage. Institute of Development Economics IDE, Japan 2001, pp 317-338.
Cover story (2005), “Cant’ live without I.T.”, Pakistan & Gulf Economist, Vol xxiv, no 49,
December 5-11, 2005.pp 9-11. Danziger, J.N. (1985), “Social science and the social impacts of computer technology,”
Social Science Quarterly, 1985, pp.3-21. Drucker, P.(1992), “The new society of organizations”, Harvard Business Review,
September/October, pp. 95-105 Farooq M. & Mahmood Tariq(2005), “Information Technology & E-Governance”, Pakistan
Development Review, February 2005, pp 50-57. Franke, R.H(1987), “Technology revolution and productivity decline”, Computer
introduction in the financial industry, “ Technological forecasting and social change, 1987, pp-143-154.
Ghauri Salim(2003), “IT status in Pakistan”, Pakistan & Gulf Economist, Vol. XXIII, no 94,
December. 6-12, 2003. pp 34. Ghauri Salim(2006a), “A good start of 2006 for IT industry”, The Nation, Monday, February
27, 2006. Ghauri Salim(2006b), “Prospects and problems of IT industry”, DAWN, Monday, February
06, 2006.

126
Greaves Jennifer(2005), “Effective IT with limited resources”, Central Banking XV(3), Feb-2005, pp79-82.
Gupta Uma G.(2000), “Information Systems: Success in the 21st Century”, Prentice_hall
International U.S.A. pp. 17, 360-372. Gupta Uma G.& Collins W(1997), “The impact of information systems on the efficiency of
banks: an empirical investigation”, Industrial management & Data Systems, pp10-16. Hydir, Ghulam(2006), “Phenomenal growth in telecom sector”, The News International,
Saturday, January 01, 2005. Ho, Chia-Fu(1996), “IT implementation strategies in manufacturing organizations”,
International Journal of Operations Research & Production Management, Vol 16, no. 17. pp 77-100.
Hussain, Asad Syed(2005), “Economies of IT: Pakistan IT sector Analysis”, Economic
outlook, October 2003, pp21. Imam Ali Z(2002), “Status Of IT industry in Pakistan”, Pakistan & Gulf Economist, Vol.
XXII, no 49, October 16-22, 2002. pp 34-36. Iftikhar Momin(2005), “Indian giants eyeing Pakistan Vulnerability”, The Nation, 25th July,
2005. Ismat Sabir & Hasan Dr(2005), “Information Technology-IT industry in Pakistan”, I& A
Research Publications, PIIA Building, Sadar Karachi. Ismail S. Mustafa(2003), “Approaches to E-Finance, Management Accountant”, November
2003. p39-40. Karr, J.(1996), “Technology spending and alliances: new highs in financial service firms”,
Journal of Retail Banking Services, Vol. 183, pp 45-48. Kolachi Nadir Ali(2004), “An interdependence model for business and IT education”,
Pakistan & Gulf Economist, Vol. XXIII, no 49, December. 6-12, 2004. pp 34-36. Khan Ateeq M.(2001), “E-Commerce: Where do we stand”, Pakistan & Gulf Economist,
March 12-25, 2001, pp23-26. Khan Ateeq M.(2001), “IT: The future Challenge”, Pakistan & Gulf Economist, February 26-
March 4, 2001, pp23-26. Khan Ather Mahmood and Shah Qamar Ali(2004), “Impact of information and
communication technology on decent work in Pakistan”, Pakistan Manpower Institute, Ministry of Labor, Manpower & Overseas Pakistanis, Government of Pakistan. A study report published on 9th December 2004. pp5,22,40,44.

127
Khan Aziz Umar(2005), “IT initiatives from the government”, The Nation, Monday, March 28, 2005.
Khan Mehmood-ul-Hassan(2002), “Information Technology and the future”, Management
Accountant, Published by ICMAP, Karachi, October 2002. pp 30-32. Kazmi Shabbir H.(2000), “Promoting IT in Pakistan”, Pakistan & Gulf Economist, Vol.
XXIII, no 48, February 11-17, 2002, pp 18-21. Kazmi Shabbir H.(2003), “IT In Core Industries”, Pakistan & Gulf Economist, Vol. XXII, no
26, June 30-July 6, 2003, pp 12-13. Kazmi Shabbir H.(2004), “E-Banking”, Pakistan & Gulf Economist, Vol. XXIII, no 48,
November 29-December 5, 2004, pp12-14. Kazmi Shabbir H(2005), “A lot needs to be done to make IT use common”, Pakistan & Gulf
Economist, Vol xxiv, no 49, December 5-11, 2005.pp 14. Kemal A.R(1999), “Pattern And Growth of Pakistan’s Industrial Sector”, In 50 years of
Pakistan’s Economy edited by Shahrukh Rafi Khan, Oxford University Press Karachi. pp150-174.
Koepp Stephen (1984), “Banking takes a beating,”, Time, December 3,1984, pp48. Laudon Kenneth C & Laudon Jane p.(2005), “Management Information Systems: Managing
the digital firm”, 8th edition, Prentice Hall Publisher U.S.A. Lang Josephine C.(2002), “Managing in Technology-based competition”, Journal of
Organizational Change Management, Vol 14, No. 6, 2001. Page 539. Ledere, A.L & Mendelow, A.L(1988), “Convincing top management of the strategic
potential of information systems”, MIS Quarterly, December, pp. 525-34. Long Larry and Long Nancy (1999), “Computers”, Prentice Hall Inc. U.S.A. pp71, 174. Mahmood, Javed (2006), “2006 another productive year of Banks”, Money plus 17 June
2006. Mahmood, Javed (2006), “Where Pakistan stands in the global economy”, Money plus 26
June 2006. Mahmood, M.A & Mann, G.J. (2000), “Special Issue: Impacts of Information Technology
investment on organizational performance,” Journal of Management Information Systems pp.3-10.
Marshall Tom(2002), “E-Finance: An Ill tempered fight for supremacy”, Euromoney,
33(401), Sep-2002, pp138-139.

128
Martini Marco(1999), “Impact of IT on the Banking and financial industry”, Review of economic conditions, 1999(2), pp203-223.
Mayer Martin(1987), “The Humbling of Banks America”, The New York Times, May 3,
1987, pp 27. Morrisi Tersa L(1998), “An application Of Advance Technology in Electric Industry”, The
Monthly Labor Review, 1998, pp 31. Mujahid Yousaf Haroon(2003), “E-Commerce & WTO”, Pakistan & Gulf Economist, Vol.
XXII, no 6&7, February 10-23, 2003, pp32-40. Nsouli Saleh M.(2002), “Challenges of E-Banking revolution”, I.M.F Finance &
Development. 39(3), September 2002. pp48-51. Osama Ather(2005), “Making up for IT’s lost decades”, The Dawn, 4th July, 2005. Pasha M.A(2005), “Securing the Future of IT education in Pakistan”, Journal Of
Research(Humanities), B.Z.University Multan. 2005, Vol 24, pp95-105. Pasha Mustafa Kamal(2005), “Future Vision of Information Society in Pakistan”, The
Nation, 8th August, 2005. Poku Kofi(2002), “A Model of the impact of Corporate Culture on Information Technology
Adoption”, Working Paper no 57. School of Renewable Natural Resources, Louisiana State University, Agriculture Center, Baton Rouge, La.
Prasad Baba & Harker Patrick T(1997), “Examining the contribution of Information
Technology towards productivity and profitability in U.S Retail Banking” Financial Institution Center, The Wharton School, University of Pennsylvanis, USA.
Rab Malahat(2005), “Growth of Telecom sector in Pakistan in year 2004”, The news
International, Monday, March 07, 2005. Rehman Atta A(2002), “IT: The Great Opportunity”, http:lid awn, com/ events/
infotechatl.htm. Rehman Atta A(2001), “Government committed to promote IT”, The Nation 8th May 2001. Rizvi Shamim Ahmad(2005a), “Telecom revolution in Pakistan”, Pakistan & Gulf
Economist, Vol. XXIV, no 19, May 9-15, 2005, pp67. Rizvi Shamim Ahmad(2005b), “IT making strides in Pakistan”, Pakistan & Gulf Economist,
Vol xxiv, no 49, December 5-11, 2005.pp 12-13 Saeed, Kh. Amjad(2003), “Economy Of Pakistan”, Khawaja Amjad Saeed Publisher, 2003,
pp75-104

129
SAMEDA(2005), “Secrets of e-Commerce”, SAMEDA & ITC, Head Office, Lahore. www.smeda.org.pk
Sargana, Muhammad Arif (2006) “What make telecom a success story” , Money Plus July
31, 2006.pp9-11. Shafiq, Muhammad(2001), “E-Commerce: A practical guide to decide for the future business
sharper”, Pakistan Accountant, 33(2), April 2001, pp47-56. Shahid Muhammad(2005), “A real IT professional in Pakistan”, The News International,
Wednesday, March 30, 2005. Shanahan James B. (1995), “ATM revolution Keeps Machine on,”, The American Banker,
November 27, 1995. pp 2A. Shelly G.B, T.J.Cashman, M.E. Verment(2004), “Discovering Computers: A gateway to
information Web Enhanced”, Thomson Course Technology Boston, U.K Shere Susan A(2004), “Impact of National Culture on IT Investment management
Processes”, 12th Annual Cross-Culture Meeting in Information Systems. College of Business & Economics , Lehigh University, Bethlehem.
Sievewright(2003), “Banking on the technology cycle”, Economist, Sept. 2003, pp12-16. Sohal Amrik S, Moss Simon and Lione N(2001), “Comparing IT success in manufacturing
and service industries”, International Journal of Operations & Production Management, Vol 21, no ½, pp 30-45.
Syed Mustafa(2006), “E-banking: Are we there yet”, Business Recorder, 3oth , July, 2006. Strachman, D.(1994), “PCs are catching on faster at community banks”, American Banker,
Vol 159, no 156, pp4-6. Strocken, J,H,M.(2000),“Information Technology, innovation and supply chain structure”,
International Journal of Technology Management, 20(1-2), pp156-175. Teixeira, D.(1995), “Technology investments have led to excess banking capacity”, American
Banker, Vol 160, no 24, p8. Terry Beadle(2005), “IT systems in smaller central banks”, Central Banking, XV(3),
February 2005, pp101-104. Vasudevan A.(2003), “Some perspectives on IT up gradation in the financial sectors”,
Journal of Indian Institute Of Bankers. 74(1), Jan-2003, pp36-38. Walker Beverley L & Cheung Yen P.(1998), “IT to support service quality excellence in the
Australian banking industry”, Managing service Quality, Vol 8. No. 5 pp 350-358.

130
William, B.K and S.C. Sawyar. (2005). ‘Using Information Technology’, 6th edition, McGraHill Publishing Co. U.S.A: 3,4,147
Zaidi Junaid Dr. & Neem Tahir(2001), “Growth Of IT education in Pakistan”, Pakistan and
Gulf Economist, September 24-30, 2001, Vol XX, no 39, pp 28-29. Zhu Zhiwei, Scheuermann Larry & Billy J.B(2004), “Information network technology in the
banking industry”, Industrial Mgt. & Data Systems, Vol 104, no. 5, pp. 409-417. Websites of : Computer Society Of Pakistan: www.csp.org.pk Connect IT Pakistan: www.connectitpakistan.com Electronic Government Directorate Of Pakistan: www.e-government.gov.pk Federal Bureau of Statistic of Pakistan: www.fbs.gov.pk Ministry of Information Technology Of Pakistan: www.Moitt.gov.pk Ministry of Science & Technology Of Pakistan: www.Most.gov.pk Pakistan Government: www.pakistan.gov.pk, www.infopak.gov.pk Pakistan President’s web site: www.Presidentofpakistan.com Pakistan Software Export Board: www.pseb.org.pk Pakistan Computer Bureau: www.pcb.gov.pk Pakistan Software Houses Association: www.pasha.org.pk Pakistan Telecommunication Corporation: www.ptcl.org.pk Pakistan Telecommunication Authority: www.pta.gov.pk Sate Bank of Pakistan: www.sbp.org.pk

131
Chapter
Factors Affecting Adoption Of Information Technology
Introduction
4.01. The use of technology and Information Technology in particular is essential to the
successful operations of the today’s organizations. As discussed in the previous chapters
Information Technology now is one of the major factors improving productivity and
performance of the organizations. As the introduction and adoption of any new technology is
encountered with many challenges and obstacles, so is the case with IT. A number of factors
appear to impede or facilitate the diffusion of IT, in both developing and developed countries
and this is particularly true for small and big organizations.
The literature has identified many organizational and systemic factors that may affect an
organizations’ decision to adopt an innovation. These moderator factors include culture,
political, social, organizational, managerial, economical and technological characteristic
etc.(Gopalakrishna & Dmanpour, 1997; Lai & Guynes, 1994; Fichman and Kemerer, 1992;
Strassman, 1991; Schein, 1990; Rogers, 1983). In addition, as concluded by McFarlan(1992),
after studying sixteen research papers, and by Hanaa et. al (1995) from their comprehensive
study, that the adoption of new technology in different countries has met also with different
other barriers as well i.e 1) Lack of organizational coordination and conflicts 2)Lack of
management support 3) Training understanding of technology 4) The availability of trained
staff. 5) Skill shortage and 6) lack of expertise. Hanna(1994) in his study for World Bank has
also identified many hindrances which developing countries normally face for diffusion of
IT. These are summarized in Table 4.1.
This chapter discusses in detail the cultural, social, economic, human, political and all other
factors which may affect technology diffusion in any organization in the world and in
Pakistan as well. It also highlights different important issues relating to these factors as well.
The conclusion of the discussion is given at the end of the chapter.
4

132
Cultural Factor
4.1.1 Culture is a term that was originally developed in the field of Anthropology and has
recently become a prevalent research area in the organizational studies. In 1952, the
anthropologists Kroeber and Kluckholn claimed that there are more than 150 definitions
of the concept of culture and proposed to define it as: “Culture consists of patterns,
explicit and implicit of and for behavior acquired and transmitted by symbols constituting
the distinctive achievement of human groups including their embodiment of artifacts”.
Baligh(1994) conceives of culture in term of its parts and components. According to him,
the parts are: family, language and communication, religion, government and politics,
education, transformation and technology, society, economic structures and
activities(business) and the components of culture are: truth, beliefs, values, logic, rules,
and actions.
Schein(1990) links the culture concept to the dual pressures upon human beings to face
external adaptation and internal integration he proposes defining culture as: (1) a pattern
of basic assumptions, (2) invented, discovered, or developed by a given group, (3) it
learns to cope with its problems of external adaptation and internal integration, (4) that
has worked well enough to be considered valid and , therefore (5) it is to be taught to new
members as (6) the correct way to perceive, think, and feel in relation to these problems.
So according to him culture then concerns with a group of people who share a common
understanding and meaning of things around them. It is a shared systems of meaning
(Trompenaars,1993) or the collective programming of human mind that distinguishes
members of one group from another(Hofstede, 1983). This programmed mind was well
defined by Kolland(1990) as : “What society has impressed upon a person from the basis
from which individual characteristics grow, which in turn make an individual unique
among other members of society”.
Trompenaars(1993) proposed a framework to understand culture. His model indicates
that “the products of culture(observable artifacts) which is seen every where are symbols
of the norms and value of the people living in that place which in turn are based on
fundamental basic assumptions about human existence and life.”
133
Many studies are also found in the literature that captures the concept of national culture.
For example Hofstead(1983) in an early study proposed that national culture and values
as they effect the work environment and its management, could be categorized on the
basis of four variables, namely: power distance, uncertainty avoidance, individualism-
collectivism and masculinity-feminity. In 1985 Bond added a fifth dimension, long term
versus short term orientation, or Confucianism dynamic. According to Hofstead(1983,
1985) of the above five dimensions, power distance and uncertainty avoidance are
considered to be the most important in studying organizations in different national
cultures. Hofstead’s model of national culture is based on work related values and is one
of the most widely used models in cross-cultural management. In addition, Hofsted’s
framework has been increasingly employed in information system research (Straub,
1994; Watson et al., 1994, Fleron, 1997).
In their research Robbins and Coultar(2002) also reported that individuals perceive the
culture of the organization based upon what they see or hear within the organization.
Though individuals may have different backgrounds or work experiences at different
levels in the organization, but they tend to describe the organization culture in the similar
terms. An organization’s culture usually reflects the vision and mission of the
organization’s founders. The organizations may have strong or week culture, strong
culture shares values which are intensely held and widely shared and have a greater
influence on employees whereas in week culture it is not so. Therefore, introduction of
any new technology in an organization may need different adoption strategies.
On the basis of above definitions, it can be concluded that there are many diverse views
of culture because the writers come from different discipline with dissimilar orientation
and background. So, it can be said that the personality of the organization is represented
by its culture. A culture is a system of shared meaning within an organization that
determines in large degree that how employees act. Shared values, norms and
organizational practices do shape the culture that assist organizations to adopt the
changes.

134
There is also a substantial literature documenting the impact of culture on adoption of
technology. For example Slowinkowski and Jarratt(1997) note that the effect of cultural
factors, specifically ‘traditions’, ‘religion’ and ‘fatality’ have grater impact on adoption
of technology and must be considered with great care in adoption process. Another study
proposes that two cultural values are of specific relevance for the adoption of new
technology i.e learning orientation, and openness to the adaptation of new technologies.
The finding of that study suggests that a technological environment is not necessarily
open for adoption of technological change, and that the learning orientation plays a
critical role in the assimilation of new technology(Brainin and Erez, 2004).
Madon(1997) reported that technology particularly IT is not culturally neutral. Every
technology depicts the culture of its manaufacturing country. Developing countries can
not easly grasp the new technology as quickely as developed nation do. The reasons
behind are logical that weightage is given to the values of workers in the developed world
where rationalism and individualism are prevailing core concepts of culture. Developed
worlds design the technology by keeping in view demands and aspirations of their
culture. Developing countries find it difficult to cope with pace of changes generated by
adoption of new technology.
Khalil and Elkordy(1997) pointed out in their study that the cultural sensitivities of host
environments are often ignored in technology adoption decision. This is especially true in
the work place since the adoption decision is often negotiated by upper-level managers
who either work for international companies or who have spent time in the industrialized
countries. Yet it is the lower level managers and workers who, without the diverse
cultural experiences, have the responsibility of the daily use of the new technology, and
ultimately accept or don’t accept it.
Culture impacts both how systems are designed and how they are received. As Hill et
al.(2002) in their study of “Transfer of IT to the Arab world” found that successful
transfer and adoption of IT into organizational/business workplaces in culturally and
socially diverse countries require an understanding of micro-level beliefs, norms, and

135
actions within the framework of national and international macrostructures. Culture is an
independent variable that impacts IT and is reflected in formal and informal
organizations/businesses. Culture gives people the sense of order they have to their every
day lives. Cultural beliefs and values of different cultures differ markedly in term of how
they construct a meaning for technology. Hill et al(2002) are in a openion that culture
does not necessarily need to be viewed as a barrier that always obstructs technology.
Indeed, culturally appropriate technology design and implementation, which considers
the differential influence of culture on technology, can enhance its transfer and adoption.
Robey and Badreau(2000) report that that culture influence the outcome and the type of
many managerial practices. They worked on a conceptual framework for understanding
cultural constraints on technology transfer. Their model incorporates national cultural
(Societal culture in their words) as a key moderating variable in studding IT transfer.
According to them basic assumptions, norms and values influences a lot on IT success
and IT has the power to eliminate temporal and geographical barriers.
Wettemann and Rabecca(2003) also effectively argue that people of different cultures
communicate and collaborate in different ways. Americans, Japanese, Germans and
French etc. all have different cultural styles. The management must see first that in what
culture their organization is operating and then adopt any technology according to that
culture. But Odedra(1996) looked it from different angle and say that IT doesn’t take
‘culture’ as obstacle in its adoption, rather it facilities culture and minimizes effect of
cultural barrier because it allows for quick and vivid transmission of information between
people and organizational subunits. He further adds that the motivational effects of
culture that are supportive of efficiency and innovation can be enhanced with IT.
Communicative IT such as email, voicemail and Intranets can help promote the cultural
norms and make available supportive messages and statements to employees. This can
also motivate the employees, resulting in increased efficiency and innovation.
Sherer(2004) is also of the opinion that culture values not only have impact on IT
adoption but it have impact on IT investment management process as well.

136
Middleton(2000) in his research has also identified cultural factors as the most important
determinant of IT adoption in the organization.
Another researcher Fleron(1997) argues that implementation of a new technology does
not end with installation of the machinery and explanation of how to use it. As most of
the technology is designed and produced in developed society with their cultural values
in mind, it could be expected that there would be some social and cultural gap with less
technologically developed societies. He suggests that transferring education,
organization, administration, employment strategy, and research etc. could reduce this
gap. It is normally expected that the new technology would be accepted by the receiving
society. Therefore, the set of values introduced by and indispensable for the use of the
new technology must not be contradictory to the values accepted for the receiving
society(Madon and Shay, 1996).
If we view the Pakistani culture, It is a mix of religion, Indian origin, British inheritance
and American influences(Khilji, 1999). These influences have greater impact on
economic, legal, educational systems of the country and working patron of the employees
in organizations. American result oriented and progressive management style, Britain
slow and bureaucratic working, Islamic value system of collectivism and accountability
management practices are the key ingredients of Pakistani culture(Ahmad, 1996).
Therefore, these mix characteristics have the greater concern to the managers while
deploying any new technology.
To conclude all above, it can be said that the culture, a borrowed concept from the
discipline of anthropology, has been an important issue in management and international
management in general, and in information systems in particular. It may affect the
organizations in both ways for success or failure of adoption of any technology. Culture
is very important factor that can significantly affect transfer and adoption of IT. Culture
of any organization is a blood stream, running all directions, vertically and horizontally
and maintaining its’ over all image. It also has an important impact on the information
systems’ success of any company. The culture misfit is likely to occur if an information
137
system or IT developed in one culture is implemented in the same way in an organization
possessing a different culture. Culture basically establishes constraints on management as
to “what-they-can-do and what-can-not”. If the culture is receptive to change,
management may not feel any difficulty to implement its plans of adoption of new
technologies but if it is not, the management faces difficulties and is forced to first make
culture receptive to new change. This could be made possible through education, training,
administration and research.
Culture is one of the major factors that influence organizational structure and
management practices but it never creates barrier in the adoption of any
innovation.Culture is a critical aspect of success for firms. If the culture is supportive, the
work environment tends to me bore enjoyable, which boots moral and this leades to
increased level of team work, information sharing, and openness to new ideas and plans.
Organizational culture orientation programs to mold employee’s behavior can make
culture more supportive in the way of implementation of any new technology. As
different cultures may have different behaviors, attitudes, and beliefs, so is the case with
Pakistani culture, which has greater influences of Islamic system, American influences,
Britain inheritance and Indian origin. So it would be very right to say that a company
who wants to standardize its system (the same system in all the units-local and abroad) to
get economic benefits may face complexity due to cultural differences and need to
overcome this problem by applying all means and ways as discussed above.
Human Factor
4.1.2 Szewczak and Snodgrass(2002) say that individuals play an effective and important
role in technology adoption process. A technology is not successful if its user does not
accept it and in case of IT it is also true. Lack of user acceptance to technology has long
been an impediment to the success of new technologies. Therefore, its understanding has
been a high priority item for researchers and practitioner alike(Chau & Hu, 2002;
Venkatesh & Davis, 2000).

138
Avergou(1996) says that user participation could be considered as “Taking part” in some
activity. Such participation may be direct or indirect, formal or informal, performed alone
or in a group, but covering varying scopes of activities during systems development and
implementation. Lin and Shao(2000) in this regard argue that the participation of users in
the design and implementation of projects promote greater user acceptance. In IT projects
IT usage, system quality, organizational impact and increased user satisfaction, could
lead to increased IT adoption success. Moorman et. al(1993) also add that the greater the
user participation in the project is, the greater will be the establishment of trust in the
success of the project as the users are the right persons who identify loopholes in the
project before final implementation and will also feel committed to make it work.
Bowonder et. al(1999) have found that user participation facilitates organizational
learning by bringing together all dispersed knowledge from the various units within the
organization to one spot where employees can access information, learn from one another
and benefit from new knowledge developed by other units. This all provides an
opportunity for mutual learning and inter unit cooperation. It stimulates the creation of
new knowledge and, at the same time, contributes to organizational abilities to innovate.
Walsham et. al.(1998) demonstrate that the goal of every organizational based
information systems is to improve job performance and this performance efficiency is
achieved when IT is accepted and used by the concern employees in an organization.
Wettemann and Rabecca(2003) add their views to this discussion by saying that before
undertaking an initiative for deploying technology, organizations should examine their
corporate culture. It is likely that individuals working in that organizations will feel
threatened by any project that pushes them back or to force them to change their working
styles and patterns and these individuals would create problems in usage of that
technology in future.
Mayer(2001) is of the view that technological replacement is not the ultimate challenge
that managers face, rather motivating the humans is a bigger hurdle. Individuals working
in the company if are cooperative can bring success or otherwise may do reverse of it.

139
Mayer(2001) also identified that among all employees, comparably younger workers are
more strongly influenced by attitude towards using the technology and open to the new
technology. In contrast, older worker are more strongly influenced by objectivity and
perceived behavioral control. He argues that this issue is very important and the
organizations must consider it seriously.
Estrin et. al(2003) demonstrate that managers of many firms have a high-level
understanding of their business and operational process but they often lack employees
with the experience and skills necessary to adopt new technologies. Frenzel(1999) notes
that scarcity of skilled employees and experienced managers limits the introduction of
complex and rapidly evolving technology and shortages of highly skilled people
somewhat limit effective implementation of information systems in business and
industry. He emphasizes that the proper training of employees can sharpen skill to new
technology. Mayer(2001) in a study conducted for United Nations’ project also concludes
that it is becoming increasingly transparent that human skill shortage and changing skill
requirements are the principal initial barriers to the introduction of new technologies like
IT, in both the developed and developing countries. The majority of establishments he
has surveyed in France, Germany, and U.K have rated ‘lack of expertise’ as the most
important problem when introducing IT into products and processes.
Many other studies also revel that some managers are reluctant to use advance
technology because they often view advanced technology as an expense rather than a
strategic investment. They also have the fear that technology adoption can be a never-
ending process-one that causes expenses to spiral out of control, so they start resisting its
use as they feel that they can not afford advanced technologies(Landes, 1998; Estrin et.
al., 2003). Estrin et al(2003) have also indicated that in an organization, owners,
managers and employees have multiple responsibilities and performs multiple tasks, they
are under tremendous pressure to be productive. So they feel that they don’t have time to
experiment with new systems or to “wait” for a system to pay for it. Therefore, they
avoid adopting new technologies and prefer to work with the old systems.

140
Pakistan has abundance of expert human resource to work. Being the highly populated
country with 2.1% rate of population growth, Pakistan has manpower in all fields. But
with the great intervention from government side in organizations’ HR polices, the
organizations however sometimes feel difficulties to hire talented peoples(Khilji, 2001).
Many projects in Pakistan fail due to lack of expert personnel in their respective field and
the same case is with IT projects.
In short, individuals being an integral part and most scarce resource of any organization
are very important for success of a company. The individuals working in the corporations
at different levels play an important role in acceptance or rejection of any new
technology. Even though organizations may adopt the technology best fits to their
business activities, but they can not guarantee performance leveraging unless the
organizational members appropriately use it. So acquiring appropriate technology is
necessary but not sufficient condition for utilizing it effectively. Therefore, individuals
acceptance of technology and especially usage is an important issue.
The effective application and adoption of IT in the organization also requires competent
staff and willing users, and this involves a substantial process of learning and knowledge
sharing. A stable environment for learning and knowledge sharing is essential for
cultivating the necessary pool of talent and also to instilling cooperation among users.
The fullest user involvement in technology adoption decision is a success. Technology
adoption by force may result in individual’s non-cooperation and eventually failure to
adopt it. So, there is a dire need to involve all employees in technology adoption
decisions by offering them all types of rewards. There is also a need to have competent
and suitable personnel to work on different projects. The organization should also
accommodate employees by all means, to make them relax and also introduce any new
technology gradually by involving them all ways.
Social Factor
4.1.3. The social change works both ways: it become the reason for technological change
and also play a role of a great barrier in any technology adoption decision. As this is an
era of great technological changes, so every day companies come across with new

141
product and services. Yet the habits, taste, customs, values and culture of any country or
an organization do not allow them to go for the change. So organizations have to think
otherwise, to defer or totally reject few new technology adoption decisions.
Many researchers have emphasized on the importance of social factors in deployment of
technology. Godwin and Guimarases(1994) for example say that three factors are to be
considered to see social involvement in technology advances i.e. 1) social need-to feel
strong desire of some thing, 2) social resources-the capital, material, and skilled
personnel vital for innovation and adoption of new thing, 3) sympathetic social ethos-an
environment in which the dominant groups are prepared to consider innovation seriously
and are receptive to new idea. According to Godwin and Guimarases(1994) in default of
any of above factors it is unlikely that a technological innovation is widely adopted and is
successful. Aanadarajan et. al(2000) have conducted a research in banking industry and
identified social factor as the basic factor affecting IT usage. An other researcher named
Delmar(1992) also has identified several other social and organizational factors which do
affect the technology implementation and adoption success. According to him these
factors are user perception of innovations’, firms’ culture, type of communication
channels used to diffuse knowledge of the innovation and various leadership factors.
They stressed on the need to fully understand these factors before adoption of any
technology.
Amstrong(1999) also narrates that technologies such as IT, have probably the most
important social impact, that is its impact on the labor market. There is no agreement
about whether the number of jobs increases or decreases when IT is adopted, but there is
a great deal of pessimism about it. Amstorng(1999) further says that it is clear that the
characteristic of the workplace and the required qualification and skills are changing so
new jobs require more qualified and skill personnels. This results in job re-training of old
employee. Some those who do not change would disappear or would easily be replaced
by someone more talented. So employees now a day are required to continuously update
their skills and knowledge. Chepaitis(1998) in this context says that in developed
countries, technology is often a cheaper alternative to personnel, so the question of

142
introducing IT in countries where the unemployment rate is increasing each year becomes
important to be considered before introducing IT.
Madon(1997) also has talked about the inadequacy of trained personnel as one of the
most important problems of the developing countries. According to him, developing
countries either do not have trained IT people or those who are available for them social
environment prevailing in the country is not accepted, so they prefer to migrate to the
advanced countries. The social set up in Pakistan generally incorporate ‘Islamic’ code of
conduct, in which obedience, respect to elders, teachers, bosses etc is taught right from
the childhood. This type of system of dependence pervades all human contact and people
carry need for dependence/security (Lyon, 1993). So sometimes they just are forced to
cooperate in implementation of any new project against their wishes, leaving a room for
resistance afterward. This point is to be considered seriously by the policy makers.
To sum up, it can be said that social acceptance of a particular technology, is very vital.
An acceptable social environment is needed to be created by the country or the
organization to attract and retain talented peoples and to convince them to willingly
accept new technology.
Organizational Structure Factor
4.1.4 Robbins and Coulter(2002) describe that the organizational structure is its
framework, which is expressed by its degree of complexity, formalization, and
centralization. An organization is divided into different divisions, departments, sections,
teems and work groups for the purpose of smooth working and each member in the
organization is given certain responsibility and authority to his position. So relationships
among individuals, groups and all departments are established with a formal line of
authority and organizational resources are deployed for business conduct. If there is any
misfit among them then problems may arise and it would become difficult for the
management to introduce any technology. Brainin and Eraz(2004) are of the views that
mechanistic organizationas are bureaucratic, and rigid to adopt change. Whereas,organic
organizations are highly adaptive to change as need arise. Therefore, the behaviors of

143
organizations towards adoption of technology vary with their structure type. Organic
structure is most appropriate for new technology as it is flexible and maximizes
adaptability.
In early 1960s, a British scholar named Joan Woodward also demonstrated that
organizations’ structure is a significant contributor to the technology adoption. She
founded in her research that 1) distinct relationship existed between the technology and
structure and 2) the effectiveness of the organization is related to the “fit” between
technology and structure. Charles Perrow, her follower also derived from his research
that control and coordination methods vary with technology type. According to him the
more routine the technology is, the more highly structured the organization should be.
Conversely, non-routine technologies require greater structural flexibility, and high level
of interaction among members.
Hussain & Hussain(1993) narrates that Pakistani organizations have a formal and
hierarchical structure, consequently polices are mostly centralized in head offices.
Employees from different offices are forced to follow a policy of uniformity of objectives
and culture. Hussain & Hussain(1993) further elaborates that there exists communication
gap between management and employees and polices are made in isolation, feedback
from employees is not sought. Employees seldom know what decisions are made at head
office levels. Therefore, this type of struture creates many problems for deployment of
any new technology.
So from the above discussion it is concluded that an organization structure is an
important factor to be considered in technology adoption. An appropriate ‘structure-fit’ is
necessary for adoption of technology. Moreover members’ interactions and cooperation
at all levels, among all departments, among all groups and teams are also necessary for
success of introduction of any new technology.

144
Governmental And Political Factor
4.1.5 Ayeni(2004) says that technology acquisition raises a number of political questions.
The first relates to the dependence of the receiving nations on the supplying nation and
this technological dependence could become a political one. So it is the responsibility of
a government to select carefully the country from where technology acquisition is made
so that no political problems could arise in future. The second question relates to the
possible transfer of political power from political elites to the technical specialists. This
problem is more prominent in computer-based technologies because these technologies
are directly related with retrieval and processing of data and information. The people at
the management level are mainly from non technical backgrounds, as a result of which
there is always a tension between these two groups. The third question concerns the
selection of countries to which certain technology could be transferred. An other
researcher named Bhatnagar(1992) pointed out that political competition among
organizational groups for influence over the organizational polices, procedures, and
resources. New technology like IT inevitably becomes bound up in organizational politics
because it influences access to a key resource namely ‘information’. So IT can effect who
does what to whom, when, where, and how in an organization. As IT systems change
organizations’ structure, culture, politics, and work, so there is often considerable
resistance to them when they are introduced and there is a need to reduce this resistance
Bhatnagar and Odedra(1990).
Montealegre(1999) also notes that there are various interest groups in an organization,
which form a hierarchy and have a considerable share of political power, few of them are
very receptive to new technology and the other creates resistance. Therefore, new
technology may have to face severe resistance and it is needed to reduce that resistance.
According to an early study of Han(1991) the role of government has been identified as
very important component in technology adoption. Government policies about tax and
tariff subsidies, other rules regulations, restrictions, incentives and support with regards
to a particular technology play an important role in adoption or rejection of any
technology. Bowonder, et. al.(1993) also points out that the general stability of the

145
countries in which the organization operates and the specific attitude of the elected
government officials towards adoption of certain technology plays a crucial role in
technology adoption decisions. Most advance country like U.S, generally have stable
political environment and the officials generally have positive attitude towards adoption
of technology but even the U.S firms operating globally face difficulties due to certain
restriction of local countries of their operation whose record for stability is quite erratic
for example, Libya, Republic of South Africa, and Iran.
Information Technology Barriers in Developing Countries
Technology education and extension. -R&D institute: weak links to industry -University education: slow response -Private training institutes: Low standards -Technology support institution: poor delivery of standard, extension, and information Physical infrastructure -Poor telecom: Infrastructure and services -Unreliable power supply Capital markets and financial institution -Poor access to credit for SMEs, particularly software and service suppliers -Inadequate lending for intangible investments -No venture capital for technology start ups Local supply capabilities and access to international know-how -Weak presence of IT multinationals -Poor access to worldwide technology networks -Information asymmetry between local users and multinational suppliers -Weak user-producer interactions -Underdeveloped local consulting industry Domestic Demand for IT -The missing middle-size enterprises -Islands of sophisticated users. -Under-investment in domestic market development -Weak incentives for technology upgrading Technical and managerial capabilities -Low information and computer literacy -Inappropriate managerial attitudes for information management -Institutional rigidities and constraints to learning Underdeveloped public sector capability as information collector & IT user -Restrictive polices for public procurement and information sharing practices -Underdeveloped legal framework for information sharing and intellectual property rights -Lack of partnership between government and business -Weak civil service
Table 4.1: Source Hanna(1994). pp31

146
Due to political restrictions and bans, the firms some time cannot develop or transfer new
technologies and therefore, they have to rely on old methods and equipments(Straub et. al 1997).
Pakistan also has a quite erratic political history. One researcher named Khan(1997)
discusses that Pakistan’s political history has always symbolized a tug-of-war between
the elite namely military bureaucracy and feudal politicians, all are attempting to
monopolize power in all types of government.
This pattern has caused unrest as well as feels of insecurity and disillusionment for
public. The continuity of polices is missing in government projects in all types of
organizations such kind of practice in all types of organizations has caused failure of
many projects.
To cut short all above discussions it can be said that political factor has the greater
influence on the adoption of any new technology. Government policies, rules and the
greater stability of the country play an important role in technology adoption. There is
also dire need to overcome conflicts among all the groups in the organizations, to make
them receptive to new technology.
Economic Factor
4.1.6 The economic issue also has great influence on the use of technology. Odedra &
Madon (1998) state that two economic aspects of technology acquisition are important to
be considered: i.e 1) funds for initial investment and 2) return on investment. In low and
middle income countries, the funds available are often not sufficient to buy expensive
technology. These countries mostly rely on the technology donated to them and later
problems are encountered when the project is over. Lind(1999) has also identified that the
lack of awareness of available technologies and its uses, capabilities, and return on
investment are greater barrier to technology adoption.
The erratic political situation of Pakistan has lead to the economic hardships of the
country. Every new government aims with to solve the same economic problems and then these

147
very governments are duly changed with different projects unimplemented with resources
underutilized(Khilji, 2001). Despite having such unstable economic systems, the organizations in
Pakistan however are concerned sbout performance increase. Economic polices in Pakistan are
made under influences of external pressure, therefore they do not carry consistency. The lacks of
knowledge about technology selection, adoption, and implementation as well as lack of
knowledge in organizational development and strategic planning restrict to the uses of
new technology in organization.
Conclusions 4.2.0 The above literature review and discussion have pointed out that IT is an important
tool for uplift of any organization and country today. An organization is surrounded by a
whole range of culture, social, political, individual, technological etc. factors. These
organizational and systemic factors alongwith other factors like coordination between
different departments, proper infrastructure, top management support, and finances etc.
can influence directly and indirectly on its way of act. The factors impact both ways i.e
negative and positive. The size of these factors differs across countries and time, so the
larger the negative impact of these factor is, greater the investment and an effort a firm
have to make to adopt a more advance technology (Palvia et. al(1992)). These findings
can be taken as guide line in a way that while deploying any technology in the
organization the manager must first identify its potentials barriers and also the techniques
which will be used to limit the negative impact of these barriers.
The factors which may impede/facilitate the adoption of new technology are needed to be
scanned before implementing any new technology. Aligning these factors with new
strategic technology adoption decisions is also a complex process which also requires a
complete understanding of all the aspects. These factors may tend to create obstacles to
prevent organizations from building capability and identifying role models to improve
their performance or these factors could effectively work in a positive way that they
facilitate the spread of technology. With regards to IT, it is a risky technology and
“pattern of acquisition” of IT is also highly influenced by a complex and dynamic

148
interaction of these social, political, economic, cultural, and organizational factors. So
there is a need for multi-prospective consideration of management which should carefully
cater all the aspects.
It is, therefore, rightly to say that there is no single best procedure for managing
technology in all organization, since it depends on external social, economic, political
and internal cultural factors and on skills, and they vary from country to country,
organization to another, and region to region. There is a great need of proper management
of technologies as per specific need, culture and environment of any organization and
country. If a country or company tries to follow another country’s or company’s adoption
model, it is not likely to work very well at all. Any particular technology is adopted
according to its own environment, culture, conditions, need and requirements. Although
barriers to take-up and spread of IT are similar for the use of each level of IT but there
exist significant differences in emphasis of each. So the effective IT diffusion strategies
are to be devised to develop organizational capabilities to use and diffuse it.
Similarly, in context of Pakistan, it is observed that IT holds a prominent position and is
the way forward. The organizations have recognized significance role of IT and adapting
it aggressively. However the prevailing political, economical, cultural, structural, and
other conditions are not so supportive and needed to be made conducive for its proper
deployment.

149
References
Agarwal, R(2000), “Individual acceptance of Information Technology,” in: Framing the
Domains of IT Management Projecting the Future through the past. Zmud, R.W. (eds.), Pinnaflex Educational Resources, Inc.
Ahmad, M.(1996)), “The Crescent and the Sword: Islam, the Military and Political
Legitimacy in Pakistan”, Middle East Journal. 50, (3), 235-256. Amstrong, P. (1999) “Labour and Monopoly Capital” in Hyman, R. and Streeck, W. (eds.)
New Technology and Industrial Relations, Basil Blackwell, New York. Anandarajan, M, Igbaria, M & Anakwe U.P(2000), “Technology acceptance in banking
Industries” Information Technology and people, Vol 13, no 4, 2000 pp. 298-312. Avergou, C. (1996),“Transferability of Information Technology and Organizational
Practices” in M. Odedra (ed.) Information Technology and Socio –economic Development: Opportunities and Challenges, Ivy League Publishing, pp.106-115.
Ayeni V. (2004), “Public sector reforms in developing countries: A Hand book of
commonwealth experience”, Commonwealth Secretariat Publisher. London. U.K. Baligh, H.H (1994) “Components of Culture: Nature, Interconnections, and Relevance to the
decisions on the Organization Structure”, Management Science, 40(1), pp 14-27. Bhatnagar, S. (1996) “Applications of Information Technology in Grameen Bank” in M
Odedra (ed.) Information Technology and Socio-economic Development: Opportunities and Challenges, Ivy League Publishing, pp. 95-105.
Bhatnagar, S. (1992) “Information Technology Manpower: Key Issues for Developing
Countrie”s, Tata McGraw-Hill, New Delhi, India. Bhatnagar, S. and Odedra, M. (1992) “Social Implications of Computers in Developing
Countries”, Tata McGraw-Hill, New Delhi, India. Bjorn-Andersen, N., Belardo, S., and Mohan, L. (1990) “A Contingency Approach to
Managing Information Technology in Developing Nations: Benefiting from LessonsLearned in Developed Nations” in S.C. Bhatnagar and N. Bjorn-Anderson (eds.) Information Technology in Developing Countries, North-Holland.
Bowonder, B., Miyqake, T. and Singh, T.M. (1993) “Emerging Trends in Information
Technology: Implications for Developing Countries”, International Journal of Information Management, Vol. 13, pp. 183-204.
Brainin E. & Erez M. (2004), “Organizational Learning Orientation in the Assimilation of
New Technology in Organization,” A research study report-The Academic Center Tel-Aviv-Yaffo, Israel.

150
Chau, P.Y., & Hu, P.J.(2002), “Investigating healthcare professional’s to accept telemedicine
technology”, Information & Management, pp. 297-311. Chepaitis, E.V. (1998) “Information Systems in Lesser Developed Countries: Seminal
Questions in Planning and Control” in Palvia, S., Palvia, P. and Zigli, R. (eds.) Global Issues of Information Technology Management, Idea Group Publishing, Harrisburg, PA.
Delmore, J. (1982) “The Changing Legal Framework for Technology: Some Implications, in
North/South Technology Transfer”, The Adjustments Ahead, pp. 88-167, Paris: ECD. Estrin L, John T. Foreman, Suzanne Gracia (2003), “Overcoming Barriers to Technology
Adoption in Small Manufacturing Enterprises”, Working paper of Directorate for information operations and report, Arlington, U.S.A.
Ein-Dor, P., Myrers, M.D., and Raman, K.S. (1997) “Information Technology in Three Small
Developed Countries”, Journal of Management Information Systems , Vol.13, No. 4, pp. 61-89.
Fichman R.G. and Kemerer C.F.(1993), “Towards a theory of the adoption and diffusion of
software process innovations, in proceedings of IFIP conference on diffusion, transfer & implementation of IT (ed. L. Levine) Pittsburge, pp21-30.
Fleron, F.J, Jr (1997) “Introduction in Technology and Communist Culture: The
Sociocultural Impact of Technology Transfer under Socialism”, New York: Praeger. Frenzel Carroll W.(1997), “Management Of Information Technology,” Boyd & Fraser
Publishers U.S.A. pp 14,67-55,230. Godwin Udo and Tor Guimaraes, (1994), “Improving Organization Absorption of emerging
Technologies: A socio-technical Approach”, Information and Management, pp207-213.
Gopalakrishna S, and Danmanpour, F.(1994), “Patterns of generation and adoption of
innovation: Contingency models of innovation attributes”, Journal of Engineering and technology Management 11, pp95-116.
Hussain, M. and Hussain, A.(1993), “Pakistan: Problems of Governance”, Vanguard Books
Lahore. Hofstede, G. (1983), “Culture and organization: software of the mind”, McGraw-Hill,
London. Hofstede, G. (1985), “The interaction between National and Organizational Value systems”,
Journal of Management Studies, 22(4), pp 347-357. Hosfstede, G. & M.H. Bond(1988), “The Confucius Connection: firms culture roots to
economic growth”, Organization Dynamics. 1694), pp4-21.

151
Han, C.K.(1991) “Information Technology Policies and Government Information Systems: A Multiple Level Perspective”, A PhD Thesis, University of Cambridge, UK.
Hanna, N., (1994), “Exploiting Information Technology for Development”, World Bank
Discussion Paper 246. Hanna, Nagy, Guy ken & Arnold Erick(1995) “The Diffusion of Information Technology:
Experience of Industrial Countries and Lessons for Developing Countries” World Bank Discussion Paper 281.
Hill Carole E. Straub Detmar W & Loch Karen D.(2002), “Transfer of Information
Technology to the Arab World: A Test of Cultural Influence Modeling”, Published in Information Technology Management in Developing Countries, IRM Press, U.S.A. PP. 92-134.
Kansal, K. (1997) “The Information Revolution and Less Developed Countries” – A Paper
Presented on UNCTAD /ESCAP Conference on Information Technology, May 21-13, Bangkok, Thailand.
Kelsey, R. (1988) “Expert Systems as a Preliminary Design for Drinking Water Supplies in
Developing Countries”, Science, Technology and Development, Vol. 6, No. 1. Khalil, O.E.M & Elkordy, M.M.(1997), “The relationship of some personal and situational
factors to IS effectiveness: Empirical Evidence from Egypt., Journal of Global Information Management”, 5(2), pp22-34.
Khan, A.A.(1997), “Economic Development”, in R.Raza (ed) Pakistan in Perspective 1947-
1997, Oxford University Press, Karachi. Khilji, S.E.(1999), “Management in Pakistan”, in M. Warner International Encyclopedia of
Business and Management, International Thomson Press, London. Khilji, S.E.(2001), “Human Resource Management in Pakistan”, in Human Resource
management in Developing Countries, Routledge Press USA. Pp 102-119. Kolland, A. (1990),”National Cultures and Technology transfer: The influence of the
Mexican life style on technology adoption”, International Journal of Intercultural relations, 14, 319-336.
Kroeber, A, & Kluckholn, C(1952) “Culture: A critical review of concepts and definitions”,
Cambridge, MA. Lai V.S and Guynes J.L.(1994), “A model of ISDN adoption in U.S Corporations”,
Information & Managemnt”, 26(2), pp31-54. Landes, D (1998), “Information Policy for a New Millennium”, Library Review, Vol. 49, No.
7 pp. 322-330.

152
Lin, W.T and Shao, B.B(2000), “The relationship between user participation and system success: A simultaneous contingency approach”, Information & Management, 37(6) pp283-295.
Lind, P. (1999) “Computerization in Developing Countries”, London, Routledge. Madon, S. and Sahay, S. (1996) “Geographic Information Systems for Development Planning
in India: Challenges and Opportunities” in M. Odedra (ed.) IT and Socio-economic Development: Opportunities and Challenges, Ivy League Publishing, pp. 42-52.
Madon, S. (1997) “Information-Based Global Economy and Socio-economic Development:
The Case of Bangalore”, The Information Society, Vol. 13, pp. 227-243. McFarlan, F.W. (1992) “Multinational CIO Challenge for the 1990s”, In The Global Issues
of Information Technology Management, (Palvia, et.at., Eds.) Idea Group, Harrisburg, PA, pp. 484-493.
Middleton P.(2000), “Barriers to the efficient and effective use of Information Technology”,
The International Journal of Public sector Management”, Vol 13, no 1. pp 85-99. Moorman, C., Desphande R and Zaltman G.(1993), “Factors Affecting trust in Market
Research Relationship”, Journal of Marketing, 57(1), pp 81-101. Morden, T(1999), “Models of National Culture-A Management Review”, Cross Culture
Management, 6(1), 1999. Montealegre, R. (1999) “A Case for More Case Study Research in the Implementation of
Information Technology in Less-Developed Country”, Information Technology for Development, Vol. 8, No.4, pp. 199-207.
Montealegre, R. (1998) “Managing Information Technology in Modernising ‘against the
odds’: Lessons from An Organization in a Less-developed Country”, Information & Management, Vol. 34, No. 2, pp. 103-106.
Montealegre, R. (1997) “The Interplay of Information Technology and the Social Mileu”,
Information, Technology and People, Vol. 10, No. 2, pp. 106-131. Mayer, J(2001), “Technology diffusion, Human capital and economic growth in developing
countries,”, UNCTAD Discussion paper no. 154 (2001). Odedra, M.(1996), “Introduction in Information Technology and Socio-Economic
Development: Challenges and Opportunities”, p.1, Ivy League Publishing, New Hampshire, USA.
Odedra M and Madon S(1993), “Information Technology polices and Applications in the
commonwealth developing countries”. Commonwealth Secretariat Publisher. U.K. Palvia, S., Palvia, P., and Zigli, R.M., (Eds.) (1992) “The Global Issues of Information
Technology Management”, Idea Group, Harrisburg, PA.

153
Robbins Stephen P. and Coulter M.(2002), “Management”, 7th edition, Prentice Hall, U.S.A,
pp 71,114,271-273. Rogers, E.M.(1983), “The diffusion of Innovations”, 3rd edition, The free Press, New York. Robey, D. & Boudreau M.C. (2000), “Organizational Consequences of Information
Technology: Dealing with diversity in empirical Reseacrh In Zmud R. (Ed.), Framing the Domain of IT management, Pinnaflex, pp 51-63.
Schein, E.H (1990), “Organizational Culture”, American Psychologist, 45(2), pp 109-119. Sherer Susan A.(2004), “Impact of National Culture on IT investment Management
processes”, 12th Annual Cross-Culture Meeting in Info systems, Lehigh University. Slowingkowski Sue & Jarrat D.G.(1997), “The impact of Culture on the Adoption of high
Technology Products”, Marketing Intelligence & planning, Vol 15. No 2, pp97-105. Straub, D. W, (1994), “The effect of culture on It diffusion: E-mail and Fax in Japan and the
U.S.A”, Information Systems Research, 5, 23-47. Straub, D. W, Keil, M. & Brenner, W, (1997), “Testing the technology acceptance model
across cultures:A three country study”, Information and Management, 33, pp 1-11. Strassmann, Paul(1991), “The business value of computers”, New Canaan, Conn.: The
Information Economics Press. Szewczak, E.J, and Snodgrass C.(2002), “Human factors in information systems”, IRM press,
U.S.A, pp 72-83. Szewczak, E.J, and Snodgrass C.(2002), “Managing the Human side of Information
Technology: Challenges and solution”, IRM press, U.S.A, pp 231-261. Trompenaars, F.T. (1993), “Riding the waves of culture: Understanding Cultural Diversity in
Business”, London: Economic Books. Venkatesh, V. & Davis F.D. (2000), “A theoretical extension of the Technology Acceptance
Model: Four longitudinal field studies”, Management Sciences. Vol. 2, pp. 186-204. Wetterman A. & Rabecca R. (2003), “Control through Communication”, Baltimore, MD,
The John Hopkins University Press. Watson, R.T., Ho, T.H. & Raman, K.S.(1994), “Culture: A fourth dimension of group
support systems.” Communication of the ACM, 37, 44-55.

154
Chapter
Reseacrh Model
General
5.1.0 The researchers have used several theoretical paradigms in examining the
organizational performance impact of Information Technology. Several streams of
research are concerned with assessing the organizational performance implication of IT
and each bringing its own results. Manay theories have also been developed to address
this phenomenon, but non of them has been conducted in Pakistan. All these researches
have been conducted outside Pakistan, especially in advanced countries, in their
particular cultural and environmental context. This research has developed a
framework(model) Figure 5.1, in Pakistan context, which shows the relationship of
Pakistani companies IT usage with organizational performance. It shows impact of IT
investments, Impact of IT systems, impact of top management role, impact of training,
impact of user involvement and impact of organizational and systemic factors on
organizational performance.
The literature review, discussed in the previous chapters has identified that technology
plays an important role in the growth of today’s organizations. Technology is a major
source of change and it brings revolutions in the working of organizations. It is
technology which has brought all major social changes in society. Over the time,
technology is becoming cheaper and better at a rapid pace. The developing countries like
Pakistan are highly dependant on the technology, which is developed in advanced
countries.
In providing the background to the subject, there has also been discussion that IT is the
key technology of today’s life and an important management tool. It affects a lot on the
5

155
functioning of the organizations. IT is being used in all functional areas of the
organizations to increase their performance and IT now is playing more important role in
the organizations than what labor and capital play.
It has also been discussed that technology becomes useful when it is properly diffused
and technology adoption is considered much important than the technology development.
It is discussed that IT is an individual user based application and its adoption/diffusion
process should also start at that level. It is found that a strong advocacy rather than
dministrative force would be more effective to avoid a negative trend and resistance in
the mind of user, for any new technology. It is established in the literature that over the
Top Management & Companywide
Support
Information Technology
Systems
Information Technology Investments
Training &
User Involvement
Organizational Factors: Culture, Structural Human Resource
Uses of Information Technology
Organizational Performance
Systemic Factors: Social. Government Economic, Political
Figure 5.1: Research Framework

156
time the use of IT has increased rapidly in all the organizations of Pakistan. IT has been
applied throughout all areas of both manufacturing and service industries as well and its
role has grown and changed continuously in both the sectors. It has been noted that
advances in IT hardware and software have provided many opportunities to the
companies to utilize IT in their functional areas to increase their performance. The use of
IT has improved many aspects of the organizations. If IT is implemented properly in the
companies, it performs a range of activities with grater efficiency by taking less time,
incurring a lower cost or acquiring fewer efforts.
It is also found, that successful IT introduction in the organizations has saved time and
money, increased revenue and market share, interlinked several functions and units, and
improved organizations’ performance by eliminating delay, administrative intermediaries
and redundant processing steps and by providing better access to information, improved
decision making etc. IT is used for organization reengineering, innovation, organization
transformation and as a strategic weapon for social and economic changes. But all these
IT benefits are dependent upon the ways the management deploy it in the organizations.
An industry using IT has to consider that how much, when and where to make IT
investments to get high performance. It also has to consider that what type of hardware,
software, personnel and information systems would be more usefull. Proper training and
involvement of the user in IT projects were also found to have greater impact on IT
success to increase the management performance.
The importance of organizational and systemic factors like culture, government,
individuals, social, political and economic factors which may affect the adoption of any
technology is also discussed. It is observed that that these factors play an important role
in adoption and success of any technology. The size of these factors differs across
countries and organizations. A suitable culture, social acceptance by the employees,
favoring governmental, political and economic conditions were found to be important
factors for success of IT and failing to put their proper dimensions can inhibit the success
and may increase cost and efferts and the risks of failure. The proper management of

157
technology as per specific culture, political and social requirements of the organization,
can make adoption of any technology a success.
Pakistani organizations serve as an excellent case for the study of an impact of IT on
organizational performance. The government of Pakistan is fully supporting the
introduction of IT in the country on priority basis. It is found in the literature that though
Pakistan now has well established IT infrastructure with fully equipped
telecommunication network but still there exist need for the government to enhance IT
facilities. Moreover, less qualified IT personnel, data security, non availability of full
fledge hardware industry, very high taxation on import of computers parts, still high cost
of communication and Internet connectivity are seemed to be greater problems in the way
of making country as an IT giant.
Proposition Derivation. 5.1.1 By synthesizing the literature review discussed in previous chapters and using the
integrative model discussed above as a lens, we identified following research questions to
organize the surveys and guide the direction of research. These questions are divided into
two groups.
Group 1
Question 1: What impact IT investments have on use of IT, positive or negative in term of
decrease/increase in income/profit and other performance indicators like
customer satisfaction, stakeholder confidence, interoffice linkage, job interest
of employees and company image.
Question 2: Management Performance of the IT based organizations is associated with
the reasons that for what function/purpose IT is being used in the
organizations, type of Hardware/Software is being used and what level of
information systems an organization has attained so for.
Question 3: What role management support, training and user involvement in IT
projects of organization play for having best organizational performance?

158
Group 2
Question 4: How and to what extent organiztional and systemic factors such as Culture,
Social, Governmental, Political, Human, Organizational, Economic and
other problems have impacted the usage of IT in the organization.
Question 5: What measures organizations usually take to overcome IT adoption
problems in Pakistan?.
Question 6: What are the reasons for so far IT success in Pakistan?.
Conclusions
5.2.0 The first group questions discussed above concern to the points that how
investments in IT are linked to high organizational performance, how organizational
performance is bettered off through effective use of IT. The focus is also made to identify
that what IT systems are most suited at present time to the success of any organization
and what role management support, training and user involvements has, to uplift IT and
use of IT sytems in the organizations. The second group of questions relate with
systemic, organizational and other factors which may impede or facilitate the use of any
technology in the organizations. The organizational measures to overcome technology
implementation problems and reasons for IT success to make IT implementation
successful also are concerns of questions in this group. The discussions made in the
ensuing chapters present our research methodology, data analysis & interpretation, and
findings drawn on our research questions alognwith our recommendations.

159
Chapter
Reseacrh Methodology
General
6.1.0. The literature review, as discussed in the previous chapters has identified that
technology plays an important role in the growth of today’s organizations. Technology is
a major source of change and it brings revolutions in the working of organizations.
Technology brought all great social changes in society. Technology is becoming cheaper
and better at a rapid pace. Developing countries like Pakistan are highly dependant on the
technology, which is developed in advanced countries. In providing the background to
the subject, there has been discussion that the Information Technology is the key
technology of today’s life and an important management tool. It affects a lot on the
functioning of the organizations. IT is being used in all functional areas of the
organizations to increase its performance and it is now playing more important role in the
organizations than labor and capital.
It is established in the literature that over the time the use of IT has increased rapidly in
all the organizations. IT has been applied throughout all areas of both manufacturing and
service industries as well and its role has grown and changed continuously in both the
sectors. It has been noted that advances in IT hardware and software have provided many
opportunities to the companies to utilize IT in their functional areas to increase their
performance. The use of IT has improved many aspects of the organizations. If IT is
implemented properly in the companies, it will perform a range of activities with grater
efficiency by taking less time, incurring a lower cost or acquiring fewer efforts.
It is also found, that successful IT introduction in the organizations has saved time and
money, increased revenue and market share, interlinked several functions and units, and
improved organizations’ performance by eliminating delay, administrative intermediaries
6

160
and redundant processing steps and by providing better access to information, improved
decision making etc. IT is used for organization reengineering, innovation, organization
transformation and as a strategic weapon for social and economic changes. All IT
benefits are dependent upon the way the management deploy it in the organizations. An
industry using IT will have to consider that how much, when and where to make IT
investments to get high performance. They also have to consider that what type of
hardware, software, personnel and information systems they are using. Proper training
and involvement of the user in IT projects were also found to have greater impact on IT
success to increase the management performance.
The factors like culture, government, individuals, social, political and economic
conditions which may affect the adoption of any technology are also discussed. It is
observed that these factors play an important role in the success of any technology and
size of these barriers differs across countries and organizations. Longer the negative
affect of these factors are, the greater the investments and efforts organization has to
make to adopt and use IT. So, the proper management of technology as per specific
culture, political, social requirement of the organization can make that technology more
succesfull.
Pakistani organizations serve as an excellent case for the study of an impact of
Information Technology on Management performance. The government of Pakistan is
fully supporting the introduction of IT in the country and IT now is on its all priorities. It
is found in the literature that Pakistan has now well established IT infrastructure with
fully equipped telecommunication network but still there exist need for the government to
enhance IT facilities. Moreoer, less qualified IT personnel, data security, non availability
of full fledge hardware industry, very high taxation on import of computers parts, still
high cost of communication and Internet connectivity seem to be some problems in the
way of making country as an IT giant.
The researcher believes that no similar study has ever been undertaken in and outside
Pakistan. Accordingly, further investigation into this particular area is required. This may

161
be achieved by undertaking relevant fieldwork and making a detailed study of the firms
that use IT.
Objectives of Research
6.2.0. The main focus of the research was to identify the relationship of IT with
organizational performance (effiency and effectiveness) of Pakistani organizations in
banking and manufacturing sectors. It also focused on the problems faced by different
business firms in Pakistan using IT, in coping with the new developments in IT and in
successful implementation of IT systems. The utmost desire of each and every company
is to increase its performance by less cost and by applying all latest technologies,
techniques and tools. But to achieve so, the organizations do face many problems in the
way of adoption and implementation of any new technologies in their setup. These
problems may arise as a result of deploying technologies without planning, incompetent
human resources, poor management, lack of financial resources, culture, political, social,
governmental and due to other socio cultural/organizational/systemeci factors. The other
focus of this research was to identify these problems and limitations experienced by the
firms operating in Pakistan’s banking and manufacturing sectors and measures to
overcome these barriers. As the IT includes computer hardware, software, personnel,
telecommunications and resources assigned to supporting IT. Investigations therefore
were focused on examining such issues as which part of the IT and what IT mix is most
important and suitable for organizations’ success and has the greater effect on increasing
organizational and management efficiency.
The study also examined the importance of management support, training and user
involvement in IT projects. The study investigated that how much consideration
organizations give to training and user involvement to ensure success of their systems.
The study also highlighted the reasons for slow pace of IT implementation in Pakistani
firms. It examined the investments of firms in IT and its comparable usefulness/ benefits.
It also tried to identify different types of IT investments and areas in which these
investments are being made. Lastly, the study identified present state of IT in Pakistan

162
and the role/efforts of Pakistani government to boost up IT sector and its cheaper and
quality availability to the organizations.
Collection of Information
6.3.0. There are two types of data, which is usually used in research viz. primary and
secondary. The primary data are those, which are collected afresh and for the first time,
and thus happen to be original in character. The secondary data, on the other hand, are
those which have already been collected by some one else and which have already been
passed through the statistical process (Neuman, 2005). Secondary data is very helpful in
order to grasp knowledge about topic of the research. It helps the researcher to know the
topic in detail and helps the researcher to confine his study and also guides to the core
issues that are researchable(Kothari, 2005). For this research both primary and secondary
sources of data are used for collection of information.
Methods For Collection Of Data
6.4.0. The methods of collecting primary and secondary data differ since primary data are
to be originally collected, while in case of secondary data the nature of data collection
work is merely that of compilation. There are many methods of colleting the primary and
secondary data for testing the research problems, which have been defined through the
hypothesis. Each method of course has its utility as well as limitations.
Method to Collect Secondary Data
6.4.1. Secondary data for this research is obtained from the company’s records, articles,
published reports and the documents of various agencies. Already published articles and
journals actually provide information about the previous work done so far on the same
topic or in the same field and were used for the literature review. For this purpose the
sources are journals, books, newspapers, websites and research articles. Such kind of data
provides a base and platform to develop the track for future work. This also provides
wide approach to the subject and the researcher after going through the colletcted
literature, develop a mindset and ample knowledge about the field and the topic studied.

163
Already published data gives information about the extent of work done in a particular
field and what future researches can be done to continue the work. As IT is relatively new
filed in Pakistan so very little published information was available. However, the
researcher used the following sources to collect secondary data;
1. Web site of Government of Pakistan 2. Web site of Ministry of Science & Technology 3. Web site of Ministry of Information Technology 4. Web site of IT Commission of Pakistan 5. Web site of State Bank of Pakistan 6. Web site of Computer Society of Pakistan 7. Web site of Punjab Information Technology Board 8. Web site of Pakistan Bureau of Statistic. 9. Library of Lahore University of Management Sciences 10. Library of Institute of Business Administration. Karachi 11. Library of Institute of Management Sciences, B.Z.University. 12. Library of State Bank of Pakistan Karachi. 13. Library of Bahauddin Zakariya University Multan. 14. Digital Library of Higher Education Commission Islamabad 15. Articles down loaded from Emerald-Libarary.com & Google.com 16. Articles published in different issues of Economist, Newsweek and
Pakistan & Gulf Economist. 17. Articles published in daily news papers, the Dawn, The Nation,
The Jang, The News, The Business Recorder and The Express 18. Articles published in different International Journals and World
Bank jornals/publications. 19. Books published by different authors. 20. Library of COMSATS institute of Information Technology Lahore
campus.
Data collected from these sources is compiled and produced in the form of literature
review in this thesis and discussed in chapters 2-4. The pattern and format of review and
research is based upon all that information that the researcher has gathered from the
above mentioned sources. In the research, financial reports of all the organizations were
also required to know about the IT investments over time and its contribution to firms’
performance in term of increased profits, market share etc. These reports and financial
data of all the organization are obtained from following source;
1. Annuals reports of sample organization
2. Annual reports of State Bank of Pakistan

164
Methods to Collect Primary Data 6.4.2. There are many methods to collect primary data i.e 1.Experimentation 2.Observation
3.Case study 4.Survey. Each method has its own merit and demerits. 1) Neuman(1999)
indentified that experiment method is is widely used method in research because of its
logical rigor and simplicity, consistency with positivist assumptions, and relatively low
cost. Kothari(2005) noted that the experimentation method was borrowed by the social
sciences from the natural sciences, and began in psychology, is the best method in
eperiemntal research. But Somekh and Lewin(2005) noted that this method is good in
experimentation research but in case the research is of the descriptive type then primary
data can be obtained either through observation or through direct communication with the
respondents in one for or another through personal interviews. So for the purpose of this
research, experimentation is not possible due to descriptive nature of research. 2) The
observation method is the most commonly used method especially in studies relating to
the behavioral sciences. According to Neumen(2005), under the observation method, the
information is sought by way of investigator’s own direct observation without asking
from the respondent but it is expensive, having limited information and the researcher
may have to wait till the relevant event or behavior occurs.
This method is particularly suitable in studies, which deals with subjects (i.e.
respondents) who are not capable of giving verbal response of their feelings for one
reasons or the other. Fink(2005) also observed that observation techniques are both
underdeveloped and underutilized. This technique is found not applicable in this research
as well because of the diversified nature of the problems being examined. 3) Case study
method is another method of data collection. Reddy(2004) argues that under this method
one case study is undertaken and efforts are made to make a comprehensive study of the
problem as a whole or entirely, keeping in view unitary character of the subject.
Reddy(2004) further adds that the case study method is a very popular form of qualitative
analysis and involves a careful and complete observation of a social unit, be that unit a
person, a family, an institution, a cultural group or even the entire community. It is a
method of study in depth rather than breadth. It is an intensive investigation of the
particular unit or more of such units under consideration. This method studies the social

165
unit covering all factors. According to Burgess(2004) case study method is a technique
by which individual factors whether it be an institution or just an episode in the life of an
individual or a group is analyzed in its relationship to any other in the group.
Lerry(2005) argued that a case study helps in maintaining unitary character of the subject.
In respect of case study method an effort is made to know the mutual inter relationship of
casual factors.
Hays(2000) pointed out the demerits of case study and says that 1) in case study it is
difficult to extract information from the parties, particularly when the information called
is of confidential nature or bring lurking fear of some disadvantage at some distant
feature. 2) case study method is based on numerous assumptions, which may not be very
realistic at time, and as such the usefulness of case data is always subject to doubt. 3) it
consumes more time and need lot of expenditures. 4) the danger of false generalization is
always there in view of the fact that no set rules are followed in collection of the
information and only few units are studied. 5) case situations are seldom comparable and
as such the information gathered in case study is often not comparable. Choudrie &
Dwivedi(2005) reviewed different leading research journals from 1985 to 2003 and found
that case study method is most widely used by the researchers when examining IT
adoption/usage issues were at the organizational level and survey method was used
predominantly when investigating the topics of user adoption/usage of technology. So
this method is not used by this research because of its different nature to study the entire
sample as a whole.
Suryey method is another method which is used for data collection. Tull &
Hawkins(1988) say that this method provides both the qualitative and quantitative data
required to meet the research objectives. Kinner and Taylet(1997) demonstrate that
survey research is concerned with the administration of a questionnaire. It involves the
systematic gathering of information from respondents for the purpose of understanding
and/or predicting some aspect of the behavior of the population of interest. Kothari(2005)
describes that surveys may either be through census or sample surveys. They may also be
classified as a social survey, economic surveys or public opinions surveys. Whatever be

166
their type, the method of data collection happens to be either observation, or interview or
questionnaire/opinionnaire or some objective technique(s).
Zikmund(2000) demonstrates that surveys are usually appropriate in case of social and
behavioral research because many types of behavior that interest the researcher can not
be arranged in a realistic setting. The main constraints affecting this method are the
extent to which respondents are willing and able to provide the desired data. In addition,
an interviewee may be influenced by the interviewing process and accordingly provide
distorted information (Kinner and Taylor, 1997). These constrains can, however, be
minimized by carefully designing the research and data collection instrument and
ensuring its proper implementation.
Survey through questionnaires method is quite popular, particularly in case of big
enquires. It is being adopted by private individuals, research workers, private and public
organizations and even by the governments. According to Baker(1999) “a questionnaire
is a list of questions sent to a number of persons for them to answer”. It secures
standardized results that can be tabulated and treated statistically. It consists of a number
of questions printed or typed in a definite order on a form or set of forms.
Somekh and Lewin(2005) narrate that the questionnaires are of two forms i.e. 1)
structured, in which there are definite, concrete and pre-determined questions. This form
of question may be either closed i.e of the type ‘yes’ or ‘no’ or open i.e inviting free
response but should be stated in advance and not constructed during questioning. The
structured questionnaire may have fixed alternative questions in which response of the
informants are limited to the structured alternatives. Thus the structured questionnaire is
one in which all questions and answers are specified and comments in the respondents
own words are held to the minimum 2) unstructured or non-structured questionnaire,
in which the interviewer is provided with a general guide on the type of information to be
obtained, but the exact question formulation is largely his own responsibility and the
replies are to be taken down in the respondents’ own words to the extent possible, in
some situation tape recorders may be used to achieve this goal. Somekh & Cathy(2005)
167
demonstrate that structured questionnaires are simple to administrate and relatively
inexpensive to analyze but have limitations too. But due to its advantages over
unstructured questionnaire, these are used in most of the studies.
Leary(2005) says that there are four possible ways of administrating a questionnaire i.e 1.Mail 2.
Telephone 3. Internet 4. Personal interview. 1) Questionnaire may be sent by mail (post) to
the respondents who returns completed questionnaires to the researcher by the same
method. The respondents read and understand the questions and write down the reply in
the space meant for the purpose in the questionnaire itself. The respondents have to
answer the questions on their own. The method of collecting data by mailing the
questionnaires to respondents is most extensively employed in various economic and
business surveys because of the merits that it is comparatively low cost, free from the
bias of the interviewer, respondents have adequate time to give well thought out answers,
unapproachable respondents can be contacted and large samples can be made use of and
thus results can be made more dependable and reliable.
Despite merits, however, there are many demerits of this techniques i.e. low rate of
return, can only be used only when the respondents are educated, ambitious replies,
inflexible, difficult to know whether the replies are given by the actual respondents and it
is the slowest among other methods(Tull & Hawkins, 1988). Though by conducting a
pilot survey for testing the questionnaires however would have minimized these
deficiencies but this method of survey was not found feasible for this research because of
above stated demerits. 2) a telephonic interview can also be used to collect data. It plays
an important part in the industrial surveys particularly in developed regions because of
high rate of response, no requirement of field staff, more flexible then mailing method,
faster then other methods, quick way of obtaining information, replies can be recorded
without causing embarrassment to respondents, while instant data analysis is possible by
means of computer aided telephone interviewing and this method may be more
economical as compared with personal interviewing Miller and Whichker(1999). This
method was used for follow up for getting financial data from some companies. 3) an
Internet can be used as an advanced technique for collecting data, whereby the

168
interviewer intaracts the respondent through a computer by an instant messenger or mail.
This technique was also not used, as it again needed a continuous contact with the
respondent with no break in conversation, which was difficult. Moreover, it was not sure
that the contact is being made with the actual respondent or not. If the questionnaire
would have been sent through e-mail it might again taken long time to receive reply and
would have encounterd all other same difficulties as mentioned above in ‘mail’
problems.
Another method available for the collection of primary data is the personal interview
method. Hays(2000) says that an Interview can be classified into two types one is non-
directive also called uncontrolled, unguided and unstructured interview. In this type of
interview, the interviewer does not follow any list of predetermined questions.
Interviewer allows the interviewee to narrate his own experiences in the manner he will
like to. He is also permitted to give his own definition of a particular social situation and
also importance of events from his viewpoint. The second type is the directive interview.
In this method of interview, there are predetermined questions, which the interviewer is
required to put on the interviewee to collect information of his purpose. All respondents
in this are required to reply to the same questions, but each one has his own meanings to
the questions and replies accordingly. In this alternative answers can also be provided
with the result that all these questions can be only closed questions. But some questions
can also be open ended as well and as such the interviewee might like to reply the way he
likes to reply. In case the reply given by the respondent is either not satisfactory or not to
the point the question can be repeated(Hays, 2000).
In social research interview method is becoming increasingly popular. According to Tull
and Hawkins(2003) personal interviewing is the best technique when the interview is
likely to be fairly complicated and the period involved is lengthy. This technique is
widely used in research. Willing(2004) narrates that in this method the interviewer
himself approaches the investigator, puts questions to him and himself records the replies
usually not bringing to the notice of the respondents. In this system there is a direct
contact between the respondent and the informant. There are different methods of
interview and the system has its own advantages and as well as limitations.

169
In personal interviewing, the interviewer submits questions to the respondent in a face-to-
face situation. Questions can be explained to the respondents and the interviewer can
judge whether or not the respondent fully understands the questions. Moreover, the level
of response is also higher, as in face-to-face situation it is not possible to refuse a request
for an interview. Therefore, more information in greater depth can be obtained.
Kothari(2005) says that interview method is the best method because of its flexibility in
getting more information, securing the most spontaneous reactions and collecting
supplementary information about the respondents and the problems.
In order to collect the primary data, survey based structured questionnaire, are undertaken
within the organizations. As discussed above since in this type of questionnaire, questions
and response categories are straight forward, respondents find it easier and convenient to
answer the questions. Data analysis is easy and fast as the answers are more or less
standardized. It is, however, not unusual, as stated by Parasuraman(1986), for a
structured questionnaire to include a few open ended questions to allow the respondent an
opportunity to comment more fully on some important issues., with special reference to
the area identified in the literature review and keeping in view of the merits of personal
interview. For the purpose of this research keeping in view of the benefits, despite some
limitations, the survey through questionnaire methods with a structured close ended
questionnaire in personal interview method was considered to be the most appropriate for
fulfilling the objectives of this study and therefore was used by the researcher for this
research.
Data Limitation
6.5.0. In this research, the research problems have been analyzed for the last decade i.e.
from 1994 to 2004, because of the reasons that many companies operating in Pakistan
were either not using IT before 1994 or IT had very little introduction and computers
were being used merely as a word processing tools. So it was difficult to measure any of
significant IT impact on management performance before above mentioned period. There
were six hypotheses set for this study based upon research questions. Data needed for six

170
hypotheses was requiring descriptive answers or ‘tick mark’ on an apporopirate reply.
The researcher, therefore, did not find any problem in getting the required information, as
the respondents were personally interviewd and were explained of questionnnairs.
However, the researcher did find great difficulties in obtaining the replies for financial
data i.e income/IT expense data, which was required for first hypothesis. Among others,
one of the major objectives of this research was to analyze Income vs. IT expenses since
year 1990 to year 2004, to know about impact of IT on performance of organizations in
term of increase/decrease in income and no of employees. So to perform this analysis it
was manadatory required to have income and IT expenses data of the sample companies
for the years 1990-2004. But, it has become very difficult to find out such data
particularly IT expenses for that period, for all the companies in sample. As neither this
data, particularly IT expenses were reported in any separate head of accounts in the
annual reports of these companies, nor was the management of these companies willing
to provide this information on various grounds.
As this data was considered very important for this research, so the researcher has tried
his level best from all corners/sources to approach the management of these companies
for this data but in vain. At last the researcher managed to approach by some sources to
the Managing Director State Bank of Pakistan (Central Bank of Pakistan) and a Director,
Security and Exchange Commission of Pakistan (SECP) and requested them to ask these
companies to provide them this data, which will later be used by the researchers. On
researcher’s request the SBP and SEAP managements were kind enough to officially ask
these companies to provide them this data directly for their own use. Despite SBP &
SECP efferts and directives even then most of the companies again declined to provide
such old data citing confidentiality and busy schedules as reasons. However, by this way
the researcher managed to collect some data through SBP & SECP in one year period
from some companies. Therefore, Income & IT expense analysis for test of first
hypothesis of this research is limited to those companies and for those years for which the
data is received. So, for analysis of Income Vs IT expense, the companies are therefore
divided into two groups as given in Table 6.1 & 6.2 given below. The response rate for
171
financial data was 42% for the year 1990-2004 and 67% for the year 1999-2004. For rest
of the questions/data the response rate was almost 100%.
Sample Size
6.6.0 There are two population groups for this research. One is the banking sector local
and multinational and the other is large manufacturing organizations again both local and
multinationals, which are making use of IT. The reasons to select the above-mentioned
sectors are that; 1) the banking sector of Pakistan is the most organized sector of the
service industry and highly IT user 2) this sector has made much more investments in IT
than any other sectors to achieve high performance 3) IT has met greater introduction in
banking sectors for performance improvements since 1992 because of throat cut
competition due to establishment of many new banks in the private sector or due to
privatization of many nationalized banks.
The second sector of study i.e manufacturing is the next best user of IT. A large number
of local and foreign manufacturing companies are working in Pakistan and are using IT
for their business processes since long. Many companies in both the sectors have state-of-
the-art technologies for improving their performance. The management of these
organizations has also made numerous investments in IT with the hope to increase their
efficiency. Keeping in view of the above reasons the researcher believed that a fine study
would have been undertaken and selecting the aforementioned sectors as research study
could make the best conclusions of the research. In the sample from the above sectors a
total of 48 companies (24 locals and 24 foreign) are selected both from banking and
manufacturing sectors which have started business in Pakistan before 1992. List of
sample companies is given in Table 6.3 and 6.4. There are about 40 commercial banks
operating in Pakistan(SBP, 2005). Out of these 40 banks, 24 banks are included in the
sample because of the reasons that many other banks are either set up in few years back
or do not have well established network in Pakistan, therefore, they do not serve the
purpose of this research.There is no definite information available relating to the size of
large manufacturing sector. According to an estimate about 3000 large-scale
manufacturing units are operating in Pakistan(Saeed, 2003). Therefore, in the sample,
from the manufacturing sector, a total of 24 large size well reputed organizations are

172
included. These companies have been established before 1992 and having well
established set up in Pakistan. The sample size could have been increased but the nature
of problem seems to be similar in each case. So the chosen sample size is considered to
be sufficient. The companies selected are those using latest Information Technology and
have also well established IT set up.
The participants in the study were categorized as follows; the staff and senior managers
of finance, human resources, marketing and IT departments of the companies in sample.
Two persons from each department were interviewed so eight respondents from each
company. The responses of all eight respondents of each company were compiled
together and a single/one reply of each company for all the questions is derived. So in
total there were 48 replies in total for all 48 companies for all questions. Most of the data
were captured through personal directive interviews using a structured close-ended
questionnaire.
Table 6.1: Group 1: (Companies for which data was available for year 1990 to 2004
A. Foreign Banks B. Local Banks 1. ABN Amro 1. Allied Bank Ltd. 2. Bank Of Tokyo 2. Bank Of Punjab 3. Deutsche Bank 3. First Women Bank Ltd. 4. HSBC Bank 4. Muslim Commercial Bank Ltd. 5. HBL AZ-Zurich 5. National Bank Ltd.
C. Foreign Manufacturing D. Local Manufacturing 1. I.C.I Pakistan Ltd. 1. Atlas Honda Ltd. 2. Pakistan Tobacco Ltd. 2. D.G. Cement 3. Suzuki Pakistan Ltd. 3. Lakson Tobacco 4. Simens Pakistan Ltd. 4. Service Industries 5. Uni Lever Pakistan Ltd. 5. Packages Ltd

173
Table 6.2: Group 2: In this group three more companies in each sector of group 1 are added and the data is available for the years 1999-2004. A. Foreign Banks B. Local Banks
1. ABN Amro 1. Allied Bank Ltd. 2. Bank Of Tokyo 2. Bank Of Punjab 3. Deutsche Bank 3. First Women Bank Ltd. 4. HSBC Bank Ltd. 4. Muslim Commercial Bank Ltd. 5. HBL AZ-Zurich 5. National Bank Ltd. 6. Citi Bank 6. Askari Bank Ltd. 7. Standard Chartered Bank 7. Bank Al-Habib Ltd. 8. Oman Bank Ltd. 8. Metropolitan Bank Ltd.
C. Foreign Manufacturing D. Local Manufacturing 1. I.C.I Pakistan Ltd. 1. Atlas Honda Ltd. 2. Pakistan Tobacco Ltd. 2. D.G. Cement 3. Suzuki Pakistan Ltd 3. Lakson Tobacco 4. Simens Pakistan Ltd. 4. Service Industries 5. Uni Lever Pakistan Ltd. 5. Packages Ltd 6. Bata Pakistan Limited 6. General Tyre Ltd 7. L.G Pakistan Limited 7. Indus Mtors Ltd 8. Reckitt Benkiser Limited 8. Honda Atlas Ltd
List Of Companies In Sample The list of companies surveyed for this study is given as under.
Table 6.3: Banking Sector
List Of Local Banks List Of Foreign Banks
1 Habib Bank Ltd. 1 American Express Bank Ltd.
2 National Bank Ltd. 2 Citibank N.A.
3 United Bank Ltd. 3 Habib Bank AG Zurich
4 Muslim Commercial Bank Ltd 4 Algemene Bank Netherland (ABN Amro)
5 Bank Al Habib Ltd 5 Internaional Islamic Bank
6 Metropolitan Bank Ltd. 6 Deutsche Bank A.G.
7 Bank Of Punjab 7 Rupali Bank Ltd.
8 Askari Commercial Bank Ltd. 8 Standarad Charterd Bank
9 Bank Alflah Ltd. 9 Oman International Bank Ltd.
10 Allied Bank Ltd. 10 Bank Of Tokyo Ltd.
11 Faisal Bank Ltd. 11 Mashraq Bank Ltd.
12 First Women Bank Ltd. 12 Hong Kong & Shangai Bank Ltd.

174
Table 6.4: Manufacturing Sector
List Of Pakistani Manufacturing Companies.
List of Foreign Manufacturing Companies
1 Packages Ltd 1 Uni Lever Pakistan Ltd.
2 General Tyres Ltd. 2 Reckett Benkiser Pakistan Ltd
3 D.G. Khan Cement Ltd 3 Procter & Gamel Pakistan Ltd.
4 Atlas Honda Cars Ltd. 4 Philips Electrical Company Ltd.
5 Pakistan Steel Ltd. 5 Siemens Pakistan Ltd.
6 P.E.C.O Ltd. 6 I.C.I Pakistan Ltd.
7 Lakson Tobacco Ltd. 7 Nestle Pakistan Ltd.
8 Indus Motor Ltd. 8 Colgate Pakistan Ltd.
9 Service Industries Ltd 9 Pakistan Tobacco Ltd.
10 P.E.L Ltd. 10 Suzuki Pakistan Ltd.
11 Dawllance Pakistan Ltd 11 Bata Pakistan Ltd.
12 Honda Atlas Ltd. 12 L.G Pakistan Ltd.

175
References: Baker, T.L(1999), “Doing Social Research”, Mc Graw-Hill Companies, pp 30-74. Choudrie J. & Dwivedi Y.K(2005), “Investigating the Research Approaches for
Examining Technology Adoption Issues”, Journal of Research Practice, Vol 1, issue 1, 2005.
Fink Arlene(2005), “Conducting Research Literature Review”, 2nd edition, Sage
Publications, Inc., U.K. pp51-148.
Goodwin, J.C(1995), “Research in Psychology: Methods and Design”, John W. & Sons. Hays, N(2000), “Doing Psychological Research: Gathering And Analyzing Data”,
Philadelphia: Open University Press. Kinnear, T.C and Tylor, J.R(1997) “Marketing Research: An Applied Approach”, 3rd
Edition. New York, McGraw Hill. Kothari C.R(2005), “Research methodology-Methods & Techniques”, 2nd Edition, New
Age International Ltd. Publisher, New Dehli, India. pp1-23, 34-35,95-121. Leary Zina O’(2005), “The Essential Guide to doing research”, Pak book Corporation,
Lahore, Pakistan. pp85-100, 150-183. Miller, G.J & Whichker, M.L(1999), “Handbook of Research Methods in Public
Administration”, Marcell Dakker, Inc. pp 181-203. Neuman W. Lawrence(1999), “Social Research Methods, Qualitative and Quantitative
Approaches”, 3rd edition., U.S.A. Allyn & Bacon Publisher. Parasuraman, A(1986), “Marketing Research”, Mass.,Addison-Wesley. Reddy R, Jayaprakash(2004), “Research Methodology”, A. P.H Publishing Corporation
New Dehli, India.pp 11-16. Saeed, Khawaja Amjad(2003), “Economy Of Pakistan”, Ibne Hasan Printing Press
Karachi. pp 71-72. Somekh Bridget & Lewin Cathy(2005), “Research Methods in the Social Sciences”,
Vistaar Publications, New Dehli, India. pp197-236.
Tull, Donald S and Hawkins, Del I.(1988), “Marketing Research”, Macmillan, NY. Willing, C(2001) “Introducing Qualitative Research in Psychology: Adventures in
Theory and Methods”, Philadelphia: Open University Press. Zikmund, W.G(2000) “Exploring Marketing Research”, 7th edition, U.S.A, Thomson
Learning.

176
Chapter
Data Analysis And Interpretation
General 7.1.0 This chapter presents the analysis and interpretation of the data collected for this study.
Quantitative and qualitative data were collected from in-depth interviews and official documents,
detailing different aspects pertaining to the study. A series of hypotheses were formulated to test
different issues as discussed in previous chapter, relating to IT investment impact on
organizational performance, IT adoption problems, impact of socio-
culture/organizational/systemic variable on IT usage and different organizational measures to
overcome these problems.
Data Analysis Methods:
7.2.0 The general purpose of hypothesis testing is to determine whether the sample data support
or refute a hypothesis about the population. The hypothesis testing is a statistical procedure that
allows researchers to use sample data to draw inferences about the population of interest. To test
all hypotheses of this study, analyses were carried out by statistical and financial techniques. The
statistical software packages named SPSS 12.0 and Minitab 14.0 have been used for analysis.
According to the problem/requirement, statistical techniques such as Linear Regression Model,
One Way ANOVA, t-Test, z-Test, Cross Tabulation and Chi-Square test etc. have been applied.
The statistical/financial technique used for each hypothesis is discussed with the respective
hypothesis discussions.
The rationale to use these methods is that 1) the regression technique is best fitted for finding
straight line for a set of data over a time scale (Gravetter and Wallnau, 2000). 2) Analysis of
variance (ANOVA) is a hypothesis testing procedure that is used to evaluate mean differences
between two or more treatments (or populations). As with all inferential procedures, ANOVA
uses sample data as the basis for drawing general conclusions about populations(Fink, 2005). 3)
7

177
The t-Test/z-Test is the most elementary method for testing a hypothesis about a population
mean or for comparing two groups’ mean score. It assumes that the variables in the populations
from which the sample is drawn are normally distributed, and also that the populations have
homogeneity and that they deviate equally from the mean(Kothari, 2004; Zikmund, 2000).
It may appear that ANOVA and t-Test are simply two different ways of doing exactly the same
job: testing for mean differences. In some respect, this is true, however, ANOVA has a
tremendous advantage over t-Test that it can be used to compare two or more
treatments(Neuman, 1999). 4) The chi-square test for goodness of fit uses sample data to test
hypotheses about the shape or proportions of a population distribution. The test determine how
well the obtained sample proportions fit the population proportions specified by the null
hypothesis(Willing, 2001; Reddy, 2004). In some hypotheses the analysis was performed using
chi-square test. This was done as a measure of test of no association between two attributes.
Scheffe test has also further been applied in certain cases for pair-wise comparison when the null
hypothesis in ANOVA was rejected of different sectors. As being independent of each other,
different hypotheses of this study have used any one or more out of above mentioned
techniques/methods as per requirement. The SPSS and Minitab results included computing
relevant test statistic such as regression coefficient(β coefficient), t-test statistic (or F-test statistic),
degree of freedom (df) and the p-value.
The following discussion presents the analyses/results of different hypotheses of the study with
conclusion of every hypothesis at the end of each section. The overall conclusion of the chapter
is given at the end. In each of the following sections, the research hypotheses have been stated at
the beginning. The research hypothesis is then taken as alternative hypothesis in the statement of
statistical hypothesis.
Hypothesis 1
7.3.0 Research Hypothesis No 1: “ IT investments have impact on the performance of an
organization”.
This can be translated in form of statistical hypotheses as:
H0: IT investments have no impacts on performance of the organizations.

178
H1: IT investments have impacts on performance of the organizations.
In order to test the above hypothesis, the performance of an organization has been measured in
two ways:
1) In quantitative/financial terms: The above mentioned hypothesis has been tested by
measuring:
(a) Increase/decrease in net income, after usage of IT.
(b) Increase/decrease in the proportion of employees as the IT is used.
Time series data was available about both these variables. Simple linear regression model was
fitted taking IT expenses as independent and income as dependant variables. Summary of
regression results are presented in Tables 7.1(a,b,c,d) to 7.2(a,b,c,d) and 7.3.
2) Assessing the performance indicators: by assessing the impacts of IT on other performance
indicators i.e customer satisfaction, stake holder confidence, customer/ supplier links, company
image, job interest of employees and on inter office/links communications.
In the discussion presented herein we examined the impact of IT on management performance by
performing the quantitative analysis of net income, IT expenses, total and IT employees. In
interpretation, results of each company are discussed separately then comparison has been made
between the Local & Foreign Banks, Local and Foreign Manufacturing Companies, Banking and
Manufacturing Sectors. The discussion is also made on all the companies overall. The details of
net income, IT expenses, total and IT employees of all the organizations are given in Annexure-
XXIII.
1) Quantitative Analysis.
i) Banking Sector.
a) Foreign Banks: The regression analysis shows that IT has no impact on the incomes of
the Bank of Tokyo, Deutsche Bank and HSBC bank as p-values or marginal significance
levels for these banks are above 0.05. IT has positive impact on the incomes of ABN Amro
and Habib Bank AG Zurich as p-values or marginal significance levels for both these banks
are far below 0.05. All regression coefficients are positive showing that with the increase in

179
expenditure on IT, the incomes of these banks have substantially increased. Analysis is also
made for all foreign banks as a whole for group 1 and group 2(Tabel 6.3 & 6.4). For both
groups, it was found that IT has significant impact on income of all foreign banks operating
in Pakistan (p-value < 0.05).
Regression Results Summary (α = 0.05) For Banking Sector
Table 7.1(a) Year 1990-2004 Income = a+b(IT expense)
S/No Bank Name Results
β coefficient t-Statistics p-value 1 All Banks : n=10 7.179 8.661 .000 2 All Foreign Banks: n=5 4.458 10.573 .000 3 All Local Banks: n=5 7.726 5.929 .000 4 ABN Amro 7.487 15.187 .000 5 HBL AG Zurich 12.919 9.829 .000 6 Bank of Punjab 3.214 2.574 .023 7 First Women Bank 8.264 3.673 .003 8 Muslim Commercial Bank 10.791 8.871 .000 9 National Bank of Pakistan 7.316 2.510 .026
Regression Results Summary (α = 0.05)
For Manufacturing Sector Table 7.1(b) Year 1990-2004 Income = a+b(IT expense)
S/No Company Name Results
β coefficient t-Statistics p-value 1 All Companies: n=20 4.357 4.357 .000 2 All Local Manufacturing: n=5 4.148 3.071 .003 3 Atlas Honda 12.157 2.686 .019 4 Lakson Tobacco 12.509 7.885 .000 5 Suzuki 61.397 4.898 .000 6 P.T.C 1.956 2.182 .048 7 Siemens 1.624 5.927 .000
Regression Results Summary (α = 0.05)
For All Companies Table 7.1(c) Year 1999-2004 Income = a+b(IT expense)
S/No Company Name Results
β coefficient t-Statistics p-value 1 All Companies: n=20 0.02.798 2.685 .008 2 All Banking Sector: n=10 0.04.57 6.159 .000 3 All Local Banks: n=5 0.03923 4.432 .000 4 All Foreign Banks 0.155 9.453 .000
Regression Results Summary (α = 0.05)
For All Companies Table 7.1(d) Year 1999-2004 Income = a+b(IT expense)
S/No Company Name Results
β coefficient t-Statistics p-value 1 All Companies n=32 0.03496 4.258 .000

180
2 All Banking Sector n=16 0.04879 7.903 .000 3 All Local Banks n=8 0.04024 4.953 .000 4 All Foreign Banks n=8 0.09181 10.714 .000 5 All Local Manufacturing n=8 0.03068 2.680 .010
Regression Results Summary (α = 0.05)
For Banking Sector Table 7.2(a) Year 1990-2004 Income = a+b(IT expense)
S/No Bank Name Results
β coefficient t-Statistics p-value 5 Bank of Tokyo 15.788 2.128 .053 6 Deutsche Bank -.466 -.172 .866 7 HSBC 11.273 1.405 .184 9 Allied Bank Limited .288 .047 .963
Regression Results Summary (α = 0.05)
For Manufacturing Sector Table 7.2(b) Year 1990-2004 Income = a+b(IT expense)
S/No Company Name Results
β coefficient t-Statistics p-value 1 All Manufacturing Companies: n=10 .118 .285 .776 2 All Foreign Manufacturing: n=5 -.275 -.423 .674 3 D.G. Cement 1.171 .374 .715 4 Packages 70.706 1.869 .084 5 Service -.701 -.112 .913 6 I.C.I Pakistan .496 .226 .824 7 Uniliver Pakistan -.960 -.761 .460
Regression Results Summary (α = 0.05)
For all Companies Table 7.2(c) Year 1999-2004 Income = a+b(IT expense)
S/No Company Name Results
β coefficient t-Statistics p-value 1 All Manufacturing Sector: n=5 -0.0153 -.648 .519 2 All Local Manufacturing: n=5 0.01588 1.165 .254 3 All Foreign Manufacturing n=5 -0.03544 -1.210 .236
Regression Result s Summary (α = 0.05)
For all Companies Table 7.2(d) Year 1999-2004 Income = a+b(IT expense)
S/No Company Name Results
β coefficient t-Statistics p-value 1 All Foreign Manufacturing n=8 -0.005.53 -.203 .840 2 All Manufacturing n=16 0.001141 .073 .942
Regression Results Summary
For Total and IT Employees (n=20) Table 7.3 Year 1990-2004 :IT employee % of the total employee = a+b(time)
S/No Organizations Results
t-Statistics P-value 1 All Companies 20.886 .000

181
2 All Banks 13.576 .000 3 All Foreign Banks -1.288 .220 4 All Local Banks 13.953 .000 5 All Manufacturing 16.565 .000 6 All Local Manufacturing 12.428 .000 7 All Foreign Manufacturing 17.500 .000
Years: Independent variable IT Employees %age to Total Employees: Dependent variable
As depicted in graph in Annexure II, total no of employees in foreign banks have been
increased continuously from the year 1990 to 2004, despite of the facts that IT has been
applied in all operations of the banks. The IT has not reduced the number of employees as
anticipated by some circles due the reasons that most of the banks in this sector have
introduced new products or services during this period, so the work load has increased,
therefore, staff strength has also increased. It has also been observed that there are floating
trends in the strength of IT employees. As graph in Annexure I indicates that IT employees
have increased for years 1990-1993, decreased from 1994 to 1997 but again increased from
1998 onwards and that increase is due to increase in IT activities because of raised volume
of transactions, introduction of new products/services and increasing competition with the
local banks in offering online/ computerized services. The net income for these banks for the
years 1990-2004 is PKR 11.429 billions and IT expenses are PKR 1.716 billions which
comes to 15.02% of net income but net income for these banks for the years 1999-2004
comes to PKR 18.616 billions and IT expense are PKR 2.460 billions which are 13.21% of
net income.
b. Local Banks: It is revealed from regression analysis that IT has impact on the income
of most of the local banks i.e. Bank of Punjab, First Woman Bank, Muslim Commercial
Bank and National Bank of Pakistan (p-vale or marginal significance level is far below 0.05)
Table 7.1(a). But IT has no impact on income of one bank, i.e Allied Bank (p-value > 0.05).
Overall it is also found that IT has positive impact on income of all the local banks for group
1 and 2 as for both groups (p-value <0.05).All regression coefficients are also positive which
shows that with the increase in expenditure on IT, the incomes of these banks have increased
significantly. Table 7.1(a)
As shown in graph in Annexure IV, there has been decrease in total no of employees of local
banks. It is not because of IT but it is due to restructuring and privatization of most of local
182
banks. For right sizing purpose many employees were laid off by offering ‘golden hand
shakes’ schemes. Contrary, as also presented in Annexure III, there has been gradual
increase in the IT employees, due to increase in workload for up gradation,
computerization/making online of many branches as per industry or customer need.
Moreover, net income for these banks for the years 1990-2004 is PKR 28.040billions and IT
expense are 4.186 billions with a ratio of 14.93%, whereas net income for these banks for the
years 1999-2004 is PKR 28.710 billions and IT expenses are 4.479billions with an increased
ratio of 15.60%.
c. All Banks : Turning to the overall performance of all the banks for group 1 & 2, it is
observed that IT expenditure has impact on the income of all these banks (p-values< 0.05). A
positive regression coefficient supplements our results that increase in expenditure on IT
significantly increases the incomes of these banks.
To further examine the performance, trend analysis for IT spending and net income is carried
out. It is noted that there is increase in income with proportional increase in IT expenditure of
all banks. Detailing it, the net income for all the banks for the years 1990-2004 is PKR
39.470 billions, IT expenses are 5.902billions, which are 14.95% of net income. The net
income for all the banks for the years 1999-2004 for group 2 is PKR 47.327 billions and IT
expenses are 6.939 billions, which are 14.66% of net income. While the net income for all
foreign banks for the year 1999-2004 is PKR 7.44billions and IT expenses are 1.050billions
which are 14.12% of the net income for the same period, but these expenses are 61.20% of
total IT expenditure out of the year 1990-2004. That means that the companies have been
spending large amounts during the last six years in their IT operations. The same case is for
all local banks i.e. the net income for all local banks for the year 1999-2004 is PKR 18.773
billions and IT expenses are 3.454billions which are 18.40% of the net income for the same
period but these are 82.53% of total IT expenditure from the year 1990-2004. That also
shows that there are high increasing trends in IT expenditures in local banks in the past six
years (1999-2004). Surprisingly, the same results are found for the entire banking sector i.e.
the net income for all the banks for the year 1999-2004 is PKR 26.213 billions and IT
expenses are 4.505 billions which are 17.19% of the net income for the same period but

183
these expenses are 76.33% of total IT expenditure for the year 1990-2004. It indicates that
there is high increase in IT expenditures in the entire banking sector during the years 1999-
2004.
To investigate the linkage between the IT expenditure and increase/decrease in number of
total and IT employees, we observed that during the sample period, the number of IT
employees have increased in the banking sector but total employees have been decreased
Annexure XI & X. Further, our regression analysis also shows (Table 7.3) that this increase
has positive impacts on income (p-value < 0.05). Table 7.4(a,b,c) and Figures 7.1 to 7.3
report the summary of net income/ IT expenses and % increase/decrease of income to
expenses. Income & IT Expense Comparison for All companies for the year 1990-2004
Table 7.4 (a) For Group 1 : n=20
Sector Net Income IT Expenses Expenses %of income
Foreign Banks 11,429,932,000 1,715,997,260 15.02
Local Banks 28,040,686,000 4,185,681,800 14.93
Total Banking Sector 39,470,618,000 5,902,679,060 14.95
Local Manufacturing 14,118,508,000 1,374,077,480 9.73
Foreign Manufacturing 22,371,542,000 10,453,731,000 46.73 Total Manufacturing Sector 36,490,050,000 11,827,808,480 32.41
Total All Companies 75,960,668,000 17,730,487,540 23.34 Figure 7.1
Comparison of Income & IT Expenses for Comapanies for the year 1990-2004
0%10%20%30%40%50%60%70%80%90%
100%
Fore
ign
Bank
s
Loca
l Ban
ks
Tata
l Ban
king
Sect
or
Loca
l
Man
ufac
turin
g
Fore
ign
Man
ufac
turin
g
Tata
l
Man
ufac
turin
g
Sect
or
Tota
l All
Com
pani
esExp
ense
% o
f Inc
ome
Series1 Series2
Series 1 Show the Income Series 2 Show the Expense % of Income
Income & IT expense Comparison for all companies for the year 1999-2004 Table 7.4 (b) For Group 1 : n=20
Sector Net Income IT Expenses Expenses %of income %age of 1999-2004 expenses to 1990-2004 Expenses
Foreign Banks 7,440,175,000 1,050,855,000 14.12 61.2
Local Banks 18,773,824,000 3,454,532,500 18.4 82.53 Total Banking Sector 26,213,999,000 4,505,387,500 17.19 76.33 Local Manufacturing 9,791,169,000 950,434,480 9.71 69.17

184
Foreign Manufacturing 16,439,359,000 5,934,785,000 36.1 56.77 Total Manufacturing Sector 26,230,528,000 6,885,219,480 26.25 58.21
Total All Companies 52,444,527,000 11,390,606,980 21.72 64.24
Figure 7.2
Comparison of Income & IT Expenses for Comapanies for the year 1999-2004
0%20%
40%60%
80%100%
Fore
ign
Bank
s
Loca
l Ban
ks
Tata
l Ban
king
Sect
or
Loca
l
Man
ufac
turin
g
Fore
ign
Man
ufac
turin
g
Tata
l
Man
ufac
turin
g
Sect
or
Tota
l All
Com
pani
esExp
ense
% o
f Inc
ome
Series1 Series2
Series 1 Show the Income Series 2 Show the Expense % of Income
Income & IT Expense Comparison for all Companies for the year 1999-2004 Table 7.4(c) For Group 2 : n=32
Sector Net Income IT Expenses Expenses %of income
Foreign Banks 18,616,763,000 2,460,082,000 13.21
Local Banks 28,710,716,000 4,479,494,500 15.60 Total Banking Sector 47,327,479,000 6,939,576,500 14.66 Local Manufacturing 16,455,436,909 1,436,243,780 08.73 Foreign Manufacturing 17,604,147,000 6,055,853,900 34.40 Total Manufacturing Sector 34,059,583,909 7,492,097,680 22.00
Total All Companies 81,387,062,909 14,431,674,180 17.73 Figure 7.3
Comparison of Income & IT Expenses for Comapanies for the year 1999-2004
0%20%
40%60%
80%100%
Fore
ign
Bank
s
Loca
l Ban
ks
Tata
l Ban
king
Sect
or
Loca
lM
anuf
actu
ring
Fore
ign
Man
ufac
turin
g
Tata
lM
anuf
actu
ring
Sect
or
Tota
l All
Com
pani
esExp
ense
% o
f Inc
ome
Series1 Series2
Series 1 Show the Income Series 2 Show the Expense % of Income
ii. Manufacturing Sector

185
a. Local Manufacturing Companies : The regression analysis shows that IT has
positive impacts on the incomes of the local manufacturing companies i.e Atlas Honda and
Lakson Tobacco (p-values < 0.05). But IT has no impact on the income of D.G. Cement,
Packages and Services Industries, (p-value > 0.05).
Further analysis for all local manufacturing companies for the years 1990-2004 and 1999-
2004 shows that IT has positive impacts on income of all the local companies as p-value is
far below .05 for group 1 and 2 (Table 6.1 & 6.2). The regression coefficient for these
companies is positive, which indicates the decisive impact of IT on income. At the same
time, net income for these companies for the years 1990-2004 is PKR 14.118 billions and IT
expenditures are 1.374 billions which are only 9.73% of net income. Whereas, net income for
the year 1999-2004 is 9.791 billions and IT expenses are 950,434,480 that are 9.71% of the
net income of 1999-2004 but 69.17% out of total IT expenditure of 1990-2004. For group 2
the net income for these companies for the years 1999-2004 is PKR 16.455 billions and IT
expense are 1.436 billions which are low as 8.73% of net income.
As seen from graph in Annexure V & VI, there is a gradual increase in total and IT
employees till year 2002. It is due to the facts that some of these companies have expanded
their operations during these years and consequently the volume of transaction/job has been
increased, resulting therein an increase in staff strength. After year 2002, there is a slight
decrease in IT employees because of the reasons that some of these companies have
implemented S.A.P and their major IT systems are being maintained by outsourced staff of
SAP provider.
b. Foreign Manufacturing Companies : It has also been observed from regression
analysis that IT has no impact on the incomes of I.C.I and Unilever Pakistan Ltd (p-values
> 0.05). Furthermore there are three companies, SIMENS Pakistan Ltd, Suzuki Ltd and
P.T.C for which IT has positive impacts on the income (p-value< 0.05). Our analysis for
group 1 and for group 2 presents that IT has no impacts on income of foreign companies as
overall (p-value>0.05). The net income for these companies for the years 1990-2004 is PKR

186
22.371 billions and IT expense are 10.453 billions, which are high as 46.73%. Where as net
income for the year 1999-2004 is 16.439 billions and IT expenses are 5.934 billions, which
are 36.10% of the net income but 56.77% of the total IT expenditure from 1990-2004.
For group 2, net income for the years 1999-2004 is PKR 17.604 billions and IT expense are
6.055 billions, which are 34.40% of net income.
Like local companies, there has been an increase in total and IT employees. Graphs in
Annexure VII & VIII represents these results. Again this increase is considered due to
expansion in production over the period of last ten years. It is because of this, that the volume
of transactions/jobs and employees have been increased

187
c. All Manufacturing Companies: The overall analysis of all the manufacturing
companies for group 1 & 2 further validated that IT has no impacts on income of all the
manufacturing companies (p-value >.05). But surprisingly, there is marvelous increase in the
net income for all the manufacturing companies for the years 1990-2004, i.e. PKR 36.490
billions and IT expense are 11. 827 billions being 32.41% of net income. For the years 1999-
2004 net income for these companies is 26.230 billions and IT expenses are 6.885 billions
which are 26.25% of net income. There is an increase in the IT expenses during the last six
years i.e. 1999-2004 as IT expense ratio of net income is 58.21% out of the total IT expenses
for the years 1990-2004 despite of the above facts that IT is not contributing more to incomes
of these companies. There is an increase in total and IT employees and this increase is due to
the same reasons as mentioned above. Graphs in Annexure XI & XII present clearly these
effects.
For group 2 the net income for all the manufacturing companies for the years 1999-2004 is
PKR 34.059 billions and IT expense are 7.492 billions which are 22% of net income. The
regression coefficient is positive for this group. Similar to group 1, the same pattern of
increase in total and IT employees appears.
It is more obvious if we look into the computer usage statistic of manufacturing companies in
Annexure XXII that only those manufacturing companies (local & foreign) dominate the
scene which have excellent IT systems and have also implemented world class S.A.P (ERP)
systems.
iii. All Companies In Both The Sectors:
After analyzing the performance of individual sector, the analysis is made to know about
performance of all the companies in banking and manufacturing sectors for group 1 and 2. As
discerned, IT has positive impacts on income of all the companies (p-value<0.05) Table
7.2(c,d). The regression coefficient is also positive which shows that there is an increase in
income after increase in IT expenses. So far net income for all the manufacturing companies
for the years 1990-2004 is concerned, it is PKR 75.960 billions and IT expenses are 17. 730
billions which are 23.34% of net income for 1990-2004. For the years 1999-2004 net

188
income for all companies is 52.444 billions and IT expenses are 11.390 billions which are
21.72% of net income. Similarly, net incomes for group 2 for all the companies for the years
1999-2004 are PKR 81.387 billions and IT expenses are 14.431 billions which are 17.73% of
net income. There appears to be constant increasing trends in the IT expenditures during the
last six years i.e. 1999-2004 in both the sectors. As the IT expense for these years for both
the sectors are 64.24% out of total IT expenses for the years 1990-2004.
So far as total and IT staff strength is concerned as reported in graph in Annexure XIII,
there is an increase in IT but decrease in total staff and reasons for this increase have already
been discussed in detail in individual banking and manufacturing sections.
iv) Conclusions
It would appear from above analyses that IT in Pakistan is being applied aggressively both in
manufacturing and banking sectors as these companies investing billions of rupees on it. It is
also evident that it is being used more efficiently in banking sector than the manufacturing
sector. The following salient points of above discussion are worth stressing that 1) the local
banking sector of Pakistan is using IT more than the foreign banks because of intensive
competition and increased branch network 2) Though multinationals in Pakistan are
seen as a means of bringing in new technology and work practices and providing training
grounds for the work force but there is high rise in IT investments in local baking sector in
the latest IT systems in the recent years as compared to foreign banking sectors as
percentage of IT expenses for the years 1999-2004 for total banking sector, are 76.33%, out
of their total IT expenses for the years 1990-2004. 3) the percentage increase in IT expenses
in local banks is 82.53% for the year 1999-2004 out of expenses of the years 1990-2004,
which is much higher than the foreign banks where %age increase is 61.20%. 4) in
comparison of local versus foreign manufacturing companies mixed trends have been
observed in IT spending. The IT expenses percentage is 69.17% and 56% respectively for
both the sectors out of incomes of years 1990-2004. But surprisingly, percentage IT expense
for local and foreign companies for the years 1990-2004 as a whole are 29.73% and 42.33%.
For group 2 these expenses %ages are 18.33 and 34 respectively. It is, therefore, evident that
overall foreign manufacturing sector is investing more in IT than the local manufacturing
sector. 5) overall, there is remarkable increase in the IT expenses and in income in return, of

189
all the companies, given to the facts that IT expenses are 17.730 billions in 1990-2004 and in
1999-2004, these are 11. 390 billions which are 64.24% of total IT expenses. The net income
is 75.960,668,000 in the years 1990-2004 and for the years 1999-2004 it is 52,44,527,000.
The percentage increase in net income thus comes to 69.04% for year 1990-2004.
We find strong evidence through above facts that though manufacturing sector is investing
much more in IT but the banking sector surpass the manufacturing sector in performance as
their incomes are very high. On the other hand the study also detected that there is an
increase in IT employees in both the sectors due to increased work because of expansion of
operations of the companies over the years but decrease in total employees because of
implementation of down/right sizing policies in local baking sector since 1990s. In line with
above results, in conclusion, we say that IT investments have positive impacts on the
performance of the organizations and we accept our research hypotheses.
2) Analysis of performance Indicators 7.3.0 This section examines the performance of both the sectors of economy i.e. manufacturing
and banking in term of increase/decrease in performance indicators. The literature identified a
number of indicators of organizational performance such as customer satisfaction, customer
suppliers links, company image, job interest of employees, stake holder’s confidence and inters
office links/communication. In the questionnaire the respondents were asked that after
implementation of IT what increase they have observed with respect to a particular performance
indicator. In this part of discussion we determine increase or decrease in these indicators after
implementing IT. The response options of respondents were anchored in a three-point scale
ranging from 1(no increase), 2(moderate increase) and 3 (high increase) for each benefit. For
discussion purpose “Substantial increase” has been defined as “above average’ i.e. average score
greater than 2. Increase in all these traits have been observed for all companies in both sectors.
For each trait two different research hypotheses have been tested as under:
Research Hypothesis No.1(b): “There has been substantial increase with respect to the given
indicator in the given sector, after implementation of IT.”
Translation of this in terms of statistical hypotheses is as under:
H0: 2≤µ

190
H1: 2>µ
This one-sided hypothesis was tested using t-test statistic at level of significance of 0.05.
Research Hypothesis No.1(bb): “The change in the given indicator after implementation of IT is
not the same in all the four sectors”.
Translation of this in terms of statistical hypotheses is as follows:
H0: 4321 µµµµ ===
H1: At least two µ’s are different.
This hypothesis was tested using one way ANOVA technique at level of significance of 0.05.
Again, the rejection of the null hypothesis means, the acceptance of the research hypothesis.
Rejection of the null hypothesis implies that not all means are same i.e. all means may be
different or some may be same or some may be different. The post hoc tests about pair-wise
comparison ( : vs.: 10 jiji HH µµµµ ≠= for ji ≠ ) were performed using Scheffe test
statistic. The benefit wise analysis is discussed in ensuing sections and summaries of ANOVA
results for all benefits are presented in Table 7.6.
1. Customer Satisfaction Research Hypothesis No 1(b1): There has been substantial increase with respect to customer
satisfaction in the given sector, after implementation of IT.
In terms of statistical terms:
H0: 2≤µ
H1: 2>µ
This one-sided hypothesis was tested using t-test statistic at level of significance of 0.05. Table
7.5 In individual sector analysis it is observed that p-value for local banks and foreign banks is
less than 0.05, and for local manufacturing and foreign manufacturing it is greater than 0.05.
Table 7.5. This implies an ‘above average’ increase in customer satisfaction for banking sector
but not so increase in manufacturing. This is confirmed when sector wise comparison is made
between banking and manufacturing sectors, again it appears that p-value for banking sector is
less than 0.05 and for manufacturing sector it is greater than 0.05. Though means for both the
sectors are greater than 2 but value of means for manufacturing sector is not so significantly
greater. It indicates that there is substantial increase in customer satisfaction in banking sector

191
but not so increase in manufacturing sector. In overall comparison of all the four sectors, we note
that p-value is far below 0.05 and average means are greater than 2. It shows that there is
substantial increase in customer satisfaction in all the four sectors. Table 7.5 represents summary
of all the results of t-test for customer satisfaction. In conclusion, we can say that after
implementing IT, there has been increase in customer satisfaction in all four sectors of the
economy and this increase has been substantial or above average in case of entire banking sector.
Results Summary of One-Sample t-Test Table 7.5 Customer Satisfaction
Sector n Mean t-statistics p-value
All Banking & Manufacturing 48 2.4 4.78 0.000
Banking 24 2.67 6.78 0.000
Manufacturing 24 2.12 1.14 0.133
Local Banks 12 2.75 5.74 0.000
Foreign Banks 12 2.58 3.92 0.001
Local Manufacturing 12 2.08 0.43 0.337
Foreign Manufacturing 12 2.17 1.48 0.083
Research Hypothesis No.1(bb1): “The change in the customer satisfaction after implementation
of IT is not the same in all the four sectors”.
Translation of this in terms of statistical hypotheses follows as:
H0: 4321 µµµµ ===
H1: At least two µ’s are different.
The ANOVA results given in Table 7.6 show that customer satisfaction has not increased in all
the sectors uniformly (p = 0.007<0.05) thus, supporting above conclusions. This represents that
all the four sectors have benefited with customer satisfaction but differently by adopting IT.
Scheffe test further revealed in pair-wise comparison that customer satisfaction level differ
between banking and manufacturing industries. There is difference between sector 1 (local
banks) and sector 4 (Local manufacturing),1 (local banks) and 3 (foreign manufacturing) as
shown diagrammatically below;
Sectors 4 3 2 1

192
Means 2.08 2.17 2.58 2.75
Figure 7.4 Schematic diagram for ordered means One way ANOVA Results Summary IT Adoption Benefits Table 7.6 For all Companies n=48
Sr. no Variable Name
ANOVA Results Average
Mean F-Value P-value
1 Customer Satisfaction 2.4143 4.655 .007
2 Better Customer/ Service Links 2.3958 7.702 .000
3 Company Image 2.7500 .277 .842 4 Job Interest of Employee 2.5833 4.423 .008 5 Stake Holder Confidence 2.5000 1.782 .165
6 Inter Office Links/Communication 2.6875 1.658 .190
We conclude our discussion on this trait by observing that in general IT has increased customer
satisfaction but this increase is greater in banking sector, particularly local banks as compared to
manufacturing sectors. The possible reason of this difference could be, that banking sector has
introduce modern technological innovations relating to interactive customer services such as
ATM, On-Line banking, Call Centers, Mobile banking, Internet banking and other E-banking
facilities, which are very much visible to the customers and they are benefiting directly from
these. Conversely, manufacturing sector has lagged behind until recently in such type of
technological services. Most of the companies in this sector are still using IT for ‘traditional
systems’ for which customer has no direct interaction/interest.
2. Better Customer/ Supplier Links Research Hypothesis No 1(b2): The customer/Suppliers links has increased substantially in the
given sector, after implementation of IT.
As described above, in statistical terms:
H0: 2≤µ
H1: 2>µ

193
To test this one-sided hypothesis t-test statistic at level of significance of 0.05 was carried out.
First we analyzed the performance of individual sector with respect to above indicator and then
performance is analyzed as a whole. This analysis revealed that p-value for local, foreign banks
and foreign manufacturing is <0.05, while for local manufacturing it is > 0.05. It implies that
although increase in customer/supplier links has been observed for all sectors but substantial
increase is in all the companies except local manufacturing. If we look at both the sectors and all
the companies combine, except for manufacturing sector, there has been substantial increase in
customer/supplier links in all companies, banking sector (p-value <0.05). Table 7.7 represents
summary of all the results of t-test for customer/supplier links.
Results Summary of One-Sample t-Test Table 7.7 Better Customer Links
Sector n Mean t-statistics p-value
All Banking & Manufacturing 48 2.42 4.25 0.000
Banking 24 2.60 4.90 0.000
Manufacturing 24 2.25 1.66 0.055
Local Banks 12 2.75 5.74 0.000
Foreign Banks 12 2.42 2.16 0.027
Local Manufacturing 12 1.75 1.39 0.904
Foreign Manufacturing 12 2.75 5.41 0.000
Research Hypothesis No.1(bb2): “The change in the customer/supplier links after
implementation of IT is not the same in all the four sectors”.
This hypothesis is translated in term of statistical form as following:
H0: 4321 µµµµ ===
H1: At least two µ’s are different.
ANOVA results as given in Table 7.6 indicates that the customer/supplier links has been
increased in all the sectors but differently (F= 7.702, p-value = 0.000,<0.05). This represents
that all the four sectors have benefited with customer/supplier links but to different extent by
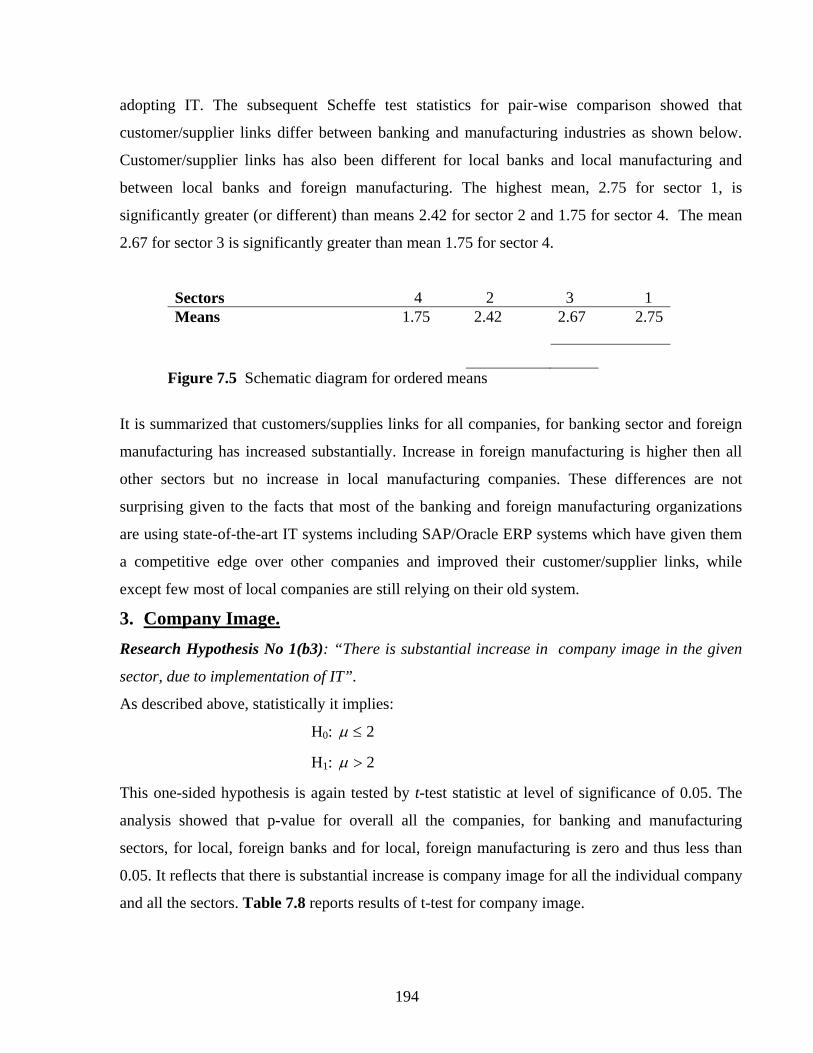
194
adopting IT. The subsequent Scheffe test statistics for pair-wise comparison showed that
customer/supplier links differ between banking and manufacturing industries as shown below.
Customer/supplier links has also been different for local banks and local manufacturing and
between local banks and foreign manufacturing. The highest mean, 2.75 for sector 1, is
significantly greater (or different) than means 2.42 for sector 2 and 1.75 for sector 4. The mean
2.67 for sector 3 is significantly greater than mean 1.75 for sector 4.
Sectors 4 2 3 1 Means 1.75 2.42 2.67 2.75
Figure 7.5 Schematic diagram for ordered means
It is summarized that customers/supplies links for all companies, for banking sector and foreign
manufacturing has increased substantially. Increase in foreign manufacturing is higher then all
other sectors but no increase in local manufacturing companies. These differences are not
surprising given to the facts that most of the banking and foreign manufacturing organizations
are using state-of-the-art IT systems including SAP/Oracle ERP systems which have given them
a competitive edge over other companies and improved their customer/supplier links, while
except few most of local companies are still relying on their old system.
3. Company Image. Research Hypothesis No 1(b3): “There is substantial increase in company image in the given
sector, due to implementation of IT”.
As described above, statistically it implies:
H0: 2≤µ
H1: 2>µ
This one-sided hypothesis is again tested by t-test statistic at level of significance of 0.05. The
analysis showed that p-value for overall all the companies, for banking and manufacturing
sectors, for local, foreign banks and for local, foreign manufacturing is zero and thus less than
0.05. It reflects that there is substantial increase is company image for all the individual company
and all the sectors. Table 7.8 reports results of t-test for company image.

195
Results Summary of One-Sample t-Test Table 7.8 Company Image
Sector n Mean t-statistics p-value
All Banking & Manufacturing 48 2.75 11.87 0.000
Banking 24 2.71 7.47 0.000
Manufacturing 24 2.80 9.35 0.000
Local Banks 12 2.75 5.74 0.000
Foreign Banks 12 2.67 4.69 0.000
Local Manufacturing 12 2.67 4.69 0.000
Foreign Manufacturing 12 2.92 11.00 0.000
Research Hypothesis No.1(bb3): “The change in the Company image links after implementation
of IT is not the same in all the four sectors”.
Translation of this in terms of statistical hypotheses is as follows:
H0: 4321 µµµµ ===
H1: At least two µ’s are different.
ANOVA results reported in Table 7.6 indicate that the company image of all the sectors is
increased uniformly (F= .277 and p-value = 0.842 >0.05). Since IT is being used extensively in
all the sectors of sample so, it has increased the company’s image in the mind of all the stack
holders of these companies. They feel that more accurate performance/results are an outcome of
IT. IT usage leaves good impression in the mind of peoples who have or not have any concern
with the company and IT has now become the necessity for daily office work, not only the
symbolic thing.
4. Job Interest Of Employees Research Hypothesis No 1(b4): “The job interest of employees has been substantially increased
in the given sector, after implementation of IT”.
As described above, statistically it implies:
H0: 2≤µ
H1: 2>µ

196
Again a one-sided hypothesis t-test statistic was used at level of significance of 0.05, which is
carried out to analyze performance of individual and all sectors with respect to above indicator.
The p-values for local banks, local and foreign manufacturing is less than 0.5 which implies that
job interest of employees in all these sectors have increased substantially. Table 7.9 below
indicates summary of results of t-test for job interest of employees.
Results Summary of One-Sample t-Test Table 7.9 Job Interest of Employees
Sector N Mean t-value p-value
All Banking & Manufacturing 48 2.56 7.19 0.000
Banking 24 2.33 2.89 0.004
Manufacturing 24 2.80 9.35 0.000
Local Banks 12 2.42 2.80 0.009
Foreign Banks 12 2.25 1.39 0.096
Local Manufacturing 12 2.83 7.42 0.000
Foreign Manufacturing 12 2.75 5.74 0.000
Research Hypothesis No.1(bb4): “The change in the job interest of employees after
implementation of IT is not the same in all the four sectors”.
Translation of this in terms of statistical hypotheses is follows:
H0: 4321 µµµµ ===
H1: At least two µ’s are different.
ANOVA results as given in Table 7.6 further prove that the job interest of employees in all the
sectors have increased but differently (F= 4.423 and p-value = 0.008 <0.05). This means that all
the four sectors have benefited with increased job interest of employees but differently by
adopting IT. Furthermore, Scheffe test statistics for pair-wise comparison reveals that job interest
of employee differ for banking and manufacturing industries as shown below. The highest mean,
2.83 for sector 4, is significantly greater (or different) than means 2.25 for sector 2. The mean
2.83 for sector 3 is significantly greater than mean 2.25 for sector 2 and 2.42 for sector 1.
Sectors 2 1 4 3 Means 2.25 2.42 2.83 2.83

197
Figure 7.6: Schematic diagram for ordered means
In brief, we conclude that IT has substantially increased job interest of employees as IT
facilitates the employees to carrying out all their daily official jobs/activities. The jobs/work
which created boredom for employees in the past now are matter of more interest because of IT
ease. In Pakistan, as discussed in length in the literature review, initially employees were
reluctant to use IT but after seeing its benefits/growth world wide, they are forced to rethink and
their dependence on IT has increased.
5. Stakeholder Confidence Research Hypothesis No 1(b5): “The stakeholder confidence has shown substantial increased in
the given sector, after implementation of IT”.
As described above, statistically it implies:
H0: 2≤µ
H1: 2>µ
To test this one-sided hypothesis, t-test statistic at level of significance of 0.05 was used. The
analysis guided to the facts that p-value for local, foreign banks and foreign manufacturing is less
than 0.05, while for local manufacturing it is greater than 0.05. It means that although increase in
stake holder confidence has been observed for all sectors but substantial increase is in all sectors
except local manufacturing. The individual and overall sector wise analysis also indicated that
there has been substantial increase in stake holder confidence in all companies and banking
sector (p<0.05) except for manufacturing sector where p >0.05. Table 7.10 exhibits summary of
all the results of t-test for stake holder confidence.
Results Summary of One-Sample t-Test Table 7.10 Stake Holder Confidence
Sector N Mean t-value p-value
All Banking & Manufacturing 48 2.50 5.31 0.000
Banking 24 2.46 3.82 0.000
Manufacturing 24 2.54 3.68 0.001
Local Banks 12 2.42 2.16 0.027
Foreign Banks 12 2.50 3.32 0.003

198
Local Manufacturing 12 2.25 1.00 0.169
Foreign Manufacturing 12 2.83 7.42 0.000
Research Hypothesis No.1(bb5): The change in the stake holder confidence after
implementation of IT is not the same in all the four sectors.
Translation of this in terms of statistical hypotheses is follows:
H0: 4321 µµµµ ===
H1: At least two µ’s are different.
To test this hypothesis again ANOVA analysis has been repeated(Table 7.6). Its results are given
in Table 7.6. There is uniform increase in stake holder confidence in all the sectors (F=1.782,
p=.165 > 0.05). This represents that all the four sectors have benefited with customer/supplier
links but in same way by adopting IT.
It is inferred overall that stake holder confidence for all companies, for banking sector and
foreign manufacturing has increased substantially. Increase in foreign manufacturing is higher
than all other sectors but no substantial increase in local companies. It can be argued that these
differences are due to the facts that use of IT in the companies has given rise to
accuracy/performance, resulting therein an increase in the confidence of its stack holders.
6. Interoffice Links. Research Hypothesis No 1(b6): “The interoffice link has been substantially increased in the
given sector, after implementation of IT”.
As described above, statistically it implies:
H0: 2≤µ
H1: 2>µ
For testing of above one-sided hypothesis, t-test statistic was applied at significance level of
0.05. The analysis shows that p-value for local, foreign banks and foreign manufacturing is less
than 0.05, while for local manufacturing it is found to be greater than 0.05. It means that there is
substantial increase in interoffice links for all sectors except local manufacturing. Table 7.11.
Results Summary of One-Sample t-Test Table 7.11 Interoffice Links
Sector n Mean t-value p-value
All Banking & Manufacturing 48 2.69 7.25 0.000

199
Banking 24 2.67 5.13 0.000
Manufacturing 24 2.71 5.03 0.000
Local Banks 12 2.67 3.55 0.002
Foreign Banks 12 2.67 3.55 0.002
Local Manufacturing 12 2.42 1.60 0.069
Foreign Manufacturing 12 2.80 7.90 0.000
Research Hypothesis No.1(bb6): “The change in the interoffice links after implementation of IT
is not the same in all the four sectors”.
Translation of this in terms of statistical hypotheses is follows:
H0: 4321 µµµµ ===
H1: At least two µ’s are different.
Similar to above indicators for test of this hypothesis too, again ANOVA procedure is applied.
Results are shown in Table 7.6 which indicate that the interoffice communication links has been
increased in all the sectors but uniformly (F=1.658, p = 0.190 > 0.05). This represents that all
the four sectors have benefited with same level increased interoffice communication.
Overall, it is observed in above analysis that interoffice communication links have been
increased for all the sectors after implementation of IT, owing to the reasons that almost all the
companies now using Internet, Intranet, though ISDN, DSL, Radio and VSAT etc links. These
links provide them speedy connectivity among their various offices spread over in remote areas,
and 24hrs of the day.
Overall Conclusion Hypothesis 1
7.3.1 From the above analyses and discussions it is observed that implementation of IT has
positive impact on working of banking and manufacturing sectors of Pakistan. This positive
impact has been demonstrated both in quantitative and qualitative terms. In general, incomes of
all the companies in all sectors have increased after introduction of IT in recent years. The IT
expenses have also been increased for the last few years. The banking sector showed good
performance and continued growth with IT as their incomes increased but manufacturing sector
provided mixed flavors. Also, with the implementation of IT, persons qualified in IT have been

200
able to secure a higher share in terms of employment. Significant improvements with respect to
qualitative measures such as customer satisfaction, customer/suppliers links, company image, job
interest of employees, stakeholders’ confidence and inter office links/communication have been
observed. Such improvements and enhancements in performance with respect to the traits
studied have been substantial in both the sectors and banking in particular. Overall,
implementation of IT has opened new and wider avenues in all the companies of both the sectors
in sample.
Hypothesis 2
7.4.0 Research Hypothesis No.2: “Organizational performance of IT based organizations is
associated with the functions/purpose IT is playing, type of Hardware/Software being used and
level of Information Systems an organization has attained”.
To test this hypothesis the organizational performance of the organization has been studied in
following perspectives.
a) IT Purpose/function analysis
b) Application Software usage analysis
c) Information Systems Level analysis
The responses of the firms were recorded in the form of yes(being used) or no(not being used),
which then are dummy coded as ‘1’ and ‘0’ for analysis purpose. As described below two
hypotheses have been tested for each of the above categories and explained separately in the
following discussions.
a) Functions IT playing in the organizations.

201
The literature has identified following functions for which IT is normally used in any
organization:
1) programming, systems development and maintenance
2) telecommunication management
3) business process reengineering
4) strategy formulation and organization transformation
5) product innovations.
First it is analyzed that for what which is the most used functions/purpose of IT and what impact
it has on organization performance. The hypothesis 2(a1) below looks at effect of any of the
functions/purposes of IT on the management performance, whereas the hypotheses 2(a2)
explores if there is any relationship between different sectors and the purpose for which IT being
employed.
Hypothesis No. 2(a1): “Organizational performance depends on the function/purpose for which
IT is being used.”
To test this hypothesis, an index has been developed to measure ‘organizational performance’ by
adding the scores of each company on all five performance indicators used in second part of the
first hypothesis i.e. customer satisfaction, customer/suppliers links, company image, job interest
of employees, stake holders confidence and inter office links/communication. Multiple
regression analysis was performed taking ‘management performance’ as dependent variable and
the above mentioned five indicators as independent variables. In statistical terms, the hypothesis
may be written as:
zero. are s' allNot :0:
1
543210β
βββββHH =====
Regression Results Summary (α = 0.05)
IT Levels VS Performance Indicators Table 7.12(a) Year 1990-2004
S/No IT Level Results
β coefficient t-Statistics p-value

202
1 Executive Support System -.638 -.727 .471 2 Decision Support System 1.087 1.171 .248 3 Management Information System 4.336 2.480 .017 4 Transaction Processing System No Statistic Constant Constant
Regression Results Summary (α = 0.05) IT Levels/functions/software VS Performance Indicators Table 7.12(b) Year 1990-2004
S/No IT Level ANOVA Results
F-Statistics p-value 1 IT Functions 2.328 .059 2 Application Software Usage 1.675 .173 3 IT Levels 3.556 .022
The global test has failed to reject Ho(p-value=0.059 > 0.05). It means that the management
performance is not dependent on (or associated with) any of the above functions of IT.
As stated earlier, in the second hypothesis we explore presence of any association between a
sector and functions. That is;
Hypothesis No 2(a2): “All sectors are using IT for different purposes/functions.”. The following
hypothesis represents this in statistical form.
H0 : There is no association between sectors and types of functions/purposes for which IT is
used.
H1 : There is an association between sectors and types of functions/purposes for which IT is
used.
Test of association using chi-square statistic was applied for this test. With the (p-
value=0.842>0.05) Table 7.13, for IT functions, we accept the null hypothesis. It implies that
all sectors are using IT for these functions with equal proportion. No sector is showing any
preference to a particular purpose.
Table 7.13 Chi-Square Results of Different Problems/Test Variable
S/No Problems/Test Variables Chi-Square Results
1 Application Software Usage Analysis 0.822
2 Functions IT playing in Organization 0.842
3 Information System Levels 0.996

203
Figure 7.7 As
show
n in
Figu
re
7.7 it
is
obser
ved
in a
comparative analysis that out of above five functions, telecommunication management is
identified as the most used function in the organization having the highest sum of 46 out of 48.
The programming function is the second most important function with sum of 43, business
process reengineering function is ranked as third most used function having sum of 33, while
strategy formulation and product innovation function are ranked at 4th and 5th with sum of 29
and 27 respectively. All this reveals that in most of companies operating in Pakistan, IT is still
being used mostly for telecommunication and programming development / maintenance
functions. It also look that there is change occurring in this traditional role of IT and it is
acquiring new role as a business process reengineer, strategy formulator and product innovator
gradually. Frequency of score of each function is given in Annexure XV.
b) Application Software Usage Analysis:
As identified in the literature IT systems help us to accelerate communication process, reducing
cycle time and collaborate work process. IT systems facilitate organization’s responsible icon to
brows company’s information and world-based update within seconds. Today’s IT managers
believe that any organization’s global existence is only possible when you make excellent use of
a wide variety of IT systems. Electronic business acceleration is mainly dependent now on ERP
systems. An ERP systems as defined by Bakry and Bakry(2005) is “an integrated information
system software comprised of several modules that share a central database, designed to
automate business process across the enterprise”. Through ERP all the departments of the
Function IT Playing in Organization: All Companies
05
101520253035404550
TelecommunicationManagement
Programming,system
Development &Maintenance
Business ProcessReengineering
StrategyFormulation & org.
Transformation
Productsinnovations
IT F
unct
ions

204
company are integrated and now it has become the crux of the business activates. ERP flourish
electronic business in a way as one can browse from any corners of the world all information
pertaining to the company.
As the modern organizational need is based on faster integration, collaboration and coordination
throughout the world so managers have no choice except installing flexible and smoothly
compatible ERP in the organization, which give real-time, global, secure and simultaneous
communications. Feeling this need, the organizations are developing their own ERP systems or
using standard customize ERP solutions i.e. SAP, JD Edward, Oracles, Misys, Fidielty and Sibel
in manufacturing and banking. The following application software/programs are investigated to
test hypothesis.
1. Vendor supplied IT software systems.
2. Standard customize ERP system i.e. SAP, Oracle (JD Edwards), Misys, Sibel etc
3. In house developed IT systems
4. Consultants’ developed systems
5. Copied IT software systems.
Hypothesis No 2(b1). “Organizational performance of IT based organization is dependant upon
the type of application software package/type being used in the organizations”.
Multiple regression analysis was again performed taking ‘management performance’ as
dependent variable and the above mentioned five software types as independent variables.
Statistically, the hypothesis may be written as:
zero. are s' allNot :0:
1
543210β
βββββHH =====
Table 7.12(b) displays that (p-value = 0.173 > 0.05) for this global test and thus the above null
hypothesis is accepted. It means that the management performance is not dependent on (or
associated with) any of the above mentioned software/program used.

205
Hypothesis No 2(b2): “All sectors are using the above software to the same extent”. The
following hypothesis represents this in statistical form.
H0 : There is no association between sectors and types of software/systems used.
H1 : There is an association between sectors and types of software/systems used.
The above hypotheses were tested using chi square statistic (p-value = 0.842 > 0.05), thus we
accept the null hypothesis. It implies that all sectors are using these software systems with equal
proportion. No sector is showing any preference to a particular software/program. Further, a
comparative analysis of usage of aforementioned application software systems also shows that
out of above mentioned five types of systems most of the companies in both the sectors are
mostly using in house developed systems as it is being used in 35 out of 48 companies in sample.
About 24 companies are using consultants’ developed systems and 17 companies are using
standard ERP applications systems. Only one company in local banks i.e. First Women bank is
using copied software (provided to them by U.B.L on government instructions). The results of
comparison of banking versus manufacturing also reveal that the manufacturing sector tends to
use ‘standard systems’ more than banking companies, as 13 foreign and 4 local companies are
using standard systems. At the same time about 21 banking and 14 manufacturing companies are
using in house developed systems. As far as consultant development systems are concerned
about 13 banks and 11 manufacturing companies are using these systems. Only one bank
discussed above is using copied software and none of the company in the sample is using vendor
supplied systems. In comparison of local organizations VS foreign organizations, in local
organization again 8 companies are using standard software while in foreign score is 9. About 21
local and 14 foreign companies are using in house developed systems. So far as consultant’s
developed systems are concerned 18 local and 6 foreign companies are using these systems. No
foreign company is using copied software(Annexure XVI). Data reported in (Figure 7.8)
indicates all these results graphically.

206
Figure7.8
Application Software Use Analysis: All Companies
05
10152025303540
In h
ouse
Dev
elop
edSy
stem
Con
sulta
nts'
Dev
elop
edS
yste
ms
Sta
ndar
dap
plic
atio
n;ER
PSy
stem
s i.e
SAP,
MSY
S,
OR
ACLE
S
Cop
ied
Softw
are
Vend
orSu
pplie
d
No
Of C
ompa
nies
It is concluded therefore, that still companies in both the sectors are relying most on their own
developed system or systems developed for them by the consultants. However, as the time
requires ERP systems are getting introduction. So far, in banking sector only three banks i.e.
H.B.L, M.C.B and Faisal are implementing standard applications/ERP system for their core areas
(HBL is converting their old MOBS system to MISYS. M.C.B and Faisal Bank are
implementing Siebel). No foreign bank is using any standard application. Many foreign
manufacturing companies like P.T.C, Reckitt Benkiser, Nestle, and Philips, are also using SAP
and JD Edward (Oracle) but only two companies in local sector i.e. Packages and Honda Atlas
are using SAP.
In summary, at present, except few, most of the companies are relying on their own or
consultant’s developed system. But the opened avenues of electronic business are to accelerate
electronic activities which have created the need of customized systems, organizations to have
complete and versatile IT solution to be connected with all the stake holders have started to
install some best and best of breed IT systems for their successful business activities. New
systems and dependency on them is increasing day by day and they always looking for the best
service. The computer usage statistic of all the companies in sample in Annexure XXII shows a
clear picture of computerization status of sample firms.
c) Information System Levels Analysis.

207
As discussed in the literature there are many IT systems for different setups in various categories
which facilitate the organizations to accelerate their work in this e-culture. These systems have
the room to facilitate different users, an assembly worker to company’s C.E.O. In the modern
organizations transaction processing systems, management information systems (MIS), decision
support systems (DSS) and executive support systems are paramount IT systems levels. The
literature has identified that in an individual prospective and organizational exposure with
diversified activities, there exist one or all the above systems, which ultimately increases the
performance of the individuals and organizations. The adoption of these systems enables the
organization to enjoy modern race to reach at the successful target of e-commerce business
environment.
In the foregoing analysis the following IT system levels were tested;
1. Executive support system
2. Decision support system
3. Management information system
4. Transaction processing system.
Again, two hypotheses have been constructed for testing. The first hypothesis looks at effect of
information system levels on the management performance. The second hypothesis explores if
there is any relationship between different sectors and the information system level being used.
Hypothesis No. 2(c1): “Organizational performance depends on information system levels being
used”.
To test this hypothesis, multiple regression analysis was performed taking ‘management
performance’ as dependent variable and the above mentioned four information system levels as
independent variables. In statistical terms, the hypothesis may be written as:
zero. are s' allNot :0:
1
43210β
ββββHH ====
The null hypothesis is rejected as the (p-value = 0.022 < 0.05) for information systems levels. It
means that the management performance is dependent on (or associated with) a particular type of
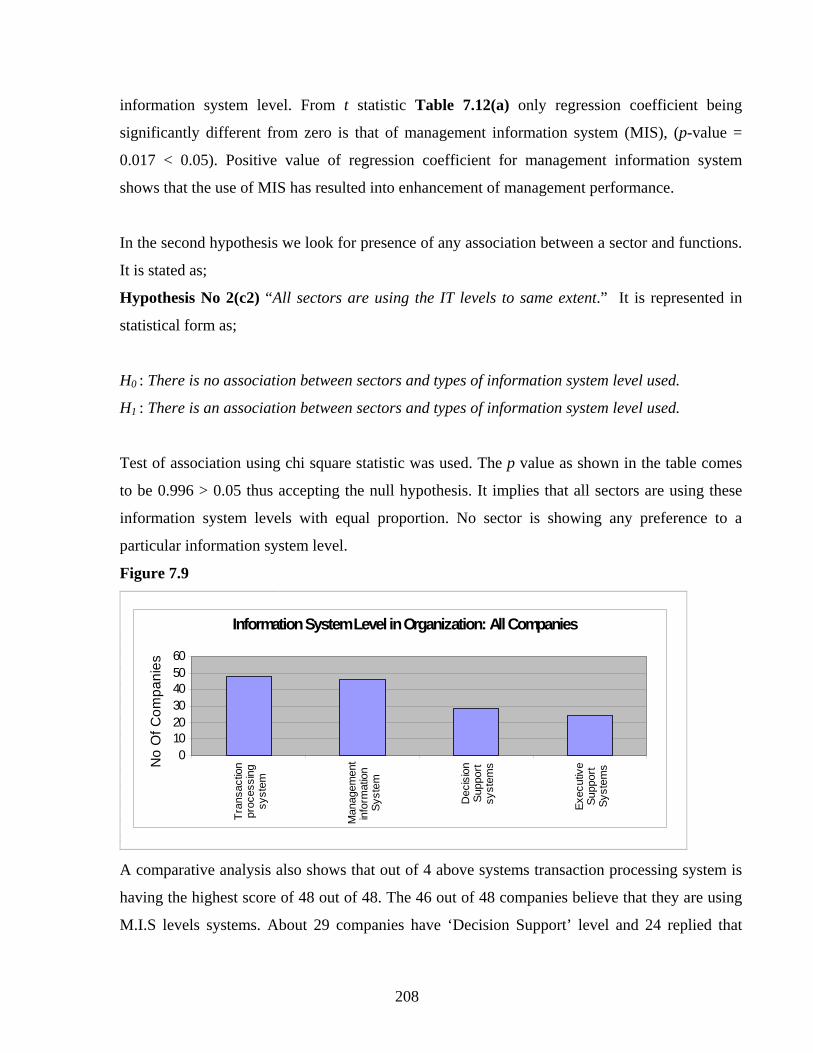
208
information system level. From t statistic Table 7.12(a) only regression coefficient being
significantly different from zero is that of management information system (MIS), (p-value =
0.017 < 0.05). Positive value of regression coefficient for management information system
shows that the use of MIS has resulted into enhancement of management performance.
In the second hypothesis we look for presence of any association between a sector and functions.
It is stated as;
Hypothesis No 2(c2) “All sectors are using the IT levels to same extent.” It is represented in
statistical form as;
H0 : There is no association between sectors and types of information system level used.
H1 : There is an association between sectors and types of information system level used.
Test of association using chi square statistic was used. The p value as shown in the table comes
to be 0.996 > 0.05 thus accepting the null hypothesis. It implies that all sectors are using these
information system levels with equal proportion. No sector is showing any preference to a
particular information system level.
Figure 7.9
Information System Level in Organization: All Companies
0102030405060
Tran
sact
ion
proc
essi
ngsy
stem
Man
agem
ent
info
rmat
ion
Syst
em
Dec
isio
nSu
ppor
tsy
stem
s
Exec
utiv
eSu
ppor
tSy
stem
sNo
Of C
ompa
nies
A comparative analysis also shows that out of 4 above systems transaction processing system is
having the highest score of 48 out of 48. The 46 out of 48 companies believe that they are using
M.I.S levels systems. About 29 companies have ‘Decision Support’ level and 24 replied that

209
their IT systems do support ‘Executive Support Systems’. The sum score highlights in
comparison between Banking Vs Manufacturing sectors that both the sectors have TPS. While
22 banking and 24 manufacturing companies confirm that their IT level is MIS. About 13
manufacturing companies and 16 manufacturing companies believe they have DSS. About
executive support systems both the sectors have equal score of 12.
In comparison of local VS foreign companies, for TPS and MIS both sectors have close score i.e.
24 and 23 each and for DSS and ESS, foreign companies have high score i.e. 16 for each and
local companies have score of 13 and 8 respectively. Finally, to say that majority of companies
operating in Pakistan have not achieved ESS and DSS levels of IT systems, companies with well
good ERP solution which give real time, global, secure and prompt communication, enjoying the
benefits of most of the above systems but most of the companies enjoying middle level MIS
systems which are capable of using and transmitting information. Overall, the systems usage
level of foreign banks and manufacturing companies are higher than local companies.
Overall Conclusions Hypothesis 2.
7.6.0. The findings of above discussion reveal that organizational performance of organizations
does not depend on the functions IT plays or type of Hardware/Software being used. However, it
does depend on information systems levels. Organizations that have attained MIS level are
performing well. Most of the companies are still working with their in-house developed systems
and do not have any standard application for their core areas but their performance is good. Since
transformation for global IT connectivity is taking place, so the need to update old IT system or
to use standard applications is evolving rapidly in all the organizations.
Hypothesis 3
7.5.0 The factors affecting the implementation of IT in the organizations are numerous. These
may be of interest not only to academicians but also to managers working in the organizations. In
the literature review, however, few of the important factors such as culture, organizational,
governmental, political, economical, human etc along with their relationship/impact on
organizational IT adoption were broadly discussed. This section of the study seeks to explore the
impact/relationship of certain variables/problems on implementation of IT in the organizations.
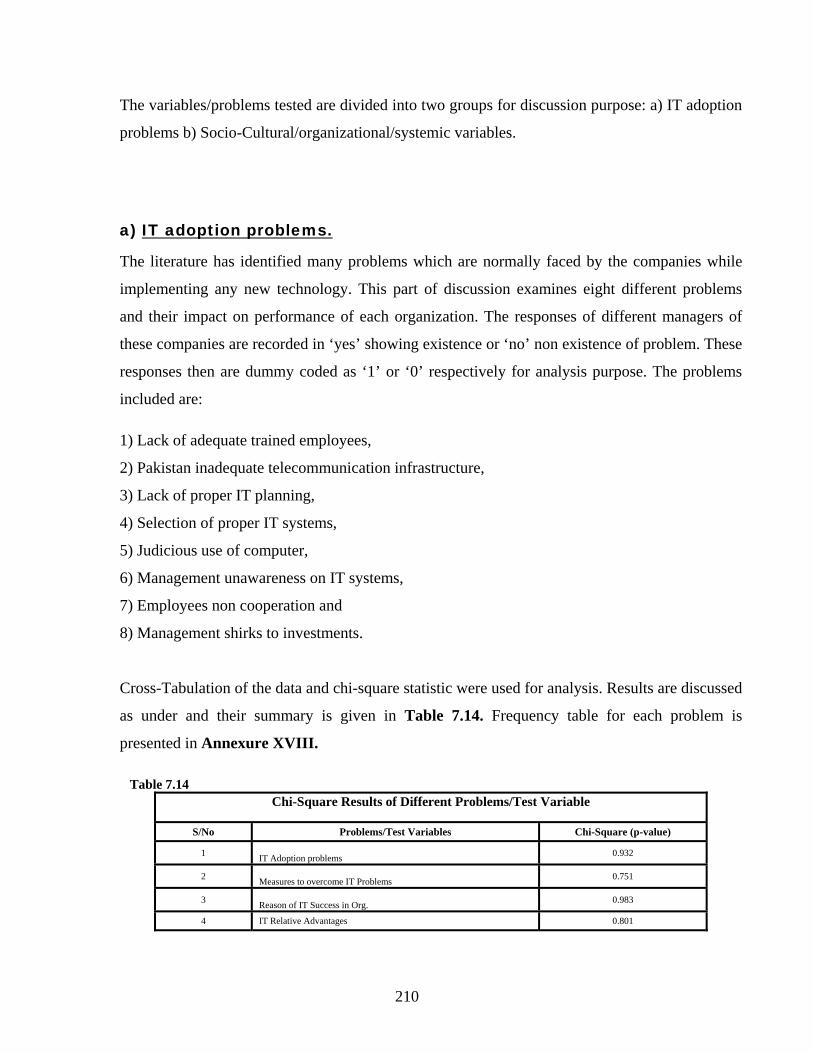
210
The variables/problems tested are divided into two groups for discussion purpose: a) IT adoption
problems b) Socio-Cultural/organizational/systemic variables.
a) IT adoption problems.
The literature has identified many problems which are normally faced by the companies while
implementing any new technology. This part of discussion examines eight different problems
and their impact on performance of each organization. The responses of different managers of
these companies are recorded in ‘yes’ showing existence or ‘no’ non existence of problem. These
responses then are dummy coded as ‘1’ or ‘0’ respectively for analysis purpose. The problems
included are:
1) Lack of adequate trained employees,
2) Pakistan inadequate telecommunication infrastructure,
3) Lack of proper IT planning,
4) Selection of proper IT systems,
5) Judicious use of computer,
6) Management unawareness on IT systems,
7) Employees non cooperation and
8) Management shirks to investments.
Cross-Tabulation of the data and chi-square statistic were used for analysis. Results are discussed
as under and their summary is given in Table 7.14. Frequency table for each problem is
presented in Annexure XVIII. Table 7.14
Chi-Square Results of Different Problems/Test Variable
S/No Problems/Test Variables Chi-Square (p-value)
1 IT Adoption problems 0.932
2 Measures to overcome IT Problems 0.751
3 Reason of IT Success in Org. 0.983
4 IT Relative Advantages 0.801

211
Figure 7.10
IT Adoption Problem: All Companies
05
10152025303540
Paki
stan
Inad
equa
teTe
leco
mm
unic
atio
nin
frast
ruct
ure
Lack
of P
rope
r IT
Plan
ning
Lack
of A
dequ
ate
Trai
ned
Empl
oyee
s
Sele
ctio
n of
Pro
per
IT S
yste
ms
Judi
ciou
s U
se o
fC
ompu
ter
Empl
oyee
s N
on
Coo
pera
tion
Man
agem
ent S
hirk
sto
Inve
stm
ents
Man
agem
ent
Una
war
e on
ITSy
stem
s
No
Of C
ompa
nies
Statistically we have framed following hypothesis for this problem;
Hypothesis 3(a)
H0: There is no association between a kind of problem and sectors. H1: There is an association between a kind of problem and sectors.
The chi-square (p-value =.932 > 0.05) shows that all the companies have faced these problems
while implementing IT with the same proportion. Further, a comparative analysis for all banking
sector puts problem 2 (Pakistan inadequate telecommunication structure) at top followed by
problem 3, 4, 5. The problems 6, 7 and 8 come next in order. While in manufacturing companies
problem 2 is rated at top then comes the problem 3, 4, 6, 8, 5 and 4 next in order. In local
companies problem 3 is at top then is problem 1 and 2 and then comes problem 4, 7, 6, 5 and 8.
In foreign companies problem 1(lack of adequate trained employees) is at top then are the
problem 3,4,5,8 and 7. Figure 7.10 depicts clearly results of all the eight problems for all the
companies.

212
In overall comparison of all the companies it was found that out of above eight problems, the
Pakistan’s inadequate telecommunication infrastructure (problem 2) has been the major problem
in slow IT implementation in the organizations. Lack of IT planning in the companies is the
second major problem which is found in the organization. It has been observed that in Pakistan,
companies are usually making IT investment by following strategy of other companies not
assessing their own real need. Thus some of them are still unable to achieve the desired results.
The shortage of trained employees is the third major problem, as most of the institutions in
Pakistan are just producing the ‘technicians’ or ‘user’ not the computer experts. The companies
are forced to recruit out of these non-qualified personnel, who are unable to properly manage the
advanced IT systems. Selection of proper IT systems is the fourth major problem which these
companies are facing. More real computer use is also still limited, employee non cooperation,
management’s unwillingness to invest more in IT systems, and management unawareness about
the IT are also few of the barriers these companies are facing.
b) Socio-Culture/organizational/systemic factors
The second part of hypothesis 3 focus on the examining the impact of socio-
culture/organizational/systemic variables on implementation IT. It views these moderating
variables and their impact on both the sectors of economy in our sample i.e. manufacturing and
banking. The literature identified a number of factors i.e. culture, human, political, social,
governmental, economical etc. which have impact on the implementation of IT. This part of
discussion determines to what extent that impact is?.
A scale of 1-4 was used for recording responses of the companies, where 1 means no impact, 2
represents low impact, 3 shows moderate impact and 4 indicates high impacts for a particular
variable. For discussion purpose “impact” here is refers to average score greater than 1. Impact
of all these variables have been observed for all companies and all sectors. For each variable two
different research hypotheses have been tested:
Research Hypothesis No 3(b): “Socio-Culture/organizational/systemic variables such as culture,
social, government, political, human, organizational and economical have impact on the
implementation of IT in the organizations”.
Translation of this in terms of statistical hypotheses is under:
H0: µ = 1

213
H1: µ > 1
This one-sided hypothesis was tested using t-test statistic at level of significance of 0.05.
Rejection of the null hypothesis stands for acceptance of the research hypothesis.
Research Hypothesis No.3(bb): “The impact of the given variable on implementation of IT is not
the same in all the four sectors”.
Translation of this in terms of statistical hypotheses follows:
H0: 4321 µµµµ ===
H1: At least two µ’s are different.
This hypothesis was tested using one way ANOVA technique at level of significance of 0.05.
Again, the rejection of the null hypothesis means that the acceptance of the research hypothesis.
Rejecting the null hypothesis implies that not all means are same i.e. all means may be different
or some may be same or some may be different. The post hoc tests about pair-wise comparison
( : vs.: 10 jiji HH µµµµ ≠= for ji ≠ ) were performed using Scheffe test statistic wherever
the null hypothesis was rejected. Variable wise analysis is discussed in ensuing sections and the
summaries of ANOVA results are presented in Table 7.16.
1. Cultural Factor As discussed in the literature review that each society, nations, industry, corporations and
organization, has its own unique culture i.e. set of beliefs, value systems, attitude, and related
behavior that shape its personality. Some cultures are more receptive to new technology whiles
other are not. Since culture vary more widely across region and organization, so even within
same organization one thing which has worked in one area/region, may not work in other.
Culture variables, therefore are the most significant factors to be considered in implementing any
change/technology. It is hypothesized that;
Research Hypothesis No 3(b1): “Culture variable has impact on implementation of IT systems
in the given sector”.
As described above, statistically it implies:
H0: µ = 1
H1: µ > 1
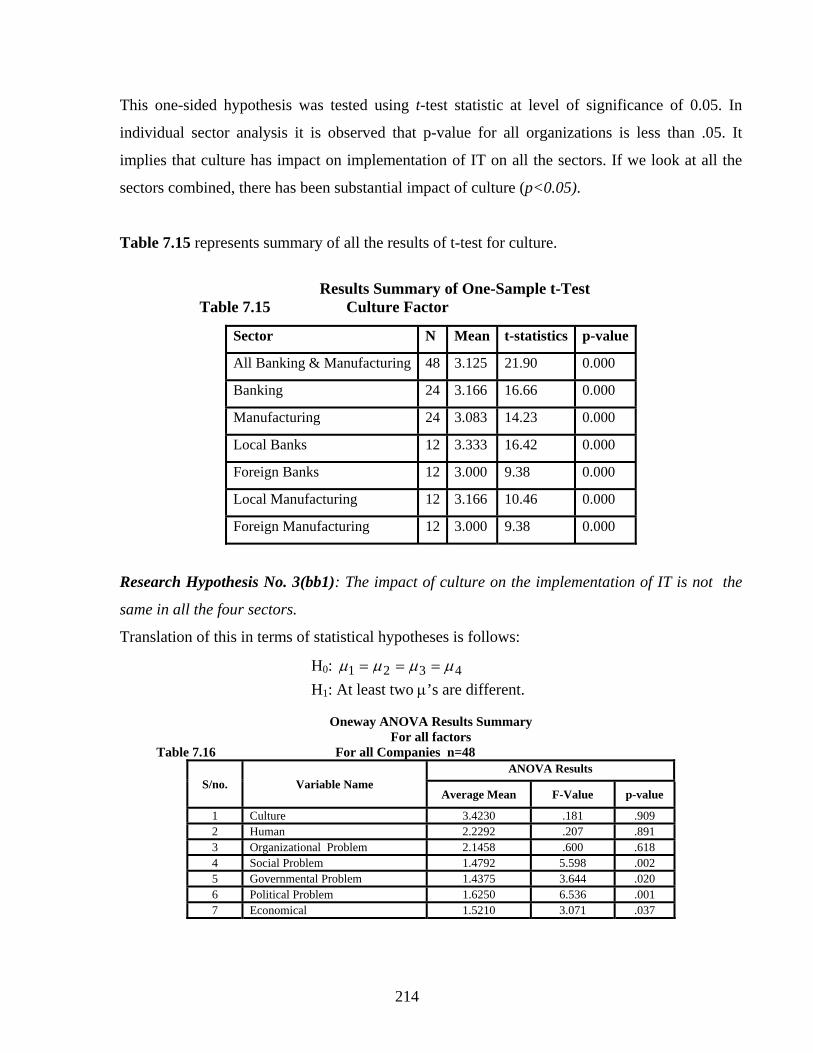
214
This one-sided hypothesis was tested using t-test statistic at level of significance of 0.05. In
individual sector analysis it is observed that p-value for all organizations is less than .05. It
implies that culture has impact on implementation of IT on all the sectors. If we look at all the
sectors combined, there has been substantial impact of culture (p<0.05).
Table 7.15 represents summary of all the results of t-test for culture.
Results Summary of One-Sample t-Test
Table 7.15 Culture Factor
Sector N Mean t-statistics p-value
All Banking & Manufacturing 48 3.125 21.90 0.000
Banking 24 3.166 16.66 0.000
Manufacturing 24 3.083 14.23 0.000
Local Banks 12 3.333 16.42 0.000
Foreign Banks 12 3.000 9.38 0.000
Local Manufacturing 12 3.166 10.46 0.000
Foreign Manufacturing 12 3.000 9.38 0.000
Research Hypothesis No. 3(bb1): The impact of culture on the implementation of IT is not the
same in all the four sectors.
Translation of this in terms of statistical hypotheses is follows:
H0: 4321 µµµµ === H1: At least two µ’s are different.
Oneway ANOVA Results Summary
For all factors Table 7.16 For all Companies n=48
S/no. Variable Name ANOVA Results
Average Mean F-Value p-value
1 Culture 3.4230 .181 .909 2 Human 2.2292 .207 .891 3 Organizational Problem 2.1458 .600 .618 4 Social Problem 1.4792 5.598 .002 5 Governmental Problem 1.4375 3.644 .020 6 Political Problem 1.6250 6.536 .001 7 Economical 1.5210 3.071 .037

215
The subsequent ANOVA results given in Table 7.16 showed striking similarities that there is
significant impact of culture in the implementation of IT and it is same in all the sectors. (F=
.181, <2.82 and p-value= 0.909 >0.05). This represents that all the four sectors have been
influenced equally with culture variable.
Overall, the above analysis shows that organizational culture has impacted all the organizations
in implementation of IT. The management in today’s multinational global business community
frequently encounters culture differences, which can impede the successful installation of any
new technology.
2. Human Factor It is well established in the literature that individual matters most for economic advances, as well
as other natural resources. The human also play a key role in shaping the organizational systems
in number of ways. Pakistani organizations are experiencing two types of employee’s influences;
1) by the older employees-reluctant to use new technology and 2) newer employees-more
receptive to technology. The banking and manufacturing industries have undergone various
restructuring during the last decade and had laid off many old employees to develop a
progressive culture in order to bring new changes/technologies. Most of these organizations have
been successful in this regards while few are not. It is hypothesized as;
Research Hypothesis No 3(b2): “Human variable has impact on implementation of IT systems
in the given sector”.
As described above, statistically it implies:
H0: µ = 1
H1: µ > 1
Again this one-sided hypothesis was tested using t-test statistic at level of significance of 0.05.
Turning first to full sample, we note that p-values for all organizations are less than 0.05 which is
similar to the p-value of individual sectors. These results tends to support the view that human
variable has impact on implementation of IT on all the sectors.
Results Summary of One-Sample t-Test Table 7.17 Human Factor

216
Sector n Mean t-statistics p-value
All Banking & Manufacturing 48 2.229 09.18 0.000
Banking 24 2.250 16.66 0.000
Manufacturing 24 2.210 14.23 0.000
Local Banks 12 2.333 4.92 0.001
Foreign Banks 12 2.166 3.92 0.001
Local Manufacturing 12 2.333 5.20 0.000
Foreign Manufacturing 12 2.083 4.73 0.000
Research Hypothesis No. 3(bb2): “The impact of human variable on the implementation of IT is
not the same in all the four sectors”.
Translation of this in terms of statistical hypotheses is follows:
H0: 4321 µµµµ ===
H1: At least two µ’s are different.
We find in ANOVA results given in Table 7.15 that there is substantial impact of human on the
implementation of IT and it is same in all the sectors. (F=0.207 < 2.82 And p-value=0.891
>0.05). This represents that all the four sectors have been affected equally with human variable.
3. Organizational Structural Factor The organizational structure i.e. complexity, formalization, centralization, decentralization etc.
has substantial impact on implementation of any new technology. As discussed in the literature
organizational structure is an important factor to be considered by the management before
implementing any technology as an appropriate ‘structure-fit’ is necessary for adoption of any
new technology. It is hypothesized that;
Research Hypothesis No 3(b3): Organizational structure has impact on implementation of IT
systems in the given sector.
As described above, statistically it implies:
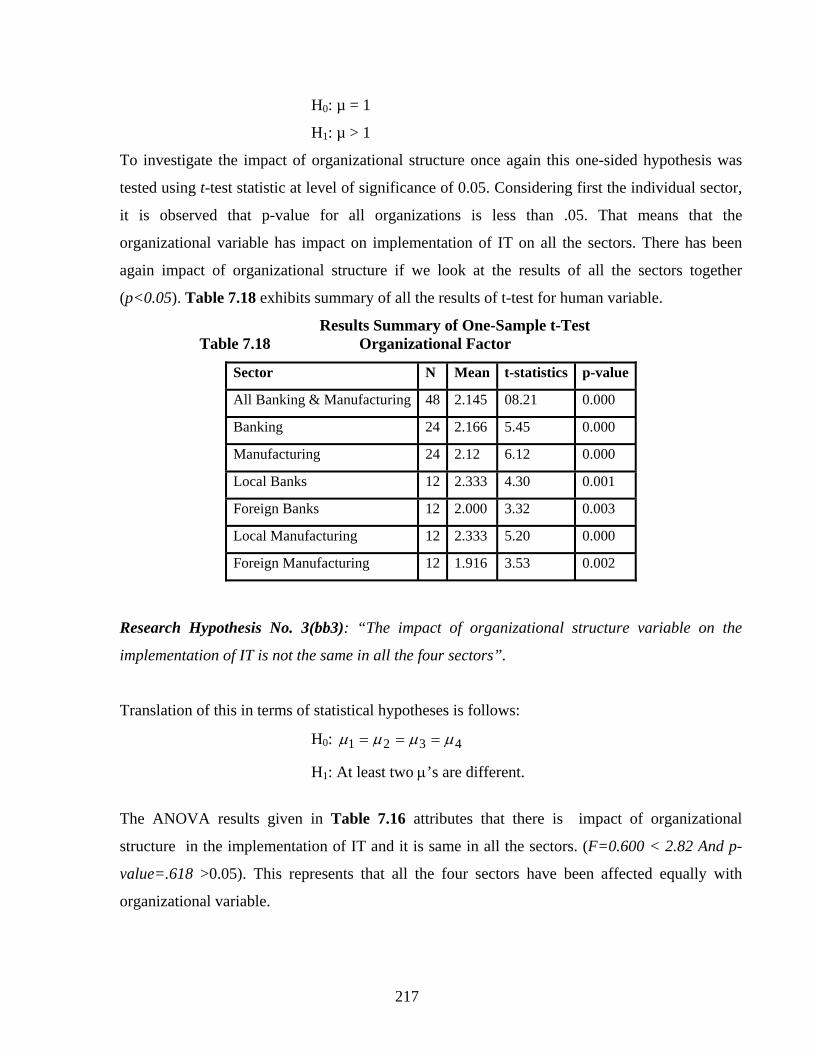
217
H0: µ = 1
H1: µ > 1
To investigate the impact of organizational structure once again this one-sided hypothesis was
tested using t-test statistic at level of significance of 0.05. Considering first the individual sector,
it is observed that p-value for all organizations is less than .05. That means that the
organizational variable has impact on implementation of IT on all the sectors. There has been
again impact of organizational structure if we look at the results of all the sectors together
(p<0.05). Table 7.18 exhibits summary of all the results of t-test for human variable.
Results Summary of One-Sample t-Test Table 7.18 Organizational Factor
Sector N Mean t-statistics p-value
All Banking & Manufacturing 48 2.145 08.21 0.000
Banking 24 2.166 5.45 0.000
Manufacturing 24 2.12 6.12 0.000
Local Banks 12 2.333 4.30 0.001
Foreign Banks 12 2.000 3.32 0.003
Local Manufacturing 12 2.333 5.20 0.000
Foreign Manufacturing 12 1.916 3.53 0.002
Research Hypothesis No. 3(bb3): “The impact of organizational structure variable on the
implementation of IT is not the same in all the four sectors”.
Translation of this in terms of statistical hypotheses is follows:
H0: 4321 µµµµ ===
H1: At least two µ’s are different.
The ANOVA results given in Table 7.16 attributes that there is impact of organizational
structure in the implementation of IT and it is same in all the sectors. (F=0.600 < 2.82 And p-
value=.618 >0.05). This represents that all the four sectors have been affected equally with
organizational variable.

218
4. Governmental Factor A major characteristic of all developing countries is all the pervasive and crucial role their
governments play in the management of their organizations. In Pakistan too as discussed in
literature, like other countries the government has impact on implementation of IT in different
ways. It is hypothesized as;
Research Hypothesis No 3(b4): “Governmental variable has impact on implementation of IT
systems in the given sector”.
As described above, statistically it implies:
H0: µ = 1
H1: µ > 1
Our t-test statistic results at level of significance of 0.05 show variations for different sectors. For
all companies, banks and local banks p-value is <0.05 but for manufacturing (local and foreign)
and for foreign banks p-value> 0.05. That implies that in some companies the government
polices has impact on implementation of IT and in others it doesn’t. Table 7.19 represents results
of t-test for human variable.
Results Summary of One-Sample t-Test
Table 7.19 Governmental Factor
Sector n Mean t-statistics p-value
All Banking & Manufacturing 48 1.437 03.57 0.000
Banking 24 1.666 16.66 0.001
Manufacturing 24 1.208 3.39 0.067
Local Banks 12 2.083 3.22 0.004
Foreign Banks 12 1.250 1.91 0.041
Local Manufacturing 12 1.250 1.00 0.169
Foreign Manufacturing 12 1.166 1.48 0.083
Figure 7.11: Schematic diagram for ordered means
Research Hypothesis No.3(bb4): “The impact of governmental variable on the implementation
of IT is not the same in all the four sectors”.

219
Translation of this in terms of statistical hypotheses is follows:
H0: 4321 µµµµ ===
H1:
At least
two µ’s
are
different.
The ANOVA results given in Table 7.16 show that there is impact of government in the
implementation of IT but it is different in various sectors. (F=3.644 > 2.82 and p-value=.020<
0.05). This represents that all the four sectors have been affected differently with governmental
policies. A pair-wise comparison of Schefee test represented in Figure 7.9.
It depicted as the highest mean, 2.08 for sector 1(Local Banks), is significantly greater (or
different) than all others. That means that government policies have impacted local banks lot but
same effect was experience for all other.
5. Social Factor Research Hypothesis No 3(b5): “Social variable has impact on implementation of IT systems in
the given sector”.
As described above, statistically it implies:
H0: µ = 1
H1: µ > 1
The results in Table 7.20, p-value < 0.05 for all companies combined, both banking and
manufacturing sectors, and local banks and p-value > 0.05 for foreign banks and foreign
manufacturing, for t-test statistic (at level of significance of 0.05) indicate that social variable has
impacted all the companies except companies operating in foreign sector.
Results Summary of One-Sample t-Test Table 7.20 Social Factor
Sector N Mean t-statistics p-value
All Banking & Manufacturing 48 1.479 04.30 0.000
Sectors 4 3 2 1 Means 1.17 1.25 1.25 2.08
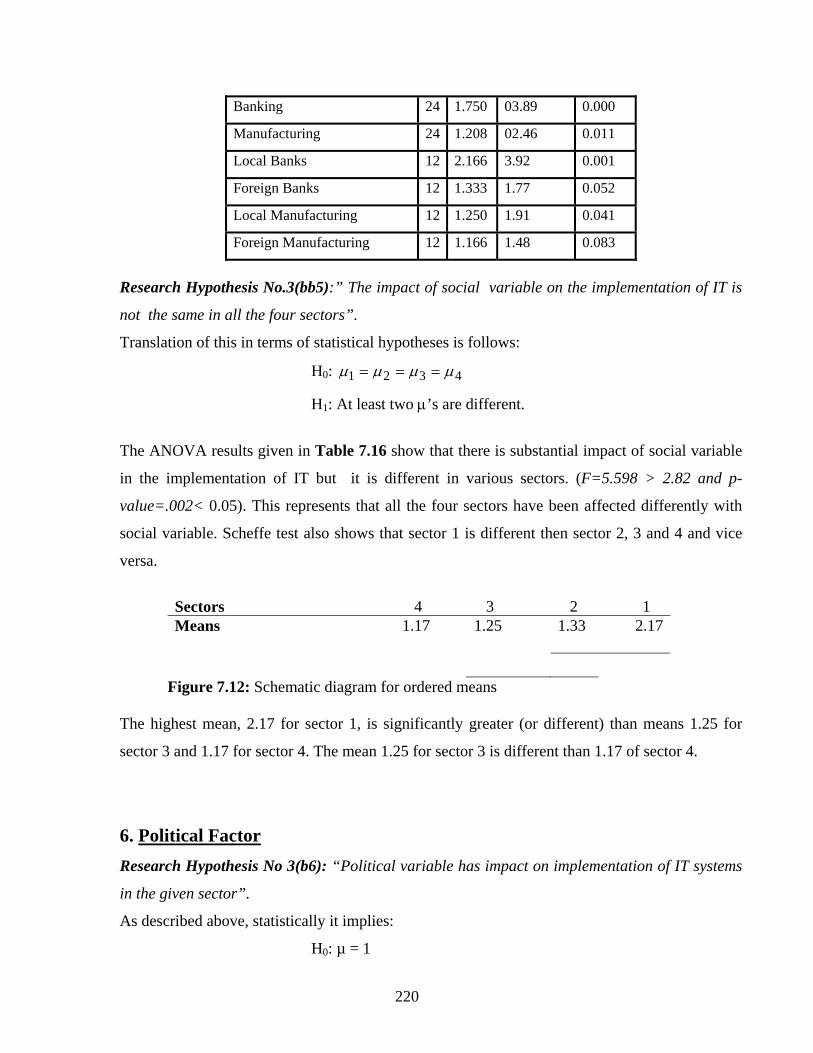
220
Banking 24 1.750 03.89 0.000
Manufacturing 24 1.208 02.46 0.011
Local Banks 12 2.166 3.92 0.001
Foreign Banks 12 1.333 1.77 0.052
Local Manufacturing 12 1.250 1.91 0.041
Foreign Manufacturing 12 1.166 1.48 0.083
Research Hypothesis No.3(bb5):” The impact of social variable on the implementation of IT is
not the same in all the four sectors”.
Translation of this in terms of statistical hypotheses is follows:
H0: 4321 µµµµ ===
H1: At least two µ’s are different.
The ANOVA results given in Table 7.16 show that there is substantial impact of social variable
in the implementation of IT but it is different in various sectors. (F=5.598 > 2.82 and p-
value=.002< 0.05). This represents that all the four sectors have been affected differently with
social variable. Scheffe test also shows that sector 1 is different then sector 2, 3 and 4 and vice
versa.
Sectors 4 3 2 1 Means 1.17 1.25 1.33 2.17
Figure 7.12: Schematic diagram for ordered means
The highest mean, 2.17 for sector 1, is significantly greater (or different) than means 1.25 for
sector 3 and 1.17 for sector 4. The mean 1.25 for sector 3 is different than 1.17 of sector 4.
6. Political Factor
Research Hypothesis No 3(b6): “Political variable has impact on implementation of IT systems
in the given sector”.
As described above, statistically it implies:
H0: µ = 1

221
H1: µ > 1
The results in Table 7.21 indicate that p-value for all the companies combine, both banking and
manufacturing sectors, local and foreign banks, local and foreign manufacturing is < 0.05 for t-
test statistic (at level of significance of 0.05). It indicates that political variable has impact on all
the companies.
Results Summary of One-Sample t-Test Table 7.21 Socio-Culture Variable-Political
Sector N Mean t-statistics p-value
All Banking & Manufacturing 48 1.646 05.34 0.000
Banking 24 2.250 16.66 0.000
Manufacturing 24 1.916 14.23 0.002
Local Banks 12 2.416 04.53 0.000
Foreign Banks 12 1.416 02.16 0.009
Local Manufacturing 12 1.416 5.20 0.027
Foreign Manufacturing 12 1.333 4.73 0.019
Research Hypothesis No.3(bb6): “The impact of political variable on the implementation of IT
is not the same in all the four sectors”.
Translation of this in terms of statistical hypotheses is follows:
H0: 4321 µµµµ ===
H1: At least two µ’s are different.
The ANOVA results exhibit in Table 7.16 display that There is substantial impact of political
variable in the implementation of IT but it is different in various sectors. (F=6.536 > 2.82 And
p-value=.001< 0.05). This represents that all the four sectors have been effected differently with
social variable. Scheffe test shows the same that sector 1 is different than 3 and 4. Sector 2 is
different then 4.

222
Sectors 4 3 2 1 Means 1.25 1.42 1.42 2.42
Figure 7.13 : Schematic diagram for ordered means
The highest mean, 2.42 for sector 1, is significantly greater (or different) than means 1.42 for
sector 3 and 1.25 for sector 1. The mean 1.42 for sector 3 is significantly greater than mean 1.25
for sector 4.
Political factor has the substantial impact on implementation of IT. This impact is seen on high
end in banking as a whole and in local banks particular and it could be due the reasons that there
has been lot of political intervention in these banks till their complete privatization by 2003.
7. Economic Factor Research Hypothesis No 3(b7): “Economic variable has impact on implementation of IT
systems in the given sector”.
As described above, statistically it implies:
H0: µ=1
H1: µ>1
In Table 7.22, we give results of t-test statistic at level of significance of 0.05, which represents
that p-value for all the companies combine, both banking and manufacturing sectors, local and
foreign banks and local manufacturing is <0.05. Only for foreign manufacturing it is >0.05. It
shows that economical variable has impacted all the companies except foreign manufacturing.
Results Summary of One-Sample t-Test
Table 7.22 Economic Factor
Sector n Mean t-statistics p-value
All Banking & Manufacturing 48 1.520 04.12 0.000
Banking 24 1.791 03.65 0.001
Manufacturing 24 1.250 02.30 0.015
Local Banks 12 2.083 03.22 0.004

223
Foreign Banks 12 1.500 01.91 0.041
Local Manufacturing 12 1.416 02.16 0.027
Foreign Manufacturing 12 1.083 01.00 0.169
Research Hypothesis No.3(bb7): “The impact of economic variable on the implementation of IT
is not the same in all the four sectors”.
Translation of this in terms of statistical hypotheses is follows:
H0: 4321 µµµµ ===
H1: At least two µ’s are different.
The ANOVA results given in Table 7.16 exhibits that there is impact of social variable in the
implementation of IT but it is different in various sectors. (F=3.071 > 2.82 and p-value=
0.037< 0.05). This represents that all the four sectors have been affected differently with social
variable. From Scheffe test it is observed that sector 4 is different then all other sectors.
Sectors 4 3 2 1 Means 1.08 1.42 1.50 2.08
Figure 7.14: Schematic diagram for ordered means
The highest mean, 2.08 for sector 1, is significantly greater (or different) than mean 1.42 for
sector 3 and 1.42 for sector 3. The mean 1.50 for sector 2 is significantly greater than mean 1.08
for sector 4.
In summary like other variables, economic conditions have effected all the organizations except
foreign manufacturing in implementation of IT. As discussed in the literature Pakistan has mixed
economy with protective interventionist policies where the private sector is allowed to operate
under governmental guidelines and direct control, and where the government also owns and
manages manufacturing and service industries. In the above analysis the local companies are
affected more than foreign companies with economic variable because of the reasons that these
companies have been more under economic influence/reforms of the government. The foreign
companies are comparatively less effected to economic changes/reforms than that of other
companies operating in Pakistan.

224
Overall Conclusion Hypothesis 3
7.5.1 Pakistan is a developing country and is now on IT boom. There are obvious changes
occurring in the organizational systems in the recent years due to IT. But still there are lot of
barriers which have direct impact on successful implementation of IT. The organizational
decisions are effected by different factors. The above discussion has shown that out of eight
problems as identified in the literature, Pakistan inadequate telecomm infrastructure, lack of IT
planning, lack of trained employees and improper IT systems are the top most problems these
organizations are facing. Other factors like culture, human, political, organizational, economical,
social etc. have also impacted the performance of these organizations at the same time.
Hypothesis 4
7.6.0 The literature has discussed many problems in adoption / implementation of IT in the
organizations and management actions to overcome these problems. In hypothesis no 3, we have
analyzed individual problem in detail. In the ensuing hypotheses we analyze different actions of
management to overcome these problems. Statistically, it implies that;
Research Hypothesis no 4. “The organizations take same measures to overcome IT adoption problems”. We frame two hypotheses for testing.
H0= The organizations take same measures to overcome IT adoption problems.
H1= The organizations take different measures to overcome IT adoption problems.
Responses of different managers were recorded in the form of ‘yes’ or ‘no’ answers on the
questionnaire and then these answers were dummy coded with 1 for ‘yes’ and 0 for ‘no’ for
analysis purpose. z-Test and chi-square test were applied for analysis. Results of analysis are
discussed as under, values for chi-square are given in Table 7.14 and values for individual z-test
are given Table 7.23. Detail is presented in Annexure XXIV. in different tables in undergoing
discussions. The ensuing discussions seek to investigate “different measures and which one is
225
more used in organizations to overcome IT implementation/usages problems internal to
organizations”. The measures tested are;
1) Education & tanning
2) Employees motivation
3) Employees rewards
4) Job threats.
It is statistically hypothesized as;
Research Hypothesis No.4(a1): “Most of the companies adopt the given ‘measure’ to control IT
adoption problems in their organization”.
This hypothesis was tested for each of the measure using z-test using a level of significance as
0.05. These hypotheses were statistically tested in the form given below:
50.0:50.0:
1
0>≤
ππ
HH
where π stands for the proportion of organizations in favor of given proposition. This hypothesis
was tested using z test statistic separately for each of the given ‘reason’ and has been discussed
below.
1. Education and Training: H0 was rejected for all sectors and overall in above hypothesis
( p=0 <0.05) Table 7.23. All organizations feel that ‘education and training’ is the most useful
measure, the organization takes to overcome IT adoption problems.
2. Employees Motivations: H0 was again rejected for all sectors and overall as all the
organizations feel that ‘employee motivation’ is also the most useful measure taken in the
organization to overcome IT adoption problems. (P=0<0.05) Table 7.23.
3. Proper Rewards to users: The Table 7.23 below exhibits variations in p-vales for this
variable. Overall all the companies, all banking and manufacturing, and foreign manufacturing
are having p-value < 0.05. However, for local banks and local manufacturing p-value>0.05. It

226
implies that all the organizations in sample, except local organizations believe that ‘proper
rewards’ system in addition to above cited two measures to overcome IT adoption problems is
necessary. The local companies lack this measure because of the reasons that their management
is normally having conservative and hard approach in compensating employees on their certain
achievements. Though management is very open to new IT introduction/investments but their
employees are still dissatisfied with their salaries and other reward systems.
Results Summary of One-Sample z -Test Table 7.23 Measure to Overcome IT Adoption
Sector n Education and Training
Employees Motivation
Proper Rewards to Users
Job Threat
p- value p- value p- value p- value All Banking & Manufacturing 48 0.000 0.000 0.000 1.000 Banking Sector 24 0.000 0.000 0.000 0.999 Manufacturing Sector 24 0.000 0.000 0.000 1.000 Local Banks 12 0.000 0.000 0.060 0.959 Foreign Banks 12 0.000 0.000 0.000 0.994 Local Manufacturing 12 0.001 0.001 0.052 0.993 Foreign Manufacturing 12 0.000 0.000 0.000 1.000
4. Job Threats Table 7.23 above exhibits that p-values in overall all the companies, all
banking and manufacturing sectors, and individual sector are grater than 0.05. It implies that ‘job
threats’ is least used measure in almost all the organizations in sample and it supports our null
hypothesis.
Research hypothesis No.5(a2): “There is association between ‘measures’ and different sectors
i.e. different sectors are having different measures for overcoming IT adoption problems”.
This hypothesis was tested using chi square test of association for nominal data at 0.05 level of
significance. It is observed from chi-square analysis p-value=.751 >0.05. It shows that the
companies take different measures in all four sectors with same proportion to overcome IT
adoption problem. Moreover, in comparative analysis of all the companies(Figure 7.15), out of 4
above mentioned measures, education & training and employees motivation measures are
seemed to be used mostly in all organizations as they are toped scored i.e. 48 out of 48 in
calculations of sums. The employee reward is next high scored measure with 25 score. The job
threat with 6 score is the 4th and least used measure. In comparison of Banking Vs
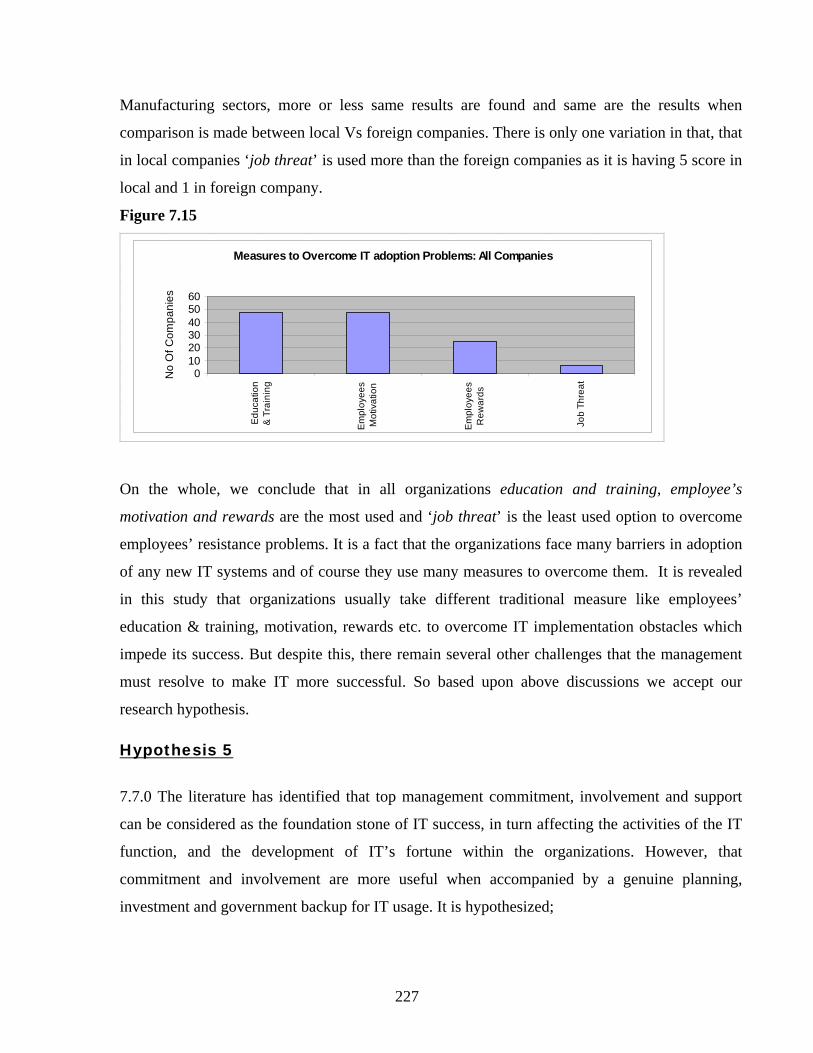
227
Manufacturing sectors, more or less same results are found and same are the results when
comparison is made between local Vs foreign companies. There is only one variation in that, that
in local companies ‘job threat’ is used more than the foreign companies as it is having 5 score in
local and 1 in foreign company.
Figure 7.15
Measures to Overcome IT adoption Problems: All Companies
0102030405060
Edu
catio
n&
Tra
inin
g
Em
ploy
ees
Mot
ivat
ion
Em
ploy
ees
Rew
ards
Job
Thre
at
No
Of C
ompa
nies
On the whole, we conclude that in all organizations education and training, employee’s
motivation and rewards are the most used and ‘job threat’ is the least used option to overcome
employees’ resistance problems. It is a fact that the organizations face many barriers in adoption
of any new IT systems and of course they use many measures to overcome them. It is revealed
in this study that organizations usually take different traditional measure like employees’
education & training, motivation, rewards etc. to overcome IT implementation obstacles which
impede its success. But despite this, there remain several other challenges that the management
must resolve to make IT more successful. So based upon above discussions we accept our
research hypothesis.
Hypothesis 5
7.7.0 The literature has identified that top management commitment, involvement and support
can be considered as the foundation stone of IT success, in turn affecting the activities of the IT
function, and the development of IT’s fortune within the organizations. However, that
commitment and involvement are more useful when accompanied by a genuine planning,
investment and government backup for IT usage. It is hypothesized;

228
Hypothesis No. 5: “Al the organizations have same reasons for so far IT success”.
Statistically it implies that;
H0: All the organizations have same reasons for IT success
H1: All the organizations have different reasons for IT success
To test the above-mentioned hypothesis responses of different managers were recorded in the
form of ‘yes’ or ‘no’ answers on the questionnaire and then these answers were dummy coded
with 1 for ‘yes’ and 0 for ‘no’ for analysis purpose. z-Test and chi-square test were applied for
analysis. Results of analysis are discussed as under, values for chi-square are given in Table
7.14 and values for individual z-test are given in Table 7.27. The detail of z-Test is reported in
Annexure XXVII. The frequencies of each reason and measure are given in Annexure XX for
comparative analysis. In this analysis it is tested that “what are the most accepted reasons out
of following due to which IT is successful so far in organizations?” The reasons tested are;
1. Top Management commitment
2. Organization’s proper IT planning
3. Organizations proper IT investments
4. Government Role.
Statistically it is further hypothesized that:
Research Hypothesis No.5(a1): “Most of the companies cite the given ‘reason’ as a cause of
success of IT in their organization”.
These hypotheses were tested for each of the reasons using z-test using a level of significance as
0.05. These hypotheses were statistically tested in the form given below:
50.0:50.0:
1
0>≤
ππ
HH
where π stands for the proportion of organizations in favor of given proposition. This hypothesis
was tested using z test statistic separately for each of the given ‘reason’ and has been discussed
below.
1. Top Management Commitment: In the above hypothesis H0 was rejected for all
sectors and overall. It implies that more than 50% of the organizations feel that ‘top Management

229
Commitment’ is reason for IT success in their organization since all p-values are smaller than
0.05 (Table 7.24).
Results Summary of One-Sample z -Test Table 7.24 IT Success Reason
Sector n Top Management commitment
Organization Proper IT Planning
Organization Proper IT Investment
Government Suport
p- value p- value p- value p- value All Banking & Manufacturing 48 0.000 0.000 0.000 0.000 Banking sector 24 0.000 0.000 0.005 0.213 Local Banks 24 0.000 0.000 0.000 0.000 Foreign Banks 12 0.000 0.000 0.133 0.500 Manufacturing Sector 12 0.000 0.000 0.006 0.133 Local Manufacturing 12 0.001 0.001 0.006 0.000 Foreign Manufacturing 12 0.000 0.000 0.006 0.000
2. Organizational proper IT planning: Again H0 was rejected in above hypothesis for
all sectors and overall. It indicates that more than 50% of the organizations feel that ‘proper IT
planning’ is reason for IT success in their organization. As shown in Table 7.24, all p-values
except local banks, are smaller than 0.05. Respondents in local banking sector admitted that IT is
being applied haphazardly without any rational in their respective organizations, resulting therein
high increase in expenses and rapid obsolete of core IT systems/applications.
3. Organizational proper IT Investments: The Table 7.24 shows variations in p-
values for this reason. Overall, all the companies, manufacturing sector, local and foreign
manufacturing are having p-value <0.05 rejecting H0. However, for banking sector in local and
foreign banks p-value>0.05. Table 7.24 display frequency of the sums of IT investments trends of all organizations and
Figure 7.16 also clearly depicts these results.
Since in overall organizations p-value<0.05, so we accept alternate hypothesis of presence of
relationship.
Figure 7.16
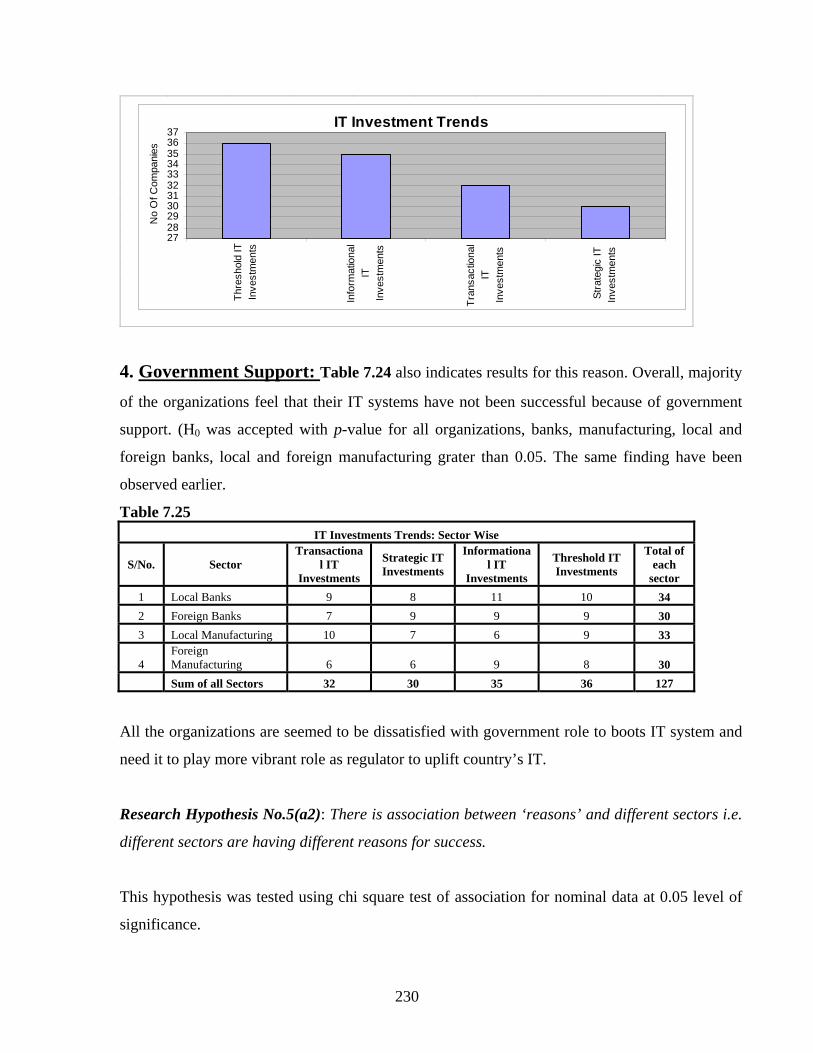
230
IT Investment Trends
2728293031323334353637
Thre
shol
d IT
Inve
stm
ents
Info
rmat
iona
lIT
Inve
stm
ents
Tran
sact
iona
lIT
Inve
stm
ents
Stra
tegi
c IT
Inve
stm
ents
No
Of C
ompa
nie s
4. Government Support: Table 7.24 also indicates results for this reason. Overall, majority
of the organizations feel that their IT systems have not been successful because of government
support. (H0 was accepted with p-value for all organizations, banks, manufacturing, local and
foreign banks, local and foreign manufacturing grater than 0.05. The same finding have been
observed earlier.
Table 7.25
IT Investments Trends: Sector Wise
S/No. Sector Transactiona
l IT Investments
Strategic IT Investments
Informational IT
Investments
Threshold IT Investments
Total of each
sector 1 Local Banks 9 8 11 10 34 2 Foreign Banks 7 9 9 9 30 3 Local Manufacturing 10 7 6 9 33
4 Foreign Manufacturing 6 6 9 8 30
Sum of all Sectors 32 30 35 36 127
All the organizations are seemed to be dissatisfied with government role to boots IT system and
need it to play more vibrant role as regulator to uplift country’s IT.
Research Hypothesis No.5(a2): There is association between ‘reasons’ and different sectors i.e.
different sectors are having different reasons for success.
This hypothesis was tested using chi square test of association for nominal data at 0.05 level of
significance.

231
It is observed from our chi-square test that there is no association between the reasons and the
sectors as p-value= 0.983 > 0.05. It implies that the given reasons were cited with the same
proportion by different sectors.
Figure 7.17
Reasons Organizations think for their IT success: All Companies
05
101520253035404550
Top
Man
agem
ent
Com
mitm
ent
Org
aniz
atio
nsPr
oper
ITP
lann
ing
Prop
erO
rgan
izat
ions
Inve
stm
ents
Gov
ernm
ent
Rol
e
No
Of C
ompa
nies
In addition, a comparative analysis of all the companies based upon the calculated frequencies
(Figure 7.17) puts “Top Management Commitment” at top followed by proper IT planning,
proper IT investments and government role having scores of 47, 36, 35 and 14 respectively. In
comparison of banking versus manufacturing sectors, it is found that in entire banking sector all
companies uniformly believe that their IT success is due to their top management firm
commitment for IT implementation while in manufacturing companies the score for management
commitment is 23. About IT planning, 15 banking organizations believe that their IT projects are
well planned, while in manufacturing 21 organizations feel that they have proper planning.
About IT proper investments 13 companies believe in banking sector that they have made proper
investments so far while in manufacturing sector the number of companies are 17. About
government role only 5 out of 24 banks and 9 out of 24 manufacturing companies have
appreciated government role. If we compare local organizations Vs foreign organizations, in
local organizations again all 24 companies and in foreign 23 companies have appreciated top
management commitment. While for IT planning 18 local companies and 20 foreign companies
believe that their projects are well planned. Regarding IT investments 14 local companies and 22
foreign companies commended their company’s investments. About government role 8 local and
6 foreign companies have appreciated government role.

232
It is concluded therefore, that almost in all the companies in sample, there are different reasons
for IT success. Overall in all the organizations top management support is considered to be
success of any system.
Hypothesis 6
7.8.0 It is identified in the literature that in view of the impact of the modern organizational
setup, user function, information literacy, miraculous advancement in technology and above all a
full involvement of user and its training is the core to success of any organization. It is
hypothesized as;
Research Hypothesis No 6: “Training and user involvement in IT projects of organizations have
great impacts on the performance of the organization and all companies give importance to
them”.
It is observed in the surveys of all companies in sample that every company gives much and
equal importance to the involvement of user in the development/installation of a new system and
its training. All companies consider both of these factors important for their success. In almost
all of the companies’ steering committee comprising of senior heads of different departments
make major IT systems installation decisions. An appropriate budget is allocated to the training
of the employees in each company. The identical ‘yes’ response of all the companies with
regards to test this hypothesis with the following statement “Do you involve user in IT system
development and do you give training to them for IT systems”, points to the facts that the user
involvement and training is being given ‘much importance’ for all. Therefore, no statistical
analysis is made for any test and the research hypothesis no 7 is accepted as such.
Overall Conclusions
7.14.0 For this study six hypotheses were framed to test different research questions. Each
hypothesis tested a number of variables. According to results of data analysis sufficient support
was found for all research hypotheses. The first two hypotheses addressed issues related to
impact of Information Technology on management performance, while next one identified the IT

233
adoption barriers and last four hypotheses dealt with the problems companies usually face in
implementing IT, reasons to overcome these problems, IT so far success reasons, and importance
of user involvement and its training for IT project success. All of these issues were seen to be
more critical because of many reasons. Therefore, real data from the companies in sample is
obtained and utilized in various statistical techniques by using SPSS and Minitab computer
packages. The study has resulted into a number of important issues. As, in the 1st hypothesis it
is observed that IT investment has positive impact on performance of all the organizations in
sample but performance of banking sector, particularly local banks, is much betters then the
manufacturing sectors’ performance. Moreover, IT expenses for all the companies and local
banks in particular have increased tremendously during the last five years.

234
There can be several reasons for these increasing trends in the IT expenditures. Firstly, there was
no proper recognition of the importance of IT at government level till 1990s. The government
has started playing its role more aggressively in creating IT’s awareness and encouraging its use
in the country for the last 4-5 years. It has also reduced import duties and sales tax on IT items
which in turns substantially lowered down prices of IT products, enabling companies to buy and
introduce new IT in every functional area more freely. Secondly, reduction in communication
charges by PTCL as well as availability of state-of-the-art world standard IT infrastructure with
latest communication channels i.e. DSL, VSAT, Radio link etc. is a great attraction for the
companies to replace their old hardware and software.
Most of the companies are now upgrading their existing infrastructure to make it in line with
world standards. Thirdly, due to revised and strong economic polices of the government, most of
the multinationals that were previously working with low profile have started expansion of
services or diversification of products. Therefore, to support this they have started investing
more in their IT set up in the recent past. Conversely, to stay abreast of competition, the local
companies are also improving their IT setup by investing more in it. The last plausible reason for
incremental investments in IT by these companies during the recent years is the availability of
new and modern computer systems/IT products in the market, which were not available few
years back. So, aforementioned initiatives seem to have compelled all companies to introduce
modern technologies in their work to earn more profits, thereby increasing IT expenses.
Similarly, the findings of the 2nd hypothesis revealed that the performance of the management
does not depend on the functions of IT, type of hardware/software is being used in the Pakistani
organizations but it does depend on information systems level. Though use of standard
applications packages and ERP system conceptually and operationally are getting popularity in
the world and in Pakistan too, but still in Pakistan, most of the companies are relying on in-house
developed IT systems. It is also revealed that manufacturing sector companies are converting
their IT systems more rapidly to ERP solutions than the banking sector companies and overall
foreign companies are taking the lead.

235
The 3rd hypothesis proved that the organizations though face many barriers in the way of
implementing of IT but Pakistan’s inadequate telecom infrastructure, lack of planning, lack of
trained employees, improper IT systems are the top most problems faced by these companies.
Government’s uncertain rules/regulations and its’ polices to create IT based economy had been
bureaucratic in past. Though the government has liberalized its IT polices during the last 4-5
years but still there is lot to be done to remove present hindrances to boost IT. Many IT facilities
including creating of communication links via DSL, Radio link, VSAT are still not available in
many of the cities of Pakistan, thereby, creating major problem in the real time, on-line
connectivity of various organizations for full fledge e-Commerce. The systems used are selected
without assessing the actual need. These are either acquired by copying other companies’
strategies or purchased on recommendations of the computer vendors. In addition traditional
problems like culture, human, organizational being at top and economical, political and social
problems after that, also impeded the IT diffusion in the organizations.
The 4th hypothesis confirmed that out of many actions/measures which organizations take to
overcome IT adoption/implementation problems, education & training, employee’s motivation
and rewards are found to be the top most used measure. The 5th hypothesis perceived
top management commitment to be the most accepted reason for, so far, IT success in all the
organizations. The top management is now very active, it is not merely symbolic but giving all
go-aheads for IT implementation by providing different resources and leadership, by setting
goals and objective for IT and showing interest by participating in IT deployment matters. It is
fully committed to implement IT. They have realized the value IT can give to their organization.
IT is heavily being pushed from top management to get its maximum benefits. IT could become
more successful and beneficial with continued top management support in all companies and
particularly in those where there is proper planning and investment in IT systems. The
government more support in setting up proper IT infrastructure could add a lot to all its benefits.
Proper IT planning and investments are found missing in the organizations. There is also no
proper categorization of IT investments in the companies. In addition most of the investments in
all the sector and banking in particular, are found to be made for ‘threshold IT(Just to compete)
investments without any accounting rational Table 7.25.

236
Though it is observed in first hypothesis of this study, that banking sector surpass manufacturing
sector in IT performance, but it is reveled here that banking sector at the same time lacks proper
investments in right areas as compare to manufacturing sector. It is bore out to the facts that the
banks like M.C.B, H.B.L, Union, Faisal are changing their costly core IT systems after short
span of time i.e. in just 2-3 year, citing the reasons that old systems do not fulfill their need. They
are bearing billions of rupees as an expense for this replacement to increase efficiency. These
increased expenses would have been reduced, if the need of the IT systems had rightly identified
and then ‘proper investments with proper planning’ in the right areas had been made. It can be
said therefore, that the banking sector can get much better results with low cost if more attention
is given to properly investments.
It has been observed that generally there is no proper categorization of these investments in both
the sectors. This was confirmed when companies were asked about one of the following
purposes of their IT investments; 1) traditional(cutting costs), 2) strategic (competitive
advantage), 3) informational (information access & communication) and 4) threshold IT(Just to
compete). It revealed in surveys that most of the managers have no idea of this categorization of
purpose of IT investments. However, it has been noticed through response of some manager that
firms are investing more in ‘threshold IT’ and are not unduly concerned about weather the
investment has a positive return. IT is their necessity now, regardless of the accounting rational,
in order to imitate competitor’s technology level.
The 6th hypothesis has identified user involvement and his training as an important aspect in
implementation of IT in all the sectors. All the organizations are much aware of it and are
emphasizing on it lot in all their future planning.
All in all, this study concludes that IT has been applied throughout all areas of both
manufacturing and banking industries efficiently and it has positive impact on the performance
of all the organization. The study has dealt with different issues from several perspectives.
Although all the companies are having same issues but significant differences exist between
them with regards to their IT investments and benefits. The pattern of similarities between
banking and manufacturing tends to support this notion that both the sectors now are best IT

237
user. The banking sector however surpass manufacturing sector in performance with full user
involvement, its motivation, education and training and full top management commitment. More
over this performance is independent of IT systems and types of hardware/software being used
but dependant on IT systems levels. The research also found that all the organizations have been
facing various problems in IT adoption and these were same in all the sectors.
In addition to other problems Pakistan’s inadequate telecom infrastructure is the top problem of
all the sectors. It is indeed challenging for the companies to overcome all these problems. At the
same time, taken together, the results of this study also reveled that all the organizations take
same measure to overcome IT adoption problems using motivation and reward as most used
strategies. The unique results of this study indicates that generally, there is lack of proper
planning and investments in IT projects and mostly ‘threshold IT-Just to compete’ investments
are being made in the companies. Similar to the world, in Pakistan too, the use of standard
application packages is being increased but at the movement organizations with in-house
developed systems are performing well.

238
References:
Bakry Ali Haj and Bakry Saad Haj(2005), “Enterprise Resource Planning: A review and a stop
view”, International Journal of network management; 15: 363-370. Davis, F.D (1989), “Perceived usefulness perceived ease of use and user acceptance of information
technology”, MIS Quarterly, no 13, pp-983-1003. Davis, F.D, Bagozzi, R.P, Warshaw, P.R(1992), “ User acceptance of computer technology: a
comparison of two theoretical models”, Management Sciences, Vol, 35 pp.98,1003. Fink Arlene(2005), “Conducting Research Literature Review”, 2nd edition, Sage Publications, Inc.,
U.K. pp51-148. Gravetter Frederick J & Wallnau Larry B(2000), “Statistics for Behavioral Sciences”, 5th edition,
Wadsworth/Thomson Learning U.S.A. pp 581, 313, 150, 395 Kothari C.R(2004), “Research methodology-Methods & Techniques”, 2nd Edition, New Age
International Ltd. Publisher, New Dehli, India. Pp1-23, 34-35,95-121. Neuman W. Lawrence(1999), “Social Research Methods, Qualitative and Quantitative Approaches”,
3rd edition., U.S.A. Allyn & Bacon Publisher. Reddy R, Jayaprakash(2004), “Research Methodology”, A. P.H Publishing Corporation New Dehli,
India.pp 11-16. Somekh Bridget & Lewin Cathy(2005), “Research Methods in the Social Sciences”, Vistaar
Publications, New Dehli, India. pp197-236. Willing, C.(2001) “Introducing Qualitative Research in Psychology: Adventures in Theory and
Methods”, Philadelphia: Open University Press. Zikmund, W.G(2000) “Exploring Marketing Research”, 7th edition, U.S.A, Thomson Learning.

240
Chapter
Findings, Conclusions And Recommendations General
8.01 This chapter presents the overall findings/conclusions and recommendations based on the
literature review and the survey. This chapter is divided into two sections. The first section
contains the conclusions while the second section presents the researchers’ recommendations. An
overall conclusion is given at the end of the chapter.
Major Findings
8.1.0 The literature review established that Information Technology plays an important role in
growth and uplift of today’s organizations and a country’s development. IT is a major source of
change and revolution in the working of organizations now a day. IT is becoming cheaper and
better at an exponential rate. The developing countries like Pakistan have been relying most on
the IT which has been developed by the advanced countries. The success of any technology is
dependant upon its proper diffusion which is most decisional, crucial and costly stage, so is case
with IT. Besides a supportive infrastructure, user perception, attitude and interaction play an
important role in the adoption process. The adoption process for any technology requires fullest
involvement and acceptance of the user. IT is more user-oriented and needs to be deployed by
offering different incentives, rewards, recognition and moral supports to its actual user with
fullest top management support. IT is a technology of time, therefore, its acquisition and
diffusion has now been the focal point of nations’ agenda of all the developing countries and
catching the attention of both the private and public companies.
It was also established in the literature that IT is the important management tool. It occupies a
key role in modern science and technology. It is having a pervasive impact on virtually every
sphere of life and is having great presence in all industries, in service, as well as, in
manufacturing. IT is being used in all functional areas of the organizations to increase their
8

241
performance and it is now playing more important role in the organizations than labor and capital
do. Over the time the use of IT has increased rapidly in all the organizations.
The literature review also showed that the benefits of IT and its advancement in hardware and
software have compelled the companies to utilize it in all their functional areas. The successful
IT introduction in the organizations has saved time and money, increased revenue and market
share, interlinked several functions and units, improved organizations’ performance by
eliminating delay, reduced administrative intermediaries and redundant processing steps by
providing better access to information, improved decision making etc. The organizations use the
ability of IT to achieve new goals and processes and perform the things that are not already done.
IT is used for organization’s reengineering, innovation, organization’s transformation and as a
strategic weapon for social and economic changes.
The advances in IT have significantly influenced the radical change of the twentieth century. IT
has permitted the firms to become more efficient, more effective, more flexible, and
economically more powerful in ways once impossible but all IT benefits are dependent upon the
way the management deploy it in the organizations. An industry using IT will have to consider
that how much, when and where to make IT investments to get better performance. They also
have to consider that what type of hardware, software, personnel and information systems they
are using. Proper training and involvement of the user in IT projects were also found to have
great impact on IT success to increase the management performance. An appropriate IT
investment decision, selection of the appropriate hardware, software, personnel and systems’
type involve an intelligent decision making, and subsequently, the success of the entire set of
management processes.
In the literature review it was also established that many organizational and systemic factors may
impede the adoption of IT. Important among these are culture, social, political, governmental,
economical, individual, structural, lack of coordination among different departments, lack of
proper infrastructure, lack of management support, and lack of finances etc. The success of any
technology depends on right/effective use of these factors and aligning these factors with new
strategic technology adoption decisions is a complex process that requires a complete

242
understanding of all aspects of these factors. Therefore, there is a great desire of proper
management of technologies as per specific need, culture and environment of any organization
and country. If a country or company simply trying to follow another country’s or company’s
adoption model, it is not likely to work very well at all. It needs to adopt any particular
technology according to its own environment, culture, conditions, need and requirements.
Barriers to adoption and diffusion of technology depend on the particular technology adopted.
Although barriers to take-up and spread of IT are similar for the use of each level of IT but there
can be significant differences in emphasis. The size of these barriers differs across countries and
organizations. Longer these barriers are, the greater the investments and efforts organization has
to make to adopt and use IT. A suitable culture, social acceptance by the employees, favoring
governmental, political and economic conditions were found to be important factors for success
of IT and failing to put proper dimensions of these factors can inhibit the success and may
increase the risks of failure. The proper management of technology as per specific culture,
political, social requirement of the organization can make any technology a success.
It is revealed in the literature that IT has proven to be the key technology of the past two decades.
Over last one decade it has developed at a breakneck speed and has brought tremendous
opportunities for mankind globally. In Pakistan IT is comparatively a recent arrival but it is
progressing smoothly. IT has been introduced in every discipline now. Newer and IT friendly
methods are being acquired to keep people abreast of the latest information about the innovation
and inventions going on around global efforts. The growth in Pakistan IT industry has been
unleashed in the past years. Almost every organization working in Pakistan is using IT for its
tasks. The government of Pakistan has laid great emphasis on enlarging the scope and intensity
of IT in variant areas. IT has got massive attention from the present government. The
government has liberalized its rules and offering different incentives to boost up IT usage
through comprehensive policies regarding IT, telecom deregulation, cellular mobile and
broadband. These policies have given strategies direct and set objectives for improvements of
Information and Communication Technology in the country. Pakistan places science and
technology among its top concern with particular focus on IT and telecom and these areas have
shown tremendous growth. Though introduction of IT in Pakistan was started in 1960 but its
widespread diffusion has started during the last few years. Maximum attention has been focused

243
on development of IT infrastructure at all levels. IT infrastructure and services across the country
are fairly well established and Pakistan has state-of-the-art telecommunication network
comprising of digital switching, transmission, radio and fiber optic cables and other modern
technologies. Pakistan no more remains a silent observer to the spiraling growth of the IT but is a
true user of all its latest tools and techniques. The IT industry in Pakistan has not yet achieved
sufficient maturity for it to serve its needs and to face severe competition in the international
market. The IT hardware industry is facing death while its counterpart-the software industry is
flourishing. The Pakistan is still relying on computer hardware, most of which is imported from
developed countries. But Pakistan's IT software industry has everything one may need, experts
from various disciplines, highly skilled and economical workforce, a modern and rapidly
expanding telecommunication system, all this is backed by an unmatched investment package
offered by the Government of Pakistan. The government is building IT skills by liberalizing its
laws for establishing IT institution. These institutions are needed to be monitored carefully for
quality education, to produce world class IT experts.
The government is taking all possible steps to institutionalize the traditions of IT in all sectors in
the country. The government’s policies with respect to E-Commerce and Internet business are
fairly well and it is because of them that Pakistan has now emerged as one of the most
technological enhanced nation in the region. In a very small span of time the government has
managed to turn around the economy to make its base more along the lines of technology
oriented industry rather than conventional industries of yore.
In addition to other organizations banking & manufacturing industries of Pakistan are also using
IT since ages in almost all of their applications. It has been established that IT investments have
positive impact on organizational performance of both the industries. IT has become means of
better production and services in these industries. The literature review also established that in
banking IT is being used mostly for customer oriented applications and the banking industry
seems to be more benefited with IT than that of manufacturing. At the same time ATMs and
other on-line facilities offered through IT have raised the important serious issues of security,
authentication, consumer protection, privacy and integration of data. This includes issues relating
to confidentially of information, preventing of data corruption and prevention of fraud. Many
244
organizations are using appropriate technologies for encryption of data for secured transaction,
regular and multiple backups, extensive use of password and other forms of authorization to have
security. There is a lack of standardization in the software being used in the industries. The
expenditures on IT are seemed more than the benefits being received. The exponential growth of
the IT industry in Pakistan, with a rising number of software packages has necessitated the need
for interaction between the government IT policy makers and the IT usage organizations for
standardization. The organizations may get strategic business benefit in term of high corporate
image higher business orders, faster payments, better customer value and increased employees
commitments but financial benefits in term of cost savings are not achieved.
The survey of the banking and manufacturing industries of Pakistan has revealed that IT is being
applied successfully in all areas of both the sectors and they are achieving many benefits.
Predominantly the major benefits achieved across both the industries are, increase in incomes,
customer image, stakeholders’ confidence, interoffice links, employees’ commitments etc.
Overall, it is found that the IT has positive impact on organizational performance of all the
organizations but performance of banking sector, particularly local banks, has been much better
than the manufacturing sectors in Pakistan. Moreover, IT expenses for all the companies and for
local banks in particular have increased tremendously during the last five years. It is also
revealed that the performance of all IT based organizations does not depend on the functions of
IT, type of hardware/software but it does depend on information systems level. Though use of
standard applications packages and ERP system conceptually and operationally are getting
popularity in the world and in Pakistan too, but still in Pakistan, most of the companies are
relying on in-house developed IT systems and are performing well.
It is identified that the organizations though face many barriers in the way of implementing of IT
but Pakistan’s inadequate telecom infrastructure, lack of planning, lack of trained employees,
improper IT systems were identified as the greatest impediments to IT success in both the
industries. In addition socio-culture/organizational/systemic problems like culture, human,
organizational being at top and economical, political and social problems after that, also impeded
the IT diffusion in the organizations. It is also observed that out of many actions/measures which
organizations took to overcome IT adoption/implementation problems with regards to the

245
employee’s resistance, the measures like education & training, employee’s motivation and
rewards were found to be at top. Above all, the top management commitment was found to be
the most accepted reason for, so far, IT success in all the organizations. At the same time proper
IT planning and investments were found missing in the organizations. There is also no proper
categorization of IT investments in the companies. Most of the investments in all the sectors, are
found to be made for threshold IT(Just to compete) investments without any accounting rational.
The user involvement and its training were found to be an important aspect in implementation of
IT in all the sectors on which all the organizations are much aware and emphasizing a lot in all
their future planning.
All in all, it is found that IT has been applied throughout all areas of both manufacturing and
banking industries efficiently in Pakistan and it has positive impact on the performance of all the
organization. Although all the companies have been facing same problems in IT adoption but
significant differences exist among them with regards to their IT investments and benefits. The
pattern of similarities between banking and manufacturing tends to support this notion that both
the sectors are best IT user but banking sector surpass manufacturing sector in performance with
full user involvement, motivation, education and training and full top management commitment.
Moreover, this performance is independent of IT systems and types of hardware/software being
used but dependant of IT systems levels.
Recommendations
8.2.0 The importance of IT is represented by the amount of research in the literature review and
survey in this study. Based upon the overall results of this study, the following policy
recommendations for improvement of IT utilizations for Pakistani banking and manufacturing
sectors are made;
1. The banking and manufacturing sectors in Pakistan are showing signs of robust
growth after the extensive reforms undergone during the past decades. The
introduction of structural reforms in the Pakistani banks in 1974 and 1992 and in
manufacturing sector in 1974, 1980 and 1989 were, by far, an important milestone in
the economics management of the country. Though both, but banking sector in

246
particular, was in the vanguard in this reform process. Coupled with, by
implementing IT both sectors are receiving high operating benefits. However, the cost
of IT utilization has been very high in both the sectors. As it revealed in our analysis
that IT investments have been increased in banking sector as a whole and there is
high rise in IT investments in local baking sector in the latest IT systems in the recent
years as compared to foreign banking sectors. The local banking sector of Pakistan is
using IT more discreetly than the foreign banks. As percentage of IT expenses for
the years 1999-2004 for total banking sector, are 76.33%, out of their total IT
expenses for the years 1990-2004. The percentage increase in IT expenses in local
banks is 82.53% for the year 1999-2004 out of expenses of the years 1990-2004,
which is much higher than the foreign banks where %age increase is 61.20%. There is
also increase in cost in manufacturing sector but in comparison of local versus foreign
manufacturing companies mixed trends have been observed in IT spending. The IT
expenses percentage is 69.17% and 56% respectively for both the sectors out of
incomes of years 1990-2004. But surprisingly, percentage IT expense for local and
foreign companies for the years 1990-2004 as a whole are 29.73% and 42.33%. It is,
therefore, evident that overall foreign manufacturing sector is investing more in IT
than the local manufacturing sector. Overall, there is remarkable increase in the IT
expenses and in income in return, of all the companies, given to the facts that IT
expenses are 17.730 billions in 1990-2004 and in 1999-2004, these are 11.390
billions, which are 64.24% of total IT expenses. The net income is 75.960 billions in
the years 1990-2004 and for the years 1999-2004 it is 52.40 billions. The percentage
increase in net income thus comes to 69.04% for year 1990-2004.
Initially many organizations worldwide moved toward IT under an assumption that
there would be a major reduction in transaction cost. However, because of various
problems including lack of proper IT infrastructure and limited access to Internet in
developing countries and in Pakistan too, the IT base applications became an ad-on
channel providing better and more efficient services to the organization stakeholders.
The IT base business processing to retain customers has become more significant
drivers of automation although cost reduction remains one of the long term drivers.

247
The plausible reasons to this increase cost as revealed in our results are due to the
introduction of new IT products and improper investments of failing to match IT
capabilities to organizational need. Both the sectors have failed to identify a particular
strategy for IT investments and share them with those responsible for planning. The
organizations have been investing in IT without really having a strategy for its usage
and a plan to make this investment work for the organization. The new computers
were needed either due to the reasons that the competitors had it or it was
recommended by some vendors. The management being pushed into buying a piece
of hardware and software programs and when the machine was there, the companies
began to think as to what uses can and should it be put to. This approach neither
worked in past nor it will work in future. The management now is very much
educated about the facts but still is unable to devise a proper investment strategy. A
plan is needed to be worked out as to what kind of application software is needed,
what kind of benefits are expected over what period of time needing what size and
capacity of hardware. While setting up an IT strategy, it is imperative that first of all
the applications that shall form part of the overall plans be identified, as also the
information needs of the different levels of users from each. As revealed in our study
that the management performance does depends upon the properly designed M.I.S.
Therefore, the hierarchy of information needs has to be established for all levels of
management. A detailed cost and benefits analysis of each application also is to be
made.
As reveled through our analysis, a proper categorization of IT cost is missing in
organizations. It is also needed to be done. The cost, both in term of capital
expenditure on hardware and software, as well as the operating cost of running and
maintaining any application, taking into account its growth in size and scope over the
years is to be calculated. The data integration and capturing is to be ensured. The
implementation models of each application should also be established and it should
be ensured that the compromises made during implementation have not affected the
overall design of the applications. The implementation of each application should
ensure that the benefits have been calculated to be delivered as per calculations.

248
Overall, the strategy should payoff handsomely for the organization, both for short
and long term and should have healthy return on investments.
At present, except a few, most of the organizations in both the sectors are operating in
private sectors where they have more freedom on decision making and deployment of
funds. The deregulation or powers, liberalization of the regulated regimes and all
round market orientation in the organizations working have therefore ushered a
totally new era in the Pakistani organizations. The new licensed banks and
manufacturing industries have a clean beginnings and modern technology in
operations is their trump card in attracting business. They can rationalize IT projects
cost by adopting aforementioned strategy and maximize their benefits. Newer and
newer information systems cost millions but can not be dispensed with when the
competitor invest in them and move ahead. But at the same time cost associated with
these systems is to be rationalized as above and investment be made in accordance
with the need.
2. Our results revealed that although the companies in both the sectors which are using
in-house developed systems are performing very well but the performance of the
companies which are using world class ERP systems/standard applications for their
core areas is excellent.
The deregulations and increasingly competitive environment has possessed a
challenge in term of efficiency now. An analysis by the computer giant “IBM”
predicts that over the next decades, the pace of technological innovation would
reinforce Darwan’s law of the survival of the fittest’ and as a result, only most
efficient organizations would survive while the less efficient organization would be
driven out of the market. It is extremely essential, therefore, for organizations to
maximize the use of new technology in order to increase efficiency, reduce their cost
and be in the market. In the highly competitive environment of 21st century with
increased need of integration of information, organizations will not be able to fulfill
their organizational need and to attract customers with present out dated systems.

249
Efficiency and technology will go hand in hand in future. Banks will need to
rationalize the scale of branch network by deploying latest information and
communication technology and manufacturing organizations also have to work with
more advanced integrated automated systems. Increased use of information for
decision making will make possible centralization of many routine processing
operations currently carried out in the branch or regional office. Tomorrow
organizations will be vastly different from the present ones. All the organizations in
both the sectors will have to focus on enhancing and developing new products so as
to increase their income. As a result, an organization needs to enhance existing
systems with new features and functions and to build systems for introducing new
products and services in the existing system is compulsory. Each organization and its
circumstances are unique in terms of the organization’s history and culture, the
characteristic of employees and management, strategy, and customers it serves. So
their need differ to have IT systems which meets their requirements. But the
successful organizations are those which are open to change, innovations, and
learning. In concise terms, these changes can be managed through i) A good
information systems ii) latest technology and skills for decision making iii) Improved
customer services iv) Friendly attitude pattern of the personnel at all levels.
It is high and better time the organizations should develop some framework for
gathering information about suitable IT through products/services a company may
offer, and quantitative and qualitative benefits a company may receive. Such an
exercise can provide wealth of information which can be used to evaluate the
performance of an organization vis-a-vis IT and assess competitive advantages which
the organization may get by same way. Such information will not only help an
individual organization but also the entire industry as well as the regulatory
authorities. The other dimensions on which information about IT need to be collected
are; 1) Existing infrastructure 2) IT spending 3) Future IT investments 4)
Organization 5) Benefits and impact. This all will greatly help to coordinate efforts
and schedule information technology projects and give them priority, taking into

250
considerations major objectives. In future organizational scenario for the deployment
of IT is going to be more challenging.
During the last few years, organizations have already gone through different stages of
‘restructuring’, ‘reinvesting’ and, ‘reengineering’. Future IT scenario is changing very
fast. Though it may be difficult to make any predictions about the future but timely
decisions making and prompt action are two major ingredients for a successful
organization. The organizations have to have twin strength of MIS and Technology to
compete. The very future of both the sectors hinges on strategically applying IT in
new and innovative way. This phenomenon raised the need to utilize the world class
IT systems. All this would be possible only with the use of ERP systems. As the
world is moving towards integrated standard packages so be the Pakistani
organization.
The ERP systems are becoming of increasing importance as integrated part of
business networks. They support ‘e-business implementation’ for better enterprise
performance, ‘integrate activities’ for higher enterprise efficiency, and enjoying a
‘modular architecture’, for future extensions and further benefits. To get these
systems right at the movement toward a global economy is evident in many unfolding
trends. It may initially cost high to the companies but would definitely provide them
cost saving gradually and competitive edge in future. The organizations may develop
their own ERP systems or the world leading standardized integrated software
application packages i.e. SAP or JD Edward(Oracle)/ Misys, Fidelity etc., can be
considered by the organizations because of their world wide acceptance and usage. If
the organizations can not afford the entire modules then few of them initially may be
acquired. In the selection process however followings critical factors are crucial and
should be taken into account to have cost effective better system 1) The basic features
of the ERP systems software 2) The application features of the ERP with regards to
specific business of the enterprise 3) The ERP vendor or supplier market strength and
support to customers 4) The ERP implementation speed and 5) The ERP cost.

251
3. Pakistani organizations are not lagging behind multinational companies now in
offering technology based services to their customers. Our survey reveals that local
banks surpass the foreign bank and manufacturing companies, both in technology
adoption and performance. Except Citi bank and Standard Chartered bank, all other
foreign banks are operating with branch network of 1-6 branches through out the
country. The local banks are facing stiffening competition among themselves and
with their counterpart foreign banks due to increasing demand of customers. The
local banks have huge branch network. So to manage it they will have to further
deploy the state-of-the-art technology and heavily invest in term of money and human
resources to transform old systems and procedures in order to make them compatible
with the latest technology. As far as IT products currently being used by Pakistani
companies, they are of course world class and at par with international standard,
however it is the area of application of these IT products where these industries were
immature and improvements in application is much desired to bring quality and
standard in customer services as well as strengthening the communication
infrastructure. There is a need for standardized applications, new skills, new attitude,
new organizational structures, and new relationships in a technology-driven
environment. A strong program in human resources development at all level is
required both at the individual organization as well as industry level. Alongside, the
recruitment of high caliber staff is necessary.
4. It is observed through our surveys that though the organizations are taking proper
measures for security, authenticity, consumer protection and privacy of data through
appropriate technologies for encryption of data for secured transactions, regular and
multiple backups and extensive use of password and other forms of authorization to
have security, but still there exist lot of things to be done in this regard for more
security. As in banking where the computers are more open to public ATM etc , many
instances of unauthorized funds withdrawals and transfers have occurred. As also
pointed out by Federal Financial Institutions Examination Council (FFIEC, USA) that
legacy system of user ID and password is inadequate for financial transactions, so
there is a need to use at least two factors authentication similar to one used for credit
252
card transactions and that the selection and use of authentication technologies should
depend on the results of the financial institution’s risk assessment process. Electronic
transaction ordinance with the electronics crimes act and data piracy act should be
enforced immediately by the government.
5. Our research revealed that the organizations are faced with following major problems
of IT implementation 1) Inadequate telecommunication systems 2) Lack of adequate
trained human capital 3) Selection of IT system to suit the organizations growing
volumes of transactions 4) Management unawareness on utility of computer
information on better output. 5) lack of planning. 6) Organizational/systemic
problems like culture, economical, political, social, governmental etc. To overcome
these problems the experience of those who have successfully adopted Information
Technology can help by providing guidance. The advanced countries have been
accumulating experience not only in formulating and adopting polices and programs
that promote the generation and diffusion of IT, but also in assessing their
effectiveness. Such experiences can be shared with advanced countries. Such
programs which transform their business to overcome challenge into opportunities
would have to be carried out by the organizations. The following can also be done in
this regard;
i). Present era of globalization is built around falling telecommunication
costs. The cost of telecommunication in Pakistan is still higher. Though
PTCL has already reduced tariffs but it should bring the charges/tariffs
further down for all existing services.
ii). The bandwidth should further be increased, prompt delivery and quality of
services also be assured.
iii). The Pakistan has state-of-the-art telecommunication network but needs
immediately an overhaul to the old PTCL organizational structure to make
it line with the world standard.
253
iv). It is an urgent need that PTCL should further enhance its communication
network and other telecommunication infrastructure to all cities of the
country to provides extended communication dial up, DSL, dedicated
bandwidth, VOIP applications, cheaper call rate and domain server to the
companies by replacing/enhancing the current infrastructure of the current
PTCL network. The role of the government in this regards has become
very crucial after privatization of the local largest loop conglomerate i.e.
PTCL to Etisalat, which is a regional telecommunication giant with a large
sophisticated network of switches and true telecommunication
cognoscente. It has extensive experience in both, product launch activities
as well as enhancing customer base and thus can cater the need and
requirement of the masses. Etisalat’s management with its brand name and
success rate that it foster over years of evolution can make PTCL a
success and should take these measures immediately for increase its
services and revenues.
v). The country has abundant pool of young talents but they are lacking with
competency for using new IT products. The Government of Pakistan has
been supportive to all digital initiatives in the recent past but it urgently
needs to further revolutionize its IT infrastructure. It needs to educate and
train and bring its workforce to the international standard. It should bring
intense focus on building an information based economy by upgrading the
technical and managerial skill of people. The training programs similar to
that, which are being offered by Simens and Punjab Information
Technology Board for most commonly and demanded application
software programs i.e S.A.P, Oracle, Misys, Fidelity and all other new
products, are to be offered with more low fee structure. It could be done
by educational institutions / universities by establishing E.R.P centers in
collaboration with leading E.R.P providers. In addition to offering
certification in respective package/software, these institutions should also

254
update their current curriculums with new E.R.P courses. The government
should give more grants to all those institutions who want to establish such
center. The same type of centers should also be established by E.R.P
vendors to provide training of such systems through out Pakistan. All this
will not only provide an opportunity to the existing IT professionals at
mass level to update their knowledge with these new IT systems but also
will give chance to the young graduates to equip themselves with
changing IT scenario. So that, when they would enter in the job market
they would have attained all the prerequisite training of new
popular/leading E.R.P systems.
vi). Selection of IT systems is to be made prudent. Procurements should not be
made on recommendations of vendors or followings other company’s
strategy, but be made keeping in view the company’s own present and
future requirements to avoid obsolescence and extra cost. A committee of
experts in the organizations is be made to take such decisions.
vii). Though the top management of every organization is now fully aware of
IT importance and open to its investments but overall still there exist its
incapability for IT strategic planning. Plans are made in isolation of IT
heads. As a result these plans do not work properly when IT department
refuse to provide support for various projects due to certain limitations, so
leaving the chance for failure of many projects. The top management must
realize the importance and changing role of IT department from facilitator
to strategy maker. They should involve IT managers in strategic decision
making. In addition, the IT talent should not be generally marginalized but
rewarded on performance basis. A good human resource policy with new
codes with regards to reward systems for IT employees is mandatory for
success of organization.
viii). The role of government is very important for development of an industry.
The government policies with regards to IT are fairly well but a

255
continuous update to them is needed. A more clear policy with regards to
IT is needed by the government as the objectives of the previous IT policy
generally lacked coherence and consistency. The IT industry of Pakistan is
showing continuous growth in software but still lack behinds in hardware.
The government must give more incentives for software exports and also
encourage use of local software/ hardware in public and private
organizations.
The importance of imported application software SAP, Oracles,
PeoplesSoft, Maxio, Misys, Sibel etc. can not be ignored but at the same
time local software usages also be encouraged at least for routine ‘non
core’ applications, like for example Phonix, a Pakistani software is being
used successfully by all banks for one-link ATM network and another
common network system is being used for clearing. The local software
companies have spent several years in studying banking and
manufacturing domain and have developed competitive products. They are
able to offer expertise to local and international organizations in their
quest towards e-Business. So, they are to be given some share. At the
same time the standardization of the software is to be maintained across
the organizations with capability for bridges for external communications.
This requirement for standardization is getting more crucial with a need of
integrated industry wide network. The best example is use of SWIFT
package by all the banks for inter bank messages for foreign exchange
import/export transactions. Further to optimize cost, organizations may
share in other IT facilities. Banks in Pakistan are already cooperating in
using ATMs services, the future areas of cooperation in settlement, back
office, data warehousing etc. can also be extended in banking sector. The
manufacturing companies might also share some common systems in the
same way. This industry based standardization/cooperation can be
monitored by the regulating authorities i.e. State Bank and Security &
Exchange Commission of Pakistan. The government should also

256
encourage the local vendors in research & development activities to
produce more innovative IT systems.
6. While the organizations are achieving e-Commerce, e-Business, e-Banking status
where all the business transactions are conducted through computer, it is apprehend
that there will be no physical contact between the companies and the customers. The
organization should devise the ways right now that how they will retain the loyalty of
customers in future in the absence of physical contact.
7. To be more cost effective certain traditional (non-core) IT services in both the sectors
might also be outsourced to gain more efficiency and effectiveness. The use of this
technique free the managers to focus on their core job rather than routine operations.
The others could do a better job for the organization while remaining aligned with the
organizations’ overall strategy and objectives. This concept is gaining popularity day
by day in the world and in Pakistan too. The companies like Packages, Honda Atlas
and Standard Chartered bank, which were also in the sample of this study, are already
experimenting this and are satisfied. This experience might be shared by other
companies as well.
8. No doubt, the Pakistani Government now is fully supporting IT usage in the country
and it has taken some steps already to boost IT. The organizations and people in
Pakistan are learning fast to use IT but still there is a need for the government to act
more quickly with new plans to overcome all existing barriers. The Pakistan’s IT
policy planners must devise some newer IT plans and implement them in letter and
spirit to compete in the world which is changing at an unprecedented and
uncontrollable pace. The government must also consult IT experts before launching
any IT policy.
Overall Conclusions
8.3.0 As pointed out in the literature review, IT is playing an important role in the uplift of
modern organizations. IT has become a matter of strategic importance for today’s organizations.

257
IT is no longer seen as a choice, but as a necessary strategy for an organization to adopt to
improve productivity and enhance its competitiveness in the global economy. A variety of
industries are using IT to both ‘lock in’ their customers and ‘lock out’ competitors. Today’s and
future Information Technologies offer great potential, but only a few organizations have really
succeeded in deploying effective global IT capabilities. IT with all its benefits proves to be a
necessity of modern organization systems to cope up with the ever-increasing need for efficient
and prompt service to the customers.
The findings of this study revealed, however, that the benefits of IT will be constrained by many
problems that exist in the area of use of application software. Coupled with increasing cost and
greater emphasis on the Internet and emerging applications from Internet technology,
organizations are required to carefully use IT as an important resource to exploit its full potential.
However, the task of strategizing IT has become more complex and troublesome due to the rapid
pace of its development. The selection of type of IT to adopt with rationalized cost is another
major consideration because of keen competition among the key IT providers. The
standardization of software/hardware and the use of world class IT systems, across the industries
is also the need of time, alongside establishing training centers for most recent E.R.P/customize
standard packages in educational institutions with government support.
The implementation of above recommended policy framework may assist in achieving an
efficient IT adoption with wider spectrum in both banking and manufacturing sectors and
would definitely bring higher growth rate/incomes for these companies to be at top.
Direction For Future Research 8.4.0 This research has explored very important issues of present time by examining the impact
of Information Technology (IT) on organizational performance. In this study, a holistic
framework was developed to examine the impact of IT on organizational performance for
Pakistan’s banking and manufacturing sectors. While the relationship between IT and
organizational performance was examined based upon perceptions of the managers and perusing
financial reports. The importance of other related factors including systemic, sociological and
organizational etc., facilitating or impeding use of IT, was also identified. This framework also

258
shows impact of IT investments, impact of IT systems, impact of top management, and impact of
training, impact of user involvement and impact of organizational and systemic factors on
organizational performance. It has been observed that IT has positive impact on performance of
the companies. IT has been applied throughout all functional areas of both manufacturing and
service industries to increase their performance and it is now playing more important role in the
organizations than labor and capital. All the companies are investing millions of rupees on IT to
make them more competitive, but as per this research findings, the performance of banking
sector is seemed to be much grater than the manufacturing sectors and local companies are
taking lead in this regard. Proper training and involvement of the user in IT projects, top
management commitment and latest IT systems were also found to have greater impact on IT
success to increase the management performance.
The role of organizational and systemic factors like culture, government, individuals, social,
political and economic factors which may affect the adoption of any technology, is also explored.
It is observed that that these factors play an important role in the success or failure of any
technology and size of these factors differs across countries and organizations. The proper
management of technology as per specific culture, political, social, economic requirements of the
organization, can make that technology more successful. Though Government of Pakistan’s role
is found very positive to promote IT in the country but still there exist further need for the
government to support IT sector to enhance IT facilities.
The similar nature research can also be carried out for other sectors of Pakistan’s economy as
well, by using the same frame work developed in this research. While finding of this study
suggest the main/basic proposition that IT does have influence on organizational performance,
therefore, there is a need to conduct further research to test the causality between IT and
organization performance by controlling other factors impacting organizational performance.
Beside IT, there are other factors i.e Management, Human Resources, Marketing service and
Manufacturing competency etc. as well, which affect the performance of the organizations.

259
Further investigations into these areas can also be made. This may be achieved by undertaking
relevant field work and making a detailed study of the firms in the selected sectors.

iTotal and IT Employee % Graphical Representation Annexure I
Years IT emply %1990-91 4.1769041771991-92 5.2132701421992-93 5.8823529411993-94 5.0526315791994-95 5.3505535061995-96 4.9152542371996-97 4.3806646531997-98 3.3623910341998-99 3.3694344161999-00 4.0268456382000-01 4.0570175442001-02 4.6186895812002-03 4.7717842322003-04 4.6889952152004-05 4.523026316
All Foreign BanksAll Foreign Banks
0
1
2
3
4
5
6
7
1990-91
1991-92
1992-93
1993-94
1994-95
1995-96
1996-97
1997-98
1998-99
1999-00
2000-01
2001-02
2002-03
2003-04
2004-05
% a
ge o
f IT
empl
oyee
s to
Tot
al
Empl
oyee
s
Annexure II
Years Tot Emply1990-91 4071991-92 4221992-93 4421993-94 4751994-95 5421995-96 5901996-97 6621997-98 8031998-99 8311999-00 8942000-01 9122001-02 9312002-03 9642003-04 10452004-05 1216
All Foreign BanksAll Foreign Banks
0
200
400
600
800
1000
1200
1400
1990-91
1991-92
1992-93
1993-94
1994-95
1995-96
1996-97
1997-98
1998-99
1999-00
2000-01
2001-02
2002-03
2003-04
2004-05
Tot
al E
mpl
oyee
s

ii Total and IT Employee % Graphical Representation Annexure III
Years IT emply %1990-91 0.3979446811991-92 0.4350392411992-93 0.4849618341993-94 0.5074202251994-95 0.5240670971995-96 0.5300672621996-97 0.5505118791997-98 0.6770148991998-99 0.748281141999-00 0.8014637672000-01 0.8144611542001-02 0.8931445122002-03 1.0839140022003-04 1.1487819972004-05 1.170427016
All Local BanksAll Local Banks
00.20.40.60.8
11.21.4
1990-91
1991-92
1992-93
1993-94
1994-95
1995-96
1996-97
1997-98
1998-99
1999-00
2000-01
2001-02
2002-03
2003-04
2004-05%
age
of I
T em
ploy
ees
to T
otal
Em
ploy
ees
Annexure IV
Years Tot Emply1990-91 457351991-92 457431992-93 459831993-94 471011994-95 475131995-96 498051996-97 517701997-98 449031998-99 411611999-00 388042000-01 391672001-02 372842002-03 335822003-04 339492004-05 34261
All Local BanksAll Local Banks
0
10000
20000
30000
40000
50000
60000
1990-91
1991-92
1992-93
1993-94
1994-95
1995-96
1996-97
1997-98
1998-99
1999-00
2000-01
2001-02
2002-03
2003-04
2004-05
Tot
al E
mpl
oyee
s

iiiTotal and IT Employee % Graphical Representation Annexure V
Years IT emply %1990-91 0.3576982891991-92 0.3928213821992-93 0.41993-94 0.4200442151994-95 0.4383081311995-96 0.4278900111996-97 0.4632510541997-98 0.4957994771998-99 0.5285920231999-00 0.5810376652000-01 0.6107275622001-02 0.646182252002-03 0.6111924622003-04 0.6319115322004-05 0.600529879
Local ManufacturingLocal Manufacturing
00.10.20.30.40.50.60.7
1990-91
1991-92
1992-93
1993-94
1994-95
1995-96
1996-97
1997-98
1998-99
1999-00
2000-01
2001-02
2002-03
2003-04
2004-05%
age
of I
T em
ploy
ees
to T
otal
Em
ploy
ees
Annexure VI
Years Tot Emply1990-91 128601991-92 129831992-93 135001993-94 135701994-95 136891995-96 142561996-97 144631997-98 145221998-99 145671999-00 146292000-01 150642001-02 151662002-03 157072003-04 158252004-05 16985
Local ManufacturingLocal Manufacturing
02000400060008000
1000012000140001600018000
1990-91
1991-92
1992-93
1993-94
1994-95
1995-96
1996-97
1997-98
1998-99
1999-00
2000-01
2001-02
2002-03
2003-04
2004-05
Tot
al E
mpl
oyee
s

ivTotal and IT Employee % Graphical Representation Annexure VII
Years IT emply %1990-91 0.6110283161991-92 0.621936051992-93 0.6145490921993-94 0.6246996641994-95 0.6820351931995-96 0.7588075881996-97 0.7904608791997-98 0.8193991071998-99 0.8490878941999-00 0.9525699542000-01 0.954449712001-02 0.9844457572002-03 0.9693974532003-04 1.0045489012004-05 1.032030709
Foreign ManufacturingForeign Manufacturing
00.20.40.60.8
11.2
1990-91
1991-92
1992-93
1993-94
1994-95
1995-96
1996-97
1997-98
1998-99
1999-00
2000-01
2001-02
2002-03
2003-04
2004-05%
age
of I
T em
ploy
ees
to T
otal
Em
ploy
ees
Annexure VIII
Years Tot Emply1990-91 134201991-92 136671992-93 139941993-94 145671994-95 146621995-96 147601996-97 149281997-98 150111998-99 150751999-00 151172000-01 151922001-02 152372002-03 157832003-04 158282004-05 15891
Foreign ManufacturingForeign Manufacturing
12000125001300013500140001450015000155001600016500
1990-91
1991-92
1992-93
1993-94
1994-95
1995-96
1996-97
1997-98
1998-99
1999-00
2000-01
2001-02
2002-03
2003-04
2004-05
Tota
l Em
ploy
ees

vTotal and IT Employee % Graphical Representation Annexure IX
Years IT emply %1990-91 0.4312773611991-92 0.4787176431992-93 0.536348951993-94 0.5527997311994-95 0.5785037981995-96 0.5814068861996-97 0.5988709191997-98 0.724193761998-99 0.800152411999-00 0.8740994512000-01 0.8882457152001-02 0.9839068432002-03 1.1868233662003-04 1.2562957882004-05 1.285339798
All BanksAll Banks
0
0.2
0.4
0.6
0.8
1
1.2
1.4
1990-91
1991-92
1992-93
1993-94
1994-95
1995-96
1996-97
1997-98
1998-99
1999-00
2000-01
2001-02
2002-03
2003-04
2004-05
% a
ge o
f IT
empl
oyee
s to
Tot
al E
mpl
oyee
s
Annexure X
Years Tot Emply1990-91 461421991-92 461651992-93 464251993-94 475761994-95 480551995-96 503951996-97 524321997-98 457061998-99 419921999-00 396982000-01 400792001-02 382152002-03 345462003-04 349442004-05 35477
All BanksAll Banks
0
10000
20000
30000
40000
50000
60000
1990-91
1991-92
1992-93
1993-94
1994-95
1995-96
1996-97
1997-98
1998-99
1999-00
2000-01
2001-02
2002-03
2003-04
2004-05
Tot
al E
mpl
oyee
s

viTotal and IT Employee % Graphical Representation Annexure XI
Years IT emply %1990-91 0.4870624051991-92 0.5103189491992-93 0.5092020081993-94 0.5259977961994-95 0.5643539911995-96 0.5962227741996-97 0.6294443881997-98 0.6602783331998-99 0.6915862631999-00 0.7698514092000-01 0.7833157062001-02 0.8157089762002-03 0.7907272152003-04 0.8182478752004-05 0.809100864
All ManufacturingAll Manufacturing
00.10.20.30.40.50.60.70.80.9
1990-91
1991-92
1992-93
1993-94
1994-95
1995-96
1996-97
1997-98
1998-99
1999-00
2000-01
2001-02
2002-03
2003-04
2004-05
% a
ge o
f IT
empl
oyee
s to
Tot
al E
mpl
oyee
s
Annexure XII
Years Tot Emply1990-91 262801991-92 266501992-93 274941993-94 281371994-95 283511995-96 290161996-97 293911997-98 295331998-99 296421999-00 297462000-01 302562001-02 304032002-03 314902003-04 316532004-05 32876
All ManufacturingAll Manufacturing
0
5000
10000
15000
20000
25000
30000
35000
1990-91
1991-92
1992-93
1993-94
1994-95
1995-96
1996-97
1997-98
1998-99
1999-00
2000-01
2001-02
2002-03
2003-04
2004-05
Tota
l Em
ploy
ees

vii Total and IT Employee % Graphical Representation Annexure XIII
Years IT emply %1990-91 0.4515202561991-92 0.4902835951992-93 0.5262517081993-94 0.5428394071994-95 0.5732534091995-96 0.5868204661996-97 0.6098529751997-98 0.6991055171998-99 0.7552279641999-00 0.8294453082000-01 0.8431079832001-02 0.9093823782002-03 0.8465079652003-04 1.0473089562004-05 1.056281363
All CompaniesAll Companies
0
0.2
0.4
0.6
0.8
1
1.2
1990-91
1991-92
1992-93
1993-94
1994-95
1995-96
1996-97
1997-98
1998-99
1999-00
2000-01
2001-02
2002-03
2003-04
2004-05
% a
ge o
f IT
empl
oyee
s to
Tot
al E
mpl
oyee
s
Annexure XIV
Years Tot Emply1990-91 724221991-92 728151992-93 739191993-94 757131994-95 764061995-96 794111996-97 818231997-98 752391998-99 716341999-00 694442000-01 703352001-02 686182002-03 660362003-04 666472004-05 68353
All CompaniesAll Companies
0100002000030000400005000060000700008000090000
1990-91
1991-92
1992-93
1993-94
1994-95
1995-96
1996-97
1997-98
1998-99
1999-00
2000-01
2001-02
2002-03
2003-04
2004-05
Tot
al E
mpl
oyee
s of
all
the
com
pani
es
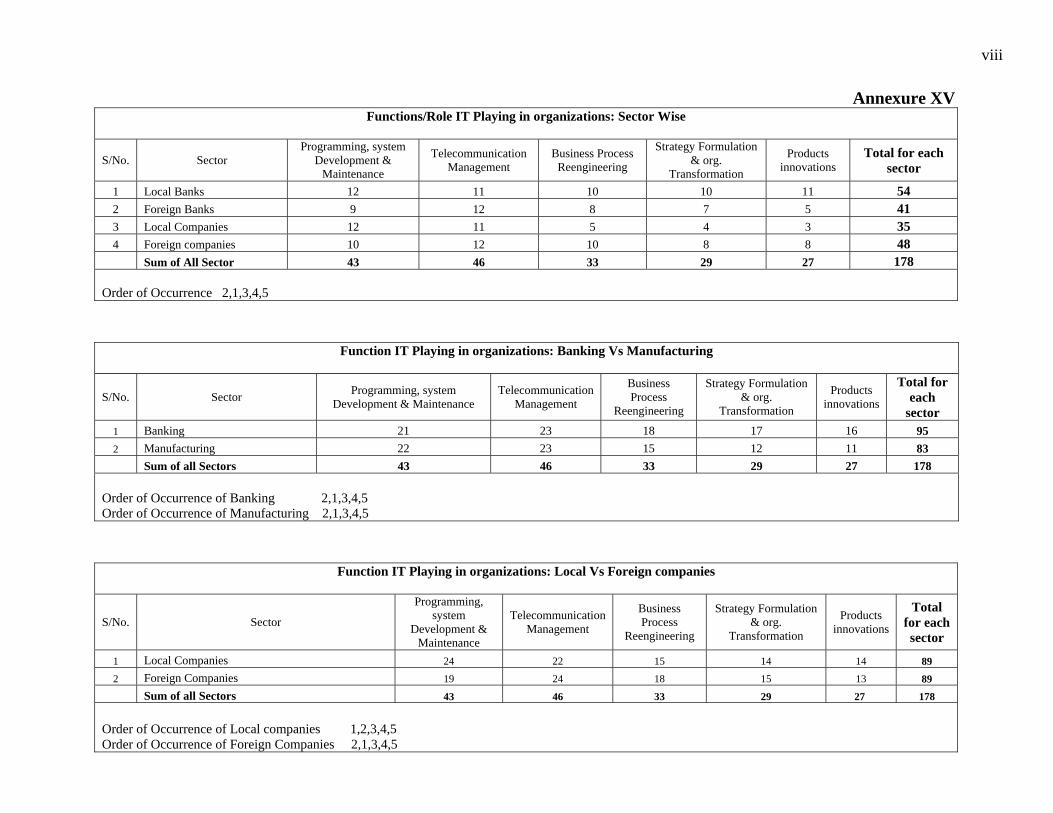
viii Annexure XV
Functions/Role IT Playing in organizations: Sector Wise
S/No. Sector Programming, system
Development & Maintenance
Telecommunication Management
Business Process Reengineering
Strategy Formulation & org.
Transformation
Products innovations
Total for each sector
1 Local Banks 12 11 10 10 11 54 2 Foreign Banks 9 12 8 7 5 41 3 Local Companies 12 11 5 4 3 35 4 Foreign companies 10 12 10 8 8 48 Sum of All Sector 43 46 33 29 27 178
Order of Occurrence 2,1,3,4,5
Function IT Playing in organizations: Banking Vs Manufacturing
S/No. Sector Programming, system Development & Maintenance
Telecommunication Management
Business Process
Reengineering
Strategy Formulation & org.
Transformation Products
innovations Total for
each sector
1 Banking 21 23 18 17 16 95 2 Manufacturing 22 23 15 12 11 83 Sum of all Sectors 43 46 33 29 27 178
Order of Occurrence of Banking 2,1,3,4,5 Order of Occurrence of Manufacturing 2,1,3,4,5
Function IT Playing in organizations: Local Vs Foreign companies
S/No. Sector
Programming, system
Development & Maintenance
Telecommunication Management
Business Process
Reengineering
Strategy Formulation & org.
Transformation Products
innovations Total
for each sector
1 Local Companies 24 22 15 14 14 89 2 Foreign Companies 19 24 18 15 13 89 Sum of all Sectors 43 46 33 29 27 178
Order of Occurrence of Local companies 1,2,3,4,5 Order of Occurrence of Foreign Companies 2,1,3,4,5

ix Annexure XVI
Application Software Use Analysis: All Sectors
S/No. Sector Vendor Supplied
Standard application; ERP Systems i.e SAP,
MSYS, ORACLES
In house Developed System
Consultants' Developed Systems Copied Software Total
1 Local Banks 0 4 11 11 1 27 2 Foreign Banks 0 0 10 2 0 12 3 Local Manufacturing 0 4 10 7 0 21 4 Foreign Manufacturing 0 9 4 4 0 17 Sum of all Sectors 0 17 35 24 1 77
Order of Occurrence 3,4,2,5,1
Application Software Usage Analysis: Banking Vs Manufacturing
S/No. Sector Vendor Supplied
Standard application; ERP System i.e SAP, MISYS, ORACLES
In house Developed System
Consultants' Developed Systems
Copied Software Total
1 Banking 0 4 21 13 1 39 2 Manufacturing 0 13 14 11 0 38 Sum of all Sectors 0 17 35 24 1 77
Order of Occurrence of Banking 3,4,2,5,1 Order of Occurrence of Manufacturing 3,2,4,1,5
Application Software Usage Analysis: Local Vs Foreign
S/No. Sector Vendor Supplied
Standard application; ERP system i.e SAP, MISYS, ORACLES
In house Developed System
Consultants' Developed Systems
Copied Software Total
1 Local Companies 0 8 21 18 1 48 2 Foreign companies 0 9 14 6 0 29 Sum of all Sectors 0 17 35 24 1 77
Order of Occurrence of Banking 3,4,2,5,1 Order of Occurrence of Manufacturing 3,2,4,1,5

x Annexure XVII
Information System Levels in organization: Sector Wise
S/No. Sector Executive Support Systems
Decision Support systems
Management information System
Transaction processing
system Total or each sector
1 Local Banks 4 6 11 12 33 2 Foreign Banks 8 7 11 12 38 3 Local Manufacturing 4 7 12 12 35 4 Foreign Manufacturing 8 9 12 12 41 Sum of all Sectors 24 29 46 48 147
Order of Occurrence 4,3,2,1
Information System Level : Banking Vs Manufacturing Companies
S/No. Sector Executive Support Systems
Decision Support systems
Management information System
Transaction processing system Total of each sector
1 Banking 12 13 22 24 71 2 Manufacturing 12 16 24 24 76 Sum of all Sectors 24 29 46 48 147
Order of Occurrence of Local companies 4,3,2,1 Order of Occurrence of Foreign Companies 3,4,2,1
Information System Level : Local Vs Foreign Companies
S/No. Sector Executive Support Systems
Decision Support systems
Management information System
Transaction processing system Total of each sector
1 Local companies 8 13 23 24 68 2 Foreign companies 16 16 23 24 79 Sum of all Sectors 24 29 46 48 147
Order of Occurrence of Local companies 4,3,2,1 Order of Occurrence of Foreign Companies 4,3,1,2

xi Annexure XVIII
IT Adoption Problems: Sector Wise
S/no. Sector Lack of Adequate
Trained Employees
Pakistan Inadequate
Telecommunication infrastructure
Lack of Proper IT Planning
Selection of Proper IT Systems
Judicious Use of
Computer
Management Unaware on IT
Systems
Employees Non
Cooperation
Management Shirks to
Investments
Total for each Sector
1 Local Banks 6 8 9 9 4 5 5 3 49 2 Foreign Banks 4 10 8 5 7 2 2 4 42 3 Local Manufacturing 6 9 5 4 2 0 5 0 31 4 Foreign Manufacturing 10 8 8 6 5 2 5 6 50 Sum of all Sectors 26 35 30 24 18 9 17 13 172
Order of Occurrence 2,3,1,4,5,7,6,8
IT Adoption Problems: Banking Vs Manufacturing
S/no. Sector
Lack of Adequate Trained
Employees
Pakistan Inadequate
Telecommunication infrastructure
Lack of Proper
IT Planning
Selection of
Proper IT
Systems
Judicious Use of
Computer
Management Unaware on IT Systems
Employees Non
Cooperation
Management Shirks to Investments
Total for each sector
1 Banking 10 18 17 14 11 7 7 7 91 2 Manufacturing 16 17 13 10 7 2 10 6 81 Sum of all sector 26 35 30 24 18 9 17 13 172
Order of Occurrence of Banking 2,3,4,5,1,6,7,8 Order of Occurrence of Manufacturing 2,1,3,4,7,5,8,6
IT Adoption Problems: Local Vs Foreign Companies
S/no. Sector Lack of Adequate
Trained Employees
Pakistan Inadequate Telecommunication
infrastructure
Lack of Proper IT Planning
Selection of Proper IT Systems
Judicious Use of
Computer
Management Unaware on IT
Systems
Employees Non
Cooperation
Management Shirks to Investments
Total for each sector
1 Local companies 12 17 14 13 6 5 10 3 92 2 Foreign Companies 14 18 16 11 12 4 7 10 80 Sum of all sector 26 35 30 24 18 9 17 13 172
Order of Occurrence of Banking 3,1,2,4,7,8,5,6 Order of Occurrence of Manufacturing 2,3,1,4,5,7,8,6
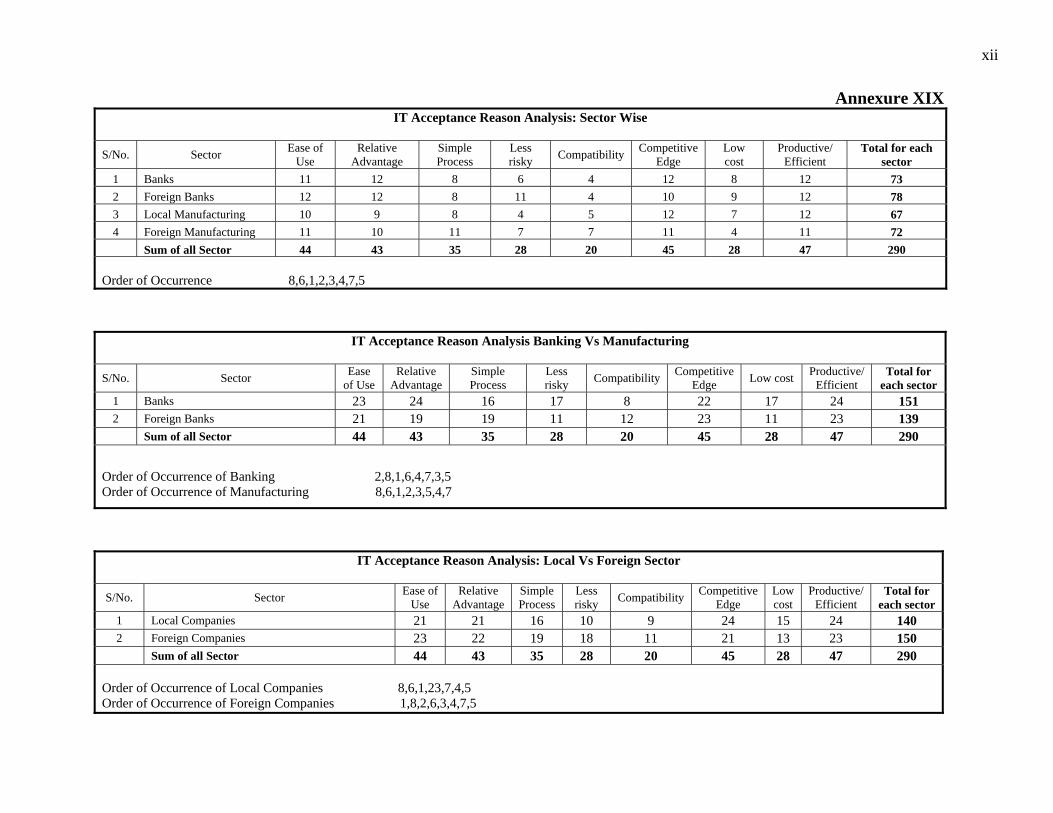
xii Annexure XIX
IT Acceptance Reason Analysis: Sector Wise
S/No. Sector Ease of Use
Relative Advantage
Simple Process
Less risky Compatibility Competitive
Edge Low cost
Productive/ Efficient
Total for each sector
1 Banks 11 12 8 6 4 12 8 12 73 2 Foreign Banks 12 12 8 11 4 10 9 12 78 3 Local Manufacturing 10 9 8 4 5 12 7 12 67 4 Foreign Manufacturing 11 10 11 7 7 11 4 11 72 Sum of all Sector 44 43 35 28 20 45 28 47 290
Order of Occurrence 8,6,1,2,3,4,7,5
IT Acceptance Reason Analysis Banking Vs Manufacturing
S/No. Sector Ease of Use
Relative Advantage
Simple Process
Less risky Compatibility Competitive
Edge Low cost Productive/ Efficient
Total for each sector
1 Banks 23 24 16 17 8 22 17 24 151 2 Foreign Banks 21 19 19 11 12 23 11 23 139 Sum of all Sector 44 43 35 28 20 45 28 47 290
Order of Occurrence of Banking 2,8,1,6,4,7,3,5 Order of Occurrence of Manufacturing 8,6,1,2,3,5,4,7
IT Acceptance Reason Analysis: Local Vs Foreign Sector
S/No. Sector Ease of Use
Relative Advantage
Simple Process
Less risky Compatibility Competitive
EdgeLow cost
Productive/ Efficient
Total for each sector
1 Local Companies 21 21 16 10 9 24 15 24 140 2 Foreign Companies 23 22 19 18 11 21 13 23 150 Sum of all Sector 44 43 35 28 20 45 28 47 290
Order of Occurrence of Local Companies 8,6,1,23,7,4,5 Order of Occurrence of Foreign Companies 1,8,2,6,3,4,7,5

xiii Annexure XX
Reasons Organizations think for their IT success: Sector Wise
S/No. Sector Top Management Commitment
Organizations Proper IT Planning
Proper Organizations Investments Government Role Total of each sector
1 Local Banks 12 8 6 4 30 2 Foreign Banks 12 10 11 1 34 3 Local Manufacturing 12 10 8 4 34 4 Foreign Manufacturing 11 10 11 5 37 Sum of all Sectors 47 38 36 14 135
Order of Occurrence 1,2,3,4
Reasons Organizations think for their IT success: Banking Vs Manufacturing
S/No. Sector Top Management Commitment
Organizations Proper IT Planning
Proper Organizations Investments
Government Role Total of each sector
1 Banking 24 18 17 5 64 2 Manufacturing 23 20 19 9 71 Sum of all Sectors 47 38 36 14 135
Order of Occurrence of Local companies 1,2,3,4 Order of Occurrence of Foreign Companies 1,2,3,4
Reasons Organizations think for their IT success: Local Vs Foreign Companies
S/No. Sector Top Management Commitment
Organizations Proper IT Planning
Proper Organizations Investments
Government Role Total of each sector
1 Local companies 24 18 14 8 64 2 Foreign companies 23 20 22 6 71 Sum of all Sectors 47 38 36 14 135
Order of Occurrence of Local companies 1,2,3,4 Order of Occurrence of Foreign Companies 1,2,3,4

xiv
Annexure XXI Measures To Overcome IT Adoption Problems: Sector Wise
S/No. Sector Education & Training Employees Motivation Employees Rewards Job Threat Total of each sector
1 Local Banks 12 12 7 3 34 2 Foreign Banks 12 12 6 0 30 3 Local Manufacturing 12 12 8 1 33 4 Foreign Manufacturing 12 12 4 2 30 Sum of all Sectors 48 48 25 6 127
Order of Occurrence 1,2,3,4
Measures To Overcome IT Adoption Problems: Banking Vs Manufacturing
S/No. Sector Education & Training Employees Motivation Employees Rewards Job Threat Total of each sector
1 Banking 24 24 13 3 64 2 Manufacturing 24 24 12 3 63 Sum of all Sectors 48 48 25 6 127
Order of Occurrence of Local companies 1,2,3,4 Order of Occurrence of Foreign Companies 1,2,3,4
Measures To Overcome IT Adoption Problems: Local Vs Foreign
S/No. Sector Education & Training Employees Motivation Employees Rewards Job Threat Total of each sector
1 Local companies 24 24 15 4 67 2 Foreign companies 24 24 10 2 60 Sum of all Sectors 48 48 25 6 127
Order of Occurrence of Local companies 1,2,3,4 Order of Occurrence of Foreign Companies 1,2,3,4

xv Pakistani Top Banks & Manufacturing Companies IT Usages Summary/Statistic Annexure XXII
Local Banks
Sr.no Company Name Year of
starting Busines in Pak.
Year of starting IT
Systems computerized Ways of systems developed
Name of Standard application
Year of Installing standard Application
Level of integration of systems
Hardware being used Programming Software being used
Main areas of IT Investments
Mode of Inter office/city connectivity
1 Allied Bank Ltd. 1942 1978 All Core banking areas All Traditional systems
Got from vendors In House development
Unibank Swift
1998 All Core banking systems online, Traditional systems integrated at Head office level
IBM, DEL servers, Pc networking, Acer, wyse terminals, Epson, HP, Printronix printers
Cobol, Oracle, FoxPro, Windows xp and Linux Operating systems
Customer focus areas, Traditional organizational systems
ISDN, DSL, Radio Link, VSAT
2 Askari Commercial Bank
1992 1992 All Core banking areas All Traditional systems
Got from vendors In House development
Unibank Swift
1992 All Core banking systems online, Traditional systems integrated at Head office level
NCR servers, Del, Acer servers, Epson, HP, Printronix printers
Cobol, Oracle, FoxPro, Windows xp and Unixe, Linux Operating systems, Visual Basic
Customer focus areas, Traditional organizational systems
ISDN, DSL, Radio Link, VSAT
3 Bank Of Punjab 1989 1989 All Core banking areas All Traditional systems
In House development, BOP 2001 software
Bop2001 in house software package
No standard application
All current a/c online and each branch send data on daily basis
Acer servers, Acer, Raffels terminals, Epson, HP printers
Cobol, Oracle, Dotnet, Cshop, Unix, Windos Xp operating systems
Customer focus areas, Traditional organizational systems
Dial up, DSL
4 Bank Al-Habib Ltd. 1992 1992 All Core banking areas All Traditional systems
In House development, Got from Consultants
No standard application
No standard application
All Core banking systems online, Traditional systems integrated at branch level
IBM, HP servers, IBM, Acer Monitors, Epson, HP, IBM printers
Jawa, Windows XP operating systems
Customer focus areas, Traditional organizational systems
ISDN, DSL, Radio Link, VSAT
5 Bank Alflah Ltd. 1997 1997 All Core banking areas All Traditional systems
Got developed from out side consultants
No standard application but plan to get
No standard application
All Core banking systems online, Traditional systems integrated at Head office
HP servers and monitors, HP, Epson, Printronix printers
V.B 6, SQL server, Windows xp, windos 2003
Customer focus areas, Traditional organizational systems
ISDN, DSL, Radio Link, VSAT
6 Faisal Bank Ltd 1987 1992 All Core banking areas All Traditional systems
In House development IBS in hose system but planning to purchase Sibol
IBM in house developed system
All Core banking systems online, Traditional systems integrated at Head office
Sun Slorince servers, Acer, DEL terminals, HP, IBM printers
COBOL, Windows xp
Customer focus areas, Traditional organizational systems
ISDN, DSL, Radio Link
7 First Women Bank Ltd.
1989 1989 Current & saving A/C, G.L Payroll
In House, Got from Consultant
No standard application
No standard application
All off line systems, no integration between systems & branches
IBM servers, LAN, IBM monitors, Epson, HP printers
COBOL, FoxPro, Unix, Windows Xp
Traditional organizational systems
Dial up just for Internet usages
8 Habib Bank Ltd. 1943 1966 All Core banking areas All Traditional systems
In House, Got from Consultants, Standard Application
MOBS, SWIFT, MISYS
1995, 2003 All Core banking systems online, Traditional systems integrated at regional level
IBM,NCR mini,servers NCR, DEL, Acer,INBOX monitors, Epson, HP, Printronix Printers
Cobol, Oracle, VisualBasic, C++, Unix, Linux, Windos XP
Customer focus areas, Traditional organizational system
ISDN,DSL, Radio Link, VSAT
9 Metro Politan Bank 1992 1992 All Core banking areas All Traditional systems
In House Consultant No Standard Application
No Standard Application
All Core banking systems online, Traditional systems integrated at regional level
Sun, Sabree, IBM , Epson
Java, C++, SQL Customer focus areas, Traditional organizational system
ISDN,DSL, Radio Link, VSAT
10 Muslim Commercial Bank Ltd
1948 1970 All Core banking areas All Traditional systems
In House, Got from Consultants, Standard Application
Sibol 2001 All Core banking systems online, Traditional systems integrated at Head office
IBM As/400, HP Servers, IBM, NCR, Philips Monitors, EPSON, HP, IBM printers
Cobol, Java, FoxPro, Os/400, Windows Xp
Customer focus areas, Traditional organizational system
ISDN,DSL, Radio Link, VSAT
11 National Bank Of Pakistan
1949 1980 All Core banking areas All Traditional systems
In House, Got from Consultants, Standard Application
Planning for FIDILITY system
No Standard Application
All Core banking systems online, Traditional systems integrated at Head Office
IBM Mini, Servers, LAN, DEL monitors, EPSON, HP printers
Java, C++, FoxPro, OS/400 Windows Xp
Customer focus areas, Traditional organizational system
DSL, ISDN
12 United Bank Ltd. 1959 1967 All Core banking areas All Traditional systems
In House, Got from Consultants, Standard Application
Unibank, Swift, CTL
1995 All Core banking systems online, Traditional systems integrated at Head Office
IBM, NCR, DEL mini, servers, IBM, NCR DEL monitors, EPSON, HP printers
Oracel, Cobol, Developer 2000, Net
Customer focus areas, Traditional organizational system
ISDN,DSL, Radio Link, VSAT

xvi
Pakistani Top Banks & Manufacturing Companies IT Usages Summary/Statistic
Foreign Banks
Sr. No Company Name
Year of starting Busines in Pak.
Year of starting IT
Systems computerized
Ways of systems developed
Name of Standard application
Year of Installing standard Application
Level of integration of systems
Hardware being used Programming Software being used
Main areas of IT Investments
Mode of Inter office connectivity
01 American Express Bank Ltd.
1980 1990 All Core banking areas All Traditional systems
In House, Amex world application
SBS(Standard Business application), In House developed
1997,2003 All Core banking and traditional systems Computerized but off line
IBM, servers, IBM, NCR IBM monitors EPSON, HP, printers, Lan
COBOL Visula Basic, Novel NET 4, Cliper windows Operating systems.
Customer focus areas, Traditional organizational system
Dial up for Internet usage
02 ABN Amro Bank Ltd.
1948 1990 All Core banking areas All Traditional systems
In House, ABN Standard Application
In House developed 1995 All Core banking and traditional systems Computerized but off line
DEL, HP servers, DEL , IBM monitors EPSON, HP, printers,
Developer 2000, Windows Xp, VB.Net, Windows, Solaris Operating systems
Customer focus areas, Traditional organizational system
ISDN,DSL, Radio Link, VSAT
03 Bank Of Tokyo
1980 1988 All Core banking areas All Traditional systems
In House Development
In House developed 1988 All Core banking and traditional systems Computerized but off line
IBM P4 Servers, IBM Monitors, HP, Epson Printers
Cobol, FoxPro, VB, Windows xp
Customer focus areas, Traditional organizational system
Dial Up for Internet use only
04 Citi Bank N.A
1980 1988 All Core banking areas All Traditional systems
In House Development
In House Development, Citibank World wide one package
1988 All Core banking systems online, Traditional systems integrated at Branch Level
IBM Mini, Servers, HP Toshiba monitors, HP Printers
SQL, VB, Cobol etc. Customer focus areas, Traditional organizational system
ISDN,DSL, Radio Link, VSAT
05 Deutsche Bank Ltd.
1962 1990 All Core banking areas All Traditional systems
IDMS(Integrated Data Mgt. Systems) IN House developed
In House developed 1995 All Core banking systems online, Traditional systems integrated at Branch Level
IBM, HP Servers, DEL Monitors, HP, Printronix Printers
COBOL, C++, Windows Xp
Customer focus areas, Traditional organizational system
ISDN,DSL,Dxx, VSAT
07 Habib Bank AG Zurich
1979 1990 All Core banking areas All Traditional systems
HPLUS( Bank own software package world wide)
In House developed 1990 All Core banking systems online, Traditional systems integrated at Branch Level
Sun Slorince, NCR, Aceer Monitors, HP,OKEY Printers
Jawa, Cobol, Linux, Windows XP Operating systems
Customer focus areas, Traditional organizational system
ISDN,DSL,Dxx, VSAT
08 Hong Kong Shanghai Bank Ltd
1982 1985 All Core banking areas All Traditional systems
In House, Global in house systems
In House Global development
1985 All Core banking systems online, Traditional systems integrated at Branch Level
IBM As 400 Servers, Del Terminals, IBM & HP Printers
RPG, COBOL, VB, MS ACCESS, Windows XP, 2000
Customer focus areas, Traditional organizational system
ISDN,DSL,Dxx, VSAT
09 Oman International Bank
1996 1996 All Core banking areas All Traditional systems
In House Development Standard PIBAS application
In House Development
1996 All Core banking systems o Traditional systems. No Integration
Gateways, Del P4 servers, DEL Monitors, Epson, HP printer
Cobol, Windows xp, Windos 98
Customer focus areas, Traditional organizational system
Dial Up for internet
10 Rupali Bank Ltd.
1976 1988 All Core banking areas All Traditional systems
Got from Market, MZ International
BANK GENERAL 1995 All Core banking systems Traditional systems. No Integration
Unbranded P4 server, LAN, Unbranded Terminal, Epson, HP Printers
Cobol, Excell, Windows 96, Unix
Traditional Systems Dial Up for internet
11 Standard Chartered Bank
1947 1985 All Core banking areas All Traditional systems
In house Development, EBBS global application
EBBS global application
1995 All Core banking systems o Traditional systems. Integrated country level
IBM, DEL NCR servers & Terminals, Epson, HP printers
Java, Linux Customer focus areas, Traditional organizational system
ISDN, DSL, DXX, VSAT, Radio Link
12 Mashraq Bank Ltd.
1996 1996 All Core banking areas All Traditional systems
In House Development
In House Development
1996 All Core banking systems Traditional systems. No Integration
Del server, DEL Monitors, Epson, HP printer
Cobol, Windows xp, Windos 98
Customer focus areas, Traditional organizational system
Dial up for internet only

xvii
Pakistani Top Banks & Manufacturing Companies IT Usages Summary/Statistic
Foreign Manufacturing Companies
Sr. No
Company Name
Year of starting Busines in Pak.
Year of starting IT
Systems computerized Ways of systems developed
Name of Standard application
Year of Installing standard Application
Level of integration of systems
Hardware being used Programming Software being used
Main areas of IT Investments
Mode of Inter office connectivity
1 Bata Pakistan Ltd.
1960 1985 Retail, POS Payroll, Accounts, Costing, etc
In House development, Got from consultants, from parent company
Core systems from Head office, Payroll from systems Ltd.
Installed As/400 in 1985
Have POS systems in 150 shops but not online.
IBM As/400 & netfinity servers, IBM terminals, HP & IBM printers
Cobol, Visual Foxpro, Os/400 & unix operating systems
Traditional organizational system
Dial up, DSL for internet etc.
2 Colgate Pakistan Ltd.
1985 1990 Payroll, Inventory, GL, Sales etc.
In House developed In House developed IBM Mini & Servers, No standard Application
Interlinked with Zonal offices
IBM mini computer, DEL terminals, Epson & HP printers
VB, SQL, JAVA Traditional organizational systems
Dial up, DSL for internet etc.
3 I.C.I Pakistan Ltd.
1960 1985 All business applications In House development S.A.P
SAP(ERP) Germany 2000 Interlinked with business units
HP, DEL servers & terminals, HP, XEROX printers
VB, Cobol, Linux, Windows 200 operating systems
All organizational systems
Dial up, DSL etc.
4 L.G Pakistan(New Allied Electronic)
1989 1990 All business applications are computerized
In House development, Got few programs from consultants
No standard application No standard application
Sales system Interlinked with all branches in country
HP servers, del monitors, Epson & HP printers
Oracle developers, foxpro, Windows XP
All organizationa systems
Dial up, DSL, Wirless
5 Pakistan Tobacco Co.
1948 1985 All business applications In House development, Got from vendors
S.A.P (ERP systems) 2000 All systems interlinked world wide
HP Servers, Terminals, HP, Epson printers
Oracles, Windows 2000 xp
All organizational systems
Dial up, DSL, VSAT
6 Simens Pakistn Ltd.
1965 1980 All business applications In House development S.A.P (ERP systems) 2000 All systems interlinked world wide
HP servers & terminals, HP printers
Oracles, Windows xp All organizatiopn systems
DSL, VSAT
7 Suzuki Pakistan Ltd
1985 1982 All business applications In House development, Got from Market
No Standard systems 1999 All systems interlinked within company
IBM AS/400, HP servers, IBM, DEL terminals, Epson, HP printers
RPG 400/ Oracles, OS/400, Windows Xp
All organizational systems
Dial Up for internet etc,
8 Reckitt Benkiser Pakistan Ltd.
1970 1982 All business applications are computerized
In House development, Got from Market
JD Edwar/Oracle 2001 All systems are interlinked
DEL servers & Terminals, HP Printers
Cobol, Oracles All Organizational Systems
Dial up, DSL
9 Uni lever Pakistan ltd.
1965 1970 All business applications are computerized
In House development, Got from Market
MFG/Pro 2000 All systems are interlinked
IBM Risk HP servers IBM, Del, & HP terminals, Epson, HP Printers
ASP VB, Oracles, Windows XP, W2k3
All organizational systems
Dial up, DSL, VSAT
10 Proctor & Gamels Pakistan Ltd.
1970 1980 All business applications are computerized
In House Development, from Consultant
S.A.P world wide, Platinium in Pakistan
1999 All systems are interlinked
HP, IBM servers and terminals, Epson, HP printers
VB, Oacles, Windows XP
All organizational systems
Dial up, DSL, VSAT
11 Nestle Pakistan Ltd.
1988 1988 All business applications are computerized
In House Development, from Consultant
S.A.P 2005 All systems are interlinked
DEL, HP servers & terminals
VB, Oracles All organizational systems
Dial up, DSL, VSAT
12 Philips Electrical Co. Pakistan ltd
1949 1970 All business applications are computerized
In House Development, from Consultant
P-GIS, ERP stnadarad systems, J>D Edward/Oracle
1998 All systems are interlinked
IBM As/400 servers, IBM, HP terminals, Epson, HP printers
RPG 400, VB, OS/400, Widows xp
All organizational systems
Dial up, DSL, VSAT

xviii
Pakistani Top Banks & Manufacturing Companies IT Usages Summary/Statistic
Local Manufacturing Companies
Sr. No Company Name Year of starting Busines in Pak.
Year of starting IT
Systems computerized Ways of systems developed
Name of Standard application
Year of Installing standard Application
Level of integration of systems
Hardware being used Programming Software being used
Main areas of IT Investments
Mode of Inter office connectivity
1 D.G.Khan Cement Ltd. 1984 1990 All business applications are computerized
In House Development, from Consultant
No standard application
N.A All systems are interlinked
DEL Servers & Terminals, HP printers, LAN, WAN
Oracles, Visual FoxPro, Windows XP
All Organizational systems
Dial Up, DSL, VSAT, DXX,SAT
2 General Tyres Ltd 1964 1984 All business applications are computerized
In House Development, from Consultant
No standard application
N.A All systems are interlinked
IBM As/400, IBM, ACER, HP servers, HP, Epson printers
RPG/400, VB, Oracles
All Organizational systems
Dial Up, DSL
3 Lakson Tobaco Ltd. 1970 1982 All business applications are computerized
In House Development, from Consultant
S.A.P 2005 All systems are interlinked
Sun slornace, servers, Inbox Terminal, Epson Hp printers
Unix, Windos XP All Organizational systems
Dial up, DSL, Radio
4 Packages Ltd. 1965 1966 All business applications are computerized
In House Development, from Consultant
S.A.P 2000 All systems are interlinked
HP, Sun servers, HP, Del terminals, Epson, HP printers
A.s.P, Windows xp, N.T, Linus
All Organizational systems
FR line, VSAT
5 Service Industries Ltd. 1970 1980 Most systems are computerized
In house Development, from consultants
No standard application
N.A All systems are stand alone but integrating
IBM, HP servers, non branded terminals, Epson, HP printers
Oracal, developer, Windows 2000
Traditional organizational and sales systems
DSL, Dial up
6 Indus Motors Ltd 1990 1990 All business applications are computerized
In House development, Got from consultants
S.A.P 2000 All core systems re integrated
IBM, HP servers, WAN, HP, Philips Terminals, Epson, HP printers
Windows N.T, VB, Jawa
All organizational systems
DSL, Dial up
7 Honda Cars Ltd. 1994 1994 A/c, Payroll, sales, inventory etc
In House development, Got from consultants
No standard application
N.A All systems are interlinked
IBM As/400, Hp, IBM, DEL, HP terminals, Epson, HP, Printronix printers
Os/400, Windows NT, RPG LE
All organizational systems
Dial Up, DSL
8 Pakistan Electric Company 1985 1992 All business applications are computerized In House
development, Got from consultants
No standard application
N.A All systems are interlinked
IBM As/400, Hp, IBM, DEL, HP terminals, Epson, HP, Printronix printers
RPG/400, VB, Oracles
All organizational systems
Dial Up, DSL
9 Dawlence 1985 1991 All business applications are computerized In House
development, Got from consultants
No standard application
N.A All systems are interlinked IBM As/400, Hp, IBM, DEL,
HP terminals, Epson, HP, Printronix printers
A.s.P, Windows xp, N.T, Linus
All organizational systems
Dial Up, DSL
10 PECO 1976 1990 All business applications are computerized In House
development, Got from consultants
No standard application
N.A All systems are interlinked IBM As/400, Hp, IBM, DEL,
HP terminals, Epson, HP, Printronix printers
Os/400, Cobol, Windows NT, RPG LE
All organizational systems
Dial Up,
11 Atlas Honda LTd 1992 1992 All business applications are computerized In House
development, Got from consultants
S.A.P 2003 All systems are interlinked IBM As/400, Hp, IBM, DEL,
HP terminals, Epson, HP, Printronix printers
Os/400, Cobol, Windows NT, RPG LE
All organizational systems
Dial Up, DSL
12 Pakistan Steel 1974 1985 All business applications are computerized In House
development, Got from consultants
No standard application
N.A All systems are interlinked IBM As/400, Hp, IBM, DEL,
HP terminals, Epson, HP, Printronix printers
Os/400, Cobol, Windows NT, RPG LE
All organizational systems
Dial Up, DSL

xixBanking Sector IT Expenses/Income/Total Employee/IT Employee Annexure XXIII Foreign Banks
ABN Amro (Rs. 000)
S/No. Years Net income itexp Totemp itemp 1 1990 18,991,000 41,623,000 50 3 2 1991 49,775,000 45,241,000 55 4 3 1992 86,081,000 47,985,000 64 4 4 1993 133,509,000 55,421,000 80 5 5 1994 152,411,000 57,524,000 115 6 6 1995 10,992,000 62,451,000 131 6 7 1996 147,524,000 68,541,000 160 7 8 1997 334,910,000 76,584,000 197 7 9 1998 225,128,000 81,452,000 226 8
10 1999 294,369,000 87,542,000 275 10 11 2000 436,400,000 94,652,000 282 12 12 2001 732,458,000 152,840,000 281 16 13 2002 1,025,540,000 157,991,000 272 17 14 2003 806,197,000 155,846,000 270 17 15 2004 714,020,000 137,727,000 322 20
Bank of Tokyo (Rs. 000)
S/No. Years Net income Itexp totemp itemp
1 1990 20,234,000 138,900 26 1 2 1991 23,456,000 190,200 28 1 3 1992 18,907,000 214,140 29 2 4 1993 29,700,000 231,400 29 2 5 1994 31,789,000 250,800 30 2 6 1995 29,450,000 245,900 33 2 7 1996 25,357,000 240,000 34 2 8 1997 24,442,000 1,348,000 39 2 9 1998 136,607,000 1,766,000 54 2 10 1999 165,666,000 5,582,000 60 4 11 2000 79,357,000 352,000 66 4 12 2001 155,516,000 1,087,000 55 4 13 2002 27,720,000 1,106,000 43 3 14 2003 20,322,000 688,000 35 3
15 2004 33,645,000 4,842,000 38 3
Deutsche(Rs. 000)
S/No. Years Net income itexp totemp itemp
1 1990 24,709,000 369,000 60 2 2 1991 2,757,000 675,000 60 2 3 1992 27,153,000 967,420 62 3 4 1993 2,747,000 963,200 62 2 5 1994 92,612,000 1,023,000 65 3 6 1995 1,568,000 1,265,300 65 3 7 1996 72,831,000 1,263,500 68 3 8 1997 79,738,000 1,375,000 70 3 9 1998 -40,693,000 5,623,000 70 3 10 1999 46,437,000 6,652,000 70 4 11 2000 -16,734,000 9,306,000 71 3 12 2001 -19,095,000 9,770,000 72 3 13 2002 119,783,000 15,609,000 73 3 14 2003 -33,901,000 8,945,000 73 3
15 2004 400,000 11,419,000 75 3
HSBC(Rs. 000)
S/No. Years Net income Itexp totemp itemp
1 1990 -61,607,000 320,000 120 2 2 1991 36,469,000 670,000 130 3 3 1992 35,894,000 790,500 134 3 4 1993 14,461,000 940,600 135 4 5 1994 14,163,000 1,102,500 136 3 6 1995 -162,512,000 1,371,000 136 3 7 1996 14,453,000 1,790,000 149 3 8 1997 37,182,000 2,174,000 184 3 9 1998 -10,959,000 2,188,900 191 3 10 1999 602,000 11,482,000 202 4 11 2000 -132,598,000 1,634,000 124 4 12 2001 70,041,000 4,799,000 129 4 13 2002 88,759,000 4,092,000 128 5 14 2003 231,056,000 5,861,000 125 5
15 2004 58,415,000 5,380,000 133 6
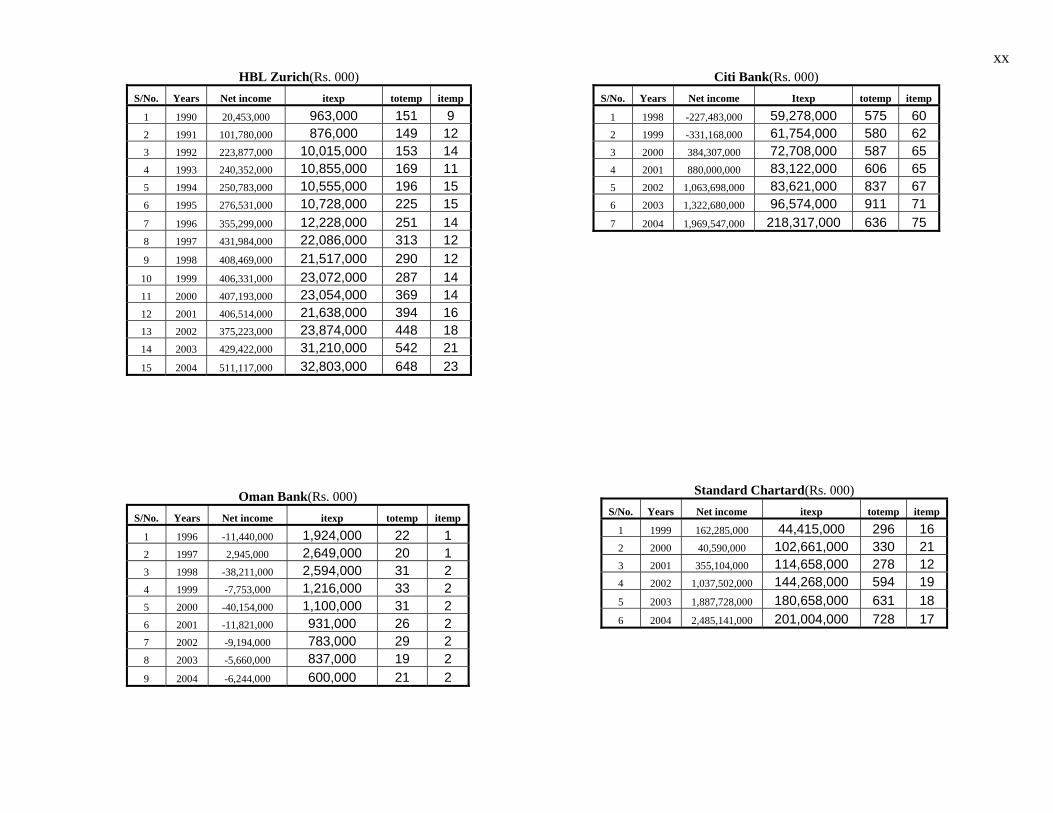
xxHBL Zurich(Rs. 000)
S/No. Years Net income itexp totemp itemp
1 1990 20,453,000 963,000 151 9 2 1991 101,780,000 876,000 149 12 3 1992 223,877,000 10,015,000 153 14 4 1993 240,352,000 10,855,000 169 11 5 1994 250,783,000 10,555,000 196 15 6 1995 276,531,000 10,728,000 225 15 7 1996 355,299,000 12,228,000 251 14 8 1997 431,984,000 22,086,000 313 12 9 1998 408,469,000 21,517,000 290 12 10 1999 406,331,000 23,072,000 287 14 11 2000 407,193,000 23,054,000 369 14 12 2001 406,514,000 21,638,000 394 16 13 2002 375,223,000 23,874,000 448 18 14 2003 429,422,000 31,210,000 542 21 15 2004 511,117,000 32,803,000 648 23
Citi Bank(Rs. 000)
S/No. Years Net income Itexp totemp itemp
1 1998 -227,483,000 59,278,000 575 60 2 1999 -331,168,000 61,754,000 580 62 3 2000 384,307,000 72,708,000 587 65 4 2001 880,000,000 83,122,000 606 65 5 2002 1,063,698,000 83,621,000 837 67 6 2003 1,322,680,000 96,574,000 911 71 7 2004 1,969,547,000 218,317,000 636 75
Oman Bank(Rs. 000)
S/No. Years Net income itexp totemp itemp
1 1996 -11,440,000 1,924,000 22 1 2 1997 2,945,000 2,649,000 20 1 3 1998 -38,211,000 2,594,000 31 2 4 1999 -7,753,000 1,216,000 33 2 5 2000 -40,154,000 1,100,000 31 2 6 2001 -11,821,000 931,000 26 2 7 2002 -9,194,000 783,000 29 2 8 2003 -5,660,000 837,000 19 2 9 2004 -6,244,000 600,000 21 2
Standard Chartard(Rs. 000)
S/No. Years Net income itexp totemp itemp
1 1999 162,285,000 44,415,000 296 16 2 2000 40,590,000 102,661,000 330 21 3 2001 355,104,000 114,658,000 278 12 4 2002 1,037,502,000 144,268,000 594 19 5 2003 1,887,728,000 180,658,000 631 18 6 2004 2,485,141,000 201,004,000 728 17

xxi
Local Banks Allied Bank Limited(Rs. 000)
S/No. Years Net income itexp totemp itemp
1 1990 20,174,000 1,833,000 11,240 25
2 1991 33,044,000 5,244,000 10,900 31
3 1992 142,310,000 4,940,000 10,690 37
4 1993 79,587,000 20,420,000 10,690 45
5 1994 88,066,000 19,052,000 10,700 46
6 1995 145,528,000 7,924,000 10,500 49
7 1996 69,869,000 28,227,000 9,600 52
8 1997 13,664,000 19,490,000 9,500 56
9 1998 19,592,000 26,713,000 8,900 59
10 1999 10,544,000 124,751,000 7,010 62
11 2000 -4,841,806,000 42,351,000 7,089 63
12 2001 -1,122,065,000 99,592,000 6,960 72
13 2002 -1,069,257,000 65,898,000 6,965 75
14 2003 385,580,000 119,170,000 6,970 79
15 2004 191,773,000 203,356,600 6,976 81
Bank of Punjab(Rs. 000)
S/No. Years Net income Itexp totemp itemp
1 1990 55,930,000 110,000 483 4
2 1991 145,030,000 111,000 957 5
3 1992 313,650,000 119,800 1,390 5
4 1993 354,450,000 224,500 1,705 5
5 1994 229,270,000 212,300 2,501 6
6 1995 174,070,000 120,000 2,924 7
7 1996 151,450,000 1,860,000 3,358 21
8 1997 162,910,000 3,120,000 3,366 31
9 1998 123,120,000 3,130,000 3,304 30
10 1999 28,240,000 3,260,000 3,229 26
11 2000 157,420,000 3,500,000 3,110 26
12 2001 236,250,000 39,070,000 3,063 26
13 2002 283,970,000 93,420,000 3,000 34
14 2003 689,180,000 62,350,000 3,019 33
15 2004 368,170,000 45,820,000 3,144 36
Bank Al Habib(Rs. 000)
S/No. Years Net income itexp totemp itemp
1 1991 7,687,000 670,000 67 7
2 1992 24,714,000 754,000 210 9
3 1993 96,413,000 988,400 470 9
4 1994 106,935,000 1,245,000 501 10
5 1995 127,446,000 1,480,300 525 10
6 1996 152,960,000 1,490,200 565 12
7 1997 198,644,000 1,523,000 575 13
8 1998 203,122,000 1,612,000 580 15
9 1999 152,728,000 1,893,000 583 15
10 2000 153,178,000 25,236,000 584 15
11 2001 246,006,000 9,939,000 742 20
12 2002 289,726,000 133,479,000 1,007 35
13 2003 1,012,309,000 176,394,000 1,253 35
14 2004 541,011,000 222,303,000 1,462 40
First Women Bank(Rs. 000)
S/No. Years Net income itexp totemp itemp
1 1990 263,000 745,000 104 3
2 1991 3,035,000 865,000 198 6
3 1992 8,585,000 2,060,000 295 6
4 1993 15,700,000 2,627,000 244 7
5 1994 12,827,000 2,292,000 309 7
6 1995 19,875,000 2,444,000 310 8
7 1996 -129,834,000 3,050,000 353 8
8 1997 826,000 2,595,000 331 8
9 1998 20,673,000 3,635,000 314 8
10 1999 -64,833,000 4,001,000 467 8
11 2000 41,493,000 4,821,000 484 8
12 2001 101,156,000 4,450,000 484 7
13 2002 45,407,000 5,203,000 496 9
14 2003 160,579,000 21,987,000 524 10
15 2004 124,324,000 17,262,000 507 11

xxii
Muslim Commercial Bank(Rs. 000)
S/No. Years Net income Itexp totemp itemp
1 1990 38,483,000 6,580,000 12,904 60
2 1991 66,725,000 7,890,000 13,031 62
3 1992 113,997,000 9,400,000 12,792 65
4 1993 146,228,000 10,540,000 13,768 67
5 1994 252,622,000 12,560,000 13,892 68
6 1995 370,715,000 12,986,000 14,522 70
7 1996 103,288,000 13,698,700 14,729 72
8 1997 238,782,000 17,600,000 13,610 72
9 1998 399,180,000 48,963,000 12,858 72
10 1999 568,950,000 98,008,900 12,557 74
11 2000 734,729,000 125,521,000 13,133 79
12 2001 1,108,176,000 146,841,000 11,614 85
13 2002 1,738,594,000 138,072,000 10,926 101
14 2003 2,230,145,000 189,985,000 10,164 121
15 2004 2,539,994,000 183,454,000 9,889 122
Metro Bank(Rs. 000)
S/No. Years Net income itexp totemp itemp
1 1992 4,947,000 217,000 64 2
2 1993 64,040,000 699,000 104 4
3 1994 80,466,000 2,592,000 193 8
4 1995 93,829,000 7,005,000 271 9
5 1996 152,145,000 6,829,000 312 10
6 1997 178,952,000 7,327,000 398 11
7 1998 201,002,000 8,578,000 428 11
8 1999 196,710,000 9,542,000 450 12
9 2000 225,658,000 10,276,000 494 12
10 2001 334,695,000 11,468,000 561 12
11 2002 429,669,000 18,756,000 763 13
12 2003 678,479,000 25,861,000 901 19
13 2004 815,539,000 31,970,000 1,045 24
National Bank of Pakistan(Rs. 000)
S/No. Years Net income itexp totemp itemp
1 1990 221,124,000 105,000 21,004 .
2 1991 735,999,000 947,000 20,657 .
3 1992 812,746,000 1,078,000 20,816 .
4 1993 2,407,912,000 1,764,000 20,694 .
5 1994 607,811,000 9,171,000 20,111 .
6 1995 681,523,000 52,963,000 21,549 .
7 1996 -795,273,000 71,439,000 23,730 .
8 1997 61,683,000 114,232,000 18,096 .
9 1998 529,653,000 176,069,000 15,785 .
10 1999 -177,062,000 379,346,000 15,541 .
11 2000 461,227,000 114,272,000 15,351 .
12 2001 1,148,529,000 170,910,000 15,163 .
13 2002 2,253,385,000 191,905,000 12,195 .
14 2003 4,198,103,000 338,215,000 13,272 .
15 2004 6,242,929,000 417,740,000 13,745 .
Askari Bank(Rs. 000)
S/No. Years Net income Itexp totemp itemp
1 1992 6,260,000 333,000 240 14
2 1993 118,508,000 2,712,000 326 30
3 1994 145,201,000 3,814,000 465 67
4 1995 173,084,000 7,446,000 664 87
5 1996 238,361,000 11,449,000 796 98
6 1997 310,670,000 19,127,000 946 102
7 1998 359,134,000 31,931,000 996 110
8 1999 282,446,000 34,272,000 1,001 113
9 2000 315,588,000 40,237,000 1,147 114
10 2001 550,051,000 46,287,000 1,281 118
11 2002 686,994,000 60,026,000 1,456 120
12 2003 1,103,065,000 73,806,000 1,723 123
13 2004 1,923,040,000 93,217,000 2,118 125

xxiiiManufacturing Sector IT Expenses/Income/Total Employee/IT Employee
Atlas Honda(Rs. 000)
S/No. Years Net income Itexp totemp itemp
1 1990 16,257,000 6,658,000 . .
2 1991 -10,475,000 10,194,000 . .
3 1992 -338,000 11,212,000 . .
4 1993 13,388,000 11,211,000 . .
5 1994 11,443,000 11,973,000 . .
6 1995 10,318,000 12,243,000 . .
7 1996 101,454,000 17,769,000 . .
8 1997 124,944,000 23,491,000 . .
9 1998 125,641,000 24,851,000 . .
10 1999 123,394,000 30,269,000 1,011 10
11 2000 60,182,000 21,550,000 1,200 14
12 2001 117,777,000 32,110,000 1,250 16
13 2002 270,500,000 20,190,000 1,275 12
14 2003 427,400,000 23,832,000 1,280 15
15 2004 544,700,000 27,927,000 1,300 16
General Tyre(Rs. 000)
S/No. Years Net income itexp totemp itemp
1 1990 8,826,000 1,210,000 936 7
2 1991 49,631,000 1,471,000 948 7
3 1992 66,102,000 1,547,000 963 8
4 1993 58,102,000 1,621,000 970 8
5 1994 30,460,000 1,631,000 981 8
6 1995 24,454,000 1,672,000 982 9
7 1996 9,038,000 1,680,000 990 9
8 1997 2,563,000 1,710,000 1,011 9
9 1998 74,647,000 1,750,000 1,035 10
10 1999 102,139,000 1,771,000 1,045 10
11 2000 199,984,000 1,854,000 1,011 10
12 2001 189,154,000 2,192,000 1,002 10
13 2002 175,469,000 2,251,000 994 11
14 2003 197,687,000 2,409,000 997 12
15 2004 236,000,000 2,458,000 989 12
D.G Cement(Rs. 000)
S/No. Years Net income itexp totemp itemp
1 1990 81,961,000 5,580,000 550 8
2 1991 92,618,000 5,987,000 572 8
3 1992 82,543,000 6,660,000 580 9
4 1993 296,134,000 7,376,000 582 9
5 1994 362,884,000 10,447,000 583 10
6 1995 386,788,000 14,462,000 590 10
7 1996 248,411,000 22,580,000 595 12
8 1997 71,454,000 53,443,000 600 12
9 1998 -58,284,000 37,382,000 610 12
10 1999 -580,369,000 45,265,000 634 13
11 2000 -101,199,000 45,314,000 660 14
12 2001 -444,004,000 70,628,000 673 14
13 2002 279,868,000 74,063,000 677 14
14 2003 483,592,000 80,425,000 692 15
15 2004 794,493,000 92,757,000 705 15
Lakson(Rs. 000)
S/No. Years Net income itexp totemp itemp
1 1990 15,380,000 2,510,000 . .
2 1991 11,420,000 2,795,000 4,560 18
3 1992 21,510,000 2,847,000 4,570 18
4 1993 30,318,000 4,765,000 4,590 20
5 1994 65,154,000 6,859,000 4,595 20
6 1995 42,500,000 8,979,000 5,010 22
7 1996 48,120,000 10,357,000 5,034 22
8 1997 89,758,000 24,786,000 5,048 23
9 1998 150,324,000 38,974,000 5,053 23
10 1999 180,385,000 53,543,000 5,060 25
11 2000 474,653,000 38,734,000 5,074 25
12 2001 394,708,000 43,782,000 5,084 27
13 2002 749,023,000 54,066,000 5,090 27
14 2003 856,783,000 60,805,000 5,093 28
15 2004 1,277,744,000 95,887,000 6,010 30

xxivPackages Limited (Rs. 000)
S/No. Years Net income itexp totemp itemp
1 1990 108,936,000 2,000,000 2,800 8
2 1991 128,228,000 2,500,000 2,810 8
3 1992 175,948,000 2,600,000 2,820 9
4 1993 224,744,000 2,800,000 2,805 9
5 1994 238,783,000 2,700,000 2,809 9
6 1995 150,318,000 2,500,000 2,850 8
7 1996 153,503,000 1,075,000 2,860 10
8 1997 90,385,000 1,095,000 2,865 11
9 1998 220,079,000 2,000,000 2,885 11
10 1999 384,154,000 2,000,000 2,900 15
11 2000 428,703,000 1,058,000 2,940 16
12 2001 424,879,000 5,001,880 2,950 15
13 2002 655,372,000 6,802,000 2,965 15
14 2003 813,513,000 5,902,600 2,970 12
15 2004 963,202,000 1,432,000 3,000 11
Indus Motors(Rs. 000)
S/No. Years Net income Itexp totemp itemp
1 1992 94,272,000 4,507,000 670 5
2 1993 84,478,000 7,546,000 771 5
3 1994 121,545,000 11,986,000 850 5
4 1995 51,721,000 14,084,000 960 6
5 1996 187,235,000 14,830,000 990 9
6 1997 150,204,000 25,124,000 1,110 11
7 1998 147,164,000 2,544,800 1,250 12
8 1999 251,289,000 43,154,000 1,340 12
9 2000 172,254,000 45,587,000 1,461 13
10 2001 203,370,000 90,116,000 1,631 14
11 2002 360,463,000 91,329,000 1,890 14
12 2003 1,257,761,000 94,219,000 1,970 14
13 2004 1,473,242,000 87,065,000 2,005 15
Service Industries (Rs. 000)
S/No. Years Net income Itexp totemp itemp
1 1990 21,741,000 252,000 4,050 8
2 1991 27,257,000 310,000 4,056 9
3 1992 32,976,000 296,000 4,560 10
4 1993 41,386,000 644,000 4,616 11
5 1994 42,576,000 1,132,000 4,721 12
6 1995 44,813,000 811,000 4,819 12
7 1996 47,668,000 1,364,000 4,981 14
8 1997 22,635,000 1,496,000 5,012 16
9 1998 123,738,000 1,677,000 5,017 21
10 1999 29,902,000 1,788,000 5,024 22
11 2000 31,143,000 2,562,000 5,190 23
12 2001 67,710,000 2,939,000 5,209 26
13 2002 47,227,000 2,239,000 5,700 28
14 2003 8,832,000 3,652,000 5,790 30
15 2004 26,902,000 3,911,000 5,970 30
Honda Cars(Rs. 000)
S/No. Years Net income itexp totemp itemp
1 1994 20,986,947 1,000,000 1,140 4
2 1995 86,424,753 600,000 1,142 5
3 1996 201,170,033 420,000 1,145 4
4 1997 48,065,001 710,000 1,150 4
5 1998 158,179,106 900,000 1,190 6
6 1999 207,692,154 640,000 1,371 5
7 2000 191,285,533 650,000 1,200 4
8 2001 204,471,222 2,762,500 1,131 5
9 2002 431,642,000 5,772,000 1,250 5
10 2003 346,135,000 6,452,000 1,190 5
11 2004 464,230,000 5,127,800 1,200 5
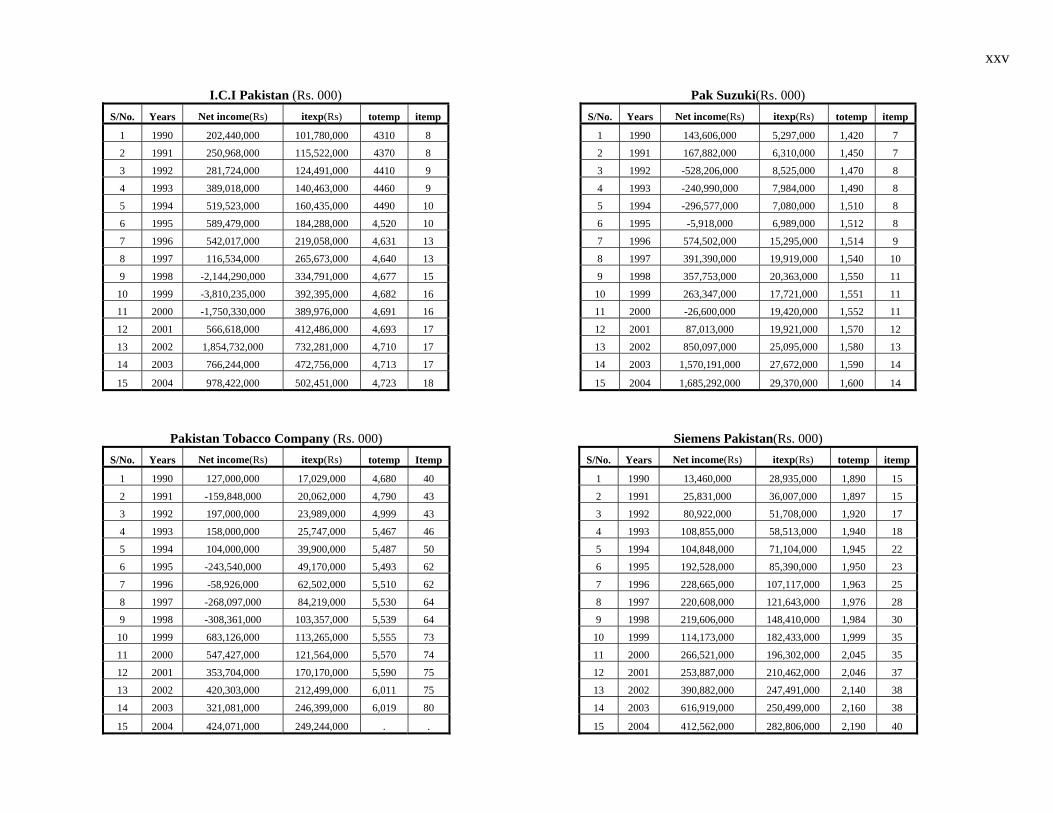
xxv
I.C.I Pakistan (Rs. 000)
S/No. Years Net income(Rs) itexp(Rs) totemp itemp
1 1990 202,440,000 101,780,000 4310 8
2 1991 250,968,000 115,522,000 4370 8
3 1992 281,724,000 124,491,000 4410 9
4 1993 389,018,000 140,463,000 4460 9
5 1994 519,523,000 160,435,000 4490 10
6 1995 589,479,000 184,288,000 4,520 10
7 1996 542,017,000 219,058,000 4,631 13
8 1997 116,534,000 265,673,000 4,640 13
9 1998 -2,144,290,000 334,791,000 4,677 15
10 1999 -3,810,235,000 392,395,000 4,682 16
11 2000 -1,750,330,000 389,976,000 4,691 16
12 2001 566,618,000 412,486,000 4,693 17
13 2002 1,854,732,000 732,281,000 4,710 17
14 2003 766,244,000 472,756,000 4,713 17
15 2004 978,422,000 502,451,000 4,723 18
Pakistan Tobacco Company (Rs. 000)
S/No. Years Net income(Rs) itexp(Rs) totemp Itemp
1 1990 127,000,000 17,029,000 4,680 40
2 1991 -159,848,000 20,062,000 4,790 43
3 1992 197,000,000 23,989,000 4,999 43
4 1993 158,000,000 25,747,000 5,467 46
5 1994 104,000,000 39,900,000 5,487 50
6 1995 -243,540,000 49,170,000 5,493 62
7 1996 -58,926,000 62,502,000 5,510 62
8 1997 -268,097,000 84,219,000 5,530 64
9 1998 -308,361,000 103,357,000 5,539 64
10 1999 683,126,000 113,265,000 5,555 73
11 2000 547,427,000 121,564,000 5,570 74
12 2001 353,704,000 170,170,000 5,590 75
13 2002 420,303,000 212,499,000 6,011 75
14 2003 321,081,000 246,399,000 6,019 80
15 2004 424,071,000 249,244,000 . .
Pak Suzuki(Rs. 000)
S/No. Years Net income(Rs) itexp(Rs) totemp itemp
1 1990 143,606,000 5,297,000 1,420 7
2 1991 167,882,000 6,310,000 1,450 7
3 1992 -528,206,000 8,525,000 1,470 8
4 1993 -240,990,000 7,984,000 1,490 8
5 1994 -296,577,000 7,080,000 1,510 8
6 1995 -5,918,000 6,989,000 1,512 8
7 1996 574,502,000 15,295,000 1,514 9
8 1997 391,390,000 19,919,000 1,540 10
9 1998 357,753,000 20,363,000 1,550 11
10 1999 263,347,000 17,721,000 1,551 11
11 2000 -26,600,000 19,420,000 1,552 11
12 2001 87,013,000 19,921,000 1,570 12
13 2002 850,097,000 25,095,000 1,580 13
14 2003 1,570,191,000 27,672,000 1,590 14
15 2004 1,685,292,000 29,370,000 1,600 14
Siemens Pakistan(Rs. 000)
S/No. Years Net income(Rs) itexp(Rs) totemp itemp
1 1990 13,460,000 28,935,000 1,890 15
2 1991 25,831,000 36,007,000 1,897 15
3 1992 80,922,000 51,708,000 1,920 17
4 1993 108,855,000 58,513,000 1,940 18
5 1994 104,848,000 71,104,000 1,945 22
6 1995 192,528,000 85,390,000 1,950 23
7 1996 228,665,000 107,117,000 1,963 25
8 1997 220,608,000 121,643,000 1,976 28
9 1998 219,606,000 148,410,000 1,984 30
10 1999 114,173,000 182,433,000 1,999 35
11 2000 266,521,000 196,302,000 2,045 35
12 2001 253,887,000 210,462,000 2,046 37
13 2002 390,882,000 247,491,000 2,140 38
14 2003 616,919,000 250,499,000 2,160 38
15 2004 412,562,000 282,806,000 2,190 40
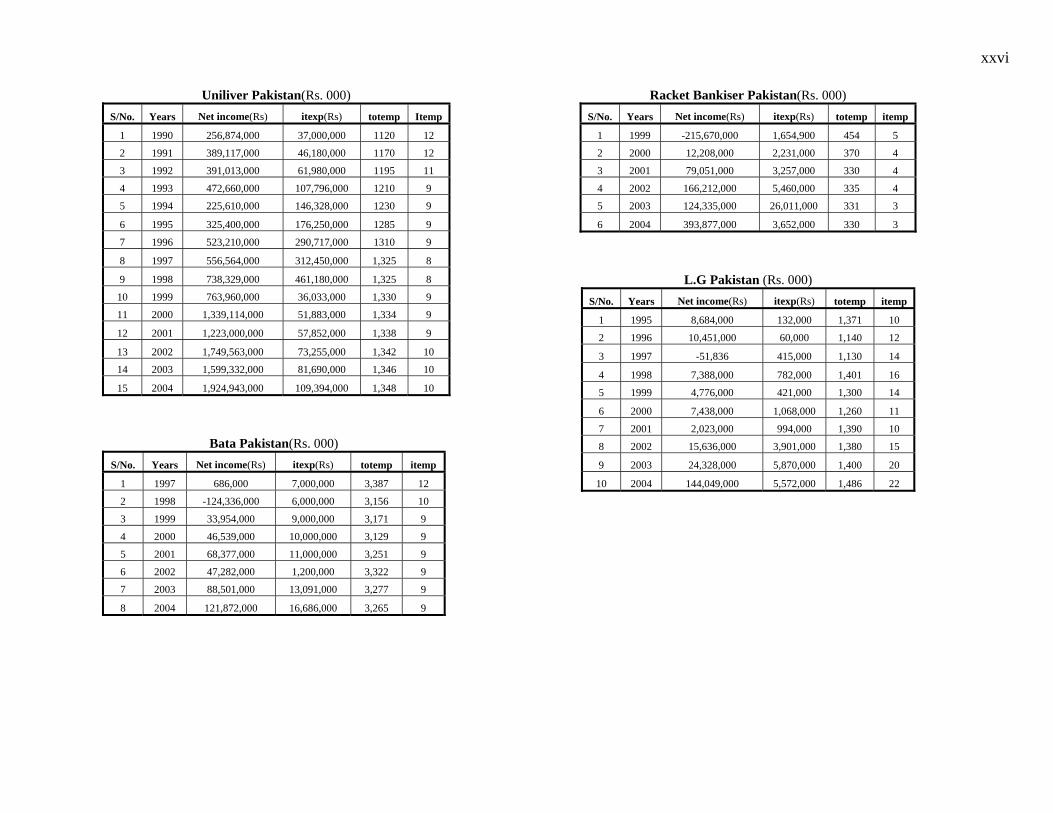
xxvi
Uniliver Pakistan(Rs. 000)
S/No. Years Net income(Rs) itexp(Rs) totemp Itemp
1 1990 256,874,000 37,000,000 1120 12
2 1991 389,117,000 46,180,000 1170 12
3 1992 391,013,000 61,980,000 1195 11
4 1993 472,660,000 107,796,000 1210 9
5 1994 225,610,000 146,328,000 1230 9
6 1995 325,400,000 176,250,000 1285 9
7 1996 523,210,000 290,717,000 1310 9
8 1997 556,564,000 312,450,000 1,325 8
9 1998 738,329,000 461,180,000 1,325 8
10 1999 763,960,000 36,033,000 1,330 9
11 2000 1,339,114,000 51,883,000 1,334 9
12 2001 1,223,000,000 57,852,000 1,338 9
13 2002 1,749,563,000 73,255,000 1,342 10
14 2003 1,599,332,000 81,690,000 1,346 10
15 2004 1,924,943,000 109,394,000 1,348 10
Bata Pakistan(Rs. 000)
S/No. Years Net income(Rs) itexp(Rs) totemp itemp
1 1997 686,000 7,000,000 3,387 12
2 1998 -124,336,000 6,000,000 3,156 10
3 1999 33,954,000 9,000,000 3,171 9
4 2000 46,539,000 10,000,000 3,129 9
5 2001 68,377,000 11,000,000 3,251 9
6 2002 47,282,000 1,200,000 3,322 9
7 2003 88,501,000 13,091,000 3,277 9
8 2004 121,872,000 16,686,000 3,265 9
Racket Bankiser Pakistan(Rs. 000)
S/No. Years Net income(Rs) itexp(Rs) totemp itemp
1 1999 -215,670,000 1,654,900 454 5
2 2000 12,208,000 2,231,000 370 4
3 2001 79,051,000 3,257,000 330 4
4 2002 166,212,000 5,460,000 335 4
5 2003 124,335,000 26,011,000 331 3
6 2004 393,877,000 3,652,000 330 3
L.G Pakistan (Rs. 000)
S/No. Years Net income(Rs) itexp(Rs) totemp itemp
1 1995 8,684,000 132,000 1,371 10
2 1996 10,451,000 60,000 1,140 12
3 1997 -51,836 415,000 1,130 14
4 1998 7,388,000 782,000 1,401 16
5 1999 4,776,000 421,000 1,300 14
6 2000 7,438,000 1,068,000 1,260 11
7 2001 2,023,000 994,000 1,390 10
8 2002 15,636,000 3,901,000 1,380 15
9 2003 24,328,000 5,870,000 1,400 20
10 2004 144,049,000 5,572,000 1,486 22

xxvii
Results Summary of One-Sample z –Test Annexure XXIV
IT Success Reason-Top Management Commitment
Sector n π̂ z-statistic p-value
All Banking & Manufacturing 48 0.979 23.00 0.000
Banking 24 1.000 Infinity 0.000
Manufacturing 24 0.958 11.00 0.00
Local Banks 12 1.000 Infinity 0.000
Foreign Banks 12 1.000 Infinity 0.000
Local Manufacturing 12 0.650 Infinity 0.000
Foreign Manufacturing 12 .9167 5.00 0.000
IT Success Reason-Organization Proper IT Planning
Sector n π̂ z-statistic p-value
All Banking & Manufacturing 48 0.791 4.92 0.000
Banking 24 0.750 2.77 0.005
Manufacturing 24 0.833 4.29 0.000
Local Banks 12 0.667 1.17 0.133
Foreign Banks 12 .833 2.97 0.006
Local Manufacturing 12 .833 2.97 0.006
Foreign Manufacturing 12 .833 2.97 0.006
IT Success Reason-Organization Proper IT Investments
Sector N π̂ z-
statistic
p-value
All Banking &
Manufacturing
48 0.750 3.96 0.000
Banking 24 0.583 0.81 0.213
Manufacturing 24 0.917 7.23 0.000
Local Banks 12 0.500 0.00 .5000
Foreign Banks 12 .667 1.17 0.133
Local Manufacturing 12 .917 5.00 0.000
Foreign Manufacturing 12 .917 5.00 0.000
IT Success Reason-Government Role
Sector n π̂ z-statistic p-value
All Banking &
Manufacturing
48 0.292 -3.14 0.999
Banking 24 0.917 -1.70 0.948
Manufacturing 24 0.250 -2.77 0.995
Local Banks 12 0.333 -1.70 0.867
Foreign Banks 12 0.333 -1.70 0.867
Local Manufacturing 12 .0833 -5.00 1.000
Foreign
Manufacturing
12 .4170 -0.56 0.707

xxviii
Results Summary of One-Sample z –Test Annexure XXV
Organizational Measure For IT Success: Rewards Sector N π̂ z-statistic p-value
All Banking & Manufacturing 48 0.750 3.96 0.000
Banking 24 0.663 4.81 0.000
Manufacturing 24 0.917 7.23 0.000
Local Banks 12 0.300 0.00 0.060
Foreign Banks 12 .767 4.17 0.000
Local Manufacturing 12 .246 2.29 0.052
Foreign Manufacturing 12 .917 5.00 0.000
Organizational Measure For IT Success: Job Threats
Sector N π̂ z-statistic p-value
All Banking & Manufacturing 48 0.125 -7.77 1.000
Banking 24 0.208 -3.44 0.999
Manufacturing 24 0.0417 -11.00 1.000
Local Banks 12 0.250 -1.91 0.959
Foreign Banks 12 0.167 -2.97 0.994
Local Manufacturing 12 0.165 -2.94 0.993
Foreign Manufacturing 12 0.0833 -5.00 1.000

xxix
Questionnaire Annexure xxvi
=================================================================
1. Name of company:____________________________________________
2. Origin:__________________________________________________
3. Year of Starting Business in Pakistan:____________________________
4. Main Areas of Business:____________________________________
5. Address Of Corporate office: ___________________________________
6. Name of the Interviewee:__________________________________
7. Designation:_______________________________________
8. Duration of your service in the company:____________________
9. For how long your company is using I.T:_____________________
10. What is total staff strength of your company:___________________
11. What is staff strength of your IT people:_________________
12. How many out of your total management staff are?: (Pl. provide no.)
1. Business degree Holder
2. Engineering degree Holder
3. Computer Science degree Holder
4. Any other degree Holder
13. What functions I.T department plays in your organization: (Pl tick)
a. Programming, system Development & maintenance
b. Manage Telecommunication (Internet, Intranet etc.)
c. Processing of business applications
d. Helps in strategy formulation/organization transformation
e. Helps in Innovation of product & service
f. Helps in Business Process Reengineering
g. For all of above
14. In which application areas of your company IT has been introduced?:
1. 2. 3. 4. 5.
6. 7. 8. 9. 10.
15. Which of above areas/ systems are interlinked?
1. 2. 3. 4. 5.
16. The above systems are used mostly for:
Planning Organizing Leading Controlling All of these:
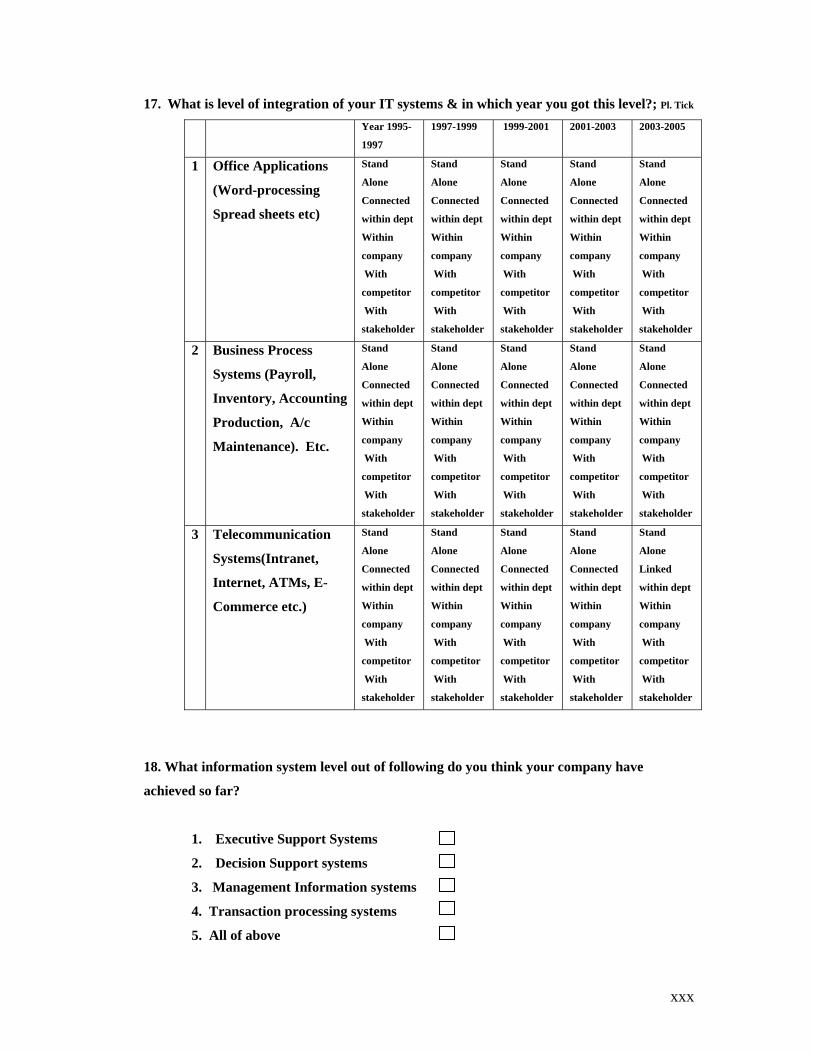
xxx
17. What is level of integration of your IT systems & in which year you got this level?; Pl. Tick
Year 1995-
1997
1997-1999 1999-2001 2001-2003 2003-2005
1 Office Applications
(Word-processing
Spread sheets etc)
Stand
Alone
Connected
within dept
Within
company
With
competitor
With
stakeholder
Stand
Alone
Connected
within dept
Within
company
With
competitor
With
stakeholder
Stand
Alone
Connected
within dept
Within
company
With
competitor
With
stakeholder
Stand
Alone
Connected
within dept
Within
company
With
competitor
With
stakeholder
Stand
Alone
Connected
within dept
Within
company
With
competitor
With
stakeholder 2 Business Process
Systems (Payroll,
Inventory, Accounting
Production, A/c
Maintenance). Etc.
Stand
Alone
Connected
within dept
Within
company
With
competitor
With
stakeholder
Stand
Alone
Connected
within dept
Within
company
With
competitor
With
stakeholder
Stand
Alone
Connected
within dept
Within
company
With
competitor
With
stakeholder
Stand
Alone
Connected
within dept
Within
company
With
competitor
With
stakeholder
Stand
Alone
Connected
within dept
Within
company
With
competitor
With
stakeholder 3 Telecommunication
Systems(Intranet,
Internet, ATMs, E-
Commerce etc.)
Stand
Alone
Connected
within dept
Within
company
With
competitor
With
stakeholder
Stand
Alone
Connected
within dept
Within
company
With
competitor
With
stakeholder
Stand
Alone
Connected
within dept
Within
company
With
competitor
With
stakeholder
Stand
Alone
Connected
within dept
Within
company
With
competitor
With
stakeholder
Stand
Alone
Linked
within dept
Within
company
With
competitor
With
stakeholder
18. What information system level out of following do you think your company have
achieved so far?
1. Executive Support Systems
2. Decision Support systems
3. Management Information systems
4. Transaction processing systems
5. All of above

xxxi
19. What Hardware system your organization is using? Pl. Tick:
a. Main frames
b. Mini computer
c. Mid range servers
d. P.C networking LAN, WAN, etc
e. Combination of any two above
20. What Operating system you are using?.
1._______________________
2.________________________
3.________________________
21. Which software package/language you are using for programming/systems?.
1._______________________
2.________________________
3.________________________
22. How you developed your IT systems(Pl. tick)?;
1. Vendor supplied
2. Purchased standard system from Market.
3. Developed In-house by own
4. Got developed from consultants
5. Got copy from different sources
6. Combination of any of above
Note: If you are using standard system please name that:______________
23. Do your present I.T systems meet your all requirements Yes No
24. If ‘Yes’ at what extent of requirements out of followings ? (Pl. tick)
a) All systems have been computerized and meet all requirements
b) Most systems have been computerized & Few systems are left.
c) Still use manual procedures for some reports of computerized systems
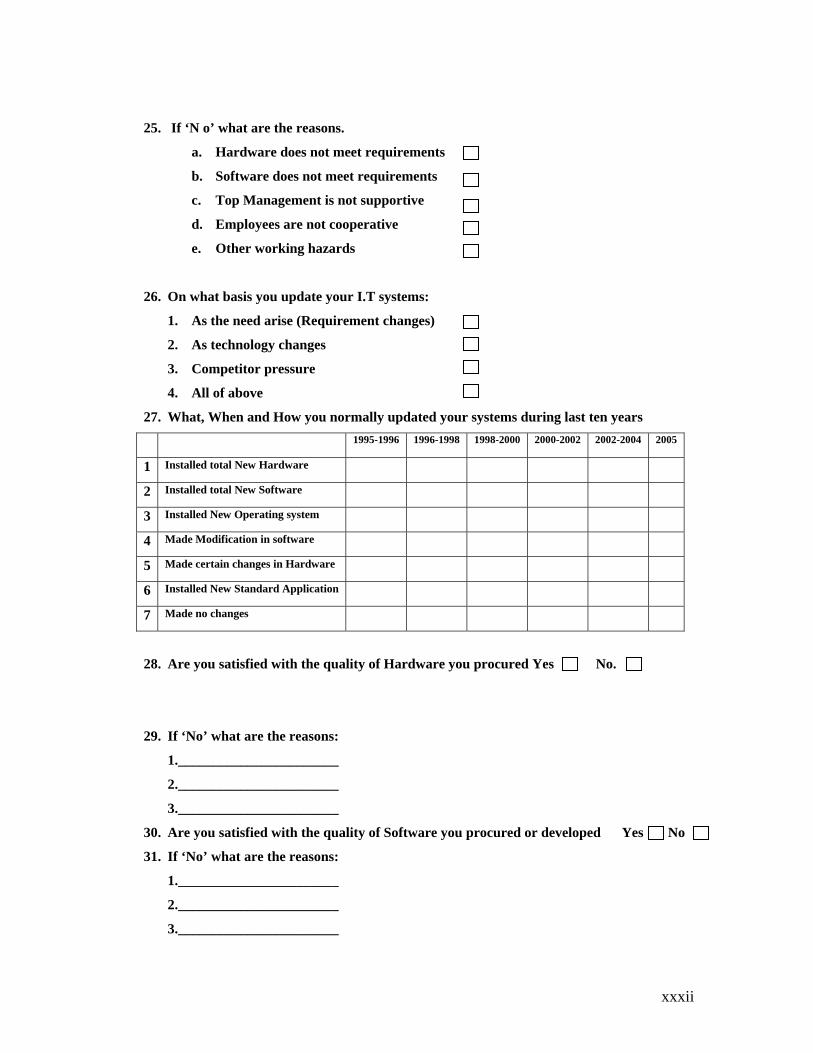
xxxii
25. If ‘N o’ what are the reasons.
a. Hardware does not meet requirements
b. Software does not meet requirements
c. Top Management is not supportive
d. Employees are not cooperative
e. Other working hazards
26. On what basis you update your I.T systems:
1. As the need arise (Requirement changes)
2. As technology changes
3. Competitor pressure
4. All of above
27. What, When and How you normally updated your systems during last ten years
1995-1996 1996-1998 1998-2000 2000-2002 2002-2004 2005
1 Installed total New Hardware
2 Installed total New Software
3 Installed New Operating system
4 Made Modification in software
5 Made certain changes in Hardware
6 Installed New Standard Application
7 Made no changes
28. Are you satisfied with the quality of Hardware you procured Yes No.
29. If ‘No’ what are the reasons:
1._______________________
2._______________________
3._______________________
30. Are you satisfied with the quality of Software you procured or developed Yes No
31. If ‘No’ what are the reasons:
1._______________________
2._______________________
3._______________________

xxxiii
32. Are you satisfied with the quality of people working on your IT systems Yes No
33. If ‘No’ what out of following reasons you think are those:
1. Qualified staff is not available
2. Recruitment of staff is not up to Mark
3. Proper Training is not provided to the employees by the organization
4. Employees are not properly motivated by the organization
5. Any other reason:_________________________
34. How do you compare your I.T systems with those of your competitors?
1. Much better and offer many advantages
2. As good as their system.
3. Inferior to their system
4. No information about their
35. At what level any new IT related system installation decisions are made:
a. Corporate level
b. Regional level
c. Branch/Unit level
36. Who makes your company’s computerization decisions:
a. Top Management
b. Any I.T committee
c. Departmental/Divisional Heads
d. I.T department
e. Any other please name
37. To what extent do you think concerned manager or employee (User of a system ) are
involved in yours’ company computerization decisions?
a) Involved only in 1st phase of system development life cycle
b) Involved in all phases of system development life cycle
c) Do not involved in any phase.
38. Do you provide your staff any training for using IT systems?. Yes No

xxxiv
39. If ‘Yes’ What type out of following;
1. On the Job
2. Off the Job but within company
3. Off the Job outside company
40. How frequently you provide them training?
a. On Yearly basis
b. On Quarterly basis
c. On Need basis
d. Only once when employee is firstly appointed.
41. Do you allocate any budget to this training? Yes No
42. If “Yes” what %age of your annual budget (or What Amount)?.
43. IT is accepted by your employees in your organization because it was;
a. Easier to use
b. Has relative advantage
c. Has simple process
d. Is less risky
e. Is compatible with other systems
f. Give competitive edge
g. Low Cost
h. More efficient/productive
i. All of above
44. What impacts the following have on your employees on acceptance of IT in your
organization?
a. Intrinsic rewards such as
Low Impact Moderate Impact High Impact
A Ease of Use
B Usefulness
C Enjoyment
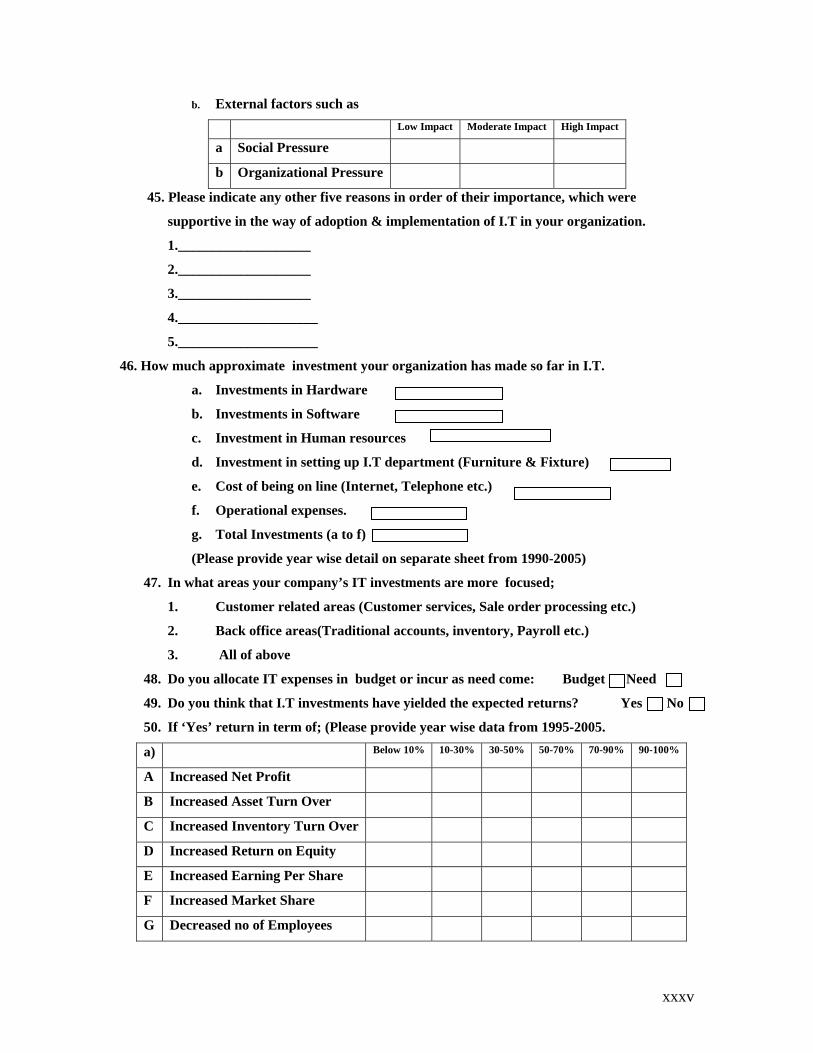
xxxv
b. External factors such as
Low Impact Moderate Impact High Impact
a Social Pressure
b Organizational Pressure
45. Please indicate any other five reasons in order of their importance, which were
supportive in the way of adoption & implementation of I.T in your organization.
1.___________________
2.___________________
3.___________________
4.____________________
5.____________________
46. How much approximate investment your organization has made so far in I.T.
a. Investments in Hardware
b. Investments in Software
c. Investment in Human resources
d. Investment in setting up I.T department (Furniture & Fixture)
e. Cost of being on line (Internet, Telephone etc.)
f. Operational expenses.
g. Total Investments (a to f)
(Please provide year wise detail on separate sheet from 1990-2005)
47. In what areas your company’s IT investments are more focused;
1. Customer related areas (Customer services, Sale order processing etc.)
2. Back office areas(Traditional accounts, inventory, Payroll etc.)
3. All of above
48. Do you allocate IT expenses in budget or incur as need come: Budget Need
49. Do you think that I.T investments have yielded the expected returns? Yes No
50. If ‘Yes’ return in term of; (Please provide year wise data from 1995-2005.
a) Below 10% 10-30% 30-50% 50-70% 70-90% 90-100%
A Increased Net Profit
B Increased Asset Turn Over
C Increased Inventory Turn Over
D Increased Return on Equity
E Increased Earning Per Share
F Increased Market Share
G Decreased no of Employees
xxxvi
b)
NO
INCREASE
MODERATE
INCREASE
HIGH
INCREASE
H Customer Satisfaction
I Stake Holder Confidence
J Better Customer/Supplier Links
K Better Data storage
L Company Image
M Job Interest of employees
N Inter office link/communication
51. If ‘No’ what are the reasons:
1._______________________
2.________________________
3.________________________
4.________________________
5.________________________
52. For what purpose you made your investments. (Pl. Tick)
1. Threshold IT (Just to Compete)
2. Informational IT (Information Access & Communication)
3. Traditional Investments (Cutting Cost)
4. Strategic Investments (Competitive Advantages)
5. All of Above
6. No Idea
52. If your organization has faced any of the following problems in way of adoption of IT
Please indicate its impact.
No Impact Low Impact Moderate Impact High Impact
a Culture
b Political
c Human
d Organizational
e Governmental
f Social
g Economical
h Environmental
i Any other

xxxvii
53. What Measures you took to overcome these barriers? (Pl. Tick)
1. Education & Training
2. Employee Motivation
3. Employee Rewards
4. Job Threats
54. Please indicate any other five problems in order of their importance in way of adoption
& implementation of I.T in your organization. (Pl. Tick).
1. Inadequate Telecommunication Infrastructure
2. Lack Of Adequate Employees
3. Lack Of Proper IT Planning
4. Selection of Computer to suit company needs
5.Judious use of computer
6. Management Unawareness about IT
7. Management shirks to investment money
8. Employees non cooperation
55. What security measures your company take?.
a) For Data
1. Use Backups tapes/Diskettes
2. Use Backups Cds
3. Any other
b) For Systems
1. Level restrictions to the user
2. System & User password
3. Both of above
56. What standby systems your company have if your I.T system do not work due to any
reasons or it is totally collapses.
1.___________________
2.___________________
58. Are you satisfied with the role of Govt. in promoting I.T in the country: Yes No
59. If ‘No’, why you are dissatisfied;
1.____________________________
2.____________________________
3.____________________________
60. Any Other Comments you want to give on this questionnaire;
_________________________________________________________
*****************Thank You For Your Cooperation*******************