impact of large scale pv generation - home - ieee power ... · impact of large scale pv generation...
TRANSCRIPT

Impact of Large Scale PV Generation
Vijay Vittal – Arizona State UniversitySara Eftekharnejad – TEPCO
Gerald Heydt – Arizona State UniversityBrian Keel – SRP
Jeffrey Loehr - SRP
1

Reference Source
• This presentation is based on the following transactions paper
Eftekharnejad, S., V. Vittal, G.T. Heydt, B. Keel, J. Loehr, “ Impact of Increased Penetration of Photovoltaic Generation on Power Systems,” IEEE Transactions on Power Systems, Vol. 28, No. 2, pp. 893-901, May 2013.
2
Characteristics of System Studies
• Entire WECC represented for high PV penetration studies
• Photovoltaic systems are added to the zones within the Arizona area
• Light loading conditions of the month of April
• Peak PV outputs
3
Base Case Modifications
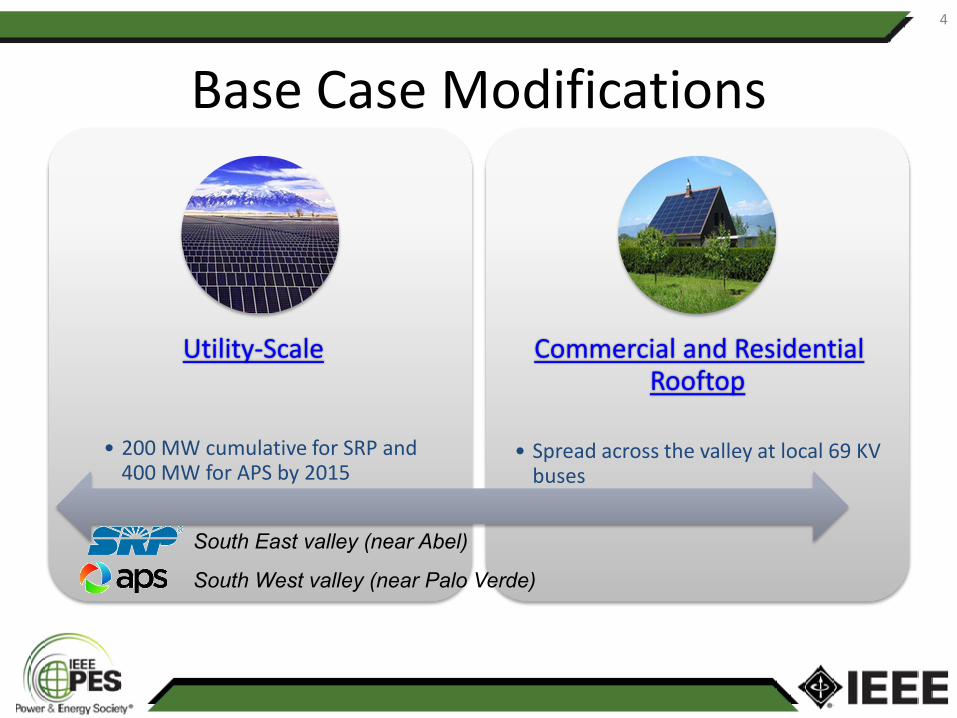
Utility-Scale
• 200 MW cumulative for SRP and 400 MW for APS by 2015
Commercial and Residential Rooftop
• Spread across the valley at local 69 KV buses
South East valley (near Abel)
South West valley (near Palo Verde)
4
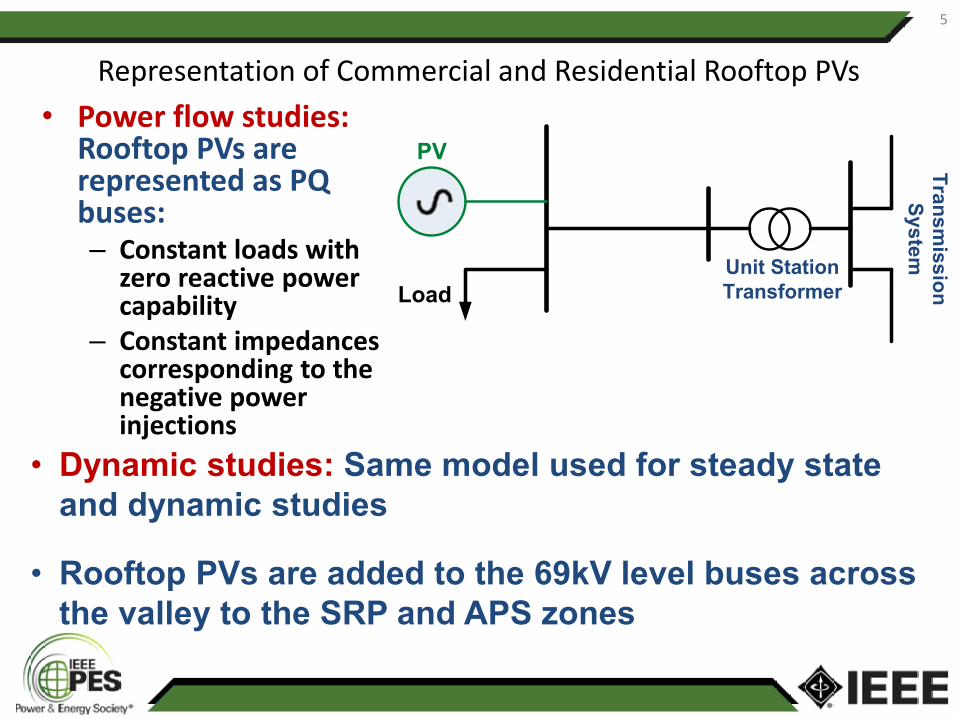
Representation of Commercial and Residential Rooftop PVs• Power flow studies:
Rooftop PVs are represented as PQ buses:– Constant loads with
zero reactive power capability
– Constant impedances corresponding to the negative power injections
PV
LoadUnit Station Transformer
Transmission
System
• Dynamic studies: Same model used for steady state and dynamic studies
• Rooftop PVs are added to the 69kV level buses across the valley to the SRP and APS zones
5

Arizona Solar MapAn Arizona solar map is utilized to locate the existing PV installations based on the zip codes of the SRP substations
6
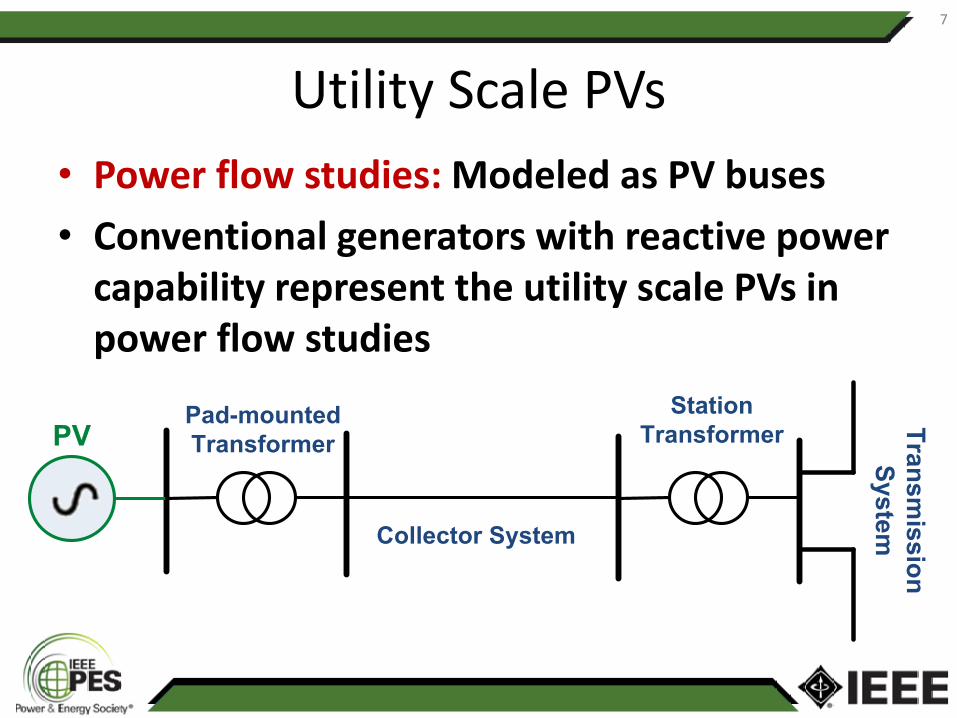
Utility Scale PVs• Power flow studies: Modeled as PV buses• Conventional generators with reactive power
capability represent the utility scale PVs in power flow studies
PVPad-mounted Transformer
Collector System
Station Transformer Transm
ission System
7

Utility Scale PVs• Use existing WECC
generic convertermodel– General Electric
type 4 wind turbine generator
• DC side dynamics such as MPPT are neglected
• Both DSATools and PSLF have the equivalent model available in the model library
Source: K. Clark, N. Miller, R. Walling, “Modeling of GE Solar Photovoltaic Plants for Grid Studies”, April 2010.
8

Utility Scale PVs
•Converter Model
•Protective Relay settings
•Electrical Control Models
PV Array Model
Inverter Model
Connection to Network
d-q voltage
d-q current
DC voltage
Reactive power Control
Desired q-axis current
DC current
AC voltage
Power Factor
Network Model in PSLF
9

Steady State Analysis
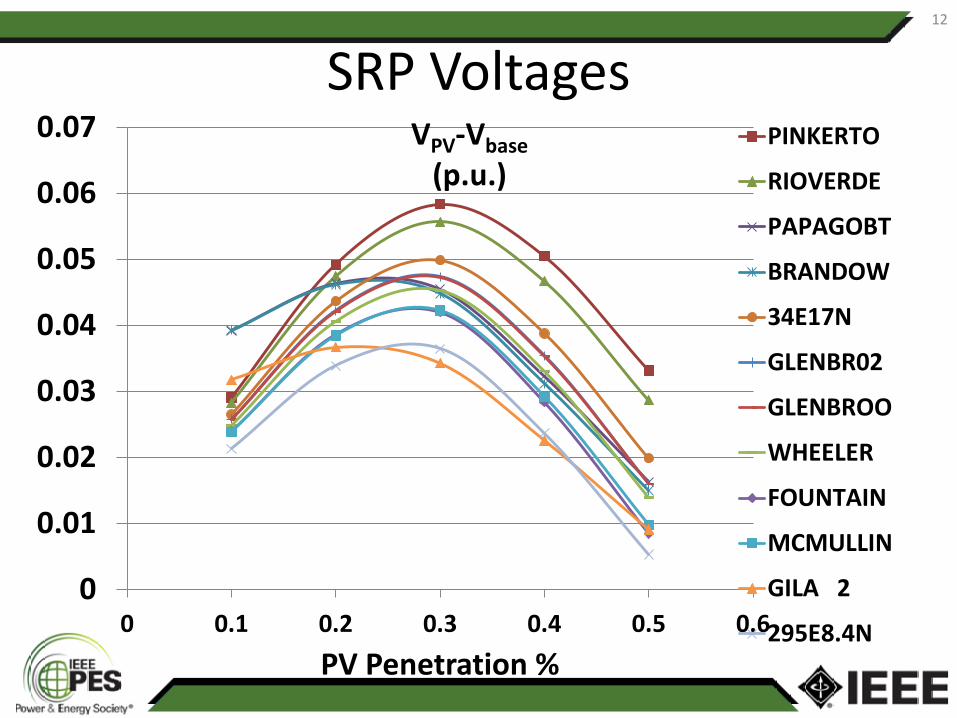
Impact of increased penetration of PV solar on static voltage stability and control at low loads
• Various PV penetration levels were studied (up to 50 %)• Roof top PVs modeled as PQ buses and utility scale PVs modeled as PV buses
• High voltages were observed at 20-30% PV generation levels• At higher PV generation levels steady state voltages will decrease
10
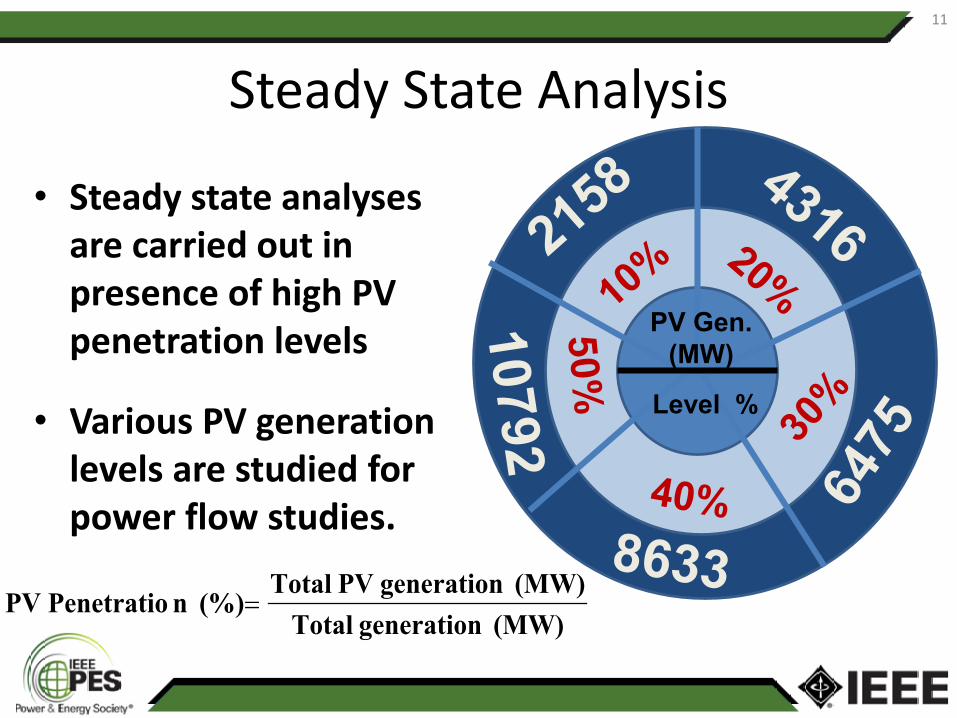
Steady State Analysis
• Steady state analyses are carried out in presence of high PV penetration levels
• Various PV generation levels are studied for power flow studies.
(MW) generation Total(MW) generationPV Total
(%) n PenetratioPV =
PV Gen. (MW)
Level %
11
SRP Voltages
0
0.01
0.02
0.03
0.04
0.05
0.06
0.07
0 0.1 0.2 0.3 0.4 0.5 0.6
VPV-Vbase(p.u.)
PV Penetration %
PINKERTO
RIOVERDE
PAPAGOBT
BRANDOW
34E17N
GLENBR02
GLENBROO
WHEELER
FOUNTAIN
MCMULLIN
GILA 2
295E8.4N
12
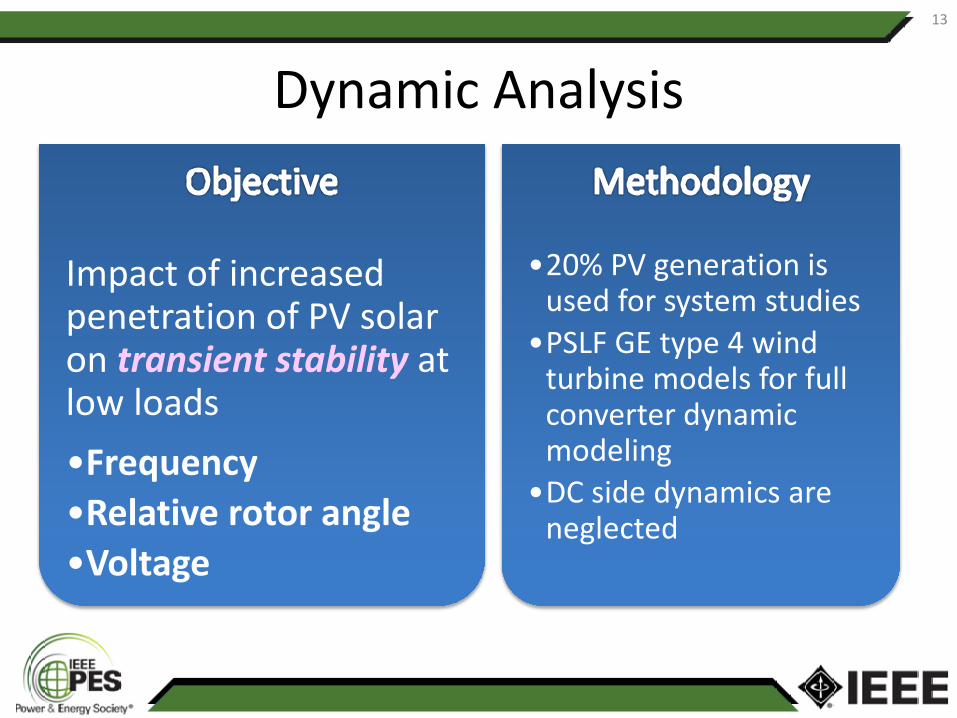
Dynamic Analysis
Impact of increased penetration of PV solar on transient stability at low loads•Frequency•Relative rotor angle•Voltage
•20% PV generation is used for system studies
•PSLF GE type 4 wind turbine models for full converter dynamic modeling
•DC side dynamics are neglected
13

Case Studies14
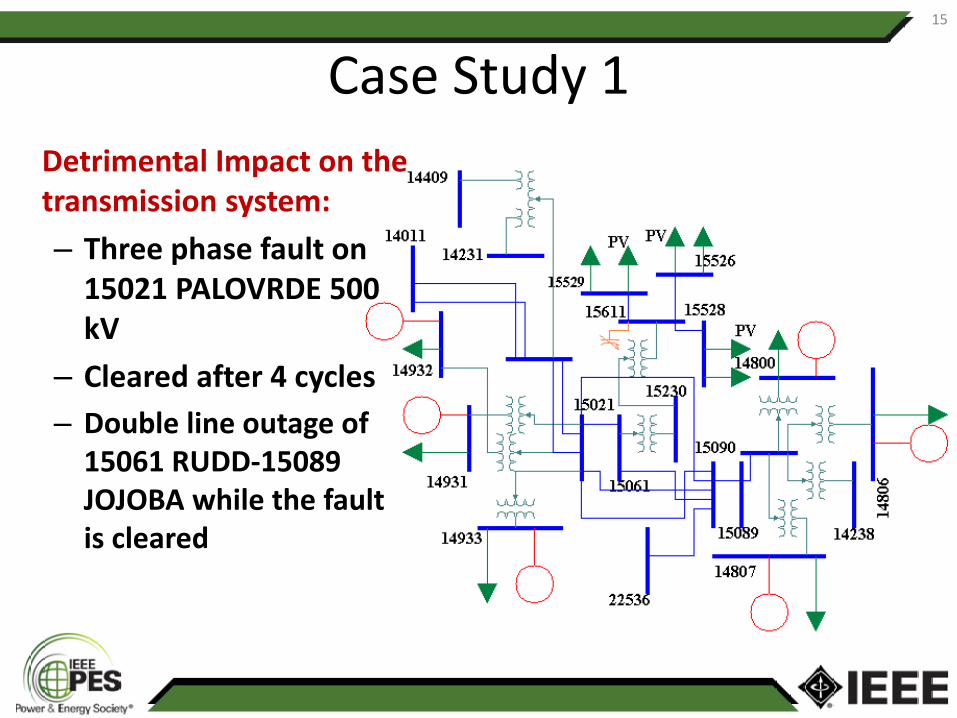
Case Study 1Detrimental Impact on the transmission system:– Three phase fault on
15021 PALOVRDE 500 kV
– Cleared after 4 cycles– Double line outage of
15061 RUDD-15089 JOJOBA while the fault is cleared
15

Case Study 1
4.5 5 5.5 6 6.5 7 7.5 80
20
40
60
80
100
Time (sec)
Rela
tive r
oto
r an
gle
(d
eg
ree)
Gen 888 20% PVGen 888 no PVGen 1567 20% PVGen 1567 no PV
16
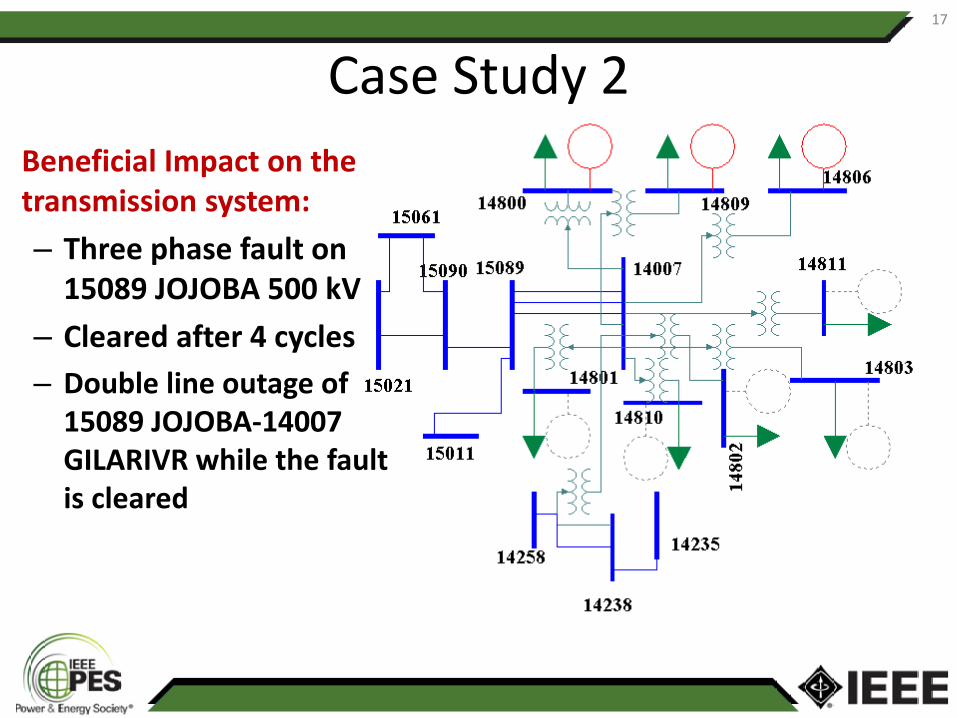
Case Study 2Beneficial Impact on the transmission system:– Three phase fault on
15089 JOJOBA 500 kV – Cleared after 4 cycles– Double line outage of
15089 JOJOBA-14007 GILARIVR while the fault is cleared
17

Case Study 2
4.5 5 5.5 6 6.5 7 7.5 8 8.5 90102030405060708090
100
Time (sec)
Rel
ativ
e ro
tor a
ngle
(deg
)
Gen 1567 20% PVGen 1567 no PVGen 888 20% PVGen 888 no PV
18
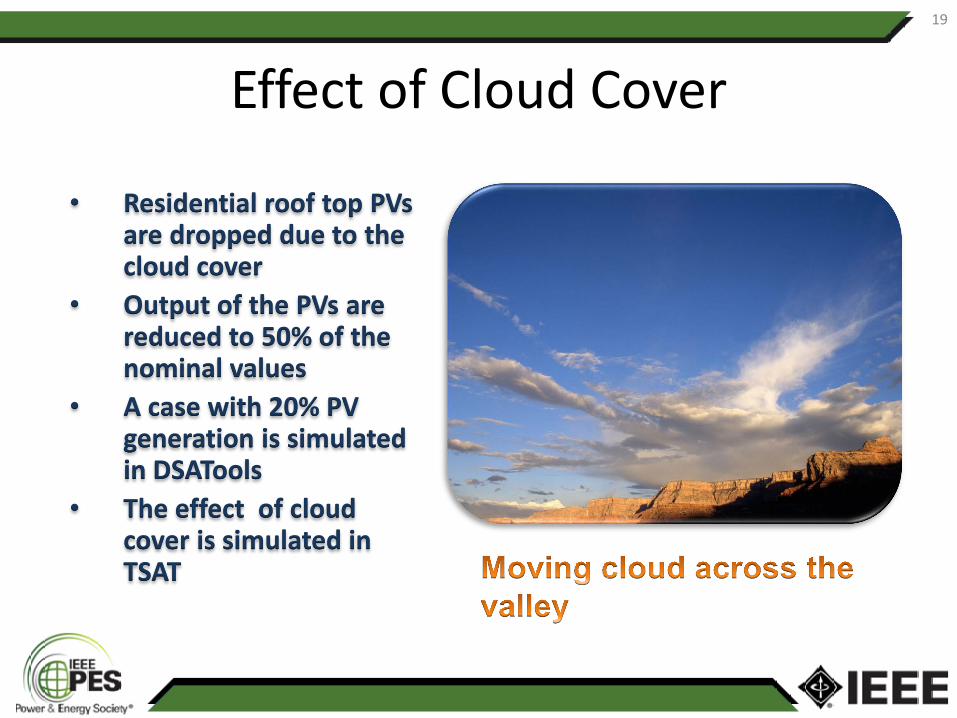
Effect of Cloud Cover
• Residential roof top PVs are dropped due to the cloud cover
• Output of the PVs are reduced to 50% of the nominal values
• A case with 20% PV generation is simulated in DSATools
• The effect of cloud cover is simulated in TSAT
19

Effect of Cloud Cover
0 10 20 30 40 50 60 70 801.03
1.035
1.04
1.045
1.05
1.055
1.06
1.065
1.07
Time (sec)
Volta
ge (p
.u.)
21.E1.0S 69.0ANDERSON 69.0ARCADIA1 69.0BRANDOW 69.0BROADWA2 69.0DOBSON 1 69.0FLUME 69.0INDIANB1 69.0KNOX 69.0KYRENEST 69.0OWENS 2 69.0RIVERSI2 69.0SANTAN 69.0SOUTHERN 69.0
20

Conclusions• High penetration of PV resources results in:
– Increase in steady state voltages– High voltages on 69 kV buses with 20% penetration level
(over voltages up to 10%)– Increased voltage dips during contingencies (e.g. 0.12 p.u.
more voltage dip)– Increased oscillations in relative rotor angles
• With motor loads the large voltage dips could lead to further worsening of voltage recovery
• Cloud cover affects the bus voltages and may cause a significant voltage drop depending on the cloud characteristics
21