impact of over-exploitation on groundwater quality: a case
TRANSCRIPT

Impact of over-exploitation on groundwater quality:A case study from WR-2 Watershed, India
Anil M Pophare1,∗, Bhushan R Lamsoge2, Yashwant B Katpatal3 and Vijay P Nawale4
1Department of Geology, RTM Nagpur University, Nagpur 440 001, India.2Central Ground Water Board, Nagpur 440 001, India.
3Visvesvaraya National Institute of Technology, Nagpur 440 010, India.4Geological Survey of India, Hyderabad, India.
∗Corresponding author. e-mail: [email protected]
The WR-2 watershed is located in the Deccan trap basaltic terrain of Maharashtra State, India. Thewatershed area incorporates a rich orange orchard belt that requires a huge quantity of water for irriga-tion. This requirement is mostly met through groundwater, extracted from the shallow aquifers of theWR-2 watershed. However, over the years, excess withdrawal of groundwater from these aquifers hasresulted in depletion of groundwater level. The declining trends of groundwater level, both long termand short term, have had a negative impact on the groundwater quality of the study area. This effectcan be gauged through the rising electrical conductivity (EC) of groundwater in the shallow aquifers(dug wells) of the WR-2 watershed. It is observed that the long term declining trend of groundwaterlevel, during 1977–2010, varied from 0.03 to 0.04 m per year, whereas the corresponding trend of risingEC varied from 1.90 to 2.94 µS/cm per year. During 2007–2010, about 56% dug wells showed a positivecorrelation between depleting groundwater level and rising EC values. The groundwater level depletionduring this period ranged from 0.03 to 0.67 m per year, whereas the corresponding trend of rising ECranged from 0.52 to 46.91 µS/cm per year. Moreover, the water quality studies reveal that groundwaterfrom more than 50% of the dug wells of the WR-2 watershed is not suitable for drinking purpose. Thegroundwater, though mostly suitable for irrigation purpose, is corrosive and saturated with respect tomineral equilibrium and shows a tendency towards chemical scale formation.
1. Introduction
Groundwater resources play a major role in thesocial and economic growth of any country. Ground-water overdraft, a form of ‘over-exploitation’,occurs when extraction exceeds both natural andinduced aquifer recharge over a long period. Adver-se effects of groundwater overdraft include, uneco-nomic pumping conditions, water quality degrada-tion through induced intrusion of saline or poorquality groundwater, flow reduction in streams,wetlands and springs, land subsidence, interference
with pre-existing water uses and water rights, andgradual depletion of groundwater storage. Consis-tent lowering of water table can dry up wells, drainsprings and wetlands, and turn perennial streamsinto desert washes (Sophocleous 2003; Zekster et al.2005; Harou and Lund 2008).
The global scenario of groundwater overdraftindicates that over-exploitation of groundwaterfrom the shallow aquifers has deteriorated its qual-ity. For example, in the alluvial Pleistocene wellsof Jericho area, Palestine, groundwater overdrafthas led to high salinity and high susceptibility to
Keywords. Groundwater; over-exploitation; groundwater quality; WR-2 watershed; India.
J. Earth Syst. Sci. 123, No. 7, October 2014, pp. 1541–1566c© Indian Academy of Sciences 1541

1542 Anil M Pophare et al.
contamination of groundwater sources due to anth-ropogenic influences of agricultural backflow andsewage effluent (Khayat et al. 2006). In the aquifersof Zakynthos Island, Ionian Sea, Greece, the totalabstraction of groundwater exceeded natural re-charge, during the last decade, resulting in salinewater intrusion and deterioration of groundwa-ter quality (Diamantopoulou and Voudouris 2008).The hydrographs and water quality trends for keyaquifers in Jordan indicate a strong relationshipbetween depleting water levels and deterioration,stemming from groundwater overdraft, point andnon-point source contamination from agriculture,industrial and domestic uses also being a majorproblem (El-Naqa and Al-Shayeb 2009). In theKerman province of SE Iran, over-exploitation ofgroundwater from the Sirjan watershed has ledto significant drop in groundwater level, at anaverage rate of 70 cm/year from 1984 to 2005.This has resulted in greater saltwater interface inthe freshwater aquifers and caused deterioration ofgroundwater quality in a major part of the Sirjanwatershed (Bagher and Rasoul 2010).
In India, over-development of groundwater re-sources resulted in water level depletion, shortagein water supply, worsening groundwater quality,and intrusion of saline water in coastal areas(Sivasankar et al. 2012). These factors have seri-ous implications on the environment and socio-economic conditions of the populace. About 85%of rural population and ∼50% of urban populationin India is directly dependent on groundwaterfor their drinking, domestic, and irrigation needs.Moreover, during the last few decades, the demandof groundwater as a reliable source for fulfillingthese requirements has increased manifold (CGWB2007). Thus, the increased need of water forvarious purposes has culminated in excessive with-drawal of groundwater from all sources beyondthe perennial yield of many watersheds. Theimpact of over-exploitation of groundwater resour-ces on its quantity and quality can be witnessedin many leading states, including Maharashtra,where the agricultural productivity has beendowngraded.
In Maharashtra, about 82% of the rural popula-tion is directly dependent on groundwater for irri-gation, drinking, and domestic purposes. The totalrechargeable fresh groundwater resources in thestate are computed as 35.79 billion cubic meters(BCM), whereas the net groundwater availabil-ity is to the tune of 33.91 BCM. The presentannual gross draft of groundwater in the state,for all purposes, is 17.00 BCM. Out of this about15.95 BCM of groundwater is used for irrigationpurposes and the rest for drinking and domesticuses. This quantum of groundwater for irrigationis extracted through 1.87 million abstraction
structures throughout the state. These structuresinclude 1.68 million dug wells (with mhot andpump sets) extracting 14.44 BCM of groundwaterand 0.19 million bore-wells extracting 1.51 BCMof groundwater, annually. There are totally 1531watersheds in Maharashtra and the groundwaterdevelopment has reached more than 100% in mostof these watersheds, as compared to groundwaterrecharge. This has resulted in depleting ground-water levels during either post or pre-monsoonseasons or both, such that out of the total, 66watersheds have been categorised as over-exploited(GEC 1997; CGWB 1998a, b, 1999; CGWB andGSDA 2005, 2009; Duraiswami 2007, 2008). Thisscenario demands an urgent need for sustainabledevelopment of groundwater resources in the stateand this requires an understanding of its origin andrenewability.
The present study was carried out in one suchover-exploited watershed ‘WR-2’, which is locatedin the basaltic terrain of the Eastern Deccan Vol-canic Province of Vidharbha region in Maharash-tra. The areal extent of the watershed incorpo-rates a rich orange orchard belt that requires ahuge quantity of water for irrigation. Due to lim-ited availability of surface water in this area, thegroundwater is extensively utilised for irrigation,domestic, and industrial purposes. Use of ground-water particularly for irrigation of orange cultiva-tion and other agricultural practices is quite ram-pant. This is increasing at an alarming proportiondue to the recent increase in the orange orchards inthis area, resulting in over-exploitation of ground-water and depletion of water level in the shallowaquifers. It has been observed that the ground-water draft is more than the natural recharge;hence these unconfined shallow aquifers are undercontinual stress of water level decline and over-exploitation. Groundwater development in WR-2watershed has reached 156%, leading to its cate-gorisation as over-exploited watershed (GEC 1997;CGWB 1998a, b, 1999; CGWB and GSDA 2005,2009). Moreover, the impact of over-exploitationof groundwater on its overall quality is quite sig-nificant, which is reflected by the rising electricalconductivity (EC) of groundwater in the dug wellsof the study area. Although, there are many waterconservation structures constructed in this areaby various Govt. agencies and non-governmentalorganisations (NGOs) for restoring the water level,the benefits of these structures do not reflecton the overall groundwater scenario of the studyarea (CGWB 2012). Hence, in order to study,ascertain, and correlate the depleting groundwaterlevels, due to over-exploitation, and its impact ondeteriorating groundwater quality, hydrogeologicaland hydrochemical investigations were carried outin the study area.

Impact of over-exploitation on groundwater quality 1543
2. Study area
The WR-2 watershed is located in the Warudtaluka of Amravati district, Maharashtra State,India. It extends for ∼30 km from north to southand ∼28 km from east to west and has an arealextent of about 632 km2 (figure 1). It is boundedby latitudes 21◦19′36′′: 21◦35′26′′ and longitudes78◦05′00′′: 78◦22′18′′, and is covered under the Sur-vey of India Topographical Sheet Nos. 55 K/2, 55K/3, 55 K/6 and 55 K/7. This watershed con-stitutes a part of Wardha river sub-basin and islocated along the surface water divide betweenWardha river sub-basin and Purna river sub-basin
(figure 2) (CGWB 1998a). It has a general slopeof ∼10–20 m per km, from north to south.
The WR-2 watershed is bounded by the Satpurahill ranges towards the north while Wardha riverflows along its southern boundary, from east towest. The watershed is mainly covered by a thickpile of Deccan Trap basaltic lava flows with associ-ated intertrappean sediments of Cretaceous–LowerEocene age and Wardha river alluvial deposits ofRecent to Quaternary age. The alluvium depositsoccur along the Wardha river course towards thesouthern part of the WR-2 watershed. They have athickness of about 10 to 30 m and consist of detritalmaterial like sand and silt with admixture of clay,
Figure 1. Location map of WR-2 watershed.

1544 Anil M Pophare et al.
Figure 2. Generalised geological map of WR-2 watershed with village/dugwell locations.
with a few kankers forming badland topography(figure 2). About 2-m thick black cotton soil withoccasional calcareous kankers envelop the basalticterrain of this watershed (CGWB 1998a). Thestudy area of WR-2 watershed falls under assuredrainfall zone with nearly 55 rainy days and an aver-age annual rainfall of 691mm. This area experi-ences subtropical to tropical temperate monsoonclimate (CGWB 1998a, 2010).
3. Methodology
In the WR-2 watershed area, the water require-ment of the local populace for irrigation anddomestic usage is met through dug wells located onthe phreatic shallow aquifers. These dug wells arehosted in jointed, fractured, vesicular, and weath-ered Deccan Trap basalts and Wardha river allu-vium deposits. Hence, during the present study,

Impact of over-exploitation on groundwater quality 1545
Table
1.W
ellinventory
andhyd
rogeologicaldata
ofthekeydugwells
ofW
R-2
watershed.
Dep
thof
Sl.
Dugwell
Altitude
Aquifer
Dep
thDiameter
weathering
Lifting
no.
no.
Village/location
Latitude
Longitude
(amsl)
lithology
(mbgl)
(m)
(mbgl)
Use
dev
ice
1DW
1Raw
ala
21◦ 3
4′ 21.6
′′78◦ 1
6′ 28.1
′′497.13
VB
13.65
2.60
5.10
IEP
2DW
2Satnur
21◦ 3
3′ 25.5
′′78◦ 1
7′ 47.9
′′464.52
JFMB
4.85
1.80
1.30
DEP
3DW
3Malkapur
21◦ 3
1′ 31.5
′′78◦ 1
7′ 45.6
′′437.70
FMB
15.50
3.00
3.70
DEP
4DW
4Tiw
saghat
21◦ 3
1′ 40.9
′′78◦ 1
6′ 21.2
′′432.21
Bouldary
14.70
1.90
1.40
IEP
5DW
5Jhatamziri
21◦ 3
2′ 21.2
′′78◦ 1
4′ 5.5
′′484.03
WB
17.85
4.00
2.00
IEP
6DW
6Shek
dari
21◦ 3
1′ 26′′
78◦ 1
1′ 38.2
′′502.62
WB
15.80
3.20
5.50
IEP
7DW
7Gahwankund
21◦ 3
0′ 21.7
′′78◦ 1
2′ 24.3
′′462.39
WB
13.40
2.75
3.20
IEP
8DW
8Tem
bukherda
21◦ 2
9′ 35.5
′′78◦ 1
4′ 29.2
′′456.60
MB
10.90
3.00
3.00
IEP
9DW
9Pusla
21◦ 2
9′ 11.8
′′78◦ 2
0′ 0.5
′′420.94
WVB
andJFMB
20.00
2.10
2.20
IEP
10
DW
10
Dhanodi
21◦ 2
8′ 41.2
′′78◦ 1
7′ 58.7
′′385.88
WVB
14.55
1.90
3.05
Inone
11
DW
11
Warud
21◦ 2
8′ 2.8
′′78◦ 1
5′ 24.5
′′408.75
FMB
14.10
2.45
5.10
DEP
12
DW
12
Bahada
21◦ 2
8′ 53.6
′′78◦ 1
2′ 17.1
′′443.79
WVB
15.15
2.50
2.80
IEP
13
DW
13
Manikpur
21◦ 2
8′ 20.9
′′78◦ 0
8′ 47′′
453.24
WVB
andJMB
12.10
2.20
2.70
DManual
14
DW
14
Ben
oda
21◦ 2
7′ 21.9
′′78◦ 1
1′ 18.2
′′415.75
VB
11.85
3.10
6.00
DEP
15
DW
15
Jarud
21◦ 2
7′ 15.8
′′78◦ 1
2′ 53′′
412.09
WB
26.80
2.10
5.60
IEP
16
DW
16
Surali
21◦ 2
6′ 47.4
′′78◦ 1
8′ 14.6
′′400.82
VB
10.72
4.25
3.83
DManual
17
DW
17
Chandas
21◦ 2
6′ 9.3
′′78◦ 2
0′ 45.3
′′388.63
RD
(Alluvium)
11.50
1.80
3.45
DManual
18
DW
18
Udapur
21◦ 2
4′ 47.6
′′78◦ 1
9′ 45.9
′′396.55
VB
17.40
2.25
5.25
IEP
19
DW
19
Chinch
argav
han
21◦ 2
4′ 50.2
′′78◦ 1
7′ 50′′
380.39
WVB
13.70
3.50
9.40
IEP
20
DW
20
Amdapur
21◦ 2
5′ 16.6
′′78◦ 1
6′ 7.1
′′401.73
FMB
17.06
2.65
3.40
IEP
21
DW
21
Davargaon
21◦ 2
5′ 37.6
′′78◦ 1
4′ 41.5
′′385.88
WB
andJMB
27.80
4.80
7.25
IEP
22
DW
22
Pim
palkhuta
21◦ 2
5′ 49.6
′′78◦ 1
2′ 26.4
′′400.51
WVB
16.80
4.50
5.70
IEP
23
DW
23
Goregaon
21◦ 2
5′ 25.6
′′78◦ 0
9′ 54.4
′′387.71
JW
B9.40
2.80
3.00
IEP
24
DW
24
Karajgaon
21◦ 2
4′ 27.1
′′78◦ 1
1′ 53.9
′′381.00
VB
6.95
1.50
1.65
DManual
25
DW
25
Mangruli
21◦ 2
4′ 12′′
78◦ 1
3′ 45.7
′′379.18
VB
21.50
3.60
9.70
IEP
26
DW
26
Wadegaon
21◦ 2
3′ 16.8
′′78◦ 1
6′ 12.2
′′388.02
FMB
19.15
3.20
2.90
IEP
27
DW
27
Wadala
21◦ 2
2′ 45.3
′′78◦ 1
7′ 41.3
′′367.59
Alluvium
27.00
4.50
14.30
IEP
28
DW
28
Gadegaon
21◦ 2
1′ 30.6
′′78◦ 1
5′ 21′′
377.04
WB
24.65
4.30
6.20
IEP
29
DW
29
Nandgaon
21◦ 2
1′ 31′′
78◦ 1
3′ 52.1
′′369.42
VB
14.35
2.90
9.80
IEP
30
DW
30
Loni
21◦ 2
2′ 34′′
78◦ 1
1′ 11.3
′′362.72
VB
andMB
22.00
1.10
3.10
DManual
31
DW
31
Mamdapur
21◦ 2
2′ 40′′
78◦ 0
7′ 43′′
344.12
WB
7.30
4.30
3.00
IDP
32
DW
32
Belona
21◦ 2
3′ 11.4
′′78◦ 0
6′ 1.6
′′349.61
WVB
14.70
3.00
6.05
IEP
33
DW
33
Jamalpur
21◦ 2
1′ 1.5
′′78◦ 0
8′ 59.2
′′340.47
WB
andJMB
6.90
3.30
–I
EP
34
DW
34
Haturna
21◦ 2
0′ 10.3
′′78◦ 1
3′ 47.4
′′365.76
Alluvium
25.85
3.40
–D
EP
DW
:Dugwell;VB:VesicularBasalt;MB:MassiveBasalt;W
B:Weathered
Basalt;JFMB:JointedandFracturedMassiveBasalt;RD:LocalRiver
Dep
osit;
I:Irrigation;D:
Drinking;EP:ElectricPump;DP:DieselPump.

1546 Anil M Pophare et al.
Table 2. DTWL and spot/field EC data from the key dug wells of WR-2 watershed.
Dugwell May Nov Jan May Aug Nov Jan May Aug Nov Jan May
no. Parameters 2007 2007 2008 2008 2008 2008 2009 2009 2009 2009 2010 2010
DW1 DTWL 12.5 7.65 10.80 12.05 11.10 11.70 10.30 Dry 9.50 6.20 10.60 11.25
EC 500 900 500 600 600 600 600 Dry 700 800 700 700
DW2 DTWL 3.85 2.90 3.30 3.90 2.95 3.40 4.50 7.80 3.05 2.85 5.10 5.35
EC 300 500 300 400 500 500 900 600 700 850 700 500
DW3 DTWL 15.15 6.10 10.20 7.95 4.50 6.50 8.60 12.70 4.80 5.00 8.80 9.10
EC 400 600 400 600 600 500 600 700 700 800 750 640
DW4 DTWL Dry Dry 7.40 12.35 10.35 10.65 11.50 14.6 9.40 6.20 12.35 13.85
EC NA NA NA 1300 1300 600 1200 1100 1300 1470 1200 640
DW5 DTWL 17.30 3.90 6.20 10.90 Dry 11.00 Dry Dry 10.35 8.80 Dry Dry
EC 300 600 300 500 NA 500 NA NA 600 620 NA NA
DW6 DTWL 8.48 6.50 8.40 8.10 7.60 6.80 9.80 15.10 5.50 6.40 11.25 13.3
EC 300 400 300 500 400 400 900 400 600 540 600 490
DW7 DTWL 9.55 5.30 4.50 7.54 8.80 7.90 9.50 11.8 11.25 10.20 9.65 10.20
EC 400 600 400 1100 600 500 600 600 600 550 600 570
DW8 DTWL 10.78 3.00 4.60 6.80 4.50 5.55 8.35 8.20 5.85 5.80 8.10 10.4
EC 1200 1600 1200 1500 1300 1400 1200 1100 1200 1400 1300 1190
DW9 DTWL Dry Dry 10.10 13.40 4.40 11.25 Dry 13.90 4.85 5.00 11.35 18.90
EC NA NA NA 600 400 700 NA 600 500 800 700 460
DW10 DTWL Dry Dry 11.2 11.8 10.3 12.9 13.45 14.6 10.95 10.45 11.7 12.25
EC NA NA NA 700 1000 900 900 800 1100 1200 1000 910
DW11 DTWL 13.10 8.80 9.80 11.55 10.20 10.50 11.20 13.90 12.30 10.60 11.77 14.00
EC 1300 400 1300 1100 600 1000 1200 1200 800 700 1100 1350
DW12 DTWL 12.65 3.80 6.55 9.50 7.90 8.60 11.20 Dry 11.80 7.80 12.35 14.10
EC 700 900 700 900 900 800 800 NA 900 960 900 830
DW13 DTWL Dry Dry 2.95 9.65 4.15 4.70 7.45 12.10 4.90 4.70 8.50 11.85
EC NA NA NA 700 800 700 700 700 900 790 800 740
DW14 DTWL 9.80 5.35 7.95 9.05 7.55 7.75 8.35 11.35 7.10 6.15 8.35 10.40
EC 1100 800 1100 700 700 500 600 600 700 640 600 650
DW15 DTWL 16.45 8.90 11.5 12.55 11.50 13.90 15.20 18.90 11.50 16.40 17.20 19.50
EC 1200 700 1200 600 700 700 800 700 800 830 700 670
DW16 DTWL 10.18 4.00 5.94 7.89 4.69 5.39 5.59 7.29 5.39 4.59 6.10 Dry
EC 800 1400 800 1600 1400 1200 1200 1500 1700 1120 1100 1072
DW17 DTWL 10.62 6.45 8.00 9.90 8.70 8.75 10.20 11.30 9.35 7.20 9.35 10.20
EC 700 1100 700 1200 1300 1200 1200 800 1300 1360 NA NA
DW18 DTWL 13.30 9.00 12.00 11.60 9.75 11.20 16.90 14.85 12.85 10.42 10.85 12.90
EC 500 800 500 800 800 800 800 700 700 850 800 830
DW19 DTWL Dry Dry 10.75 11.60 10.90 12.45 12.30 13.10 12.75 12.80 12.90 13.10
EC NA NA NA 1200 1100 1600 1000 1000 800 1030 1000 1100
DW20 DTWL 17.06 9.75 13.00 16.20 12.20 16.20 Dry 17.50 15.15 11.40 12.65 17.85
EC 600 1000 600 900 900 900 NA 1100 1000 910 950 1030
DW21 DTWL Dry Dry 21.37 21.55 19.30 20.40 21.70 23.00 24.85 25.10 25.25 26.00
EC NA NA NA 800 800 800 900 800 900 NA 800 830
DW22 DTWL Dry Dry 12.40 11.50 10.80 15.50 16.20 15.70 13.05 11.50 12.70 15.80
EC NA NA NA 700 700 600 600 600 700 700 700 740
DW23 DTWL Dry Dry 4.00 Dry Dry 6.70 Dry Dry Dry Dry Dry Dry
EC NA NA NA NA NA 600 NA NA NA NA NA NA
DW24 DTWL 3.75 3.02 4.50 4.30 3.10 3.60 4.15 5.05 4.25 3.95 4.15 4.40
EC 1600 1900 1600 1000 1600 1200 700 1100 1400 1500 1400 1350
DW25 DTWL 17.20 9.50 14.30 16.75 15.40 18.30 20.00 18.65 18.85 16.60 17.15 18.50
EC 1600 800 1600 1400 1000 1400 1700 1600 1300 1200 1300 1730
DW26 DTWL 9.90 9.40 9.75 9.90 9.45 9.60 10.00 11.40 10.25 9.50 10.15 10.85
EC 700 1100 700 1200 800 700 1000 800 900 680 700 850
DW27 DTWL Dry NA 22.45 22.40 21.10 23.75 23.80 24.50 23.50 23.00 23.15 23.90
EC NA NA NA 1000 900 1000 1000 1000 1100 1200 900 1060

Impact of over-exploitation on groundwater quality 1547
Table 2. (Continued.)
Dugwell May Nov Jan May Aug Nov Jan May Aug Nov Jan May
no. Parameters 2007 2007 2008 2008 2008 2008 2009 2009 2009 2009 2010 2010
DW28 DTWL 17.54 15.45 17.20 16.70 16.10 19.50 20.20 20.00 19.75 18.45 20.15 21.35
EC 600 1100 600 1100 1100 1100 1100 1100 1200 1150 1100 1080
DW29 DTWL 12.65 9.90 11.10 13.00 8.10 10.80 Dry 12.60 10.50 8.90 DRY 12.45
EC 1000 800 1000 700 800 700 NA 700 800 800 800 810
DW30 DTWL 19.85 13.20 14.30 17.25 13.80 14.50 16.40 20.50 17.80 16.80 19.20 21.80
EC 1100 1600 1100 1200 700 800 1400 1200 1000 1560 1100 1130
DW31 DTWL 4.70 2.55 3.05 4.05 2.95 3.50 3.70 5.55 4.80 3.40 4.10 5.40
EC 1500 600 1500 600 800 600 600 600 1000 870 700 690
DW32 DTWL Dry Dry 11.60 Dry 11.80 Dry Dry Dry 14.85 12.00 12.85 Dry
EC NA NA NA NA 1600 NA NA NA 1600 1740 NA NA
DW33 DTWL Dry Dry 1.90 2.25 0.70 2.50 3.00 3.75 2.00 1.80 2.60 3.70
EC NA NA NA 500 NA 500 900 500 NA 550 500 470
DW34 DTWL Dry Dry 15.70 16.80 16.65 16.70 17.85 19.80 18.20 17.45 18.70 20.30
EC NA NA NA 1200 1200 1200 1200 1000 1200 1300 1200 1230
totally 34 key dug wells, representing shallow aqui-fers and covering all the hydrogeological units ofWR-2 watershed were selected to study the gro-undwater regime and its quality, over the area of632 km2 (figure 2). The selected dug wells includetwo ‘Groundwater Monitoring Wells’ DW11 andDW30 of the Central Ground Water Board(CGWB) that are located at Warud and Loni vil-lages, respectively. The representative dug wellswere monitored for DTWL and spot/field EC fromJanuary 2007 to May 2010 on quarterly basis, i.e.,for the months of January, May (pre-monsoon),August (monsoon) and November (post-monsoon).This was carried out to verify the trends of DTWLand EC variation and its impact on groundwaterquality. Out of 34 dug wells, 32 were selected foranalysis due to continuity and availability of data.
The DTWL and spot/field EC data of CGWBrecorded at Warud (DW11) and Loni (DW30) vil-lages, during 1977–2010 (CGWB 2010) was utilisedto study the impact of long term over-exploitationof groundwater on its quality along with the datacollected from key dug wells, during present study.The well inventory data and hydrogeological detailsof these dug wells collected during present fieldinvestigations are shown in table 1, whereas theDTWL and EC data are presented in table 2.
Moreover, groundwater sampling from the keydug wells was carried out during pre-monsoonseason of 2008 (May 2008) for detailed hydro-chemical investigations. Totally 32 groundwatersamples were collected from representative dugwells, as two dug wells (DW23 and DW32) werefound dry during the sampling period. Physicalparameters of water samples like pH and spot ECwere measured in the field, immediately after thesampling, using portable EC meter. All standardprecautions, necessary for reliable estimation were
observed during field measurement. The accuracyof measurement was ± 0.1 units. The groundwatersamples after collection were subjected to determi-nation of hydrochemical parameters such as totaldissolved solids (TDS) and total hardness (TH)along with calcium (Ca), magnesium (Mg), sodium(Na), potassium (K), carbonate (CO3), bicarbonate(HCO3), chloride (Cl), sulphate (SO4), nitrate (NO3)and fluoride (F) ions. The sampling, preservation,and analytical techniques used are as per the re-puted laboratories for analysis of groundwatersamples and American Public Health Association(APHA) manual of ‘Standard Methods for Exami-nation of Water and Wastewater’ (Handa 1981;NEERI 1986; APHA 1998). The accuracy of chem-ical data for major ions is estimated from the elec-tro neutrality condition (Rossum 1975; Friedmanand Erdmann 1982; Appelo and Postma 1993).The specific analysis for identification of pesticidesand fertilizers was not carried out; hence, the risksassociated with it to human being are not included.
Spot/field EC is selected for assessment ofgroundwater quality as it represents total ionic con-tent in water. It indicates the extent of minerali-sation in groundwater and generally increases withcontamination, flow, and residence time of water inthe aquifers. It is one of the important parametersthat reflect even minor changes in the quality ofgroundwater from shallow aquifers (Deutsch 1997;Madnure et al. 2007).
4. Hydrogeology
About 91.27% (577 km2) area of the WR-2 water-shed is covered by Deccan trap basaltic lava flowsand the rest of the area, about 8.72% (55 km2),by Wardha river alluvium. The basaltic lava flows

1548 Anil M Pophare et al.
have two hydrogeological units, viz., a vesicularunit confined to the upper part and a massiveunit restricted to the lower part of the flow. Thevesicular units possess interconnected vesicles thatprovide pore spaces for storage and movement ofgroundwater and acts as a good aquifer, particu-larly at shallow depth. Whereas, the lower massiveunit is hard, compact, and has less primary po-rosity and permeability. Groundwater occurs underphreatic conditions in the exposed vesicular lavaflows and in semi-confined state in the jointedand fractured portions of massive subsurface flows.The alluvial deposits are unevenly distributed and
restricted to the banks of Wardha river. The coar-ser detrital material occurring as lenses forms goodwater bearing strata in alluvium. Whereas, finerclayey and silty material has poor permeability anddoes not permit movement of groundwater. Thegroundwater occurs under phreatic conditions insandy layers.
The availability of groundwater is extremelyuneven, both spatially and temporally. The unevendistribution of groundwater can be attributed toheterogeneous lithology of the aquifers and unevendistribution of rainfall (CGWB and GSDA 2005).The shallow groundwater, tapped by large diameter
Figure 3. (a). DTWL vs. time plot of groundwater monitoring dug well of Warud (DW11) during 1977–2009. (b) Longterm EC vs. time plot of groundwater monitoring dug well of Warud (DW11) during 1981–2008.

Impact of over-exploitation on groundwater quality 1549
shallow dug wells, is the most important source ofwater, especially in the large rural tracts of thestudy area. The groundwater movement in thestudy area is mainly controlled by topography,drainage pattern, and structural controls over thearea. The groundwater flow direction is towards thesouth which ultimately converges into the Wardhariver.
In the WR-2 watershed, the depth of dugwells varies from 4.85 to 27.80mbgl (meters belowground level), whereas their diameter varies from1.10 to 4.80 m (table 1). However, at places aroundJarud, Davergaon, Mangruli, Wadala, Gadegaon,Loni and Haturna villages, the dug well depth
varies from 20 m bgl to maximum 30 m bgl, pierc-ing the entire unconfined phreatic aquifer. Thismay be due to deeper DTWL and prevailing localhydrogeological conditions. The depth of weather-ing in WR-2 watershed was estimated from thedepth of curbing in the existing dug wells, well sec-tions of open wells, and borehole logs. The depthof weathering ranges from 1.30 to 14.30 m bgl(table 1) and in general, increases from north tosouth, i.e., in the direction of general ground slope.In the central part of WR-2 watershed aroundJarud–Warud villages, the depth of weathering isrelatively high as compared to the surroundingareas. Dug well density and agricultural activity
Figure 4. (a). DTWL vs. time plot of groundwater monitoring dug well of Loni (DW30) during 1989–2010. (b) Long termEC vs. time plot of groundwater monitoring dug well of Loni (DW30) during 1989–2009.

1550 Anil M Pophare et al.
are also relatively more in and around Jarud–Warud areas. However, along the northern bankof Wardha river the thickness of weathered andporous zone in dug well sections is high as thesewells are mostly hosted in alluvium (figure 2).The depth of weathering in Deccan Trap basaltand alluvium area is controlled by the natureof lithology, intensity of fracturing, and joints,etc.
4.1 Trends of water level and water quality
The long term depth to water level (DTWL)trend recorded at the ‘Groundwater MonitoringWells’ of CGWB at Warud (DW11) during 1977–2009, and Loni (DW30) during 1989–2010 shows adecline of 0.03 and 0.04 m per year, respectively.The corresponding trend of EC shows rise of 1.90and 2.94 µS/cm per year, respectively in thesedug wells, over the same period (CGWB 2010)(figures 3a, 3b, 4a and 4b).
The short term (2007–2010) DTWL and ECtrends, recorded in the dug wells of the study area,reveal that during pre-monsoon seasons of 2007–2010, DTWL varied from 2.25 to 26 m bgl andcorresponding spot/field EC ranged from 300 to1730 µS/cm, respectively. Whereas, during post-monsoon seasons of 2007–2009, the DTWL variedfrom 1.8 to 25.1 m bgl and spot/field EC variedfrom 400 to 1900 µS/cm, respectively (table 2).
During monsoon season (August) of 2008–2009, the DTWL varied from 0.7 to 24.85mbgland corresponding spot/field EC ranged from400 to 1700µS/cm, respectively. Whereas, duringJanuary months of 2008–2010, the DTWL variedfrom 1.9 to 25.25 m bgl and corresponding ECranged from 300 to 1700 µS/cm, respectively, inthe dug wells of the study area (table 2).
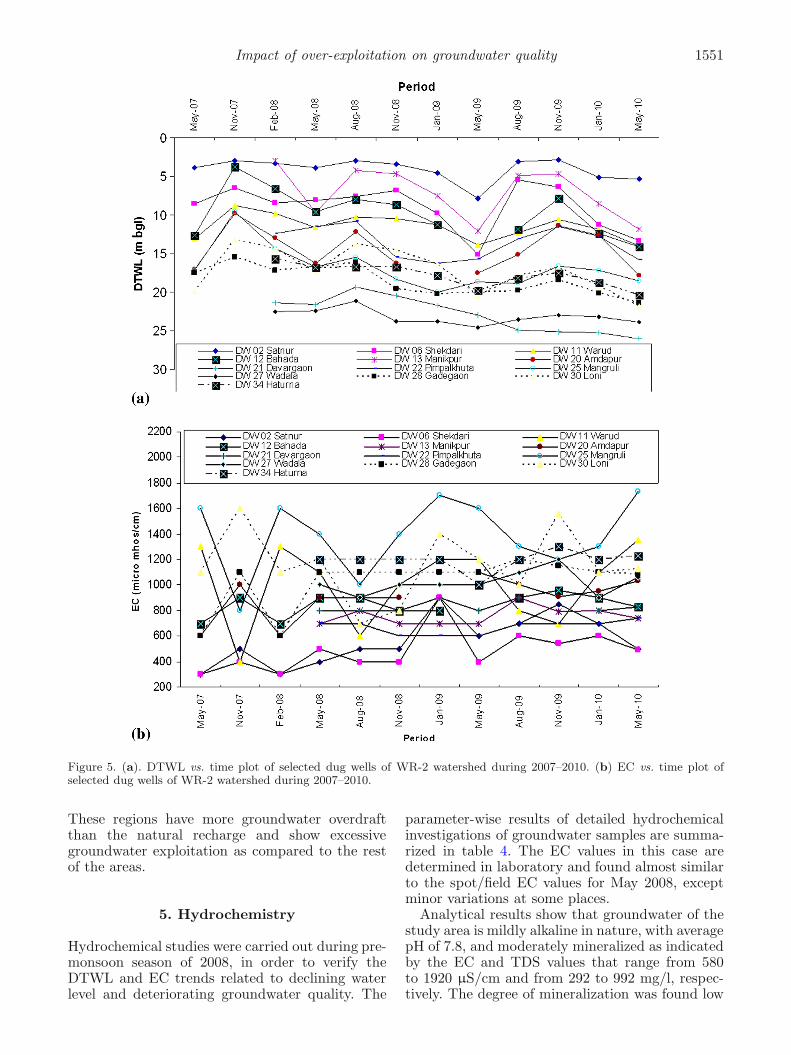
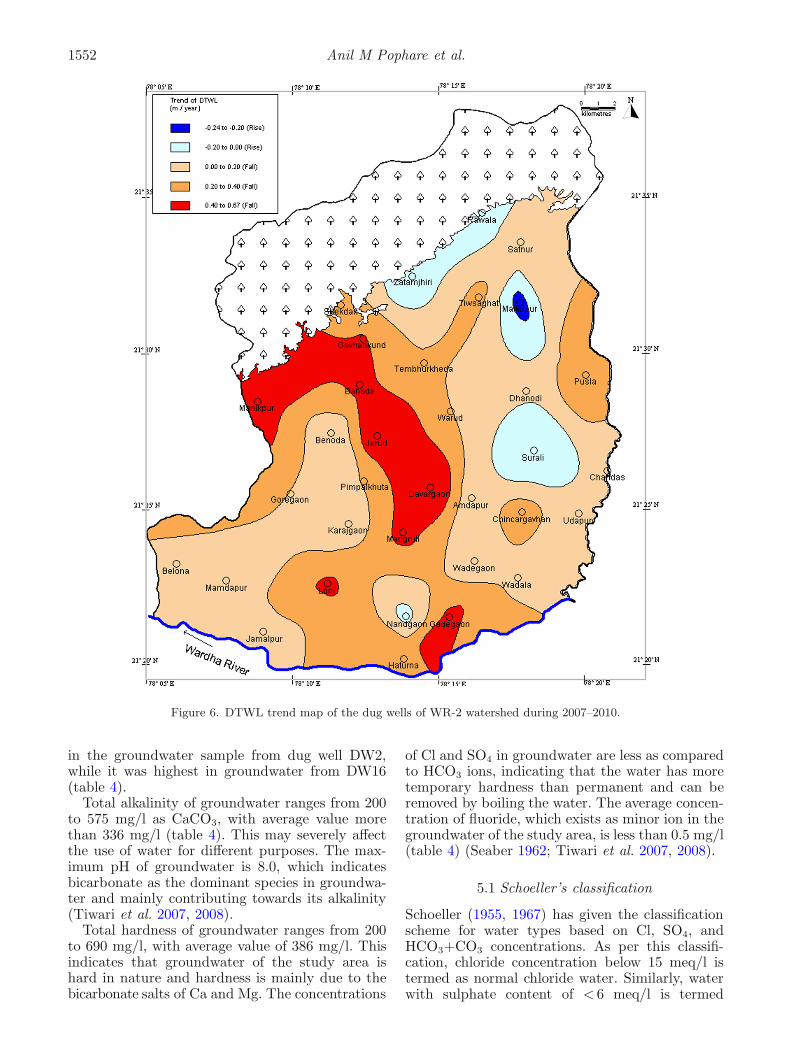
The data thus collected indicate that irrespec-tive of the sampling seasons DTWL show declin-ing trend and EC show rising trend in the dugwells of the study area and about 18 dug wellsout of the total (i.e., 56% dug wells) show pos-itive correlation between decline of DTWL andrise in EC values (tables 2 and 3). The decliningtrend of DTWL ranged from 0.03 to 0.67 m peryear, whereas the corresponding rising spot/fieldEC trend ranged from 0.52 to 46.91 µS/cm peryear, respectively, during 2007 to 2010 (table 3).The graphical presentation of correlation betweenDTWL, EC and time for the representative dugwells of DW2, DW6, DW11, DW12, DW13, DW20,DW21, DW22, DW25, DW27, DW28, DW30 andDW34 are shown in figure 5(a and b). The DTWLand EC variation trend maps for the period of2007–2010 are presented in figures 6 and 7. Thevariation in long term and short term waterlevel trends may be due to variation in natural
Table 3. Correlation between declining DTWL and risingspot/field EC trends during 2007–2010 in the dug wells ofWR-2 watershed.
Dugwell Trend of water Trend of spot EC
no. level (m/year)* (µS/cm/year)* Correlation
DW1 −0.1276 11.25 −0.81
DW2 0.1558 35.14 0.11
DW3 −0.2367 26.89 −0.45
DW4 0.2221 −18.33 −0.49
DW5 −0.1083 26.39 −0.41
DW6 0.3296 22.97 0.05
DW7 0.4033 1.82 0.01
DW8 0.2072 −12.97 −0.58
DW9 0.3174 7.56 −0.07
DW10 0.0291 27.33 −0.65
DW11 0.202 11.01 0.64
DW12 0.4306 10.97 −0.17
DW13 0.4852 9.00 −0.49
DW14 0.0813 −35.56 0.00
DW15 0.5622 −25.59 −0.06
DW16 −0.1817 11.65 −0.27
DW17 0.0783 46.91 −0.34
DW18 0.0994 18.46 −0.24
DW19 0.2512 −34.00 −0.23
DW20 0.1138 26.45 0.04
DW21 0.6741 3.20 0.26
DW22 0.21 7.67 −0.59
DW24 0.0686 −27.80 −0.53
DW25 0.4238 16.54 0.71
DW26 0.082 −11.50 −0.03
DW27 0.1682 12.33 0.32
DW28 0.4217 33.67 0.29
DW29 −0.0271 −11.14 0.01
DW30 0.4115 0.52 0.03
DW31 0.1253 −38.53 −0.02
DW33 0.1418 −10.92 0.00
DW34 0.3948 5.33 −0.40
*Positive values indicate declining DTWL and rising ECtrends.
recharge, rainfall, and excessive withdrawal ofgroundwater.
Moreover, the long term (1977–2010) and shortterm (2007–2010) record of the DTWL andspot/field EC in the dug wells of the study areaindicate that the decline in DTWL is directlyproportional to the rising EC values. The declin-ing DTWL trend indicates progressive scarcity ofgroundwater, whereas rising EC values indicatedeterioration of the groundwater quality in the dugwells of phreatic shallow aquifers of WR-2 water-shed. This is reflected in terms of higher concen-tration of Ca, Mg, TDS, and TH in the groundwa-ter of the study area. Moreover, the DTWL datashow that the areas in the central and southernparts of WR-2 watershed have deeper DTWL andare more susceptible to groundwater exploitation.
Impact of over-exploitation on groundwater quality 1551
Figure 5. (a). DTWL vs. time plot of selected dug wells of WR-2 watershed during 2007–2010. (b) EC vs. time plot ofselected dug wells of WR-2 watershed during 2007–2010.
These regions have more groundwater overdraftthan the natural recharge and show excessivegroundwater exploitation as compared to the restof the areas.
5. Hydrochemistry
Hydrochemical studies were carried out during pre-monsoon season of 2008, in order to verify theDTWL and EC trends related to declining waterlevel and deteriorating groundwater quality. The
parameter-wise results of detailed hydrochemicalinvestigations of groundwater samples are summa-rized in table 4. The EC values in this case aredetermined in laboratory and found almost similarto the spot/field EC values for May 2008, exceptminor variations at some places.
Analytical results show that groundwater of thestudy area is mildly alkaline in nature, with averagepH of 7.8, and moderately mineralized as indicatedby the EC and TDS values that range from 580to 1920 µS/cm and from 292 to 992 mg/l, respec-tively. The degree of mineralization was found low
1552 Anil M Pophare et al.
Figure 6. DTWL trend map of the dug wells of WR-2 watershed during 2007–2010.
in the groundwater sample from dug well DW2,while it was highest in groundwater from DW16(table 4).
Total alkalinity of groundwater ranges from 200to 575 mg/l as CaCO3, with average value morethan 336 mg/l (table 4). This may severely affectthe use of water for different purposes. The max-imum pH of groundwater is 8.0, which indicatesbicarbonate as the dominant species in groundwa-ter and mainly contributing towards its alkalinity(Tiwari et al. 2007, 2008).
Total hardness of groundwater ranges from 200to 690 mg/l, with average value of 386 mg/l. Thisindicates that groundwater of the study area ishard in nature and hardness is mainly due to thebicarbonate salts of Ca and Mg. The concentrations
of Cl and SO4 in groundwater are less as comparedto HCO3 ions, indicating that the water has moretemporary hardness than permanent and can beremoved by boiling the water. The average concen-tration of fluoride, which exists as minor ion in thegroundwater of the study area, is less than 0.5 mg/l(table 4) (Seaber 1962; Tiwari et al. 2007, 2008).
5.1 Schoeller’s classification
Schoeller (1955, 1967) has given the classificationscheme for water types based on Cl, SO4, andHCO3+CO3 concentrations. As per this classifi-cation, chloride concentration below 15 meq/l istermed as normal chloride water. Similarly, waterwith sulphate content of < 6 meq/l is termed

Impact of over-exploitation on groundwater quality 1553
Figure 7. EC trend map of the dug wells of WR-2 watershed during 2007–2010.
as normal sulphate water (Schoeller 1955, 1967;Freeze and Cherry 1979; Hem 1985).
During pre-monsoon season of 2008, chlorideconcentration in groundwater samples of the studyarea is < 15 meq/l, indicating normal chloridewater. Differentiation of SO4 concentration indi-cates the groundwater as normal sulphate water, asSO4 < 6 meq/l and differentiation of HCO3+CO3
concentration indicates it as sulphate carbonatewaters, as HCO3+ CO3 > 7 meq/l (Schoeller 1955,1967). The concentrations of major ions expressedin meq/l are graphically presented using Schoeller’sdiagram (figure 8). This shows that concentrationof Ca exceeds that of Mg followed by Na amongstthe cations, while HCO3 ion has higher concentration
than Cl followed by NO3 and SO4 in the ground-water samples of the study area.
5.2 Piper’s diagram
The trilinear diagram of Piper (1944) is very use-ful in bringing out chemical relationships amonggroundwaters in more definite terms (Walton1970). The geochemical classification of groundwa-ter of the study area was carried out by subjectingthe samples to graphical treatment and plottingthem on Piper’s trilinear diagram (Piper 1944,1953) (figure 9). Piper’s diagram indicates thatgroundwater of the study area is predominatelyof Ca–HCO3 type and represents characteristics of

1554 Anil M Pophare et al.
Table 4. Chemical analysis of groundwater samples from dug wells of WR-2 watershed for pre-monsoon season of 2008.
Dugwell EC TDS TH TA Ca Mg Na K HCO3 Cl SO4 NO3 F
no. pH (µS/cm) (mg/l)
DW1 7.9 800 402 360 315 70 45 16.3 0.2 384 21 30 27 0.62
DW2 7.9 580 292 245 260 64 21 19.3 0.3 317 11 14 2.8 0.79
DW3 7.9 680 374 295 230 86 19 17.2 0.8 281 32 8 70 0.35
DW4 7.4 1390 850 625 230 156 57 29 0.9 281 113 108 246 0.35
DW5 7.9 690 341 300 320 72 29 19.7 1 390 14 5.8 3.9 0.51
DW6 7.6 590 303 250 245 56 27 19.7 0.6 299 11 16 23 0.58
DW7 7.5 630 332 265 235 64 26 21 1.4 287 32 21 23 0.52
DW8 7.6 1610 928 625 330 124 77 78 0.6 403 184 42 220 0.56
DW9 7.6 640 356 235 200 64 18 37 0.4 244 39 32 43 0.70
DW10 7.7 840 460 370 260 90 35 22 0.9 317 64 12 78 0.26
DW11 7.9 1350 740 535 395 114 61 61 1 482 106 42 113 0.39
DW12 7.5 950 524 420 255 90 47 24 0.2 311 74 39 93 0.31
DW13 7.9 920 490 390 325 78 47 28 4.5 397 43 31 59 0.34
DW14 7.5 680 362 305 220 80 26 14.7 0.4 268 57 20 30 0.12
DW15 7.6 770 412 325 265 72 35 26 0.3 323 32 29 56 0.26
DW16 8.0 1920 992 690 575 160 70 112 9.1 702 262 5.2 22 0.37
DW17 7.6 1530 823 375 570 92 35 161 9.6 696 121 18 38 0.43
DW18 7.8 970 490 330 420 40 56 69 1.2 512 21 14 32 0.18
DW19 7.8 1210 652 450 430 54 77 67 0.7 525 46 10 135 0.29
DW20 7.7 1120 602 390 410 56 61 69 0.6 500 53 13 98 0.41
DW21 7.9 1010 515 395 410 54 63 46 0.3 500 35 11 55 0.31
DW22 7.8 800 418 265 340 46 36 56 1.1 415 21 4 45 0.50
DW23 Dry
DW24 8.0 1180 627 410 405 80 51 80 0.7 494 85 15 68 0.34
DW25 7.6 1470 800 540 340 76 85 88 0.3 415 199 21 122 0.28
DW26 7.8 1440 774 605 240 168 45 47 4.4 293 291 58 14 0.45
DW27 7.8 1120 602 240 430 46 30 142 1.2 525 57 8 56 0.23
DW28 7.7 1190 630 395 400 54 63 84 0.9 488 89 12 82 0.09
DW29 7.7 700 378 290 245 60 34 23 0.9 299 32 9 70 0.57
DW30 7.9 1400 778 545 350 88 79 67 2.1 427 128 44 156 0.48
DW31 7.8 650 352 285 235 60 33 18.5 0.2 287 25 8 64 0.72
DW32 Dry
DW33 7.8 670 337 200 315 36 27 54 6.6 384 14 5.2 1.2 0.90
DW34 7.9 1390 720 410 550 46 72 126 0.3 671 64 18 58 0.25
Minimum 7.4 580 292 200 200 36 18 14.7 0.2 244 11 4 1.2 0.09
Maximum 8.0 1920 992 690 575 168 85 161 9.6 702 291 108 246 0.90
Average 7.8 1028 552 386 336 78 46 54 1.7 410 74 23 69 0.50
groundwater from basaltic aquifers. Few samplesfall in the category of mixed type of water. Thealkaline earths (Ca+Mg) exceed alkalis (Na+K)and weak acids (CO3+HCO3) exceed strong acids(Cl+SO4+NO3) in a majority of groundwatersamples. However, alkalis (Na+K) exceed alkalineearths (Ca+Mg) in the water sample from dug wellDW17, while strong acid (Cl+SO4+NO3) exceedsweak acid (CO3+HCO3) in the groundwater sam-ples from dug wells DW4, DW8, DW25, DW26 andDW30.
This change in type of groundwater of the studyarea may be attributed to the influence of surfaceactivities. Percolation of waste/wastewater fromthe surface rich in alkalis and strong acids mighthave caused such changes in groundwater. Ions
such as Cl and NO3 usually do not take activepart in the processes occurring during circulationand get directly added to groundwater. Possibilitiesof cation exchange increases when resident time ofwater is more, leading to strong water–rock inter-action. However, in shallow aquifers of the studyarea, groundwater is under constant circulationand regularly gets recharged. Hence, possibilitiesof ion exchange during the circulation are negligi-ble (Back 1966; Deutsch 1997; Saini et al. 2006;Pophare and Dewalkar 2007).
5.3 Index of base exchange
Control on the dissolution of undesirable con-stituents in water is impossible during subsurface

Impact of over-exploitation on groundwater quality 1555
Figure 8. Schoeller’s classification of the groundwater samples of the study area (after Schoeller 1955, 1967).
Figure 9. Chemical classification of groundwater samples from dug wells of the study area, average data of pre-monsoonseason of 2008 (after Piper 1944, 1953).

1556 Anil M Pophare et al.
Table 5. Choloro-alkaline indices in the groundwater samples of the study area.
Dugwell no. CAI-I CAI-II
DW1 −0.62 0.49
DW2 −2.42 0.16
DW3 0.05 0.77
DW4 2.78 3.06
DW5 −1.84 0.26
DW6 −2.50 0.15
DW7 −0.15 0.73
DW8 4.53 4.87
DW9 −0.38 0.80
DW10 1.26 1.66
DW11 2.09 2.73
DW12 1.58 1.94
DW13 0.11 1.05
DW14 1.20 1.48
DW15 −0.36 0.73
DW16 6.69 6.95
DW17 1.28 2.82
DW18 −4.53 0.26
DW19 −0.97 1.03
DW20 −0.53 1.19
DW21 −1.05 0.77
DW22 −3.57 0.27
DW24 0.93 2.03
DW25 4.92 5.19
DW26 7.93 7.85
DW27 −2.26 0.96
DW28 1.04 2.12
DW29 −0.23 0.74
DW30 2.78 3.32
DW31 −0.45 0.57
DW33 −5.99 0.00
DW34 −1.24 1.36
run off. However, it is essential to understand var-ious changes that groundwater undergoes duringits circulation (Pojasek 1977; Johnson 1979). Themechanism of ion exchange between groundwaterand its host environment during residence or cir-culation can be understood by the study of chloro-alkaline indices CAI-I: Cl–(Na+K)/Cl and CAI-II: Cl–(Na+K)/SO4+HCO3+CO3+NO3 (Schoeller1955, 1967).
The chloro-alkaline indices can be either posi-tive or negative depending on whether exchangeof Na and K is from water with Mg and Ca inrock or vice-versa. Positive values of the ratiosindicate a base-exchange reaction (chloro-alkalineequilibrium) and negative values indicate chloro-alkaline disequilibrium and the reaction as acation–anion exchange reaction (Sreedevi 2004).The chloro-alkaline indices of groundwater sam-ples from the study area indicate that 47% (15samples) show positive CAI-I ratio, whereas, 53%
(17 samples) show negative CAI-I ratio. However,all the groundwater samples of the study area showpositive CAI-II ratio indicating that chloro-alkalineequilibrium exists in the groundwater of the studyarea (table 5).
5.4 Gibbs diagram
Gibbs (1970) proposed a diagram to understandthe mechanism controlling groundwater chemistryand the relationship of chemical componentsof waters from their respective aquifer litholo-gies. This diagram is based on Gibbs ratio I:(Cl/Cl+HCO3) for anions and ratio II: (Na+K)/(Na+K+Ca) for cations of water samples andconsists of three distinct fields, viz., precipita-tion dominance, evaporation dominance, and rockdominance. Gibbs ratio-I and II, calculated for thegroundwater samples of the study area plot sepa-rately against respective values of TDS and showrock dominance over the majority of groundwa-ter samples, indicating interaction between aquiferlithology and groundwater (figure 10).
In WR-2 watershed, basalt is the main waterbearing formation. These rocks are usually com-posed of chain silicates, pyroxene (partly amphi-bole), and feldspar group of minerals. The disso-lution of these minerals mainly yields Ca, Mg andNa ions to groundwater (Plummer and Back 1980;Katz and Choquette 1991; Pawar 1993; Pawar andNikumbh 2007). The probable chemical reactionsduring water–rock interaction are as under:
CaAl2Si2O8
Anorthite+H2O+2H+ = Al2Si2O5 (OH)4
Kaolinite+Ca++
(1)
5Mg2SiO4
Olivine+8H+ + 2H2O= Mg6 (OH)8 Si4O10
Serpentine
+ 4Mg++ +H4SiO4 (2)
CaMgFeAl2Si3O12 (s)Pyroxene
+5H2O+ 6CO2
= Al2Si2O5 (OH)4 (s)Kaolinite
+Ca++ +Mg++
+ Fe++ + 6HCO−3 + SiO2 (3)
2NaAlSi2O8
Albite+9H2O+ 2H+
= Al2Si2O5 (OH)4Kaolinite
+ 2Na+ + 4H4SiO4 (4)
Concentration of HCO3 ion in groundwater ismainly influenced by the amount of CO2 dissolved

Impact of over-exploitation on groundwater quality 1557
Figure 10. Mechanisms controlling chemistry of groundwater during pre-monsoon season of 2008. (a) Evaporationdominance and (b) precipitation dominance (after Gibbs 1970).
in water from atmosphere and decay of organicmatter. The concentration of K in groundwaterof basaltic aquifer is generally very low. It is lib-erated with great difficulty from K-feldspars asthese minerals are very resistant to the attackby water. Potassium has a strong tendency to bereincorporated into the solid weathering product(Tardy 1971; Pedro and Siefferman 1979; Pawarand Nikumbh 2007). In basalts, there is no appar-ent source of Cl, SO4 and NO3. The groundwaterin basaltic terrain of the study area which is rich inthese ions is indicative of anthropogenic contam-ination (Weijden and Pacheco 2006; Tiwari et al.2007, 2008).
6. Quality of groundwater for drinkingand irrigation purposes
The groundwater quality assessment for drinkingpurpose was carried out based on the drinkingwater standards prescribed by Bureau of IndianStandards (BIS 2003) for various parameters and issummarized in table 6. It is observed that pH andconcentrations of parameters such as SO4 and F ingroundwater are within the desirable limits andhave less impact on the quality of groundwater.The potability of groundwater is mainly affectedby the parameters like TA, Ca, Mg, TH, NO3 andTDS, as more than 50% of dug well waters haveconcentrations of these parameters beyond thedesirable limits for drinking purpose (table 6).However, the groundwater of four dug wells DW4,DW8, DW16 and DW26 cannot be utilised fordrinking purpose as it has crossed the maximum
permissible limit of 600 mg/l for TH, in absence ofalternate source. The groundwater in 19 dug wells,classified under the parameter NO3 is also notsuitable for drinking purpose as there is no relax-ation under maximum permissible limit in case ofalternate source (table 6).
The field observations during the present studyhave indicated that anthropogenic activities likeopen unlined sewerages, improper disposal of cowdung for manure in the vicinity of groundwatersampling source, excessive use of fertilizer in agri-culture field for orange cultivation, etc., are themain reasons for nitrate contamination in ground-water of the study area. These observations sug-gest that overall, the groundwater of the studyarea, in more than 50% dug wells is not suitablefor drinking purpose (table 6). This indicates thatthe water quality deterioration in the study areais due to groundwater overdraft and point to non-point source contamination from agriculture anddomestic uses.
Overlay analysis has been carried out usingweighted average method in GIS software (Mapinfo6.5) to identify the risk associated with the ground-water from a particular dug well. This methodallows analysis of geospatial data, where the vectorparameters overlay by using simple statistical cor-relation. Logically the weights were assigned as ‘1’to each parameter, viz., EC, Ca, Mg, NO3, TDS,TA and TH of groundwater from each dug well.The cumulative weighted layer was derived at theend and categorized in six zones (table 7, figure 11).
The suitability of groundwater for irrigation pur-pose is examined using EC, percent sodium (%Na),sodium adsorption ratio (SAR), soluble sodium

1558 Anil M Pophare et al.
Table 6. Classification based on BIS drinking water standards (after BIS 2003).
Desirable Dug wells in which the groundwater Total no. of
Parameters limit exceeding desirable limit such dug wells
pH 6.5–8.5 Nil Nil
TDS (mg/l) 500 DW4, DW8, DW11–12, DW16–17,
DW19–21, DW24–28, DW30, DW34 16
TA as CaCO3 (mg/l) 200 DW1–8, DW10–22, DW24–31, DW33–34 31
TH as CaCO3(mg/l) 300 DW1, DW4, DW8, DW10–21, DW24–26, 21
DW28, DW30, DW34
Ca (mg/l) 75 DW3–4, DW8, DW10–14, DW16–17, 14
DW24–26, DW30
Mg (mg/l) 30 DW1, DW4, DW8, DW10–13, DW15–22, 23
DW24–26, DW28–31, DW34
Cl (mg/l) 250 DW16, DW26 2
SO4 (mg/l) 200 Nil Nil
NO3(mg/l) 45 DW3–4, DW8, DW10–13, DW15, 19
DW19–21, DW24–25, DW27–31, DW34
F (mg/l) 1.0 Nil Nil
Table 7. Categorisation of dug wells based on risk associated to human health in WR-2 watershed.
Resultant Total dug
Category of risk assigned weight wells Dugwell numbers
Very high risk dug wells 8 1 DW27
High risk dug wells 7 2 DW24, DW34
Severe risk dug wells 6 6 DW8, DW17, DW20, DW25, DW28, DW30
Moderate high risk dug wells 5 7 DW4, DW11, DW12, DW16, DW19, DW21, DW26
Moderate risk dug wells 4 4 DW10, DW13, DW18, DW22
No risk dug wells >4 14 DW5, DW7, DW23, DW32, DW2, DW6, DW1, DW3,
DW9, DW14, DW15, DW29, DW31, DW33
percentage (SSP), residual sodium carbonate(RSC), Kelly’s ratio (KR), magnesium ratio (MR),corrosivity ratio (CR), and permeability index(PI) values of the groundwater samples (tables 8and 9). The level of salinity hazard based on EC,and sodium hazard based on SAR value is assessedusingUSSalinity diagram (USSL 1954) (figure 12).
6.1 Per cent sodium (%Na)
Percent sodium parameter in groundwater is com-puted to evaluate its suitability for irrigation(Wilcox 1948, 1955). Excess Na combining withcarbonate will lead to formation of alkaline soils,while Na with Cl forms the saline soils. Either ofthe soils do not support growth of crops (Sreedevi2002; Pandian and Sankar 2007). As per theBureau of Indian Standards, Na up to 60% ingroundwater is permissible for irrigation purpose(BIS 2003). %Na is calculated by the followingformula using values in meq/l:
%Na =
[Na
Ca + Mg + Na + K
]×100. (5)
In groundwater samples of the study area, %Nain 50% samples is within excellent category, 41%in good category, while only 9% samples are fallingin permissible category (table 9).
6.2 Sodium absorption ratio (SAR)
Suitability of groundwater for agricultural purposeis determined by SAR, as it is responsible forsodium hazard (USSL 1954, 1973). Sodium andsalinity hazards are the two important parameters,which can indicate suitability of water for irriga-tion usage (Sreedevi 2002). SAR is calculated bythe following formula using values in meq/l:
SAR =Na√
(Ca +Mg)/2. (6)
In groundwater samples of the study area SARvalues indicate that all the samples fall in C2-S1and C3-S1 category and are suitable for irrigationpurposes (table 9, figure 12) (USSL 1954, 1973).
Possibility of sodium hazard to the soil is low(S1) as SAR values of groundwater samples from

Impact of over-exploitation on groundwater quality 1559
Figure 11. Groundwater quality and risk zone map of WR-2 watershed.
all the dug wells are less than 10 (table 8). Thelow SAR values in the area are due to the lowconcentration of sodium in groundwater as com-pared to the alkaline earth, i.e., Ca and Mg ions.However, EC values of most of the samples fallunder the category of medium (C2) and high(C3) salinity hazard zone indicating that specialcrop and water management practices are requiredfor utilizing such water for irrigation purpose(figure 12).
6.3 Soluble sodium percentage (SSP)
Sodium by the process of base-exchange replacescalcium in the soil, which in turn lowers soil
permeability. SSP for water samples was calculatedby the following formula using values in meq/l:
SSP =Na × 100
Ca + Mg + Na. (7)
In groundwater samples of the study area, about97% samples are suitable for irrigation while only3% samples fall in unsuitable category (table 9).
6.4 Residual sodium carbonate (RSC)
RSC is the CO3 and HCO3 amount in alka-line earths chiefly Ca and Mg, in excess of per-missible limits, which affects irrigation adversely

1560 Anil M Pophare et al.
Table 8. %Na, SAR, SSP, RSC, KR, MR, CR and PI in groundwater samples of the study area.
Dugwell no. %Na SAR SSP RSC KR MR CR PI
DW1 8.95 0.37 8.96 −0.91 0.10 51.41 0.63 40.67DW2 14.53 0.53 14.55 0.27 0.17 35.07 0.33 54.07DW3 11.28 0.44 11.31 −1.26 0.13 26.67 0.91 43.77DW4 9.15 0.50 9.17 −7.88 0.10 37.56 3.29 24.78DW5 12.47 0.50 12.52 0.41 0.14 39.87 0.40 49.46DW6 14.53 0.54 14.57 −0.12 0.17 44.25 0.33 52.23DW7 14.52 0.56 14.60 −0.63 0.17 40.07 0.92 49.29DW8 21.27 1.35 21.29 −5.93 0.27 50.55 5.24 37.43DW9 25.53 1.05 25.57 −0.68 0.34 31.65 1.13 57.37DW10 11.44 0.50 11.47 −2.18 0.13 39.03 1.82 38.82DW11 19.79 1.15 19.83 −2.82 0.25 46.83 3.06 40.85DW12 11.08 0.51 11.09 −3.27 0.12 46.23 2.13 35.08DW13 13.38 0.62 13.55 −1.26 0.16 49.80 1.25 41.94DW14 9.41 0.36 9.43 −1.75 0.10 34.85 1.62 40.35DW15 14.84 0.63 14.85 −1.19 0.17 44.45 0.93 45.09DW16 25.81 1.86 26.14 −2.25 0.35 41.87 7.39 44.35DW17 47.53 3.62 48.34 3.93 0.94 38.51 3.45 71.67DW18 31.12 1.65 31.22 1.78 0.45 69.74 0.62 61.37DW19 24.34 1.37 24.38 −0.43 0.32 70.12 1.31 48.92DW20 27.69 1.52 27.72 0.38 0.38 64.20 1.52 54.18DW21 20.22 1.01 20.23 0.31 0.25 65.76 1.00 49.19DW22 31.51 1.50 31.63 1.54 0.46 56.30 0.60 65.51DW24 29.74 1.72 29.79 −0.10 0.42 51.20 2.42 54.16DW25 26.15 1.65 26.17 −3.99 0.35 64.80 5.64 44.00DW26 14.33 0.83 14.44 −7.30 0.17 30.60 8.26 29.94DW27 56.26 4.00 56.42 3.84 1.29 51.77 1.62 83.23DW28 31.59 1.84 31.66 0.11 0.46 65.76 2.53 56.17DW29 14.66 0.59 14.71 −0.90 0.17 48.26 0.91 47.28DW30 21.00 1.25 21.09 −3.90 0.27 59.64 3.67 40.24DW31 12.33 0.48 12.34 −1.01 0.14 47.52 0.71 45.60DW33 35.90 1.66 36.86 2.27 0.58 55.25 0.40 76.24DW34 39.95 2.70 39.98 2.77 0.67 72.04 1.84 64.18
Minimum 8.95 0.36 8.96 −7.88 0.10 26.67 0.33 24.78Maximum 56.26 4.00 56.42 3.93 1.29 72.04 8.26 83.23Average 21.95 1.21 22.06 −1.00 0.32 49.11 2.12 49.61
(Eaton 1950; Richards 1954). Continued usage ofhigh residual sodium carbonate waters affects theyield of crops. High concentration of bicarbonatemay result in precipitation of Ca and Mg bicar-bonates from the soil solution, increasing relativeproportion of Na and causing sodium hazard. RSCrefers to residual alkalinity and can be calculatedby the following formula using values in meq/l:
RSC = (HCO3 + CO3)− (Ca +Mg) (8)
RSC values indicate that about 82% groundwatersamples of the study area are in the safe category,9% samples are suitable, while another 9% sam-ples fall in the unsuitable category for irrigationpurposes (table 9).
6.5 Kelly’s ratio (KR)
The level of Na measured against Ca and Mg isknown as Kelley’s ratio based on which irrigation
waters can be rated (Kelley 1946; Paliwal 1967).Excess sodium in waters produces undesirableeffects of changing soil properties and reducing soilpermeability (Kelley 1951; Tijani 1994). Kelley’sratio is taken as an indication of alkali hazard inwater (Handa 1981). It is determined form thefollowing formula using values in meq/l:
KR =Na
Ca +Mg. (9)
In groundwater samples of the study area, only 3%groundwater samples are unsuitable for irrigation,whereas 97% samples are suitable for irrigation(table 9).
6.6 Magnesium ratio (MR)
Magnesium hazard ratio is the excess amount ofMg over Ca and Mg amount, whereas normally the

Impact of over-exploitation on groundwater quality 1561
Figure 12. SAR vs. conductivity plot of groundwater samples from dug wells of the study area during pre-monsoon seasonof 2008 (after USSL 1954, 1973).
level of Ca and Mg will be in a state of equilibrium(Lloyd and Heathcote 1985; Sreedevi 2002). ExcessMg affects the quality of soil resulting in poor agri-cultural returns. MR is calculated by the formulausing values in meq/l:
MR =Mg × 100
Ca + Mg. (10)
In groundwater samples of the study area about56% samples are found suitable, while 44% arefound unsuitable for irrigation purpose (table 9).
6.7 Corrosivity ratio (CR)
The corrosivity ratio is important to know whetherthe water can be transported through metallicpipes or not. The groundwater with CR values of<1 is considered to be safe for transport of waterin any pipe. If the corrosivity ratio is >1, only non-corrosive pipes have to be used for transportingwater (Ryner 1944; Raman 1985). The intensity ofcorrosion depends upon certain physical factors liketemperature, pressure, and flow velocity of water(Ayer and Westcot 1985). High concentrations ofchloride and sulphate also increase the corrosionrate (Ryner 1944; Raman 1985). The corrosivityratio is calculated by the following formula usingvalues in meq/l:
CR =(Cl/35.5) + 2(SO4/96)
2(HCO3 + CO3/100)(11)
In groundwater samples of the study area, about38% samples fall under good category while 62%samples are corrosive and not suitable for trans-portation through metal pipes (table 9).
Although it is pertinent that the quality ofgroundwater in shallow aquifers of WR-2 water-shed, tapped by dug wells is suitable for irrigationpurpose, high concentrations of Ca, Mg, TH, TAand SO4 in it may affect the quality of soil at places.
6.8 Permeability index (PI)
The soil permeability is affected by long term useof irrigation water and is influenced by Na, Ca, Mgand HCO3 contents of the soil. The permeabilityindex (PI), as developed by Doneen (1962, 1964)indicates the suitability of groundwater for irriga-tion. It is calculated as under using values in meq/l:
PI =
[(Na +
√HCO3)
Ca + Mg + Na
]× 100. (12)
According to permeability indices, groundwatercan be divided into Class I, Class II and Class IIItypes. Class I and Class II water types are suitablefor irrigation with 75% or more of maximum per-meability, and Class III types of water with 25%maximum permeability. The PI values of ground-water samples range from 29.94% to 83.23% andthus, on the basis of Doneen’s chart all groundwa-ter samples of the study area are suitable for irri-gation purpose except at dug well DW4 where PIwas 24.78% (tables 8 and 9) (Doneen 1962, 1964).
7. Discussion and conclusions
Groundwater from the shallow aquifers of WR-2watershed is utilized for irrigation and domestic

1562 Anil M Pophare et al.
Table 9. Classification of groundwater samples based on %Na, SAR, SSP, RSC, KR,MR, CR and PI.
Ratio Range (meq/l) No. of samples Percentage Category
%Na < 20 16 50 Excellent
20–40 13 41 Good
40–60 3 9 Permissible
60–80 0 0 Doubtful
>80 0 0 Unsuitable
SAR <10 32 100 Excellent
10–18 0 0 Good
18–26 0 0 Fair
>26 0 0 Unsuitable
SSP <50 31 97 Good
>50 1 3 Unsuitable
RSC <1.25 26 82 Safe
1.25–2.5 3 9 Suitable
>0.5 3 9 Unsuitable
KR <1 31 97 Good
>1 1 3 Unsuitable
MR <50 18 56 Suitable
>50 14 44 Unsuitable
CR <1 12 38 Good
>1 20 62 Unsuitable
PI Up to 75% 31 97 Good
<25% 1 3 Unsuitable
purposes. The long term (1977–2010) and shortterm (2007–2010) record of both DTWL and spotEC in the dug wells of these aquifers indicate thatthe decline in DTWL is directly proportional to therising EC values of the groundwater. The declin-ing DTWL trend indicates progressive scarcity ofgroundwater, whereas rising EC values indicatedeterioration of groundwater quality in the dugwells of phreatic shallow aquifers of WR-2 water-shed. Overlay analysis of DTWL shows that theareas in the central and southern parts of WR-2watershed have deeper DTWL and are more sus-ceptible to contamination as compared to the restof the areas and have more groundwater overdraftthan the natural recharge. The groundwater explo-ration in the study area has been carried out to adepth of 172 m, where unconfined aquifers compris-ing of fractured massive and vesicular basalt occurup to the depth from 10 to 41 m with varying thick-ness. The static water level (SWL) varies from 4.35to 36 m bgl. A multi-layer fractured aquifer sys-tem exists in Deccan Trap basaltic terrain wheregroundwater occurs only in interconnected frac-tured zones. Considering this aspect, the up-coningof deeper aquifer due to groundwater exploitationmay not be possible, which is often observed inunconsolidated/consolidated alluvium formation.
In the study area, there are several factors inter-related to each other causing over-exploitation ofgroundwater from the shallow aquifers of WR-2
watershed. This includes the propensity of thelocal farmers to take cash crop of oranges mostlythrough traditional irrigation practices, ignoringthe depleting groundwater levels in the aquifers,although the traditional technique of flood irri-gation causes more groundwater draft than themodern irrigation techniques like drip and sprin-kler method. The specific yield of basaltic aquiferin WR-2 watershed is meager and takes about24 hours to recoup the dug after the pumping isstopped. Besides this, the irregular rainfall pat-tern over the years causes reduced runoff, whichin turn reduces the base flow and ultimately nat-ural recharge to the groundwater resources in theaquifers becomes negligible. These aspects resultin depletion of groundwater level in the shallowaquifers of WR-2 watershed. Moreover, excessiveuse of pesticides and fertilizers has already deterio-rated the quality of groundwater, causing leachingof soil and increase in the soil salinity. All thesefactors lead to a vicious cycle of groundwater over-exploitation and its quality deterioration in theWR-2 watershed (figure 13).
The study of groundwater quality in WR-2watershed indicates that groundwater from shal-low aquifer tapped by more than 50% dug wellsis not suitable for drinking and domestic pur-poses. This is due to higher concentration ofparameters like Ca, Mg, NO3, TDS, TA and TH,which are beyond the permissible limit. The higher

Impact of over-exploitation on groundwater quality 1563
Figure 13. Vicious cycle of groundwater over-exploitation in the WR-2 watershed.
concentrations of these parameters in the ground-water of the study area has led to an increase in itsEC values that adversely affect the quality of soilat places. This can be attributed to high suscepti-bility of groundwater sources to contamination dueto anthropogenic influences of agricultural back-flow and sewage effluent. The groundwater, thoughmostly suitable for irrigation purpose, is saturatedwith respect to mineral equilibrium and has a ten-dency towards chemical scale formation. Moreover,the CR values indicate that 62% of groundwater inthe dug wells is corrosive in nature and not suitablefor transport through metal pipes.
The correlation of observed chemical parametersand their zone/village-wise distribution indicatethat the value of TH is high in the dug wells locatedtowards northern and SE parts of the WR-2 water-shed (i.e., at Temburkheda, Tiwsaghat, Surali, andWadegaon villages). The EC was observed beyondpermissible limit towards the central, southern,and eastern parts of the watershed (i.e., in dugwells at Tiwsaghat, Temburkheda, Warud, Surali,Chandas, Mangruli, Wadegaon, and Loni villages).High concentrations of NO3 was observed through-out the watershed, in the dug wells locatedat Malkapur, Tiwsaghat, Temburkheda, Dhan-odi, Warud, Bahada, Manikpur, Jarud, Chinch-gavhan, Amdapur, Davaegaon, Karajgaon, Man-gruli, Wadala, Gadegaon, Nandgaon, Loni, Mam-dapur, and Haturna villages. This may beattributed to the anthropogenic contamination of
the groundwater sources in the entire watershedarea.
In view of the above, it is very essential totake urgent steps to arrest the over-exploitation ofgroundwater. It is observed that the entire studyarea of WR-2 watershed is experiencing the viciouscycle of groundwater over-exploitation. This cycleis mainly based on the wrong agriculture practices,irregular monsoon rainfall pattern, typical basalticaquifers, and irregular electric supply, etc. To breakthis cycle, it is recommended to change the crop-ping pattern in the entire WR-2 watershed area.Presently, there are about 84,53,349 orange treesirrigated by groundwater through 12,879 irrigationwells. This cash crop can be supplemented withother crops such as cotton, oil seeds, pulses, veg-etables, etc., which will reduce the water require-ment considerably leading to break this viciouscycle.
It is recommended that participatory ground-water management practices and modern irrigationtechniques like drip or sprinkler method should beadopted for irrigation in this area. This will pos-sibly reduce groundwater draft by 4.64 Mm3/yearand save 30% of groundwater. Further, the use ofsome advanced agriculture techniques like Aqua-ferti seed drill, Raised bed technology, Laser lev-eling, Biogas slurry, System of Rice Intensification(SRI), and combination of all techniques in watermanagement can improve the crop yields by 17–47%, which in turn will save 11–43% of irrigation

1564 Anil M Pophare et al.
cost, groundwater, irrigation time, and electricalenergy. Another management strategy to improveefficiency of water use is to utilise Pipe DistributionNetwork (PDN) instead of Canal Distribution Net-work (CDN). By virtue of PDN the water use effi-ciency can be improved up to 70–80% from exist-ing efficiency of 40% in the study area of WR-2watershed.
As part of the participatory groundwater man-agement approach, the stakeholders, people, andadministrators should come forward for above-referred interventions by strengthening collabo-ration and increasing confidence amongst them,before the system deteriorates. Although, the rela-tion between over-exploitation of groundwater andits quality has been observed and established in thestudy area of WR-2 watershed, it requires detailedinvestigation. A dense and strong monitoring net-work for detailed long term water level and qualitymeasurements and rainwater harvesting and otherartificial recharge techniques should be imple-mented effectively to arrest declining water leveland improving groundwater quality. The risingtrends of EC in such watersheds/areas can be usedas an indicator of groundwater over-exploitation.The results can be used for further study ofsimilar over-exploited watersheds, in Amravati dis-trict, in particular and Maharashtra State, ingeneral.
Acknowledgements
Authors are thankful to anonymous reviewers forcritically reviewing the manuscript. BRL is thank-ful to the Chairman, CGWB, Faridabad andRegional Director, CGWB, Nagpur for permittingto carry out this work.
References
APHA 1998 Standard methods for the examination of waterand waste water; American Public Health Association,Water Pollution Control Federation, Washington DC,20th edn, pp. 10–161.
Appelo C A J and Postma D 1993 Geochemistry, ground-water and pollution; A A Balkema Publ., Rotterdam, TheNetherlands, pp. 45–49.
Ayer R S and Westcot D W 1985 Water quality for agricul-ture, irrigation and drainage; Paper no. 29, Rev. I FAQRome 174.
Back W 1966 Hydrochemical facies and groundwater flowpatterns in northern part of Atlantic coastal plain; USGSProfessional Paper 498-A.
Bagher R M and Rasoul M R 2010 Effect of groundwatertable decline on groundwater quality in Sirjan Watershed;Arabian J. Sci. Engg 35(1B) 197–210.
BIS 2003 Indian standard drinking water specification (firstrevision incorporating amendment no.1 January 1993 andamendment no. 2 September 2003), IS10500: 1991 edn
2.2 (2003-09); Bureau of Indian Standards, New Delhi,India.
CGWB 1998a A report on artificial recharge to ground-water in orange growing areas, watershed WR-2, TalukaWarud, District Amravati, Maharashtra; Central GroundWater Board, Central Region, Nagpur, Report No.884/ARP/1998, 190p.
CGWB 1998b Detailed guidelines for implementing thegroundwater estimation methodology – 1997; CentralGroundWater Board, Ministry of Water Resources, Govt.of India, 219p.
CGWB 1999 Integrated water resources development: Aplan for action; Report of the National Commission forIntegrated Water Resources Development Plan, Ministryof Water Resources, Govt. of India, 1 515p.
CGWB 2007 Manual on artificial recharge of groundwa-ter; Central Ground Water Board, Ministry of WaterResources, Govt. of India, 185p.
CGWB 2010 Groundwater Year Book – 2009–10: Maha-rashtra and Dadra, Nagar and Haveli; Central GroundWater Board, Central Region, Nagpur, Report No. 1678/GWM/2011, pp. 10–26.
CGWB 2012 Report on drilling, construction and com-missioning of 88 piezometers in Vidarbha region, Maha-rashtra; Report No.1690/GWM/2012 (AAP-2011–2012),Central Ground Water Board, Central Region, Nagpur,Ministry of Water Resources, Govt. of India, 42p.
CGWB and GSDA 2005 Report on dynamic groundwa-ter resources of Maharashtra as on March 2005; Cen-tral Ground Water Board, Central Region, Nagpur andGroundwater Surveys & Development Agency, 332p.
CGWB and GSDA 2009 Report on dynamic groundwa-ter resources of Maharashtra as on March 2008; Cen-tral Ground Water Board, Central Region, Nagpur andGroundwater Surveys & Development Agency, 228p.
Deutsch W J 1997 Groundwater geochemistry: Fundamen-tals and applications to contamination; Lewis Publ. NewYork, 221p.
Diamantopoulou P and Voudouris K 2008 Optimization ofwater resources management using SWOT analysis: Thecase of Zakynthos Island, Ionian Sea, Greece; Env. Geol.54 197–211.
Doneen L D 1962 The influence of crop and soil on per-colating water; In: Proc. 1961 Biennial Conference onGroundwater Recharge, pp. 156–163.
Doneen L D 1964 Notes on water quality in agriculture;Published as a water science and engineering paper 4001,Dept. of Water Sci. and Engg., Univ. of California.
Duraiswami R A 2007 Groundwater conditions in ground-water provinces of eastern Maharashtra: Emergingchallenges; In: Recent Developments in GroundwaterResources of Central India (eds) Pophare A M and MalpeD B, Gond. Geol. Mag. Spec. Vol. 11 69–76.
Duraiswami R A 2008 Changing geohydrological scenarioin the hard-rock terrain of Maharashtra: Issues, concernsand way forward; In: Changing Geohydrological Scenarioin Hard rock Terrain of Peninsular India (ed.) Das S,Geol.Soc. India Memoir 69 86–121.
Eaton F M 1950 Formulas for estimating the drainageand gypsum requirement of irrigation water; Texas Agri.Expt. Sta. Misc. Report III.
El-Naqa A and Al-Shayeb A 2009 Groundwater protectionand management strategy in Jordan; Water Resour.Manag. 23 2379–2394; doi: 10.1007/s11269-008-9386-x.
Freeze R A and Cherry J A 1979 Groundwater; PrenticeHall Inc., New Jersey, 604p.
Friedman L C and Erdmann D E 1982 Quality assurancepractices for analyses of water and fluvial sediments;

Impact of over-exploitation on groundwater quality 1565
Tech. Water Resources Inc. Book 5, Chapter A6, USGovt. Printing Office, Washington DC.
GEC 1997 Report of the groundwater resources estima-tion committee methodology–1997; Ministry of WaterResources, Govt. of India, New Delhi, 107p.
Gibbs R J 1970 Mechanism controlling world water chem-istry; Science 170 1088–1090.
Handa B K 1981 Technical report on hydrochemistry, waterquality and water pollution in Uttar Pradesh; Cen-tral Ground Water Board, Ministry of Agriculture andIrrigation, Govt. of India, 317p.
Harou J J and Lund J R 2008 Ending groundwater overdraftin hydrologic-economic systems; Hydrogeol. J. 16 1039–1055.
Hem J D 1985 Study and interpretation of the chemicalcharacteristics of natural waters; 3rd edn, USGS WaterSupply Paper 2254 175–177.
Johnson C C Jr 1979 Land application of waste: An accidentwaiting to happen; Groundwater 17 69–72.
Katz B G and Choquete A F 1991 Aqueous geochemistry ofsand and gravel aquifers, Northwest Florida; Groundwater29(1) 47–55.
Kelley W P 1946 Permissible composition and concentra-tion of irrigation waters; In: Proc. Am. Soc. Civil Engg.,607p.
Kelley W P 1951 Alkali soils – their formation propertiesand reclamation; Reinold Publ. Corp., New York.
Khayat S, Heinz H, Stefan G and Wasim A 2006 Hydro-chemical investigation of water from the Pleistocene wellsand springs, Jericho area, Palestine; Hydrogeol. J. 14192–202.
Lloyd J W and Heathcote J A 1985 Natural inorganic hydro-chemistry in relation to groundwater: An introduction;Oxford Univ. Press, New York, 296p.
Madnure P, Sirsikar D Y, Tiwari A N, Ranjan B and MalpeD B 2007 Occurrence of fluoride in the groundwatersof Pandharkawada area, Yavatmal Dist., Maharashtra,India; Curr. Sci. 92(5) 675–679.
NEERI 1986 Manual of water and waste water analysis;National Environmental Engineering Research Institute,Nagpur, 340p.
Paliwal K V 1967 Effects of gypsum application on thequality of irrigation water; The Madras Agri. J. 59646–647.
Pandian K and Sankar K 2007 Hydrogeochemistry andgroundwater quality in the Vaippar river basin, Tamil-nadu; J. Geol. Soc. India 69 970–982.
Pawar N J 1993 Geochemistry of carbonate precipitationfrom the groundwaters in the basaltic aquifers: An equi-librium thermo-dynamic approach; J. Geol. Soc. India 41119–131.
Pawar N J and Nikumbh J D 2007 Mass balance modelling ofgroundwater from shallow and alluvial aquifers of Behedibasin, District Nasik, Maharashtra; In: Recent Develop-ments in Groundwater Resources of Central India (eds)Pophare A M and Malpe D B, Gond. Geol. Mag. Spec.Vol. 11 23–34.
Pedro G and Siefferman G 1979 Weathering of rocks and for-mation of soils; In: Review of research on modern problemsof geochemistry (ed.) Siegel F R, pp. 39–54.
Piper A M 1944 A graphic procedure in the geochemicalinterpretation of water analyses; Trans. Am. Geophys.Union 25 914–928.
Piper A M 1953 A graphic procedure in the geochemicalinterpretation of water analysis; USGS Groundwater Note12.
Plummer L N and Back W 1980 The mass balance approach:Application to interpreting the chemical evolution ofhydrologic systems; Am. J. Sci. 280 130–142.
Pojasek R B 1977 Drinking water quality enhancementthrough protection; Ann Arbor Science Publishers Inc.,Michigan, 614p.
Pophare A M and Dewalkar S M 2007 Groundwater qual-ity in eastern and southeastern parts of Rajura Tahsil,Chandrapur District, Maharashtra; In: Recent Develop-ments in Groundwater Resources of Central India (eds)Pophare A M and Malpe D B, Gond. Geol. Mag. Spec.Vol. 11 119–126.
Raman V 1985 Impact of corrosion in the conveyanceand distribution of water; J. Int. Water Works Assoc.XV(11) 115–121.
Richards L A 1954 Diagnosis and improvement of saline andalkali soils; Agri. Handbook 60, US Dept. of Agriculture,Washington DC, 160p.
Rossum J R 1975 Checking the accuracy of water analysesthrough the use of conductivity; J. Am. Water WorksAssoc. 67 204.
Ryner J W 1944 A new index for determining amount ofcalcium carbonates scale formed by water; J. Am. WaterAssoc. 36 472–486.
Saini R K, Chakrapani G J and Sen A K 2006 Geochemi-cal studies of groundwater in Saharanpur, Uttar Pradesh;J. Geol. Soc. India 68 50–58.
Schoeller H 1955 Geochemie des eause souterraines; Rev.Inst. Fr. Petrol. 10 230–244.
Schoeller H 1967 Qualitative evaluation of groundwaterresources; In: Methods and Techniques of Groundwa-ter Investigations and Development, UNESCO WaterResources Series 33 44–52.
Seaber P R 1962 Cation hydrochemical facies of ground-water in the Englishtown Formation, New Jersey; USGSprofessional paper 450, article 51.
Sivasankar V, Ramachandramoorthy T and ChandramohanA 2012 Deterioration of coastal groundwater qual-ity in Island and mainland regions of Ramanathapu-ram District, southern India; Env. Monit. Assess., doi:10.1007/s10661-012-2604-2.
Sophocleous M 2003 Environmental implications of inten-sive groundwater use with special regard to streamsand wetlands; In: Intensive Use of Groundwater(eds) Lamas R and Custodio E, The Netherlands,pp. 93–112.
Sreedevi P D 2002 Hydro-geochemistry of Pageruriver basin, Cuddapah District, Andhra Pradesh; In:Proc. ‘Hydrology and Watershed Management’ I 638–645.
Sreedevi P D 2004 Groundwater quality of Pageru riverbasin, Cuddapah district, Andhra Pradesh; J. Geol. Soc.India 64(5) 619–636.
Tardy Y 1971 Characterization of principal weather-ing types by geochemistry of water from some Euro-pean and African crystalline massifs; Chem. Geol 7253–271.
Tijani J 1994 Hydrochemical assessment of groundwater inMoro area, Kwara State, Nigeria; Env. Geol. 24 194–202.
Tiwari A N, Nawale V P, Tambe J A and Satya Kumar Y2008 Correlation of fluoride with bicarbonate in ground-water of exploratory wells in parts of Maharashtra; J.Appl. Geochem. 10 93–102.
Tiwari A N, Nawale V P, Tambe J A and Satya KumarY 2007 Non-lithological nitrate and chloride causingincrease in total dissolved solids in groundwater of shal-low basaltic aquifer of Maharashtra; Indian J. Geochem.22(2) 355–362.
USSL 1954 Diagnosis and improvement of saline and alkalisoils; United States Salinity Laboratory Staff, US Dept.of Agriculture Hand Book, 60 160p.

1566 Anil M Pophare et al.
USSL 1973 Diagnosis and improvement of saline and alkalisoils; United States Salinity Laboratory Staff, US Dept.of Agriculture, Hand Book, 60, 2nd edn, 173p.
Walton W C 1970 Groundwater resources evaluation;McGraw-Hill Book Co., New York, 664p.
Weijden C H Van der and Pacheco F A L 2006 Hydro-geochemistry in the Vogue River basin (central Portu-gal): Pollution and chemical weathering; Appl. Geochem.21(4) 580–613.
Wilcox L V 1948 The quality of water for Irrigation use; USDept. Agri., Tech. Bulletin-1962, Washington DC, 19p.
Wilcox L V 1955 Classification and use of irri-gation waters; US Dept. of Agriculture, Circular961.
Zekster S, Loaiciga H A and Wolf J T 2005 Environmentalimpacts of groundwater overdraft: Selected case studiesin the southwestern United States; Env. Geol. 47 396–404.
MS received 27 June 2012; revised 10 June 2013; accepted 9 September 2013