impact of signal length in crosscorrelation based underwater network size estimation
TRANSCRIPT
Thesis Title Impact of Signal Length in Cross-
Correlation Based Underwater Network
Size Estimation
December 26, 2015
Presented by Supervised by
Samir Ahmed Shah Ariful Hoque Chowdhury
Roll No: 104018 Assistant Professor
Dept. of ETE, RUET.
1 Of 26

Contents
• Introduction
• Importance of node estimation
• Importance of signal length
• Underwater environment
• Literature review
• Impact of signal length in node estimation
• Corresponding works
• Comparison
• Future work
• Conclusion
December 26, 2015
2 of 26
Introduction
• Node - communication endpoint, terminal equipment.
• Sensor- receiving node, capable of performing some
processing, gathering sensory information and communicating
with other connected nodes.
• Cross-correlation- a measure of similarity between
two waveforms
• Underwater wireless acoustic sensor network (UWASN)
• Signal length – Energy related term
• TS case – triangular sensors case, sensors placed in triangular
shape
December 26, 2015
3 of 26
Importance of node estimation
• To ensure proper network operation
• Successful data collection
• Network maintenance
• To maintain communication quality
• Background noise calculation
December 26, 2015
4 of 26

Importance of Signal Length
• Signal length possesses a very important role in size
estimation of underwater wireless sensor network (UWSN)
• The greater the signal length the greater energy is required
for estimation
• Ideally the signal length is infinity (we consider 106
samples)
• It plays a great role in estimating number of nodes
• Accurate node estimation is being observed and discussed
in this thesis
December 26, 2015
5 0f 26

Underwater environment
• Long propagation delay
• High path loss
• Strong background noise
• Non-negligible capture effect
• Multipath signal propagation
December 26, 2015
6 of 26
Cross-correlation based node
estimation using two sensors [1]
• Basic theory: cross-correlation of two Gaussian signals results a delta.
• Estimation parameter: ratio of standard deviation to the mean, R of the cross-correlation function (CCF).
• Low protocol complexity
• Delay insensitive
• Not affected by capture effect
• Less time required
• Applicable to any environment network
December 26, 2015
7 0f 26
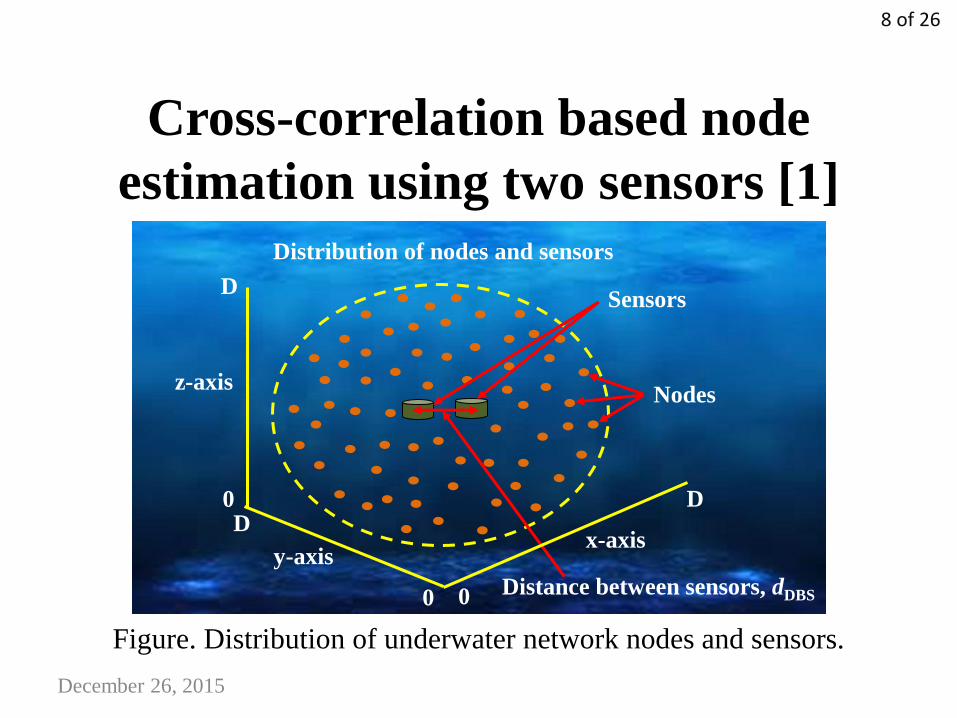
Cross-correlation based node
estimation using two sensors [1]
Figure. Distribution of underwater network nodes and sensors.
December 26, 2015
0 Distance between sensors, dDBS
0
y-axis
z-axis
0
x-axis
D D
D
Distribution of nodes and sensors
Nodes
Sensors
8 of 26
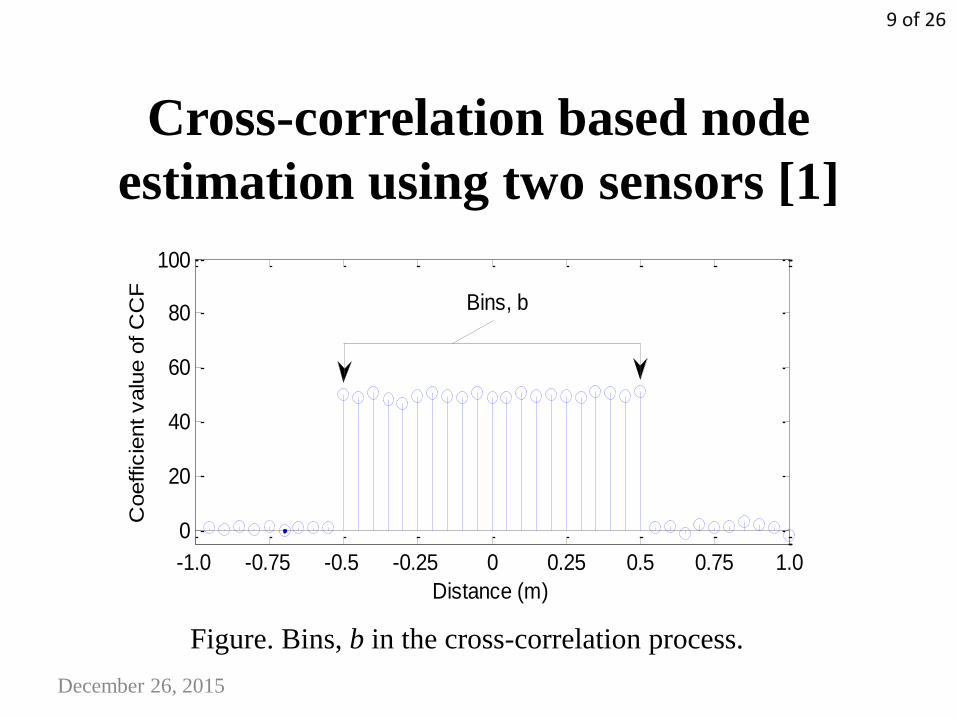
Cross-correlation based node
estimation using two sensors [1]
Figure. Bins, b in the cross-correlation process.
December 26, 2015
-1.0 -0.75 -0.5 -0.25 0 0.25 0.5 0.75 1.0
0
20
40
60
80
100
Distance (m)
Coeffic
ient valu
e o
f C
CF
Bins, b
9 of 26
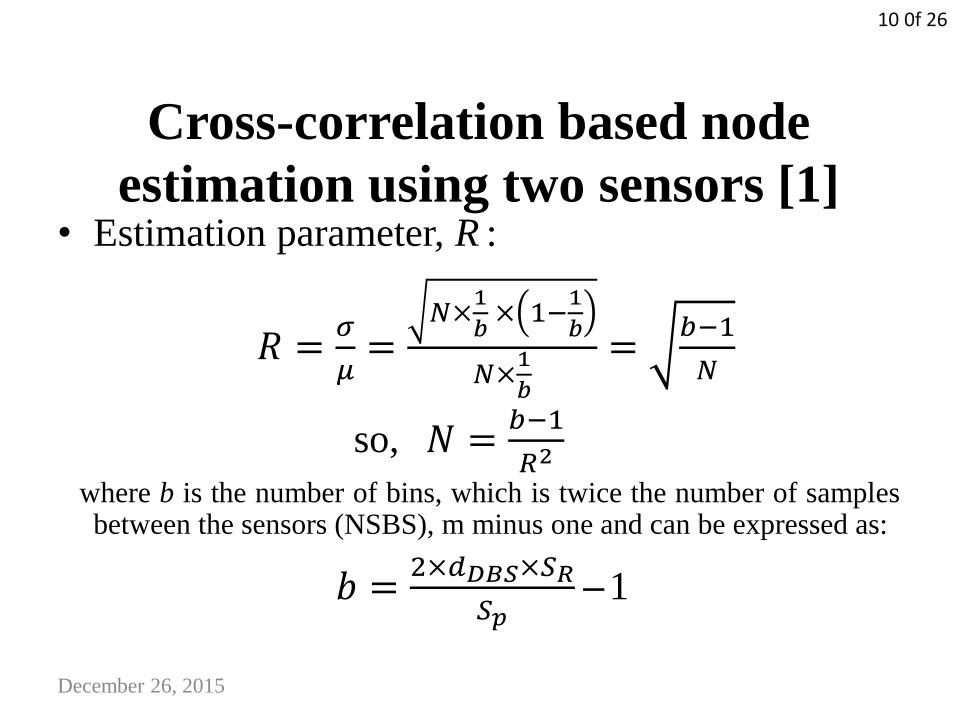
Cross-correlation based node
estimation using two sensors [1] • Estimation parameter, R :
𝑅 =𝜎
𝜇=
𝑁×1
𝑏 × 1−
1
𝑏
𝑁×1
𝑏
=𝑏−1
𝑁
so, 𝑁 =𝑏−1
𝑅2
where b is the number of bins, which is twice the number of samples between the sensors (NSBS), m minus one and can be expressed as:
𝑏 =2×𝑑𝐷𝐵𝑆×𝑆𝑅
𝑆𝑝 ̶̶ 1
December 26, 2015
10 0f 26
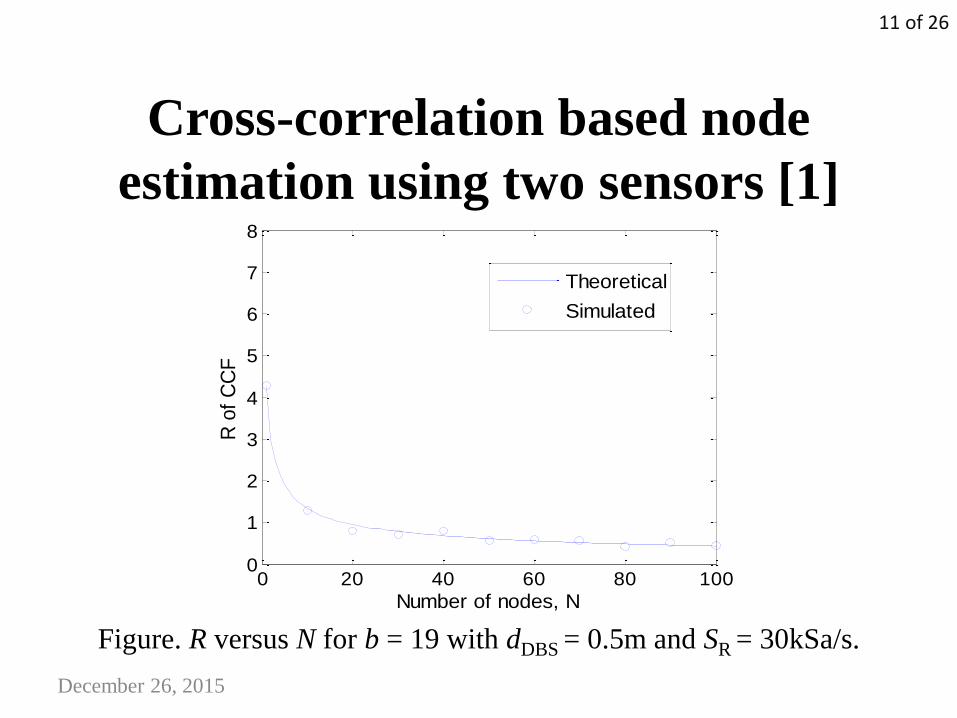
Cross-correlation based node
estimation using two sensors [1]
Figure. R versus N for b = 19 with dDBS = 0.5m and SR = 30kSa/s.
December 26, 2015
0 20 40 60 80 1000
1
2
3
4
5
6
7
8
Number of nodes, N
R o
f C
CF
Theoretical
Simulated
11 of 26
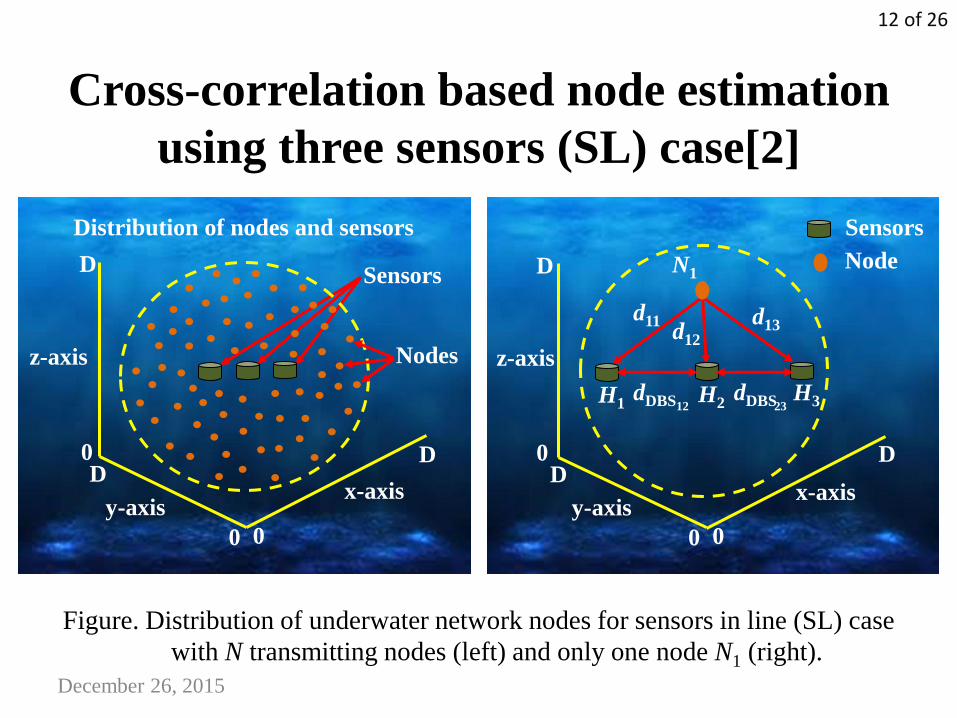
Cross-correlation based node estimation
using three sensors (SL) case[2]
Figure. Distribution of underwater network nodes for sensors in line (SL) case
with N transmitting nodes (left) and only one node N1 (right). December 26, 2015
0
0
0
y-axis
z-axis
x-axis
D D
D
Sensors
Node
H3 H1 H2
N1
d11 d12
d13
dDBS 12
0
0
y-axis
z-axis
0
x-axis
D D
D
Distribution of nodes and sensors
Sensors
Nodes
dDBS 23
12 of 26
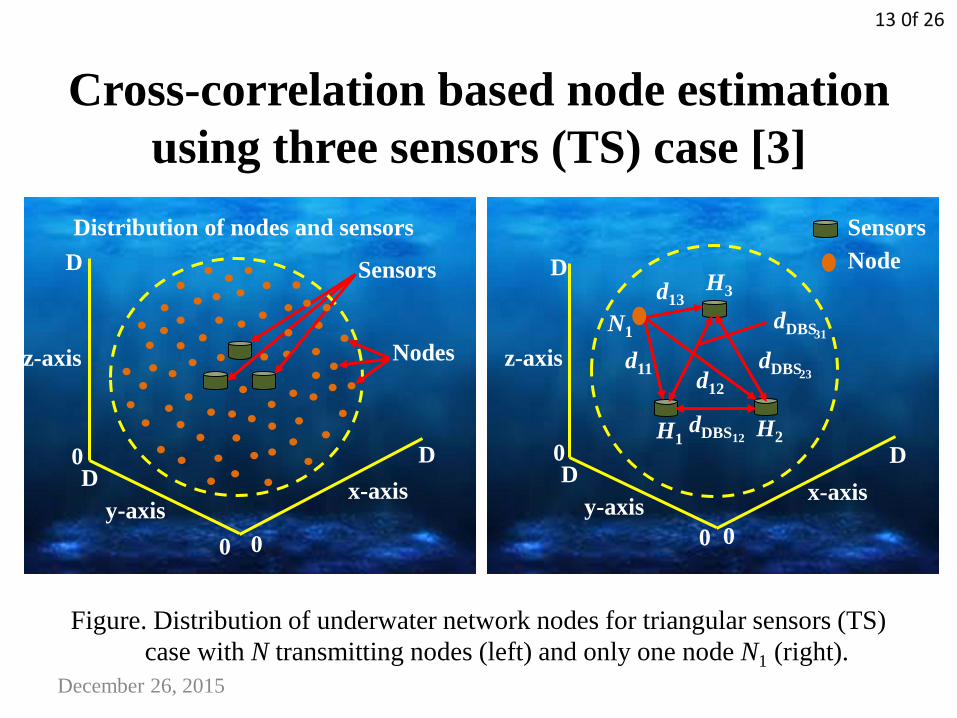
Cross-correlation based node estimation
using three sensors (TS) case [3]
Figure. Distribution of underwater network nodes for triangular sensors (TS)
case with N transmitting nodes (left) and only one node N1 (right).
December 26, 2015
d11 d12
d13
dDBS 12
dDBS 23
0
Nodes
0
y-axis
z-axis
0
x-axis
D D
D
Distribution of nodes and sensors
Sensors
0
z-axis
D
0 0
y-axis x-axis
D D
Sensors
Node H3
N1
H1 H2
dDBS 31
13 0f 26

Block diagram for TS case
December 26, 2015
d11 d12
d13
dDBS 12
dDBS 23
(t) Sr c1
(t) Sr c2
(t) Sr c3
C12 (τ)
C23 (τ)
σ12
σ23
μ23
μ12 R12
R23
Raverage 3CCF
⁞ ⁞ ⁞
Ratio
σ31 / μ31
Average Ratio
σ12 / μ12
Ratio
σ23 / μ23
Mean
Mean
Standard deviation
Mean
Standard deviation
Sensors
Gaussian
signals Composite
Gaussian
signals
Cross-correlation
Cross-correlation
Nodes
N1
N2
N3
NN
H3
H2
H1
Cross-correlation
Standard deviation
C31 (τ) μ31
σ31 R31
dDBS 31
14 of 26
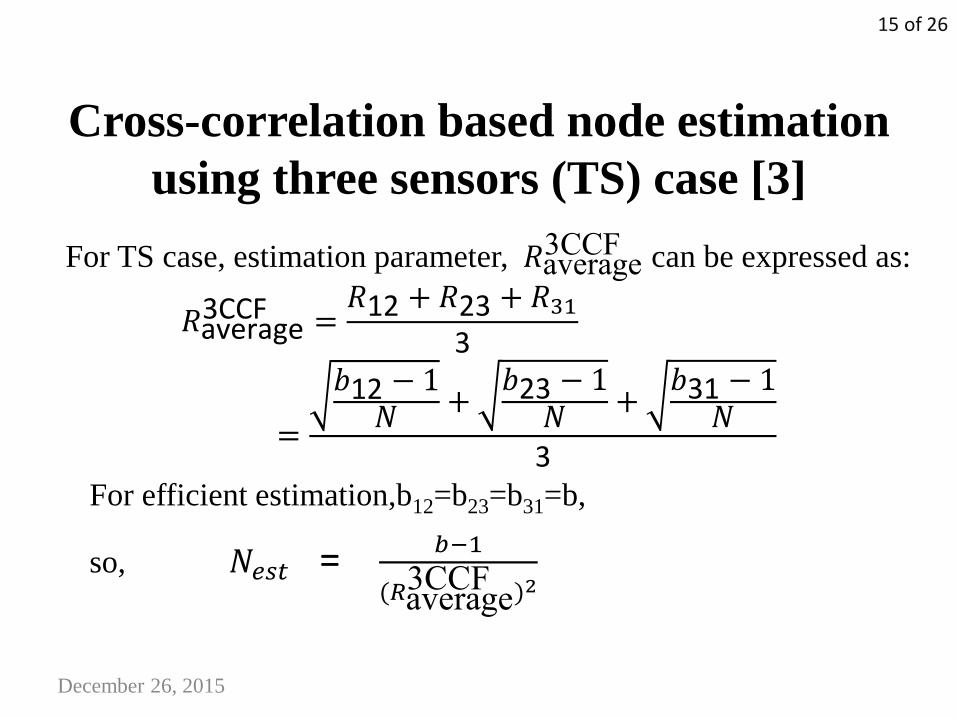
Cross-correlation based node estimation
using three sensors (TS) case [3]
For TS case, estimation parameter, 𝑅average3CCF can be expressed as:
𝑅average3CCF =
𝑅12 + 𝑅23 + 𝑅31
3
=
𝑏12 − 1𝑁 +
𝑏23 − 1𝑁 +
𝑏31 − 1𝑁
3
For efficient estimation,b12=b23=b31=b,
so, 𝑁𝑒𝑠𝑡 = 𝑏−1
(𝑅average3CCF )2
December 26, 2015
15 of 26
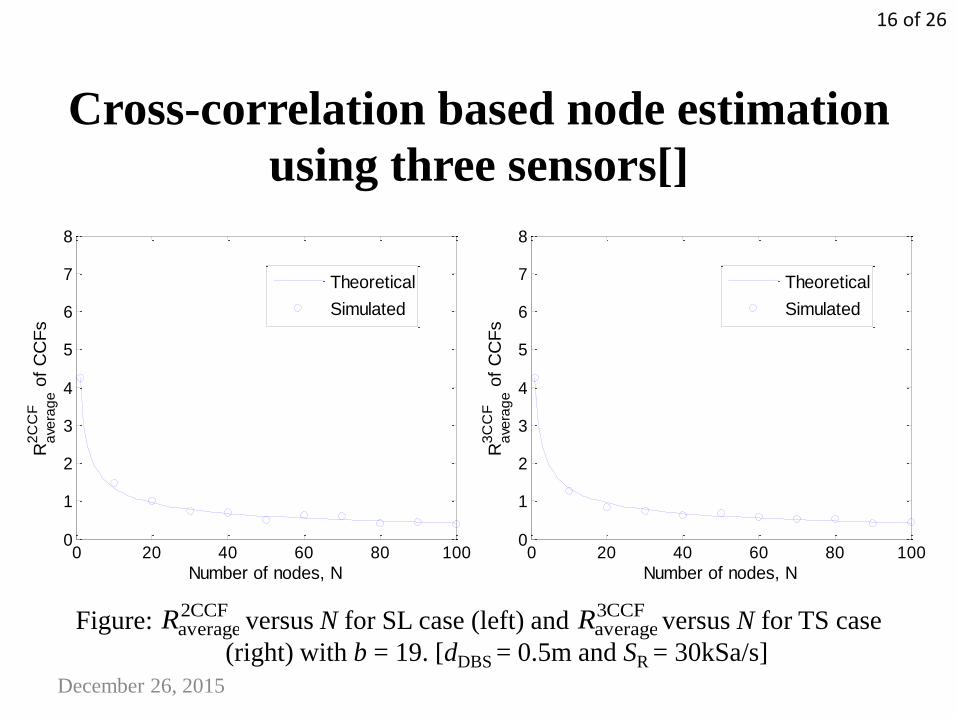
Cross-correlation based node estimation
using three sensors[]
Figure: versus N for SL case (left) and versus N for TS case
(right) with b = 19. [dDBS = 0.5m and SR = 30kSa/s]
December 26, 2015
0 20 40 60 80 1000
1
2
3
4
5
6
7
8
Number of nodes, N
R2
CC
F
ave
rag
e o
f C
CF
s
Theoretical
Simulated
0 20 40 60 80 1000
1
2
3
4
5
6
7
8
Number of nodes, N
R3
CC
F
ave
rag
e o
f C
CF
s
Theoretical
Simulated
2CCFaverageR 3CCF
averageR
16 of 26

December 26, 2015
Effect of signal length in estimation
process, (SL case) [4]
102
103
104
105
106
0
5
10
15
20
25
30
35
Signal length in Number of samples (Ns)
Nu
mb
er o
f n
od
es,
N
Nest
vs Ns plot for SL case
Nest
vs Ns plot for Two sensor case
Exact 32 Nodes
Figure. Estimated N versus Ns plot (x-log, y-normal scale) for two & three
sensor (SL case) method with fixed value of b = 119 using exact 32 nodes
17 of 26

December 26, 2015
Impact of signal length in cross-
correlation based estimation (TS case)
• The channel is considered as ideal
• Receivers are assumed to be ideal
• No multipath effect is considered
• No Doppler shift is considered
• Network dimension — 3D spherical
• Transmitted Signal — White Gaussian
• Signal power — Equal received powers from all nodes
Some initial assumption
18 of 26
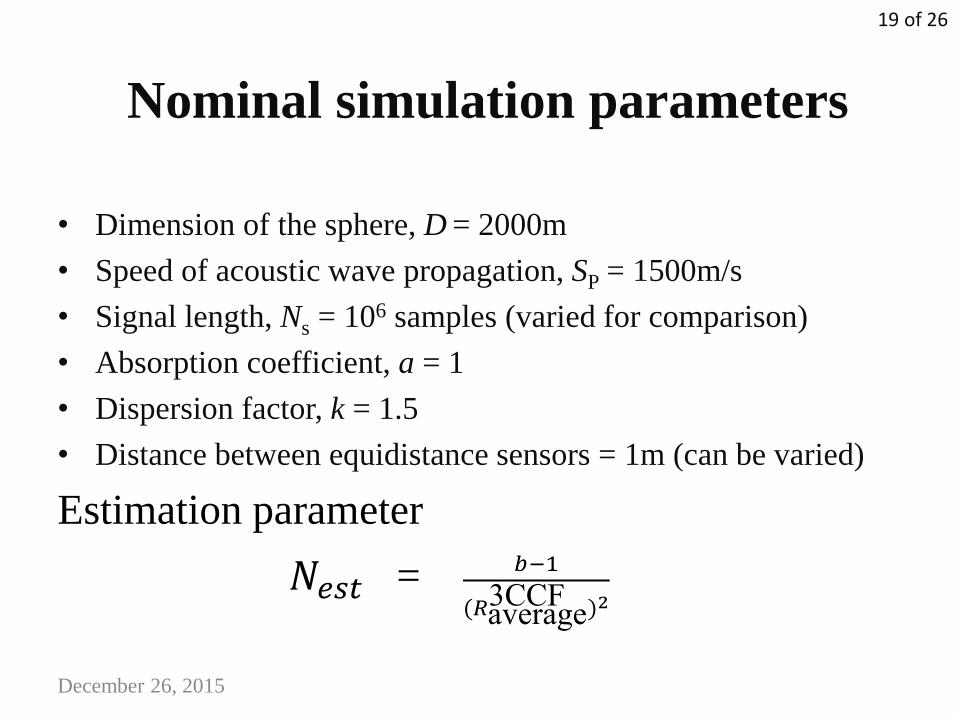
Nominal simulation parameters
• Dimension of the sphere, D = 2000m
• Speed of acoustic wave propagation, SP = 1500m/s
• Signal length, Ns = 106 samples (varied for comparison)
• Absorption coefficient, a = 1
• Dispersion factor, k = 1.5
• Distance between equidistance sensors = 1m (can be varied)
Estimation parameter
𝑁𝑒𝑠𝑡 = 𝑏−1
(𝑅average3CCF )2
December 26, 2015
19 of 26
Corresponding Result
December 26, 2015
102
103
104
105
106
100
101
102
signal Length, Ns
num
ber o
f nodes,
N
N vs Ns plot for exact 32 nodes
Estimated N vs Ns plot for b=119
Estimated N vs Ns plot for b=39
Estimated N vs Ns plot for b=19
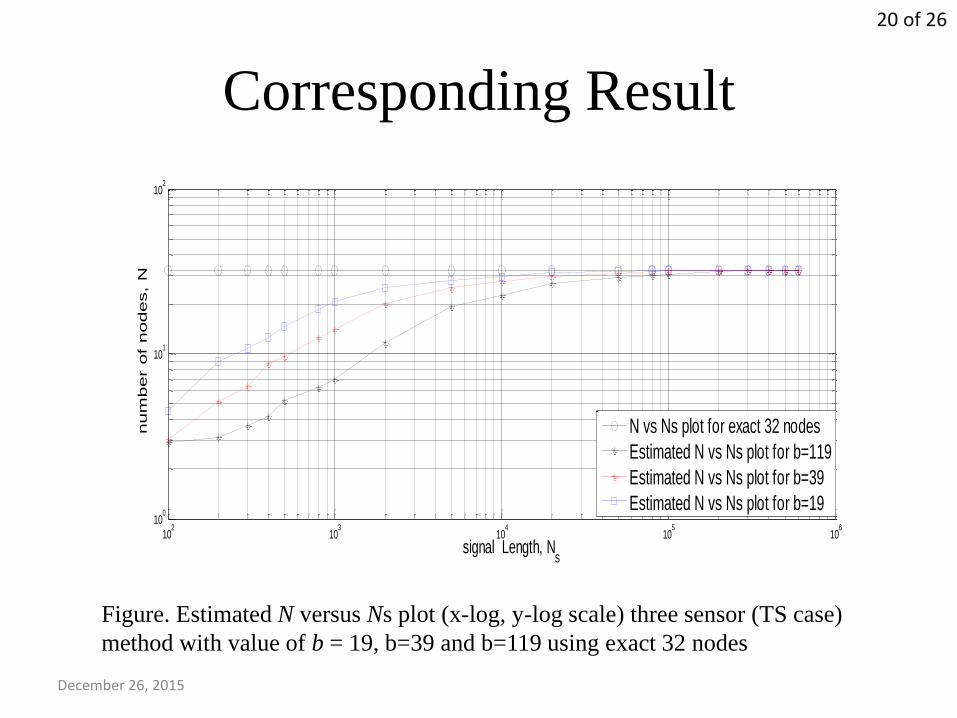
Figure. Estimated N versus Ns plot (x-log, y-log scale) three sensor (TS case)
method with value of b = 19, b=39 and b=119 using exact 32 nodes
20 of 26
Corresponding Result
December 26, 2015
102
103
104
105
106
100
101
102
signalLength, Ns
num
ber o
f nodes,
N
Estimated N vs Ns plot for 64 nodes,b=39
N vs Ns plot for exact 64 nodes
Estimated N vs Ns plot for 32 nodes,b=39
N vs Ns plot for exact 32 nodes
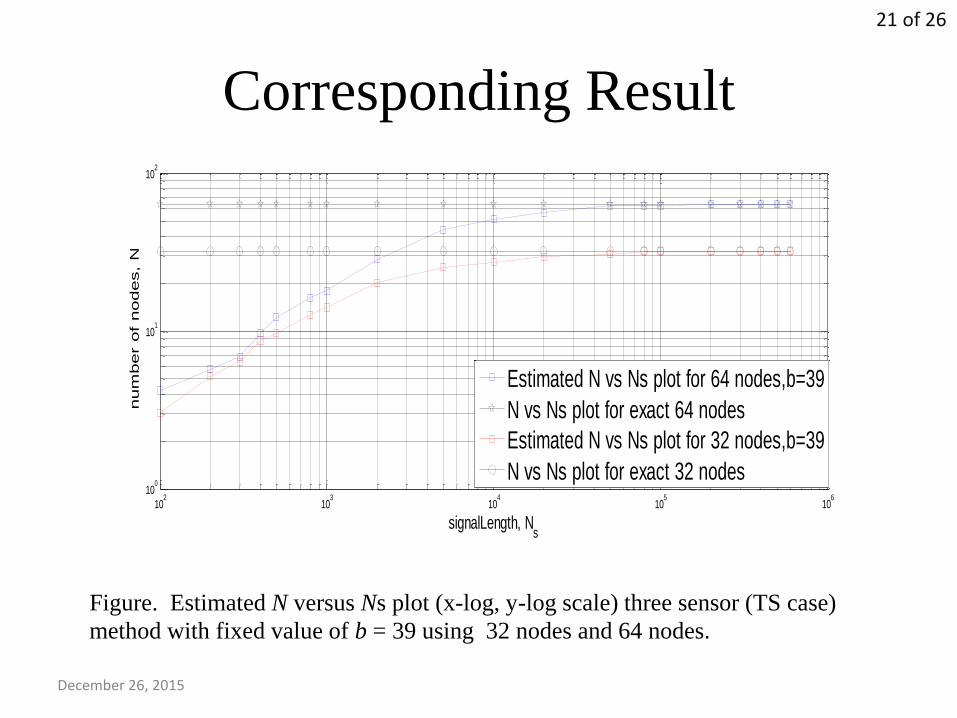
Figure. Estimated N versus Ns plot (x-log, y-log scale) three sensor (TS case)
method with fixed value of b = 39 using 32 nodes and 64 nodes.
21 of 26
Comparison between TS case and SL case
December 26, 2015
102
103
104
105
106
100
101
102
signalLength, Ns
num
ber
of
nodes,
N
N vs Ns plot for exact 64 nodes
Estimated N vs Ns plot for TS case,b=19
Estimated N vs Ns plot for SL case,b=19
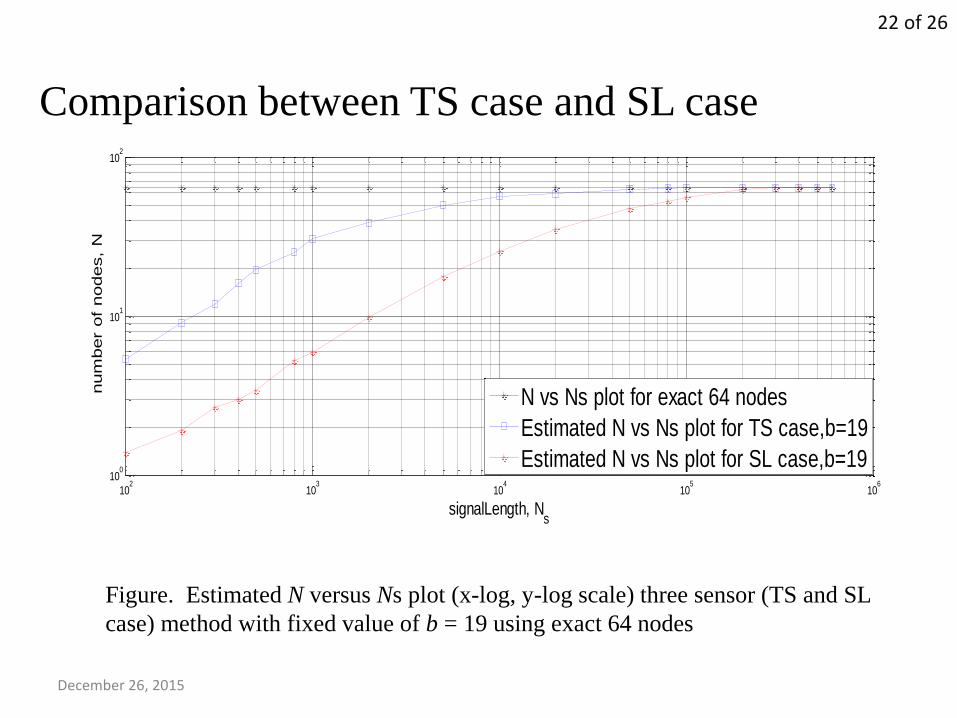
Figure. Estimated N versus Ns plot (x-log, y-log scale) three sensor (TS and SL
case) method with fixed value of b = 19 using exact 64 nodes
22 of 26

Future work
• Estimation with unequal distances between the sensors
• Estimation with non-uniform distribution of nodes
• Estimation with different shape of network
• Estimation with random placement of the sensors
• Estimation with variable propagation delay
• Use of Non-Gaussian signals for estimation
• Estimation with M number of sensors
• This thesis consider only ERP case, so ETP, RTRP cases
requires further work
December 26, 2015
23 of 26
Conclusion
• Using three sensors method, TS case, we can estimate the
number of nodes easily with reduced signal length for which
the required energy will be less than the SL case, three sensors
method
• In this thesis we use smaller signal length than two sensor
technique and provide better performance in estimation
process
• TS case, three sensors techniques provide better performance
than any other techniques in small area
December 26, 2015
24 of 26

References
[1] M. S. Anower, M. R. Frater, and M. J. Ryan, ―Estimation by cross-correlation of the number of
nodes in underwater networks,‖ In Proceedings of Australasian Telecommunication Networks
and Applications Conference (ATNAC), 10–12 November, 2009, pp. 1–6. doi:
10.1109/ATNAC.2009.5464716.
[2] S. A. H. Chowdhury, M. S. Anower, and J. E. Giti (2014), ―A signal processing approach of
underwater network node estimation,‖ In Proc. International Conference on Electrical
Engineering and Information Communication Technology (ICEEICT) 2014, Dhaka, 10−12
April, 2014.
[3] S. A. H. Chowdhury, M. S. Anower, and J. E. Giti (2014), ―Effect of sensor number and location
in cross-correlation based node estimation technique for underwater communications network,‖ in
Proceedings of 3rd International Conference on Informatics, Electronics & Vision (ICIEV 2014),
23–24 May, 2014, Dhaka, Bangladesh
[4] M.A. Hossen, S.A.H. Chowdhury, M. S. Anower (2015), ―Effect of signal length in cross-
correlation based underwater network size estimation‖ Paper id 528_ICEEICT 2015
December 26, 2015
25 of 26

Thank you
December 26, 2015
26 of 26