impact of technical barriers to trade and sanitary and ... e hira.pdf · 4 empirically using...
TRANSCRIPT

Papers and Proceedings
pp. 475–494
Impact of Technical Non-tariff Measures
on Pakistan Exports
NOOR-E-HERA, SAIMA SHAFIQUE, and AMIR MUSTAFA*
Technical barriers to trade (TBT) and sanitary and phytosanitary (SPS) measures are two
major tools of technical non-tariff barriers set by world trade organisation (WTO) and should
strictly followed by WTO member countries. These NTBs are set for safety of food, human,
animal, plants and environment. In global competitive market countries can maintain their
trade position only if they follow WTO quality and standards of products. These non-tariff
barriers have promoted as well as restrict trade. As exports in any country promotes not only
because of demand and supply of products but it depends on correct functioning of all micro
and macroeconomic policies. This paper discusses the role of Pakistan macroeconomic policies
that facilitate trade and redefine the prosperity paths in changing global and local economies.
Currently CPEC a big opportunity for Pakistan but its challenge for Pakistan to promote its
exports in the presence of non tariff barriers. We analysed impact of these TBT and SPS
measures initiated as well as enforced by partner countries on Pakistan’s exports, by
constructing database of Pakistan and its top export partners that are U.S.A, China, and U.A.E
countries, at HS-2 digit product code level from 2003-2016 time period. To quantify TBT and
SPS measures we employ coverage ratio and frequency index. Literature shows TBT imposed
by importer on Pakistan’s exports has positively affected the export performance while SPS
discourage exports. A separate effect of these NTBs on manufacturing and agriculture sectors
is also analysed. The frequency index and export coverage ratio shows that TBT and SPS
measure promoted exports of agricultural and manufacturing sector. The data set is sourced by
WTO, UN Comtrade, and WDI.
JEL Classification: F14, F18, F64, H23
Keywords: Technical Barriers to Trade (TBT), Sanitary and Phytosanitary (SPS),
Pakistan, Exports, Frequency Index, Coverage Ratio, World Trade
Organisation (WTO).
1. INTRODUCTION
The non-tariff measures (NTMs) are obstacles to foreign trade; it is considered as
non-tariff barriers (NTBs) to trade. These NTBs may be protectionist at the expense of
exporters from foreign countries or sometimes non-protectionist, but limit the trade
volumes. Technical barriers to trade (TBT) and sanitary and phytosanitary (SPS)
agreements of World Trade Organisation (WTO) are technical non-tariff trade barriers
measures. These barriers have impacted increasingly on regional as well global trade. The
Noor-e-Hera<[email protected]> is MPhil Scholar, National University of Modern Languages,
Islamabad. Saima Shafique <[email protected]> is Associate Professor, National University of Modern
Languages. Amir Mustafa <[email protected]> is Assistant Professor, National University of Modern
Languages and PhD Scholar, Federal Urdu University of Arts Science and Technology, Islamabad.
476 Hera, Shafique, and Mustafa
members maintain trade quality and standard to ensure that merchandised food is safe for
buyers, and to prevent the spread of pests or diseases among living organs. Strict health
and safety regulations are being used unnecessarily as an excuse for protecting interests
of domestic producers or to maintain comparative advantage. However, bilateral and
preferential trade liberalisation policies have been initiated and implemented particularly
after accession to WTO.
This research paper analyses the bilateral trade and enforcement of TBT and SPS
measures on Pakistan’s exportable products by partner countries USA, china, and UAE
from 2003-2016, at HS 21 Section products. According to WTO, tariff is customs duty on
merchandise imports; it gives a price advantage to locally produce same goods. Non-
tariff barriers (NTBs) are such measures that imposed on imports include health,
product, labour, environmental standards, internal taxes or charges, and domestic
subsidies. Overwhelmingly, tariff and NTMs are levied to protect home country’s import
competing industrial sector. Tariff are monetary while non-tariff barriers are non
monetary barriers used by importing countries. Such NTBs are reduced under regional,
plurilateral, or free trade agreements, and sometimes eliminated. NTBs increase the cost
of trading, and are more challenging to abolish than the conventional tariff.
The Agreement on the Application of Sanitary and Phytosanitary measures of the
WTO sets out the basic rules for quality and standards. The measures should be initiated
and enforced only to protect living organinisms. Sanitary (human and animal health) and
phytosanitary (plant health) measures apply to trading commodities. For the purpose of
the SPS Agreement as any measures applied to some specific areas i.e. to protect against
risks arising from additives, contaminants, toxins or disease-causing organisms in food;
that protect human life from plant- or animal-carried diseases; and protect from pests,
diseases, or disease-causing organisms, as well to protect the health of fish and fauna, as
well as forests and flora [UNCTAD (2012)]. While technical regulations include product
characteristics, their related processes and production methods. TBT may deal with
terminology, symbols, packaging, marking and labelling requirements. Standards are
approved by an official recognised body which is responsible for issues related to these
measures. The process related to TBT that government officials uses are step by step
starting from procedures for sampling, testing and inspection; then evaluation,
verification and assurance of conformity; and registration, then finally TBT approval and
issue certificates that whether the TBT and SPS should impose on products or not
[UNCTAD (2012)].
Health and hygiene standards are beneficial to household consumers, as these help
to avoid risks associated with food trade and economic losses. If the objective of any SPS
measures is to protect local industry, opposite to health and life of humans, animals and
plants, the measure can be challenged in Dispute Settlement Body (DSB), governed by
the WTO since 1995. The whole process is not only cost ineffective but also a time
consuming proposition.
Agreement on Technical Barriers to Trade and Sanitary and
Phytosanitary Measures
Article 10 of the Agreement on Technical Barriers to Trade stated that WTO “The
TBT agreement aims to ensure that technical regulations, standards, and conformity

Impact of Technical Non-tariff Measures on Pakistan Exports 477
assessment procedures are non-discriminatory and do not create unnecessary obstacles to
trade. At the same time, it recognises WTO members’ right to implement measures to
achieve legitimate policy objectives, such as the protection of human health and safety, or
protection of the environment”. The Article 20b Agreement on sanitary and phytosanitary
stated “The SPS Agreement allows countries to set their own standards. However, that
regulations must be based on scientific findings and should be applied only to the extent
that they are necessary to protect human, animal or plant life or health; they should not
unjustifiably discriminate between countries where similar conditions exist” [WTO
Agreements (2017)].
The Ministry of Commerce Pakistan collaborated with the standardisation bodies
i.e. Pakistan Standards and Quality Control Authority (PSQCA) and Pakistan National
Accreditation Council, Ministry of Science and Technology to implement technical
standards and testing assessments for implementation of TBT and SPS agreements for
exporters and importers. The bodies advise to the Government bodies, industrialists, trade
unions and other stakeholders on technical standardisation policies and programmes to
promote industrial and agricultural productivity and trade. These organisations are also
focal points on TBT and SPS for national and foreign institutions such as ISO and Codex
Alimentarius. While the quality standards related NTBs enquiring and issuing authorities
in importing countries are as General Administration of Quality Supervision, Inspection
and Quarantine of China. American Section of the International Association for Testing
Materials (ASTM), American National Standards Institute (ANSI), [International
Standardisation Organisation (2017)]. Traders, manufacturers and exporters must be
registered with these organisations to ensure adoption and respond according to TBT and
SPS notifications.
The study is organised as follow, Section 1 describes facts and current
implementation status of TBT agreement under WTO regime. Section 2 comprises on
theoretical framework, significance of study, and objectives of the study. The Section 3
contains the literature reviews, and Section 4 explains the research methodology i.e.
selection of variables and data, econometric model and estimation technique. The last
section contains the conclusion and recommendations of the study.
2. THEORETICAL FRAMEWORK
The relationship of non-tariff barriers instruments like TBT and SPS imposed by
importing countries on exporting country products was also explained by traditional
theories. Theoretical literatures explain how much export performance depends upon that
country product related measures, standards and technology. Traditional trade models
predict that countries will specialise in the goods in which they have comparative
advantage either due to technology/productivity according to Ricardo model. According
to trade model based on monopolistic competition developed by Paul Krugman (1980),
identical countries trade differentiated goods because consumers have a preference for
variety. In monopolistic competition only the most productive firms export. Exporting
countries with more productive firms will have a larger number of exporters and products
shipped to overseas markets. On the other hand if exporting costs increase, these models
predict reduction in the number of exporters and hence number of products exported.
Empirical evidence of the presence of large trade costs that exporting countries faces

478 Hera, Shafique, and Mustafa
other than tariffs, suggests that compliance costs of TBT and SPS are also significant
[Melitz (2003); Eaton and Kortum (2002); Melitz and Ottaviano (2007)].
Walter (1971) discussed the implications of non-tariff measures, how were the
NTBs applied to imports by the developed countries and the prospects of developing
countries export performance. The non-tariff measures impact trade in many ways. First,
developing and least developed country exporters are not ready to adjust their
infrastructure according to the market requirements. Second, developing and least
developed countries do not have the technical capacity and expertise to challenge SPS
measures that deviate from international standards due to lack of scientific justification.
Technical barriers to trade and sanitary and phytosantary measures impose compliance
costs on exporters. These compliance costs are related to potential adjustments of
production process, certification procedures, technology upgradation needed to meet the
requirements of the countries imposing such regulations and standards [Schlueter, et al.
(2009)].
The most common approach used in the literature is a gravity model, to understand
the pattern of trade in a globalised world. It has been known since the work of Jan
Tinbergen (1962) shows that the size of bilateral trade flows between any two countries
can be approximated by a law called the “gravity equation” by analogy with the
Newtonian theory of gravitation. Gravity model is stated as the value of trade between
any two countries is proportional; other things equal, to the product of the two countries’
GDPs, and diminish with the distance between the two countries.
Gravity models can arise out of a range of trade theories. In particular, Bergstrand
(1985 and 1989) shows that a gravity model is a direct implication of a model of trade
based on monopolistic competition developed by Paul Krugman (1980). Deardorff (1998)
shows that a gravity model can arise from a traditional factor-proportions explanation of
trade. Eaton and Kortum (2002) derive a gravity-type equation from a Ricardian type of
model, and Helpman, et al. (2008) and Chaney (2008) obtained it from a theoretical
model of international trade in differentiated goods with firm heterogeneity. Gravity
model is well suited to capture the trade effects of NTBs. Moenius (2004) and Mahe
(1997) stated that the gravity model is one of the most successful and therefore widely
used frameworks for empirical analysis of trade flows between countries. The gravity
model has some advantages over other similar methods in estimating the trade flows
among countries. The model can estimate the effects of protection on the volume of trade.
The gravity model is able to contain the trade-enhancing effect of regulations and the
distinct forms of NTBs in estimating the trade flows.
In our study along with Tariff, TBT and SPS, GDP of Pakistan and other
importing countries will also be analysed on export performance. We take real GDP of all
countries, the real GDP of an exporting country to proxy its supply capacity and the real
GDP of an importing country to proxy its demand capacity. GDP indicates country size
and economic development level that can affect export dynamics [Besedina (2015)]. In
particular rich countries are expected to have high demand of standard food and products.
Literatures shows mostly TBT and SPS measures are protectionist tools of developed
nations, and developing nation’s exports badly affected due to these measures [Hoekman
and Mavroidis (2003); Ederington and Ruta (2016)]. The gravity model includes
geographical indicator boarder distance between countries that cause ease in trade in

Impact of Technical Non-tariff Measures on Pakistan Exports 479
terms of transportation cost. Exchange rates also an important variable to include in
analysis. As impact of exchange rate volatility vary across developed and developing
countries, the depreciation of currency against dollars results that country export volume
positively while depreciation of importing country currency against dollars negatively
affect export volume of exporting country [Kurgman, Obstsfeld, and Melitz (2008);
Berman, et al. (2012)].
2.1. Significance of Study
This study provides latest viewpoint of the prevailing situation in Pakistan in the
context of TBT and SPS measures and its impact on exports of Pakistan. Previously no
study conducted to examine the both TBT and SPS measures impact on Pakistan overall
exports with top exports partner countries. This study will also investigate whether tariff
or non tariff barriers to trade affect exports of Pakistan most. We will study the impact of
NTBs on exports and along with other selected variables in Pakistan and importing
countries i.e. GDP, exchange rate, geographical distance, tariff rate. Reformulate a policy
for focusing and improving quality and standards of exported products in Pakistan.
2.2. Objectives of Study
The objectives of the study are following:
To find out the impact of technical barriers to trade and Sanitary, and
phytosanitary measures on exports of Pakistan.
To find out which non-tariff barriers affect more on exports of Pakistan.
To compare impact of tariff and non tariff barriers (TBT and SPS) on exports of
Pakistan.
3. LITERATURE REVIEW
In this chapter we are going to review the empirical studies at nation and
international level, to find the impact/cost of technical barriers to trade and sanitary and
phytosanitary measures imposed by importers on Pakistan exports. Most of researchers
conclude that TBT and SPS measures imposed by importing countries on exports of
partner country hamper exporting countries trade. Some researchers also conclude that
TBT SPS can promote trade as well as restrict trade. These NTBs impact on trade is
negative for developing countries but positive for developed countries.
3.1. Review of International Literature
Non-tariff barriers (NTBs) include number of obstacle that restricts the ability of
companies/countries to export. Non-tariff barriers (NTBs) may now have a greater impact
on trade than tariffs. Ardakani, et al. (2000) used a gravity model to estimate the trade
effect of non-tariff barriers imposed by importer countries on exports of Iran. There study
shows a negative impact of non- tariff barriers (NTBs) on exports and their effect were
greater than that of tariffs. The export and the world demand for agricultural products
increasing focusing on quality, packaging, labelling and standards of products. Europe
Union members have reduces their imports from Iran mostly because of SPS and TBT

480 Hera, Shafique, and Mustafa
measures. According to Bora, Kuwahara, and Laird (2002) the developing world is
vulnerable to non-tariff barriers (NTBs) specially TBT and SPS measures because these
are generally prominent in agriculture (and food generally), textiles, garments and iron
and steel. Mostly these are top exporting products so it affects the trade of developing
countries largely.
There has been an increasing use of technical barriers to trade (TBT) and Sanitary
and Phytosanitary (SPS) measures as instruments of commercial policy in unilateral,
regional, and global trade. These non-tariff barriers (NTBSs) may bear additional cost in
meeting such mandatory standards to developing countries and may causes market
failures Beghin and Bureau (2001), Ferrantino (2006) and Korinek, Melatos and Rau
(2008), Maskus, Otsuki, and Wilson (2001), and Maskus and Wilson (2001). All provide
comprehensive reviews on key economic issues related to TBT and SPS modelling and
measurement. John and Jean (2001) developed methodologies for modelling and
quantifying nontariff barriers (NTB) to both imports and exports. The impact of technical
barriers to trade (TBT) and sanitary and phytosanitary (SPS) measures on trade was
analysed and methods introduces that provide some quantitative estimates of the impact
of such barriers on market equilibrium, trade flows, economic efficiency, and welfare.
They focused on Quantification of the effects of such measures on a particular product.
Bao and Qiu (2010) study also empirically examine the influence of TBT imposed
by China on the 43 trade partner’s agriculture and manufacture products. They use both
frequency index and coverage ratio approaches to quantify technical barrier to trade
(TBT). Frequency index shows that TBT are trade restrictive, due to the falling
probability of market access, china’s import values decreases by 0.8 percent. Before
joining WTO china’s TBT have trade promotion effects, so increases import value by
about 0.2 percent, due to the higher market access probability of importers. There study
also shows that China’s TBT are trade restricting for agriculture goods but trade
promoting for manufacturing goods. That result was also proved by Sithamparam and
Devadason (2011) study.
3.2. Review of National Literature
The technical barriers to trade (TBT) are one of such barriers that affect trade in
Pakistan significantly. The impact of TBT on export performance of Pakistan textile
industry has been empirically tested. Shah, et al. (2014) argued that due to trade
liberalisation; competition has increased, forcing industries to improve their productivity
to compete in this free market. However there is impact of technical barriers to trade
(TBT) on export performance of Pakistan textile industry. There study empirically
evaluated this relationship using primary data. Multiple regression analysis results
indicated that technical barriers to trade (TBT) have positively affected the performance
of Pakistan textile industry. This result shows the TBT measure that Pakistan faces not
create obstacles to international trade, while create harmonisation; firms actively follow
WTO rules related to product quality and standard.
Saleem, et al. (2014) research shows that Pakistan and India tariff measures are
quite high, i.e., 218 percent for agricultural and 176 percent for non-agricultural sector.
Trade barriers between these two countries are a result of economic, political and military
tensions. Pakistan exports experience huge application of non-tariff barriers by India, i.e.,

Impact of Technical Non-tariff Measures on Pakistan Exports 481
technical barriers to trade, sanitary and phytosanitary measures, regulatory and safety
requirements that hamper Pakistani exports to India. India follows a restrictive trade
regime especially in case of agricultural goods, Similarly for textile exports, India
observes a large number of non-tariff barriers including technical barriers to trade (TBT),
and sanitary and phytosanitary (SPS) measures. According to Altaf and Mehmood (2015)
USA is also among the top ten major trading partners of Pakistan. USA is also top of the
list for huge application of non tariff barriers against Pakistan exports. Pakistan face huge
trade costs with USA because of large distance, stressed relationship between the
government, technical and sanitary requirements from USA government. Pakistan is a
country that is included in the list of Restricted Entities by USA, imposition of non-tariff
barriers hampers Pakistan’s textile and clothing products the most.
Ministry of Commerce (2016) highlighted these issues in strategic trade policy
framework 2015-18 and also show government work on it to enhance standards and
exports. Due to use of inefficient technologies Pakistan’s exports of some sectors i.e.,
fans, home appliances, rice, cutlery and sports goods is not increasing. So in order to up
gradation of technology some investment support and markup support programmes are
initiated for investors. As currently no brand certification development support policy in
Pakistan, so the Government decided to provide grant to facilitate the branding and
certification for faster growth of the SME and export sector in Pakistan’s economy.
Ministries of Science and Technology, Commerce and National Food Security and
Research will be constituted to work on quality standardisation and harmonisation of
Pakistan standards. There is considerable potential for increase of exports of basmati
rice, horticulture, meat and meat products and jewellery in China in the short-term
through strategic interventions in technical barriers to trade (TBT) and sanitary and
phytosanitary (SPS) measures.
4. DATA AND METHODOLOGY
In this chapter we present the methodology to conduct the study. The study is be
based on panel data for the period 2003-2016. We will use data of Pakistan exports at HS-2
digit level from 2003-2016 using UN Comtrade database. TBT SPS and Tariff data will be
collected from World Trade Organisation (WTO), and exchange rate and GDP, tariff data
from World Development Indicators (WDI) of the World Bank, and uses gravity indicator
distance from CEPII database. In this study we want to find how much TBT and SPS
measures imposed by importers affect different Pakistan’s exports. To quantify TBT SPS
we use two approaches Frequency index (FI) and Export coverage ratio (CR).
According to Economic survey of Pakistan 2015-16, Pakistan’s major export
partners are United States of America, China, United Arab Emirates.1 These all countries
initiate and enforced Technical barriers to trade (TBT) and Sanitary and phytosanitary
(SPS) measures against Pakistan. All countries are members of World trade organisation
(WTO), but there joining dates of WTO are different. Pakistan joined WTO in 1995; we
collected data of TBT and SPS from WTO,2 for the years of 2003-2016. In our sample,
Pakistan is exporting country, whereas above all are importing country of all agriculture
and industrial level products at HS-2 digit level of Harmonised System. The detail of HS
1Ministry of Finance, Government of Pakistan (2017). 2WTO Integrated Trade Intelligence Portal (I-TIP), online dataset accessed on 16, March 2017.
482 Hera, Shafique, and Mustafa
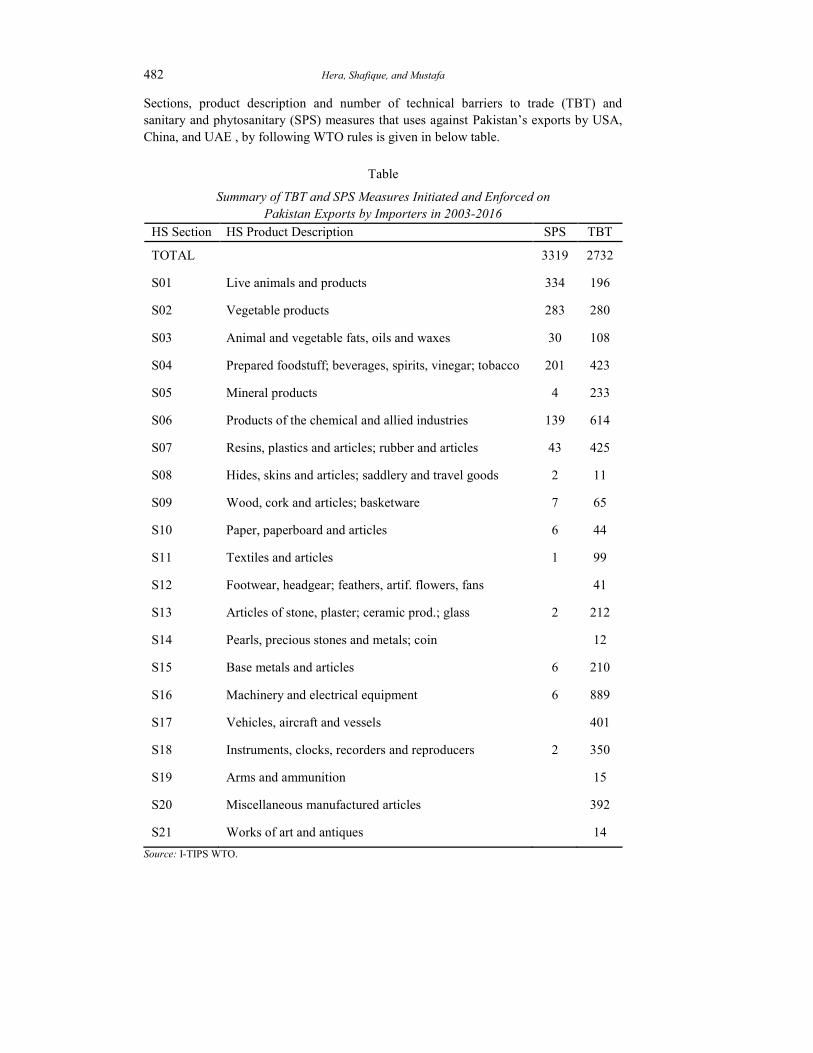
Sections, product description and number of technical barriers to trade (TBT) and
sanitary and phytosanitary (SPS) measures that uses against Pakistan’s exports by USA,
China, and UAE , by following WTO rules is given in below table.
Table
Summary of TBT and SPS Measures Initiated and Enforced on
Pakistan Exports by Importers in 2003-2016
HS Section HS Product Description SPS TBT
TOTAL 3319 2732
S01 Live animals and products 334 196
S02 Vegetable products 283 280
S03 Animal and vegetable fats, oils and waxes 30 108
S04 Prepared foodstuff; beverages, spirits, vinegar; tobacco 201 423
S05 Mineral products 4 233
S06 Products of the chemical and allied industries 139 614
S07 Resins, plastics and articles; rubber and articles 43 425
S08 Hides, skins and articles; saddlery and travel goods 2 11
S09 Wood, cork and articles; basketware 7 65
S10 Paper, paperboard and articles 6 44
S11 Textiles and articles 1 99
S12 Footwear, headgear; feathers, artif. flowers, fans 41
S13 Articles of stone, plaster; ceramic prod.; glass 2 212
S14 Pearls, precious stones and metals; coin 12
S15 Base metals and articles 6 210
S16 Machinery and electrical equipment 6 889
S17 Vehicles, aircraft and vessels 401
S18 Instruments, clocks, recorders and reproducers 2 350
S19 Arms and ammunition 15
S20 Miscellaneous manufactured articles 392
S21 Works of art and antiques 14
Source: I-TIPS WTO.

Impact of Technical Non-tariff Measures on Pakistan Exports 483
4.1. Definition of Variables
Name Variable Description
Expected
Sign Data Source
EX Export Bilateral merchandise exports of
Pakistan to partner countries. It
is calculated in current US
dollars.
UNCOMTRADE
GDP Gross
Domestic
Products
GDP reflects the value of all
goods and services produced by
an country i and j in current US
dollars in a given year. We uses
both GDP of Pakistan and
importing countries.
Positive WDI, World Bank
Dist Distance The geographical distance
between Pakistan and partner
countries borders (in Kilo meters).
CEPII
ER Exchange Rate Exchange rate shows worth of
PK Rupee against US $.
Positive WDI, World Bank
Tariff Tariff Product of simple average tariffs
imposed by partner country on
Pakistan export Products at HS
2 code level.
Negative WDI, World Bank
TBT Technical
Barriers to
Trade
TBT measures deals with
terminology, symbols, package-
ing, marking and labelling
requirements, in order to protect
national security, environment,
human, animal and plants. TBT
measures at HS 2 digit code data
are used.
Negative WTO, I-TIP
SPS Sanitary and
Phytosanitary
The SPS Agreement concerns
with specific risks related to
human health (mostly about
food safety) and animal/plant
health or life or protection from
pests. A SPS measure at HS 2
digit code data is used.
Negative WTO, I-TIP
4.2. Econometric Model
On the basis of discussion with respect to link between exports and the
independent variables (technical barriers to trade, sanitary and phytosanitary, exchange
rate and real GDP), we have specified following model: the NTBs are estimated through
gravity equation. The econometric model predicts that bilateral trade flows are
proportional to the size of their economies and inversely related to the distance between

484 Hera, Shafique, and Mustafa
them. The simplest specification of the gravity model given by Jan Tinbergen (1962)
takes the following form:
… … … (1)
Where is the value of bilateral trade from exporter i to the importer j in time t. GDPit
and GDPjt is the level of real gross product in country i and j in time period t. is the
bilateral geographical distance between countries i and j. where the error term is
assumed to be identically and independently distributed.
The specification of the gravity model for use in studying international trade flows
started with Tinbergen (1962). His specification included the three variables in Equation
(1) addition to a fourth variable (Aijt) that accounts for other variables that are either
promoting or restricting trade between country i and j at time t, as is shown in the
following equation:
… … … (2)
If take its natural log then Equation (2) will be
(3)
In above equation the coefficients . The coefficient
represents the trade friction resulting from trade costs especially transportation costs.
Gravity equation catures the effect includes tariff and non-tariff barriers [World
Trade Report (2012)]. Exchange rate volatility largely affects exports in a country like
Pakistan. The model captures the following characteristics as in Equation (4).
… … (4)
Where
i= exporting country,
j= importing country (1…..3),
t= 1….13,
k= products at HS section level ( 1….21)
Where the explanatory and explained variables are defined as follows:
is the value of Pakistan’s export of product k from country j in year t
is Pakistan’s exchange rate in year t
and are Pakistan’s and country j GDP in year t, respectively.
is the border distance between Pakistan i and partner country j.
is the importing country j tariff applied to product k of exporting
country i in year t;
is the frequency index or export coverage ratio of country j TBT applied
to product k of country i in year t;
is the frequency index or export coverage ratio of country j SPS applied to
product k of country in year t;

Impact of Technical Non-tariff Measures on Pakistan Exports 485
4.3. Quantification Techniques for Technical Barriers to Trade and Sanitary
and Phytosanitary Measures
Inventory Approach
Bora, et al. (2002) provided a review of various approaches to quantify TBT and
SPS. Conventionally, there are two approaches, which are the frequency index and
coverage ratio. In Bao and Qiu (2009, 2010, 2012), uses this approach to quantify these
NTBs. Export coverage ratio (ECR) and frequency index are reviewed by Bora, et al.
(2002), so we used to quantify TBT and SPS effects on Pakistan’s export.
Export Coverage Ratio
The export coverage ratio covers the extent of export covered by enforcement of
TBT and SPS. The ratio of TBT and SPS in Pakistan for product category j in a year is
the percentage of export by Pakistan in product category j which is affected by TBT and
SPS in respective year, and denoted by
∑
∑ × 100 … … … … … … (5)
where i is export good contained in product category j (HS 2). If TBT and SPS is
enforced to good i, the dummy variable Di take value one if TBT and SPS is enforced
and zero otherwise. Vi is the value of good i’s exported by Pakistan to importing country
k. Thus, the coverage ratio of good category j is higher if more of goods are subject to
TBT and SPS scrutiny and/or the goods under TBT and SPS have larger exports values.
However, there is a difficulty with the coverage ratio: the endogeneity of weights in
export values. In extreme, if TBT and SPS is so restrictive in good i, it will preclude all
export of good i, and ultimately the weight Vi will be zero. Coverage ratio is downward
biased in regression. One solution to this issue is to use the counterfactual free trade
weights, but it’s not available. Alternatively, we add frequency index, which does not
suffer from this issue.
Frequency Index
The frequency index covers the presence/absence of TBT and SPS in a product
without considering the exports value covered. FI forwards the percentage of exports
transactions affected by TBT and SPS in Pakistan. Specifically, the frequency index of
TBT and SPS in Pakistan for product category j in a particular year is the percentage of
export goods by Pakistan in product category j affected by importing country k TBT and
SPS in that year:
∑
∑ ×100 … … … … … … (6)
Where i is export good contained in product category j (HS 2). If TBT and SPS is
enforced to good i, the dummy variable Di takes value of one and zero otherwise. Ei is
dummy variable equal to one if value of export of particular product i exists and zero
otherwise. Frequency index does not show relative value of affected goods.

486 Hera, Shafique, and Mustafa
Frequency index measures the number of goods subject to TBT and SPS as
percentage of total number of goods in a good category, whereas coverage ratio measures
value of exports of TBT affected good as percentage of total imports of good category. In
case of frequency index, the occurrence of TBT is not weighted by export value, whereas
in coverage ratio, it weighted by export value.
5. RESULTS AND DISCUSSION
HS sections catagories products into 21 sections products, which further categories
into HS-2 level code products i.e. 1-97 products. We aggregate HS 2 digit coded products
data into HS sections to measures the impact of non-tariff barriers on Pakistan exportable
products. We estimate them by pooling the USA, china, and UAE data, as gravity model
involves some time invariant factors that effect can seen after pooling many countries
data. The pooled Estimated Generalised Least Square (EGLS) results of non-agricultural
products are shown in Table 1. Results of pooled estimated generalised least squares
model show that Pakistan exports for selected trading partner are significantly dependant
on the explanatory variables included in the model. Dependant variable is the log of all
HS section merchandise bilateral export products.
Table 1
Empirical Results of Pooled EGLS: Total Exports at All HS Section Products
Variable Coefficient Std. Error t-Statistic Prob.
C 98.42763 4.086275 24.08737 0.0000*
CRSPS 0.008675 0.001326 6.542395 0.0000*
CRTBT 0.014881 0.000928 16.03816 0.0000*
FISPS –0.001586 0.001482 –1.070189 0.2845
FITBT 0.015948 0.001019 15.65619 0.0000*
Tariff –0.025350 0.003699 –6.853958 0.0000*
ER 0.007458 0.002557 2.916897 0.0035*
GDP 1.662587 0.076175 21.82576 0.0000*
GDPP –0.885426 0.143065 –6.188998 0.0000*
Dist –13.63136 0.373952 –36.45217 0.0000*
R-squared 0.130363 Mean dependent var 14.87961
Adjusted R-squared 0.130207 S.D. dependent var 4.248135
S.E. of regression 3.961926 Sum squared resid 872038.9
F-statistic 832.7983 Durbin-Watson stat 0.433223
Prob(F-statistic) 0.000000 * Significant at 5 percent.
Pooled EGLS (Cross-section random effects) shows export coverage ratio for sanitary
and phytosanitary measures (CRSPS) that USA, China, and UAE impose on Pakistan
exported products encourage exports of Pakistan during the year 2003 to 2016. Result shows
if 1 percent SPS measure imposed by importers then exports of Pakistan increases by 0.008
percent. t-statistics and p-values shows Coverage ratio for SPS is highly significant at 5
percent level of significance. Frequency index for sanitary and phytosanitary measures
(FISPS) that USA, China, and UAE impose on Pakistan exported products discourage exports
of Pakistan during the year 2003 to 2016. Result shows if 1 percent SPS measure imposed by
importers then exports of Pakistan increases by 0.001 percent. However this variable is not
Impact of Technical Non-tariff Measures on Pakistan Exports 487
statistically significant. Export coverage ratio for technical barriers to trade measures
(CRTBT) that USA, China, and UAE impose on Pakistan exported products encourage
exports of Pakistan during the year 2003 to 2016. Result shows if 1 percent TBT measure
imposed by importers then exports of Pakistan increases by 0.014 percent. t-statistics is
16.03816 and p-values is 0.000 shows that is highly statistically significant at 5 percent level
of significance. Frequency index for technical barriers to trade measures (FITBT) that
Pakistan exports faces encourage exports of Pakistan during the year 2003 to 2016. Result
shows if 1 percent increase in TBT measure imposed by importers then exports of Pakistan
increases by 0.015 percent. result shows that it is statistically highly significant.
Tariff always act as an obstacle to international trade thus negatively affect
exports. Because tariffs imposed on goods causing a switch towards intra-national trade
leading to decrease exports. Here estimated coefficient sign for average tariff that
importing countries imposes on Pakistan is negative and is statistically significant.
Results show that 1 percent increase in tariffs will decrease the exports by 0.025 percent.
These results are in line with the findings of Novy (2013) and Wincoop, et al. (2004).
While the results depict that nominal exchange rate (ER) is statistically significant at 5
percent level and has a positive sign. Thus, showing that there is an direct relationship
between depreciation of nominal exchange rate and exports of Pakistan. In other words,
with depreciation of the exchange rate, total volume of exports. The coefficient for
exchange rate suggests that 1 percent depreciation of exchange rate increases exports by
0.0074 percent. It shows that with depreciation of nominal exchange rate increases total
exports with selected countries over the period of 2003-2016.
Results show that the GDP of Pakistan (GDPP) has negative effect on Pakistan’s
export to USA, China, and UAE. 1 percent increase in Pakistan’s GDP decreases Pakistan
export by 0.88 percent . Supporting this result, Irshad (2016) also found similar results.
Conversely, Pakistan’s GDP does not have much influence on its exports. GDP of USA China
UAE (GDP) positively influence Pakistan exports, its coefficient shows 1 percent increase in
there GDP will increase Pakistan export demand by 1.66 percent. Therefore, in present
conditions, Pakistan benefits more from the bilateral trade because its’ exports are positively
correlated with trading partner GDP, which is growing faster than Pakistan’s GDP.
Distance (Dist), common language (Comlang) are geographic determinants of
trade barriers. Distance between the trading partners affects the physical transport cost.
Geographic distance between the trading countries is a hindrance to bilateral trade flows.
The estimated results show that geographic distance between Pakistan and its trading
partners is negatively related to the exports of Pakistan. It indicates that 1 percent
increase in distance decreases the exports by 13.63 percent. In other worlds Pakistan
exports increases as it is demanded by country close to us. It is highly significant at 5
percent level of significance. R2 shows 13 percent exports volume is explained by
independent variables. Our result is consistent with the study of Duan and Jason (2012).
Impact of Technical Barriers to Trade and Sanitary Phytosanitary Measures on
Pakistan Agricultural Exports
HS sections specifies 1-4 code sections to agricultural products. At HS 2 digit
level agricultural products includes 1-23 HS coded products. We aggregate HS 2 digit
coded products data into HS sections to measures the impact of non-tariff barriers on

488 Hera, Shafique, and Mustafa
Pakistan exportable products. We estimate them by pooling the USA, china, and UAE
data, as gravity model involves some time invariant factors that effect can seen after
pooling many countries data. The pooled Estimated Generalised Least Square (EGLS)
results of non agricultural products are shown in Table 2.
Estimation shows that export coverage ratio for sanitary and phytosanitary
measures (CRSPS) that USA, China, and UAE impose on Pakistan exported products
encourage exports of Pakistan during the year 2003 to 2016. Result shows if 1 percent
SPS measure imposed by importers then exports of Pakistan increases by 0.001 percent.
coverage ratio shows very less impact of SPS measure on Pakistan exports and is
statistically insignificant. Frequency index for sanitary and phytosanitary measures
(FISPS) that USA, China, and UAE impose on Pakistan exported products encourage
exports of Pakistan during the year 2003 to 2016. Result shows if 1 percent increase in
SPS measure imposed by importers then exports of Pakistan increases by 0.026 percent.
However this variable is also statistically significant at 5 percent level of significance.
Export coverage ratio for technical barriers to trade measures (CRTBT) that USA, China,
and UAE impose on Pakistan exported products encourage exports of Pakistan during the
year 2003 to 2016. Result shows if 1 percent TBT measure imposed by importers then
exports of Pakistan increases by 0.016 percent. t-statistics is 2.954019 and p-values is
0.000 shows that is highly statistically significant at 5 percent level of significance.
Frequency index for technical barriers to trade measures (FITBT) that Pakistan exports
faces encourage exports of Pakistan during the year 2003 to 2016. Result shows if 1
percent increase in TBT measure imposed by importers then exports of Pakistan increases
by 0.02 percent. Result shows that it is statistically highly significant.
Table 2
Empirical Results of Pooled EGLS: Agricultural Products at HS Section Level
Variable Coefficient Std. Error t-Statistic Prob.
C 79.69269 21.35894 3.731116 0.0002*
CRSPS 0.001355 0.004762 0.284580 0.7760
CRTBT 0.016346 0.005533 2.954019 0.0032*
FISSPS 0.026176 0.005341 4.901337 0.0000*
FITBT 0.020580 0.006473 3.179119 0.0015*
Tariff –0.024511 0.015472 –1.584185 0.1133
ER 0.029293 0.013356 2.193212 0.0284*
GDP 1.019995 0.397195 2.567994 0.0103*
GDPP –0.093610 0.754870 –0.124008 0.9013
Dist –11.75108 1.935304 –6.071959 0.0000*
R-squared 0.211033 Mean dependent var 15.07567
Adjusted R-squared 0.202724 S.D. dependent var 4.361669
S.E. of regression 3.894548 Akaike info criterion 5.567885
Sum squared resid 30244.01 Schwarz criterion 5.629093
Log likelihood –5590.428 Hannan-Quinn criter. 5.590350
F-statistic 25.39784 Durbin-Watson stat 0.491850
Prob(F-statistic) 0.000000
*Significant at 5 percent.

Impact of Technical Non-tariff Measures on Pakistan Exports 489
Tariff (T) always act as an obstacle to international trade thus negatively affect
exports. Because tariffs imposed on goods causing a switch towards intra-national
trade leading to decrease exports. Here estimated coefficient sign for average tariff
that importing countries imposes on Pakistan is negative and is statistically
insignificant. Results show that 1 percent increase in tariffs will decrease the exports
by 0.024 percent. While the results depict that nominal exchange rate (ER) is
statistically significant at 5 percent level and has a positive sign. Thus, showing that
there is an direct relationship between depreciation of nominal exchange rate and
exports of Pakistan. In other words, with depreciation of the exchange rate, total
volume of exports. The coefficient for exchange rate suggests that 1 percent
depreciation of exchange rate increases exports by 0.02 percent. It shows that with
depreciation of nominal exchange rate increases total exports with selected countries
over the period of 2003-2016.
Results show that the GDP of Pakistan (GDPP) has negative effect on
Pakistan’s export to USA, China, and UAE. 1 percent increase in Pakistan’s GDP
decreases Pakistan export by 0.093 percent. GDP of Pakistan is statistically
insignificant for export volume as Pakistan economy is in position to complete with
partner developed countries. GDP of USA China UAE (GDP) positively influence
Pakistan exports, its coefficient shows 1 percent increase in there GDP will increase
Pakistan export demand by 1.01 percent and statistically significant. Therefore, in
present conditions, Pakistan benefits more from the bilateral trade because its ’
exports are positively correlated with trading partner GDP, which is growing faster
than Pakistan’s GDP.
Distance (Dist) is geographic determinants of trade barriers. Distance between
the trading partners affects the physical transport cost. Geographic distance between
the trading countries is a hindrance to bilateral trade flows. The estimated results
show that geographic distance between Pakistan and its trading partners time
invariant and is negatively related to the exports of Pakistan. It indicates that 1
percent increase in distance decreases the exports by 11.75 percent. In other worlds
Pakistan exports increases as it is demanded by country close to us. It is highly
significant at 5 percent level of significance. R2
shows 21 percent exports volume is
explained by independent variables. Our result is consistent with the study of Duan
and Jason (2012).
Impact of Technical barriers to Trade and Sanitary Phytosanitary Measures on
Pakistan Non-agricultural Exports
HS sections specifies 5 to 21 code sections to manufacture products. At HS 2 digit
level manufacture products includes 24 to 97 HS coded products. We aggregate HS 2
digit coded products data into HS sections to measures the impact of non-tariff barriers
on Pakistan exportable products. We estimate them by pooling the USA, china, and UAE
data, as gravity model involves some time invariant factors that effect can seen after
pooling many countries data. The pooled Estimated Generalised Least Square (EGLS)
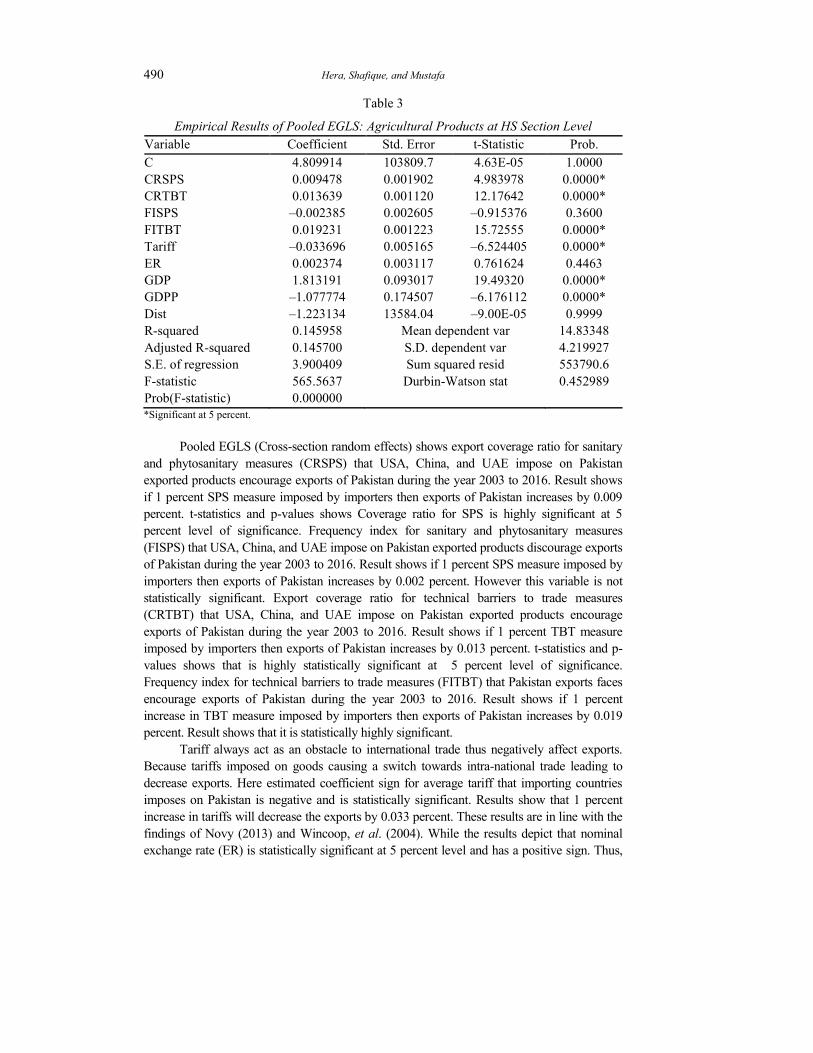
results of non agricultural products are shown in Table 3.
490 Hera, Shafique, and Mustafa
Table 3
Empirical Results of Pooled EGLS: Agricultural Products at HS Section Level
Variable Coefficient Std. Error t-Statistic Prob.
C 4.809914 103809.7 4.63E-05 1.0000
CRSPS 0.009478 0.001902 4.983978 0.0000*
CRTBT 0.013639 0.001120 12.17642 0.0000*
FISPS –0.002385 0.002605 –0.915376 0.3600
FITBT 0.019231 0.001223 15.72555 0.0000*
Tariff –0.033696 0.005165 –6.524405 0.0000*
ER 0.002374 0.003117 0.761624 0.4463
GDP 1.813191 0.093017 19.49320 0.0000*
GDPP –1.077774 0.174507 –6.176112 0.0000*
Dist –1.223134 13584.04 –9.00E-05 0.9999
R-squared 0.145958 Mean dependent var 14.83348
Adjusted R-squared 0.145700 S.D. dependent var 4.219927
S.E. of regression 3.900409 Sum squared resid 553790.6
F-statistic 565.5637 Durbin-Watson stat 0.452989
Prob(F-statistic) 0.000000
*Significant at 5 percent.
Pooled EGLS (Cross-section random effects) shows export coverage ratio for sanitary
and phytosanitary measures (CRSPS) that USA, China, and UAE impose on Pakistan
exported products encourage exports of Pakistan during the year 2003 to 2016. Result shows
if 1 percent SPS measure imposed by importers then exports of Pakistan increases by 0.009
percent. t-statistics and p-values shows Coverage ratio for SPS is highly significant at 5
percent level of significance. Frequency index for sanitary and phytosanitary measures
(FISPS) that USA, China, and UAE impose on Pakistan exported products discourage exports
of Pakistan during the year 2003 to 2016. Result shows if 1 percent SPS measure imposed by
importers then exports of Pakistan increases by 0.002 percent. However this variable is not
statistically significant. Export coverage ratio for technical barriers to trade measures
(CRTBT) that USA, China, and UAE impose on Pakistan exported products encourage
exports of Pakistan during the year 2003 to 2016. Result shows if 1 percent TBT measure
imposed by importers then exports of Pakistan increases by 0.013 percent. t-statistics and p-
values shows that is highly statistically significant at 5 percent level of significance.
Frequency index for technical barriers to trade measures (FITBT) that Pakistan exports faces
encourage exports of Pakistan during the year 2003 to 2016. Result shows if 1 percent
increase in TBT measure imposed by importers then exports of Pakistan increases by 0.019
percent. Result shows that it is statistically highly significant.
Tariff always act as an obstacle to international trade thus negatively affect exports.
Because tariffs imposed on goods causing a switch towards intra-national trade leading to
decrease exports. Here estimated coefficient sign for average tariff that importing countries
imposes on Pakistan is negative and is statistically significant. Results show that 1 percent
increase in tariffs will decrease the exports by 0.033 percent. These results are in line with the
findings of Novy (2013) and Wincoop, et al. (2004). While the results depict that nominal
exchange rate (ER) is statistically significant at 5 percent level and has a positive sign. Thus,
Impact of Technical Non-tariff Measures on Pakistan Exports 491
showing that there is an direct relationship between depreciation of nominal exchange rate and
exports of Pakistan. In other words, with depreciation of the exchange rate, total volume of
exports. The coefficient for exchange rate suggests that 1 percent depreciation of exchange
rate increases exports by 0.002 percent. It shows that with depreciation of nominal exchange
rate increases total exports with selected countries over the period of 2003-2016.but
insignificant for non agriculture products.
Results show that the GDP of Pakistan (GDPP) has negative effect on Pakistan’s
export to USA, China, and UAE. 1 percent increase in Pakistan’s GDP decreases
Pakistan export by 1.07 percent. Conversely, Pakistan’s GDP does not have much
influence on its exports. GDP of USA China UAE (GDP) positively influence Pakistan
exports, its coefficient shows 1 percent increase in there GDP will increase Pakistan
export demand by 1.81 percent. Therefore, in present conditions, Pakistan benefits more
from the bilateral trade because its’ exports are positively correlated with trading partner
GDP, which is growing faster than Pakistan’s GDP.
Distance (Dist) is geographic determinants of trade barriers, and it is time
invariant. Distance between the trading partners affects the physical transport cost.
Geographic distance between the trading countries is a hindrance to bilateral trade flows.
The estimated results show that geographic distance between Pakistan and its trading
partners is negatively related to the exports of Pakistan. It indicates that 1 percent
increase in distance decreases the exports by 1.22 percent. In other worlds Pakistan
exports increases as it is demanded by country close to us. R2
shows 14 percent exports
volume is explained by independent variable.
5. CONCLUSION AND POLICY RECOMMENDATIONS
TBT and SPS measures encourage Pakistan exports to its major trading partners
i.e. USA, UAE and China. TBT impact on Pakistan exports is relatively more dominant
and encouraging then tariff. Tariff hampers exports of Pakistan. Stringent and alarming
for Government to take immediate necessary actions to tackle the issue to maintain its
comparative advantageous position in concentrated commodity exports. Government
must comply on projects suggested in trade policy frame work 2015-18. It is the need of
time that government should update the capacity building of nodal points i.e., Pakistan
Standards and Quality Control Authority (PSQCA), and Pakistan National Accreditation
Council (PNA), and Ministry of Science and Technology to boost exports. Reshaping
size and dimensions of GDPs of China and USA, as well as UAE may help Pakistan to
avail market share with assistance of China. Protectionist macroeconomic policies in
wake of CPEC and emergence of Chinese economy at global level reinforce Pakistan to
increase its competitiveness to boost exports.
REFERENCES
Alaeibakhsh, S. and Z. Ardakani (2012) Quantifying the Trade Effects of SPS and TBT
Agreements on Export of Pistachios From Iran. World Applied Sciences Journal 16:5,
637–641.
Ali, S. (2016) Export Response to Sanitary and Phytosanitary Measures and Technical
Barriers to Trade: Firm-level Evidence from a Developing Country. (CREDIT
Research Paper 16/02 (No. 2016-02)).

492 Hera, Shafique, and Mustafa
Ali, S., A. Sajid, and S. Shah (2014) The Impact of Technical Barrier to Trade on
Pakistan Textile Industry. Pakistan Journal Of Science 66:2.
Anderson, J. E. and E. Van Wincoop (2004) Trade Costs. Journal of Economic Literature
42:3, 691–751.
Ardakani, Z., S. Yazdani, and O. Gilanpour (2009) Studying the Effects of Non-Tariff
Barriers on the Export of the Main Agricultural Products of Iran. American Journal of
Applied Sciences 6:7. 1321–1326.
Arita, S., L. Mitchell, and J. Beckman (2015) Estimating the Effects of Selected Sanitary
and Phytosanitary Measures and Technical Barriers to Trade on US-EU Agricultural
Trade. Economic Research Report 199.
Bao, X. and L. D. Qiu (2009) Quantifying the Trade Effects of Technical Barriers to
Trade: Evidence from China.
Bao, X. and L. Qiu (2010) Do Technical Barriers to Trade Promote or Restrict Trade?
Evidence from China, Asia-Pacific Journal of Accounting and Economics 17:3, 253–
278.
Bao, X. and L. Qiu (2012). How Do Technical Barriers to Trade Influence Trade? Review
of International Economi 20:4, 691-706.
Beghin, J. C. and J. C. Bureau (2001) Quantification of Sanitary, Phytosanitary, and
Technical Barriers to Trade for Trade Policy Analysis, Centre for Agricultural and
Rural Development (Working Paper 01-WP 291).
Bergstrand, J. H. (1985) The Gravity Equation in International Trade: Some
Microeconomic Foundations and Empirical Evidence. The Review of Economics and
Statistics, 474–481.
Bergstrand, J. H. (1989) The Generalized Gravity Equation, Monopolistic Competition,
and the Factor-proportions Theory in International Trade. The Review of Economics
and Statistics, 143–153.
Berman, N., P. Martin, and T. Mayer (2012) How Do Different Exporters React to
Exchange Rate Changes? The Quarterly Journal of Economics 127:1, 437–492.
Besedina, E. (2015) Technical Barriers to Trade and SPS Measures and Export
Dynamics. Norway: Norwegian Institute Of International Affairs. (NUPI Working
Paper 842).
Bora, B., A. Kuwahara, and S. Laird (2002) Quantification of Non-Tariff Measures,
Policy Issues in International Trade and Commodities. UNCTAD Study Series 18.
Chaney, T. (2008) Distorted Gravity: The Intensive and Extensive Margins of
International Trade. American Economic Review 98:4, 1707–21.
Chen, M., T. Otsuki, and J. Wilson (2006) Do Standards Matter for Export Success.
World Bank Policy Research Working Paper 3809.
Chevassus-Lozza, E., D. Majkovic, V. Persillet, and M. Unguru (2005) Technical
Barriers to Trade in the European Union: Importance for the New EU Members. An
Assessment for Agricultural and Food Products. In 2005 International Congress,
August 23-27, 2005, Copenhagen, Denmark (No. 24621). European Association of
Agricultural Economists.
Dal Bianco, A., V. L. Boatto, F. Caracciolo, and F. G. Santeramo (2015) Tariffs and
Non-Tariff Frictions in the World Wine Trade. European Review of Agricultural
Economics Jbv008.
Impact of Technical Non-tariff Measures on Pakistan Exports 493
Deardorff, A. V. and R. M. Stern (1998) Measurement of Nontariff Barriers (Vol. 179).
University of Michigan Press.
Disdier, A., B. Fekadu, C. Murillo, and S. Wong (2008) Trade Effects of SPS and TBT
Measures on Tropical and Diversification Products. ICTSD Project on Tropical
Products. Switzerland: International Centre for Trade and Sustainable Development.
(Issue Paper No. 12).
Ederington, J. and M. Ruta (2016) Nontariff Measures and the World Trading
System. Handbook of Commercial Policy 1, 211–277.
Ferrantino, M. (2006) Quantifying the Trade and Economic Effects of Non-tariff
Measures.
GATT (1994) Agreement on Technical Barrier to Trade.General Agreement on Tariff
And Trade. Switzerlan: World Trade Organisation.
Helpman, E., M. Melitz, and Y. Rubinstein (2008) Estimating Trade Flows: Trading
Partners and Trading Volumes. Quarterly Journal of Economics 123: 441–87.
Hoekman, B. and P. Mavroidis (2003) Economic Development, Competition Policy and
the World Trade Organisation. Journal of World Trade 37, 1–28.
Irshad, M., Q. Xin, and H. Arshad (2016) SWOT Analysis of Pakistan-China Free Trade
Agreement: Pros and Cons. International Journal of Asian Scocial Science 7:1.
Johnson, R. (2014) Sanitary and Phytosanitary (SPS) and Related Non-Tariff Barriers to
Agricultural Trade. Congressional Research Service.
Johnston, J. and J. Dinardo (2011) Econometric Methods. 4th Edition. Mcgraw-Hill.
Kareem, O. I. (2012) Non–tariff Barriers and Exports: An Impact Analysis from Africa–
EU and Africa–USA Trade Relations.
Kayani, U. and S. Shah (2014) Non-tariff Barriers and Pakistan Regional Trade.
International Growth Centre, Pakistan: Lahore University of Management Sciences.
Korinek, J., M. Melatos, and M. Rau (2008) A Review of Methods for Quantifying the
Trade Effects of Standards in the Agric-food Sector. (OECD Trade Policy Working
Paper No. 79).
Krugman, P. (1980) Scale Economies, Product Differentiation, and the Pattern of Trade.
The American Economic Review 70:5, 950–959.
Krugman, P. R. (2008) International Economics: Theory and Policy, 8/E. Pearson
Education India.
Krugman, P. R., M. Obstfeld, and M. J. Melitz (2012) International Economics: Theory
and Policy, 9/E. Pearson Education India.
Mahe, L. P. (1997) Environment and Quality Standards in the WTO: New Protectionism
in Agricultural Trade? A European Perspective. European Review of Agricultural
Economics 24:3-4, 480–503.
Maskus, K. E. and J. S. Wilson (2000, April) Quantifying the Impact of Technical
Barriers to Trade: A Review of Past Attempts and the New Policy Context. In World
Bank Workshop on Quantifying the Trade Effect of Standards and Technical Barriers:
is it Possible (Vol. 27). Development Research Group (DECRG), USA: The World
Bank.
Melitz, M. (2003) The Impact of Trade on Intra-Industry Reallocations and Aggregate
Industry Productivity. Econometrica 71, 1695–1725.

494 Hera, Shafique, and Mustafa
Melitz, M. J. and G. I. Ottaviano (2008) Market Size, Trade, and Productivity. The
Review of Economic Studies 75:1, 295–316.
Ministry of Commerce (2016) Strategic Trade Policy Framework 2015-18. Pakistan:
Government of Pakistan.
Moenius, J. (2004) Information versus Product Adaptation: The Role of Standards in
Trade. International Business and Markets Research Centre. (Working Paper No. 1).
Mustafa, K. and S. Ahmad (2003) Barriers against Agricultural Exports from Pakistan:
The Role of WTO Sanitary and Phytosanitary Agreement. The Pakistan Development
Review 42:4, 487–510.
Novy-Marx, R. (2013) The Other Side of Value: The Gross Profitability Premium.
Journal of Financial Economics 108:1, 1–28.
Prevost, D. (2009) Sanitary, Phytosanitary and Technical Barriers to Trade in the
Economic Partnership Agreements Between the European Union and the ACP
Countries, International Centre For Trade And Sustainable Development. (Issue Paper
No. 6).
Schlueter, S. W., C. Wieck, and T. Heckelei (2009) Regulatory Policies in Meat Trade: Is
There Evidence for Least Trade Distorting Sanitary Regulations. American Journal of
Agricultural Economics 91:5, 1484–1490.
Shabbir, S. and R. Kazmi (2007) Economic Effects of the Recently Signed Pak-China
Free Trade Agreement, The Lahore Journal of Economics 12(Special Edition), 174–
202.
Shah, S., A. Sajid, and S. Ali (2014) The Impact of Technical Barrier to Trade on
Pakistan Textile Industry. Pakistan Journal of Science 66:2.
Sithamaparam, A. G. and E. S. Devadason (2011) Do Non-tariff Measures in the EU,
Japan and the ASEAN Matter for Export Consignments from Malaysia?
Staiger, R. (2012) Non-Tariff Measures and the WTO. Economic Research and Statistics
Division, World Trade Organisation. (Staff Working Paper ERSD-2012-01).
Tinbergen, J. (1962) Shaping the World Economy. Suggestions for an International
Economic Policy. Twentieth Century Fund.
UNCTAD (2015) International Classification of Non-tariff Measures, Version 2012,
Available at http://unctad.org/en/PublicationsLibrary/ditctab20122_en.pdf
Walter, I. (1971) Nontariff Barriers and the Export Performance of Developing
Economies. The American Economic Review 61:2, 195–205.
Wong, S. A. (2007) The Effects of SPS and TBT Measures on Banana and Pineapple
Trade in Ecuador. ESPAE.
World Trade Report (2012) The Trade Effects of Non-tariff Measures and Services
Measures. The World Bank.
WTO (2016) Twenty-First Annual Review of the Implementation of the Operation of the
TBT Agreement. Switzerland: World Trade Organisation.