impact of the aggressive working capital management policy
TRANSCRIPT

Impact of the Aggressive Working Capital Management Policy
on Firm’s Profitability and Value: Study on Non-Financial Listed
Firms in Indonesia Stock Exchange
Rosyeni Rasyid1*
1Economic Faculty, Universitas Negeri Padang
Email: [email protected]
ABSTRACT
Effective working capital management policies is crucial to the company’s long survival. The
working capital policy is concerned with determining the aggregate amount of a firm’s current
assets and current liabilities is required by a firm. This study investigates the impact of the
aggressive working capital management policy on firm’s profitability and value of non-financial
listed firms. This study collected the data from 393 non-financial Indonesian listed companies in
2014. The data were analyzed by using multiple linear regression. The findings have established
that aggressive working capital policy has a significant influence on the company profitability,
however, it has no significant impact on the market value of the company. Moreover, this study
found that aggressive investment policy (AIP) has a positive relationship with the profitability.
Surprisingly, the finding showed that the aggressive financing policy (AFP) has a negative
impact on profitability. Accordingly, to increase the company’s market value, the manager must
increase profitability by optimizing investment on current asset and by adding the proportion
of long-term financing in working capital. In addition, this study employed leverage ratio and
firm’s size as the control variables. Finally, this study has also discussed some limitations and
future research.
Type of Paper: Empirical
Keyword: Aggressive Investment Policy; Aggressive Financing Policy; Leverage; Size;
Profitability; Value of the Firm
1. Introduction
Working capital is very crucial to maintain the smooth running of a business and to support the
achievement of corporate goals. Working capital connected to investment in current assets and
current liabilities. The optimal level of working capital is determined by the method which is
adopted for the management of current asset and current liabilities (ALShubiri, 2011). Working
capital management will be affecting the liquidity and profitability, but there is always a trade-off
between liquidity and profitability. Efficient management of working capital is a fundamental
part of the overall corporate strategies in creating the shareholders’ value. (Afza, 2007)
From the perspective of the financial manager, working capital management is a simple and
straightforward concept in ensuring the ability of the organization in financing the short-term
11th International Conference on Business and Management Research (ICBMR 2017)
Copyright © 2017, the Authors. Published by Atlantis Press. This is an open access article under the CC BY-NC license (http://creativecommons.org/licenses/by-nc/4.0/).
Advances in Economics, Business and Management Research, volume 36
207
assets and short-term liabilities. In practice, working capital management policy has become one
of the most important issues in the organizations where many financial executives are struggling
to identify the basic working capital drivers and an appropriate level of working capital.
The working capital policy is concerned with determining the composition of a firm’s current
assets and current liabilities. There are three alternative working capital policies, that is
including aggressive, moderate, and conservative (Weston & Copeland, 2008). Each of these
policies involves risk-return trade-offs. A firm may adopt an aggressive approach with the
company holds a relatively small proportion of its total assets in the form current assets or uses
a relatively high proportion of short term debt. As a result, this policy will result from a higher
profitability and a higher risk that the company. To select the working capital management
policy, a firm’s management must evaluate the trade-off between expected return and risk.
Optimal working capital will occur when there is a balance achieved between risk and efficiency
(Afza & Nazir, 2009).
The high proportion of current assets may reduce the risk of liquidity which is associated with
the opportunity cost of funds that may have been invested in long-term assets. The company
tries to maintain an optimal working capital to maximize the value of the company. This
research examines the potential relationship between aggressive investment policies, aggressive
financing policies, profitability and firm’s value. Furthermore, this study also examines the
link between aggressive working capital management on the profitability and firm’s value by
using leverage and firm’s size as the control variables. This study is expected to contribute to
a better understanding of the relationship between aggressive investment and financing policy,
profitability and market value of non-financial listed firms in Indonesia Stock Exchange.
This research aims to examine the presence of herding behavior in Indonesia and Singapore
stock markets. By using two different stock market, this research compared the investor’s herd
mentality between the stock exchange in developed country and developing country. Moreover,
this research examined whether there is herding spillover or whether stock market condition
of one country affect the herding behavior in the other country. Economou et al. (2011) argue
that herding behavior within the inter-state scope will potentially lead to instability of the stock
market inside the Eurozone. The urgency is reinforced by the results of several studies that
mention that ASEAN capital markets are increasingly integrated. Sharma and Wongbangpo
(2002) proved that stock markets in Indonesia, Thailand, Malaysia and Singapore have long-
term relationships, or in other words, integrated. Click and Pulmmer (2005) prove that by using
the period after the monetary crisis of 1998, stock markets in Indonesia, Thailand, Malaysia,
Singapore and the Philippines are integrated and not limited by borders between countries.
2. Literature Review
Working capital management is very crucial for the company because it will affect the
company’s performance and corporate value. Working capital policy concerned about the level
current assets and proportion short term debt to use in financing these assets. This decision
also involves trade-offs between profitability and risk. Working capital policy, including
two fundamental questions: (1) how the amount of the current assets should be owned by
the company, and (2) how it should be financed current assets? Working capital management
policy involves defining the working capital policy and the implementation of those policies in
daily operations. (Brigham & Houston, 2015), (Koh, Brigham, & Ehrhardt, 2014)
Advances in Economics, Business and Management Research, volume 36
208

The working capital investment policy is concerned with determining the aggregate amount
and composition of investment in current assets, which might be different for each company.
While working capital financing policy is concerned with determining the proportions of short-
term and long-term finance used by a company. When the proportion of short-term debt used
is increased, the expected profitability and the risk also increased. Hence, the assessment of
working capital investment and financing policy involves analysis of financial information for
one company alone.
Investment in current assets is largely determined by the nature of the firm’s business and how
efficiently the firm is managed. Firms might use short-term and long-term financing. There
are two differences in the characteristics of short-term funding and long-term funding sources.
The characteristics of short-term financing are: 1) short-term financing has a relatively short
lifespan, so it has a high risk of having the immediate payment of interest and principal, and 2)
normally has short time payment maturity, however, the total cost of funding is relatively lower.
While the characteristics of long-term financing are: 1) funding has a relatively long payment
maturity, so, it has a lower risk for principal repayment which is made within a relatively long
period, and 2) long-term funding sometimes has a relatively high-interest rate and with long
time credit period, so the total cost of funding is relatively high.
By paying attention to the characteristics of financing which is reflecting the trade-off between
risk and financing costs in determining the combination of short-term and long-term financing,
a financial manager must concern with two situations. The first, using short-term funding
resulted in high risk of repayment but it has low funding costs, and the second, long term
funding leads to the low risk of repayment but it has high funding costs. About the use of short-
term or long term financing, there are three types of funding policy, namely: 1) hedging policy,
2) conservative policy, and 3) aggressive policy, (Keown, Martin, Petty, & Scott, 2013), and
(Horne & Wachowicz, 2009).
Profitability is the company’s ability to generate earnings in certain periods, either in the form of
operating profit or net income. Profit is a measurement of corporate performance. Accordingly,
when the company has a high profit means better performance and vice versa. Profitability is
a tool in analyzing the performance of management; profitability will describe the position
of corporate profits. The investors in the capital market has a high interest on the company’s
ability to generate and increase profits. It is an attraction for investors in buying and selling
shares. Therefore, the management should be able to meet the targets that have been set. The
company’s profitability was measured by using a variable return on assets ratio. This ratio was
calculated by comparing net income and total assets.
Company size and leverage are the determinant of company performance. A larger company
is usually more established and it is assumed that it could operate effectively and outperform
a smaller company. The large company can exploit benefits of economies of scale, it may
perform better than a small company.
Some studies have provided conflicting results on the impact of aggressive working capital
policy on profitability and firm’s value. (Wanguu, 2015) have found the significant positive
relationship between aggressive investment policy (AIP) on profitability and a significant
negative relationship between aggressive financing policy (AFP) on profitability. While
(ALShubiri, 2011) found the significant negative relationship between AIP and AFP on
Advances in Economics, Business and Management Research, volume 36
209

Independent variables Dependent variables
- Aggressive Investment
Policy (AIP)
- Aggressive Financing
Policy(AFP)
- Leverage (DAR) (control)
- Firm Size (FS) (control)
- Return on assets (ROA)
- Firm Value (FV)
Figure 1: Conceptual framework
profitability. Moreover (Amiri, 2014) found that there is no relationship between AIP and AFP
with profitability. Some researchers reported a positive impact of AFP on profitability (Mwangi,
Makau, & Kosimbei, 2014); (Kungu, Wanjau, & Waititu, 2014), and others reported a negative
effect (Vahid, Mohsen, & Mohammadreza, 2012), (Vahid, 2012); (Javid & Zita, 2014) and
(Afza T. &., 2007). Working capital management policy also influences a firm’s value. Some
researchers reported a negative impact of AFP on firm’s value (Javid & Zita, 2014); (Ogundipe,
Idowu, & Lawrwncia, 2012), and (Bandara, 2015)
2.1 Conceptual Framework and Hypothesis
The aggressive working capital policy refers to maintaining a high short-term liabilities level
and a low level of current assets compared to the total assets. A firm may adopt an aggressive
investment policy with a low level of current assets as a percentage of total assets or it may also
use for the financing decisions of the firm in the form of high level of current liabilities as the
percentage of total liabilities. Aggressive current assets and current liabilities may influence the
profitability and the value of the firm. In some previous studies, leverage and size of the firm
have a significant influence on the profitability of the company. So, it might be assumed that
the variable leverage and size are the antecedents of the company profitability and value of the
firm. Hence, in this study, the researcher employed them as the control variables.
Hypothesis
1. Aggressive working capital management policy has a significant effect on profitability.
2. Aggressive working capital policy has a significant effect on firm value
3. Research Methodology
3.1 Research Design
This study utilized a quantitative approach. This study collected the secondary data from non-
financial listed firms in Indonesia Stock Exchange. This study aims to prove two hypotheses,
including investigating the impact of the aggressive policy of working capital on profitability
and the impact on the company value.
3.2 Population and Sample
The population of this research is all non-financial companies which are listed on Indonesia
Advances in Economics, Business and Management Research, volume 36
210

Table 1. Variable Description
Variable Measure
Dependent Variable
Return on Asset (ROA) ROA =
Value of the Firm (Tobin’s Q) Tobin’s Q =
Independent Variable
Aggressive Working Capital Policy:
-Aggressive Investment Policy AIP)
-Aggressive Financing Policy
- AIP =
- AFP =
Control Variables
Financial Debt Ratio (DR) DAR =
Size of Firm (FS) FS = Natural Logarithm of Asset
Table 2. Summary Descriptive Statistics
N Minimum Maximum Mean Std. Deviation
ROA 393 -,2080 ,2904 ,0390 ,0674
TOBIN’S Q 393 ,1694 8,1265 1,534 1,1296
AIP 393 ,0010 ,9768 ,4514 ,2417
AFP 393 ,0002 ,9790 ,2940 ,1945
DAR 393 ,0001 1,4069 ,4780 ,2397
FS 393 10,8387 18,2691 14,6705 1,5346
Stock Exchange in2014. The study has excluded financial companies, such as bank and
insurance company because they have different regulation compared to other companies.
This study employed purposive sampling as the sampling method with some criteria, such as
the company must have a policy of aggressive policy in funding and investment on working
capital. Based on these criteria, this study has selected 393 companies from several sectors as
the samples.
3.3 Variables Description
The variable description shown in Table 1.
3.4 Data Analysis:
This study used descriptive statistics, such as mean, maximum, minimum, standard deviation,
to describe the data and rRegression analysis was used to examine the impact of Aggressive
working capital as aggressive investment policy(AIP), and aggressive financing policy (AFP)
on profitability (ROA) and Firm Value (Tobin’s Q), and leverage (DAR), firm size (FS) as
control variables. The regression equation took the following form:
Equation 1: ROA = + AIP + AFP+ DAR + FS+ (1)
Equation 2: Tobin’s Q = + AIP + AFP+ DAR + FS+ e (2)
Advances in Economics, Business and Management Research, volume 36
211
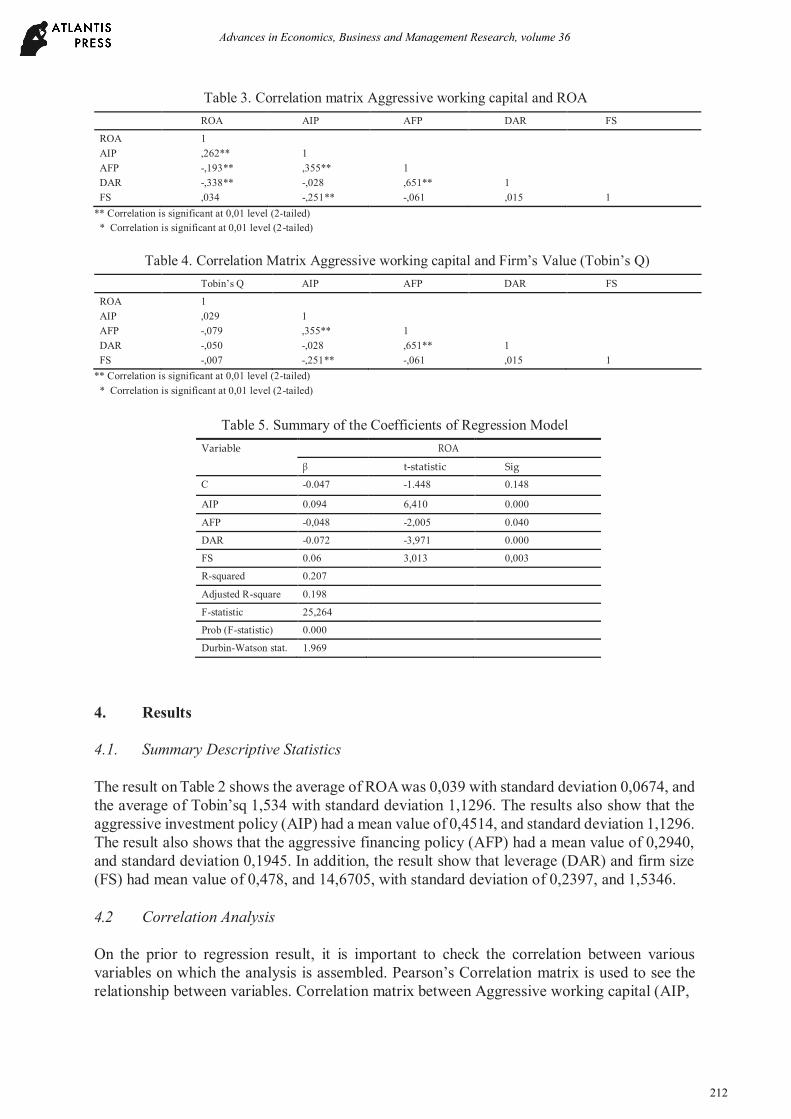
Table 3. Correlation matrix Aggressive working capital and ROA
ROA AIP AFP DAR FS
ROA 1
AIP ,262** 1
AFP -,193** ,355** 1
DAR -,338** -,028 ,651** 1
FS ,034 -,251** -,061 ,015 1
** Correlation is significant at 0,01 level (2-tailed)
* Correlation is significant at 0,01 level (2-tailed)
Table 4. Correlation Matrix Aggressive working capital and Firm’s Value (Tobin’s Q)
Tobin’s Q AIP AFP DAR FS
ROA 1
AIP ,029 1
AFP -,079 ,355** 1
DAR -,050 -,028 ,651** 1
FS -,007 -,251** -,061 ,015 1
** Correlation is significant at 0,01 level (2-tailed)
* Correlation is significant at 0,01 level (2-tailed)
Table 5. Summary of the Coefficients of Regression Model
Variable ROA
β t-statistic Sig
C -0.047 -1.448 0.148
AIP 0.094 6,410 0.000
AFP -0,048 -2,005 0.040
DAR -0.072 -3,971 0.000
FS 0.06 3,013 0,003
R-squared 0.207
Adjusted R-square 0.198
F-statistic 25,264
Prob (F-statistic) 0.000
Durbin-Watson stat. 1.969
4. Results
4.1. Summary Descriptive Statistics
The result on Table 2 shows the average of ROA was 0,039 with standard deviation 0,0674, and
the average of Tobin’sq 1,534 with standard deviation 1,1296. The results also show that the
aggressive investment policy (AIP) had a mean value of 0,4514, and standard deviation 1,1296.
The result also shows that the aggressive financing policy (AFP) had a mean value of 0,2940,
and standard deviation 0,1945. In addition, the result show that leverage (DAR) and firm size
(FS) had mean value of 0,478, and 14,6705, with standard deviation of 0,2397, and 1,5346.
4.2 Correlation Analysis
On the prior to regression result, it is important to check the correlation between various
variables on which the analysis is assembled. Pearson’s Correlation matrix is used to see the
relationship between variables. Correlation matrix between Aggressive working capital (AIP,
Advances in Economics, Business and Management Research, volume 36
212

Table 6. Summary of the Coefficients of Regression Model
Variable TOBIN’S Q
β t-statistic Sig
C 1,510 -2,497 0.013
AIP 0.360 1.306 0.192
AFP -0.761 -1,713 0.088
DAR 0,522 0.470 0.602
FS 0,000 0,000 0,999
R-squared 0.011
Adjusted R-square 0.01
F-statistic 1,059
Prob (F-statistic) 0.377
Durbin-Watson stat. 1.878
Table 7. Summary of the Coefficients of Regression Model
Variable TOBIN’S Q
β t-statistic Prob
C 1,282 21,073 0.000
ROA 6,476 8,278 0,000
R-squared 0.149 -1,713 0.088
Adjusted R-square 0.147 0.470 0.602
F-statistic 68,526 0,000 0,999
Prob (F-statistic) 0.000
Durbin-Watson stat. 1.909
F-statistic 1,059
Prob (F-statistic) 0.377
Durbin-Watson stat. 1.878
AFP) and profitability (ROA) and firm value shown in Table 3.
The correlation results in table 3 show that there is a positive correlation between ROA and
AIP, but negative correlation between ROA and AFP. The result also shows that there is a
negative correlation between DAR and ROA, and that there is a positive correlation between
FS) and ROA of non-financial firms listed at the Indonesia Stock Exchange.
The correlation results in Table 4 show that there is a positive correlation between Tobin’s Q
and AIP, but negative correlation between Tobin’s Q and AFP.
4.3 Relationship between Aggressive Working Capital Management Policy on Profitability
The results of linear regression analysis for Equation 1 (ROA) are shown in Table 5. The
regression equation has shown as follows:
ROA = -0,047 + 0,094 AIP – 0,048 AFP -0,072 DAR + 0,0006 FS (3)
Table 5 shows that the R^2 value is 0,207, which indicates that 20,7% of the variation oftheof
the dependent variable is explanedexplained by the independent variables, while 79,3% is
Advances in Economics, Business and Management Research, volume 36
213

explained by other variables and the error term. The result also shows that F-Statistics value is
25,264, and the probabilityProb (F-statistic) 0,000<0,05, hence, the model is significant at 95
% confidence level.
4.4. Relationship between Aggressive working capital Management Policy on Firm’s Value
The Result of linear regression analysis for equation 2 (Tobin’s Q) are shown in Table 6. It’s
regression equation is as below:
Tobin’s Q = 1,510 + 0,360 AIP – 0,761 AFP + 0,522 DAR + 0,000 FS (4)
The regression result shows that F-Statistics value is 1,059, and the Prob (F-statistic)
0,377>0,05, Itmeansthat the aggressive working capital (AIP, AFP), leverage (DAR), and
firm size (FS), have no significant relationshipswith firm value (FV).
4.5 Relationship between Profitability and Firm Value has been reported in Table 6.
Moreover, the funding of this study shows a positive relationship between profitability and firm;s
value. The profitability has a significant and positive effect on the firm value with the coefficient
of 6,476. Hence, it means that the higher profitability will increase the value of the firm.
5. Discussion
This study used two models to test each variable. There are two hypotheses have been
formulated in this study. The first hypothesis concluded that the aggressive working capital
policy (Aggressive investment policy, and aggressive financing policy)) have significant
influences on profitability. Aggressive investment policy (AIP) has a positive and significant
effect toward profitability (ROA), and aggressive financing policy (AFP) has a negative and
significant effect toward profitability (ROA). The findings are like (Wanguu, 2015), who
established a significant positive relationship between aggressive investment policy (AIP)
on profitability, and a significant negative between aggressive financing policy (AFP) on
profitability. The study also similar to (Vahid, Mohsen, & Mohammadreza, 2012), (Vahid,
2012) ; (Javid & Zita, 2014) and (Afza T. &., 2007), who established a significant negative
between aggressive financing policy (AFP) on profitability. Further, the result shows there is a
significant negative relationship between profitability and leverage, while it shows a significant
and positive relationship between profitability and firms size. The finding inconsistent with the
studies of (Mwangi, Makau, & Kosimbei, 2014) and (Kungu, Wanjau, & Waititu, 2014), who
established a significant positive relationship between aggressive financing policy (AFP) on
profitability. However, this finding is not in line with Amiri (2014) who found no significant
relationship between the aggressive financing policy and ROA.
The second hypothesis concluded that the aggressive working capital policy (Aggressive
investment policy, and aggressive financing policy) have no significant influences on the value
of the firms. AIP has a positive and not significant effect toward firm value, and AFP has
a negative and not significant effect toward firm value. Further, the study also showed the
leverage and size of the company have no significant effect on the value of the company. The
results are not consistent with research from (Bandara, 2015), who argued that AIP and AFP
have a negative and significant impact on firm value.
Advances in Economics, Business and Management Research, volume 36
214
6. Conclusion
The study findings established a significant relationship between the aggressive working
capital management policy and profitability, but there is no significant relationship between
the aggressive working capital management policy and firm’s value. Aggressive investment
policy positively influences profitability, and Aggressive financing policy negatively influences
profitability. The finding also established that control variable, including leverage and firm
size influence profitability, but they have no significant influences on the firm value. Therefore,
the improvement of profitability can create a higher value of the firm. However, this study has
some limitations. First of all, time constraints remain an issue. Second of all, since the sample
data have been selected from 393 industrial sectors in Indonesia Stock Exchange in 2014, this
study has a generalization problem. Accordingly, the author recommends a future research
which must be conducted in the wider area, such as Southeast Asia to get more accurate and
appropriate findings. Third of all, the future study can be done in longitudinal time frame to
create a better generalization of findings. Fourth of all,, this study can be expanded to other
variables, such as liquidity, risks and economic value.
References
Afza, T. &. (2007). Working Capital Management Policies of Firms: Empirical Evidence from
Pakistan. North South University, Dhaka, Bangladesh: Presented at 9th South Asian
Management Forum (SAMF) on February 24-25.
Afza, T., & Nazir, M. S. (2009). Impact of Aggressive Working Capital Management Policy
on Firms’ Profitability. https://www.researchgate.net/publication/228320063.
ALShubiri, F. N. (2011). The effect of working capital practices on risk management:
Evidence from Jordan. Global Journal of Business Research, 5(1), 39-54.
Amiri, E. (2014). Aggressive Invesment, Financing Policy of Working Capital With Profitability.
Advanced Research in Economic and Management Sciences, 170-182.
Bandara, R. (2015). Impact of Working Capital Management Policy on Market Value Addition.
Global Journal of Contemporary Research in Accounting, Auditing and Business Ethics
(GJCRA) An Online International Research Journal, 1(1).
Brigham, E. F., & Houston, J. F. (2015). Fundamentals of Financial Management (14 ed.). United States: Cengage Learning, Inc.
Horne, V., & Wachowicz, J. M. (2009). Fundamental of Financial Management. England:
Prentice Hall.
Javid, S., & Zita, V. P. (2014). Impact of Working Capital Policy on Firm’s Profitability: A
Case of Pakistan Cement Industry. Research journal of Finance and Accounting, 5(5).
Keown, A. J., Martin, J. D., Petty, J. W., & Scott, D. F. (2013). Financial Management Principles
and Applications. England: Pearson Education Limited.
Advances in Economics, Business and Management Research, volume 36
215

Koh, A. A., Brigham, E. F., & Ehrhardt, M. (2014). Financial Management: Theory and
Practice. Singapore: Cengage Learning Asia Pte Ltd.
Kungu, J. N., Wanjau, K. L., & Waititu, A. G. (2014). Influences Aggressiveness and
conservativeness in Investing and Financing Policies on Performance of Industrial Firm
in Kenya. IOSR Journal of Economics and Finance, 27-32.
Mwangi, L. W., Makau, M. S., & Kosimbei, G. (2014). Effects of Working Capital Management
on Performance of Non Financial Companies Listed In NSE, Kenya. European Journal
of Business and Management, 6(11).
Ogundipe, S. E., Idowu, A., & Lawrwncia. (2012). Working Capital Management, Firms’
Performance and Market Valuation in Nigeria. World Academy of Science,
Engineering and Technology, 1196-1200.
Taleb, G. A., Zoued, A. N., & Shubiri , F. N. (2010). The determinant of effective working
capital management policy: A case study on Jordan. Interdisciplinary. y Journal of
Contemporary Research in Business, 248-264.
Tobin, J. (1969). A General Equilibrium Approach To Monetary Theory. Journal of Money,
Credit, and Banking, 1(1), 15-29.
Vahid, T. K., Mohsen, A. K., & Mohammadreza, E. (2012). The Impact of Working Capital
Management Policies on Firm’s Profitability and Value: Evidence from Iranian
Companies. International Research Journal of Finance and Economics(88), 155-162.
Wanguu, K. C. (2015). The Effect of Aggressive Working Capital Policy on Profitability of
Non Financial Firms Listed at Nairobi Securities Exchange. International journal of
Commerce & Business studies, 3(4), 15-24.
Weston, F. J., & Copeland, T. E. (2008). Manajemen Keuangan. Jakarta: Binarupa Aksara.
Advances in Economics, Business and Management Research, volume 36
216