impact of the “farms to food banks” produce sourcing project
TRANSCRIPT

1
Introduction
The Kentucky Association of Food Banks (KAFB) received a Specialty Crop Block Grant from the Ken-
tucky Department of Agriculture in 2011 for the “Farms to Food Banks” program. This program was de-
signed to increase consumption and awareness of fruits and vegetables among low-income consumers
through a targeted local fresh produce distribution program. The University of Kentucky Food Systems In-
novation Center (FSIC) assisted with an evaluation of the “Farms to Food Banks” program toward the end of
the 2012 marketing season. The primary objective of the evaluation was to determine how impactful the
program was for food bank consumers. This report summarizes the results of food bank client intercept sur-
veys by examining fresh produce consumption barriers and changes in consumption behavior.
Background
The mission of the KAFB is to provide food and services to increase the capacity of Kentucky’s Feeding
America food banks to end hunger. The Association itself coordinates buying and distribution programming
for the affiliated food banks. The members of KAFB served 84% more individuals in 2010 than in 2006.
The Association is comprised of seven food banks that reach 620,100 people annually, or 1 in 7 Kentucki-
ans, in all 120 counties (KAFB, 2010). Through the “Farms to Food Banks” program, KAFB purchases
Kentucky-grown surplus and Number 2-grade produce (fresh and edible but not usually saleable on the retail
market) for distribution, free of charge, to low-income Kentuckians across the state. This program allowed
KAFB to purchase produce from local Kentucky farmers, either directly or aggregated through various pro-
duce auctions throughout the state. The additional revenue therefore increased the amount of marketable
product for local growers beyond what they would have otherwise received.
The competitiveness of Kentucky’s specialty crop market was also enhanced through increased awareness of
and familiarity with specialty crops, increased consumption of specialty crops, and increased intent to pur-
chase specialty crops in the future among low-income consumers, a market segment that is traditionally un-
derserved. Specialty crops included in the program are apples, beans, beets, broccoli, cabbage, cucumber,
lettuce (romaine and assorted greens), okra, onion, peaches, peas, peppers, potatoes, squash (yellow and win-
ter), sweet corn, sweet potatoes, tomatoes, turnips, watermelon, and zucchini.
The project covered two production seasons. During the 2011 grant funded program, $136,920 was spent on
fresh produce and 109 counties received 18 different types of fresh produce. Less than 1% of the fresh pro-
duce was lost to spoilage. The producer impact was widely spread with 202 producers supplying the pro-
duce from 48 counties across the Commonwealth. In the 2012 growing season, $218,866 was raised to pur-
chase (or was donated) 1,000,495 pounds of fresh produce from 217 producers—some of which it was do-
nated. The 2012 funding came from the Walmart Foundation, Tobacco Settlement Phase II Funds, the Ken-
tucky Agricultural Development Fund, the Kentucky Department of Agriculture Specialty Crop Block Grant,
and the Cralle Foundation.
Impact of the “Farms to Food Banks” Produce Sourcing Project
Tim Woods, Miranda Hileman and Bruce (Shang-Ho) Yang
Department of Agricultural Economics
University of Kentucky Food Systems Innovation Center
AEC-2013-04
March, 2013
2
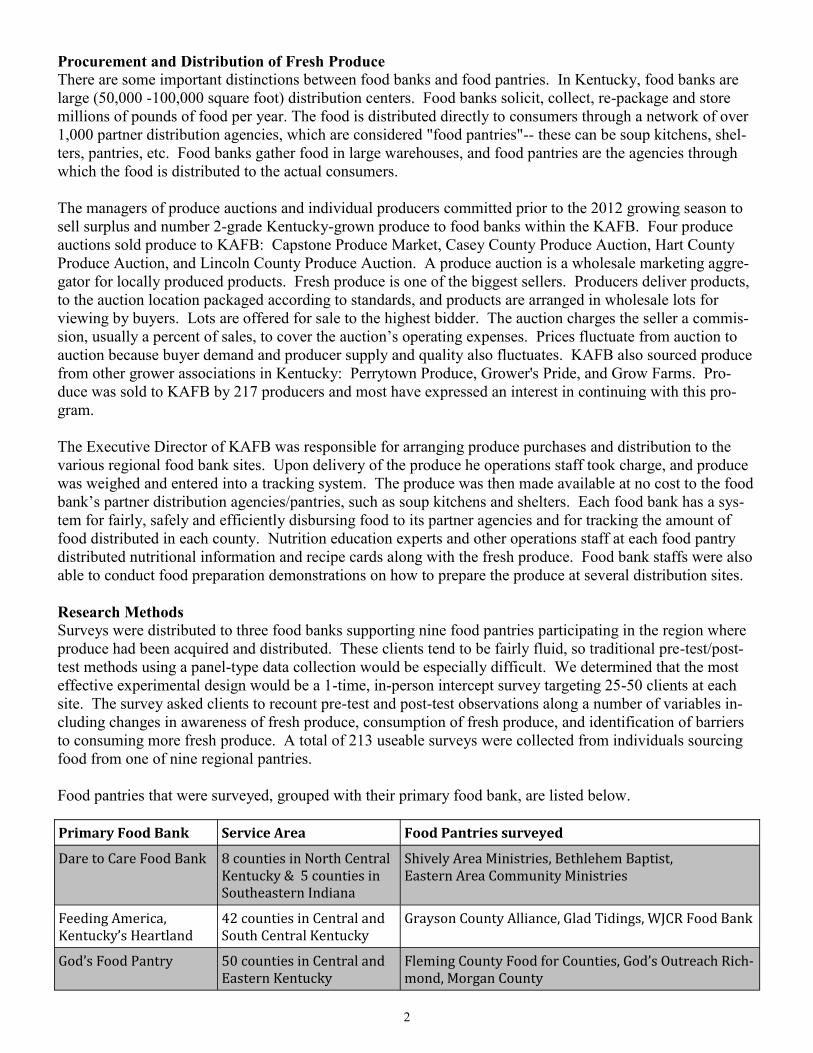
Procurement and Distribution of Fresh Produce
There are some important distinctions between food banks and food pantries. In Kentucky, food banks are
large (50,000 -100,000 square foot) distribution centers. Food banks solicit, collect, re-package and store
millions of pounds of food per year. The food is distributed directly to consumers through a network of over
1,000 partner distribution agencies, which are considered "food pantries"-- these can be soup kitchens, shel-
ters, pantries, etc. Food banks gather food in large warehouses, and food pantries are the agencies through
which the food is distributed to the actual consumers.
The managers of produce auctions and individual producers committed prior to the 2012 growing season to
sell surplus and number 2-grade Kentucky-grown produce to food banks within the KAFB. Four produce
auctions sold produce to KAFB: Capstone Produce Market, Casey County Produce Auction, Hart County
Produce Auction, and Lincoln County Produce Auction. A produce auction is a wholesale marketing aggre-
gator for locally produced products. Fresh produce is one of the biggest sellers. Producers deliver products,
to the auction location packaged according to standards, and products are arranged in wholesale lots for
viewing by buyers. Lots are offered for sale to the highest bidder. The auction charges the seller a commis-
sion, usually a percent of sales, to cover the auction’s operating expenses. Prices fluctuate from auction to
auction because buyer demand and producer supply and quality also fluctuates. KAFB also sourced produce
from other grower associations in Kentucky: Perrytown Produce, Grower's Pride, and Grow Farms. Pro-
duce was sold to KAFB by 217 producers and most have expressed an interest in continuing with this pro-
gram.
The Executive Director of KAFB was responsible for arranging produce purchases and distribution to the
various regional food bank sites. Upon delivery of the produce he operations staff took charge, and produce
was weighed and entered into a tracking system. The produce was then made available at no cost to the food
bank’s partner distribution agencies/pantries, such as soup kitchens and shelters. Each food bank has a sys-
tem for fairly, safely and efficiently disbursing food to its partner agencies and for tracking the amount of
food distributed in each county. Nutrition education experts and other operations staff at each food pantry
distributed nutritional information and recipe cards along with the fresh produce. Food bank staffs were also
able to conduct food preparation demonstrations on how to prepare the produce at several distribution sites.
Research Methods
Surveys were distributed to three food banks supporting nine food pantries participating in the region where
produce had been acquired and distributed. These clients tend to be fairly fluid, so traditional pre-test/post-
test methods using a panel-type data collection would be especially difficult. We determined that the most
effective experimental design would be a 1-time, in-person intercept survey targeting 25-50 clients at each
site. The survey asked clients to recount pre-test and post-test observations along a number of variables in-
cluding changes in awareness of fresh produce, consumption of fresh produce, and identification of barriers
to consuming more fresh produce. A total of 213 useable surveys were collected from individuals sourcing
food from one of nine regional pantries.
Food pantries that were surveyed, grouped with their primary food bank, are listed below.
Primary Food Bank Food Pantries surveyed Service Area
Dare to Care Food Bank Shively Area Ministries, Bethlehem Baptist, Eastern Area Community Ministries
8 counties in North Central Kentucky & 5 counties in Southeastern Indiana
Feeding America, Kentucky’s Heartland
Grayson County Alliance, Glad Tidings, WJCR Food Bank 42 counties in Central and South Central Kentucky
God’s Food Pantry Fleming County Food for Counties, God’s Outreach Rich-mond, Morgan County
50 counties in Central and Eastern Kentucky

3
Figure 1 Figure 2
Consumption of fresh produce increased some for 29.3% of the clients and increased by a lot for 30.3%
compared to 1 year ago. Figures 3 and 4 represent the differences in consumption by age group and by
household size.
Figure 3 Figure 4
Results—Discussion and Implications
Shopping and Cooking
The vast majority of responses came from persons primarily responsible for the grocery shopping (94%) and
preparing the main meals at home (92%). The average respondent prepared 13.2 meals at home per week –
equivalent to approximately 52 meals per month. This compares to an average of 11.0 meals per month pre-
pared at home by the average Kentucky food consumer (Woods, 2012). This striking difference in food
preparation behavior suggests fresh produce access through the food banks can significantly impact the food
bank consumers overall produce intake through produce access and preparation assistance.
Fresh Produce Awareness & Consumption
Another goal of the project was to increase fresh produce awareness and consumption among food bank cli-
ents. Awareness and familiarity with fresh produce increased some for 25.2% of the respondents and in-
creased by a lot for 26.2% compared to a year earlier. Figures 1 and 2 display the results by showing the
changes (increased some/increased by a lot) in both awareness and familiarity by age group and by house-
hold size.

4
Fresh Produce Experience % “yes”
Consuming same amount, just switching sources
71.1%
Trying new fresh produce not tried before
77.0%
Feel like I’m eating healthier 87.4%
Greater awareness of seasons for fresh produce
84.3%
Table 1. Food Bank Consumer Experiences
Figure 5
Sourcing of Fresh Produce
Overall intention to use fresh produce in 2012 compared to 2011 was measured. A total of 88.5% of the cli-
ents indicated an intention to use more fresh produce in 2012 compared to 2011. The grocery store had pre-
viously been the largest supplier to many respondents. Sourcing shifted slightly to heavier reliance on the
food banks while shifting away from the grocery stores – but this only measures share of sourcing rather
than measuring absolute consumption amounts. The change could also have to do with the availability of
free fresh produce at the food banks, so clients chose not to spend limited grocery money on fresh produce
(Figure 5).
Questions probing for more insights about fresh produce sourcing were asked. Clients were asked to re-
spond to several questions with simple no/yes responses, shown in Table 1.
Table 1 shows us that 71.1% of respondents were still consuming the same amount of fresh produce com-
pared to a year ago as a result of the food bank program—just from a different source, not particularly strong
evidence of a change in consumption. Other self-reported behaviors, however, suggested a stronger im-
pact—new trials, healthier eating, and greater awareness of produce seasonality.
There was a strong interest in seeing more fresh produce available through the food pantry – 21.7% of con-
sumers indicated they would like to see more of the same kinds of items currently being received and 74.9%
wanting more of the same, but also additional produce offerings. Table 2 below displays the favorite food
items enjoyed by respondents.
Produce Item
Tomatoes 86%
Regular potatoes 86%
Fresh greens and lettuces 76%
Melons 76%
Cucumbers 70%
Beans 69%
Peppers 63%
Sweet potatoes 57%
Table 2. Food Bank Consumer Favorite Fresh Produce Items

5
Table 3. Barriers of Increasing Fresh Produce Consumption Among Groups
Rank Barrier Age Families with Kids Gender Overall
Average Rank #
Below 50
Over 50
t-test Yes No t-test Female Male t-test
—-average rank displayed—-
1 Cost 5.56 5.33 - 5.24 5.55 - 5.52 4.99 * 5.42c
2 Family Interest 3.33 2.94 * 3.19 3.00 - 2.89 3.85 *** 3.09b
3 Home Storage 3.35 2.90 * 3.14 3.02 - 2.99 3.41 * 3.07b
4 Bulky Packaging 2.79 2.70 - 2.72 2.75 - 2.68 2.94 - 2.73ab
5 Preparation 2.72 2.39 * 2.57 2.47 - 2.42 2.89 * 2.51a
6 Access to Stores 2.77 2.33 * 2.37 2.60 - 2.45 2.67 - 2.50a
Note: N = 213. Mean rankings are displayed here. Asterisks representing t-tests indicate significant differences: * = 0.1, ** =
0.05, and *** = 0.01. Overall barrier frequency within column, followed by the same letter are not significantly different
(Tukey’s test HSD P < 0.05).The question asked respondents to evaluate these barriers using a Likert scale where 1 = ‘less of a
barrier’ and 7 = ‘more of a barrier’.
Table 3 summarizes the barriers across some of the demographics. Cost remains clearly the most important
barrier regardless of age, having kids, or gender. Female consumers identified cost more strongly, but also
noted family interest to be less of a barrier. The implication is that programs such as the KAFB local pur-
chasing project can help these consumers overcome the high costs they associate with fresh produce can
contribute significantly to greater consumption. Other factors commonly noted as barriers are much less
significant.
Barriers to Sourcing and Consuming Fresh Produce
We employed a Likert scale using 1 = “less of a barrier”
and 7 = “more of a barrier” to examine barriers to sourc-
ing and consuming fresh produce. This rating scale pro-
vides interesting information and insight into how food
bank consumers think about food. Figure 6 summarizes
the results. Cost was identified most frequently as “more
of a barrier” with an average weight of 5.42—well ahead
of the other potential barriers. Family interest and home
storage were rated at 3.09 and 3.07 respectively. Bulky
transport (2.74), knowing how to prepare it (2.51) and no
access to stores that sell it (2.50) were lesser barriers.
With cost noted as the biggest barrier, it is important to
note that lowing the cost of fresh produce increases the
consumption of healthier foods.
Figure 6
6
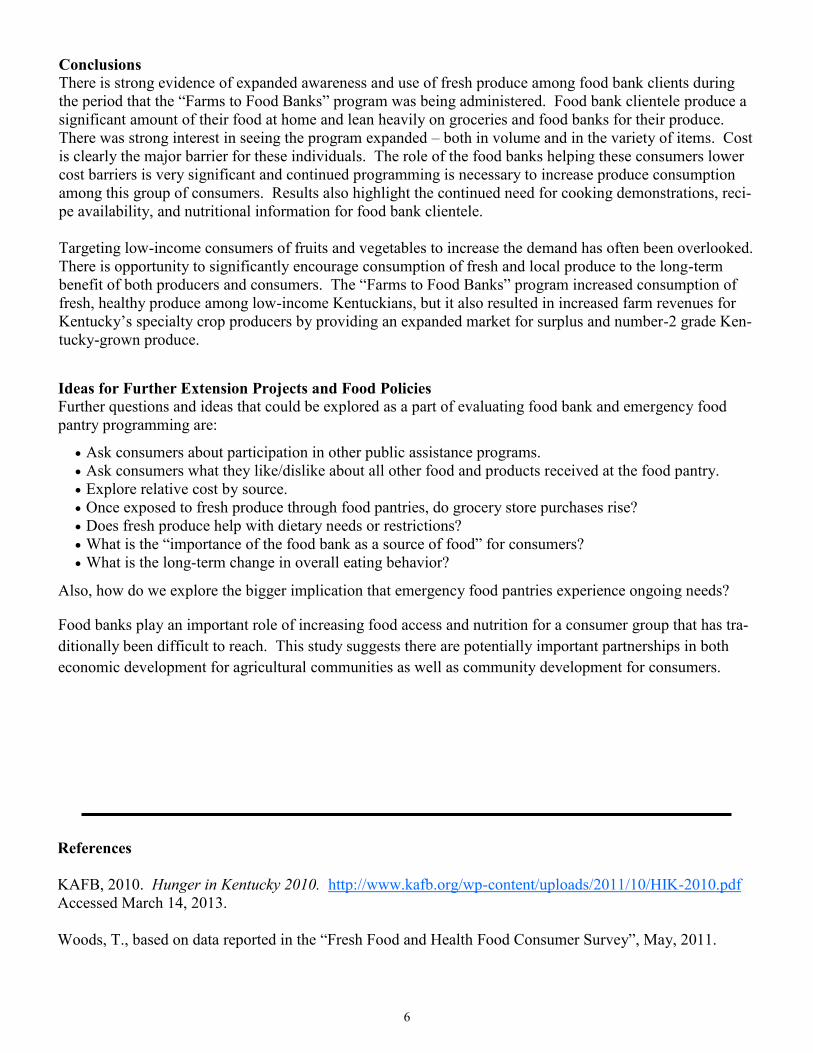
Ideas for Further Extension Projects and Food Policies
Further questions and ideas that could be explored as a part of evaluating food bank and emergency food
pantry programming are:
Ask consumers about participation in other public assistance programs.
Ask consumers what they like/dislike about all other food and products received at the food pantry.
Explore relative cost by source.
Once exposed to fresh produce through food pantries, do grocery store purchases rise?
Does fresh produce help with dietary needs or restrictions?
What is the “importance of the food bank as a source of food” for consumers?
What is the long-term change in overall eating behavior?
Also, how do we explore the bigger implication that emergency food pantries experience ongoing needs?
Food banks play an important role of increasing food access and nutrition for a consumer group that has tra-
ditionally been difficult to reach. This study suggests there are potentially important partnerships in both
economic development for agricultural communities as well as community development for consumers.
Conclusions
There is strong evidence of expanded awareness and use of fresh produce among food bank clients during
the period that the “Farms to Food Banks” program was being administered. Food bank clientele produce a
significant amount of their food at home and lean heavily on groceries and food banks for their produce.
There was strong interest in seeing the program expanded – both in volume and in the variety of items. Cost
is clearly the major barrier for these individuals. The role of the food banks helping these consumers lower
cost barriers is very significant and continued programming is necessary to increase produce consumption
among this group of consumers. Results also highlight the continued need for cooking demonstrations, reci-
pe availability, and nutritional information for food bank clientele.
Targeting low-income consumers of fruits and vegetables to increase the demand has often been overlooked.
There is opportunity to significantly encourage consumption of fresh and local produce to the long-term
benefit of both producers and consumers. The “Farms to Food Banks” program increased consumption of
fresh, healthy produce among low-income Kentuckians, but it also resulted in increased farm revenues for
Kentucky’s specialty crop producers by providing an expanded market for surplus and number-2 grade Ken-
tucky-grown produce.
References
KAFB, 2010. Hunger in Kentucky 2010. http://www.kafb.org/wp-content/uploads/2011/10/HIK-2010.pdf
Accessed March 14, 2013.
Woods, T., based on data reported in the “Fresh Food and Health Food Consumer Survey”, May, 2011.

7
Appendix A: Survey Instrument We hope this example of our survey instrument is helpful to your program. Please let us know of any questions or comments you have for us—our contact information is on the last page of the survey. Attention – This survey is completely anonymous; you do not need to give your name or any other contact information. It is intended for people over the age of 18, and please only one sur-vey per household. We sincerely appreciate your time! Dear food pantry patron – We are trying to collect some feedback from you regarding your recent experience in receiving fresh produce items through the food pantry. Please comment honestly. Your responses are completely confidential. However, we do want to thank you by sharing a small gift with you. After completing the survey, please turn it in to receive a gift bag. Shopping and Cooking
A1. Are you the person that normally does the grocery shopping? □ No □ Yes
A2. Are you the person who prepares the main meals in your household?
□ No □ Yes A3. How many meals do you prepare at home per week on average? ________ Fresh Produce Consumption B1. Would you say that your awareness and familiarity with fresh produce, compared to 1 year ago, has
□ Remained relatively the same □ Increased, but not too much □ Increased, by a lot
B2. Would you say that your consumption of fresh produce compared to 1 year ago has
□ Remained relatively the same □ Increased, but not too much □ Increased, by a lot
B3. Thinking about your average meals during a week, what number of meals do you estimate includes fresh produce compared to 1 year ago (2011)?
# of meals with fresh produce per week 1 year ago ________ # of meals with fresh produce per week today _________

8
B4. Where did you get most of your fresh produce last year? Has it changed?
B5. Do you intend to use more fresh produce in 2012, compared to last year (2011)?
□ No □ Yes Barriers and Experience C1. What are the barriers to increasing your consumption of fresh produce? (circle one)
C2. What has been your experience with fresh produce at the food pantry?
Consuming same amount, just switching sources □ No □ Yes Trying new fresh produce not tried before □ No □ Yes Feel like I’m eating healthier □ No □ Yes Greater awareness of seasons for fresh produce □ No □ Yes
C3. Would you like to see even more fresh produce available through the food pantry?
□ No, not interested □ No, it’s about right for our needs □ Yes, more of the same kinds of produce we currently get □ Yes, including additional items
% Last year (2011) % This year (2012)
Grocery store
Food pantry
Garden
Friends & Family
Farmers’ Market
Other
Total 100% 100%
Less of a barrier More of a barrier
Knowing how to prepare it 1 2 3 4 5 6 7
Family interest 1 2 3 4 5 6 7
Cost 1 2 3 4 5 6 7
Home Storage 1 2 3 4 5 6 7
Bulky packaging for transport 1 2 3 4 5 6 7
No access to stores that sell it 1 2 3 4 5 6 7
Other 1 2 3 4 5 6 7

9
C4. My favorite items are --- (please check all that apply) □ Beans □ Fresh greens and lettuces □ Sweet potatoes □ Regular potatoes □ Tomatoes □ Peppers □ Melons □ Cucumbers □ Other______________________________
Lastly, we would like to know a bit about you. D1. What is your gender? □ Female □ Male D2. What is your age? __________ Years D3. How many members live in your household, including yourself? ______________ D4. How many children under 18 live in your household? ___________ Additional Comments?
Please return your survey in exchange for a gift! Thank you for your time and participation. Our many thanks to the Kentucky Association of Food Banks. We hope you enjoy your gift bag. Your opinion means a lot! For concerns or questions, please contact: Timothy Woods Miranda Hileman University of Kentucky University of Kentucky Dept. of Agricultural Economics Dept. of Agricultural Economics 402 C.E. Barnhart Building, 407 C.E. Barnhart Building, Lexington KY 40546 Lexington KY 40546 859-257-7270 859-257-7270 [email protected] [email protected]

10
Educational programs of Kentucky Cooperative Extension serve all people
regardless of race, color, age, sex, religion, disability, or national origin.
University of Kentucky
College of Agriculture
Department of Agricultural Economics
400 C.E. Barnhart Building
Lexington KY 40546
http://www.ca.uky.edu/agecon
Phone: 859-257-5762
Fax: 859-323-1913