impact of turbulent environment on business …
TRANSCRIPT

IMPACT OF TURBULENT ENVIRONMENT ON BUSINESS PERFORMANCE
IN THE CONFECTIONARY INDUSTRY IN KENYA
BY
AUDREY ACHIENG
UNITED STATES INTERNATIONAL UNIVERSITY-AFRICA
SUMMER 2018

IMPACT OF TURBULENT ENVIRONMENT ON BUSINESS PERFORMANCE
IN THE CONFECTIONARY INDUSTRY IN KENYA
BY
AUDREY ACHIENG
A Research Project Report Submitted to Chandaria School of Business
in Partial Fulfilment of the Requirement for Masters’ Degree in
Business Administration (MBA)
UNITED STATES INTERNATIONAL UNIVERSITY-AFRICA
SUMMER 2018

ii
STUDENT DECLARATION
I, the undersigned declare that this research project is my original work and that it has not
been submitted to any other college, or other institution of higher learning other than United
States International University for purposes of academic credit
Signed: ______________________ Date: ____________________________
Audrey Achieng (ID 615684)
This research project has been presented for examination with my approval as the appointed
supervisor
Signed: ____________________ Date: ____________________________
Dr. Paul Katuse
Signed: ____________________ Date: ____________________________
Dean, Chandaria School of Business

iii
ABSTRACT
The purpose of this study was to determine the effect of turbulent environment on business
performance in the confectionery industry in Kenya. This study was guided by the
following research questions: What is the impact of technological turbulence on business
performance? What the impact of environmental turbulence on business performance? And
what is the impact of market turbulence on business performance?
This study adopted a descriptive survey design on a target population of 150 managers from
24 confectionery organizations in the Kenyan market. A structured questionnaire was used
to collect primary data.
The findings of this study show that there exists a statistically significant relationship
between technological turbulence and business performance in the confectionery industry.
The findings have revealed the existence of a statically significant relationship between
environmental turbulence and business performance in the confectionery industry.
The findings show that there exists a statistically significant relationship between market
turbulence and business performance in the confectionery industry in Kenya.
This study concludes that the technological turbulence is important in that it can enhance
organizational business performance through additional technological know-how,
enhanced competencies, new knowledge exploration, and organizational learning that
enables confectionery firms to enhance business performance. This study also concludes
that environmental turbulence, particularly business operational environment, relationships
with political regimes on taxation, and social-cultural beliefs should be nurtured and
monitored closely to ensure they adopted to enhance business performance of
confectioneries. This study concludes that competition intensity, bargaining power of
buyers; bargaining power of sellers, and rivalry within the market affects business
performance of the confectionery industry
This study recommends that confectionery firms should invest more in emerging
technologies as a mechanism of leveraging technologies to enhance performance, while at
the same time, ensuring timely adoption minimizes negative effects of technological
turbulence. This study also recommends that confectionery firms should not only monitor
their operational environment, but also political relations, and social-cultural aspects within

iv
their operational spheres. Finally. This study recommends that confectionery firms should
enhance their competitive advantages through efficient and effective operations, quality
products, highly trained and competent human resources, in addition to adopting the latest
manufacturing equipment in the sector.
v
ACKNOWLEDGEMENT
I would like to acknowledge Paul Katuse for the tireless guidance in the development of
this research project. I would also like to thank my family for the tireless support throughout
my education journey.

vi
TABLE OF CONTENTS
STUDENT DECLARATION ............................................................................................ ii
ABSTRACT ...................................................................................................................... iii
ACKNOWLEGEMENT.................................................................................................... v
TABLE OF CONTENTS ................................................................................................. vi
LIST OF TABLES ......................................................................................................... viii
LIST OF FIGURES ........................................................................................................... x
1.0 INTRODUCTION................................................................................................... 1
1.1 Background of the Study .......................................................................................... 1
1.2 Statement of the Problem .......................................................................................... 4
1.3 Purpose of the Study ................................................................................................. 6
1.4 Research Questions ................................................................................................... 6
1.5 Significance of the Study .......................................................................................... 6
1.6 Scope of the Study .................................................................................................... 6
1.7 Definition of Terms................................................................................................... 7
1.8 Chapter Summary ..................................................................................................... 7
CHAPTER TWO ............................................................................................................... 8
2.0 LITERATURE REVIEW ...................................................................................... 8
2.1 Introduction ............................................................................................................... 8
2.2 The Impact of Technological Turbulence on Business Performance ....................... 8
2.3 The Impact of Environment Turbulence on Business Performance ....................... 12
2.4 The Impact of Market Turbulence on Business Performance ................................ 16
2.5 Chapter Summary ................................................................................................... 20
CHAPTER THREE ......................................................................................................... 21
3.0 RESEARCH METHODOLOGY ........................................................................ 21
3.1 Introduction ............................................................................................................. 21
3.2 Research Design...................................................................................................... 21

vii
3.3 Population and Sampling Design ............................................................................ 21
3.4 Data Collection Methods ........................................................................................ 24
3.5 Research Procedures ............................................................................................... 24
3.6 Data Analysis .......................................................................................................... 25
3.7 Chapter Summary ................................................................................................... 25
CHAPTER FOUR ............................................................................................................ 26
4.0 RESULTS AND FINDINGS ................................................................................ 26
4.1 Introduction ............................................................................................................. 26
4.2 Demographic Information ....................................................................................... 26
4.3 Impact of Technological Turbulence on Business Performance ............................ 29
4.4 Impact of Environmental Turbulence on Business Performance ........................... 32
4.5 Impact of Market Turbulence on Business Performance ........................................ 37
4.6 Correlation Analysis ............................................................................................... 41
4.7 Regression Analysis ................................................................................................ 42
4.8 Chapter Summary ................................................................................................... 44
CHAPTER FIVE ............................................................................................................. 45
5.0 DISCUSSION, CONCLUSION, AND RECOMMENDATIONS .................... 45
5.1 Introduction ............................................................................................................. 45
5.2 Study Summary ....................................................................................................... 45
5.3 Discussion ............................................................................................................... 46
5.4 Conclusion .............................................................................................................. 50
5.5 Recommendations ................................................................................................... 51
REFERENCES ................................................................................................................. 53
APPENDIX I: COVER LETTER .................................................................................. 58
APPENDIX II: QUESTIONNAIRE .............................................................................. 30
APPENDIX III: RESEARCH BUDGET ........................... Error! Bookmark not defined.
APPENDIX IV: IMPLEMENTATION SCHEDULE ...... Error! Bookmark not defined.

viii
LIST OF TABLES
Table 3. 1: Population Distribution .................................................................................... 21
Table 3. 2: Sample Size Distribution ................................................................................. 22
Table 4.1: Reliability Analysis .......................................................................................... 26
Table 4.2: Confectionery Organization Technological Innovation ................................... 29
Table 4.3: Technological Innovation and Enhanced Product Lines .................................. 29
Table 4.4: Technological Innovation and Business Performance ...................................... 30
Table 4.5: Technological Uncertainty ................................................................................ 30
Table 4.6: Innovation and Organizational Restructuring ................................................... 31
Table 4.7: Technological Turbulence and New Knowledge ............................................. 31
Table 4.8: Knowledge Exploration and Business Performance......................................... 31
Table 4.9: Technological Innovation and Organizational Learning .................................. 32
Table 4.10: Environmental Turbulence and Competition.................................................. 33
Table 4.11: Environmental Turbulence and Competition.................................................. 33
Table 4.12: Environmental Turbulence and Tax Burden on Manufacturing ..................... 35
Table 4.13: Customer Buying Behavior and Business Performance ................................. 35
Table 4.14: Product Perception and Business Performance .............................................. 36
Table 4.15: Effect of Reducing Environmental Turbulence .............................................. 37
Table 4.16: prevalence of Market Turbulence ................................................................... 37
Table 4.17: Effect of Market Turbulence on Business Performance ................................. 37
Table 4.18: Market Competition ........................................................................................ 38
Table 4.19: Steady Dependable Buyers ............................................................................. 39
Table 4.20: Bargaining Power of Buyers ........................................................................... 39
Table 4.21: Bargaining Power of Suppliers Effect on Business Performance .................. 40
Table 4.22: Increase in Substitute Products ....................................................................... 40
Table 4.23: Threat of Substitute Products .......................................................................... 41
Table 4.24: market Intelligence and Market Turbulence ................................................... 41

ix
Table 4.25: Correlation Analysis ....................................................................................... 42
Table 4.26: Multiple Regression Model Summary ............................................................ 42
Table 4.27: ANOVA .......................................................................................................... 43
Table 4.28: Coefficients ..................................................................................................... 43

x
LIST OF FIGURES
Figure 4.1: Respondents Gender ........................................................................................ 27
Figure 4.2: Respondents Age ............................................................................................. 27
Figure 4.3: Number of Years with the Organization ......................................................... 28
Figure 4.4: Respondents Job Designation .......................................................................... 28
Figure 4.5: Prevalence of Environmental Turbulence ....................................................... 32
Figure 4.6: Change Processes and Business Performance ................................................. 34
Figure 4.7: Environmental Turbulence and Political Uncertainty ..................................... 34
Figure 4.8: Effect of Environmental Turbulence on Business Performance ..................... 36
Figure 4.9:Effects of Market Competition on Business Performance ............................... 38
Figure 4.10: Dependable Suppliers .................................................................................... 39

1
CHAPTER ONE
1.0 INTRODUCTION
1.1 Background of the Study
In today’s world, the dynamic nature of globalization has subjected businesses and business
operational environments to a continuous wave of turbulence (Farsijani, Feizi & Shafiei,
2014). The speed at which business practices are adopted form one corner of the world is
fast, dynamic and competitive. This means that businesses have to continuously adjust to
the market forces to be able to remain viable, relevant and sustainable (Cooke, 2013).
Organizations are therefore forced to adopt new approaches of doing business be able to
attract customers, compete effectively, and enhance their business performance. This is
more so the case in the confectionary industry, where buoyancy in information gathering,
manufacturing, and assembling and distribution of their products (Farsijani et al., 2014).
The quicker the movement by organizations’ in adopting to the dynamic and changing
environment, the better the chances in enhancing competitive advantage necessary for
continuous business performance (Buganza, Dell’Era & Verganti, 2014)
The global confectionery market size was estimated at $184, 056 million in 2015, and was
expected to grow to $ 232, 085 million by the end of 2022 (Allied Market Research, 2017).
The leading players in the confectionery industry include Delfi Ltd of Singapore, Ezaki
Gilco Ltd of Japan; Lindt & Sprungli of Switzerland; Ferrero SpA of Italy; Lotte
Confectionery Ltd of South Korea; Mars Inc of USA; Nestle’ S.A of Switzerland; Wrigley
Jr Ltd of USA; and The Hershey Company of USA (Allied Market Research, 2017). For
instance, Wrigley Ltd is a global confectionery company that operates in more than 40
countries and distributing products in 180 countries. Wrigley started operations in 1891 in
Chicago USA, before expanding to other parts of the world (Farsijani et al., 2014).
Wrigley’s products include chewing gum, chewy candies, and mints. Some of the renown
Wrigley’s brands include Juicy Fruit; Wrigley’s Spearmint, Altoids, Orbit, Skittles,
Doublemint, Freedent, Winterfresh, Airwaves, Extra, and Eclipse.
Nestle from Switzerland is another confectionary conglomerate established in 1866 and
sprawling over 189 countries (Buganza et al., 2014). Some of the confectionaries by Nestle
include Butterfinger, KitKat, Crunch, Smarties, Orion, Aero, Wonka, Nestle Toll House,
and Cailler. On the other hand, Cadbury, a British multinational confectionery is the second

2
largest after the Mars of the USA. Cadbury has subsidiaries in more than 50 countries. Some
of the Cadbury’s products include Dairy Milk chocolate, Roses selection box, Crème Egg,
Fudge Minis, Dairy Oreo, among others. Just like other products in other industries, the
confectionery industry has experienced turbulence environment affecting business.
According to Rob (2013), turbulent business environments are both external and internal
constant and unpredictable changes that affect business operations.
On the other hand, Buganza et al., (2014) posit turbulent environment as the amount of
change, and complexity associated with the change in a given business operational sector.
Companies in the confectionery sector (sweets/ candy and chocolate) are continuously being
challenged by an increase in competitiveness of their operational environment, dynamic
rapid changes in customer demands, to the extent that even the most traditional require their
operational processes and procedures modified from time to time to meet market
specifications, or customer needs (Cooke, 2013). As such, companies have adopted new
strategies to enhance their flexibility, quality, and responsibility. This is due to the fact that
new technologies and sector-specific philosophies do emerge to obsolete existing ones,
while on the other hand, customers remain relentless in their short-term product demands,
and equally demand new service (Rob, 2013).
According to Buganza et al., (2014) business turbulence takes different forms: technological
turbulence, market turbulence, economic turbulence, and even political turbulence. Since
the 21st century, technology has been at the forefront of innovation, competitiveness, and
business performance. Most organizations seeking to enhance competitive advantage, or
operational efficiency have turned to technology to gain such an advantage (Farsijani et al.,
2014). However, with the advent and adoption of technology in businesses, there emerged
significant disruption and turbulence to the normal way of doing business. For instance, Rob
(2013) notes that the earlier industrial revolution in Europe and America in the mid-1800’s
by the introduction of mechanized production did not have a severe impact as compared to
technological revolution of the 21st century. This is because mass production lines that were
managed by labor workers started being replaced by computerized technologies, and in the
process, enhancing efficiency, quality, and production. In as much as this was desirable, this
meant rapid disruption in the way of doing business for those who wanted to remain
competitive and relevant. As such, training of human capital had to change from unskilled
to skilled labors who could operate technology (Buganza, 2014). Companies had to retrain

3
employees, enhance technical competencies and capacities when installing new
technologies (Hafeznia, 2012)
Market environments do influence how an organization does its business. When there is too
much turbulence in the market environment, the business operation becomes unstable
resulting either in poor competition, stiff competition, more or fewer entrants, and at the
time, market turbulence can make an organization’s products uncompetitive (Lichtenthaler,
2009). Global market forces can influence how organizations structure their operations, and
performance. Chen and Lin (2014) note that global market turbulence can either be
economical, social, political, technological or environmental changes and development.
Such turbulences, in most instances, due to globalization, do cascade to the regional level,
and national standards, and as such, influences how business competitiveness.
According to Hafeznia (2012), market turbulence has several characteristics. This includes:
competition intensity from new entrants, increase in availability of substitute products, and
severe fluctuations of product prices causing a negative impact on an organizations
performance or business operations (Sulaimani & Munira, 2012). Due to the impact of
globalization, developing countries have a disadvantage when it comes to market
turbulence. In most instances, as argued by Omri (2015), most technological innovations
emanate from the west. Meaning, these technologies are less disruptive to markets compared
to developing countries where the markets might be adopting the technology for the very
first time. This does not mean that Europe and America do not experience market or
technological turbulence, but rather the rate of assimilation of new technology within their
high development markets is more business-friendly than in developing countries
(Hafeznia, 2012).
According to Buzanga et al., (2014) turbulent environments influence business operations
globally. For instance, the financial and economic crisis of 2007/2008 in the United States
of America affected almost the entire Europe, and some countries in Asia. Most business
experience negative growth, loss business, stagnation, and even collapse. The example of
this being the Lehman Brothers that collapsed sending shockwaves through the American
and European markets (Cooke, 2013). In as much as the impact of 2009 did not significantly
impact Africa or Asia, it demonstrated how market turbulence could have affect business
operations and performance.

4
Business performance is determined by various factors. According to Mamat and Ismail
(2011), some of these factors include competitive advantage, cost reduction capabilities,
and enhanced profits. For a business entity to progressively enhance performance, both
internal and external factors as highlighted by Mamat and Ismail (2011) should work in
concert to deliver on the organizational objectives. This is not always the case, particularly
in when environmental turbulence pervades performance factors. According to Oginni,
(2010) business entities do not operate in isolation of in a vacuum; both internal and external
factors influence the ultimate business performance.
Rob (2013) posits that operational business environment in Africa is extremely dynamic
due to the fact that most African states have variant business operation policies, trade
liberalization policies, and different regional business integration mechanisms. Thus,
business environments in Africa are case specific, and different dependent integration and
economic macro and microeconomic policies. In examining the link between turbulent
environment, it is difficult to use Africa summatively in this regard (Farsijani et al., 2014).
Whereas macro and microenvironmental factors in Southern and Northern Africa might be
conducive for business operation and performance, the same might not be the case for
Western African firms. Comparatively, the European Union (EU) states share common
markets, policies, tariffs, and regulations, and thus, business entities within the region tend
to enjoy similar advantages (Cooke, 2013). It is important to note that businesses in Africa
might be predisposed to economic turbulence as compared to European counterpart due to
advances in financial infrastructure, business regulations, and technology. According to
Hafeznia (2012), effects of environmental turbulence have a significant impact of viability,
performance, and sustainability of business entities, and therefore, cannot be wished away,
but rather, embraced with relevant and significant mitigation strategies.
1.2 Statement of the Problem
In the last two years confectionery industry in Kenya has been affected by business
operational turbulence forcing mega confectioneries like Wrigley’s to be acquired by
Confectionery giant Mars Inc. of USA, and as a resulting in significant changes for
Wrigley’s branches globally. Equally, other confectioneries such as Cadbury, Nestle, Mars,
have over the years gone through various restructuring due to environmental turbulence that
has in one way or the other affected their business. Africa confectionery markets have not
been spared with Nestle restructuring its Africa operational model, while at the same time,

5
Wrigley’s East Africa has been acquired Mars group resulting in organizational
restructuring, including relocation from Nairobi to Machakos County (Njihia, 2017).
For the last 2 years, Wrigley’s East Africa has seen a dip in its profitability despite reporting
an increase in sales. As a result, staff salary increments and annual bonuses have been
suspended indefinitely. Partly, this has been attributed to costs associated with construction
of new factors under Mars Inc. However the impact of turbulence environment (economical,
technological, and market) experienced in Kenya has not been examined. Therefore, there
exists a knowledge gap on the impact of turbulent environment on business performance in
the confectionery industries (Buzanga et al., 2014).
Several studies have been conducted in the area of business environments and turbulent
environments. For instance, Buganza, Dell’Era and Verganti (2014) study on the effect of
turbulent environment on business performance on Mobile telephony sector in Spain, and
established that technological turbulence had the most significant impact on business
performance. On the other hand, Chuthamas (2011) study focused on examining how
turbulent environments affect small businesses in Thailand. The study concluded that there
existed a relationship between both technological, and market turbulence and performance
of the small business in Thailand. A study Njihia (2017) focused on innovation and use of
technology as a strategic tool for SME’s operating in a turbulent environment in Kenya. The
study concluded that SMEs are affected by social and technological factors than turbulent
environments. As noted, turbulent environments can negatively and positive affect business
performance. However, most of these studies did not focus on the confectionery industry.
Similarly, the studies have attempted to look at innovation in general and how this affects
business operations, but have not examined how turbulent environments impact business
performance particularly in the confectionery industries, and that is the gap this study seeks
to explore.
This study, therefore, seeks to expand on the available literature and also fill the gap existing
in the literature on the effects of turbulent environments on business performance in the
confectionery industry. Key focus areas for this study was an examination of market
turbulence, environmental turbulence, and technological turbulence.

6
1.3 Purpose of the Study
The purpose of this study is to determine the effect of turbulent environment on business
performance in the confectionery industry
1.4 Research Questions
The following questions guided this study.
1.4.1 What is the impact of technological turbulence on business performance?
1.4.2 What is the effect of environment turbulence on business performance?
1.4.3 What is the impact of market turbulence on business performance?
1.5 Significance of the Study
This study is significant to the following stakeholders
1.5.1 Confectionery Industry
The confectionary industry can adopt the findings of this study to formulate strategies and
policies that will enhance competitiveness and also, can adopt recommendations of this
study to on how to deal with different types of turbulence in the market
1.5.2 Academicians and Researchers
Researchers and academicians seeking to gain knowledge or expand on research in the area
of turbulence on business performance can rely on the findings of this study or can use the
findings of this study to test hypothesis or con
1.6 Scope of the Study
This study seeks to determine the impact of turbulent environment on business performance
in the confectionery industry in Kenya. This study targeted both departmental managers
from all the 24 confectionery organizations. This study was limited to corporate managers
since they are in charge of developing and implementing strategies to contain turbulent
environment on business. The study was conducted from January 2018 to June 2018.

7
1.7 Definition of Terms
1.7.1 Market Turbulence
Markey turbulence is defined as the constant changes or disruption in the competition, cost
of doing business, new entrants, ease of substitute products, and regulations that cause
harmful disruptions in the market structures (Sulaimani & Munira, 2012)
1.7.2 Technological Turbulence
Technological turbulence is defined as the constant change or disruption in the structure of
the market due to the rapid introduction of new and changing technologies (Mabrouk &
Mamoghli, 2010).
1.7.3 Environmental Turbulence
Environmental turbulence is defined as both the internal and external forces that bring
constant changes on business operations in terms of complexities associated with the
changes (Buganza et al., 2014)
1.7.4 Business Performance
Business performance is defined as the alignment and achievement competitive advantage,
profitability, lower cost of business, and an increase in client base over a set period of time
(Buganza et al., 2014).
1.8 Chapter Summary
The background of the study on turbulent business environment and business performance
has been presented in this chapter. The statement of the problem to which the study seeks
to respond to has also been presented in this chapter. The study research questions, the
significance of the study, the scope of the review, and the definition of terms used in the
study has also been presented.

8
CHAPTER TWO
2.0 LITERATURE REVIEW
2.1 Introduction
The literature review on empirical studies on the impact of turbulent environment on
business performance is presented in this chapter. The section presents the literature review
based on the following research questions; what is the impact of technological turbulence
on business performance, what is the impact of environmental turbulence on business
performance and what is the impact of market turbulence on the business environment. The
chapter is concluded by a chapter summary providing an overview of the literature review
covered based on the research questions.
2.2 The Impact of Technological Turbulence on Business Performance
Technological revolution and the information explosion in the past two decades,
organizations have changed the ways of doing businesses in an attempt to cope with the
environmental changes. Organizations must continuously maintain the adaptability as well
as flexibility in today’s changing world (Mahajan, 2015). This stress the significance of
organizational learning for organizations that want to remain relevant and competitive in
the marketplace. Researchers have used the term “absorptive capacity” and suggest that it
can increase an organization’s capability to sustain competitive advantage through
reconfiguring its base of resources and by adapting to the dynamic market conditions
(Lillington, 2014). On the other hand, Christensen (2015) stresses that businesses’ capacity
to learning is crucial for survival in the marketplace since absorptive capacity can be used
as a mechanism to reinforce or refocus the organization’s knowledge base. Some of the
technological turbulence include innovation and organizational exploration.
With increased digital revolution and the explosion of information in the past two decades,
firms have now changed their ways of doing as well as approaching business (Carbonell &
Escudero, 2012). The speed at which technology evolves and the changes that come along
with it have made a significant influence on the creativity and innovations of the companies.
In the modern world of technology, firms need to keep up with adaptability and flexibility
to match the changes in the environment (Ali & Matsuno, 2018). This has stressed the
importance of organizational learning to cope up with technological turbulence. Iyer (2014)

9
uses the term absorptive capacity to state that it can always increase the company’s ability
in sustaining competitive advantage through configuration of its resources base and by
adapting to the changes in the market conditions, hence, making the firm’s ability to learn
as vital and crucial for their survival otherwise the companies can be doomed irrelevant in
the business environment.
Technological turbulence has forced companies into organizational learning which is a
process through which the firm renews its competences by value recognition of the new
information, assimilate it and apply in their business processes as an attempt to address
technological turbulence before it is too late (Pratono, 2016). With perspectives of
organizational learning Iyer (2014) expresses that companies generate their capabilities by
dividing their attention and other scarce resources among two broad aspects that are
knowledge exploitation and knowledge exploration. Knowledge exploitation is where the
firm applies and examines possible application of the knowledge that has been explored and
retaining it in the organization by including things like production, choice, efficiency, and
implementation. According to Chen and Lin (2014) exploration is the generation of new
knowledge in the company through invention efforts internally and acquisition of the
external resources that are necessary for inventions within the company, this includes things
like discovery, flexibility, creativity, and innovation. Companies that maintain a balance
between knowledge exploitation and exploration can easily cope up with technological
turbulence.
2.2.1 Innovation
Christensen (2015), innovative technological turbulence can significantly impact business
operations and performance. Innovation can be very disruptive particularly if new
technology is being introduced to the business operations. As such, innovation can bring
technological disruption that can define whether the business processes enhances
performance or not (State, 2013). This is supported by the fact that business incumbent
tends to focus on product and service improvements for their current business segments and
overlook (Christensen, Raynor, & McDonald, 2015) the inferior portion which is ignored
giving rise to opportunities that can be exploited by new entrants to cause turbulence.
Turbulence many take several forms as described by Tellis and Sood (2010) in the study
known as demystifying disruption. Their findings indicated that there are three domains of
turbulence, these include; the firm field, the demand and technological turbulence. The firm
10
turbulence can take place during the time when business market share whose products are
using new technology exceed the market share of the biggest firm whose products and
services use the highest share technology, in this form of turbulence, the existing business
or new entrant can disrupt dominant organization in certain technology (Sood & Tellis,
2010). On the other hand, the demand turbulence occurs when the total share of products in
the market on the basis of new technology surpasses the share of the products based on the
dominant technology.
The technological turbulence drives the other two forms of turbulence, and this has been
widely explored in numerous studies as indicated by Raynor, McDonald, and Christensen
(2015). It is described as the technology which outperforms the various dimensions of
dominant technology, primarily in terms of performance (Sood & Tellis, 2010). The same
definition is supported by (Verspreet, 2013) through citing technological turbulence as the
technology which alters competition basis on which organizations compete through various
transformation performance metrics. This means that every developed technology for the
market on which established organization has limitations, the turbulence technology will
improve significantly over the time at a certain point and surpass performance of the
dominant technology and eventually it will be valued as much as the old technology by
consumers changing the way firms compete through the introduction of the new
performance metrics that were not part of the competition (Bower & Christensen, 1995).
As far as the literature on technological turbulence is concerned, innovation is regarded to
be a theme on the improvement of technology, either on small scale or large scale
(Christensen, Raynor, & McDonald, 2015). Innovation is described as the process of
developing a new product, service or a method that can provide added value to the users
through a provision of a function which is better at the same time affordable than the
previous option (Marcus, 2016). It can further be defined as the implementation of new or
significantly new marketing methods as well as new ways of organizing the work of
business (Hutt, 2016). Innovation cannot be only be limited to products because, in the case
of tech industries, for instance, it is evident that (Thornhill, 2017) that technology companies
need a significant amount of Research and Development for them to stay relevant with the
constant innovation that comes forth in their industry. Production in tech companies are
often the inputs into other industries which are posing a demand of making their processes
as well as products cheaper offering a high value to the end user (Howard, 2013) as the
result these companies focus on driving the innovation through the hiring of engineers and

11
recruitment of new scientists and hiring of highly qualified technicians to drive the
performance of the business.
Research and development play a crucial role in the process of innovation (Mahajan, 2015).
Essentially it is an investment in technology as well as future capabilities which can be
transformed into a new service, products, and processes (Christense, 1993). In any business
industry and the technology, R&D is an essential component of innovation and acts as a key
factor in developing a competitive advantage for the organization. A company that has
devoted itself to the R&D they have managed continuously to stay ahead of the competition
(Root, 2007), Intel, in particular, has led to stay abreast in its industry largely due to the
investment is done in their R&D department.
2.2.2 Organizational Exploration
Organizational learning is the process through which an organization renews its
competencies by recognizing the value the new information offers, apply it and assimilating
into the firm (Cohen & Levinthal, 1990). Through the perspective of organizational
learning, it conveys that companies generate competence in two kinds of activities by
dividing attention as well as the scarce resources (Pratono, 2016). These two activities are
knowledge exploration and knowledge exploitation. Exploitation is defined as the
application and the examination of the possible applications of the knowledge being
explored and retained in the organization. The exploitation involves things like efficiency,
production, choice, selection, refinement, implementation and the execution (Lusia, 2016).
Exploration, on the other hand, refers to the generating of new knowledge within the firm
by involving internal invention efforts and external acquisitions from external sources
dividing knowledge exploration into the internal and the external exploration. The process
of exploration involves various things like variations, discovery, innovation, play, variation
and risk-taking (Lusia, 2016). Having the balance between exploitation and exploration
becomes complex since they are all competing over the same resources.
The ability of the organization to exploit the external sources of knowledge as well as
internal is an essential element of innovation capabilities within the firm. Cohen and
Levinthal (1990), argue that the capability to evaluate and use the external knowledge is
largely a function of the level of prior related know how. At the elemental level, prior
knowledge consists of the very basic skills (Bughin, 2017) or even shared a language but it
may also involve knowledge of the most recent technological and scientific developments

12
in a given field. The prior knowledge confers the ability of the firm to recognize the value
of new information, assimilating it and the application to commercial ends (Buganza,
Dell’Era & Verganti, 2014)
According to Bughin (2017), the imbalance between exploration and exploitation within the
company might lead to two things either a competency trap when implementing a system
that engages in exploration or suffering the costs of experimenting without gaining its
desired benefits. When a company strives for exploitation, there is always a trend towards
prediction of greater certainties, speed, proximity as well as clarity in terms of
organizational activities (Liu, 2006). This indicates that less effort is directed toward
revolutionary innovations, and in the long term this may be a component influencing the
tendency of obsolescence within the organizational knowledge management. Having
explicit knowledge is more present in terms of exploitation, and there is an idea of
continuity, standards operating procedures and repetition resulting to the addition of
competencies for the employees (Popadiuk, 2016) and the organization as a whole.
There is a growing interest in organizational learning and its associated concepts in
knowledge exploration. Previous researchers such as Bughin (2017) and Popadiuk (2016)
have indicated that the ability of organizations to learn is their primary source of competitive
advantage. Maintenance of appropriate balance between exploration and the exploitation
within the organization is the primary objective in organizational prosperity and survival in
a turbulence business environment (Lusia, 2016). Organizational learning can serve to
utilize the knowledge existing in the company and incorporate new knowledge into the
existing knowledge base in which the competencies of the company can be improved and
new ones to be developed for the organization to remain sustainable and cope with various
technological turbulence factors hindering its success.
2.3 The Impact of Environment Turbulence on Business Performance
The environment turbulence is an operational space where organizations relentlessly face
constant change characterized by profound transition. Organizations grapple with the
changes taking place in their environment to remain viable, vibrant, profitable and
competitive (Perrott, 2011). The changes in the environmental conditions impact most
companies hence making them emphasize on their external environment, performance,
strategic direction making strategic formulation to be crucial during this time for business
sustainability as the business operates in the uncertain business environment. The

13
environmental factors that may influence the organization include changes in the market,
customer demand, and competition (Shamsher, 2016).
The environment in which organizations operate is evolving with its unclear boundaries, the
turbulence and technological innovations taking place require companies to be flexible and
adapt changes with response strategies as well as the structure that can accommodate the
environmental changes of the business environment at all times (Shamsher, 2016). The
competitive environment for business expects to face turbulence impact of its environment
since the markets in this environment are considered as being increasingly involved with
the traditional industries converging the supply of goods and services in diversity. The
existence of shorter life cycles, perceptive and knowledgeable consumers are adding the
increasing complexity in the operating business environment (Jeroen, 2016).
In reference to Mason (2007), the business environment is made of a set of relationships
between the stakeholders and the environment and these relationships vary with the
individual decisions taken. He further describes that these relationships continuously co-
create the environment causing the business environment changes faster than ever before
and with such change occurring in two dimensions, turbulence, and complexity (Mason &
Clubb, 2007).
Environmental turbulence can be explained as dynamism in the business environment which
involves a rapid and uncertain change in the environmental dimensions (Mcmillan &
Conner, 2010). A stable business environment tends to change less often and when it does
the change is predictable. At the same time, there are many uncertain and unexpected
changes in the turbulent environments. Turbulence is brought by the changes and the
interactions between the environmental factors most of which are technological advances.
The increase of environmental turbulence, as a result, a reduction in orderly competition,
the highly need for information and responsive innovation and difficulty in comprehending
customer requirements for their products and services (Farsijani et al., 2014). As turbulence
increases in the business environment, strategic issues to be addressed by the organizations
through strategy formulation and implementation emerge. In addition, turbulence questions
the duties, the balance of authority and decision making priorities between those who govern
and manage. The different levels of turbulence determine the kind of responses the company
should take to survive. At low levels organization tend to respond by making operational
changes with a few strategic adjustments, on the other hand, with higher turbulence levels,

14
strategic issues that could impact the business’s ability to meet its goals and objectives can
engage at more frequent intervals under conditions such as vital issue management system
(Perrott, 2011).
Business leaders require guidance on how they need to cope up with the turbulent
environment if they want to improve corporate performance (Bughin, 2017). Studies on
environmental turbulence have suggested that companies that adopt a less centralized,
organic structure in uncertain environments. To cope up with the turbulent environment is
at the forefront of every business leader seeking a guide on how they can mitigate risk and
uncertainty that poses negative implications in their business operations. Studies have also
highlighted various ways on how companies can maximize their overall corporate
performance in an environment which is dynamic and volatile (Jaiswal, 2010).
Market leaders must also face and cope with turbulence by adjusting their strategy, sharing
of responsibilities for approach broadly within the company and focus on the firm’s
capabilities as their main source of competitive advantage (Lusch & Vargo, 2015). Other
researchers like Bughin (2017) have suggested that companies concentrate on the creation
of cross-functional organizational committees and a matrix while encouraging a boundary
spanning of events within the company. The contingencies of the environment also view the
company in a sense that it must align their strategy with the turbulent environment through
structuring the organization in a manner that has less centralization and more organic during
uncertain conditions. Innovation represents the most effective way for companies to deal
with external environment turbulence (Liu, 2006).
According to Payne and Leiter (2013), business industries are characterized with instability,
for instance, the media industry, computer, and telecommunication industries are often
noted to be highly turbulent, and people expect that situations will always prevail. However,
almost all industries at some point experience turbulence in their environment which may
vary form one industry to another industry. An environment with turbulence has also been
described as attributed by high levels of interfered changes which create uncertainty making
it difficult to predict changes that may occur due to its nature of volatility and dynamism
that sharp discontinuities in demand and rates of growth (Keegan, Harwood , & Lavallee,
2010). Putting together all these descriptors make up instead through measures of turbulence
in the environment, but when standing alone, for instance, there is a possibility of having a
heterogeneous environment that is not characterized with turbulence (Bughin, 2017).

15
However, in a hostile varied and dynamic turbulent environment will generate turbulence
that is defining turbulence in the business environment like the one in which unpredictable
and frequent market or technological changes within a certain industry accentuate
uncertainty and risk in the strategic planning exercise to address turbulence. Having the
inability to foresee accurately, even within the context of contingencies will help the
organization define turbulence from the top level management team aspect (Carbonell &
Escudero, 2012).
2.3.1 Political and Legal Environment
According to Naucer and Kandil (2009), the political processes and legislation within the
business environment have the influence on environmental conditions that a business or the
industry must comply with in order to operate. They further suggest that political and
government legislation have a significant effect on the governance of the business (Naceur
& Kandil, 2009). Political constraints for instance may be put on organizations through fair
trade regulations, tax programs, minimum wage laws, (Jeroen, 2016) pollution and the
policies on pricing which are likely to be seen as protecting the interests of consumers, the
environment, and employees and could restrict the profitability of the company as well as
its performance. At the same time, patent laws and government subsidies and product
research grants tend to protect the interests of the organizations (Farsijani et al., 2014) even
to enhance their profits and performance.
Shamsher (2016) suggest that it is crucial for companies to establish a political connection
with the government supporting the business environment in which it operates. The
relationship with the government tends to influence the strategic decisions within the firm
as well as the overall corporate governance of the business. The operational environmental
of the business consists of the market and the non-market dimensions, which is the political
and legal environment which play a key role in the growth of the business. Therefore, it is
important that companies have both the market and political strategies (Shamsher, 2016).
2.3.2 Social-Cultural Environment
Businesses do not operate in a vacuum, even the most successful companies must be aware
of the changes taking place in the societies and cultures in which business is operating with
an attempt to fulfill its missions and objectives of the firm (Richards, 2010). As the changes
in the culture and the society take place, companies are forced to adapt and stay ahead of

16
their competitors and stay relevant in the minds of customers interacting with the brand in
the marketplace (Grimsley, 2009). Lumpkin, Eisner, and Dess (2008) argue that socio-
cultural factors influence the beliefs, the values and the lifestyle of a society the business
operates in. They further indicate that the socio-cultural forces strongly influence the
revenues of products and services through the enhancement of sales of services and products
of an industry as a whole while at the same time suppressing those of the other sectors in
the business environment (Jeroen, 2016).
Customer purchases are significantly influenced by cultural, personal, and psychological
behaviors, and generally, marketers find it hard (Martin, 2014) despite taking them into
considerations. There both internal and external factors that influence the consumer buying
process as well as the behavior. The external factors consist of technology, social-cultural,
demographics while internal factors influencing consumer behaviors include attitudes,
motives, and needs, perception, personality, and values, together influence the consumer
behavior (Keegan, Harwood , & Lavallee, 2010)
Armstrong and Kotler (2014) have reinforced this by arguing that consumer buying
behaviors and their choices for products and services can be influenced by four major
psychological forces; these forces include; perception towards the product, motivation,
attitudes, learning, and beliefs. Attitudes represent the customer’s consistent evaluations,
the feelings and the inclination they have towards an idea, hence, putting themselves into a
state of mind for loving or disliking things or even moving away or towards a certain object
(Martin, 2014). This makes the creation and development of marketing strategies an integral
part of the business to seek competitive advantage over its rivals through the application of
market segmentation being the pivot to establishing an effective target market strategy in
the dynamic business environment (Simkin, 2008).
2.4 The Impact of Market Turbulence on Business Performance
According to Pearce and Robinson (2011), the market environment is defined through its
market turbulence. Different authors have conceptualized the concept of market turbulence
such as Shamsher (2016) who proposed the three environmental features that are the market
turbulence, technological turbulence, and the competitive intensity. The technological
turbulence and market turbulence are the rate of change in the technology and the market
respectively (Saeed & Aimin, 2015). Competitive intensity, on the other hand, refers to the
rate of activities and actions taken by competitors of the business (Jeroen, 2016). In this

17
study, market turbulence is regarded as the rate of change in the composition or proportion
of consumers and their preferences (Jaworski & Kohli, 1993). With this definition, market
turbulence captures the dynamism taking place in the customer base, the wants and needs
of consumers and the uncertainty of the market in terms of the changing rate in respect to
the competitors. Market uncertainty involves prediction of the future for the market
preference, the state of its competition and the environmental forces evolution
In regards, the market turbulence concept attempts to simultaneously evaluate the change
that businesses face in their consumer composition and the competitors also known as the
market dynamism and try to prepare the company to deal with the new competitive
situations (market uncertainty) (Milliken, 1987).
2.4.1 Competition
The market environment is determined by the kind of competition the firm is facing from
its rivals. In addition to the remote environment of the business, managers are challenged to
take into consideration the competitive environment as well as the industry.
Competitiveness in this sense refers to the positioning of the firm according to the strengths
and weaknesses the company has; this includes both intangible and tangible assets and the
managerial competencies the firm has (Dess, Lumpkin , & Eisner , 2008).
Saeed and Aimin (2015) argue that organization’s environment hosts various competitive
forces as well as a strategic performance which is significantly related to the capacity of
handling the impacts of competition in an industry and profitability of the business being
directly related to the environmental competition (State, 2013). The market turbulence can
be put into perspective with the use of Michael Porter’s five forces Model.
2.4.1.1 The Bargaining Power of Buyers
Buyers of the company’s products and services tend to pose a threat to the organization and
the industry as a whole; customers can cause turbulence to the organization as they demand
better products and playing competitors against one another. The power that each buyer
holds depends on the attributes of the situation prevailing in the marketplace based on the
significance of that buying group. A group of buyers becomes powerful when they purchase
large volumes of certain products or services that are relevant to the seller’s sales, and when
the products or service in the industry are undifferentiated, buyers have low switching costs
and when they show a threat of backward integration for the company’s products and

18
services. In addition to the bargaining power of buyers, Saeed and Aimin (2015) indicate
that consumer loyalty seems to be the marketplace currency of the 21st century. On the other
hand Lusch and Vargo (2015) suggest that customer retention is a good and effective
strategy rather than trying to attract new customers due to high costs involved in dragging
new customers into the company’s product and services to replace defect customers, making
it evident that consumers have a great role in the performance of organization.
With increased market turbulence, Pearce and Robinson (2011) argue that consumer
orientation also has a positive impact on business performance. The concept of market
orientation involves incorporating customer orientation and competitive orientation with a
focus on competitive threats and customer orientation focusing on the needs and wants of
consumers (Ranchhod, 2004). Businesses are faced with the market turbulence coming to
the bargaining power of buyers coupled with the challenging task of constant satisfaction of
consumer needs and wants. Through the collection of information pertaining to the needs
of customers and the actions of the competitors, a business can become more responsive to
the needs and wants of consumers hence; the organization becomes able to respond rapidly.
2.4.1.2 Intensity of Rivalry among Competitors
The environment in which businesses operate is faced with intense market competition
(Martin, 2014). Casu (2009) on the other hand indicate that competition is considered to be
having a positive impact on the efficiency, international competition of the industry and
innovation. Pearce and Robinson (2011) the rate of rivalry among competitors depend on
the intensity and the basis of the competition. Intense rivalry is due to the several interacting
forces that include various costs of storage, the absence of differentiation and high exit
barriers in the industry (Porter, 2008).
The more the rivals in an industry, the higher the competition pressure form the competitors
in the industry. A slow rate of growth tends to increase the competition rivalry because firms
have a higher tendency of competing with rivals with an attempt to steal market share.
Industries need to develop their own strategies in an efficient manner after scrutinizing the
company environment in which it operates (Jaiswal, 2010). Researchers have also found
that the strategy of the company is established by its competitive environment and matching
of the appropriate strategy tend to enhance the performance of the business (Shamsher,
2016).

19
2.4.1.3 Bargaining Power of Suppliers
Pearce and Robinson (2011), suppliers can have the bargaining power in the industry
through increasing of prices or reduce the quality of the goods and services purchased by
the organization. Hence, they become powerful in squeezing revenues out of the industry.
Suppliers have high bargaining power when the group of suppliers is dominated with a few
competitors, and the suppliers do not have any threat of a substitute product, the industry is
not a significant client of the supplier group, the product of the suppliers is a crucial input
to the buyers, high switching costs for the buyers and when the supplier group pose a
credible threat of forwarding integration (Lusch & Vargo, 2015).
Switching costs can be regarded as the market turbulence coming from the bargaining power
of suppliers. Switching costs refer to the one-time expenses that consumers incur in the
process of switching from one supplier to another. According to Kim (2009), switching
costs are consumer’s costs from switching and can also be referred to as barriers and benefits
from the constraints.
2.4.1.4 The Threat of Substitute Products and Services
All the firms in the industry compete with other firms that produce the substitute products
and services. Substitutes tend to reduce potential returns or profitability through replacing
ceilings on the prices that a company can charge at a profit. Porter (2008) indicates that a
substitute commodity tends to perform the same or a similar function as an industry’s
products through different means. Pearce and Robinson (2011) suggest that substitute
products and services requiring keen attention are the ones subjected to trends improving
their price-performance trade-off with the industry’s products and services or the ones being
produced by industries earning high profits.
2.4.1.5 The Threats of New Entrants
According to Pearson and Robinson (2011), the degree level of new entrants depends on the
barriers of entry and the reaction from existing competition that entrants expect, when
barriers to entry are too high, and new entrant hope to have a sharp retaliation from the
existing competition, then they do not pose a severe threat of entering the market or industry.
The barriers to entry consist of access to distribution channels, costs disadvantages (Dess,
Lumpkin , & Eisner , 2008). Thompson (2008) add to the factors which increase the threats

20
of new entries a large pool of entry players with sufficient expectations of new entrants with
an attempt to make high profitability
2.4.2 Market Orientation
In times characterized by an increased rapid change in the consumer’s tastes and even faster
fast technological progress, the intensity of rivalry among competing firms brought by the
market turbulence. It is essential for companies to develop mechanisms within their
organization that will help generate the market information, analyzing the data and
addressing the changes taking place accordingly (Saeed & Aimin, 2015). The set of
activities or initiatives developed by companies permanently to monitor, analyze and to
respond to the changes in the market is what is known as market orientation (Lusch &
Vargo, 2015) and its usefulness in the marketing performance (Dess, Lumpkin , & Eisner ,
2008). Terms such as customer focused, market-driven and market-oriented have become
the synonyms with the proactive approach of the business strategy in companies all over the
world to deal with market turbulence.
The notion in the companies that the needs of the customers need to be the source of
organizational planning processes seems to be a contemporary one as is the idea of
organizing a firm’s activities by understanding the consumer needs and demands to
overcome market turbulence (Kirca, Bearden, & Jayachandran, 2005). As many theorists
cite Peter Drucker’s statement that marketing is not an exclusive functional activity but the
whole business as seen from the perspective of the final result that is from the consumer’s
point of view. More specifically, market orientation consists (Saeed & Aimin, 2015) of
generating and disseminating of the market intelligence which is composed of the
information on the external business environment confronting the company, and sharing the
information among various departments in the organization to develop a rapid managerial
action to overcome market turbulence.
2.5 Chapter Summary
Chapter two presented the literature review on the impact of turbulent environment on
business performance. First, the chapter covers the literature on the impact of environment
turbulence on business performance, followed by the impact of environment turbulence on
business performance and the impact of market turbulence on business performance.
Chapter three of the study presents the research methodology adopted by the researcher.

21
CHAPTER THREE
3.0 RESEARCH METHODOLOGY
3.1 Introduction
The research methodology that was used to carry out this study is presented in this chapter.
The research methodology includes the research design highlighting the approach; the
population upon which the study was based; the sampling design which consists of the
sample frame, sample size, and sampling technique have also be presented. The data
collection methods, research procedures and data analysis are also presented in this study.
3.2 Research Design
According to Cooper and Schindler (2014), research design is defined as the roadmap or
framework that is used to determine the structure and methodology that was adopted for a
study. On the other hand, Creswell (2014) noted that a research design maps the overall
strategy research adopts to carry out a study that ensures logical sense that responds to the
study objectives. In choosing a research design, research has to be sure that he /she can
justify the choice of the design, the resource required to implement the design, and the type
of data required for the study. This study adopted a descriptive research design. Descriptive
survey design is defined as a study design that enables a researcher to collect both qualitative
and quantitative data in a manner that can enable the researcher to describe the study
characteristics, without tempering or influencing the study subject (Cooper & Schindler,
2014). This study adopted the descriptive survey design because primary data was collected
for this study, and a description of the respondent’s characteristics is essential to the findings
of this study.
3.3 Population and Sampling Design
3.3.1 Population
The population of a study refers to the whole elements of a study that a researcher seeks to
investigate or study (Creswell, 2014). A study population can also be defined as the subjects
of objects, or units that a researcher seeks to study and make an inference. According to
Cooper and Schindler (2014), a study population defines the context from which a study is
conducted. The target population of this study was 150 managers from 24 confectionery
organizations in the Kenyan market

22
3.3.2 Sampling Design
Sampling design is defined as the process through with a researcher establishes the basis for
selecting a sample for a study (Lavrakas, 2008). Creswell defines sampling design as the
blueprint the guides a researcher in determining and selecting a survey sample that can be
used to represent the entire population (Creswell, 2014). In research, the whole population
is hardly used to carry out a survey, unless if the study is a census. Therefore, researchers
usually adopt a scientific mechanism that can be relied on to select a sample that can provide
data to be influenced to the entire population. In this regard, a sampling design provides
researchers with the mechanism to do this (Cooper & Schindler, 2014). Sampling design is
composed of a sample frame, sample technique, and sample size.
3.3.2.1 Sampling Frame
The sampling frame is defined as the complete list that highlights the entire population of a
study in which a researcher is interested (Saunders, Lewis, & Thornhill, 2016). In research,
a sampling frame defines the parameters of the population and restricts the researcher within
the boundaries of the population when selecting the sample size to represent the entire
population. For this study, the sampling frame was obtained from the human resources
offices of the confectionery firms in their Nairobi head offices.
3.3.2.2 Sampling Technique
A sampling technique is defined as the tactic that researchers use to ensure the equal chance
of unit selection within a population that forms a sample size (Saunders et al., 2016). This
means that whether a population is either homogeneous or heterogeneous, all members must
have an equal chance of being selected to be part of a sample size. There are various types
of sampling techniques: probability sampling and non-probability sampling techniques.
According to Cooper and Schindler (2014), probability sampling refers to the use of
techniques that are predictable and can be replicated scientifically. This includes stratified
sampling, random sampling, and simple random sampling; while non-probability are
techniques used to select sample sizes, but are not scientific, nor can be replicated in a
similar order. This includes purposive sampling, convenience sampling, and snowball
sampling. This study adopted stratified sampling to select employees from different
departments, and also managers from different departments.

23
3.3.2.3 Sample Size
Creswell (2014) defines a sample size as the unit representation of an entire population, that
has similar characteristics and traits at the population upon which inference of a study was
made. The sample size is usually selected using a sampling technique. Sample size can
either be designated or final sample size. The designated sample size is the number of
sample units that have been selected to be used for data collection; while on the other hand,
a final sample size is a number of units of completed questionnaires or from which actual
data has been collected (Saunders et al., 2016). The sample size of this study was drawn
from the 9 management departments as follows: Groups Managing Director/GM, Head of
Finance, Head of Factory, Corporate Affairs, Head of HR, Head of Supply Chain, Head of
Marketing, Head of Sales, Demand Planning Lead. Thus, the sample was calculated as
follows:
n = N/(1+N(e)2) = 150/(1+150(0.5)2) = 108
Table 3.1: Sample Size Distribution Table
Organization Target population Percentage Sample Size
1) Mars - Wrigley Confectionery 12 8 9
2) Cadbury Kenya 10 7 7
3) Ferrero Rocher 6 4 4
4) Pladis 4 3 3
5) Nestle 9 6 6
6) Kenafric 5 3 4
7) Mzuri Sweets 6 4 4
8) Kenya Sweets Limited 4 3 3
9) Candy World 8 5 6
10) Patco Kenya 6 4 4
11) Pearl 8 5 6
12) Jaydev Confectioners 6 4 4
13) Kwality Candies & Sweets 8 5 6
14) Milan Pan House 8 5 6
15) Soko Sweety 4 3 3
16) Sweet Fresh Limited 6 4 4
17) Virgin International 6 4 4
18) Bhagwanji Hansraj & Sons 4 3 3
19) Mombasa Sweet Mart 6 4 4
20) Nakuru Sweet Mart 8 5 6
21) Swan Industries 4 3 3
22) Sweet Center 4 3 3
23) Virani Industries 4 3 3
24) Warku Industries 4 3 3
Total 150 100 108

24
3.4 Data Collection Methods
Data collection methods are processes through which a researcher gathers all data and
information required to answer the research questions. Cooper and Schindler (2014) define
data collection methods as the systematic order through which a researcher collects
information that is used to answer the questions and objectives. This study used a structured
questionnaire to collect primary data. A questionnaire was ideal for this study in that it
enabled the researcher to structure respondents’ views, which made it easy to conduct
descriptive analysis since the response was restricted to a Likert scale scope (Saunders et
al., 2016). The questionnaire had a five-level Likert scale of strongly disagree, disagree,
neutral, agree and strongly agree. The scale used numeric numbers of 1, 2, 3, 4, 5 in the
same order of the Likert scale. The first section of presents demographic data of the study
respondents; second section presents information on the first research question; the third
section presents information on second research question; the fourth section presents
information on the third research question
3.5 Research Procedures
Research procedures refer to the systematic and detailed step by step approach a researcher
deploys to carry out a study (Cooper & Schindler, 2014). These detailed procedures allow
a researcher to accomplish the research process in a manner that logically accomplished the
study objectives. For this study, a letter of approval was drafted to confectionery firms
Human Resources Managers seeking permission to carry out the study. One of the
permission has been granted; a pilot test was conducted at Wrigley’s using 10 casual
workers who did not take part in the final study. Piloting the questionnaire allowed the
research to examine the validity, reliability, and usability of the questionnaire. Importantly,
piloting the questionnaire played an important role in determining whether questions that
accompany each research question are simple and understandable and whether they generate
desired true reflection of the situation on the ground.
As such, feedback from the pilot was used to enhance the questionnaire tool. The next step
involved the researcher assistants physically visiting confectionery offices in Nairobi, to
administer the questionnaire. This was done through heads of departments. Each head of
the department was given a set of questionnaires to distribute. Using the heads of
departments is strategic in increasing and ensuring a higher response rate. Employees in the
selected confectionery firms report to their heads of departments. Therefore it made sense

25
to use this office to enhance the response rate. The head of the department was given 72
hours to have collected back all the questionnaires. The researcher liaised with the head of
departments to pick up all questionnaires that had been collected from employees and other
managers. The researcher went through all the questionnaires counter checking any errors
and completeness of the data provided. After this is done, the questionnaires were coded
and entered into the Statistical Packages for Social Sciences (SPSS) version 24 for analysis.
3.6 Data Analysis
Data analysis is the process through which raw data from a survey is converted into
meaningful information through the use of a data analysis tool (Creswell, 2014). Data
analysis can also be referred to as the process through which a researcher inspects, models
and transforms raw data into meaningful information that answers the research questions
(Saunders et al., 2016). This study used the Statistical Package for Social Sciences (SPSS)
version 24 to analyze both descriptive and inferential statistics. Descriptive statistics were
used to document information frequencies and percentages, while inferential statistics were
used to document correlation and regression analysis. The analyzed information has been
presented using Tables and Figures. The following regression model was used:
Y = β0 +β1X1 + β2X2 + β3X3 + e
Where; β0 is a coefficient constant; X1= Technological Turbulence; β1 = Standardized Beta
vale for Technological Turbulence; X2 = Environmental Turbulence; β2 = Standardized
Beta vale for Environmental Turbulence; X3 = Market Turbulence, β3 = Standardized Beta
value for Market Turbulence;
3.7 Chapter Summary
This chapter has presented the research methodology adopted for the study. First, a
descriptive survey research design has been presented, followed by the study population
that is composed of 150 employees and managers from 24 confectionery firms in Kenya.
Stratified sampling was used to select 108 employees and managers. This chapter has also
presented data collection methods using structured questionnaire, study procedures, and
data analysis methods.

26
CHAPTER FOUR
4.0 RESULTS AND FINDINGS
4.1 Introduction
These study findings are presented in this chapter. Demographic findings of are presented
first, followed by findings on the impact of technological turbulence on business
performance; the impact of environmental turbulence on business performance, and finally,
the effect of market turbulence on business performance. This study had a response rate of
(72%); out of the 108 respondents sample size, 78 questionnaires were returned back. The
questionnaire tool was tested for validity and reliability using a Cronbach Alpha. The
questionnaire tool was found to be reliable as it had a reliability Cronbach Alpha value
above 0.7 as indicated in Table 4.1
Table 4.1: Reliability Analysis
Variables No of Items Alpha Value
Technological Turbulence 10 0.782
Environmental Turbulence 10 0.720
Market Turbulence 10 0.846
Business Performance 6 0.770
4.2 Demographic Information
This study demographic information included respondents’ gender, age, years of work at
their respective organization, and their designation at the organization. Demographic
characteristics are presented as follows:
4.2.1 Respondents Gender
When respondents of the study were asked to indicate their gender; (55%) reported they
were male, while (45%) were female as highlighted in Figure 4.1

27
Figure 4.1: Respondents Gender
4.2.2 Respondents Age
On the question on respondents age, (35%) indicated they were aged 41-47 years; (31%)
reported they were aged 34 – 40 years; (14%) were aged 26-33 years; (13%) were aged 18-
25 years, while the remaining (8%) were aged above 48 years as summarized in Figure 4.2
Figure 4.2: Respondents Age
4.2.3 Respondents Number of Years at their Organization
When respondents were asked for a number of years had worked at their confectionery
organization, (42%) indicated they had been with the organization for 5-7 years, (19%) had
spent 8-10 years with the organization; (15%) had spent 2-4 years with their respective
55%
45% Male
Female
12.8
14.1
30.8
34.6
7.7
0.0 5.0 10.0 15.0 20.0 25.0 30.0 35.0 40.0
18-25 YEARS
26-33 YEARS
34-40 YEARS
41-47 YEARS
48 AND ABOVE

28
organization; (13%) had spent more than 10 years, while the remaining (10%) had spent 1
year or less with their organization as highlighted in Figure 4.3
Figure 4.3: Number of Years with the Organization
4.2.4 Respondents Designation
On the question on respondents’ designation at work, (41%) were human resource officers,
(31%) were managers, (19%) were manufacturing and packaging employees, while the
remaining (9%) were plant managers as indicated in Figure 4.4
Figure 4.4: Respondents Job Designation
0.0
5.0
10.0
15.0
20.0
25.0
30.0
35.0
40.0
45.0
0-1 Years 2-4 Years 5-7 Years 8-10 Years Above 10Years
10.3
15.4
42.3
19.2
12.8
9%
19%
31%
41%
Plant Manager
Manufacturing /Packaging Employee
Manager
Human Resource Officer

29
4.3 Impact of Technological Turbulence on Business Performance
This study sought to determine whether technological turbulence had an impact on business
performance. The findings are presented as follows:
4.3.1 Confectionery Organization Technological Innovation
Respondents were asked whether their respective organizations had been undergoing
technological innovation; (38%) strongly agreed, (36%) agreed, (11%) were neutral, (10%)
disagreed, while the remaining (4%) strongly disagreed as highlighted in Table 4.2
Table 4.2: Confectionery Organization Technological Innovation
Scale Frequency Percent
Strongly Disagree 3 3.8
Disagree 8 10.3
Neutral 9 11.5
Agree 28 35.9
Strongly Agree 30 38.5
Total 78 100.0
4.3.2 Technological Innovation and Enhanced Product Lines
On the question on whether technological innovation had enhanced product and service
lines, (41%) strongly agreed, (40%) agreed, (10%) disagreed, (8%) were neutral and (1%)
strongly opposed as highlighted in Table 4.3
Table 4.3: Technological Innovation and Enhanced Product Lines
Scale Frequency Percent
Strongly Disagree 1 1.3
Disagree 8 10.3
Neutral 6 7.7
Agree 31 39.7
Strongly Agree 32 41.0
Total 78 100.0

30
4.3.3 Technological Innovation and Business Performance
On the question on whether technological innovation had enhanced business performance,
the majority (51%) strongly agreed, (40%) agreed, (5%) were neutral, while the remaining
(4%) disagreed as summarized in Table 4.4
Table 4.4: Technological Innovation and Business Performance
Scale Frequency Percent
Disagree 3 3.8
Neutral 4 5.1
Agree 31 39.7
Strongly Agree 40 51.3
Total 78 100.0
4.3.4 Technological Innovation Uncertainty
Respondents were asked to indicate whether technological innovations adopted by their
organizations had increased performance uncertainty, (49%) strongly agreed, (44%) agreed,
(4%) were neutral, (3%) disagreed, while the remaining (1%) strongly disagreed as
highlighted in Table 4.5
Table 4.5: Technological Uncertainty
Scale Frequency Percent
Strongly Disagree 1 1.3
Disagree 2 2.6
Neutral 3 3.8
Agree 34 43.6
Strongly Agree 38 48.7
Total 78 100.0
4.3.5 Innovation and Organization Restructuring
When respondents were asked whether technological innovation had influenced
organizational restructuring, the majority (55%) strongly agreed, (37%) agreed, (5%) were
neutral, while (3%) disagreed as highlighted in Table 4.6
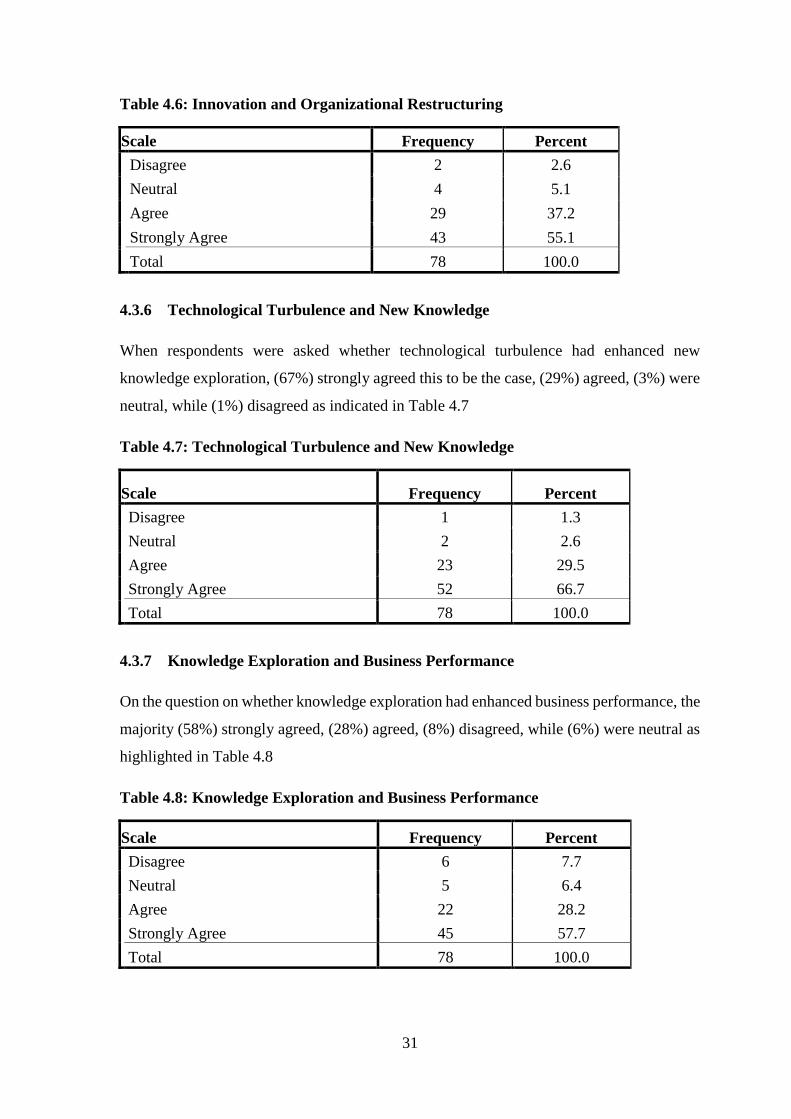
31
Table 4.6: Innovation and Organizational Restructuring
Scale Frequency Percent
Disagree 2 2.6
Neutral 4 5.1
Agree 29 37.2
Strongly Agree 43 55.1
Total 78 100.0
4.3.6 Technological Turbulence and New Knowledge
When respondents were asked whether technological turbulence had enhanced new
knowledge exploration, (67%) strongly agreed this to be the case, (29%) agreed, (3%) were
neutral, while (1%) disagreed as indicated in Table 4.7
Table 4.7: Technological Turbulence and New Knowledge
Scale Frequency Percent
Disagree 1 1.3
Neutral 2 2.6
Agree 23 29.5
Strongly Agree 52 66.7
Total 78 100.0
4.3.7 Knowledge Exploration and Business Performance
On the question on whether knowledge exploration had enhanced business performance, the
majority (58%) strongly agreed, (28%) agreed, (8%) disagreed, while (6%) were neutral as
highlighted in Table 4.8
Table 4.8: Knowledge Exploration and Business Performance
Scale Frequency Percent
Disagree 6 7.7
Neutral 5 6.4
Agree 22 28.2
Strongly Agree 45 57.7
Total 78 100.0

32
4.3.8 Technological Innovation and Organizational Learning
Respondents of the study were asked to indicate whether technological innovation had
enhanced organizational learning. The majority (64%) strongly agreed, (28%) agreed, (5%)
were neutral, while (3%) disagreed as highlighted in Table 4.9
Table 4.9: Technological Innovation and Organizational Learning
Scale Frequency Percent
Disagree 2 2.6
Neutral 4 5.1
Agree 22 28.2
Strongly Agree 50 64.1
Total 78 100.0
4.4 Impact of Environmental Turbulence on Business Performance
This study sought to determine whether environmental turbulence had an impact on business
performance. The findings are presented as follows:
4.4.1 Prevalence of Environmental Turbulence
Respondents were asked to indicate whether their organizations had been experiencing
environmental turbulence. The results show that the majority (57%) strongly agreed, (42%)
agreed, while the remaining (1%) were neutral as indicated in Figure 4.5
Figure 4.5: Prevalence of Environmental Turbulence
1%
42%
57%
Neutral
Agree
Strongly Agree

33
4.4.2 Environmental Turbulence and Competition
On the question on whether environmental turbulence had increase competition for the
organization, the majority (58%) strongly agreed, (32%) agreed, (5%) disagreed, and were
neutral respectively as indicated in Table 4.10
Table 4.10: Environmental Turbulence and Competition
Scale Frequency Percent
Disagree 4 5.1
Neutral 4 5.1
Agree 25 32.1
Strongly Agree 45 57.7
Total 78 100.0
4.4.3 Environmental Turbulence and Change Process Management
When asked whether environmental turbulence had influenced change management
processes at their organization, (56%) agreed, (38%) strongly agreed, while (3%)
disagreed and were neutral respectively as highlighted in Table 4.11
Table 4.11: Environmental Turbulence and Competition
Scale Frequency Percent
Disagree 2 2.6
Neutral 2 2.6
Agree 44 56.4
Strongly Agree 30 38.5
Total 78 100.0
4.4.4 Change Processes and Business Performance
When respondents were asked whether change processes at their respective organizations
had influenced business performance, (49%) strongly agreed, (45%) agreed, while (6%)
were neutral as highlighted in Figure 4.6

34
Figure 4.6: Change Processes and Business Performance
4.4.5 Environmental Turbulence and Political Uncertainty
On the question on whether environmental turbulence was affected by political uncertainty,
the majority (53%) of respondents strongly agreed, while (47%) agreed as indicated in
Figure 4.7
Figure 4.7: Environmental Turbulence and Political Uncertainty
6%
45%
49%
Neutral
Agree
Strongly Agree
47%53%
Agree
Strongly Agree

35
4.4.6 Environmental Turbulence and Tax Burden on Manufacturing
When respondents were asked whether environmental turbulence involved high tax burden
on manufacturing, the majority (60%) strongly agreed, (39%) agreed, while the remaining
(1%) were neutral as indicated in Table (4.12)
Table 4.12: Environmental Turbulence and Tax Burden on Manufacturing
Scale Frequency Percent
Neutral 1 1.3
Agree 30 38.5
Strongly Agree 47 60.3
Total 78 100.0
4.4.7 Customer Buying Behavior and Business Performance
This study sought to determine whether customer buying behavior had affected business
performance at confectionery organizations. The findings show that (63%) strongly agreed,
(30%) agreed, while (4%) disagreed and were neutral respectively as indicated in Table 4.13
Table 4.13: Customer Buying Behaviour and Business Performance
Scale Frequency Percent
Disagree 3 3.8
Neutral 3 3.8
Agree 23 29.5
Strongly Agree 49 62.8
Total 78 100.0
4.4.8 Product Perception and Business Performance
When asked whether perception towards organizational products had affected business
performance, (53%) strongly agreed on this to be the case, (41%0 agreed, while (6%)
remained neutral as highlighted in Table 4.14

36
Table 4.14: Product Perception and Business Performance
Scale Frequency Percent
Neutral 5 6.4
Agree 32 41.0
Strongly Agree 41 52.6
Total 78 100.0
4.4.9 Effect of Environmental Turbulence on Business Performance
On the question on whether environmental turbulence had an effect on business
performance, the majority (65%) of respondents noted this to be the case, (32%) strongly
agreed, while (3%) disagreed as highlighted in Figure 4.8
Figure 4.8: Effect of Environmental Turbulence on Business Performance
4.4.10 Effect of Reducing Environmental Turbulence
When asked whether reducing environmental turbulence would enhance business
performance, (58%) agreed that this would be the case, (36%) strongly agreed, while (6%)
as indicated in Table 4.15
2.6
65.4
32.1
0.0 10.0 20.0 30.0 40.0 50.0 60.0 70.0
DISAGREE
AGREE
STRONGLY AGREE

37
Table 4.15: Effect of Reducing Environmental Turbulence
Scale Frequency Percent
Neutral 5 6.4
Agree 45 57.7
Strongly Agree 28 35.9
Total 78 100.0
4.5 Impact of Market Turbulence on Business Performance
This study sought to determine the impact of market turbulence on business performance.
The findings are presented as follows:
4.5.1 Prevalence of Market turbulence
When respondents were asked whether their organization had experienced market
turbulence, (51%) strongly agreed, (42%) agreed, while (7%) were neutral as highlighted in
Table 4.16
Table 4.16: prevalence of Market Turbulence
Scale Frequency Percent
Neutral 5 7
Agree 33 42
Strongly Agree 40 51
Total 78 100.0
4.5.2 Effect of Market Turbulence on Business Performance
On the question on whether market turbulence affects business performance, (62%)
strongly agreed that this was actually the case at their organization, (37%) agreed, while
(1%) remained neutral as highlighted in Table 4.17
Table 4.17: Effect of Market Turbulence on Business Performance
Scale Frequency Percent
Neutral 1 1.3
Agree 29 37.2
Strongly Agree 48 61.5
Total 78 100.0

38
4.5.3 Market Competition
When asked whether respondents organizations have been experiencing competition
intensity as a result of market turbulence, (50%) strongly agreed, (49%) agreed on this to
be the case, while the remaining (1%) were neutral as summarized in Table 4.18
Table 4.18: Market Competition
Scale Frequency Percent
Disagree 1 1.3
Agree 38 48.7
Strongly Agree 39 50.0
Total 78 100.0
4.5.4 Effect of Market Competition
On the question on whether market competition affects business performance, (50%)
strongly agreed, while (50%) agreed that intensified market competition had affected
business performance as highlighted in Figure 4.9
Figure 4.9:Effects of Market Competition on Business Performance
4.5.5 Steady Dependable Buyers
On the question on whether respondents’ organizations had stable, dependable buyers, the
majority (56%) strongly agreed, (40%) agreed, (3%) disagreed, while (1%) were neutral as
indicated in Table 4.19
50%50%Agree
Strongly Agree

39
Table 4.19: Steady Dependable Buyers
Scale Frequency Percent
Disagree 2 2.6
Neutral 1 1.3
Agree 31 39.7
Strongly Agree 44 56.4
Total 78 100.0
4.5.6 Bargaining Power of Buyers
When asked whether the bargaining power of buyers had affected business performance,
(53%) strongly agreed, (45%) agreed, while (2%) remained neutral as indicated in Table
4.20
Table 4.20: Bargaining Power of Buyers
Scale Frequency Percent
Neutral 2 2.5
Agree 35 44.9
Strongly Agree 41 52.6
Total 78 100.0
4.5.7 Dependable Suppliers
Respondents were asked whether their organization had dependable suppliers, (56%)
strongly agreed, and the remaining (44%) agreed as indicated in Figure 4.10
Figure 4.10: Dependable Suppliers
44%
56%
Agree
Strongly Agree

40
4.5.8 Bargaining Power of Suppliers Effect on Business Performance
When respondents were asked whether the bargaining power of suppliers had affected
business performance, (55%) strongly agreed, (39%) agreed, (5%) were neutral, while the
remaining (1%) disagreed as indicated in Table 4.21
Table 4.21: Bargaining Power of Suppliers Effect on Business Performance
Scale Frequency Percent
Disagree 1 1.3
Neutral 4 5.1
Agree 30 38.5
Strongly Agree 43 55.1
Total 78 100.0
4.5.9 Increase in Substitute Products
To examine whether market turbulence had led to an increase in substitute products,
respondents were asked for their organization experience on the same. The findings show
that (51%) strongly agreed, (46%) agreed, while (3%) were neutral that market turbulence
had led to an increase in substitute products as summarized in Table 4.22
Table 4.22: Increase in Substitute Products
Scale Frequency Percent
Neutral 2 2.6
Agree 36 46.2
Strongly Agree 40 51.3
Total 78 100.0
4.5.10 Threat of Substitute Products
When respondents were asked whether increase in substitute products a threat to their
organization's products (51%) strongly agreed, (41%) agreed, (6.4%) were neutral, while
(1%) disagreed as highlighted in Table 4.23

41
Table 4.23: Threat of Substitute Products
Scale Frequency Percent
Disagree 1 1.3
Neutral 5 6.4
Agree 32 41.0
Strongly Agree 40 51.3
Total 78 100.0
4.5.11 Market Intelligence and Market Turbulence
On the question n whether market intelligence was being used by respondents’ organization
to fend off market turbulence, (50%) strongly agreed on this to be the case, (49%) agreed,
while (1%) were neutral as summarized in Table 4.24
Table 4.24: market Intelligence and Market Turbulence
Scale Frequency Percent
Disagree 1 1.3
Agree 38 48.7
Strongly Agree 39 50.0
Total 78 100.0
4.6 Correlation Analysis
A correlation analysis was conducted to determine the existence of any relationships
between the study variables. The findings show that market turbulence had the most
substantial relationship with business performance, r (0.597); p-value < 0.01. This was
followed by a relationship between environmental turbulence and business performance, r
(0.561); p-value < 0.01; and finally, the relationship between technological turbulence and
business performance, r (0.533); p-value < 0.05. The relationships were statistically
significant as summarized in Table 4.25

42
Table 4.25: Correlation Analysis
Variables 1 2 3 4
Business
Performance
Pearson
Correlation 1
Sig. (2-tailed)
N 78
Technological
Turbulence
Pearson
Correlation .533* 1
Sig. (2-tailed) .040
N 78 78
Environmental
Turbulence
Pearson
Correlation .561** .576** 1
Sig. (2-tailed) .001 .000
N 78 78 78
Market
Turbulence
Pearson
Correlation .597** .482** .447** 1
Sig. (2-tailed) .000 .001 .000
N 78 78 78 78
*. Correlation is significant at the 0.05 level (2-tailed).
**. Correlation is significant at the 0.01 level (2-tailed).
4.7 Regression Analysis
Since this study variables revealed the existence of strong relationships, multiple regression
analysis was conducted to determine the level of relationship when the variables are
combined. The findings show an adjusted R squared value (0.457), meaning that about
(46%) of variability in business performance in confectionery industry can be attributed to
market turbulence, technological turbulence, and environmental turbulence as summarized
in Table 4.26
Table 4.26: Multiple Regression Model Summary
Model R R Square Adjusted R Square
Std. The error of the
Estimate
1 .535a .490 .457 .19685
a. Predictors: (Constant), Market Turbulence, Technological Turbulence, Environmental
Turbulence

43
The Analysis of Variance (ANOVA) show F (3, 74) = 5.770; p-value = 0.01; meaning the
variance in the mean of the mean of the variables was statistically significant
Table 4.27: ANOVA
Model
Sum of
Squares df
Mean
Square F Sig.
1 Regression .671 3 .224 5.770 .001b
Residual 2.868 74 .039
Total 3.538 77
a. Dependent Variable: Business Performance
b. Predictors: (Constant), Market Turbulence, Technological Turbulence, Environmental Turbulence
The study findings also revealed that market turbulence had the highest Beta Coefficient β
(0.433); p value = 0.12; followed by Technological turbulence Beta coefficient, β (0.397);
p value = 0.000; and environmental turbulence Beta coefficient β (0.326); p value = 0.003.
All the coefficients p values < 0.05, meaning they were statistically significant as
summarized in Table 4.28
Table 4.28: Coefficients
Model
Unstandardized
Coefficients
Standardized
Coefficients
t Sig. B Std. Error Beta
1 (Constant) 1.387 .796 2.743 .005
Technological
Turbulence .362 .087 .397 2.875 .000
Environmental
Turbulence .369 .120 .326 3.075 .003
Market Turbulence .465 .132 .433 21.250 .012
a. Dependent Variable: Business Performance
The regression model for the variable relationship is:
Business Performance = 1.387 + 0.397TT + 0.326 ET + 0.433 MT
Where; TT = Technological Turbulence; ET = Environmental Turbulence; and MT =
Market Turbulence

44
4.8 Chapter Summary
This chapter has provided the results and findings of this study. The significant findings of
the survey show that market turbulence had the strongest relationship with business
performance, r (0.597); p-value < 0.01. This was followed by a relationship between
environmental turbulence and business performance, r (0.561); p-value < 0.01; and finally,
the relationship between technological turbulence and business performance, r (0.533); p-
value < 0.01. The next chapter presents the study summary, discussion, conclusion, and
recommendations.

45
CHAPTER FIVE
5.0 DISCUSSION, CONCLUSION, AND RECOMMENDATIONS
5.1 Introduction
This chapter presents the study summary, discussion, concussion, and recommendations.
The study summary is presented first, followed by a discussion of findings for each research
question. Conclusion and recommendation are also presented for each research question are
also presented.
5.2 Summary of the Study
The purpose of this study was to determine the effect of turbulent environment on business
performance in the confectionery industry in Kenya. This study was guided by the following
research questions: What is the impact of technological turbulence on business
performance? What the impact of environmental turbulence on business performance? and
what is the impact of market turbulence on business performance?
This study adopted a descriptive survey design on a target population of 150 managers from
24 confectionery organizations in the Kenyan market. A structured questionnaire was used
to collect primary data.
The first research question sought to determine the impact of technological turbulence on
business performance. The findings show that there exists a statistically significant
relationship between technological turbulence and business performance in the
confectionery industry, r (0.533); p-value < 0.01.
The second research question sought to determine the impact of environmental turbulence
on business performance. The findings have revealed the existence of a statically significant
relationship between environmental turbulence and business performance in the
confectionery industry, r (0.561); p-value < 0.01.
The third research question sought to determine whether the impact of market turbulence
on business performance. The findings show that there exists a statistically significant
relationship between market turbulence and business performance in the confectionery
industry in Kenya, r (0.597); p-value < 0.01.

46
5.3 Discussion
5.3.1 Impact of Technological Innovation on Business Performance
One of the objectives of this study was to determine the impact of technological innovation
on business performance in the confectionery industry in Kenya. The study findings show
that there exists a statistically significant relationship between technological innovations
and business performance in the confectionery industry in Kenya. This finding is in line
with the findings of Christensen (2015) who argued that technological innovation does have
a significant impact on business operations and performance. Christensen further argued
that in as much as technological innovation positively impact business operation, it could
be very disruptive particularly, if new technology is being introduced to the business
operations. As such, innovation can bring technological disruption that can in the short-term
stall business performance, however, the long-term benefits far out way short-term
performance hitches
The findings of this study also established that technological turbulence could lead to
enhanced organizational knowledge and lead. When an organization explores new
technologies, there is a significant impact on the way in which internal operations are
organized, and by extension, the resultant performance. Raynor, McDonald, and
Christensen (2015) equally established that technological innovation impact organizational
knowledge and learning. In most instances, technological innovation enhances knowledge
that is essential for organizational competitive advantage. When an organization has a
significant competitive advantage in the market, it improves business performance. In most
instances, organizational learning is the process through which an organization renews its
competencies by recognizing the value the new information offers, apply it and assimilating
into the firm (Cohen & Levinthal, 1990). As such, leveraging technological innovations
turbulence to advance organizational learning and competitiveness is important for business
performance in confectionery sectors.
This study also found that knowledge exploitation enhances efficiency, production, choice,
selection, refinement, implementation and the execution, factors that are necessary for
organizational business performance in the confectionery industry. The ability for
organizations to exploit the external sources of knowledge as well as internal is an essential
element of innovation capabilities within the firm, to which technological innovation
turbulence plays a significant role. Cohen and Levinthal (1990) had argued that the capacity

47
to evaluate and use the external knowledge is largely a function of organizational operations,
which feed into the business performance of an organization. The main importance of
technological innovation is to enhance internal organization competencies, processes, and
explicit knowledge. Having versatile internal technological capability does not only drive
competitiveness but also contribute significantly to the quality of products, durability, the
versatility of production and also cost reduction in manufacturing and distribution of goods
and services. This is in line with the findings of Popadiuk (2016) who have argued that in
the modern times, adoption and utilization of technology in manufacturing are extremely
important as it enables organizations to reduce on the cost of production, enhance efficiency
and quality output which in essence contributes significantly to business performance.
Similarly, Thornhill (2017) had argued that technology technological turbulence is good for
organizations since it enhances research and development component which enables
organizations to develop more quality products and as a result, stay relevant in a constantly
changing business environment. In most instances, in the manufacturing sector, research
and development is an essential component that enables organizations to reduce operational
costs, since technology enhances efficiency and effectiveness of resource utilization, and
output enhancement. Additionally, use of technology improves organizations internal
competencies necessary for long-term business performance.
5.3.2 Impact of Environmental Turbulence on Business Performance
This study sought to establish the impact of environmental turbulence on the business
performance of the confectionery industry in Kenya. The findings of this study show that
there exists a significant relationship between environmental turbulence and business
performance. This is in line with arguments placed by Perrot (2011) who noted that the
environment in which an organization operates has a significant impact on the business
performance of the organization. Therefore, any substantial changes in the operational
environment affect the business performance of the organization. Further, Perrot had noted
that the environment in which organizations operates, particularly in the face of relentless
change, determines the ultimate performance of the organization. Changes in the
environmental conditions of an organization impacts both internal and external mechanics
of business operation and by extension performance. Therefore, reducing negative
environmental turbulence enhances business performance; conversely, enhancing positive
environmental turbulence improves business performance and strategic direction. The
findings by Shamsher (2016) had established that changes in customer demand,

48
competition, regulation, political influences and affects business performance. The
competitive environment for business expect to face turbulence impact of its environment
since the markets in this environment are considered as being increasingly complex with
the traditional industries converging the supply of goods and services in diversity.
This study findings have established that political turbulence is part of environmental
turbulence affecting business performance of the confectionery sector in Kenya. Shamsher
(2016) had argued that it is crucial for companies to establish a political connection with the
government supporting the business environment in which it operates. The connection with
the government tends to influence the strategic decisions within the firm as well as the
overall corporate governance of the business. The operational environmental of the business
consists of the market and the non-market dimensions, which is the political and legal
environment which play a key role in the growth of the business. Therefore, it is important
that companies have both the market and political strategies. Based on the findings of this
study, and the arguments placed by Shamsher (2016), it is possible to argue that
organizations should endeavor to not only uphold regulatory, operational requirements but
also establish significant political relationships with government regimes for negotiating
favorable taxes and licenses that do not impinge on business performance.
This study has also established that social-cultural factors also affect the business
performance of confectionery firms in Kenya. In most instances, as established by this
study, businesses do not operate in a vacuum, even the most successful companies must be
aware of the changes taking place in the societies and cultures in which business is operating
with an attempt to fulfill its missions and objectives of the firm. To this, Richards (2010)
had argued that as changes in the culture and the society take place, companies should
position their operations in a manner that adapts and adjusts to the changes in the
environment. Based on the findings of this study, it could be argued that the socio-cultural
factors such as beliefs, the values and the lifestyle of a society the business operates in are
essential to business performance and should not be ignored by confectionery firms. Further,
it should be noted that socio-cultural forces within an operational business environment
strongly influence the revenues of products and services through the enhancement of sales
of services and products of an industry as a whole while at the same time suppressing those
of the other sectors in the business environment.

49
5.3.3 Impact of Market Turbulence on Business Performance
This study sought to determine the impact of market turbulence on business performance.
The findings of this study show that there exists a significant relationship between market
turbulence and business performance of the confectionery industry in Kenya. Most
significant, this study established that competition intensity, market uncertainty, bargaining
power of buyers, and the bargaining power of sellers are important attributes that contribute
to market environment and turbulence that affects business performance.
This study found that competition intensity affects business performance of firms in the
confectionery industry in Kenya. It is the case that the market environment is mostly
determined by the kind of competition a firm is facing in a given market environment. The
stiffer the completion, the more the impact on firms ‘business performance. This is due to
the fact that as more organizations operation within a given market environment, there is
bound to be enhanced competition in terms of pricing, quality, quantity, and production or
manufacturing resources. This finding adds to the results by Dess et al., (2008) that
established that intense competition could position an organization to enhanced business
performance or failure. The less an organization invests in a competitive advantage, the
more it feels the negative impact of intense competition on business performance, compared
to organizations that do invest in mechanisms that enhance competitive advantage and vice
versa. Competitiveness enhances organizations position in a given market, and therefore,
enhancing competitiveness, enhances opportunities for business performance.
This study found that the bargaining power of buyers also affects business performance in
the confectionery industry in Kenya. This means that buyers of confectionery products have
a significant amount of power that can sway the operations and business performance.
Similar arguments posed by the findings of this study had been posited by Saeed and Aimin
(2015) who noted that buyers of the company’s products and services tend to pose a threat
to the organization and the industry as a whole. This is to the extend that buyers can cause
turbulence to the organization by choosing to abandon a given product line, boycotting the
product altogether, or switching to a substitute product. As such, it could be argued that the
power buyers hold on the attributes of the situation prevailing in the marketplace based on
the significance of the product to the buying group. For instance, a group of buyers could
become powerful when they purchase large volumes of confectionery products, and as such,
any boycotts, failure to purchase the products for any given market reasons could

50
significantly impact the company’s ability to sell the products, and thus, affect the firm’s
business performance. One of the reasons as to why buyers might have such sway on a
product's performance is when such a product is undifferentiated, and buyers have low
switching costs (Saeed & Aimin, 2015)
The findings of this study also established that the bargaining power of suppliers could do
have an effect on the business performance of the confectionery industry in Kenya. This
finding confirms Pearce and Robinson (2011) who noted that suppliers could have the
bargaining power in the industry when they control the supply chain of a given product line.
This means that they can have the ability to influence pricing and distribution of the product.
In the confectionery industry, this means that if a supplier decides to hoard or increase
distribution pricing of the confectionery products, this would ultimately result in the unit
price of the confectionery products in the marketplace. If other substitute products on the
market are priced cheaply, then an organization can incur losses or poor sales due to the
actions of their suppliers, which can, in turn, affect the firm’s business performance.
Additionally, suppliers have high bargaining power when the group of suppliers is
dominated with a few competitors, and the suppliers do not have any threat of a substitute
product, the industry is not significant client of the supplier group, the product of the
suppliers is a crucial input to the buyers, high switching costs for the buyers and when the
supplier group pose a credible threat of forwarding integration. To mitigate such incidences,
it is important that confectioneries develop multiple distribution channels, and set both the
distribution and unit sells price at the retail level.
5.4 Conclusion
5.4.1 Impact of Technological Turbulence on Business Performance
This study sought to establish the impact of technological turbulence on business
performance. This study has established that there exists a significant relationship between
technological turbulence and business performance. Therefore, this study concludes that the
technological turbulence is important in that it can enhance organizational business
performance through additional technological know-how, enhanced competencies, new
knowledge exploration, and organizational learning that enables confectionery firms to
enhance business performance. However, this study also concludes that disruptive
technology can bring about negative turbulence that negatively affects business
performance.

51
5.4.2 Impact of Environmental Turbulence on Business Performance
This study sought to determine the impact of environmental turbulence on the business
performance of the confectionery industry in Kenya. The study has established the existence
of a significant relationship between environmental turbulence and business performance.
Therefore, this study concludes that environmental turbulence, particularly business
operational environment, relationships with political regimes on taxation, and social-
cultural beliefs should be nurtured and monitored closely to ensure they adopted to enhance
business performance of confectioneries. Negotiating for favorable tax incentives, in
addition, to secure politically stable operational environment is equally important to the
business performance of confectionery businesses in Kenya
5.4.3 Impact of Market Turbulence on Business Performance
This study sought to establish the impact of market turbulence on the business performance
of the confectionery industry in Kenya. The findings have established that there exists a
significant relationship between market turbulence and business performance. Therefore,
this study concludes that competition intensity, bargaining power of buyers; bargaining
power of sellers, and rivalry within the market affects business performance of the
confectionery industry in Kenya. The stiffer the competition, the severe the effect on
business performance. Buyers with the ability to buy significant volumes of confectioneries
and have substitute products do have significant sway in influencing the business
performance of the confectionery industry.
5.5 Recommendations
5.5.1 Recommendations for Improvement
5.5.1.1 Impact of Technological Turbulence on Business Performance
Since the findings of this study has established the existence of a significant relationship
between technological turbulence and business performance; this study recommends that
confectionery firms should invest more in emerging technologies as a mechanism of
leveraging on technologies to enhance performance, while at the same time, ensuring timely
adoption minimizes negative effects of technological turbulence.

52
5.5.1.2 Impact of Environmental Turbulence on Business Performance
This study has established the existence of a significant relationship between environmental
turbulence and business performance. This study recommends that confectionery firms
should monitor not only their operational environment, but also political relations, and
social-cultural aspects within their operational spheres. This will entail negotiating for
favorable tax incentives, and favorable regulatory and legislative laws concerning
confectionary manufacturing, distribution, and sale.
5.5.1.3 Impact of Market Turbulence on Business Performance
This study has established the existence of a significant relationship between market
turbulence and business performance. This study recommends that confectionery firms
should enhance their competitive advantages through efficient and effective operations,
quality products, highly trained and competent human resources, in addition to adopting the
latest manufacturing equipment in the sector. This will help reduce operational costs and
enhance performance. Quality and efficient products will enhance customer loyalty, a
necessary condition for enhancing business performance in the confectionery sector.
5.5.2 Recommendation for Future Research
This study focused on the impact of turbulent environment on business performance in the
confectionery industry in Kenya. The study variables were limited to technological
turbulence, environmental turbulence, and market turbulence. Future studies should look at
other factors such as economic turbulence and political turbulence and their effect on
business performance.

53
REFERENCES
Allied Market Research (2015). Status of the confectionery industry:
Https: alliedmarketresearch/confectionery-market
Ali, A., & Matsuno, K. (2018). Mediating roles of capabilities between R&D-marketing
integration and business performance. Journal of Asia business studies.
Armstrong, G., & Kotler , P. (2000). Marketing: An Introduction. Prentice Hall.
Barth, J. R., Caprio, G., & Levine, R. (2002). Bank Regulation and Supervision: What
Works Best? The national bureau of economic research.
Bower, J. L., & Christensen, C. (1995). Disruptive Technologies: Catching the Wave.
Harvard Business Review .
Buganza, T., Dell’Era, C. & Verganti, R. (2014). Exploring the relationship between
product development and environmental turbulence: The case of mobile TLC
services, The Journal of Product Innovation Management, 26(3): 308-321
Bughin, J. (2017). The right response to digital disruption. McKinsey.
Cadogan, J. W., Siguaw, J., & Diamantopoulos, A. (2002). Export Market-Oriented
Activities: Their Antecedents and Performance Consequences. ResearchGate.
Carbonell, P., & Escudero, a. (2012). The adverse effect of the team’s prior experience and
technological turbulence in new service development projects with customer
involvement. European Journal of Marketing,
Chen, C. J., & Lin, B.W. (2004). The effects of environment, knowledge attribute,
organizational climate, and firm characteristics sourcing decisions, Research and
Development Management, 6(2):137-146
Christensen, C. M. (1993). The Rigid Disk Drive Industry: A History of Commercial and
Technological Turbulence. The business history review, 67(4), 531-588.
Christensen, C. M., Raynor, M., & McDonald, R. (2015). What Is Disruptive Innovation?
Harvard Business Review .
Chuthamas, C., (2011). Factors Affecting Business Success of Small and Medium

54
Enterprises (SMEs) in Thailand, Asian Social Sciences, 7(5): 78-87
Cohen, W. M., & Levinthal, D. (1990). Absorptive Capacity: A New Perspective on
Learning and Innovation. Jstor , 35(1), 128-152.
Cooke, J.L. (2013). Agile Principles Unleashed: Proven Approaches for Achieving Real
Productivity in Any Organization. Ely, U.K: IT Governance Publication Dess, G.
G., Lumpkin , T., & Eisner , A. (2008). Strategic Management: Creating
Competitive Advantages. McGraw-Hill/Irwin.
Farsijani, H., Feizi, K., & Shafiei, M., (2014). The impact of competitive forces on the
application of knowledge to improve supply chain performance, 3rd Ed. Tehran:
Daftare Pajohesh haye Farhango Publications 104.586
Grimsley, S. (2009). How The Social Environment Affects Business: Examples & Impact.
Study .
Howard, C. (2013). Disruption Vs. Innovation: What's The Difference? Forbes .
Hutt, R. (2016). What is a disruptive innovation? World economic forum .
Iyer, K. N. (2014). The operational impact of collaboration and resource specificity: the
moderating role of technology context. Journal of Business & Industrial Marketing.
Jaiswal, P. (2010). Caught in the India-China Rivalry: Policy Options for Nepal. IPCS.
Jaworski, B. J., & Kohli, A. (1993). Market Orientation: Antecedents and Consequences.
Jstor, 57, 53-70.
Jeroen, B. (2016). The Effects of Market Turbulence on Sourcing Balance and Innovation
Performance. essayutwente.
Kale, S. (2003). Business Failures in the Construction Industry. Engineering Construction
and Architectural Management, 7(2), 120-132.
Keegan, R., Harwood , M., & Lavallee, C. (2010). The motivational atmosphere in youth
sport: Coach, parent and peer influences on motivation in specializing sports
participants. Journal of Applied Sports Psychology, 87-105.

55
Kirca, A. H., Bearden, W., & Jayachandran, S. (2005). Market Orientation: Journal of
marketing , 64, 24-41.
Kogut, B., & Zander, U. (1992). Knowledge of the Firm, Combinative Capabilities, and the
Replication of Technology. ResearchGate.
Lichtenthaler, U. (200). Absorptive Capacity, Environmental Turbulence, and The
Complementarity of Organizational Learning Process. Academy of Management
Journal, 3(4): 822-846
Lillington, K. (2014). The Digital Economy’ author Don Tapscott looks back two decades
to look forward. The Irish Times .
Liu, W. (2006). Knowledge Exploitation, Knowledge. Knowledge and Process
Management, 13(3), 144–161.
Lusch, R., & Vargo, S. (2015). The Service-The logic is dominant of Marketing. New York
: Routledge.
Lusia, K. (2016). The effects of technological turbulence on the. Emerald Insight .
Mahajan, N. (2015). Don Tapscott on Digital Disruption . Digital economt .
Mamat, M & Ismail, A. (2011), Market orientation and business performance. The study
of Bumiputera furniture industry in Kelantan. American International Journal of
Contemporary Research, 1(2): 88-98
March, J. G. (1991). Exploration and Exploitation in Organizational Learning. informs.org,
71-87.
Marcus, A. (2016). Design, User Experience,and Usability. Berkley California : Springer.
Martin, C. (2014). Competitive Rivalry | Porter’s Five Forces Model. Cleverism .
Mason, G., & Clubb, R. (2007). Why and how should we use environmental enrichment to
tackle stereotypic? Science Direct.
Mcmillan, & Conner. (2010). Using the theory of planned behavior to understand alcohol
and tobacco use in students. Taylor Francis Online .

56
Milliken, F. J. (1987). Three Types of Perceived Uncertainty about the Environment: State,
Effect, and Response Uncertainty. Jstor , 133-143.
Naceur, S., & Kandil, M. (2009). The impact of capital requirements on banks' cost of
intermediation and performance: the case of Egypt. Journal of Economics and
Business.
Njihia, C. (2017). Innovation and use of technology as a strategic tool in small and medium
enterprises operating in a turbulent environment, Unpublished Thesis, University of
Nairobi
Oginni B.O., (2010). Business Organic Management, 2nd Ed. Somolu, Lagos: Shecom
Press Ltd
Omri, W. (2015). Innovative behavior and venture performance of SME’s, European
Journal of Innovation Management, 18(2): 195-217
O'Regan, N., & Sims, M. (2007). Leaders, loungers, laggards: The strategic‐ planning‐
environment‐ performance relationship re‐ visited in manufacturing SMEs.
Emerald Insight, 19(1), 6-21.
Payne, J., & Leitter , J. (2013). Structuring agency: Examining healthcare management in
the USA and Australia using organizational theory. Journal of Health Organization
and Management.
Pearce, J. A., & Robinson, R. B. (2005). Strategic management: formulation,
implementation, and control. New York: McGraw-Hill.
Perrott, B. E. (2011). Strategic issue management as a change catalyst. Emerald Insight .
Popadiuk, S. (2016). Exploration, Exploitation, and Organizational Coordination
Mechanisms. scielo.
Porter, M. E. (2008). On Competition. Harvard Business Press.
Pratono, A. H. (2016). Strategic orientation and information technological turbulence:
Contingency perspective in SMEs. Business Process Management Journal, 22(2),
368-382.
Pratono, A. H. (2016). Strategic orientation and information technological turbulence:
Contingency perspective in SMEs. Business Process Management Journal,
57
Ranchhod, A. (2004). The changing nature of cyber-marketing strategies. Business Process
Management Journal, 10(3), 262-276.
Richards, L. (2010). The Effects of Socio-Culture on Business. Chron .
Rob, A. (2013). What is meant by turbulence and why does it happen, and examples of
supply chains, that exhibit this phenomenon. Available at:
http://robabdul.com/what-is-meant-by-market-turbulance.asp accessed on 11
February 2018
Root, G. N. (2007). The Advantages of R&D; in Business. Chron .
Rylander, A., & Peppard, J. (2003). From implementing a strategy to embodying strategy:
Linking strategy, identity, and intellectual capital. Emerald Insight , 4(3), 316-331.
Saeed, A. A., & Aimin, W. (2015). Market Orientation and Innovation: A Review of
Literature. International Journal of Innovation and Economic Development, 1, 17-
26.
Shamsher, R. (2016). political environment and its effects on business performance . ELK
Asia Pacific Journals, 2(2), 48
Simkin, L. (2008). Achieving market segmentation from B2B sectorisation. Emerald
Insight, 9(2), 62-80
Sood, A., & Tellis, G. (2010). Demystifying Disruption: A New Model for Understanding
and Predicting Disruptive Technologies. MSI, 10-102.
State, T. (2013). Difference between market turbulence technology. course hero .
Sulaimani, A., & Munira, A. (2012). The Role of Information Technology in Achieving
Competitive Advantage, Unpublished Thesis for Master’s Degree, Universite
Mohamed Khider Biskra, Algeria
Thornhill, J. (2017). More innovation needed by top tech companies. Financial Times .
Verspreet, L. (2013). Strategic Reactions to Disruptive Technology in the music industry .
Academiejaar.

58
APPENDIX I: COVER LETTER
30th March 2018
Audrey Achieng
P.O.BOX 424, 00200
Nairobi
Dear Sir/Madam,
RE: REQUEST FOR PARTICIPATION IN MY STUDY
I am a student at the United States International University (USIU-AFRICA) currently
pursuing a Master’s in Business Administration (MBA). In partial fulfillment of my
master’s program, I am currently working on my master’s thesis entitled, “Impact of
Turbulent Environment on Business Performance in The Confectionary Industry in
Kenya.”
The study will be beneficial to the entire confectionery industry in that it will provide
information on how turbulent environment has affected business performance, and as such,
use this information to improve the organizational performance. Every employee will take
part in this study, and thus how you have been selected to take part in the study. Your views
and opinions are confidential, and your name will not be used anywhere in the research or
findings. Kindly take few minutes to answer the questionnaire to the based on your
knowledge.
Yours Sincerely,
Audrey Achieng

30
APPENDIX II: QUESTIONNAIRE
SECTION I: GENERAL INFORMATION
This section contains general questions. Kindly answer to the best of your knowledge
1. Kindly indicate your gender
Male Female
2. Kindly indicate your age range
18- 25 Years
26- 33 Years
34- 40 Years
41-47 Years
48 and Above
3. Kindly indicate the number of years you have worked at your organization
0-1 Years
2-4 Years
5-7 Years
8-10Years
Above 10 years
4. Kindly indicate your job designation
Plant Engineer
Manufacturing & Packaging Employee
Manager
Human Resource Officer
Finance Officer

31
SECTION II: Impact of Technological Turbulence on Business Performance
Kindly answer the following questions to the best of your knowledge using the following
Likert scale. Strongly disagree = 1, disagree = 2, neutral = 3, Agree = 4, strongly agree = 5
No Questions 1 2 3 4 5
5. Do you think your organization has been undergoing
technological innovation?
6. Technological innovation has enhanced product and service
lines
7. Technological innovation has enhanced business
performance
8. Technological innovation has increased change uncertainty
in your organization
9. Innovation has influenced organizational restructuring
10. Technological turbulence has enhanced new knowledge
exploration
11. Knowledge exploration has enhanced business
performance
12. Technological innovation turbulence has enhanced
organizational learning
13. Technological turbulence has enhanced knowledge
exploitation
14. Knowledge exploitation has enhanced business
performance
SECTION III: Impact of Environmental Turbulence on Business Performance
Kindly answer the following questions using the Likert scale provided in section II
No Questions 1 2 3 4 5
15. Your organization has been experiencing environmental
turbulence
16. Environmental turbulence has increased competition

32
17. Environmental turbulence has increased change processes
at your organization
18. Changes processes have affected your organizations
business performance
19. Environmental turbulence has been affected by political
uncertainty
20. Environmental turbulence has involved a high tax burden
on manufacturing
21. Customer buying behavior has affected business
performance
22. Perception towards your organization's products has
affected business performance
23. Environmental turbulence has affected business
performance
24. Reducing environmental turbulence will improve your
organization business performance
SECTION IV: Impact of Market Turbulence on Business Performance
Kindly answer the following questions to the best of your knowledge using the Likert scale
in Section II.
No Questions 1 2 3 4 5
25. Your organization has been experiencing Market
turbulence
26. Market turbulence has affected business performance
27. Your organization has also been experiencing competition
intensity from other players in the market
28. Competition intensity has affected business performance
29. Your organization has steady, dependable buyers
30. The bargaining power of buyers of your organization's
products has affected business performance
31. Your organization has steady, dependable suppliers

33
32. The bargaining power of suppliers of your organization
affects business performance
33. There has been an increase of substitute products to your
organization
34. The threats of substitute products affect your organization
35. Your organization relies on market intelligence to fend off
market turbulence
Thanks very much for your participation!

34