impact of workforce diversity on employee … himani sheth_707932.pdf · was conducted inorder to...
TRANSCRIPT

IMPACT OF WORKFORCE DIVERSITY ON
EMPLOYEE PERFORMANCE WITH SPECIAL
REFERENCE TO IT, FMCG & TELECOM INDUSTRY
IN GUJARAT
A thesis submitted to Gujarat Technological University
For the Award of
Doctor of Philosophy
In
Management
By
Himani Sheth
[129990992038]
Under supervision of
Dr Siddharth Das
GUJARAT TECHNOLOGICAL UNIVERSITY
AHMEDABAD
FEBRUARY - 2018

© [HIMANI SHETH]

i
DECLARATION
I declare that the thesis entitled “Impact of Workforce Diversity on Employee
Performance with special reference to IT , FMCG & Telecom industry in Gujarat”
submitted by me for the degree of Doctor of Philosophy is the record of research work carried
out by me during the period from November, 2012 to December,2016 under the supervision
of Dr. Siddharth Das and this has not formed the basis for the award of any degree, diploma,
associateship, fellowship, titles in this or any other University or other institution of higher
learning.
I further declare that the material obtained from other sources has been duly acknowledged
in the thesis. I shall be solely responsible for any plagiarism or other irregularities, if noticed
in the thesis.
Signature of the Research Scholar : …………………………… Date:….………………
Name of Research Scholar: Himani Sheth
Place: Ahmedabad

ii
CERTIFICATE
I certify that the work incorporated in the thesis “Impact of Workforce Diversity on
Employee Performance with special reference to IT , FMCG & Telecom industry in
Gujarat” submitted by Ms. Himani Sheth was carried out by the candidate under my
supervision/guidance. To the best of my knowledge: (i) the candidate has not submitted the
same research work to any other institution for any degree/diploma, Associateship, Fellowship
or other similar titles (ii) the thesis submitted is a record of original research work done by the
Research Scholar during the period of study under my supervision, and (iii) the thesis
represents independent research work on the part of the Research Scholar.
Signature of Supervisor: ……………………………… Date: ………………
Name of Supervisor: Dr. Siddharth Das
Place: Ahmedabad

iii
Originality Report Certificate
It is certified that PhD Thesis titled “ Impact of workforce diversity on employee
performance with special reference to IT , FMCG & Telecom industry in Gujarat” by
Himani Sheth has been examined by us. We undertake the following:
a. Thesis has significant new work / knowledge as compared already published or are under
consideration to be published elsewhere. No sentence, equation, diagram, table, paragraph or
section has been copied verbatim from previous work unless it is placed under quotation
marks and duly referenced.
b. The work presented is original and own work of the author (i.e. there is no plagiarism). No
ideas, processes, results or words of others have been presented as Author own work.
c. There is no fabrication of data or results which have been compiled / analysed.
d. There is no falsification by manipulating research materials, equipment or processes, or
changing or omitting data or results such that the research is not accurately represented in the
research record.
e. The thesis has been checked using <Turnitin> (copy of originality report attached) and
found within limits as per GTU Plagiarism Policy and instructions issued from time to time
(i.e. permitted similarity index <=25%).
Signature of the Research Scholar : …………………………… Date: ….……… Name of Research Scholar: Himani Sheth Place: Ahmedabad
Signature of Supervisor: ……………………………… Date: ……………… Name of Supervisor: Dr. Siddharth Das Place: Ahmedabad

iv

v
PhD THESIS Non-Exclusive License to GUJARAT TECHNOLOGICAL UNIVERSITY
In consideration of being a PhD Research Scholar at GTU and in the interests of the
facilitation of research at GTU and elsewhere, I, Himani Sheth having 129990992038 hereby
grant a non-exclusive, royalty free and perpetual license to GTU on the following terms:
a) GTU is permitted to archive, reproduce and distribute my thesis, in whole or in part, and/or
my abstract, in whole or in part ( referred to collectively as the “Work”) anywhere in the
world, for non-commercial purposes, in all forms of media;
b) GTU is permitted to authorize, sub-lease, sub-contract or procure any of the acts mentioned
in paragraph (a);
c) GTU is authorized to submit the Work at any National / International Library, under the
authority of their “Thesis Non-Exclusive License”;
d) The Universal Copyright Notice (©) shall appear on all copies made under theauthority of
this license;
e) I undertake to submit my thesis, through my University, to any Library and Archives. Any
abstract submitted with the thesis will be considered to form part of the thesis.
f) I represent that my thesis is my original work, does not infringe any rights of others,
including privacy rights, and that I have the right to make the grant conferred by this non-
exclusive license.
g) If third party copyrighted material was included in my thesis for which, under the terms of
the Copyright Act, written permission from the copyright owners is required, I have obtained
such permission from the copyright owners to do the acts mentioned in paragraph (a) above
for the full term of copyright protection.
h) I retain copyright ownership and moral rights in my thesis, and may deal with the copyright
in my thesis, in any way consistent with rights granted by me to my University in this non-
exclusive license.

vi
i) I further promise to inform any person to whom I may hereafter assign or license my
copyright in my thesis of the rights granted by me to my University in this nonexclusive
license.
j) I am aware of and agree to accept the conditions and regulations of PhD including all policy
matters related to authorship and plagiarism.
Signature of the Research Scholar:
Name of Research Scholar: Himani Sheth
Date: ………………… Place: Ahmedabad
Signature of Supervisor:
Name of Supervisor: Dr. Siddharth Das
Date: ……………….. Place:Ahmedabad
Seal:

vii
Thesis Approval Form
The viva-voce of the PhD Thesis submitted by Shri / Smt. / Kum……………………..
.………………………………………………………… (En. No. …………………..…)
entitled ……………………………………………………………………………………..
…………………………………………………………………………………………….…
………………………………………………………………………………………………
was conducted on …………………….………… (day and date) at Gujarat Technological
University. (Please tick any one of the following option)
We recommend that he/she be awarded the Ph.D. Degree.
We recommend that the viva-voce be re-conducted after incorporating the
following suggestions:
The performance of the candidate was unsatisfactory. We recommend that he/she
should not be awarded the Ph.D. Degree.
………………………..………… ……………… ………………………………………….. Name and Signature of Supervisor with Seal 1) External Examiner 1 Name and Signature ………………………..………… ……………… ………………………………………….. 2 ) External Examiner 2 Name and Signature 3) External Examiner 3 Name and Signature
( briefly specify the modification suggested by the panel )
( The panel must give justification for rejecting the research work )

viii
ABSTRACT
With an easy access to technology and an easier availability of most of the resources, the only
thing that can distinguish one organisation from another is its manpower. Organizations with
Human capital advantage can always succeed in achieving their objectives as they consider
employees as their ultimate strength and believe that investment on employees is definitely
going to give high returns and help them achieve their objective. Organizations constantly
strive to find out various ways and means of increasing employee productivity and
performance and one such technique which is being practiced now a days is recruiting and
managing a diverse workforce.Workforce diversity refers to employees with different Age ,
Gender , Education, Work Experience, Organizational Tenure, Region, Ethnicity , Caste ,
Colour , Race , Religion , Culture , disability , personality traits ,Work Experience, and
similar related things. Acknowledging, understanding, accepting, valuing, and celebrating
these differences refer to managing workforce diversity. After investing on and managing
workforce diversity there has always been a debate whether there has been a significant
impact of workforce diversity on employee performance .When employees with diverse
background work together does it really impact their performance or that there is no
significant impact of the same.To find out the same a research has been carried out to study
the impact of workforce diversity on employee performance. The study has been conducted on
a sample of 600 employees in Ahmedabad, Baroda, Surat & Rajkot in IT, Telecom & FMCG
industry in the state of Gujarat. Exploratory as well as Descriptive research has been used for
the study. Industry practitioners and academicians were contacted under exploratory research
and employee survey was carried out under descriptive research. Data Analysis has been done
using SPSS and AMOS. Exploratory Factor Analysis, Confirmatory Factor Analysis,
Structural Equation Modeling and Frequency distribution has been used to achieve the
objectives of the study.
The factors identified under workforce diversity were Age Diversity, Gender Diversity,
Organizational Tenure diversity, Educational Background diversity, Work Experience
diversity, Religion diversity & Regional diversity. The impact of these diversity factors had to
be measured on employee performance and so one more factor identified was Employee

ix
Performance. Also Employees’ perception towards the impact of workforce diversity on their
performance had to be measured and so Employee Perception was also identified as one of the
factors. The factors and their respective variables were identified by literature review and
expert opinion. Inorder to measure the statistical relationship between the factors and the
variables, Exploratory Factor Analysis was used. After confirming the relationship between
the factors and the variables through EFA, diversity issues under each factor were studied.
Frequency distribution (mean calculation) was used to study the same. Efforts were made to
investigate the impact of workforce diversity on employee performance. Confirmatory Factor
Analysis and Structural Equation Modeling was used to investigate the same .Further
perception of employees towards the impact of workforce diversity on their performance was
studied. EFA, CFA and SEM was used for the same & Lastly an Inter Industry Comparison
was conducted inorder to study the impact of each diversity factor on employee performance
in that particular industry.The same was also studied by using CFA & SEM.
The findings of the study reveal that Age diversity, Organizational Tenure diversity,
Educational background diversity, Work experience diversity has an impact on employee
performance where as Gender diversity, Religion diversity and Regional Diversity does not
have an impact on employee performance. There are no major issues that arise when different
aged employees work together. There is some sort of inequality between male and female
employees and this is often reflected at the time of performance appraisal as well as
promotions. There is often a glass ceiling when the question of career advancement arises for
females. Seniority is given importance as compared to newly joined employees. Most of the
decisions are taken by keeping only senior employees in loop .Often there are conflicts
between seniors and juniors. In most of the companies merit is the only criteria for promotion.
In case of equally experienced employees seniority (number of years spent in the organization)
is given more weightage in most of the organizations. Employees from different regions and
belonging to different religion have not been facing serious diversity issues because of their
region and religion.The employees perceive that working with a diverse work group helps
them increase their performance. Industry specific study reveals that in Telecom industry,
Educational diversity and Work experience diversity has an impact on employee performance
where as Age diversity, Gender diversity, Organizational tenure diversity, Religion diversity

x
and Regional diversity does not have an impact on employee performance. In IT industry ,Age
diversity, Organizational tenure diversity, Educational diversity and Work experience
diversity has an impact on employee performance where as Gender diversity, Religion and
Regional diversity does not have an impact on employee performance. In FMCG industry,
Age diversity, organizational tenure diversity, educational diversity and work experience
diversity has an impact on employee performance where as Gender diversity, Religion and
Regional diversity does not have an impact on employee performance.

xi
ACKNOWLEDGMENT
I would like to express my sincere gratitude to all those individuals who have supported me
throughout my journey of the doctoral research.
Firstly I would like to thank my supervisor Dr Siddharth Das for his constant support and
valuable guidance throughout the study. I appreciate his contribution to my research in form of
time and valuable research inputs that has helped me shape my ideas in a constructive way.
The completion of the doctoral work could not have been possible without the constant
support and constructive inputs from DPC ( Doctoral Progress Committee ) members,
Dr Neha Shah and Dr Priyanka Pathak. I am immensely grateful for their feedback and
guidance throughout my research.
I acknowledge honourable Vice Chancellor Dr Navin Sheth and all the staff members of the
Gujarat Technological University especially the PhD section for their constant support.
A heartfelt thanks to Dr P K Mehta -Director L J MBA and Dr Siddarth Singh Bist- Dean
L J MBA for their constant motivation & encouragement and being instrumental in
engendering in me the quest for research.
I would like to convey special thanks to two most important people in this entire journey –
Ms Rinal Shah and Dr Dhara Shah who have played a very important role in helping me
accomplish my research goal. Not only have they made me realize the true essence of
friendship but also have always been there for me at each and every ups and downs of this
entire journey .Their valuable research inputs and guidance have been of tremendous help for
me during this entire journey. Thank You Rinal and Dhara for being available 365 days, 24 /7.
Most importantly ,I would like thank the backbone of my life – My husband, Mr Siddharth
Sheth for standing by me throughout the journey of doctoral work, for always making me
believe in my talent and potential and helping me to live & realize my dream of getting a
PhD. I am thankful to him for the Love ,Care ,Encouragement, Motivation and most
importantly “Patience” he has shown throughout this journey. I extend my thanks to him for

xii
being with me in all those uncountable & difficult moments of the doctoral journey and not
letting me lose my confidence in any circumstances and always helping me to focus on my
research goal.
I would also like to thank my in-laws for the understanding, love and care that they have
shown during this entire journey.
No words to express my gratitude for my parents Mr Kirtikumar Kapadia and
Mrs Jyotsana Kapadia for playing the most important role in making me “what I am today”
Thank you Mummy and Pappa for being a driving force behind the successful completion of
this doctoral work. The Values and Morals you both have passed on to me has helped me
complete the work with utmost sincerity and dedication. Thank you for providing me quality
education and creating a strong platform for me from where I can grow and reach newer &
greater heights. Thank You for being always there for me whenever I needed both of you.
I would like to express my gratitude and love for my biggest well wisher and lucky charm –
my sister Ms Nirali Shah. Thank you sister for always passing on good luck and positivity to
me in any phase of life and boosting my self confidence in this entire journey. Thank you for
being confident about me more than myself. Your Love, Care and Good Luck have helped me
shape my research in a constructive manner.
A special thanks to my brother in law Mr Shalin Shah for his constant motivation and
encouragement.
The best ones are always to be thanked last and so lastly I would like to thank my Niece
Aanya Shah. Her beautiful smile has always kept me going throughout this endeavor. It is her
love and affection towards me that has helped me overcome any obstacle that I have faced in
this entire journey.
Lastly, I would like to thank the entire Faculty Fraternity & Admin Staff of my workplace -
L J Institute Of Management Studies for showering their best wishes throughout this journey
of doctoral work.

xiii
TABLE OF CONTENTS
Sr . No Sections Sub
sections
Content Page
No
Title Page
Declaration
Certificate
Originality Report Certificate
Non Exclusive Licence certificate
Thesis Approval Form
Abstract
Acknowledgement
Chapter 1 Introduction 1
1.1 Research Background 1
1.2 Research Problem 2
1.3 Purpose of the Study 2
1.4 Significance of the study 3
1.5 Research Objectives 3
1.5.1 Primary Objectives 3
1.5.2 Secondary Objectives 3
1.6 Scope of the Study 4

xiv
Sr . No Sections Sub
sections
Content Page
No
1.7 Survey Break Up 4
1.8 Original Contribution by the thesis 6
1.9 Structure of the thesis 7
Chapter 2 Literature review 9
2.1 Introduction 9
2.2 IT industry in India 9
2.3 IT industry in Gujarat 11
2.4 Telecom industry in India 11
2.5 Telecom industry in Gujarat 13
2.6 FMCG industry in India 14
2.7 FMCG industry in Gujarat 15
2.8 Workforce diversity 16
2.9 Employee Performance 18
2.10 Impact Of Workforce Diversity on Employee
performance
19
2.11 Impact of various diversity factors on
organizational as well as employee
performance
23
Chapter 3 Research Gap 27

xv
Sr . No Sections Sub
sections
Content Page
No
3.1 Introduction 27
3.2 Research Gap 27
Chapter 4 Research Methodology 29
4.1 Introduction 29
4.2 Research Design 30
4.2.1 Exploratory Research 31
4.2.2 Descriptive research 32
4.3 Sample Design 32
4.3.1 Sample Unit 32
4.3.2 Sampling Technique 32
4.3.3 Sample Size 33
4.4 Data collection tools 34
4.5 Mode of data collection 34
4.6 Methods of data analysis 34
4.7 Pilot Study 34
4.7.1 Reliability of the measurement scale 35
Chapter 5 Data Analysis 38
5.1 Introduction 38

xvi
Sr . No Sections Sub
sections
Content Page
No
5.2 Case Screening & Variable Screening 38
5.2.1 Case Screening 39
5.2.2 Variable Screening 40
5.2.3 Demographics of the survey 43
5.2.3.1 Age 43
5.2.3.2 Gender 44
5.2.3.3 Industry 45
5.2.3.4 Marital Status 46
5.2.3.5 Organizational tenure 47
5.2.3.6 Qualification 48
5.2.3.7 Religion 49
5.2.3.8 Total Work Experience 50
5.3 Exploratory Factor Analysis ( EFA ) 50
5.4 Confirmatory Factor Analysis ( CFA ) 52
5.5 Structural Equation Modeling ( SEM ) 53
5.5.1 Fit Indices 53
5.5.1.1 Root mean square error of approximation 54
5.5.1.2 Goodness-of-fit statistic (GFI)) 54
xvii
Sr . No Sections Sub
sections
Content Page
No
5.5.1.3 Adjusted goodness of fit statistic ( AGFI ) 55
5.5.1.4 Standardized root mean square residual 55
5.5.1.5 Comparative Fit Index 55
5.5.1.6 CMIN / DF 56
5.6 Validity of the scale 56
5.6.1 Convergent Validity 56
5.6.2 Discriminant Validity 56
5.7 Analysis with respect to objectives 57
5.7.1 Objective 1 57
5.7.1.1 Exploratory Factor Analysis 60
5.7.1.2 Exploratory Factor Analysis after removing
EP6
68
5.7.1.3 Data Adequacy 73
5.7.1.4 Converge Validity 73
5.7.1.5 Discriminant Validity 73
5.7.1.6 Achievement with respect to objective 1 75
5.7.2 Objective 2 75
5.7.2.1 Achievement with respect to objective 2 79

xviii
Sr . No Sections Sub
sections
Content Page
No
5.7.3 Objective 3 79
5.7.3.1 Confirmatory Factor Analysis 80
5.7.3.2 Validity & Reliability Check 82
5.7.3.3 Structural Equation Modeling 84
5.7.3.4 Achievement with respect to objective 3 87
5.7.4 Objective 4 87
5.7.4.1 Exploratory Factor Analysis 88
5.7.4.2 Data Adequacy 91
5.7.4.3 Convergent Validity 91
5.7.4.4 Discriminant Validity 92
5.7.4.5 Reliability 93
5.7.4.6 Confirmatory Factor Analysis 93
5.7.4.7 Structural Equation Modeling 95
5.7.4.8 Achievement with respect to objective 4 98
5.7.5 Objective 5 98
5.7.5.1 Achievement with respect to objective 5 103
Chapter 6 Findings 104
6.1 Introduction 104

xix
Sr . No Sections Sub
sections
Content Page
No
6.2 Data Source 104
6.3 Data Preparation 104
6.4 Analysis and Interpretation of data 105
6.5 Findings of Research Objective 1 105
6.5.1 Research Objective 105
6.5.2 Explanation 105
6.5.3 Findings 105
6.6 Findings of Research objective 2 106
6.6.1 Research Objective 106
6.6.2 Explanation 106
7 6.6.3 Findings 106
6.7 Findings of Research Objective 3 107
6.7.1 Research objective 107
6.7.2 Explanation 107
6.7.3 Findings 109
6.8 Findings of Research Objective 4 110
6.8.1 Research objective 110
6.8.2 Explanation 111
xx
Sr . No Sections Sub
sections
Content Page
No
6.8.3 Findings 112
6.9 Findings of Research Objective 5 112
6.9.1 Research objective 112
6.9.2 Explanation 112
6.9.3 Findings 117
Chapter 7 Conclusions, Major Contribution &
Further Scope of work
118
7.1 Conclusion 118
7.2 Major Contribution 121
7.3 Recommendations 121
7.4 Limitations of the study 122
7.5 Scope of further work 123
Chapter 8 References 124
List of publication 136
Appendix Questionnaire 137

xxi
List of Figures
Sr No Content Pg No
1.1 Model depicting the relationship between Diversity Factors and
Employee Performance
6
5.1 Age Demographics 43
5.2 Gender Demographics 44
5.3 Industry Demographics 45
5.4 Marital Status Demographics 46
5.5 Organizational Tenure Demographics 47
5.6 Qualification Demographics 48
5.7 Religion Demographics 49
5.8 Total Work Experience Demographics 50
5.9 CFA – Objective 3 83
5.10 SEM – Objective 3 85
5.11 CFA – Objective 4 95
5.12 SEM – Objective 4 97

xxii
List Of Tables
Sr No Content Pg No
1.1 Industry wise / City wise – Survey Break up 4
1.2 Companies surveyed 5
2.1 Top Ten IT companies in India – 2017 10
2.2 Top Ten Telecom companies in India - 2017 13
2.3 Top Ten FMCG companies in India – 2017 15
4.1 Reliability Test Results 36
5.1 Result Variables ( Variables Screening) 40
5.2 Kurtosis ( Variable Screening ) 41
5.3 KMO & Bartlett’s Test – EFA ( Objective 1 ) 61
5.4 Communalities – EFA ( Objective 1 ) 62
5.5 Total Variance Explained – EFA ( Objective 1 ) 64
5.6 Pattern Matrix – EFA ( Objective 1 ) 66
5.7 KMO & Bartlett’s Test – EFA after removing EP 6 ( Objective 1 ) 68
5.8 Communalities – EFA after removing EP 6 ( Objective 1) 68

xxiii
Sr No Content Pg No
5.9 Total Variance Explained – EFA after removing EP6 ( Objective 1) 70
5.10 Pattern Matrix – EFA after removing EP 6 ( Objective 1 ) 71
5.11 Factor correlation matrix ( Objective 1 ) 74
5.12 Reliability test ( Objective 1 ) 74
5.13 Frequency distribution – Mean calculation ( Objective 2 ) 78
5.14 Standardized Regression Weights - CFA ( Objective 3 ) 80
5.15 Validity & Reliability Check – CFA ( Objective 3 ) 82
5.16 Model Fit – SEM ( Objective 3 ) 84
5.17 Summary of Hypothesis testing ( Objective 3 ) 86
5.18 KMO & Bartlett’s Test – EFA ( Objective 4 ) 88
5.19 Communalities – EFA ( Objective 4 ) 89
5.20 Total Variance Explained – EFA ( Objective 4 ) 90
5.21 Pattern Matrix – EFA ( Objective 4 ) 90
5.22 Factor Correlation Matrix ( Objective 4 ) 92
5.23 Reliability Test ( Objective 4 ) 93

xxiv
Sr No Content Pg No
5.24 Standardized Regression Weights - CFA ( Objective 4 ) 93
5.25 Validity & Reliability Check – CFA ( Objective 4 ) 94
5.26 Model Fit – SEM ( Objective 4 ) 95
5.27 Summary of Hypthesis testing ( Objective 4 ) 98
5.28 Summary of hypothesis testing - Telecom Industry ( Objective 5 ) 98
5.29 Summary of hypothesis testing - IT Industry ( Objective 5 ) 100
5.30 Summary of hypothesis testing - FMCG Industry ( Objective 5 ) 101
5.31 Industry wise impact of diversity factors on employee performance 103
6.1 Findings - Summary of Hypothesis testing ( Objective 3 ) 108
6.2 Findings - Summary of Hypothesis testing ( Objective 4 ) 112
6.3 Findings - Summary of hypothesis testing - Telecom Industry (
Objective 5 )
113
6.4 Findings - Summary of hypothesis testing - IT Industry ( Objective 5
)
114
6.5 Findings - Summary of hypothesis testing - FMCG Industry (
Objective 5 )
115

xxv
Sr No Content Pg No
6.6 Findings - Industry wise impact of diversity factors on employee
performance
117

xxvi
List Of Appendices
Appendix A : ( Questionnaire )
1
CHAPTER 1
Introduction
1.1 Research Background
With companies becoming more employee centric, Human Resource Management has become
one of the most important functions in an organization. Employees are considered to be the
ultimate asset in any organization and there are proven facts that companies practicing
efficient human resource management have produced positive results both in the form of
employee productivity as well as organizational profits. Organizations are now investing more
and more on its human resources and their development as Human capital advantage is the
only thing that can distinguish one organization from another.
The changing trend is that a diverse pool of employees has been working together with each
passing day. Employees with different Age, Gender, Organizational Tenure, Work
Experience, Educational qualification , Religion, Regions, Caste, nationality , personality,
culture, language have been working together.
Workforce diversity is the buzzword today and organizations nowadays are keen to recruit and
have a diverse workforce on board. Dora and Kieth (1998) mentions that Organizations have
discovered that Diversity is not an absolute phenomenon but it is a continuous process.
Saxena, A. (2014) discusses that Workforce diversity is considered as one of the basic
necessities in today’s changing environment but managing the same is a challenge. Having
invested on workforce diversity, organizations often try and find out the impact of workforce
diversity on employee performance. But having a diverse workforce has its benefits as well as
challenges and thus Researchers says that if a

2
diverse workforce is being recruited and managed in a very effective and efficient manner and
issues arising out of the same are handled smoothly, then the same is definitely going to give a
positive impact on employee performance. The study aims to investigate the impact of
workforce diversity on employee performance with special reference to IT, Telecom & FMCG
Industry in the state of Gujarat.
1.2 Research Problem
There has been a number of valuable studies on impact of workforce diversity factors like Age
, Gender , Ethnicity , Caste , Colour , Race , Religion , Culture , disability , personality traits
on organizational performance. Where as there has been a minimal research on impact of the
above factors on employee performance. Also none of this research have included
Organizational Tenure diversity , Work Experience diversity , Educational Background
diversity & Regional diversity along with Age diversity , Gender diversity & Religion
diversity .Apart from that hardly any research talks about measuring the impact of all these
factors on employee performance in the state of Gujarat
1.3 Purpose of the study
The purpose of the research is to study the impact of workforce diversity on employee
performance in IT, Telecom and FMCG industry in the state of Gujarat in cities like
Ahmedabad, Baroda, Surat & Rajkot. This will be done by conducting a literature review and
identifying the factors that may affect employee performance and then the purpose is to study
the issues of each factor within the organization and the industry and investigating the impact
of each diversity factor on employee performance. The purpose of the study is also to study
the perception of employees towards employee performance and carry out an inter industry
comparsion and there by study the impact of each factor on employee peformance in that
particular industry.

3
1.4 Significance of the study
There has been a number of valuable studies on impact of workforce diversity factors like Age
, Gender , Ethnicity , Caste , Colour , Race , Religion , Culture , Disability , Personality traits
on Organizational Performance. Weiliang. (2011).; Otike et al (n.d.) , Isabell et al (2010 );
Deshwal and Chaudhary ( 2012 ); Rice (n. d.) ; Garnero & Rycx ( 2013 ); Barrington &
Troske (2001 ); Cox, T. (n.d.).; Hubbard, E. E. (2005) ;Schehar B, m. F. (2013) .But there has
been a minimal research on impact of the above factors on employee performance.
There has been a number of valuable studies on various diversity factors like Age ,Education,
Gender , Ehtnicity, Caste, Colour, Race, Religion , Culture , Disability, Personality traits ;
Weiliang. (2011); Garnero & Rycx ( 2013 ) ; Isabell et al (2010 ) ; Ali et al (n. d ) ; Moreno,
K. (2012) ; Ehimare ,J. ( 2011 ) ; Otike et al (n.d.) but a minimal research has been done on
diversity factors like Organizational Tenure , Work Experience , Regional diversity and its
impact on employee performance.Apart from that hardly any research talks about measuring
the impact of all these factors on employee performance in the state of Gujarat.
1.5 Research objectives
1.5.1 Primary
• To study the impact of workforce diversity on employee performance
1.5.2 Secondary
• To identify the factors of workforce diversity that may affect employee performance
• To study the diversity issues within each factor
• To investigate the impact of each diversity factor on employee performance
• To study the perception of employees towards impact of workforce diversity on their
performance

4
• To carry out an inter industry comparison & there by study the impact of each factor
on employee performance in that particular industry
1.6 Scope of the study
The research carried out in the thesis focus on Impact of workforce diversity on employee
performance in IT, Telecom and FMCG industries in 4 cities of Gujarat i.e. Ahmedabad,
Baroda, Surat & Rajkot .600 employees from 3 industries were selected for the study.
Below is the City wise / Industry wise detail
1.7 Survey Break up – Industry wise / City wise / Company wise
TABLE 1.1 Industry wise / City wise
Cities / Industry IT Telecom FMCG Total
Ahmedabad 80 75 60 215
Baroda 47 25 43 113
Surat 66 42 39 149
Rajkot 45 34 44 123
Total 238 176 186 600
5
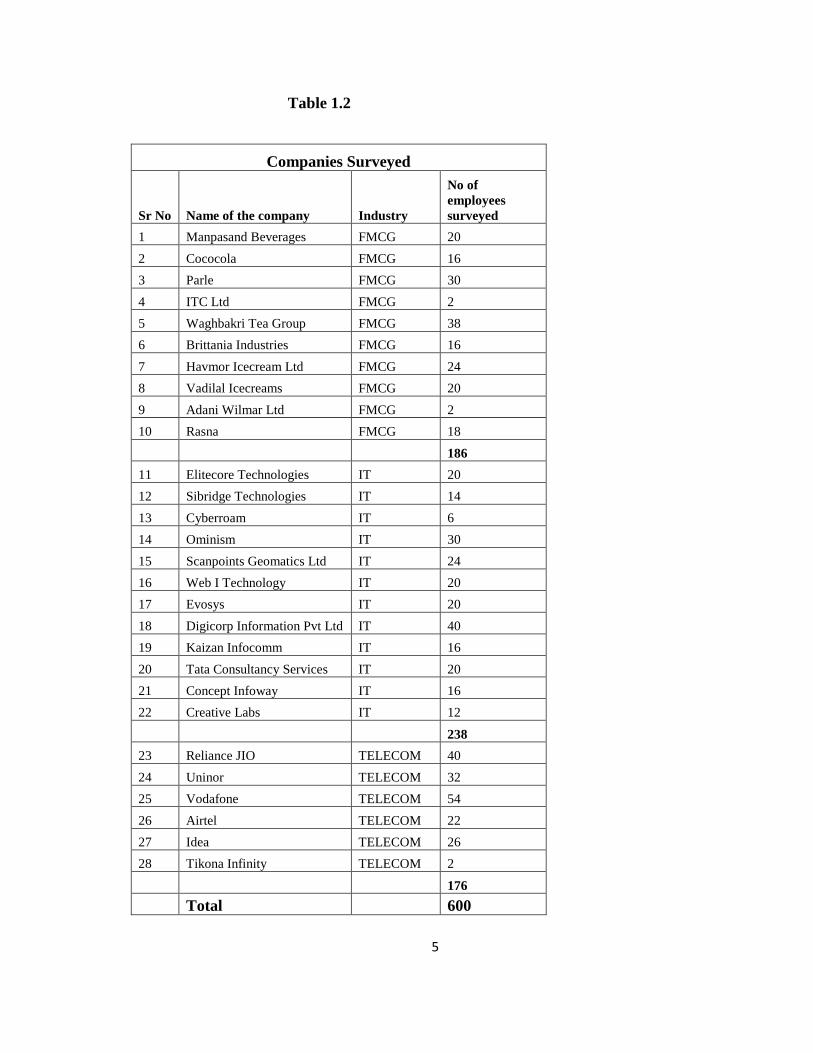
Table 1.2
Companies Surveyed
Sr No Name of the company Industry
No of employees surveyed
1 Manpasand Beverages FMCG 20 2 Cococola FMCG 16 3 Parle FMCG 30 4 ITC Ltd FMCG 2 5 Waghbakri Tea Group FMCG 38 6 Brittania Industries FMCG 16 7 Havmor Icecream Ltd FMCG 24 8 Vadilal Icecreams FMCG 20 9 Adani Wilmar Ltd FMCG 2 10 Rasna FMCG 18
186
11 Elitecore Technologies IT 20 12 Sibridge Technologies IT 14 13 Cyberroam IT 6 14 Ominism IT 30 15 Scanpoints Geomatics Ltd IT 24 16 Web I Technology IT 20 17 Evosys IT 20 18 Digicorp Information Pvt Ltd IT 40 19 Kaizan Infocomm IT 16 20 Tata Consultancy Services IT 20 21 Concept Infoway IT 16 22 Creative Labs IT 12
238
23 Reliance JIO TELECOM 40 24 Uninor TELECOM 32 25 Vodafone TELECOM 54 26 Airtel TELECOM 22 27 Idea TELECOM 26 28 Tikona Infinity TELECOM 2 176 Total 600
6
As per the above table, 600 employees from 28 companies were surveyed for the research
work. 186 employees from 10 companies were surveyed from FMCG industry, 238 employees
from 12 companies were surveyed from IT industry,176 employees from 6 companies were
surveyed from Telecom industry.
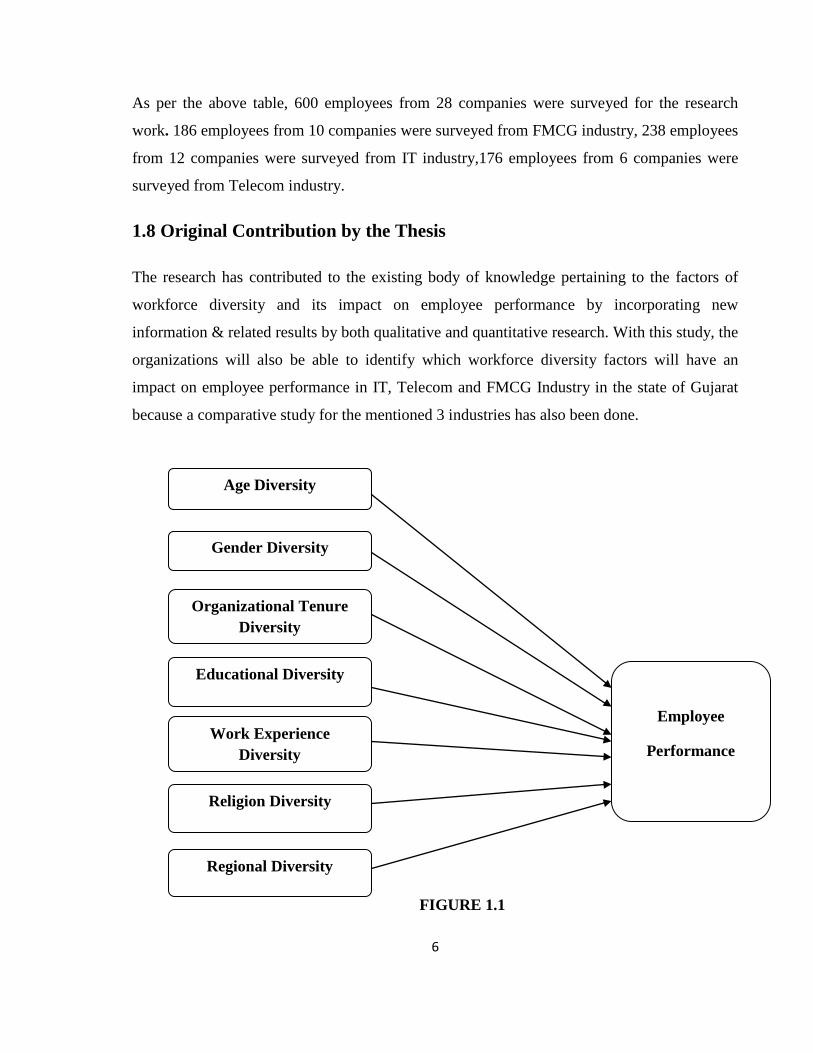
1.8 Original Contribution by the Thesis
The research has contributed to the existing body of knowledge pertaining to the factors of
workforce diversity and its impact on employee performance by incorporating new
information & related results by both qualitative and quantitative research. With this study, the
organizations will also be able to identify which workforce diversity factors will have an
impact on employee performance in IT, Telecom and FMCG Industry in the state of Gujarat
because a comparative study for the mentioned 3 industries has also been done.
FIGURE 1.1
Age Diversity
Regional Diversity
Religion Diversity
Work Experience Diversity
Educational Diversity
Gender Diversity
Organizational Tenure Diversity
Employee
Performance

7
1.9 Structure of the Thesis:
This thesis comprises of chapters, and the chapters will be settled as following:
Chapter 1 Introduction
This chapter introduces the central part of research problem. Subsequently it draws the path
that will help towards the thesis conclusion. It comprises of research background, research
problem, purpose of the study, significance and objectives of the study ,Scope of the study
significant contribution of the present work and structure of the thesis.
Chapter 2 Literature Review
This chapter includes literature review on IT,Telecom & FMCG industry in the state of
Gujarat and India, workforce diversity, employee performance, Impact of workforce diversity
on employee performance, Impact of various diversity factors on employee as well as
organizational performance.
Chapter 3: Research Gap
This chapter studies the research gap derived from literature review and theoretical framework
for the study.
Chapter 4: Research Methodology
This chapter comprises of the methodology used in conducting the research. It commences
with research design, sample design, data collection tools, modes of data collection, methods
of data analysis, pilot study
Chapter 5: Data Analysis
This chapter deals with data analysis and interpretation. It includes reliability analysis of the
scales used in the instrument and several statistical methods and analyses of data collected.

8
Chapter 6: Findings
This chapter includes the major findings on the results obtained with the help of data
Analysis.
Chapter 7 : Conclusion major contribution and scope of further work
This chapter focuses on final conclusion, major contribution, Limitations and scope of further
work.

9
CHAPTER 2
Literature Review
2.1 Introduction
Review of literature is first step for conducting research. It is carried out to enable the
researcher to get understanding about the detailed field of study. Further it helps the researcher
to get thorough with the tested methods and interpretations of similar type of studies
conducted elsewhere. It also helps the researcher to eradicate limitations of work and may also
assist to extend prevailing study. This chapter presents literature survey available in India and
abroad under the various subheadings listed below.
2.2 IT industry In India
India is the world's biggest sourcing goal for the data innovation (IT) industry and records for
around 67 for every penny of the US$ 124-130 billion market. The business utilizes around 10
million workforce. Other than that the IT business has assumed a key part in changing the
monetary photo of the nation and helped India make a check in the worldwide economy.
Regarding the same a few worldwide IT firms have set up their advancement focuses in India.
The Indian education part has additionally picked up advantages in view of IT industry
particularly to computer science and engineering. The Indian IT and ITeS industry is
partitioned into four noteworthy portions –Business Process Management (BPM), IT services,
Hardware & Software products and Engineering services .The Indian IT sector is expected to
grow at a rate of 12-14 per cent for FY2016-17 in constant currency terms.The segment is
additionally anticipated that would triple its present yearly income to achieve US$ 350 billion
by FY 2025#.Indian IT's center abilities and qualities have pulled in huge ventures from
significant nations. The PC programming and equipment segment in India pulled in combined
Foreign Direct Investment (FDI) inflows worth US$ 22.83 billion between April 2000 and

10
December 2016, as per information discharged by the Department of Industrial Policy and
Promotion (DIPP).Leading Indian IT firms like Infosys, Wipro, TCS and Tech Mahindra, are
expanding their offerings and exhibiting driving thoughts in square chain, counterfeit
consciousness to customers utilizing advancement center points, innovative work focuses,
with a specific end goal to make separated offerings. In the Union Budget 2017-18, the
Government of India reported the accompanying key recommendations: The Government of
India has designated Rs 10,000 crore (US$ 1.5 billion) for BharatNet extend under which it
expects to give rapid broadband to more than 150,000 gram panchayats by 2017-18. PM of
India, Mr Narendra Modi, has propelled the Bharat Interface for Money (BHIM) application,
an Aadhaar-based versatile installment application that will enable clients to make advanced
installments without using a credit or charge card. The application has as of now achieved the
characteristic of 10 million downloads ( IBEF,2017 )
Below is the list of top 10 IT companies in India for the year 2017
Table 2.1 – Top 10 IT companies in India - 2017
Rank Company Name
1 TCS
2 Infosys
3 Wipro
4 HCL Technologies
5 Tech Mahindra
6 Oracle Financial Services
7 Mind Tree
8 Mphasis
9 Hexaware Technologies
10 Tata ELXSI

11
2.3 IT Industry in Gujarat
The IT industry is always looking for new venues for development and Gujarat is totally
emerging as a new IT hub .The IT companies in Gujarat are aiming 20 % growth in this
financial year and it will focus on product development and global access. Gujarat as a state
has a number of advantages over others like more than 65 % population is below 35 years of
age, a solid infrastructure and an improved standard of knowledge of English. The government
of Gujarat has already added to the development of IT sector by setting up infocity at
Gandhinagar. And has announced a new industrial policy in 2003.Multiple SEZs has been set
up in cities like Ahmedabad, Gandhinagar and Vadodara. A software technology park is being
lined up at Rajkot, Surat and Jamnagar .The state has highest teledensity and the best tele
communication facility. IT companies are therefore to enter into a virgin but known area.
Educational institutions along with government are working towards development of skilled
human resources who can add value to the IT industry in Gujarat and take to the next level.
Looking at the speed of development, low crime record, safe environment and welcoming
attitude of the state, people from across India are keen to come and work in the state of
Gujarat.
2.4 Telecom Industry in India
India has exhibited a solid development in the previous decade and a half and is at present the
world's second-biggest broadcast communications showcase. The mobile economy of India is
developing quickly and will contribute significantly to India's Gross Domestic Product (GDP),
as indicated by report arranged by GSM Association (GSMA) as a team with the Boston
Consulting Group (BCG).The variables that have prompted the fast development in the Indian
Telecom division are liberal and reformist government strategies and a solid demand of the
consumers. Availability of telecom administrations at reasonable costs is additionally a key
figure to fast development of telecom industry. The part has effectively made adequate
measure of business openings. Universal Data Corporation (IDC) predicts India to surpass US
as the second-biggest cell phone showcase internationally by 2017. Driven by solid selection
of information utilization on handheld gadgets, the aggregate portable administrations

12
advertise income in India is relied upon to touch US$ 37 billion in 2017, enlisting a
Compound Annual Growth Rate (CAGR) of 5.2 for every penny in the vicinity of 2014 and
2017, as per research firm IDC. As indicated by a report by driving examination firm
"Statistical surveying Store", the Indian media transmission administrations market will
probably develop by 10.3 for every penny year-on-year to achieve US$ 103.9 billion by
2020.According to the Ericsson Mobility Report India, cell phone memberships in India is
required to expand four-overlap to 810 million clients by 2021, while the aggregate cell phone
activity is relied upon to grow seventeen-overlay to 4.2 Exabytes (EB) every month by
2021.The government has optimized changes in the telecom part and keeps on being proactive
in giving space to development for telecom organizations. A portion of the other significant
activities taken by the legislature are as per the following. The Government of India has
designated Rs 10,000 crore (US$ 1.5 billion) for taking off optical fiber-based broadband
system crosswise over 150,000 aggregate gram panchayats (GP) and Rs 3,000 crore (US$ 450
million) for laying optical fiber link (OFC) and securing gear for the Network For Spectrum
(NFS) extend in 2017-18.The Government of India has changed the installment terms for
range barters by enabling two alternatives of installments to telecom organizations for
obtaining the privilege to utilize range, which incorporate forthright installment and
installment in portions. The TRAI has suggested a Public-Private Partnership (PPP)
demonstrate for BharatNet, the focal government's eager venture to set up a broadband system
in provincial India, and has additionally imagined focal and state governments to end up
plainly the principle customers in this project.The Ministry of Skill Development and
Entrepreneurship (MSDE) marked a Memorandum of Understanding (MoU) with DoT to
create and execute National Action Plan for Skill Development in Telecom Sector, with a
target of satisfying gifted labor prerequisite and giving business and enterprise openings in the
area.
Below is the list of top Telecom companies in India for the year 2017

13
Table 2.2 - Top 10 Telecom companies in India – 2017
Rank Company Name
1 Airtel
2 Vodafone
3 Idea
4 Reliance Communication
5 BSNL
6 Aircel
7 Tata Dokomo
8 Telenor
9 Jio
10 MTS
2.5 Telecom Industry in Gujarat
Gujarat is one of the leading industrial states in the country. It has a coast line of 1600 kms
and is very well connected to major port based trade routes such as USA, Europe, Canada,
Australia, China, Japan, Korea and Gulf countries. The state contributes more than 7.5% to
India’s GDP and 18 % to India’s fixed capital. More than 10 % of the country’s factories are
in Gujarat. Inspite of the global economic meltdown; Gujarat achieved an annual GSDP
growth of 10 % in 2005-2013 which is higher than the national average. Gujarat has always
been emphasizing on wholesome & sustainable development and generation of a lot of
employment opportunities. (INDEXTB, 2015 ). One of the booming sectors in Gujarat state
today is telecom sector. Gujarat is India’s 5th largest telecom market with a wireless

14
penetration of 82 %.In 2008, there was entry of new telecom operators in the market and this
resulted into an intense competition. The internet and broadband usage in Gujarat is quite
high. Gujarat was ranked 7th in the country with more than one million subscribers as on June,
2011. Gujarat is getting itself ready to come in par with other metro states in the country. The
state also registers above average per capita GDP. Cities like Ahmedabad, Vadodara and Surat
are registering highest disposable income. Higher income across various sections of the
society in the state will lead to increase in the purchasing power of the people and there by
increase in the demand of smart phones and internet connectivity across the state. This in turn
will help the telecom industry to prosper on a large scale. (Grover, 2011)
2.6 FMCG Industry in India
FMCG area is the fourth biggest part in the Indian Economy. The FMCG segment has
developed at a yearly average of about 11 percent throughout the most recent decade. The
market size of FMCG in India is evaluated to develop from US$ 30 billion in 2011 to US$ 74
billion in 2018.Food items is the main section, representing 43 percent of the general market.
Personal care (22 percent) and fabric care (12 percent) come next as far as market share. Rural
localities are anticipated as the real driver for FMCG, as development keeps on being high in
these areas. Provincial territories saw a 16 percent, as against 12 percent growth in urban
zones. Most organizations raced to benefit from this, as they rapidly approached expanding
direct appropriation and giving better framework. Organizations are additionally working
towards making particular items uncommonly focused for the provincial market.The
Government of India has likewise been supporting the rural population with higher minimum
support prices (MSPs), distributions through the National Rural Employment Guarantee Act
(NREGA) program,loan waivers. These measures have helped in decreasing destitution in
provincial India and given a lift to rustic buying power.With ascend in expendable earnings,
mid-and high-pay customers in urban zones have moved their buying pattern from basic to
premium items. Accordingly, firms have begun upgrading their superior items portfolio.
Indian and multinational FMCG players are utilizing India as a key sourcing center point for
cost-focused item improvement and assembling to oblige global markets. (Purohit,2016 ) The
Government of India's approaches and administrative systems, for example, unwinding of
15
permit tenets and endorsement of 51percent foreign direct investment(FDI) in multi-brand and
100 percent in single-brand retail are a portion of the real development drivers for the FMCG
showcase.
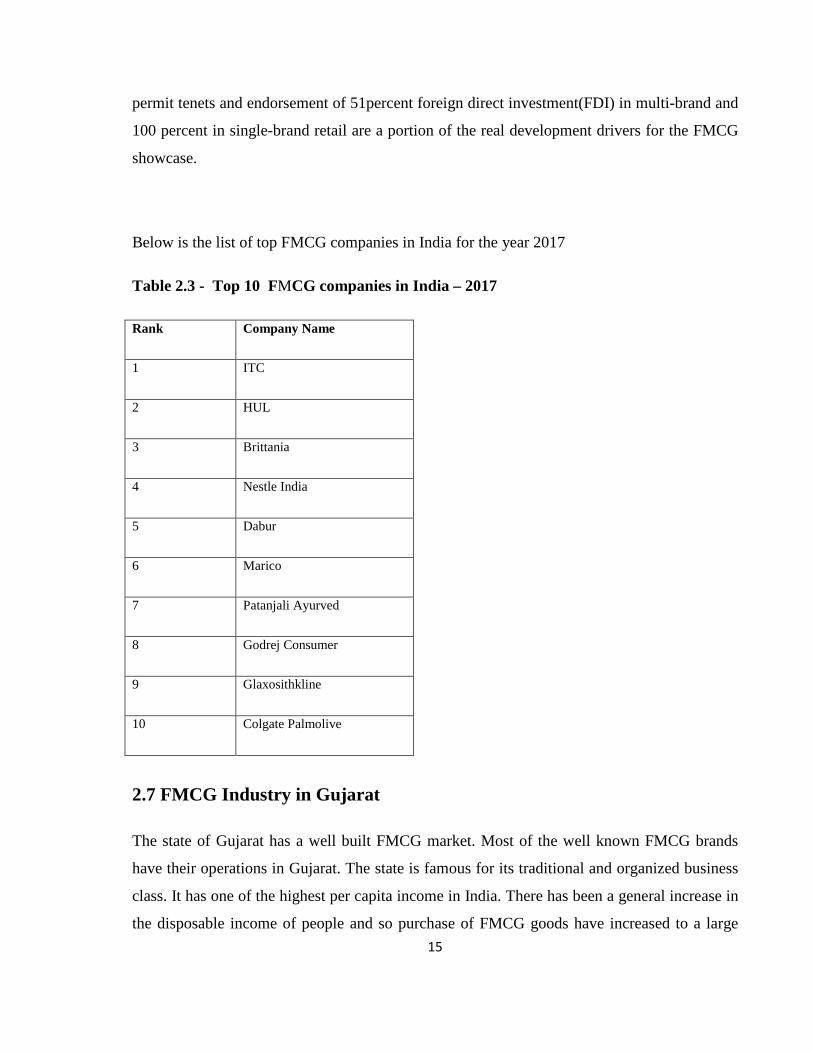
Below is the list of top FMCG companies in India for the year 2017
Table 2.3 - Top 10 FMCG companies in India – 2017
Rank Company Name
1 ITC
2 HUL
3 Brittania
4 Nestle India
5 Dabur
6 Marico
7 Patanjali Ayurved
8 Godrej Consumer
9 Glaxosithkline
10 Colgate Palmolive
2.7 FMCG Industry in Gujarat
The state of Gujarat has a well built FMCG market. Most of the well known FMCG brands
have their operations in Gujarat. The state is famous for its traditional and organized business
class. It has one of the highest per capita income in India. There has been a general increase in
the disposable income of people and so purchase of FMCG goods have increased to a large

16
extent. Cities like Ahmedabad, Gandhinagar, Baroda, Surat have facilitated the development
of FMCG consumerism in Gujarat. The FMCG based goods here are sold through organized
as well as unorganized market. (Anonymous, 2017)
2.8 Workforce Diversity
Organizations now a days have been giving utmost importance to Human Resources as
employees are considered to be the biggest assets. Off let it is proved that if the employees are
recruited, selected & managed properly, the organization can always embark on the path of
progress and prosperity. Organizations always try and set mechanisms to help the employees
increase their performance. One such technique which is gaining momentum is having a
diverse workforce.
Workforce diversity refers to having employees with different backgrounds. Race, ethnic
group, caste, age, gender, personality, cognitive style, Work experience educational
background, tenure, organizational function, language, culture, Religion, Region, and more
together form diversity.
Diversity include age, race, ethnicity, religion, culture, gender, capabilities & sexual
orientation (Das and Wagar, 2007).
A Diverse workforce refers to a group of people working together within the organization
from various socio-cultural backgrounds. Diversity includes factors such as race, gender, age,
colour, physical ability, ethnicity, etc. (Kundu and Turan, 1999)
Organizations are said to have a diverse workforce when it’s employees differ from one
another on one or more parameters (Thomas and Ely, 2001)
In industry and business terms diversity is a set of differences among employees in the form of
personality traits, social variables ,demographic variables ,professional variables that are
found at various levels of the organization (Cox, 1991; Thomas, 1991)

17
Diversity is a very essential element of any organization. Organizations often try and provide
benefits that support workforce diversity. ( Hansen ,2002 )
Organizations are striving to include a diverse workforce which according to them helps in
filling the skill gap and maximize the benefits of workforce diversity as a business case.
(Meena, 2015)
Organizations often pressurize HR departments to motivate people to work in diversity.
( Greengard,2004 )
Workforce diversity is a continuous process & should be studied in terms of level of diversity
along suitable dimensions. ( Dora & Kieth , 1998 )
Organizations are investing a lot of money on recruiting and managing a diverse workforce as
they believe that having a diverse workforce provides a lot of benefits to the organization in
many ways. Globalization has brought the people of the world closer together than ever
before, so nationality is also considered as one of the components of diversity.
Organizations often try and find out various benefits and limitations of workforce diversity
and accordingly recruit a diverse workforce.
Vedpuriswar, A.V. (2008) mentioned that Diversity should go beyond political correctness,
the area where diversity has real business value is innovation, a judicial blend of young and
old people can enhance creativity in individual employees. Diversity helps in increasing the
quality of decision making. Accept and celebrate the differences.
Henry, O., & Evans, A. J. (2007). presents that diversity is very much necessary for the
survival of any organization in today’s competitive world. The management has to analyze the
benefits of workforce diversity and should try and create an environment suitable for the same.
Lindenberger, J. (2004) says that a diverse & innovative body of talent with newer
perspectives is very important for success of an organization in the long run.

18
Hubbard, E. E. (2005) discusses the techniques to measure diversity and that how is diversity
linked with recruitment, promotion and retention. It is very important for an organization to
link diversity with profit. The best way to manage diversity is to find out how it can be
measured in quantifiable terms. He has discussed a very important point that in order to prove
his worth an employee has to act as a strategic partner. He says that there are four layers of
diversity- Workforce diversity, Behavioral diversity, business diversity, structural diversity.
Mullen, B., & Copper, C. (1994). mentions that a diverse workforce will lead to a range of
different knowledge, skills, capabilities and thoughts.
2.9 Employee Performance
Human Resource is the most important resource of any organization and its performance is the
key area that is always at the centre stage in any organization. Organizations always try and
create an environment that supports the employees to perform at their best and add to the
productivity and profitability of the organization.
The ultimate goal of recruiting any employee in the organization is extracting the best
performance out of him there by leading to organizational development along with his
personal and professional development. Employee performance is based on a number of
factors like intrinsic and extrinsic motivation, organization’s culture, financial and non
financial incentives, role clarity, personal development, continuous learning, competitive
compensation practices and the employees efficiency and effectiveness. HR departments
always try and study the factors that are hindering employee performance and work on
eliminating the same to promote smooth, positive and effective employee performance.
Employee performance is the measure of output vis a vis input .Employee performance is
dependent on a lot of organizational factors like Organizational Culture and Environment , Job
Security ,Salary ,Incentives, Job Satisfaction. ( Saeed & Asghar, 2012 )

19
Irun Shahzadi, A. J. (2014). States that What an employee does and what he does not do
represents employee performance. It involves input Vs quality and quantity of output.
Dr Trent Kaufman, D. J. (2015) States that if employees perform better , it can affect the
colleagues and can help the organization grow financially.
Yang, H. (2008) talks about verifying performance of individuals. According to him it is very
difficult to verify the performance of an employee and if employee performance is noticeable,
organizations can use direct financial as well as non financial rewards.
Armstrong (2000) indicates that both behaviour and results have to be taken into consideration
while managing performance.
Performance is defined as the productivity of employees which is appreciated and recognized
by the organization. ( Robbins, 1996 )
Auguinis ( 2009 ) described that performance does not include the result of the behaviour of
the employees but it only includes what the employee does. In other words, their behavior
matters and not the result of their behavior.
If an employee wants to perform better than others than he has to focus on three factors
declarative knowledge, procedural knowledge and motivation . (McCloy et al., 1994)
Huselid ( 1995 ) have argued that efficiency of a HR department in delivering best HR practices is very
important to help the employees perform better.
2.10 Impact of Workforce Diversity on Employee Performance
Industries now a days are looking for unique ways to increase organizational performance and
finding out best solutions to the business problems. Inclusion of a diverse work force is one of
the mechanisms practiced by industries to enhance employee as well as organizational
performance. ( Joseph & Selvaraj ,2015 )

20
When the organization environment supports workforce diversity , workforce diversity will
always add to employee productivity . ( Amaram ,2007 )
Choi and Rainey (2010) explains that there are three variables as far as workforce diversity is
concerned: diversity, diversity management and perceived organizational performance.
If the organization fails to effectively manage workforce diversity the same will lead to
conflicts, miscommunication, power struggle and politics issues. (Jackson et al, 1991; William
and O’Reilly, 1998; Jehn, 1995)
Managing a diverse workplace is very necessary to provide equal opportunities and increase
competitiveness among the employees and be a part of global competition. ( Gilbert et al
,2000 ; Shaw ,1993 )
Incompatibility between a diverse work group often leads to conflicts. Managers should be
aware of this conflicts and should handle the same properly or else it will lead to personal and
emotional issues which in turn affects the culture of the organization and employee morale
This ultimately leads to loss in employee performance. ( Hasen et al , 2009 ; Mckeena , 2000 )
Williams and O‟Reilly (1998) states that managing workforce diversity is a very crucial
challenge for organizations. Diversity is considered as a “ hot – button” in the corporate world
and management always tries to capitalize on the workforce diversity. The papers identifies
the importance of diversity management.
When managers are not very much aware about the skills of dealing with a diverse workforce
and the factors that contribute to effective diversity management, workforce diversity will
definitely create hindrances in employee performance. (Erasmus ,2007 ).
The organizations which do not handle diversity well and do not adopt a holistic view to
remove discrimination and inequality will lead to dissatisfaction amongst the employees as
well as customers. (Khandelwal, 2002)

21
Organizations have been realizing that a diverse workforce leads to employee satisfaction,
increased employee productivity and ultimately happier customers. (Dobbs, 1998; Kochan, T
et al., 2003)
There is positive relationship between diversity & performance. (Barney, 2001)
Woods, R.H. and Sciarini, M.P. (1995) states diverse workforce helps the organizations to
attract and retain talent and skills. Diversity issues are gaining momentum in service industry
as effective communication amongst people are essential to business success.
Deshwal, M. P., & Choudhary, D. S. (2012) discusses that establishments that employ a more
diverse workforce are no less productive than establishments that employ a more
homogeneous workforce. Approach to diversity, and not diversity will define the positive or
negative outcome of workforce diversity on organizational as well as employee performance.
Troske and Barrington ( 2001 ) discusses about the relationship between workforce diversity
& employee productivity and states that workforce diversity adds value to the overall
productivity of the organization.
Rice (n. d.) mentions that diversity should be considered as a business strategy to increase the
productivity and profit of an organization. Diversity will help to enhance the creativity of an
organization and help to gather a variety of thoughts.
Dike, P. (2013) conducted a survey and the results shows that workplace diversity plays an
effective role in some companies. If there is no proper guidance then diversity may lead to low
productivity and frustration among the employees. Diversity has to be managed properly for
the organizations to attain maximum benefits from the same. She concluded that workplace
diversity leads to productivity but if there is lot of discrimination treatment then it may be a
backfire.
Troske and Barrington ( 2001 ) portrays that organizations that employees more diverse
workforce are equally effecient as organizations that have homogenous workforce. In
manufacturing firms, diversity and productivity are more positively associated. Overall there

22
is no inverse or negative association between diversity and productivity. In general scenario
diversity is enhancing the performance of an organization. If an organization wants to or
experiments hiring a diverse workforce , its productivity or efficiency is not at risk.
Cox, T. (n.d.) updates the thinking on a linkage between workforce diversity and
organizational performance. He further mentions that failure to manage diversity may lead to
high turnover ratio and increasing cost. A diverse workforce is able to cater to a culturally
diverse market place .It also increases creativity and innovation He concluded that the
relationship between workforce diversity and organizational performance is complex.
Dept of business and innovation skills ( 2013 ) has revealed certain facts like diversity if
managed properly reaps benefits in some of the industries. If a firm really wants to succeed,
diversity has to be considered to be an important aspect to be included while framing the
strategy of a business. It has to gain importance in the board room.
Gadget. (n.d.). discusses about the fact that companies who actually want to meet the needs of
a diverse customer base has to now think on recruiting a diverse workforce. For adhering
those needs ,Success of an individual depends on how well he can function in or handle a
diverse work force. USA , Canada & Europe are putting in serious efforts to increase diversity
in workplace.
Sunanda Jindal, S. D. (2013).State the fact that it is very important for Indian organizations to
develop strategies for managing people from different organizations. If a firm wants to be
called a high performing organization then it is very necessary to discuss the advantages of
discussing diverse workforce in the board rooms. Strategies have to be designed for managing
the same.
Hubbard, E. E. (2005) discusses the techniques to measure diversity and that how is diversity
linked to recruitment, promotion and retention. It is very important for an organization to link
diversity with profit. The best way to manage diversity is to find out how it can be measured
in quantifiable terms. He has discussed a very important point that inorder to prove his worth

23
an employee has to act as a strategic partner. He says that there are four layers of diversity-
Workforce diversity, Behavioral diversity, business diversity, structural diversity.
Arslam Ayub, m. S. (2013). discusses that to address the issues of diversity the most important
thing is “ Treat others as you want to be treated”. The organization where the survey was
conducted did not fully utilize the benefits of diverse workforce. The heterogeneous
population leaded to varying level of discomfort among the employees.
Schehar B, m. F. (2013) has considered two independent variables i.e workforce diversity &
workforce commitment and their impact on dependent variable i.e organization performance.
The author has suggested that if the diversity in workforce is managed properly the employees
remain committed to the workforce and thus the organizational performance will definitely
increase. A heterogeneous group of employees will definitely add to the efficiency and
effectiveness of the organization. The culture of the organization should always support a
diverse workforce. Diverse group if not properly managed may lead to behavioral issues.
According to (Bassett-Jones, N. 2005), diversity leads to competition between the employees
and motivates them to learn from one other and add to their skills.
Ali M. Alghazo, H. M. (2016). Discusses that Workforce diversity within the organizations
will educate the employees to respect the differences among them which will bring a sense of
healthy competition amongst them but inorder to achieve the same, management should create
an environment that supports diversity.
2.11 Impact of various diversity factors on organizational as well as
employee performance
Weiliang. (2011). revealed the fact that Workforce diversity in terms of Gender, ethnicity,
education positively affects the organizational performance.
24
Gallego, I., Garcia, I. M., & Rodriguez, L. (2010) conducted a survey and found out that
organizations that showcased higher gender diversity, does not out perform organizations with
lower levels of the same. So Gender diversity may not impact organizational performance.
Ali et al (n. d ) revealed the fact that Firms in service industry may benefit more because of
gender diversity as compared to firms in manufacturing industry.
An organization should have a culture and environment to embrace gender diversity. Then and
only then gender diversity will lead to motivation, commitment and related outcomes. The
management of the organization has to identify the issues related to diversity inorder to see
that the gender diversity in the workplace gives effective results. ( Jayne,et al; Brown ,2008 )
Kulik.et al. (2011), states that there is a positive relationship between gender diversity and
organizational performance.
Gupta, R. (2013)states that different diversity factors have different linkage with organizational
performance such as gender is positively or negatively related with performance. Age is
negatively related with performance and culture is positively related to sales and productivity.
Garnero & Rycx ( 2013 ) discusses the impact of workforce diversity on wages and
productivity of an organization. Three factors were considered as diversity i.e Age, Gender &
Education. They concluded that educational (age) diversity is beneficial (harmful) for firm
productivity and wages. The effect of gender diversity on wages and productivity of the
organizations depend on the technological environment of firms. The result of gender diversity
is different in knowledge intensive sectors & traditional industries. Overall, findings do not
point to sizeable productivity-wage gaps except for age diversity.
Ehimare, J. (2011) mentions that gender and ethnicity diversity does not affect the over all
performance of an individual or an organization where as gender, age and ethnicity are
actually correlated to each other.
Kokemuller, N. (n.d.). mentions the negative effects of workforce diversity in an organization.
If diversity not managed properly, it may lead to severe negative consequences in the form of

25
communication barriers, Cultural resistance, internal discrimination and diversity training
costs. The organization should provide an environment where employees develop a tolerant
attitude and are ready to accept the differences among each other. These may help the
organization to reduce the negative effects of workforce diversity.
Otike et al (n.d.) discusses that Diversity based on health background, Gender, academic
qualifications, colour, race, religion affects the organizational performance. Diversity based on
demographics and socio cultural differences if not managed well, may affect the
organizational performance in a negative manner.
Ceren Ozgen, T. D. (2013). discusses that Workforce diversity helps in building creativity &
innovation in an organization or sector which is capital incentive. In labour and land intensive
sectors, the impact of cultural diversity is not so apparent. Large firms benefit from a
culturally diverse groups.
Koshy, P. (2010). summarizes that Diversity in the form of multiculturalism will enhance the
performance level of MSMEs
Moreno, K. (2012) conducted a survey of 321 executives and concluded that a diverse
workforce is a key driver to innovation. The respondents felt that they had made progress in
Gender Diversity but there was not much difference in the areas like disability and age.
Woodard, N. & Debi S Saini (2005) conducted a study where in they compared organizations
from USA and India. One of the things they found was that in Indian organizations there is a
lot of gap between legal promise and actual implementation. They also quoted that there is a
lot of unfavourable discrimination towards women in India. Finally they concluded that there
has been an upliftment of women in IT and education sector in India because of rise in
literacy level and economic and social development of women.
Cox, T. (1991), explains the importance of managing diversity in workplace. According to
him, diversity must be managed effectively to improve organizational effectiveness. He

26
explains that diversity should be planned and implemented properly inorder to maximize its
advantages and minimize its disadvantages.
Cox and Blake (1991) mentions that diversity can help an organization beat its competitors.
But the most important point to be considered over here is that workforce diversity can lead to
either positive or negative outcome.
The relationship among firm’s performance and diversity may arise over an organization’s
diversity reputation; things may also be established through change at numerous managerial
levels (Dwyer, Richard & Chadwick, 2003).

27
CHAPTER 3
RESEARCH GAP
3.1 Introduction
A research gap is a research question or problem which has not been answered appropriately
or at all in a given field of study. Research gap is actually what makes a research publishable.
A research gap shows that a researcher is just not duplicating the existing research but has a
deep understanding of the status of body of knowledge in the chosen field; and finally it shows
that the researcher has conducted a research which fulfils the gap in literature.
3.2 Research Gap
There has been a number of valuable studies on impact of workforce diversity factors like Age
, Gender , Ethnicity , Caste , Colour , Race , Religion , Culture , Disability , Personality traits
on Organizational Performance Weling (2011); Otike et al (n.d.) , Isabell et al (2010 );
Deshwal and Chaudhary ( 2012 ); Rice (n. d.) ; Garnero & Rycx ( 2013 ); Barrington &
Troske (2001 ); Cox, T. (n. d.) ; Hubbard , E. E. ( 2005 ) ; Schehar B, m. F. (2013) But there
has been a minimal research on impact of the above factors on Employee Performance.
There has been a number of valuable studies on various diversity factors like Age ,Education,
Gender , Ehtnicity, Caste, Colour, Race, Religion , Culture , Disability, Personality traits ;
Weling. (2011) ;Garnero & Rycx ( 2013 ) ; Isabell et al (2010 ) ; Ali et al (n. d ) ; Moreno, K.
(2012) ; Ehimare ,J. ( 2011 ) ; Otike et al (n.d.) but a minimal research has been done diversity
factors like Organizational Tenure , Work experience , Regional diversity and its impact on
employee performance.
Apart from that hardly any research talks about measuring the impact of all these factors on
employee performance in the state of Gujarat

28
Hence, factors i.e. Age diversity, Gender diversity, Organizational Tenure diversity,
Educational diversity, Work Experience diversity , Religion diversity ,Regional diversity &
Employee Perception has been selected after extensive literature review and an effort has been
made to study the impact of all these factors on employee performance in IT , Telecom and
FMCG industry in 4 cities in the state of Gujarat. (Ahmedabad, Baroda, Surat & Rajkot )

29
CHAPTER 4
RESEARCH METHODOLOGY
4.1 Introduction
The chapter represents the methodological foundations that addresses research questions and
hypothesis for understanding a relationship between impact of workforce diversity and
employee performance. The research questions and hypothesis have evolved from the research
gap evolved from literature review. This chapter includes objectives description of Research
design , Sample design , Data collection tools, Mode of data collection, Methods of data
analysis, Pilot study.
The following research objectives were used as the basic focus of the investigation
The objectives of the study are listed below
Primary
• To study the impact of workforce diversity on employee performance
Secondary
• To identify the factors of workforce diversity that may affect employee performance
• To study the diversity issues within each factor
• To investigate the impact of each diversity factor on employee performance
• To study the perception of employees towards impact of workforce diversity on their
performance
• To carry out an inter industry comparison & there by study the impact of each factor
on employee performance in that particular industry

30
The following null hypotheses are formulated on the basis of objectives formulated for
the study:
H1o : There is no impact of diversity factors on employee performance
H1ao: There is no impact of Age Diversity on Employee Performance
H1bo: There is no impact of Gender Diversity on Employee Performance
H1co: There is no impact of Organizational Tenure Diversity on Employee Performance
H1do: There is no impact of Educational Diversity on Employee Performance
H1eo: There is no impact of Work Experience Diversity on Employee Performance
H1fo: There is no impact of Religion Diversity on Employee Performance
H1go: There is no impact of Regional Diversity on Employee Performance
H 2o: Employees perceive that working with a diverse group does not help them increase
their performance
4.2 Research Design
Research Design is a planning of research in a systematic way that leads to a valid conclusion.
(Reis & Judd, 2000, p. 17). It engrosses the specifications of the population to be studied, the
treatment to be administered, and the dependent variables to be measured. Polit, D. F.,
Hungler, B. P., & Beck, C. T. (2001), define a research design as “the overall plan for
collecting and analysing data including specifications for enhancing the internal and external
validity of the study”.
Burns, A. & Bush, R. (2010) defines a research design as “a blueprint for conducting a study
with maximum control over factors that may interfere with the validity of the findings”.
Parahoo, 2006 describes a research design as “a plan that describes how, when and where data
are to be collected and analysed”. Polit, D. F., Hungler, B. P., & Beck, C. T. (2012) define a
research design as “the researcher’s overall presentation for answering the research question

31
or testing the research hypothesis”. Research design focuses on the ways and means to
conduct a study. It showcases all the major parts of the research study such as the samples or
groups, measures, treatments or programs, etc and combines them all in order to address the
research questions. Research design mainly affects the internal validity of research, that is, the
ability to draw conclusions about what actually causes any observable differences in a
dependent measure. Research design is linked to data analysis (Miller &Salkind, 2002).
4.2.1 Exploratory Research:
According to Malhotra & Das (2005), exploratory research is characterized as a research used
to investigate or look through a problem or situation to give understandings and inputs.
Exploratory research is significant in any circumstance where the researcher does not have
enough knowledge and understanding to continue with the research project. Exploratory
research is portrayed by adaptability and flexibility as for the techniques since formal research
conventions and strategies are not utilized. It does not often includes structured questionnaires,
probability sampling plans and other related things . Here the researchers are alert to new
thoughts and bits of knowledge as they continue. Once another thought or understanding is
found, they may divert their investigation towards that path. That new heading is sought after
until its potential outcomes are depleted or another course is found. Thus, the concentration of
the researcher may move continually as new bits of knowledge are found. Thus, the
inventiveness and resourcefulness of the researcher plays a noteworthy part in exploratory
research.
The exploratory research will comprise of secondary data analysis as well as primary. Primary
will comprise of qualitative research – in which Industry practitioners and academicians were
contacted for expert interview. The industry experts comprised of middle level managers from
IT, Telecom and FMCG Industry. Academicians were contacted from reputed management
institutes. Questionnaires were circulated via email as well as personally to Industry experts as
well as academicians. Proof checking of the questionnaire was done and relevant changes
were made as per the expert’s advice. Exploratory research helped to gather information

32
related to the HR practices being carried out in the organization , Issues emerging out of the
same and measures taken to control the same.
4.2.2 Descriptive Research:
Malhotra and Das (2005) stipulates that Descriptive Research design describe the
characteristics of relevant group. They further added that this research design is more
appropriate in estimating the percentage of units in a specified population showing certain
behavior, determining the perception of product characteristics, degree of association between
various marketing variables and making specific predictions. Exploratory and descriptive
research are different in a way that in descriptive research the information is clearly defined as
it is characterized by the prior formulation of specific hypotheses.
Descriptive research is pre- planned and well structured. It is based on the large sample size.
Employee survey was conducted to collect the primary data under descriptive research.
4.3 Sample design
A sample is taken from the populace and then survey is conducted. It is a part of the
population which is studied in order to make inferences about the whole population. An
adequate sample will have the same characteristics of the population (Zikmund,2003) and the
findings are usually used to make conclusions about the population. So, a good sample is
minuscule version of the population. A sample design involves Sample unit, Sample
technique, Sample size.
4.3.1 Sample unit
The study focuses on IT, Telecom & FMCG industry in Ahmedabad, Baroda , Surat and
Rajkot in the state of Gujarat.
4.3.2 Sampling technique

33
Sample techniques are used for selecting sample from population by reducing the number of
respondents in manageable size. Sample technique is broadly classified as non-probability and
probability sampling.
Sampling technique used for the current research is Quota Sampling & Convenience
Sampling.
Quota Sampling: Quota sampling is a non-probabilistic version of stratified sampling. In quota
sampling, a population is first divided into mutually exclusive sub-groups. Then judgment is
used to select the subjects or units from each segment based on a specified proportion.
Convenience Sampling: Convenience sampling (also known as availability sampling) is a
specific type of non-probability sampling method that depends on data collection from
population members who are easily & conveniently available to participate in study.
Convenience sampling is a type of sampling where without additional requirements, the first
available primary data source will be used for the research. In other words, this sampling
method involves getting participants wherever you can find them conveniently.
4.3.3 Sample Size
Sample size has an effect on how the sample findings accurately represent the population
(Burns & Bush, 2010). The larger the sample is, the more likely that the generalizations are an
accurate reflection of the population (Saunders, Lewis & Thornhill,2009) In general, there has
been an understanding among authors of statistical books that the larger the sample the more
appropriate for the use of various statistical analysis (Pallant, 2007). The sample size for the
current research is 600 employees in 3 industries.
Sample Size formulation :
n = ( Z ) 2 * ( p) ( q )
( E ) 2
n = ( 1.96 )2 (.5 ) (.5 ) = 600
( 0.04 )2

34
N = Sample Size
Z = Z-value (e.g., 1.96 for a 95 percent confidence level)
P = Percentage of population picking a choice, expressed as decimal Where (p) (q) = estimate of variance 0.25
C = Confidence interval, expressed as decimal (0.04)
4.4 Data collection tools
The secondary data base was collected from various online data base journals, magazines,
newspapers and books available in the library .Primary data was collected through interview
from experts (Industry experts and academicians ) and survey was conducted by
administrating questionnaire. The expert interviews were taken by personal visits to
organizations and questionnaire survey was conducted online as well as by personal visits in
some of the organizations. Online survey was also conducted in order to meet wider
geographical reach.
4.5 Mode of Data collection
Data related to research has been collected through questionnaire
4.6 Methods of Data Analysis
Statistical Tool – SPSS and AMOS have been used to analyze the data
SPSS – EFA & Frequency Distribution has been used
AMOS – CFA & SEM has been used
4.7 Pilot study
A pilot study was carried out prior to the data collection stage .Malhotra and Das (2009),refers
pilot study as a testing of questionnaire on a small sample of respondent to identify and

35
eliminate potential problems .The appropriateness of the questions of the questionnaire was
tested including question content ,wording sequence, form and layout. The pilot study was
carried out in Ahmedabad city .Survey of 30 employees was conducted in pilot study. With
the use of Cronbach Alpha reliability of the questionnaire was checked.
There were some valuable inputs received for modification in the questionnaire by Expert
Opinion before the pilot study was conducted.
The inputs are as below
• Questionnaire seemed to be lengthy
• Some questions were not relevant and did not support the research objective
• Some questions were being repeated
• Sequencing of some questions needed to be changed
• Sentence framing of some questions needed to be changed
4.7.1 Reliability of the Measurement Scale
If repeated measurements are made on the characteristic & a scale produces consistent results
the process is called reliability (Malhotra, 2006). Reliability is an indication of consistency of
findings based on the methods of data collection and analysis. Furthermore, in a Likert-type
questionnaire where there are many variables testing the concept, reliability is more important.
(Saunders, Lewis & Thornhill, 2007). Reliability of the instrument is usually measured by
Cronbach’s alpha. Cronbach’s alpha depicts how highly the items in the questionnaire are
interrelated. (Pallant, 2007). The Cronbach’s alpha coefficient ranges from 0 to 1. Nunnally, J.
C. (1978) suggested value of coefficient alpha should be over 0.7. However a minimum
satisfactory value of 0.60 can be considered acceptable as an indication of scale reliability
(Hair et al. 2006; Malhotra, 2006) for exploratory research. Cronbach’s alpha is the most
common measure of internal consistency ("reliability"). It is most commonly used when you
have multiple Likert questions in a survey/questionnaire that form a scale, and you wish to
determine if the scale is reliable.

36
Table 4.1 Reliability Test result
Reliability Test – Pilot Study
Diversity factors CRONBACH'S ALPHA
Before Changes Made After
AGE DIVERSITY 0.233
Made one statement positive ( Without
changing the meaning ) 0.557
GENDER DIVERSITY 0.867 0.867
ORGANIZATIONAL TENURE
DIVERSITY 0.732 0.732
EDUCATIONAL BACKGROUND
DIVERSITY 0.554 0.554
WORK EXPERIENCE DIVERSITY -0.676
Made two statements positive
(Without changing the meaning ) 0.633
RELIGION DIVERSITY 0.559 0.559
REGIONAL DIVERSITY 0.76 0.76
EMPLOYEE PERFORMANCE 0.847 0.847
EMPLOYEE PERCEPTION 0.844 0.844
The above table represents Cronbach’s alpha calculation for 9 diversity factors .SPSS version
20.0 is used for testing reliability through Cronbach’s alpha coefficient. Alpha value of 0.6 is
used as minimal accepted level as suggested by (Hair et al. 2006; Malhotra, 2006)
The above table states that Age diversity’s Cronbach’s alpha is 0.233 which is less than 0.6
and so one statement was made positive without changing the meaning. After doing so the
Cronbach’s alpha of the same was calculated which came to 0.557.
Work experience diversity’s Cronbach’s alpha is -0.676 which is less than 0.6 and so two
statements were made positive without changing the meaning .After doing so the Cronbach’s
alpha of the same was calculated which came to 0.633.
Thus the above result shows that the research instrument appears to be highly reliable for
measuring impact of workforce diversity on employee performance and achieving other
related objectives.

37
Questions modified after pilot survey
Statement 1
• Original Statement - Employees with different age groups do not bond well
• Changed Statement – Employees with different age groups bond well
Statement 2
• Original Statement - Generation gap and ego issues often lead to conflicts between
freshers and experience people
• Changed Statement – Generation gap and ego issues does not lead to conflicts
between freshers and experienced people
• Statement 3
• Original Statement - Highly experienced employees often feel a sense of insecurity if
the freshers and middle experienced employees are extremely talented
• Changed Statement - Highly experienced employees do not feel a sense of insecurity
if the freshers and middle experienced employees are extremely talented

38
CHAPTER 5
DATA ANALYSIS
5.1 Introduction:
Data analysis concerns activities and technologies which prepare the collected data for
analysis: data checking, entry coding and editing provide statistical insight in the collected
data: weighting, tabulations, and response analysis (Gromme, 1998). After pilot testing, reliability test was conducted. Cronbach’s alpha was calculated and as per
it’s results three statements were made positive. Data collection of 600 employees was carried
out .Once the same was done the next step was to conduct data analysis.
Before starting the data analysis it is very much necessary to ensure that the data is useable,
reliable and valid,and Inorder to check the same Case Screening and Variable Screening was
done. After ensuring that the data is useable, reliable and valid , further analysis is carried out
which focuses on achievement of objectives
AMOS and SPSS softwares were used to perform various statistical techniques to analyse the
data. Tools selected for analysis were Exploratory Factor Analysis, Confirmatory Factor
Analysis, Structural Equation Modeling & Frequency Distribution.
5.2 Case Screening and Variable screening
Case screening (sometimes referred to as "data screening") and variable screening is the
process of ensuring that the data is clean and ready to go before we conduct further statistical
analysis. Data must be screened in order to ensure the data is useable, reliable, and valid for
testing causal theory. Under case screening we have to first identify missing data in rows and
delete those rows where the data is completely missing. Then the next step is to screen
unengaged responses and outliers. Under variable screening the missing data in columns is

39
identified and then instead of deleting the columns, median is calculated for Interval data and
mean is calculated for ratio data.
5.2.1 Case Screening
Step 1: Screening missing data in rows
Count Blank ( ) function in excel was used to screen missing data in rows. In case were data is
missing in rows, it is often advisable to delete the rows. In the current research there were
many rows in which some or other data was missing but there were 2 rows in which all the
data was missing and so both the rows were deleted and subsequently the sample size has been
reduced to 598.
Step 2 : Screening Unengaged responses
Unengaged responses are those response where in the response is given same across all the
questions in the questionnaire and that the questionnaire has been filled only for formality and
there is no thought process applied in filling the questionnaire. In such case, unengaged
responses are screened using Standard deviation. Standard deviation is calculated using excel.
It was tried to get standard deviation for all the scaled variables and it was decided to use the
rule of 0 to 0.2. In this case 3 rows have standard deviation value between 0 to 0.2 and hence
those 3 rows are deleted. Subsequently the new sample size has been reduced to 595.
Step 3: Screening outliers
There are certain values in the data which are very much different as compared to the other
values of the data. These values are called outliers. Box plot function in SPSS software was
used to screen Outliers. Box plot function is applied only on demographic variables. 2 values
came out as outliers .Case no 456 and Case no 6 under work experience. Instead of removing
the same from data, the mean of work experience has been taken.

40
5.2.2 Variable screening
Step 1: Screening missing data in columns
“Replace missing Values” function in SPSS software was used inorder to screen missing data
in columns
TABLE 5. 1 Result Variables
Result Variable N of Replaced
Missing Values
Case Number of Non-Missing
Values
N of Valid
Cases
Creating
Function
First Last
1 AG2 2 1 595 595 MEDIAN(AG2,
ALL)
2 AG3 1 1 595 595 MEDIAN(AG3,
ALL)
3 AG5 2 1 595 595 MEDIAN(AG5,
ALL)
4 WE3 4 1 595 595 MEDIAN(WE3,
ALL)
5 RL6 2 1 595 595 MEDIAN(RL6,
ALL)
6 EP1 2 1 595 595 MEDIAN(EP1,
ALL)
7 RLP 2 1 595 595 MEDIAN(RLP,
ALL)
As mentioned in the above table 5.1 , there are 7 variables in which data is missing in columns
The variables are AG2, AG3, AG5, WE3, RL6, EP1, RLP
In AG2: 2 values are missing, in AG3: 1 value is missing, in AG 5 :2 values are missing, in
WE3: 4 values are missing ,in RL6 : 2 values are missing ,in EP1: 2 values are missing ,in
RLP :2 values are missing
Here instead of deleting the columns we have calculated median for the same

41
Step 2
Kurtosis
kurtosis refers to the measure of the heaviness of the tails in a distribution (also known as
peakdness or flatness of the distribution) compared with the normal distribution. In normal
distribution, the scores of kurtosis is zero. If the kurtosis value of all the variables fall within-2
to 2 there is absolutely no problem in the data. ( Trochim & Donnelly, 2006; Field, 2000 &
2009; Gravetter & Wallnau, 2014 ) Here we have calculated kurtosis by using SPSS software.
TABLE 5. 2
Kurtosis
AG6 2.389
ED1 -.867
ED2 -.720
ED3 -.485
EP1 1.046
EP2 1.763
EP3 .862
EP4 .885
EP5 .967
EP6 .699
GN1 .322
GN2 -.002
GN3 .812
GN4 .198
GN5 .719
OT1 -.430
OT2 -.789
OT3 -.404
OT4 -.716
OT5 -.890
OT6 -.919
OT7 -.656
RG1 1.719

42
Kurtosis
RG2 -.651
RG3 .706
RG4 .189
RG5 .969
RG6 1.092
RL1 -.275
RL2 -.153
RL3 .307
RL4 1.348
RL5 -.413
RL6 .308
WE1 1.960
WE2 .936
WE3 2.593
WE4 1.748
WE5 .514
AGP -.275
EDP 1.348
GNP -.153
OTP .307
RGP .511
RLP .308
WEP -.413
AG1 .918
AG2 1.502
AG3 .980
AG4 1.160
AG5 .948
As per the above table the kurtosis value of 2 variables do not fall between -2 to 2
i.e. AG6 and WE3. But as the value is not significantly different, there is absolutely no
problem in the data.

43
5.2.3 Demographics of the survey:
5.2.3.1 Age
FIGURE: 5.1 ( Age Demographics )
The Pie chart represents the data according to Age. 33% of employees were between 20 – 25
years, 57 % of employees were between 26 -35 years , 9 % employees were between 36 – 45
and 0.7 % of employees were above 45 years.

44
5.2.3.2Gender
FIGURE : 5.2 ( Gender Demographics )
The Pie chart displays data according to Gender .82 % of all the employees surveyed are
males and 18 % are females.

45
5.2.3.3 Industry
FIGURE: 5.3 (Industry Demographics )
The Pie chart displays data according to Industry. 30 % employees from the survey conducted
belonged to Telecom industry , 31 % of employees belonged to FMCG industry and 39 %
belonged to IT industry.

46
5.2.3.4 Marital Status
FIGURE : 5.4 (Marital Status Demographics )
The pie chart represents the data according to the Marital Status of the employees. Out of all
the employees surveyed, 56 % of the employees are married and 44 % of the employees are
single.

47
5.2.3.5 Organizational Tenure
FIGURE : 5.5 ( Organizational Tenure Demographics )
The pie chart represents the data according to the organizational tenure of the employees. i.e
The number of years that the employees have been working in the organization. As per the
above data 26 % of employees have been working in the organization since last 1 year , 54 %
of the employees have been working in the organization since last 5 years, 15 % of the
employees have been working in the organization since last 10 years and 5 % are the
employees who have stayed in the organization for more than 10 years

48
5.2.3.6 Qualification
FIGURE : 5.6 ( Qualification Demographics )
The pie chart represents data according to qualification of the employees.41 % of the
employees are graduates, 55 % of the employees are post graduate and 4 % of the employees
are the employees who have undergone education other than graduation and post graduation

49
5.2.3.7 Religion
FIGURE : 5.7 ( Religion Demographics )
The pie chart represents the data according to religion. 95 % of the employees are Hindu, 4%
of the employees are Muslims and 1 % of the employees are Christians.
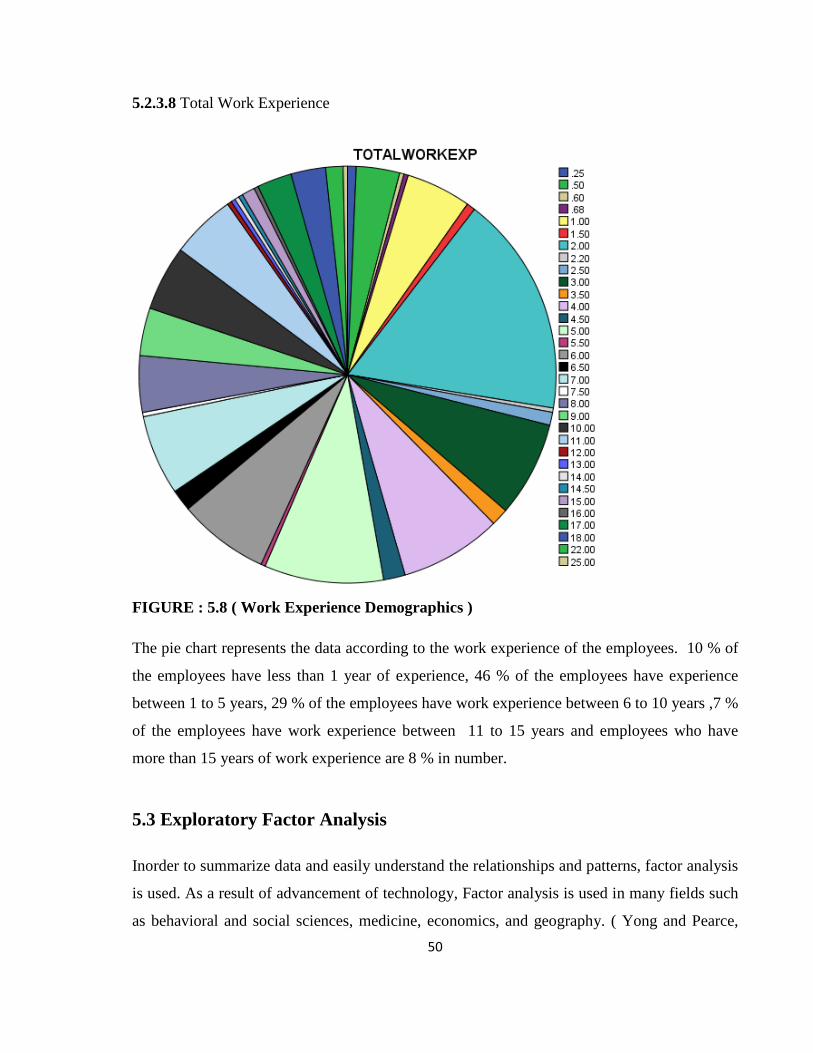
50
5.2.3.8 Total Work Experience
FIGURE : 5.8 ( Work Experience Demographics )
The pie chart represents the data according to the work experience of the employees. 10 % of
the employees have less than 1 year of experience, 46 % of the employees have experience
between 1 to 5 years, 29 % of the employees have work experience between 6 to 10 years ,7 %
of the employees have work experience between 11 to 15 years and employees who have
more than 15 years of work experience are 8 % in number.
5.3 Exploratory Factor Analysis
Inorder to summarize data and easily understand the relationships and patterns, factor analysis
is used. As a result of advancement of technology, Factor analysis is used in many fields such
as behavioral and social sciences, medicine, economics, and geography. ( Yong and Pearce,

51
2013 ) .EFA and CFA are the two main factor analysis.EFA tries to uncover complex patterns
by exploring the data set where as CFA attempts to confirm hypotheses and uses path analysis
diagrams to represent variables and factors.
When a researcher wants to analyze which variables go together and wants to discover the
number of factors influencing variables ,EFA is used . ( DeCoster, 1998 ) Factor analysis is
used in case of large datasets that consists of several variables. These variables when grouped
can be called factors. It becomes easier to focus on key factors than to consider too many
variables. Thus factor analysis helps to place variables into meaningful categories. ( Rummel,
1970 ) . Univariate and Multivariate normality in the data is essential to perform factor
analysis. ( Child , 2006 ). It is also important there has to be an absence of univariate and
multivariate outliers. ( Field, 2009 ) . There should be a linear relationship between the factors
and the variables. ( Gorsuch, 1983 ) Atleast 3 variables have to be there to label somethings as
a factor , although this ultimately depends on the design of the study . ( Tabechnick and Fidell,
2007) EFA generally works better with larger sample size, as a larger sample size will
diminish the error in data and so. A factor loading of the variable is to know that how much
the variable contributes to the factor, thus high factor loading scores indicate that the
dimensions of the factors are better accounted for by the variables (Guodagonali & Velicer
,1988 ) . Next the correlation r must be 0.30 or greater since anything lower than that will
showcase a weak relationship between the variables. Factor analysis can be performed on
categorical and dichotomous variables but it is usually performed on ordinal or continuous
variables.
One of the limitations of this technique is that naming the factors can be problematic. Factor
names may not accurately reflect the variables within the factor. Further, some variables are
difficult to interpret because they may load onto more than one factor which is known as split
loadings. These variables may correlate with each another to produce a factor despite having
little underlying meaning for the factor (Tabachnick & Fidell, 2007).
To identify the latent variable factor analysis is the most effective statistical technique.
According to Gilbert, G., Veloutsou, C., Goode, M. &Moutinho, L. (2004) this technique has

52
been adopted by almost one sixth of the authors of journal articles over the past 30 years. Due
to this reason exploratory factor analysis was selected for the study.
For the current research SPSS software was used to run Exploratory Factor Analysis. Kaiser-
Meyer-Olkin (KMO) and Bartlett’s Test of Sphericity, Communalities ,Total variance
explained and Pattern matrix was used under EFA. Data adequacy, validity and reliability was
then checked.
5.4 Confirmatory Factor Analysis
The Confirmatory Factor Analysis process determines whether the hypothesized structure
provides a good fit to the data, or in other words, that a relationship between the observed
variables and their underlying latent, or unobserved, constructs exist (Child, 1990).
Suhr, D. D. (n.d.) states that CFA allows the researcher to test the hypothesis that a
relationship between the observed variables and their underlying latent construct(s) exists. The
researcher uses knowledge of the theory, empirical research, or both, postulates the
relationship pattern a priori and then tests the hypothesis statistically. According to Hair
(2006), CFA is used to provide a confirmatory test of Measurement Theory. CFA is a special
case of Structural Equation Modeling. ( Mc Donald, 1978 )
CFA corresponds to the measurement model of SEM and as such is estimated using SEM
software. It is common to display confirmatory factor models as path diagrams in which
squares represent observed variables and circles represent the latent concepts. Additionally
single headed arrows are used to imply a direction of assumed causal influence, and double
headed arrows are used to represent covariance between two latent variables.
For the current research ,AMOS software was used to run Confirmatory Factor Analysis.
Standardized factor loading has been used by calculating standardized regression weights.
Validity and reliability of the data was then checked.

53
5.5 Structural Equation Modeling
Structural Equation Modeling (SEM) has become one of the techniques of choice for
researchers across disciplines and increasingly is a ‘must’ for researchers in the social
sciences. SEM is a comprehensive statistical approach to testing hypotheses about relations
among observed and latent variables (Hoyle, 1995). It is a methodology for representing,
estimating, and testing a theoretical network of (mostly) linear relations between variables
(Rigdon, 1998). It tests hypothesized patterns of directional and non directional relationships
among a set of observed (measured) and unobserved (latent) variables (MacCallum & Austin,
2000) .Assessing whether a specific model ‘fits’ the data is one of the most important steps in
SEM. ( Yuan , 2005 )
For the current research SEM was used to measure the Impact of Workforce Diversity factors
on Employee Performance. There are many indices available that reflects some facets of
model fit. The indices that were used for the current research are CMIN / DF , SRMR,GFI,
AGFI, CFI, RMSEA.
SEM makes it possible to:
• Fit linear relationships among a large number of variables. Possibly more than one is
dependent.
• Validate a questionnaire as a measurement instrument.
• Quantify measurement error and prevent its biasing effect.
• Freely specify, constrain and test each possible relationship using theoretical
knowledge, testing hypotheses.
5. 5. 1 Fit Indices
Fit indices determine how well a priori model fits the sample data (McDonald and Ho, 2002)
and demonstrates which proposed model has the most superior fit. These measures provides
the most fundamental indication of how well the proposed theory fits the data. Unlike
incremental fit indices, their calculation does not rely on comparison with a baseline model

54
but is instead a measure of how well the model fits in comparison to no model at all (Jöreskog
and Sörbom, 1993).
5. 5. 1.1 RMSEA : Root mean square error of approximation
The RMSEA is the second fit statistic reported in the LISREL program and was first
developed by Steigerand Lind (Steiger, 1990). The RMSEA tells us how well the model, with
unknown but optimally chosen parameter estimates would fit the populations covariance
matrix (Byrne, 1998). In recent years it has become regarded as ‘one of the most informative
fit indices’ (Diamantopoulos and Siguaw, 2000: 85) due to its sensitivity to the number of
estimated parameters in the model. In other words, the RMSEA favours parsimony in that it
will choose the model with the lesser number of parameters. One of the greatest advantages of
the RMSEA is its ability for a confidence interval to be calculated around its value
(MacCallum et al, 1996). This is possible due to the known distribution values of the statistic
and subsequently allows for the null hypothesis (poor fit) to be tested more precisely
(McQuitty, 2004).
5. 5. 1.2 Goodness-of-fit statistic (GFI)
The Goodness-of-Fit statistic (GFI) was created by Jöreskog and Sorbom as an alternative to
the Chi-Squaretest and calculates the proportion of variance that is accounted for by the
estimated population covariance (Tabachnick and Fidell, 2007). By looking at the variances
and covariances accounted for by the model it shows how closely the model comes to
replicating the observed covariance matrix (Diamantopoulos and Siguaw, 2000)
By looking at the variances and covariances accounted for by the model it shows how closely
the model comes to replicating the observed covariance matrix (Diamantopoulos andSiguaw,
2000). This statistic ranges from 0 to 1 with larger samples increasing its value. When there
are a large number of degrees of freedom in comparison to sample size, the GFI has a
downward bias (Sharma etal, 2005). In addition, it has also been found that the GFI has an
upward bias with large samples (Bollen, 1990; Miles and Shevlin, 1998). Traditionally an
omnibus cut-off point of 0.90 has been recommended for the GFI. However, simulation

55
studies have shown that when factor loadings and sample sizes are low a higher cutoff of 0.95
is more appropriate (Miles and Shevlin, 1998).
5. 5. 1.3Adjusted goodness-of-fit statistic (AGFI)
Related to the GFI is the AGFI which adjusts the GFI based upon degrees of freedom, with
more saturated models reducing fit (Tabachnick and Fidell, 2007). Thus, more parsimonious
models are preferred while penalised for complicated models. In addition to this, AGFI tends
to increase with sample size. As with the GFI, values for the AGFI also range between 0 and 1
and it is generally accepted that values of 0.90 or greater indicate well fitting models.
5. 5. 1.4 Standardised root mean square residual (SRMR)
SRMR are the square root of the difference between the residuals of the sample covariance
matrix and the hypothesised covariance model. Inorder to over come the limitations of root
mean square residual ( RMR) , SRMR is used. SRMR is much meaningful to interpret. Values
for the SRMR range from 0 to 1.0 with well fitting models obtaining values less than .05
(Byrne,1998; Diamantopoulos and Siguaw, 2000), however values as high as 0.08 are deemed
acceptable (Hu andBentler, 1999). An SRMR of 0 indicates perfect fit but it must be noted
that SRMR will be lower when there is a high number of parameters in the model and in
models based on large sample sizes.
5. 5. 1.5 CFI (Comparative fit index)
The Comparative Fit Index (CFI: Bentler, 1990) is a revised form of the NFI which takes into
account sample size (Byrne, 1998) that performs well even when sample size is small
(Tabachnick and Fidell, 2007). This index was first introduced by Bentler (1990) and
subsequently included as part of the fit indices in his EQS program (Kline, 2005).
Like the NFI, this statistic assumes that all latent variables are uncorrelated (null/independence
model) and compares the sample covariance matrix with this null model. As with the NFI,
values for this statistic range between 0.0 and 1.0 with values closer to 1.0 indicating good fit.

56
A cut-off criterion of CFI ≥ 0.90 was initially advanced however, recent studies have shown
that a value greater than 0.90 is needed in order to ensure that misspecified models are not
accepted(Hu and Bentler, 1999). From this, a value of CFI ≥ 0.95 is presently recognised as
indicative of good fit (Hu and Bentler, 1999). Today this index is included in all SEM
programs and is one of the most popularly reported fit indices due to being oneof the measures
least effected by sample size (Fan et al, 1999).
5. 5. 1.6CMIN/DF
It is also called normal chi square, normed chi-square, or simply chi-square to df ratio.It is the
chi-square fit index divided by degrees of freedom. This norming is an attempt to make model
chi-square less dependent on sample size. Thus , the indices value in the above table states that
the measurement model is a perfect fit for confirmatory factor analysis and Structural
Equation Modeling.
5.6 Validity of the scale
5.6.1 Convergent validity
The items that are indicators of a specific construct should converge or share a high proportion
of variance in common is known as Convergent Validity (Hair,2006). Anderson, J.C. and
Gerbing, D.W. (1991) advocate that convergent validity is tested by determining whether the
items in a scale converge or load together on a single construct in the measurement model. In
other words, convergent validity is the degree of convergence seen when two attempts are
made to measure the same construct through maximally different methods. If there is no
convergence, either the theory used in the study needs to be analyzed, or the purification of
measure needs to be implemented by eliminating the items.
5.6.2 Discriminant Validity:

57
Discriminant validity shows that the measure is unique in some way. Discriminant validity
gauges the extent to which measures of two different constructs are comparatively distinctive
from each other. (Campbell & Fiske, 1959). Discriminant validity assesses the degree to
which a concept and its indicators differ from another concept and its indicators. It means that
items from one scale should not load or converge too closely with items from a different scale
and that different latent variables which correlate too highly may indeed be measuring the
same construct rather than different constructs (Garver and Mentzer,1999).
5.7 Analysis with respect to objectives
5.7.1 Objective 1 - To identify the factors of workforce diversity that may affect
employee performance
Based on Literature Review and Expert Interviews, factors were identified under workforce
diversity and also set of statements were identified to measure each factor . The identification
was done conceptually.
Weiliang. (2011) revealed the fact that Workforce diversity in terms of Gender, ethnicity,
education positively affects the organizational performance, whereas there is no significant
relationship between age and organizational performance.
Gallego, I., Garcia, I. M., & Rodriguez, L. (2010) conducted a survey and found out that
Companies with higher level of gender diversity, does not out perform companies with lower
levels of the same. So Gender diversity may not impact organizational performance.
Ali et al (n. d ) revealed the fact that Firms in service industry may benefit more because of
gender diversity as compared to firms in manufacturing industry.
Garnero & Rycx ( 2013 ) discusses the impact of workforce diversity on wages and
productivity of an organization. Three factors were considered as diversity i.e Age, Gender &
Education. The conclusion made was that educational (age) diversity is beneficial (harmful)
for firm productivity and wages. The consequences of gender diversity are found to depend on

58
the technological/knowledge environment of firms. While gender diversity generates
significant gains in high-tech/knowledge intensive sectors, the opposite result is obtained in
more traditional industries. Overall, findings do not point to sizeable productivity-wage gaps
except for age diversity.
Ehimare & Oghene ( 2011 ) mentions that gender and ethnicity diversity does not affect the
over all performance of an individual or an organization where as gender, age and ethnicity
are actually correlated to each other.
Kokemuller, N. (2014). mentions the negative effects of workforce diversity in an
organization. If diversity not managed properly, it may lead to severe negative consequences
in the form of communication barriers, Cultural resistance, internal discrimination and
diversity training costs. The organization should provide an environment where employees
develop a tolerant attitude and are ready to accept the differences among each other. These
may help the organization to reduce the negative effects of workforce diversity.
Otike et al (n.d.) discusses that Diversity based on health background, Gender, academic
qualifications, colour, race, religion affects the organizational performance. Diversity based on
demographics and socio cultural differences if not managed well, may affect the
organizational performance in a negative manner
Ceren Ozgen, T. D. (2013) Workforce diversity helps in building creativity & innovation in an
organization or sector which is capital incentive. In labour and land intensive sectors, the
impact of cultural diversity is not so apparent. Large firms benefit from a culturally diverse
groups.
Koshy, P. (2010). summarizes that diversity in the form of multiculturalism will enhance the
performance level of MSMEs
Moreno, K. (2012) conducted a survey of 321 executives and concluded that a diverse
workforce is a key driver to innovation. The respondents felt that they had made progress in
Gender Diversity but there was not much difference the areas like disability and age.

59
Davis M, D. S. (2012) revealed the fact that conscientiousness personality traits is the most
predictive of job performance as compared to openness to experience, extraversion,
agreeableness & emotional stability. Personality traits can be considered as a major criteria to
find out the level of job satisfaction and job performance and there by organizational
performance. He further recommended to the organization that personality tests should be
mandatorily used as a part of recruitment & selection process.
Sims ( 2011 ) reveals the impact of generational and Age diversity on today’s workplaces.
Issues like delayed retirement of the older people, communication gaps between generations,
different ways of working styles, adaptability to latest and modern technologies create a lot of
differences between different generations who are working under the same roof. The author
also finds out that baby boomers make a large part of workforce and that they are all because
of their experience occupying the senior positions in the organizations. Because of this the
young people get frustrated as they get minimal opportunities for growth. The management
should propogate the benefits of having different generations in an organization and try to
reduce the negative impacts diversity training and mentoring are the best possible ways to help
these three different generations work together.
Hammil, G. (2005).has discussed one more generation. He says that there is an addition to 3
generations and that is the 4th one and which is Veterans. He says that organizations have to
really work hard to all these four generations. Rewards and recognitions should be tailor made
to motivate them as there is an inevitable role of each generation in smooth functioning of an
organization.
Once the factors were identified under workforce diversity and also set of statements were
identified to measure each factor, expert opinion was taken on the questionnaire and necessary
changes were made. Pilot study was then conducted for 30 employees in the city of
Ahmedabad. Reliability of the data was checked using Cronbach’s Alpha. As per the
reliability results three statements were changed from negative to positive terms. Once the
same was done questionnaire survey was conducted and data was collected. After data
collection was over, data analysis was started. The factor and their respective statement
identification was done on the basis of Literature review and Expert opinion in a conceptual

60
manner. Now, it was very much necessary to validate the same by measuring statistical
relationship between the factors and the variables. It was also important to check whether the
variables identified under each factor are useful to measure that particuar factor or not. And
inorder to do so , Exploratory Factor Analysis was conducted.Here Kaiser-Meyer-Olkin
(KMO) and Bartlett’s Test of Sphericity, Communalities, Total variance explained and Pattern
matrix was used in order to measure the statistical relationship between factors and variables.
The results obtained by conducting EFA proved that there is a statistical relationship between
the factors and variables and that the variables are useful to measure their respective factors.
Hence, following factors were identified: Age Diversity, Gender Diversity, Organizational
Tenure diversity, Educational Background diversity, Work Experience diversity, Religion
diversity & Regional diversity. The impact of these diversity factors had to be measured on
employee performance and so one more factor identified was Employee Performance.
5.7.1.1 Exploratory Factor Analysis
The following tests were used under EFA
A ) KMO and Bartlett’s test
B ) Communalities
C ) Total variance explained
D ) Pattern Matrix
Data Adequacy, Validity and Reliability was then checked
A ) KMO and Bartlett’s test
Kaiser-Meyer-Olkin (KMO) and Bartlett’s Test of Sphericity is a test to assess the
appropriateness and suitability of the data for Factor Analysis. Higher KMO value signifies
higher correlation among the variables. According to Kaiser and Rice ( 1974 ) , KMO value
greater than 0.6 can be considered as adequate.KMO measures the sample adequacy criteria

61
where in low correlation value of variable indicates that they are not fit to be the member of
any of the factor.
Bartlett’s test of sphericity tests the correlation among the variables ( Hair, 2006 ). A
statistically significant Bartlett’s Test of sphericity ( sig <0.05 ) indicates that significant
correlation exist among the variables.
KMO returns values between 0 and 1. A rule of thumb for interpreting the statistic:
• KMO values between 0.8 and 1 indicate the sampling is adequate.
• KMO values less than 0.6 indicate the sampling is not adequate and that remedial
action should be taken. Some authors put this value at 0.5, so use your own judgment
for values between 0.5 and 0.6.
• KMO Values close to zero means that there are large partial correlations compared to
the sum of correlations. In other words, there are widespread correlations which are a
large problem for factor analysis.
For reference, Kaiser put the following values on the results:
• 0.00 to 0.49 unacceptable.
• 0.50 to 0.59 miserable.
• 0.60 to 0.69 mediocre.
• 0.70 to 0.79 middling.
• 0.80 to 0.89 meritorious.
• 0.90 to 1.00 marvelous.
TABLE 5.3 KMO and Bartlett's Test
Kaiser-Meyer-Olkin Measure of Sampling Adequacy. .917
Bartlett's Test of Sphericity
Approx. Chi-Square 19081.449
Df 946
Sig. .000

62
Table 5.3 states KMO value to be 0.917 which shows that the data is perfectly suitable for
Factor Analysis. And Bartlett’s value is 0.000 which shows that the data is multivariate
normal and acceptable for data analysis.
B ) Communalities
Factor analysis uses variances to produce communalities between variables. Communalities
indicate the amount of variance in each variable that is accounted for.
The goal of extraction is to remove as much common variance in the first factor as possible. (
Child, 2006 ) The extraction method used over here is “Maximum likelihood method”
available in SPSS.
Maximum-LikelihoodMethod. A factor extraction method that produces parameter
estimates that are most likely to have produced the observed correlation matrix if the sample is
from a multivariate normal distribution. The correlations are weighted by the inverse of the
uniqueness of the variables, and an iterative algorithm is employed.
TABLE 5.4 Communalities
Initial Extraction
AG1 .715 .662
AG2 .786 .773
AG3 .833 .850
AG4 .852 .881
AG5 .731 .685
AG6 .647 .563
ED1 .449 .523
ED2 .488 .660
ED3 .404 .452
EP1 .662 .561
EP2 .725 .728
EP3 .774 .836
EP4 .628 .562
EP5 .667 .630
EP6 .486 .432

63
Initial Extraction
GN1 .650 .648
GN2 .728 .736
GN3 .771 .827
GN4 .731 .747
GN5 .728 .743
OT1
OT2
.516
.703
.404
.677
OT3 .638 .563
OT4 .629 .605
OT5 .737 .739
OT6 .775 .793
OT7 .520 .497
RG1 .357 .328
RG2 .623 .619
RG3 .509 .449
RG4 .487 .505
RG5 .666 .670
RG6 .617 .622
RL1 .608 .592
RL2 .760 .786
RL3 .723 .733
RL4 .759 .783
RL5 .686 .662
RL6 .664 .615
WE1 .606 .579
WE2 .571 .568
WE3 .580 .608
WE4 .602 .603
WE5 .487 .370
If extraction value of any variable is less than 0.2, then there may be a problem in the data. (
Child, 2006)
But as per Table 5.4, all the values are more than 0.2 so the data is suited for factor analysis.

64
C ) Total variance explained
Eigenvalue actually reflects the number of extracted factors whose sum should be equal to
number of items which are subjected to factor analysis. The next item shows all the factors
extractable from the analysis along with their eigenvalues.
The eigenvalue table has been divided into 3 subsections i.e Initial Eigenvalues, Extraction
sums of squared loadings and rotation of sums of squared loadings.
The extraction technique used over here is Maximum Likelihood method available in SPSS.
TABLE 5.5 Total Variance Explained
Factor Initial Eigenvalues Extraction Sums of Squared Loadings Rotation Sums of
Squared Loadingsa
Total % of
Variance
Cumulative
%
Total % of
Variance
Cumulative
%
Total
1 12.961 29.457 29.457 12.449 28.293 28.293 7.997
2 4.206 9.559 39.015 3.796 8.627 36.920 8.477
3 3.719 8.452 47.468 2.857 6.493 43.413 8.069
4 2.971 6.753 54.221 2.595 5.897 49.310 8.359
5 2.356 5.354 59.575 2.581 5.865 55.176 5.542
6 1.836 4.173 63.747 1.607 3.652 58.828 3.211
7 1.627 3.697 67.444 1.232 2.800 61.628 3.890
8 1.094 2.487 69.931 .755 1.716 63.344 7.570
9 .817 1.857 71.788
10 .758 1.723 73.511
11 .700 1.591 75.102
12 .691 1.570 76.672
13 .651 1.480 78.152
14 .575 1.307 79.459
15 .573 1.302 80.760
16 .538 1.223 81.983
17 .508 1.155 83.139
18 .484 1.100 84.239

65
19 .463 1.052 85.292
20 .447 1.015 86.306
21 .422 .959 87.265
22 .408 .927 88.192
23 .389 .884 89.076
24 .376 .855 89.931
25 .343 .780 90.712
26 .335 .761 91.472
27 .326 .740 92.212
28 .313 .711 92.923
29 .299 .679 93.602
30 .288 .656 94.257
31 .271 .616 94.873
32 .246 .560 95.433
33 .225 .512 95.946
34 .218 .497 96.442
35 .204 .465 96.907
36 .189 .430 97.337
37 .178 .404 97.742
38 .172 .390 98.132
39 .164 .372 98.504
40 .156 .355 98.859
41 .150 .341 99.200
42 .142 .322 99.522
43 .121 .276 99.797
44 .089 .203 100.000
All the factors in table 5.5 accounted for 63.34% of the variance. Total variance explained
(63.34 % ) exceeds the 60 % threshold commonly used in social sciences.( Hair, 2006 )

66
D ) Pattern Matrix
TABLE 5.6 Pattern Matrix
Factor 1 2 3 4 5 6 7 8 EP3 0.986 EP2 0.889 EP4 0.752 EP4 0.734 EP1 0.585 EP6 0.317 AG4 0.955 AG3 0.952 AG5 0.838 AG2 0.807 AG1 0.787 AG6 0.707 OT6 0.956 OT5 0.917 OT2 0.815 OT3 0.707 OT4 0.686 OT7 0.639 OT1 0.567 RL2 0.913 RL4 0.891 RL3 0.848 RL5 0.803 RL6 0.73 RL1 0.675 GN3 0.929 GN5 0.877 GN4 0.86 GN2 0.841 GN1 0.744 RG5 0.814 RG6 0.785 RG2 0.781 RG4 0.708 RG3 0.664

67
Factor
1 2 3 4 5 6 7 8
RG1 0.569 ED2 0.807 ED1 0.701 ED3 0.662 WE2 0.677 WE3 0.656 WE1 0.623 WE4 0 .360 0.532 WE5 0.393
The extraction technique used over here is Maximum Likelihood Method available in SPSS software
Pattern Matrix should not have any cross loading. But table 5.6 states that WE4 has cross
loading on factor 1 [which consists of EP variables].So here a Comparison is made between
Lowest EP dimension and WE4.The lowest EP dimension is EP6 : [0.317] and WE4 [0.532].
After comparing EP6 and WE4, it is found that EP 6 has a lower value and so we eliminate
EP6 from EFA.As the pattern matrix has cross loading , we remove the variable EP6 and run
EFA again

68
5.7.1.2 Exploratory Factor Analysis after removing EP6
A ) KMO and Bartlett’s test
TABLE 5.7 KMO and Bartlett's Test
Kaiser-Meyer-Olkin Measure of Sampling Adequacy. .914
Bartlett's Test of Sphericity
Approx. Chi-Square 18707.621
Df 903
Sig. .000
In table 5.7 , KMO value is 0.914 which shows that the data is perfectly suitable for Factor
Analysis. And Bartlett’s value is 0.000 which shows that the data is multivariate normal and
acceptable for data analysis.
B ) Communalities
TABLE 5.8 Communalities
Initial Extraction
AG1 .706 .658
AG2 .785 .773
AG3 .833 .851
AG4 .852 .881
AG5 .731 .684
AG6 .645 .561
ED1 .448 .524
ED2 .487 .656
ED3 .404 .455
EP1 .659 .567
EP2 .725 .730
EP3 .773 .840

69
Initial Extraction
EP4 .622 .557
EP5 .660 .625
GN1 .646 .648
GN2 .728 .736
GN3 .771 .827
GN4 .731 .747
GN5 .728 .743
OT1 .516 .404
OT2 .703 .677
OT3 .638 .563
OT4 .629 .605
OT5 .734 .740
OT6 .774 .793
OT7 .520 .497
RG1 .357 .328
RG2 .622 .619
RG3 .508 .450
RG4 .487 .505
RG5 .666 .670
RG6 .617 .622
RL1 .605 .592
RL2 .760 .786
RL3 .721 .734
RL4 .759 .783
RL5 .686 .662
RL6 .664 .615
WE1 .605 .587
WE2 .563 .558
WE3 .579 .614
WE5 .484 .370
WE4 .600 .599
If extraction value of any variable is less than 0.2, then there may be a problem in the data.
(Child ,2006)

70
But as per table 5.8 , all the values are more than 0.2, so the data is suited for factor analysis.
C ) Total variance explained
TABLE 5.9 Total Variance Explained
Factor Initial Eigenvalues Extraction Sums of Squared Loadings Rotation
Sums of
Squared
Loadingsa
Total % of Variance Cumulative % Total % of Variance Cumulativ
e %
Total
1 12.614 29.335 29.335 12.108 28.158 28.158 8.165
2 4.118 9.577 38.912 3.738 8.692 36.850 7.982
3 3.718 8.647 47.559 2.856 6.642 43.491 8.178
4 2.966 6.897 54.456 2.579 5.997 49.488 7.420
5 2.349 5.462 59.918 2.565 5.965 55.453 5.525
6 1.836 4.269 64.187 1.606 3.736 59.189 3.210
7 1.626 3.782 67.969 1.232 2.865 62.054 7.676
8 1.094 2.545 70.514 .754 1.754 63.808 3.945
9 .802 1.864 72.378
10 .758 1.762 74.140
11 .697 1.621 75.762
12 .691 1.606 77.368
13 .594 1.380 78.748
14 .573 1.332 80.080
15 .558 1.297 81.377
16 .509 1.184 82.561
17 .489 1.137 83.698
18 .473 1.100 84.798
19 .452 1.050 85.849
20 .437 1.016 86.865
21 .419 .975 87.840
22 .390 .906 88.746
23 .381 .887 89.633
24 .344 .800 90.433

71
25 .335 .779 91.212
26 .328 .763 91.975
27 .313 .727 92.703
28 .299 .695 93.398
29 .289 .671 94.069
30 .277 .643 94.713
31 .246 .573 95.286
32 .228 .530 95.815
33 .223 .518 96.333
34 .212 .492 96.825
35 .190 .441 97.267
36 .178 .414 97.680
37 .172 .400 98.080
38 .164 .381 98.461
39 .159 .369 98.831
40 .150 .349 99.179
41 .142 .331 99.510
42 .122 .283 99.792
43 .089 .208 100.000
All the factors in table 5.9 accounted for 63.808% of the variance. Total variance explained
(63.80 % ) exceeds the 60 % threshold commonly used in social sciences.( Hair, 2006 )
Residual Value is 3 %
D ) Pattern Matrix
TABLE 5.10 Pattern Matrix
Factor 1 2 3 4 5 6 7 8 AG4 0.95 AG3 0.946 AG5 0.834 AG2 0.804 AG1 0.784

72
Factor
1 2 3 4 5 6 7 8
AG6 0.704 OT6 0.955 OT5 0.918 OT2 0.815 OT3 0.707 OT4 0.685 OT7 0.639 OT1 0.567 RL2 0.912 RL4 0.889 RL3 0.846 RL5 0.801 RL6 0.728 RL1 0.675 EP3 0.971 EP2 0.867 EP4 0.731 EP5 0.717 EP1 0.54 GN3 0.929 GN5 0.877 GN4 0.861 GN2 0.841 GN1 0.745 RG5 0.814 RG6 0.785 RG2 0.781 RG4 0.708 RG3 0.664 RG1 0.569 WE3 0.704 WE2 0.704 WE1 0.673 WE4 0.567 WE5 0.426 ED2 0.807 ED1 0.704 ED3 0.668

73
The extraction technique used over here is Maximum Likelihood Method available in SPSS software
Pattern Matrix should not have any cross loading. As per table 5.10 there is no cross loading in
pattern matrix and we have reached to a clean pattern matrix. Hence, the data is suitable for
factor analysis.
The next step is to check the Adequacy, Validity and reliability of the data
5.7.1.3Data Adequacy
Inorder to check whether the data is adequate to use or not, we take a look at the pattern
matrix
Inorder to check data adequacy, either each value in the pattern matrix should be greater than
0.5 or average of each factor should be greater than 0.7.
As per the pattern matrix ( Table 5.10 ) all the values are greater than 0.5 except WE5. But as
maximum values are more than 0.5, the data is adequate.
5.7.1.4 Converge Validity
The items that are indicators of a specific construct should converge or share a high proportion
of variance in common is known as Convergent Validity (Hair,2006). Anderson and Gerbing,
(1991) advocate that convergent validity is tested by determining whether the items in a scale
converge or load together on a single construct in the measurement model. If loading in the
pattern matrix is greater than 0.5 on each factor, there is a converge validity.( Hair, 2006) As
per the pattern matrix( Table 5.10 ) all the values are greater than 0.5 , so there is a converge
validity in the data.
5.7.1.5 Discriminant validity
Discriminant validity shows that the measure is unique in some way. Discriminant validity
gauges the extent to which measures of two different constructs are comparatively distinctive
from each other. (Campbell and Fiske, 1959). Discriminant validity assesses the degree to

74
which a concept and its indicators differ from another concept and its indicators. It means that
items from one scale should not load or converge too closely with items from a different scale
and that different latent variables which correlate too highly may indeed be measuring the
same construct rather than different constructs (Garver and Mentzer,1999).
TABLE 5.11 Factor Correlation Matrix
Factor 1 2 3 4 5 6 7 8
1 1.000 .356 .482 .535 .247 .052 .523 .276
2 .356 1.000 .546 .337 .393 .006 .468 .380
3 .482 .546 1.000 .393 .248 -.079 .490 .319
4 .535 .337 .393 1.000 .224 -.006 .632 .140
5 .247 .393 .248 .224 1.000 .008 .231 .384
6 .052 .006 -.079 -.006 .008 1.000 -.027 -.005
7 .523 .468 .490 .632 .231 -.027 1.000 .300
8 .276 .380 .319 .140 .384 -.005 .300 1.000
The extraction technique used over here is Maximum Likelihood method available in SPSS.
As per the above pattern matrix ( Table 5.10 ) there is no cross loading of variables and as per
table 5.11 all the values are less than 0.7 and hence the data has discriminant validity
TABLE 5.12 Reliability using Cronbach’s alpha , validity Alpha CR
AG 0.941 0.936
GN 0.93 0.933
ED 0.774 0.777
EP 0.896 0.900
OT 0.913 0.909
RG 0.867 0.853
RL 0.927 0.927
WE 0.84 0.834

75
As per table 5.12 ,Cronbach’s alpha is greater than 0.7, and hence the data is reliable and
valid
5.7.1.6 Achievement with respect to objective 1
The following factors with their respective variables were identified through Literature
Review and Expert opinion and the statistical relationship between the factors and the
variables was measured through Exploratory Factor Analysis. The factors identified were: Age
Diversity, Gender Diversity, Organizational Tenure diversity, Educational Background
diversity, Work Experience diversity, Religion diversity & Regional diversity. The impact of
these diversity factors had to be measured on employee performance and so one more factor
identified was Employee Performance.
5.7.2 Objective 2 : To study the diversity issues of each factor within the organization
People with different Age groups, Gender ,Organizational Tenure, Educational Background
Work Experience, Religion and Region when they work together it leads to both positive as
well as negative effect. They have to be managed properly to see that a diverse workforce adds
to theirs as well as organization’s performance. But still there are lot of issues that may arise
of these diverse pool of candidates working together. Those issues are incorporated in the
questionnaire in the form of variables under each factor and view point on the same has been
collected by conducting a survey through questionnaire
Mean calculation was done through SPSS software inorder to analyse the responses of the
employees and address the above objective
Below are the diversity issues that were incorporated in the questionnaire and studied during
the survey process

76
Age Diversity issues
• Employees from all age groups are involved in decision making & problem solving
processes
• Employees with different age groups bond well
• It is easy for me to adjust to different aged employees
Gender diversity issues
• There is no gender bias during the performance appraisal process. Increments and
promotions are purely given on the merit basis
• Male & Female employees are treated in a fair & equal manner
• I feel comfortable working with the opposite gender
Organizational Tenure diversity issues
• Employees who have spent long time within the organization hold a special
importance
• Senior Employees (who have been associated in the organization for more than 5 years
)are only involved in the decision making process
• Seniority within the organization is given more importance as compared to Educational
qualifications
• Promotions & Increments are awarded on merit basis and not on the basis of Seniority
• Seniority & ego issues often lead to conflicts between employees who have spent long
time in the organization as compared to employees who have been in the organization
since 1 to 2 years
• I can get along well with my seniors as well as with my juniors
Educational diversity issues
• There may be employees with long organizational tenure( Who have been working in
the organization for more than 5 years), and whose education is less. Where as newly

77
joined employees who are more qualified as compared to the old employees. This
leads to Conflicts and ego issues among the employees
Work experience diversity issues
• In case of equally experienced employees, seniority is given more weightage during
the performance appraisal process
• Generation gap & ego issues does not lead to conflicts between freshers & experienced
people
• Freshers are not involved in the decision making & problem solving process
• Highly experienced employees do not feel a sense of insecurity if the freshers and
middle experienced employees are extremely talented
Religion diversity issues
• Employees from all the religions are involved in decision making process
• Religion is not given consideration during the performance appraisal process
• Employees are treated in a fair & equal manner irrespective of their religion
• It is easy for me to adjust with employees from different religions
• Employees from all the regions/states are involved in the decision making & problem
solving process
Regional diversity issues
• Region / state is not given consideration during the performance appraisal process
• Employees are treated in a fair & equal manner irrespective of the region / state they
belong to
• It is easy for me to adjust with employees from different regions
Mean was calculated on the basis of the response received from employees in IT Telecom
and FMCG industry in Ahmedabad , Baroda, Surat and Rajkot.

78
TABLE 5 .13
Diversity Issues Mean
Employees from all age groups are involved in decision making & problem solving
processes 3.98
Employees with different age groups bond well 4.04
It is easy for me to adjust to different aged employees 4.08
There is no gender bias during the performance appraisal process. Increments and
promotions are purely given on the merit basis
2.21
Male & Female employees are treated in a fair & equal manner 2.24
I feel comfortable working with the opposite gender 2.24
Employees who have spent long time within the organization hold a special importance 2.86
Senior Employees (who have been associated in the organization for more than 5 years
)are only involved in the decision making process
2.73
Seniority within the organization is given more importance as compared to Educational
qualifications
3.07
Promotions & Increments are awarded on merit basis and not on the basis of Seniority 3.01
Seniority & ego issues often lead to conflicts between employees who have spent long
time in the organization as compared to employees who have been in the organization
since 1 to 2 years
3.04
I can get along well with my seniors as well as with my juniors 2.90
There may be employees with long organizational tenure( Who have been working in
the organization for more than 5 years), and whose education is less. Where as newly
joined employees who are more qualified as compared to the old employees. This leads
to Conflicts and ego issues among the employees
2.54
In case of equally experienced employees, seniority is given more weightage during the
performance appraisal process
3.85
Generation gap & ego issues does not lead to conflicts between freshers & experienced
people
4.10
Freshers are not involved in the decision making & problem solving process 3.90
Highly experienced employees do not feel a sense of insecurity if the freshers and
middle experienced employees are extremely talented
3.69
Employees from all the religions are involved in decision making process 3.55
Religion is not given consideration during the performance appraisal process 3.73
Employees are treated in a fair & equal manner irrespective of their religion 3.39
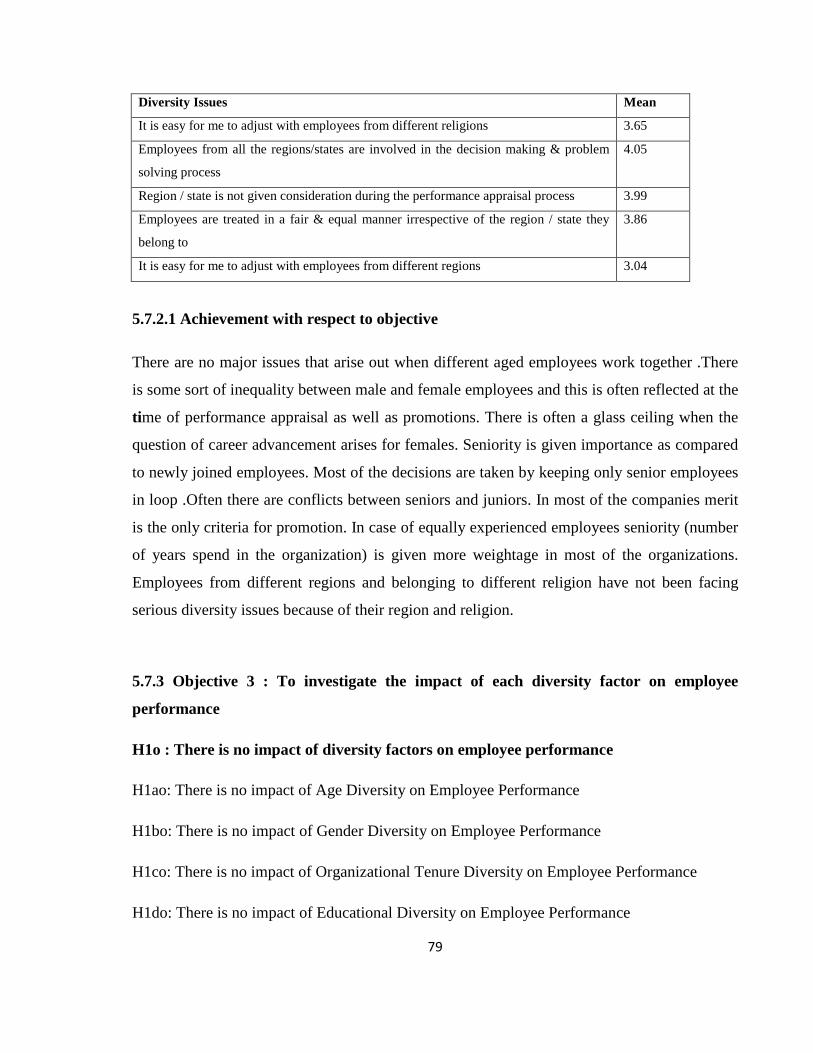
79
Diversity Issues Mean
It is easy for me to adjust with employees from different religions 3.65
Employees from all the regions/states are involved in the decision making & problem
solving process
4.05
Region / state is not given consideration during the performance appraisal process 3.99
Employees are treated in a fair & equal manner irrespective of the region / state they
belong to
3.86
It is easy for me to adjust with employees from different regions 3.04
5.7.2.1 Achievement with respect to objective
There are no major issues that arise out when different aged employees work together .There
is some sort of inequality between male and female employees and this is often reflected at the
time of performance appraisal as well as promotions. There is often a glass ceiling when the
question of career advancement arises for females. Seniority is given importance as compared
to newly joined employees. Most of the decisions are taken by keeping only senior employees
in loop .Often there are conflicts between seniors and juniors. In most of the companies merit
is the only criteria for promotion. In case of equally experienced employees seniority (number
of years spend in the organization) is given more weightage in most of the organizations.
Employees from different regions and belonging to different religion have not been facing
serious diversity issues because of their region and religion.
5.7.3 Objective 3 : To investigate the impact of each diversity factor on employee
performance
H1o : There is no impact of diversity factors on employee performance
H1ao: There is no impact of Age Diversity on Employee Performance
H1bo: There is no impact of Gender Diversity on Employee Performance
H1co: There is no impact of Organizational Tenure Diversity on Employee Performance
H1do: There is no impact of Educational Diversity on Employee Performance

80
H1eo: There is no impact of Work Experience Diversity on Employee Performance
H1fo: There is no impact of Religion Diversity on Employee Performance
H1go: There is no impact of Regional Diversity on Employee Performance
As mentioned in the objective 1, Factors identified are Age Diversity, Gender Diversity,
Organizational Tenure Diversity, Educational Diversity, Work Experience Diversity , Religion
Diversity, Regional Diversity & Employee Performance. Inorder to measure the impact of
workforce diversity on employee performance, SEM needs to be used. But before using SEM
it was very much necessary to validate the factor structure created through EFA. And in order
to validate the factor structure i.e. measuring the relationship between various factors and
check whether all the factors fit together in a model or not, Confirmatory factor analysis was
used. Once the factor structure was confirmed using CFA, the next step was to use SEM and
test the hypothesis to measure the impact of workforce diversity factors on employee
performance
The detailed analysis is as below
5.7.3.1Confirmatory Factor Analysis
Standardized factor loading has been used by calculating standardized regression weights.
A ) Standardized factor loading
TABLE 5. 14 Standardized Regression Weights: (Group number 1 - Default model)
Estimate
AG4 <--- AG .904
AG3 <--- AG .880
AG5 <--- AG .828
AG2 <--- AG .886
AG1 <--- AG .808
AG6 <--- AG .744
OT6 <--- OT .801

81
Estimate
OT5 <--- OT .778
OT2 <--- OT .863
OT3 <--- OT .771
OT4 <--- OT .781
OT7 <--- OT .678
OT1 <--- OT .686
RL2 <--- RL .882
RL4 <--- RL .885
RL3 <--- RL .852
RL5 <--- RL .787
RL6 <--- RL .757
RL1 <--- RL .770
EP3 <--- EP .897
EP2 <--- EP .881
EP4 <--- EP .714
EP5 <--- EP .801
EP1 <--- EP .706
GN3 <--- GN .902
GN5 <--- GN .860
GN4 <--- GN .867
GN2 <--- GN .854
GN1 <--- GN .800
RG5 <--- RG .651
RG6 <--- RG .711
RG2 <--- RG .760
RG4 <--- RG .733
RG3 <--- RG .732
RG1 <--- RG .615
WE3 <--- WE .749
WE2 <--- WE .700
WE1 <--- WE .682
WE4 <--- WE .803

82
Estimate
WE5 <--- WE .597
ED2 <--- ED .797
ED1 <--- ED .723
ED3 <--- ED .675
If the standard loading is greater than 0.6, than the data is suitable for factor analysis. In table
5.14, all the values are above 0.6 and thus the data is suitable for factor analysis. In case the
above condition is not fulfilled, modification indices should be used to draw arrows and
improve results.
Now we conduct the validity and reliability check for the data.
5.7.3.2 Validity & Reliability Check
TABLE 5. 15
Alpha CR AVE
AG 0.941 0.936 0.711
GN 0.93 0.933 0.735
ED 0.774 0.777 0.538
EP 0.896 0.900 0.646
OT 0.913 0.909 0.589
RG 0.867 0.853 0.493
RL 0.927 0.927 0.679
WE 0.84 0.834 0.503
If Correlation ( CR ) is greater than 0.7 and Average variance extracted ( AVE ) is greater than
0.5 ,then the data is reliable and valid.
The CR and AVE values in Table 5.15, fulfills the mentioned condition and so the above data
is reliable and valid.

83
FIGURE 5 .9
After conducting CFA the factors structure was confirmed and it was proved that there exists a
relationship between various factors and that all the factors can together fit in one model.The
next step was to conduct SEM.

84
5.7.3.3 Structural Equation Modeling
TABLE 5 .16 Model fit for CFA and SEM
Model Fit
CFA model SEM Model
CMIN/DF Below 3 2.04 2.523
SRMR 0.05 or less 0.0372 0.0427
GFI Close to 0 to 1 0.888 0.944
AGFI Greater than 0.80 0.87 0.889
CFI ≥ 0.95 0.954 0.948
RMSEA < .08 0.042 0.036
The recommended approach to judging the adequacy of a model is to use several fit indices .A
model can be considered to have adequate fit if most or all fit indices are acceptable. The
adequacy of the models was assessed by the following indices: CMIN/DF , SRMR , GFI , AGFI ,
CFI , RMSEA
CMIN/DF - Kline (1998) says value 3 or less is acceptable and indicates a good fit
SRMR - Values for the SRMR range from 0 to 1.0 with well fitting models obtaining values less
than 0 .05 (Byrne,1998; Diamantopoulos and Siguaw, 2000)
GFI - Traditionally an omnibus cut-off point of 0.90 has been recommended for the GFI
(Miles and Shevlin, 1998). Values ranging from 0 to 1 indicate a good fit and scores greater
than 0.90 are considered representative of a good fit model ( Hu & Bentler ,1995; Jaccard &
Wan ,1996; Kline , 1998 )
AGFI – Threshhold for AGFI indice is above 0.80 ( Chin and Todd ,1995,Segars and Grover
,1993 )
CFI - A cut-off criterion of CFI ≥ 0.90 was initially advanced however, recent studies have
shown that a value greater than 0.90 is needed in order to ensure that misspecified models are

85
not accepted(Hu and Bentler, 1999). From this, a value of CFI ≥ 0.95 is presently indicates a
good fit (Hu and Bentler, 1999).
RMSEA – RMSEA value of 0.08 or less is indicative of a good fit ( Dilalla, 2000;Jaccard &
Wan,1996 )
FIGURE 5.10

86
TABLE 5 .17 Summary of Hypothesis Testing Objective 3
Hypothesis P-Value Result Findings
H1ao: There is no impact of Age
Diversity on Employee Performance
*** Rejected Results depict P Value which is less than 0.05
which proves that null hypothesis is rejected
and alternate hypothesis is accepted , So here
there is an impact of Age diversity on
employee performance
H1bo: There is no impact of Gender
Diversity on Employee Performance
0.08 Accepted Results depict P Value which is more than
0.05 which proves that null hypothesis is
accepted and alternate hypothesis is rejected ,
So here there is no impact of Gender diversity
on employee performance
H1co: There is no impact of
Organizational Tenure Diversity on
Employee Performance
*** Rejected Results depict P Value which is less than 0.05
which proves that null hypothesis is rejected
and alternate hypothesis is accepted , So here
there is an impact of Organizational Tenure
diversity on employee performance
H1do: There is no impact of
Educational Diversity on Employee
Performance
***
Rejected
Results depict P Value which is less than 0.05
which proves that null hypothesis is rejected
and alternate hypothesis is accepted , So here
there is an impact of Educational diversity on
employee performance
H1eo: There is no impact of Work
Experience Diversity on Employee
Performance
***
Rejected
Results depict P Value which is less than 0.05
which proves that null hypothesis is rejected
and alternate hypothesis is accepted , So here
there is an impact of work experience
diversity on employee performance
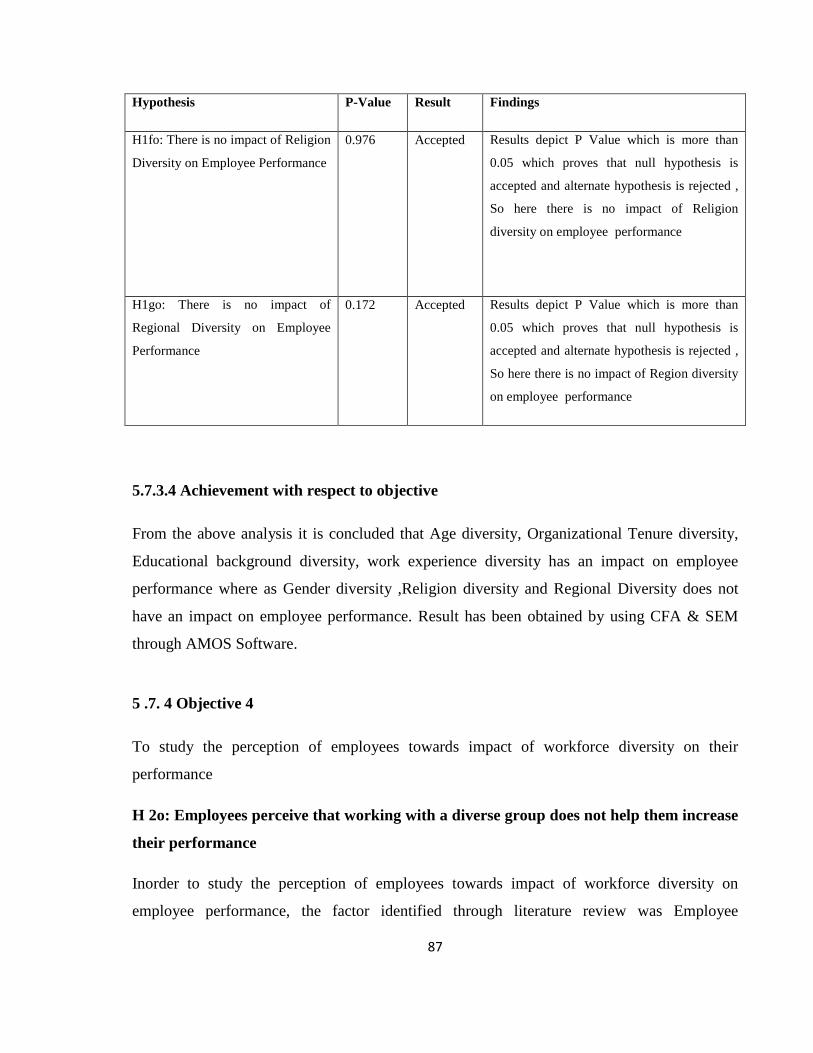
87
Hypothesis P-Value Result Findings
H1fo: There is no impact of Religion
Diversity on Employee Performance
0.976
Accepted
Results depict P Value which is more than
0.05 which proves that null hypothesis is
accepted and alternate hypothesis is rejected ,
So here there is no impact of Religion
diversity on employee performance
H1go: There is no impact of
Regional Diversity on Employee
Performance
0.172
Accepted
Results depict P Value which is more than
0.05 which proves that null hypothesis is
accepted and alternate hypothesis is rejected ,
So here there is no impact of Region diversity
on employee performance
5.7.3.4 Achievement with respect to objective
From the above analysis it is concluded that Age diversity, Organizational Tenure diversity,
Educational background diversity, work experience diversity has an impact on employee
performance where as Gender diversity ,Religion diversity and Regional Diversity does not
have an impact on employee performance. Result has been obtained by using CFA & SEM
through AMOS Software.
5 .7. 4 Objective 4
To study the perception of employees towards impact of workforce diversity on their
performance
H 2o: Employees perceive that working with a diverse group does not help them increase
their performance
Inorder to study the perception of employees towards impact of workforce diversity on
employee performance, the factor identified through literature review was Employee

88
Perception and the variables under the factor were also derived through Literature review and
expert opinion. A conceptual framework was ready, but inorder to prove the statistical
relationship between the factor and the variables and to check whether the variables identified
are useful to measure the factor or not, EFA was conducted. .Now, in order to study the
perception of employees towards impact of workforce diversity on their performance, SEM
needs to be used. But before using SEM , it was very much necessary to validate the factor
structure created through EFA . And inorder to validate the factor structure i.e. measuring the
relationship between various factors and check whether all the factors fit together in a model
or not, Confirmatory factor analysis was used. Once the factor structure was confirmed using
CFA, the next step was to use SEM and test the hypothesis and study the perception of
employees towards impact of workforce diversity on their performance
Detailed analysis is as below
5 .7. 4.1 Exploratory Factor Analysis
The following tests are used under EFA
A ) KMO and Bartlett’s test
B ) Communalities
C ) Total variance explained
D ) Pattern Matrix
Once the tests are run Data Adequacy Validity and Reliability are checked
A ) KMO and Bartlett’s test
TABLE : 5.18 KMO and Bartlett's Test
Kaiser-Meyer-Olkin Measure of Sampling Adequacy. .909
Bartlett's Test of Sphericity
Approx. Chi-Square 5510.143
Df 66
Sig. .000

89
In table 5.18, KMO value is 0.909 which shows that the data is perfectly suitable for Factor
Analysis. And Bartlett’s value is 0.000 which shows that the data is multivariate normal and
acceptable for data analysis.
B ) Communalities TABLE 5 .19 Communalities
Initial Extraction
EP1 .476 .483
EP2 .686 .730
EP3 .739 .849
EP4 .572 .541
EP5 .629 .613
AGP .563 .561
EDP .725 .749
GNP .724 .745
OTP .694 .699
RGP .743 .729
RLP .711 .678
WEP .674 .701
If extraction value of any variable is less than 0.2, then there may be a problem in the data. (
Child, 2006)
But as per table 5.19, all the values are more than 0.2 so the data is suited for factor analysis.

90
C ) Total variance explained
TABLE 5. 20 Total Variance Explained
Factor Initial Eigenvalues Extraction Sums of Squared Loadings Rotation Sums
of Squared
Loadingsa
Total % of
Variance
Cumulat
ive %
Total % of Variance Cumulative % Total
1 6.203 51.689 51.689 5.881 49.005 49.005 5.411
2 2.515 20.960 72.648 2.198 18.319 67.324 4.049
3 .640 5.337 77.985
4 .523 4.362 82.347
5 .418 3.480 85.827
6 .343 2.860 88.687
7 .303 2.521 91.208
8 .277 2.306 93.514
9 .230 1.916 95.430
10 .205 1.709 97.139
11 .184 1.531 98.670
12 .160 1.330 100.000
All the factors in Table 5.20 accounted for 67.324% of the variance. Total variance explained
(67.324 % ) exceeds the 60 % threshold commonly used in social sciences.( Hair, 2006 )
D ) Pattern Matrix
TABLE 5. 21 Pattern
Matrixa
Factor
1 2
GNP .873
WEP .864
RGP .863

91
Factor
1 2
EDP .858
RLP .822
OTP .790
AGP .724
EP3 .958
EP2 .865
EP5 .743
EP4 .727
EP1 .662
The extraction technique used over here is Maximum Likelihood method available in SPSS.
Pattern Matrix should not have any cross loading. As per Table 5.21, there is no cross loading
in pattern matrix and we have reached to a clean pattern matrix. Hence the data is suitable for
factor analysis.
5 .7. 4.2 Data Adequacy
Inorder to check whether the data is adequate to use or not, we take a look at the pattern
matrix
For data to be adequate ,Either each value in the pattern matrix should be greater than 0.5 or
average of each factor should be greater than 0.7.
As per the above pattern matrix ( Table 5.21 ) all the values are greater than 0.5 and so the
data is adequate.
5 .7. 4.3 Converge Validity
The items that are indicators of a specific construct should converge or share a high proportion
of variance in common is known as Convergent Validity (Hair, 2006). Anderson and Gerbing,

92
(1991) advocate that inorder to test convergent validity it has to be determined whether the
items in a scale converge or load together on a single construct in the measurement model.
If loading in the pattern matrix is greater than 0.5 on each factor, there is a converge validity.
( Hair, 2006 ).As per the pattern matrix above ( Table 5.21 ) , all the values are greater than
0.3, so there is a converge validity in the data.
5 .7. 4.4 Discriminant validity
Discriminant validity shows that the measure is unique in some way. Discriminant validity
gauges the extent to which measures of two different constructs are comparatively different
from each other. (Campbell and Fiske, 1959). Discriminant validity assesses the degree to
which a concept and its indicators differ from another concept and its indicators. It means that
items from one scale should not load or converge too closely with items from a different scale
and that different latent variables which correlate too highly may indeed be measuring the
same construct rather than different constructs (Garver and Mentzer,1999).
TABLE 5. 22
Factor CorrelationMatrix
Factor 1 2
1 1.000 .409
2 .409 1.000
The extraction technique used over here is Maximum Likelihood method available in SPSS.
Rotation method used is PROMAX with Kaiser Normalization
If there is no cross loading of variables on factors in pattern matrix and if all the values in
correlation matrix are less than 0.7, then there is Discriminant validity.
Table 5.22 fulfills the mentioned conditions which proves that the data has Discriminant
Validity

93
5 .7. 4.5 Reliability using Cronbach’s alpha, validity
TABLE 5 . 23 Alpha
Perception 0.939
Employee
Performance 0.896
If Cronbach’s alpha is greater than 0.7 , the data is reliable and valid.
By using EFA a factor has been derived from a similar set of variables. Thereafter CFA was
used to validate the factor structure .As per Table 5.23, Cronbach’s Alpha is greater than 0.7
and hence the data is reliable and valid.
5 .7. 4.6 Confirmatory Factor Analysis
A ) Standardized factor loading
TABLE 5 . 24
Standardized Regression Weights: (Group number 1 - Default model)
Estimate
GNP <--- PC .877
WEP <--- PC .792
RGP <--- PC .790
EDP <--- PC .884
RLP <--- PC .754
OTP <--- PC .860
AGP <--- PC .766
EP3 <--- EP .892
EP2 <--- EP .886
EP5 <--- EP .801

94
Estimate
EP4 <--- EP .711
EP1 <--- EP .695
Statistical rules states that if the standard loading is greater than 0.6, than the data is suitable
for factor analysis. In Table 5.24, all the values are above 0.6 and thus the data is suitable for
factor analysis. In case the above condition is not fulfilled, modification indices should be
used to draw arrows and improve results.
Now we conduct the validity and reliability check for the data.
B ) Validity & Reliability Check
TABLE 5 . 25 Alpha CR AVE
Perception 0.939 0.934 0.671
Employee
Performance 0.896
0.899 0.642
If Correlation ( CR ) is greater than 0.7 and Average variance extracted ( AVE ) is greater than
0.5 then the data is reliable and valid.
The CR and AVE values in Table 5.25, fulfills the mentioned condition and so the above data
is reliable and valid.

95
FIGURE 5 .11
Once the factor was derived through EFA and factor structure was validated through CFA
SEM was used in order to address objective 4. i.e. To study the perception of employees
towards impact of workforce diversity on employee performance.
5 .7. 4.7 Structural Equation Modeling
TABLE 5 . 26 Model Fit for Perception-EP Model
CFA model SEM Model
CMIN/DF Below 3 2.438 1.819
SRMR 0.05 or less 0.0346 0.0346
GFI Close to 0 to 1 0.972 0.959
AGFI Greater than 0.80 0.948 0.925
CFI ≥ 0.95 0.989 0.987
RMSEA < .08 0.049 0.026

96
The recommended approach to judging the adequacy of a model is to use several fit indices .A
model can be considered to have adequate fit if most or all fit indices are acceptable. The
adequacy of the models was assessed by the following indices: CMIN/DF , SRMR , GFI , AGFI ,
CFI , RMSEA
CMIN/DF - Kline (1998) says value 3 or less is acceptable and indicative of good fit
SRMR - Values for the SRMR range from 0 to 1.0 with well fitting models obtaining values less
than 0 .05 (Byrne,1998; Diamantopoulos and Siguaw, 2000)
GFI - Traditionally an omnibus cut-off point of 0.90 has been recommended for the GFI
(Miles and Shevlin, 1998). Values ranging from 0 to 1 indicate a good fit and scores greater
than 0.90 are considered representative of a good fitting model ( Hu & Bentler ,1995;Jaccard
& Wan ,1996; Kline , 1998 )
AGFI – Threshhold for AGFI indice is above 0.80 ( Chin and Todd ,1995,Segars and Grover
,1993 )
CFI - A cut-off criterion of CFI ≥ 0.90 was initially advanced however, recent studies have
shown that a value greater than0.90 is needed in order to ensure that misspecified models are
not accepted(Hu and Bentler, 1999). From this, a value of CFI ≥ 0.95 is presently recognised
as indicative of good fit (Hu and Bentler, 1999).
RMSEA – RMSEA value of 0.08 or less is indicative of a good fit ( Dilalla, 2000;Jaccard &
Wan,1996 )

97
FIGURE 5 .12

98
5 .7. 4.8 Achievement with respect to objective
From the above analysis, it can be concluded that employees perceive that working with a
diverse work group helps them increase their performance. The result has been obtained by
using EFA through SPSS software and CFA & SEM through AMOS Software
5 .7. 5 Objective 5 : To carry out an inter industry comparison & there by study the impact of
each factor on employee performance in that particular industry
Industry wise impact of Diversity Factors on Employee performance
TABLE 5 . 28 Telecom Industry
Telecom Industry
Hypothesis P Value Result Findings
H1ao: There is no impact of Age
Diversity on Employee Performance 0.439 Accepted
Results depict P Value which is more than 0.05 which
proves that null hypothesis is accepted and alternate
hypothesis is rejected , So here there is no impact of
Age diversity on employee performance
H1bo: There is no impact of Gender
Diversity on Employee Performance
0.07
Accepted
Results depict P Value which is more than 0.05 which
proves that null hypothesis is accepted and alternate
hypothesis is rejected , So here there is no impact of
Gender diversity on employee performance
TABLE 5 . 27 Summary of Hypothesis Testing Objective 4
Hypothesis P-Value Result Findings
H2o :Employees perceive
that working with a diverse
group does not help them
increase their performance *** Rejected
Results depict P Value which is less than 0.05 which
proves that null hypothesis is rejected and alternate
hypothesis is accepted , So here the employees perceive
that working with a diverse work group helps them
increase their performance

99
Hypothesis P Value Result Findings
H1co: There is no impact of
Organizational Tenure Diversity on
Employee Performance 0.67 Accepted
Results depict P Value which is more than 0.05 which
proves that null hypothesis is accepted and alternate
hypothesis is rejected , So here there is no impact of
Gender diversity on employee performance
H1do: There is no impact of
Educational Diversity on Employee
Performance 0.008 Rejected
Results depict P Value which is less than 0.05 which
proves that null hypothesis is rejected and alternate
hypothesis is accepted , So here there is an impact of
Educational diversity on employee performance
H1eo: There is no impact of Work
Experience Diversity on Employee
Performance *** Rejected
Results depict P Value which is less than 0.05 which
proves that null hypothesis is rejected and alternate
hypothesis is accepted , So here there is an impact of
work experience diversity on employee performance
H1fo: There is no impact of
Religion Diversity on Employee
Performance 0.622 Accepted
Results depict P Value which is more than 0.05 which
proves that null hypothesis is accepted and alternate
hypothesis is rejected , So here there is no impact of
Religion diversity on employee performance
H1go: There is no impact of
Regional Diversity on Employee
Performance
0.069 Accepted
Results depict P Value which is more than 0.05 which
proves that null hypothesis is accepted and alternate
hypothesis is rejected , So here there is no impact of
Regional diversity on employee performance

100
TABLE 5 . 29 IT Industry
IT Industry
Hypothesis P Value Result Findings
H1ao: There is no impact of
Age Diversity on Employee
Performance
***
Rejected
Results depict P Value which is less than 0.05 which
proves that null hypothesis is rejected and alternate
hypothesis is accepted , So here there is an impact of
Age diversity on employee performance
H1bo: There is no impact of
Gender Diversity on
Employee Performance
0.093
Accepted
Results depict P Value which is more than 0.05 which
proves that null hypothesis is accepted and alternate
hypothesis is rejected , So here there is no impact of
Gender diversity on employee performance
H1co: There is no impact of
Organizational Tenure
Diversity on Employee
Performance
***
Rejected
Results depict P Value which is less than 0.05 which
proves that null hypothesis is rejected and alternate
hypothesis is accepted , So here there is an impact of
Organizational Tenure diversity on employee
performance
H1do: There is no impact of
Educational Diversity on
Employee Performance
0.04
Rejected
Results depict P Value which is less than 0.05 which
proves that null hypothesis is rejected and alternate
hypothesis is accepted , So here there is an impact of
Educational diversity on employee performance
H1eo: There is no impact of
Work Experience Diversity
on Employee Performance
***
Rejected
Results depict P Value which is less than 0.05 which
proves that null hypothesis is rejected and alternate
hypothesis is accepted , So here there is an impact of
work experience diversity on employee performance

101
Hypothesis P Value Result Findings
H1fo: There is no impact of
Religion Diversity on
Employee Performance 0.414
Accepted
Results depict P Value which is more than 0.05 which
proves that null hypothesis is accepted and alternate
hypothesis is rejected , So here there is no impact of
Religion diversity on employee performance
H1go: There is no impact of
Regional Diversity on
Employee Performance
0.074
Accepted
Results depict P Value which is more than 0.05 which
proves that null hypothesis is accepted and alternate
hypothesis is rejected , So here there is no impact of
Regional diversity on employee performance
TABLE 5 . 30 FMCG Industry
FMCG Industry
Hypothesis P Value Result Findings
H1ao: There is no impact of
Age Diversity on Employee
Performance
0.032
Rejected
Results depict P Value which is less than 0.05
which proves that null hypothesis is rejected and
alternate hypothesis is accepted , So here there is
an impact of Age diversity on employee
performance
H1bo: There is no impact of
Gender Diversity on
Employee Performance
0.228
Accepted
Results depict P Value which is more than 0.05
which proves that null hypothesis is accepted and
alternate hypothesis is rejected , So here there is
no impact of Gender diversity on employee
performance

102
Hypothesis P Value Result Findings
H1co: There is no impact of
Organizational Tenure
Diversity on Employee
Performance
0.026
Rejected
Results depict P Value which is less than 0.05
which proves that null hypothesis is rejected and
alternate hypothesis is accepted , So here there is
an impact of Organizational tenure diversity on
employee performance
H1do: There is no impact of
Educational Diversity on
Employee Performance
***
Rejected
Results depict P Value which is less than 0.05
which proves that null hypothesis is rejected and
alternate hypothesis is accepted , So here there is
an impact of educational diversity on employee
performance
H1eo: There is no impact of
Work Experience Diversity
on Employee Performance
***
Rejected
Results depict P Value which is less than 0.05
which proves that null hypothesis is rejected and
alternate hypothesis is accepted , So here there is
an impact of work experience diversity on
employee performance
H1fo: There is no impact of
Religion Diversity on
Employee Performance
0.365
Accepted
Results depict P Value which is more than 0.05
which proves that null hypothesis is accepted and
alternate hypothesis is rejected , So here there is
no impact of Religion diversity on employee
performance
H1go: There is no impact of
Regional Diversity on
Employee Performance
0.998
Accepted
Results depict P Value which is more than 0.05
which proves that null hypothesis is accepted and
alternate hypothesis is rejected , So here there is
no impact of regional diversity on employee
performance
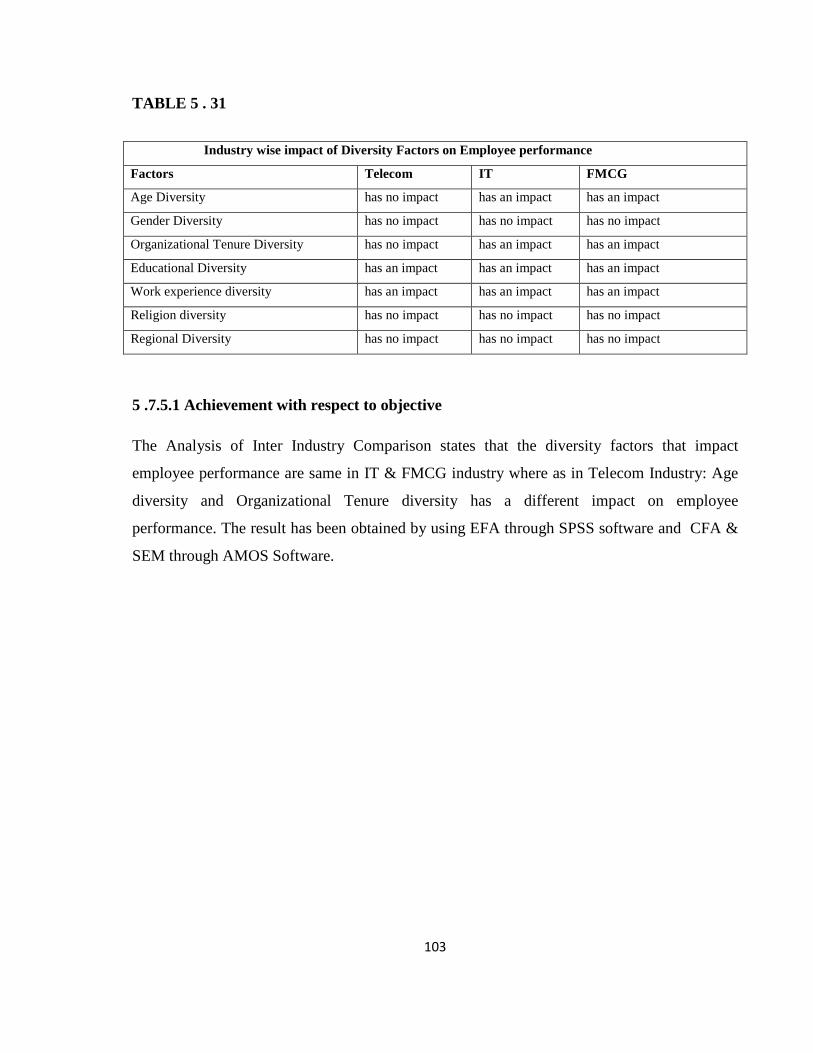
103
TABLE 5 . 31
5 .7.5.1 Achievement with respect to objective
The Analysis of Inter Industry Comparison states that the diversity factors that impact
employee performance are same in IT & FMCG industry where as in Telecom Industry: Age
diversity and Organizational Tenure diversity has a different impact on employee
performance. The result has been obtained by using EFA through SPSS software and CFA &
SEM through AMOS Software.
Industry wise impact of Diversity Factors on Employee performance
Factors Telecom IT FMCG
Age Diversity has no impact has an impact has an impact
Gender Diversity has no impact has no impact has no impact
Organizational Tenure Diversity has no impact has an impact has an impact
Educational Diversity has an impact has an impact has an impact
Work experience diversity has an impact has an impact has an impact
Religion diversity has no impact has no impact has no impact
Regional Diversity has no impact has no impact has no impact

104
CHAPTER 6
FINDINGS
6. 1 Introduction
This chapter summarizes the research procedure and presents a background of the research.
The findings discussed in this chapter are in the context of the five research objectives
established for the study. The findings are drawn based on the statistical analysis performed in
the previous chapter of data analysis
Primary and Secondary data has been used to derive objectives by applying appropriate
research methodology as described in Chapter 4.
6. 2 Data Source
Secondary data for the study are collected from various online data base journals, magazines,
newspapers and books available in the library.
Primary data was collected through interview from experts ( Industry experts and
academicians ) and survey was conducted by administrating questionnaire. The expert
interview were taken by personal visits to the organizations and questionnaire survey was
conducted online as well as by personal visits in some of the organizations. Online survey was
conducted in order to meet wider geographical reach. The response was recorded and
measured by using Nominal Scale and Likert Scale.
6. 3 Data Preparation
Data preparation was first checked preliminary to testify its completeness. The collected data
was then edited, coded, tabulated, grouped and organized according to the requirement of the

105
study and then it was tabulated into SPSS (statistical package for social sciences) and AMOS (
Analysis of Moment Structure ) for analysis.
6. 4 Analysis and Interpretation of Data
Data analysis was done by using SPSS and AMOS software. SPSS software was used to
conduct frequency distribution & Exploratory factor analysis and confirmatory factor analysis
and Structural equation modeling was conducted by using AMOS software.
6. 5 Findings of Research Objective 1
6. 5. 1 Research Objective: To identify the factors of workforce diversity that may affect
employee performance
6. 5. 2 Explanation:
Based on Literature Review and Expert Interviews, factors were identified under workforce
diversity and also set of statements were identified to measure each factor . The identification
was done conceptually. The scale was purified through reliability analysis.Once the same was
done data was collected which was followed by Data Analysis. After the conceptual
framework of factors and variables from Literature Review and Expert opinion, it was very
much necessary to validate the same by measuring statistical relationship between the factors
and the variables. It was also important to check whether the variables identified under each
factor are useful to measure that particuar factor or not. And inorder to do so , Exploratory
Factor Analysis was conducted.Here Kaiser-Meyer-Olkin (KMO) and Bartlett’s Test of
Sphericity, Communalities, Total variance explained and Pattern matrix was used in order to
measure the statistical relationship between factors and variables. The results obtained by
conducting EFA proved that there is a statistical relationship between the factors and variables
and that the variables are useful to measure their respective factors.
6. 5. 3 Findings: The factors identified were Age diversity, Gender diversity, Organizational
Tenure diversity, Educational background diversity, Work Experience diversity , Religion

106
Diversity & Regional Diversity. The impact of these diversity factors had to be measured on
employee performance and so one more factor identified was Employee Performance.
6. 6 Findings of Research Objective 2
6. 6. 1 Research Objective 2 : To study the diversity issues of each factor within the
organization
6. 6. 2 Explanation: Companies now a days are investing a lot on recruiting a diverse
workforce but it is very much necessary to manage this diverse workforce in an effective way
as there are many issues that arise when people from different backgrounds work together
Diversity in the current research focuses on Age diversity, Gender diversity, Organizational
Tenure diversity , Educational Background diversity, Work Experience diversity , Religion
diversity and Regional diversity. When a diverse group works together it may lead to both
positive as well as negative effect and so inorder to avoid negative effects they have to be
managed properly. There are lot of issues that may arise because of these diverse pool of
candidates working together. To understand the employees view on this, the issues were
incorporated in the questionnaire and view point on the same was collected by conducting a
survey through questionnaire.
Mean calculation was done through SPSS software inorder to analyse the responses of the
employees and address the above objective.
6. 6. 3 Findings
There are no major issues that arise out when different aged employees work together. There
is some sort of inequality between male and female employees and this is often reflected at the
time of performance appraisal as well as promotions. There is often a glass ceiling when the
question of career advancement arises for females. Seniority is given importance as compared
to newly joined employees. Most of the decisions are taken by keeping only senior employees
in loop .Often there are conflicts between seniors and juniors. In most of the companies merit
is the only criteria for promotion .In case of equally experienced employees seniority (number

107
of years spend in the organization) is given more weightage in most of the organizations.
Employees from different regions and belonging to different religion have not been facing
serious diversity issues because of their region and religion.
6. 7 Findings of Research Objective 3
6. 7. 1 Research Objective 3 : To investigate the impact of each diversity factor on
employee performance
6. 7. 2 Explanation: Inorder to address the above mentioned objective, Confirmatory factor
analysis and Structural equation modeling was used. Once the statistical relationship between
the factors and the variables was confirmed and it was proved that the variables under each
factor are useful to measure that particular factor as mentioned in the objective 1 , it was now
necessary to validate the factor structure created through EFA. And in order to validate the
factor structure i.e. measuring the relationship between various factors and check whether all
the factors fit together in a model or not, Confirmatory factor analysis was used. Once the
factor structure was confirmed using CFA, the next step was to use SEM and test the
hypothesis to measure the impact of workforce diversity factors on employee performance
While conducting confirmatory factor analysis, Standardized factor loading was used by
calculating regression weights. Then after validity and reliability of the data was checked.
For the final stage which focused toward the achievement of the objective, SEM was used to
test the hypothesis about relations among the observed and latent variables. Assessing whether
the specific model ‘fits ‘ the data is one of the most important steps in SEM. The indices used
to reflect the facet of model fit are CMIN / DF , SRMR,GFI, AGFI, CFI, RMSEA.SEM
helped in investigating the impact of workforce diversity on employee performance.
The summary of the same is as below:

108
TABLE 6.1 Hypothesis P-Value Result Findings
H1ao: There is no impact of Age
Diversity on Employee Performance
*** Rejected Results depict P Value which is less than 0.05
which proves that null hypothesis is rejected
and alternate hypothesis is accepted , So here
there is an impact of Age diversity on
employee performance
H1bo: There is no impact of Gender
Diversity on Employee Performance
0.08 Accepted Results depict P Value which is more than
0.05 which proves that null hypothesis is
accepted and alternate hypothesis is rejected ,
So here there is no impact of Gender diversity
on employee performance
H1co: There is no impact of
Organizational Tenure Diversity on
Employee Performance
*** Rejected Results depict P Value which is less than 0.05
which proves that null hypothesis is rejected
and alternate hypothesis is accepted , So here
there is an impact of Organizational Tenure
diversity on employee performance
H1do: There is no impact of
Educational Diversity on Employee
Performance
***
Rejected
Results depict P Value which is less than 0.05
which proves that null hypothesis is rejected
and alternate hypothesis is accepted , So here
there is an impact of Educational diversity on
employee performance
H1eo: There is no impact of Work
Experience Diversity on Employee
Performance
***
Rejected
Results depict P Value which is less than 0.05
which proves that null hypothesis is rejected
and alternate hypothesis is accepted , So here
there is an impact of work experience
diversity on employee performance

109
Hypothesis P-Value Result Findings
H1fo: There is no impact of Religion
Diversity on Employee Performance
0.976
Accepted
Results depict P Value which is more than
0.05 which proves that null hypothesis is
accepted and alternate hypothesis is rejected ,
So here there is no impact of Religion
diversity on employee performance
H1go: There is no impact of
Regional Diversity on Employee
Performance
0.172
Rejected
Results depict P Value which is more than
0.05 which proves that null hypothesis is
accepted and alternate hypothesis is rejected ,
So here there is no impact of Region diversity
on employee performance
6. 7. 3 Findings:
H1ao: There is no impact of Age Diversity on Employee Performance
Results depict P Value which is less than 0.05 which proves that null hypothesis is rejected
and alternate hypothesis is accepted , So here there is an impact of Age diversity on employee
performance
H1bo: There is no impact of Gender Diversity on Employee Performance
Results depict P Value which is more than 0.05 which proves that null hypothesis is accepted
and alternate hypothesis is rejected , So here there is no impact of Gender diversity on
employee performance
H1co: There is no impact of Organizational Tenure Diversity on Employee Performance
Results depict P Value which is less than 0.05 which proves that null hypothesis is rejected
and alternate hypothesis is accepted , So here there is an impact of Organizational Tenure
diversity on employee performance

110
H1do: There is no impact of Educational Diversity on Employee Performance
Results depict P Value which is less than 0.05 which proves that null hypothesis is rejected
and alternate hypothesis is accepted , So here there is an impact of Educational diversity on
employee performance
H1eo: There is no impact of Work Experience Diversity on Employee Performance
Results depict P Value which is less than 0.05 which proves that null hypothesis is rejected
and alternate hypothesis is accepted , So here there is an impact of work experience diversity
on employee performance
H1fo: There is no impact of Religion Diversity on Employee Performance
Results depict P Value which is more than 0.05 which proves that null hypothesis is accepted
and alternate hypothesis is rejected , So here there is no impact of Religion diversity on
employee performance
H1go: There is no impact of Regional Diversity on Employee Performance
Results depict P Value which is more than 0.05 which proves that null hypothesis is accepted
and alternate hypothesis is rejected , So here there is no impact of Region diversity on
employee performance
So the Overall finding states that Age diversity, Organizational Tenure diversity, Educational
background diversity, work experience diversity has an impact on employee performance
where as Gender diversity, Religion diversity and Regional Diversity does not have an impact
on employee performance.
6. 8 Findings of research objective 4
6.8.1 Research Objective 4: To study the perception of employees towards impact of
workforce diversity on their performance
111
6.8.2 Explanation: In order to address this objective Exploratory factor analysis,
Confirmatory factor analysis, structural equation modeling was used.
Inorder to study the perception of employees towards impact of workforce diversity on
employee performance, the factors and their respective variables were identified through
literature review and expert opinion. A conceptual framework was ready, but inorder to prove
the statistical relationship between the factor and the variables and to check whether the
variables identified are useful to measure the factor or not , EFA was conducted.Now, inorder
to study the perception of employees towards impact of workforce diversity on their
performance, SEM needs to be used. But before using SEM , it was very much necessary to
validate the factor structure created through EFA . And in order to validate the factor structure
i.e. measuring the relationship between various factors and check whether all the factors fit
together in a model or not, Confirmatory factor analysis was used. Once the factor structure
was confirmed using CFA, the next step was to use SEM and test the hypothesis and study the
perception of employees towards impact of workforce diversity on their performance.While
conducting exploratory factor analysis, KMO and Bartlett’s test of sphericity , Communalities,
Total variance & pattern matrix was used. Then after data adequacy , validity and reliability
was checked. While conducting confirmatory factor analysis , Standardized factor loading has
been used by calculating regression weights. Then after validity and reliability of the data has
been checked. For the final stage which focused towards the achievement of the objective
SEM was used to test the hypothesis about relations among the observed and latent variables.
Assessing whether the specific model ‘fits ‘ the data is one of the most important steps in
SEM. The indices used to reflect the facet of model fit are CMIN / DF , SRMR,GFI, AGFI,
CFI, RMSEA. SEM helped in investigating the perception of employees towards impact of
workforce diversity on employee performance.
The summary of the same is as below :

112
TABLE 6.2 Hypothesis P-Value Result Findings
H2o :Employees perceive that
working with a diverse group does
not help them increase their
performance
*** Rejected Results depict P Value which is less than
0.05 which proves that null hypothesis is
rejected and alternate hypothesis is accepted ,
So here the employees perceive that working
with a diverse work group helps them
increase their performance
6.8.3 Findings :
H2o : Employees perceive that working with a diverse group does not help them increase
their performance
Results depict P Value which is less than 0.05 which proves that null hypothesis is rejected
and alternate hypothesis is accepted, So here the employees perceive that working with a
diverse work group helps them increase their performance
6.9 Findings of Research Objective 5
6.9.1 Research Objective : To carry out an inter industry comparison & there by study the
impact of each factor on employee performance in that particular industry
6.9.2 Explanation: The research has been conducted in IT ,Telecom & FCG industry in the
state of Gujarat. As three industries have been considered for research an attempt has been
made to study the impact of workforce diversity on employee performance in that particular
industry and once the same was done for all the industries an inter industry comparison of the
same was carried out .The result has been obtained by using EFA through SPSS software and
CFA & SEM through AMOS Software.
The summary of the same is as below :

113
Telecom Industry
Hypothesis P Value Result Findings
H1ao: There is no impact of
Age Diversity on Employee
Performance 0.439 Accepted
Results depict P Value which is more than 0.05 which
proves that null hypothesis is accepted and alternate
hypothesis is rejected , So here there is no impact of
Age diversity on employee performance
H1bo: There is no impact of
Gender Diversity on
Employee Performance
0.07 Accepted
Results depict P Value which is more than 0.05 which
proves that null hypothesis is accepted and alternate
hypothesis is rejected , So here there is no impact of
Gender diversity on employee performance
H1co: There is no impact of
Organizational Tenure
Diversity on Employee
Performance 0.67 Accepted
Results depict P Value which is more than 0.05 which
proves that null hypothesis is accepted and alternate
hypothesis is rejected , So here there is no impact of
Gender diversity on employee performance
H1do: There is no impact of
Educational Diversity on
Employee Performance 0.008 Rejected
Results depict P Value which is less than 0.05 which
proves that null hypothesis is rejected and alternate
hypothesis is accepted , So here there is an impact of
Educational diversity on employee performance
H1eo: There is no impact of
Work Experience Diversity
on Employee Performance *** Rejected
Results depict P Value which is less than 0.05 which
proves that null hypothesis is rejected and alternate
hypothesis is accepted , So here there is an impact of
work experience diversity on employee performance
H1fo: There is no impact of
Religion Diversity on
Employee Performance 0.622 Accepted
Results depict P Value which is more than 0.05 which
proves that null hypothesis is accepted and alternate
hypothesis is rejected , So here there is no impact of
Religion diversity on employee performance
H1go: There is no impact of
Regional Diversity on
Employee Performance 0.069 Accepted
Results depict P Value which is more than 0.05 which
proves that null hypothesis is accepted and alternate
hypothesis is rejected , So here there is no impact of
Regional diversity on employee performance
TABLE 6.3

114
A ) Findings - Telecom Industry
In Telecom industry, Educational diversity and Work experience diversity has an impact on
employee performance where as Age diversity, Gender diversity, Organizational tenure
diversity ,Religion diversity and Regional diversity does not have an impact on employee
performance.
TABLE 6.4
IT Industry
Hypothesis P Value Result Findings
H1ao: There is no impact of
Age Diversity on Employee
Performance
***
Rejected
Results depict P Value which is less than 0.05 which
proves that null hypothesis is rejected and alternate
hypothesis is accepted , So here there is an impact of
Age diversity on employee performance
H1bo: There is no impact of
Gender Diversity on
Employee Performance
0.093
Accepted
Results depict P Value which is more than 0.05 which
proves that null hypothesis is accepted and alternate
hypothesis is rejected , So here there is no impact of
Gender diversity on employee performance
H1co: There is no impact of
Organizational Tenure
Diversity on Employee
Performance
***
Rejected
Results depict P Value which is less than 0.05 which
proves that null hypothesis is rejected and alternate
hypothesis is accepted , So here there is an impact of
Organizational Tenure diversity on employee
performance
H1do: There is no impact of
Educational Diversity on
Employee Performance
0.04
Rejected
Results depict P Value which is less than 0.05 which
proves that null hypothesis is rejected and alternate
hypothesis is accepted , So here there is an impact of
Educational diversity on employee performance

115
Hypothesis P Value Result Findings
H1eo: There is no impact of
Work Experience Diversity
on Employee Performance
***
Rejected
Results depict P Value which is less than 0.05 which
proves that null hypothesis is rejected and alternate
hypothesis is accepted , So here there is an impact of
work experience diversity on employee performance
H1fo: There is no impact of
Religion Diversity on
Employee Performance 0.414
Accepted
Results depict P Value which is more than 0.05 which
proves that null hypothesis is accepted and alternate
hypothesis is rejected , So here there is no impact of
Religion diversity on employee performance
H1go: There is no impact of
Regional Diversity on
Employee Performance
0.074
Accepted
Results depict P Value which is more than 0.05 which
proves that null hypothesis is accepted and alternate
hypothesis is rejected , So here there is no impact of
Regional diversity on employee performance
B ) Findings - IT Industry
In IT industry ,Age diversity, organizational tenure diversity, educational diversity and work
experience diversity has an impact on employee perforance where as Gender diversity,
Religion and Regional diversity does not have an impact on employee performance.
TABLE 6.5
FMCG Industry
Factors P Value Result Findings
H1ao: There is no impact
of Age Diversity on
Employee Performance
0.032
Rejected
Results depict P Value which is less than 0.05 which
proves that null hypothesis is rejected and alternate
hypothesis is accepted , So here there is an impact of
Age diversity on employee performance

116
Factors P Value Result Findings
H1bo: There is no impact
of Gender Diversity on
Employee Performance
0.228
Accepted
Results depict P Value which is more than 0.05 which
proves that null hypothesis is accepted and alternate
hypothesis is rejected , So here there is no impact of
Gender diversity on employee performance
H1co: There is no impact
of Organizational Tenure
Diversity on Employee
Performance
0.026
Rejected
Results depict P Value which is less than 0.05 which
proves that null hypothesis is rejected and alternate
hypothesis is accepted , So here there is an impact of
Organizational tenure diversity on employee
performance
H1do: There is no impact
of Educational Diversity
on Employee Performance
***
Rejected
Results depict P Value which is less than 0.05 which
proves that null hypothesis is rejected and alternate
hypothesis is accepted , So here there is an impact of
educational diversity on employee performance
H1eo: There is no impact
of Work Experience
Diversity on Employee
Performance
***
Rejected
Results depict P Value which is less than 0.05 which
proves that null hypothesis is rejected and alternate
hypothesis is accepted , So here there is an impact of
work experience diversity on employee performance
H1fo: There is no impact
of Religion Diversity on
Employee Performance 0.365
Accepted
Results depict P Value which is more than 0.05 which
proves that null hypothesis is accepted and alternate
hypothesis is rejected , So here there is no impact of
Religion diversity on employee performance
H1go: There is no impact
of Regional Diversity on
Employee Performance
0.998
Accepted
Results depict P Value which is more than 0.05 which
proves that null hypothesis is accepted and alternate
hypothesis is rejected , So here there is no impact of
regional diversity on employee performance

117
C ) Findings – FMCG Industry
In FMCG industry, Age diversity, organizational tenure diversity, educational diversity and
work experience diversity has an impact on employee performance where as Gender diversity,
Religion and regional diversity does not have an impact on employee performance.
TABLE 6.6
6.9.3 Over all finding
The Analysis of Inter Industry Comparison states that the diversity factors that impact
employee performance are same in IT & FMCG industry where as in Telecom Industry Age
diversity factor and organizational tenure diversity factor has a different impact on employee
performance.
Industry wise impact of Diversity Factors on Employee performance
Factors Telecom IT FMCG
Age Diversity has no impact has an impact has an impact
Gender Diversity has no impact has no impact has no impact
Organizational Tenure Diversity has no impact has an impact has an impact
Educational Diversity has an impact has an impact has an impact
Work experience diversity has an impact has an impact has an impact
Religion diversity has no impact has no impact has no impact
Regional Diversity has no impact has no impact has no impact

118
CHAPTER 7
CONCLUSION, MAJOR CONTRIBUTIONS AND
SCOPE OF FURTHER WORK
7.1 Conclusion
In the current research an effort was made to study the impact of workforce diversity on
employee performance in IT ,Telecom and FMCG industry in the state of Gujarat.
Through personal observations, primary data analysis and secondary data analysis, the
following things have been concluded.
After conducting extensive literature review & Expert interview, Diversity factors were
identified under workforce diversity and a set of variables were identified to measure each
factor. The scale was purified through reliability analysis and then Exploratory factor analysis
was used through SPSS to measure the statistical relationship between the factors and
variables and create a factor structure. By conducting EFA it was proved that the factors and
variables are related and that the variables are useful to measure their respective factor. The
following factors were identified: Age Diversity, Gender Diversity , Organizational Tenure
Diversity, Educational Background Diversity, Work Experience Diversity , Religion Diversity
& Regional diversity. The impact of these diversity factors had to be measured on employee
performance and so one more factor identified was Employee Performance. Also Employees’
perception towards the impact of workforce diversity on their performance had to be measured
and so Employee Perception was also identified as one of the factors.
Workforce diversity is welcomed today across the organizations and a lot of investment have
been done by the organizations to have a diverse workforce on board. But this does not always
turn out to be a good decision. The organizations sometimes ignores or oversees the issues that

119
arise out of workforce diversity and so the diverse workforce does not give the desired results
and in fact reduces the efficiency of the employee as well as the organization. If the issues
arising out of diversity are handled well, resolved cautiously and if the diverse workforce is
managed properly, then diversity on board will definitely prove to be one of the biggest
strengths of the organization. Inorder to study various diversity issues and understand and
extract the opinion of the same from employees these issues were added in the questionnaire
as variables. After receiving the opinion of the employees on diversity issues and conducting
data analysis through SPSS software by mean calculation it was concluded that there are no
major issues that arise out when different aged employees work together. There is some sort of
inequality between male and female employees and this is often reflected at the time of
performance appraisal as well as promotions. There is often a glass ceiling when the question
of career advancement arises for females. Seniority is given importance as compared to newly
joined employees. Most of the decisions are taken by keeping only senior employees in loop
.Often there are conflicts between seniors and juniors. In most of the companies merit is the
only criteria for promotion. In case of equally experienced employees, seniority (number of
years spend in the organization) is given more weightage in most of the organizations.
Employees from different regions and belonging to different religion have not been facing
serious diversity issues because of their region and religion.
In the above discussion it has been stated that if a diverse pool of employees is managed well
then it will definitely affect the employee’s as well as organization’s performance. And so in
the current research an attempt has been made to measure the impact of workforce diversity on
employee performance and it is being tried to check whether there is a relationship between
workforce diversity and employee performance. Data analysis was conducted by using
Confirmatory factor analysis and SEM. CFA was used to confirm and validate the factor
structure derived using EFA and inorder to study the impact of workforce diversity on
employee performance ,Structural Equation modeling was used. After conducting data
analysis by using the above mentioned statistical tools it was concluded that Age diversity,
Organizational Tenure diversity, Educational background diversity, work experience diversity
has an impact on employee performance where as Gender diversity, Religion diversity and
Regional Diversity does not have an impact on employee performance.

120
There can be a different perception of employees about impact of workforce diversity on their
performance .Whatever has been concluded as a result of data analysis may not be the same as
what the employees perceive about workforce diversity and it’s linkage with
performance.Data analysis was conducted by using EFA, CFA and SEM. A factor of
employee perception and variables to measure the same was derived from literature Review
and Expert opinion & the statistical relationship between the factor and the variables was
confirmed through EFA. The factor structure then created by EFA was validated by
Confirmatory factor analysis and SEM was used to study the perception of employees towards
impact of workforce diversity on their performance .After conducting data analysis by using
the above mentioned statistical tools, it was concluded that employees perceive that working
with a diverse work group helps them increase their performance.
In all, 3 industries: IT ,Telecom and FMCG industry were selected for the study in 4 cities
Ahmedabad ,Baroda, Surat and Rajkot in the state of Gujarat. As multiple industries have been
studied ,an attempt was made to carry out inter industry comparison and study the impact of
each factor on employee performance in that particular industry .After conducting data
analysis and using statistical tools it has been concluded that In Telecom industry
,Educational diversity and Work experience diversity has an impact on employee performance
where as Age diversity, Gender diversity ,Organizational tenure diversity, Religion diversity
and Regional diversity does not have an impact on employee performance where as In IT
industry Age diversity ,organizational tenure diversity ,educational diversity and work
experience diversity has an impact on employee performance where as Gender diversity,
Religion diversity and regional diversity does not have an impact on employee performance.
In FMCG industry, Age diversity , Organizational tenure diversity, educational diversity and
work experience diversity has an impact on employee performance where as Gender diversity,
Religion and regional diversity does not have an impact on employee performance. So here it
can be concluded that the diversity factors that impact employee performance are same in IT
& FMCG industry where as in Telecom Industry, Age diversity, and organizational tenure
diversity has a different impact on employee performance.

121
7 .2 Major Contribution
The research has contributed to the existing body of knowledge pertaining to the factors of
workforce diversity and its impact on employee performance by incorporating new
information and related results by both qualitative and quantitative research. A model has been
created which helps in studying the impact of workforce diversity on employee performance.
With this study the organizations will be able to identify which diversity factors will have an
impact on employee performance in IT ,Telecom and FMCG industry in the state of Gujarat
.Other industries can also gain insights from the results of the current research and can apply
the same in their respective industry. The research will help the organizations especially the
HR departments as to which are the issues that bother employees because of diversity and
what do the employees perceive about the same and also the implementation issues that are
caused because of having a diverse workforce in the organization .The research will help the
organizations to understand and know about the perception of employees towards impact of
workforce diversity on their performance i.e. the preference of the employees towards
working with a diverse workforce.
7.3 Recommendations
While investing on workforce diversity, organizations should also set up mechanisms to
administer and manage a diverse workforce effectively.
Organizations should create an environment that will support workforce diversity positively.
Males and Females should be treated in a fair and equal manner. There should be no gender
bias at the time of performance appraisal or promotions.
Career paths should be exclusively designed for female employees.
Merits and experience of a newly joined employee should be given due importance and his
date of joining in the organization should not be considered as the only criteria at the time of
decision making and problem solving.
There should be no fixed and preconceived notions about Gender, Religion or Region of a
person at the time of recruitment and interviews. Organizations should give an equal chance to
each and every deserving candidate.

122
Age diversity, Organizational tenure diversity , educational background diversity and work
experience diversity has an impact on employee performance and so employees with different
age groups, different organizational tenure, different educational background and different
work experience when work together, have to be provided a healthy and suitable working
environment and their issues and conflicts should be handled properly so that the impact on
their performance turns out to be positive.
Every industry should study as to which diversity is the highest in that particular industry and
try and study it’s impact on employee performance.
7.4 Limitation of the study
Best possible efforts have been made to guarantee that the research is planned and carried out
to optimize the capability to accomplish the research objectives. However there are some
limitations that may not authenticate the research however it needs to be acknowledged.
The sample has been taken from 4 major cities of Gujarat and it may not apply to entire state.
The survey has been restricted to 3 industries (IT , Telecom & FMCG ) and so cannot be
generalized to all the industries.
There may be several other factors that represent workforce diversity and may or may not
have an impact on employee performance and hence the same can be one more limitation of
the study.
Likert scale has been used as a major tool for evaluation which has its own limitations.
The evaluation done for data analysis is based on the primary data produced with the help of
questionnaire and its findings depend completely on the accurateness of such data.
Different experts have special views on estimating attitude and perceptions. The views that
have been used for the current purpose cannot be declared as absolute and perfect.
Respondent’s errors may subsist in the study (Malhotra and Das 2005 ) Respondents may not
be able to fill out the entire questionnaire due to certain reasons.

123
7.5 Scope of Further Work Further studies should apply the study of impact of workforce diversity on employee
performance to other cities within Gujarat and other states also.
More number of factors can be studied as a part of workforce diversity.
Impact of workforce diversity on organizational performance can also be studied as here we
have considered the impact of diversity factors only on employee performance and no other
factor.
An additional research can be done inorder to find out which is the most common diversity
factor across the organizations in a specific industry or multiple industries.
In the current research an attempt has been made to study the impact of workforce diversity on
employee performance but whether the diversity factors are positively or negatively related is
not studied. So a further research can be carried out to find out whether there is a positive or
negative impact of workforce diversity on employee performance
124
CHAPTER 8
REFERENCES
Ali, M., Metz, D. I., & Kulik, P. C. (n.d.). Workforce gender diversity: Is it a source of
competitive advantage ? 21st ANZAM conference.
Ali M. Alghazo, H. M. (2016). The Effects of Workforce Diversity on Employee Performance
at an Oil and Gas Company. American Journal of Business and Society , 1 (3), 148 - 153.
Andrea Garnero, r. R. (2013). The heterogenous effects of workforce diversity on
productivity, wages & profits. IZA
Arslam Ayub, m. S. (2013). Examining factors affecting diveristy in workplace.
Interdisciplinary journal of contemporary research in business , 12.
Anonyms. (2016, Septeber 17). Indextb. Retrieved April 2017, from wwwindextbco:
http://www.indextb.com/news/news.aspx
Anonyms. (2017, Arch). IBEF. Retrieved April 2017, from wwwibeforg:
https://www.ibef.org/industry/fmcg-presentation
Amaram, D. I. (2007). Cultural diversity: Implications for workplace management. Journal of
Diversity Management,2(4), 1-6.
An Gie Yong, S. P. (2013). A beginners guide to factor analysis: Focus on exploratory factor
analysis. Tutorials in Quantitative methods for Pshychology , 9 (2), 79-94.
Anderson, J.C. and Gerbing, D.W. (1991), “Predicting the performance of measures in
aconfirmatory factor analysis with a pre-test assessment of their substantive validities”,Journal
of Applied Psychology, Vol. 76 No. 5, pp. 732-740.
Armstrong .M (2003); Human Resource Management practice 8th Edition London
KoganpageLtd.

125
Aguinis H (2009). Performance Management. 2nd edition, Personeducation, Inc., publishing as
Prentice Hall.
Bollen, K.A. (1990), "Overall Fit in Covariance Structure Models: Two Types of Sample Size
Effects," PsychologicalBulletin, 107 (2), 256-59.
Burns, A. & Bush, R. (2010), Marketing Research, 6th edn. Boston: Pearson.
Byrne, B.M. (1998), Structural Equation Modeling with LISREL, PRELIS and SIMPLIS:
Basic Concepts, Applications and Programming. Mahwah, New Jersey: Lawrence Erlbaum
Associates.
Brown, S. L. (2008). Diversity in the Workplace: A Study of Gender, Race, Age, and Salary
Level. UMI Number: 3297416 by ProQuest Information and Learning Company.
Bentler, P.M. (1990), "Comparative Fit Indexes in Structural Models," Psychological Bulletin,
107 (2), 238-46.
Barney, J., Wright, M., Ketchen, D.J.(2001), “The resource-based view of the firm: Ten years
after 1991”, Journal of Management, Special issue, Vol 27, pp. 625–641
Bassett-Jones, N. (2005), “The paradox of diversity management”, Creativity and Innovation
Management, 14, 169-175.
Cox, T. (n.d.). Workforce diversity and organizational performance.The business case for
eaualit and diversity. (2013). Department for business innovation and skills .
Ceren Ozgen, T. D. (2013). Sorting out the impact of cultural diversity on innovative firms.
Norface Migration .
Child, D. (2006). The essentials of factor analysis. (3rd ed.).New York, NY: Continuum
International Publishing Group.
Child, D. (1990). The essentials of factor analysis, second edition. London: CasselEducational
Limited.
Campbell, D.T. & Fiske, D.W. (1959), “Convergent and discriminant validation by
themultitrait-multimethod matrix”, Psychological Bulletin, Vol. 56, No. 1, pp. 81-105.
126
Chin, W. W. and P. A. Todd (1995) "On the Use, Usefulness, and Ease of Use of Structural
Equation Modeling in MIS Research: A Note of Caution," MIS Quarterly (19) 2 (June), pp.
237-246.
Choi and Rainey (2010) “Managing Diversity in U.S. Federal Agencies: Effects of Diversity
and Diversity Management on Employee Perceptions of Organizational Performance”, Public
Administration Review, Vol 70 (1), pp.109–121.
Cox, T. (1991), “Managing Cultural Diversity: Implications for Organizational
Competitiveness”, Academy of Management, Vol. 5 (3), pp. 45-56.
Dike, P. (2013). The Impact Of workforce diveristy on organizations. Arcada.
Davis M, D. S. (2012). The influence of personality dimensions on organizational
performance. International journal of humanities and social sciences , 17.
Deshwal, M. P., & Choudhary, D. S. (2012). Workforce diversity management: Biggest
challenge for 21ST century managers. International Journal of Multidisciplinary Research , 2
(4).
Dora and Kieth (1998), “Demographic diversity and faultiness: The compositional dynamics
of organizational groups”, Academy of Management Review, Vol 23 (2), pp. 325-340
Diamantopoulos, A. and Siguaw, J.A. (2000), Introducing LISREL. London: Sage
Publications.
Dr Trent Kaufman, D. J. (2015). Employee Performance : WHat causes great work ? Cicero .
DeCoster, J. (1998). Overview of factor analysis. Retrieved March 22, 2012 from
http://www.stat-help .com/notes.html
Diamantopoulos, A. and Siguaw, J.A. (2000), Introducing LISREL. London: Sage
Publications.
Dillala ,L. F. ( 2000 ) . Structural equation modeling : Uses and Issues .In Tinsley ,H . &
Brown ,S. D. ( Eds ) Handbook of applied multivariate statistics and mathematical modeling
( pp.439 – 464 ) San Diego . Acadamic press.

127
Ely, R., and Thomas, D (2001), “Cultural diversity at work: The effects of diversity
perspectives on work group processes
Dobbs, M. F. (1996), “Managing Diversity: Lessons from the Private Sector”, Public
Personnel Management”, 25(3), pp. 351-367
Dwyer, S., Richard, O. C., & Chadwick, K. (2003). Gender diversity in management and firm
performance: The influence of growth orientation and organizational culture. Journal of
Business Research, 56, 1009-1019.
Erasmus. L. J.,( 2007). The Management of Workforce Diversity and the Implications for
Leadership at Financial Asset Services. Business Management, University of Johannesburg
Ehimare, J. (2011). The impact of workforce diversity on organizational effectiveness :
Astudy of a nigerian bank. Annals of the univeristy of petrona , Economics , 93-110.
Field, A. (2009). Discovering Statistics Using SPSS: Introducing Statistical Method (3rd ed.).
Thousand Oaks, CA: SagePublications.
Fan, X., Thompson, B., and Wang, L. (1999), "Effects of Sample Size, Estimation Methods,
and Model Specification on Structural Equation Modeling Fit Indexes," Structural Equation
Modeling, 6 (1), 56-83.
Field, A. (2000). Discovering statistics using spss for windows. London-Thousand Oaks- New
Delhi: Sage publications.
Field, A. (2009). Discovering statistics using SPSS. London: SAGE.
Gupta, R. (2013) Workforce Diversity and Organizational performance.
Gravetter, F., & Wallnau, L. (2014). Essentials of statistics for the behavioral sciences (8th
ed.). Belmont, CA: Wadsworth.
Gorsuch, R.L. (1983). Factor analysis (2nd ed.). Hillside, NJ: Lawrence Erlbaum Associates.

128
Grover, A. (2011, december 29). The telecom market in Gujarat. Retrieved April 2017, from
wwwtelenetin: http://www.tele.net.in/view-point/item/9095-the-telecom-market-in-gujarat-
akshay-grover-vice-president-transaction-advisory-services-ernst--young?format=pdf
Gilbert, G., Veloutsou, C., Goode, M. &Moutinho, L. (2004), “Measuring customer
satisfaction in the fast food industry: a cross-national approach”, Journal of Services
Marketing, Vol. 18 No.5, pp. 371-383.
Gilbert, J. A. and Ivancevich, J. M. (2000). Valuing diversity: a tale of two organizations.
Academy of Management Executive. 14 (1), 93–105.
Garver, M.S. and Mentzer, J.T. (1999), “Logistic research methods: employing
structuralequation modeling to test for construct validity”, Journal of Business Logistics, Vol.
20No.1, pp. 33-57.
Guadagnoli, E., & Velicer, W. F. (1988). Relation to sample size to the stability of component
patterns. Psychological Bulletin, 103 (2), 265-275. doi: 10.1037/0033-2909.103.2.265
Gallego, I., Garcia, I. M., & Rodriguez, L. (2010). The Influence of Gender Diversity on
corporate performance. Spanish Accounting review , 53-88. ( 3 ) - Isabell
Gadget. (n.d.). Benefits and problems of a diversr workplace. Retrieved March 2014, from mr-
gadget.hubpages.com:http://mr-gadget.hubpages.com/hub/Benefits-and-Problems-of-a-
Diverse-Workplace
Gromme, N. (1998), Data processing and analysis, In McDonald, C. and Vangelder, P.(eds).
4th edition, pp.389-416, Amsterdam: ESOMAR.
Greengard, Samuel (2004). “What’s in store for 2004?” Workplace Management, Vol. 82, N0.
13, 34-40.
Henry, O., & Evans, A. J. (2007, July). Critical Review Of Literature On Workforce Diversity.
African Journal of Business Management , 72-76.
Hubbard, E. E. (2005). Mesuring the value andimpact of workforce diversity.
129
Hu, L.T. and Bentler, P.M. (1999), "Cutoff Criteria for Fit Indexes in Covariance Structure
Analysis: Conventional Criteria Versus New Alternatives," Structural Equation Modeling, 6
(1), 1-55.
Hoyle, R. H. (1995). The structural equation modeling approach: Basic concepts and
fundamental issues. In Structural equation modeling: Concepts, issues, and applications, R. H.
Hoyle (editor). Thousand Oaks, CA: Sage Publications, Inc., pp. 1-15.
Hair J.F, Black W.C., Babin B.J., Anderson R.E. and Tatham R.L. (2006), MultivariateData
Analysis (6th ed.), Upper Sadle River, New Jersey: Prentice Hall.
Hammil, G. (2005). Mixing and managing four generations of employees. FDU magazine
onlie .
Hu,L.T. ,& Bentler,P. ( 1995 ) .Evaluating odel fit.In R.H.Hoyle ( ED ) ,Structural Equation
modeling . Concepts, Issues , and APPLICATIONS ( PP.76 – 99 )London sage .
Hansen, Fay (2002). “Truth and myths about work/life balance,” Workforce, Vol. 81, No. 13,
34-39.
Huselid M (1995). The impact of human resource managementpractices on turnover,
productivity, and corporate financialperformance. Acad. Manag. J., 38(3): 635-670.
Hasan, A., Muhammad, A. K., Imran A. (2009). Linkage between Employee‟s Performance
and Relationship Conflict in Banking Scenario. International Journal of Business
Management, 4(7).
IBEF. (2017, March). Retrieved March 2017, from www.ibef.org:
https://www.ibef.org/industry/telecommunications.aspx
Irun Shahzadi, A. J. (2014). Impact of employee motivation on performance. European journal
of Business and management , 6 (23).
Jöreskog, K. and Long, J.S. (1993), "Introduction," in Testing Structural Equation Models,
Kenneth A. Bollen and J. ScottLong, Eds. Newbury Park, CA: Sage.
Jöreskog, K. and Sörbom, D. (1993), LISREL 8: Structural Equation Modeling with the
SIMPLIS Command Language.Chicago, IL: Scientific Software International Inc.

130
Jöreskog, K. and Sörbom, D. (1996), LISREL 8: User’s Reference Guide. Chicago, IL:
Scientific Software International Inc.
Jayne, M. E. A. & Dipboye, R. L. (2004). Leveraging Diversity to Improve Business
Performance Research Findings and Recommendations for Organizations. Human Resource
Management, Winter 2004, 43(4), 409–424.
Jackson, S. E., & Alvarez, E. B. (1992). Working through diversity as a strategic imperative.
In D. W. Bray (Ed.),Diversity in the work place (pp. 13–36). New York, NY: Guilford Press.
Kaiser, H.F. and Rice, J. (1974), “Little Jiffy Mark IV”, Educational and
PsychologicalMeasurements, Vol. 34 No. 1, pp. 111-17.
Kokemuller, N. (n.d.). Negative effects of diversity in workplace. Retrieved March 2014, from
smallbusiness.chron.com:http://smallbusiness.chron.com/negative-effects-diversity-
workplace-18443.html
Koshy, P. (2010). Diveristy and multiculturalism as a strategy for strenghtening MSMEs in
the global market. MPRA .
Kulik, A.M., C.T., Metz, I.(2011), “The gender diversity performance relationship in services
and manufacturing organizations”, The International Journal of Human Resource
Management, Vol 22,(7), pp.1464-1485
Kate, K. (2003), The rising tide of older workers. In Nation's Business. Vol 80, no 9, p
Kundu, S C and Turan, M S, (1999). “Managing Cultural Diversity in Future Organizations”,
The Journal of Indian Management and Strategy, Vol. 4 (1), pp. 61-72
Khandelwal, P. (2002), “Gender Stereotypes at Work: Implications for Organizations", Indian
journal of Training and Development, Vol. 32, No. 2. (April - June), pp. 72-83.
Kline, R.B. (2005), Principles and Practice of Structural Equation Modeling (2nd Edition ed.).
New York: The Guilford Press.
Kline, R.B.,( 1998 ) ,Principles and Practice of Structural Equation Modeling, Guilford Press.
Lindenberger, J. (2004). Diversity and workplace. Hispanic Network Magazine .

131
Linda Barrington, K. T. (n.d.). Workforce Diversity and productivity :An analysis of employer
- employee matched data. Gatton .
list of top 10 IT companiesin india 2017-18. (2017). Retrieved may 2017, from www. alpingi.
com: http://alpingi.com/list-of-top-10-it-companies-india-2016/
Malhotra and Das (2009), “Marketing Research – An Applied Orientation”, 5th
Edition,Pearson Education Inc.
Miles, J. and Shevlin, M. (1998), "Effects of sample size, model specification and factor
loadings on the GFI inconfirmatory factor analysis," Personality and Individual Differences,
25, 85-90.
McKenna, Eugene & Beech, (2000) The Essence of Human Resources Management. Prentice
Hall Int.
Mullen, B., & Copper, C. (1994). The relation between group cohesiveness and performance:
An integration. Psychological Bulletin, 115, 210–227.
Malhotra, N. K. (2006). Markeing Reserach An Applied Orientation (4th ed.). New Delh:
Pearson Education.
Miller, D. C., &Salkind, N. J. (2002). Handbook of Research Design and Social Measurement.
SAGE.
Meena, K. (2015). Diversity Dimensions of India and their organizations challenges : An
Analysis . IOSR journal of business and management , 17 (7), 77 - 90.
McCloy RA, Campel JP, Cudeck R (1994). A confirmatory test of amodel performance
determininents. J. Appl. Psychol., 79: 493-854.
McDonald, R.P. (1978), “A simple comprehensive model for the analysis of covariance
structures,” British Journal of Mathematical and Statistical Psychology, 37, 234-251.
MacCallum, R.C., Browne, M.W., and Sugawara, H., M. (1996), "Power Analysis and
Determination of Sample Size for Covariance Structure Modeling," Psychological Methods, 1
(2), 130-49.

132
McQuitty, S. (2004), "Statistical power and structural equation models in business research,"
Journal of BusinessResearch, 57 (2), 175-83.
Moreno, K. (2012, October). Workforce diversity - Walgreens and the obvious solution.
Retrieved from www.forbes.com:
http://www.forbes.com/sites/forbesinsights/2012/10/25/workforce-diversity-walgreens-and-
the-obvious-solution/
MacCallum, R. C. & Austin, J. T. (2000). Applications of structural equation modeling in
psychological research. Annual Review of Psychology, 51, 201-226.
McDonald, R.P. and Ho, M.-H.R. (2002), "Principles and Practice in Reporting Statistical
Equation Analyses,"Psychological Methods, 7 (1), 64-82.
Nunnally, J. C. (1978). Psychometric theory (2nd ed.). New York: McGraw-Hill.
Otike, messah, & walekwa. (n.d.). Effects of workplace diversity management on
organizational effectiveness : a case study. European journal of business and management
( 2 )
Pallant, J. (2007), SPSS Survival manual: A Step by Step Guide to Data Analysis using SPSS
for Windows, 3rd edn. Berkshire: McGraw Hill: Open University Press.
Purohit, S. S. (2016). Shine. Retrieved April 2017, from infoshineco:
http://info.shine.com/industry/fmcg/6.html
Polit, D. F., Hungler, B. P., & Beck, C. T. (2001). Essentials of nursing research_:methods,
appraisal and utilization. Philadelphia: Lippincott.
Panda, D. (2016, Deceber). Top 10 Telecom Service Providers Company in India 2016-17.
Retrieved may 2017, from http://www.myhelpwap.com: http://www.myhelpwap.com/top-10-
telecom-service-providers-company-in-india-2016-17/
Polit, D. F., & Beck, C. T. (2012). Nursing research_: generating and assessing evidence for
nursing practice. Philadelphia: Wolters Kluwer Health/Lippincott Williams & Wilkins.
Parahoo, K. (2006). Nursing research_: principles, process, and issues. Basingstoke,
Hampshire, [England]; New York: Palgrave Macmillan.

133
Rummel, R.J. (1970). Applied factor analysis. Evanston, IL:Northwestern University Press.
Rice,E. (n.d.). Innovative Employee Soultions. Retrieved from
www.innovativeemployeesolutions.com:http://www.innovativeemployeesolutions.com/knowl
edge/articles/diverse-workforce-importance/
Robbins P. Stephen (1999), Organizational Change and Stress Management, Organizational
Behavior, 8th Edition, p653, Prentice Hall of India, New Delhi – 110.001.`
Rigdon, E. E. (1998). Structural equation modeling. In Modern methods for business research,
G. A. Marcoulides (editor).Mahwah, NJ: Lawrence Erlbaum Associates, Publishers, pp. 251-
294.
Reis, H. T., & Judd, C. M. (2000). Handbook of Research Methods in Social and Personality
Psychology. Cambridge University Press.
Saunders, M., Lewis, P. & Thornhill, A. (2009), Research Methods for Business students,
5thedn. Essex: Pearson Education Limited
Saunders, M., Lewis, P. & Thornhill, A. (2007), Research Methods for Business
students,4thedn. London: Prentice Hall.
Saxena, A. (2014). Workforce diversity : A key to improve productivity. Procedia: Economics
and finance , 11, 76-85.
Selvaraj, D. J. (2015). The effect of workforce diversity on eployee perforance in Singapore
organizations. International Journal of business adinistration , 6 (2).
Suhr, D. D. (n.d.). Exploratory or conforatory factor analysis. SUG , 200-31.
Steiger, J.H. (1990), "Structural model evaluation and modification," Multivariate Behavioral
Research, 25, 214-12.
Sharma, S., Mukherjee, S., Kumar, A., and Dillon, W.R. (2005), "A simulation study to
investigate the use of cutoff values for assessing model fit in covariance structure models,"
Journal of Business Research, 58 (1), 935-43.

134
Sunanda Jindal, S. D. (2013). Impact of workforce diveristy on work culture of Indian
Organizations. journal of business management and social science research , 7.
Schehar B, m. F. (2013). Analysis of workforce diversity, commitment of its employees and
its effects on organizational performance: Corporate sector in Islamabad Pakistan.
International review of basic and applied sciences .
Saeed, M. M. & Asghar, M. A (2012). Examining the Relationship between Training,
Motivation and Employees Job Performance – The Moderating Role of Person Job Fit. Journal
of Basic and Applied Scientific Research, 2(12)12177-12183
Shaw, M. (1993). Achieving equality of treatment and opportunity in the workplace. In:
Harrison, R. (ed). Human resource management: issues and strategies. Wokingham: Addison-
Wesley, 189–21.
Schwind, H., Das, H., & Wagar T. (2007). “Diversity management”. In H. Schwind, H. Das,
& T. Wagar (Eds.), “Canadian Human resource management: A strategic approach” (8th ed.),
486-524. Toronto: McGraw-Hill Ryerson
Segars, A. H. and V. Grover (1993) "Re-Examining Perceived Ease of Use and Usefulness: A
Confirmatory Factor Analysis," MIS Quarterly (17) 4 (December), pp. 517-525.
Thomas Kochan., Katerina Bezrukova, Robin Ely, Susan Jackson, Aparna Joshi, Karen Jehn,
Jonathan Leonard, David Levine, and David Thomas. (2003), “The Effects of Diversity on
Business Performance: Report of the Diversity Research Network”, Human Resource
Management, spring, Vol 42 (1), pp. 3-21
Top 10 FMCG Companies in India 2016. (2016). Retrieved may 2017, from
www.mbaskool.com: http://www.mbaskool.com/fun-corner/top-brand-lists/16180-top-10-
fmcg-companies-in-india-2016.html
Tabachnick, B. G., & Fidell, L. S. (2007). Using multivariate statistics (5th ed.). Boston, MA:
Allyn & Bacon.
Trochim, W. M., & Donnelly, J. P. (2006). The research methods knowledge base (3rd ed.).
Cincinnati, OH:Atomic Dog.

135
Vedpuriswar, A.V. (2008). "The Power of Differences". Indian Management 47 (1) : 76-83,
2008.
Woods, R.H. and Sciarini, M.P. (1995) “Diversity programs in chain restaurants”, Cornell
Hotel and Restaurant Administration Quarterly. Vol.36 (3), June.pp.18–23.
Williams and O‟Reilly (1998), “Demography and diversity in organizations: A review of 40
years of research”. Research in Organization Behavior, Vol 20, pp. 77-140.
Woodard, N. & Debi S Saini (2005) “Diversity Management Issues in USA and India: Some
Emerging Prospectives”, (Eds): Pritham Singh, Jyotsna Bhatnagar, Asha Bhandarkar in book,
“Future of work, mastering change”, Excel Publishers.
Weiliang. (2011). The effects of workforce diversity towards employee performance in an
organization. ( 1 )
Yang, H. (2008), ‘‘Efficiency Wages and Subjective Performance Pay’’, Economic Inquiry,
46(2), pp. 179–196. Yazıcı, N. K., ‘‘the Effect of Reward System Applications on Employee
Performance In Service Sector’’, (2008), Marmara University, Institute of Social Sciences,
Master Thesis.
Yuan, K.H. (2005), "Fit Indices Versus Test Statistics," Multivariate Behavioral Research, 40
(1), 115-48.
Zikmund, W. (2003), Business Research Method, 7th edn. London: Thomson South-Western.

136
LIST OF PUBLICATIONS
1. Sheth Himani,(February 2017), “A Study on Workforce Diversity in Organizations”, Indian Journal Of Applied Research , Volume 7 , Issue 2, pg. no. 693-694.
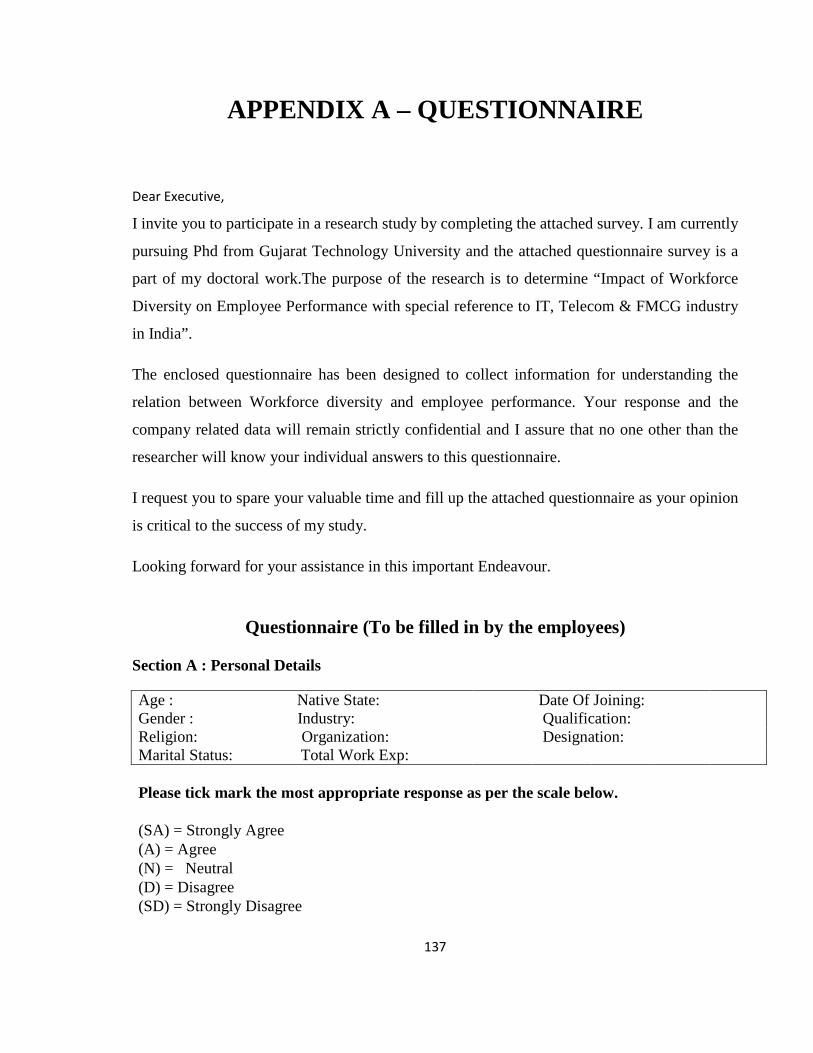
137
APPENDIX A – QUESTIONNAIRE
Dear Executive,
I invite you to participate in a research study by completing the attached survey. I am currently
pursuing Phd from Gujarat Technology University and the attached questionnaire survey is a
part of my doctoral work.The purpose of the research is to determine “Impact of Workforce
Diversity on Employee Performance with special reference to IT, Telecom & FMCG industry
in India”.
The enclosed questionnaire has been designed to collect information for understanding the
relation between Workforce diversity and employee performance. Your response and the
company related data will remain strictly confidential and I assure that no one other than the
researcher will know your individual answers to this questionnaire.
I request you to spare your valuable time and fill up the attached questionnaire as your opinion
is critical to the success of my study.
Looking forward for your assistance in this important Endeavour.
Questionnaire (To be filled in by the employees)
Section A : Personal Details
Age : Native State: Date Of Joining: Gender : Industry:
Qualification:
Religion: Organization:
Designation:
Marital Status: Total Work Exp: Please tick mark the most appropriate response as per the scale below.
(SA) = Strongly Agree (A) = Agree (N) = Neutral (D) = Disagree (SD) = Strongly Disagree

138
Section B: Age Diversity
Age Diversity SA A N DA SD There is a proper mix of employees from all the age groups in the organization
The organization recruits freshers every year
Organization allows the employees to work post retirement Age
Employees from all age groups are involved in decision making & problem solving processes
Employees with different age groups bond well
It is easy for me to adjust to different aged employees
Working with different age groups help me increase my performance
Section C: Gender Diversity
Gender Diversity SA A N DA SD There is a proper mix of males and females in the organization
There are females in Top Management There is no gender bias during the performance appraisal process. Increments and promotions are purely given on the merit basis
Male & Female employees are treated in a fair & equal manner
I feel comfortable working with the opposite gender
Working with opposite gender helps me increase my performance
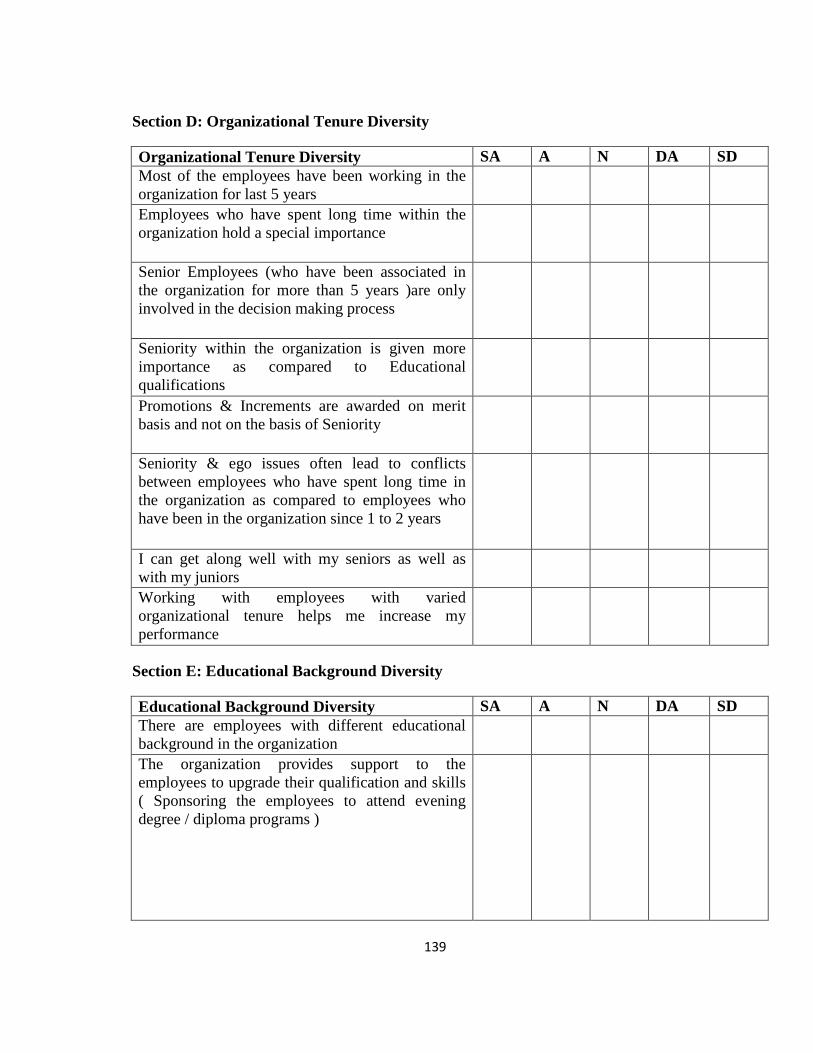
139
Section D: Organizational Tenure Diversity
Organizational Tenure Diversity SA A N DA SD Most of the employees have been working in the organization for last 5 years
Employees who have spent long time within the organization hold a special importance
Senior Employees (who have been associated in the organization for more than 5 years )are only involved in the decision making process
Seniority within the organization is given more importance as compared to Educational qualifications
Promotions & Increments are awarded on merit basis and not on the basis of Seniority
Seniority & ego issues often lead to conflicts between employees who have spent long time in the organization as compared to employees who have been in the organization since 1 to 2 years
I can get along well with my seniors as well as with my juniors
Working with employees with varied organizational tenure helps me increase my performance
Section E: Educational Background Diversity
Educational Background Diversity SA A N DA SD There are employees with different educational background in the organization
The organization provides support to the employees to upgrade their qualification and skills ( Sponsoring the employees to attend evening degree / diploma programs )

140
Educational Background Diversity SA A N DA SD There may be employees with long organizational tenure( Who have been working in the organization for more than 5 years), and whose education is less. Whereas newly joined employees who are more qualified as compared to the old employees. This leads to Conflicts and ego issues among the employees
Working with employees with different educational background helps me increase my performance
Section F: Work Experience Diversity
Work Experience Diversity SA A N DA SD There is a proper mix of freshers and experienced employees in the organization
In case of equally experienced employees, seniority is given more weightage during the performance appraisal process
Generation gap & ego issues does not lead to conflicts between freshers & experienced people
Freshers are not involved in the decision making & problem solving process
Highly experienced employees do not feel a sense of insecurity if the freshers and middle experienced employees are extremely talented
Working with freshers, middle level experienced and highly experienced employees help me increase my performance
Section G: Religion Diversity
Religion Diversity SA A N DA SD There are employees from different religions in the organization
The top management consists of employees from different religions
Employees from all the religions are involved in decision making process

141
Religion Diversity SA A N DA SD
Religion is not given consideration during the performance appraisal process
Employees are treated in a fair & equal manner irrespective of their religion
It is easy for me to adjust with employees from different religions
Working with employees from different religions helps me increase my performance
Section H: Regional Diversity
Regional Diversity SA A N DA SD There are employees from different regions / states in the organization
The top management consists of employees from different regions / states
Employees from all the regions/states are involved in the decision making & problem solving process
Region / state is not given consideration during the performance appraisal process
Employees are treated in a fair & equal manner irrespective of the region / state they belong to
It is easy for me to adjust with employees from different regions
Working with employees from different regions / states helps me increase my performance
Section I: Employee Performance
Employee Performance SA A N DA SD I always meet the targets assigned to me and deliver results on time
I always add value to my department and organization
I always try to explore and learn new techniques to deliver more than my boss’s expectations

142
Employee Performance SA A N DA SD
I often meet targets during challenging situations
Working in a diverse group helps me increase my productivity
Working in a diverse group helps me enhance my creativity