impact on maximizers and satisficers within a choice context
TRANSCRIPT

Georgia State UniversityScholarWorks @ Georgia State University
Marketing Dissertations Department of Marketing
7-24-2007
Online Product Information Load: Impact onMaximizers and Satisficers within a ChoiceContextJill Renee Mosteller
Follow this and additional works at: http://scholarworks.gsu.edu/marketing_diss
This Dissertation is brought to you for free and open access by the Department of Marketing at ScholarWorks @ Georgia State University. It has beenaccepted for inclusion in Marketing Dissertations by an authorized administrator of ScholarWorks @ Georgia State University. For more information,please contact [email protected].
Recommended CitationMosteller, Jill Renee, "Online Product Information Load: Impact on Maximizers and Satisficers within a Choice Context."Dissertation, Georgia State University, 2007.http://scholarworks.gsu.edu/marketing_diss/6
PERMISSION TO BORROW
In presenting this dissertation as a partial fulfillment of the requirements for an advanced degree from Georgia State University, I agree that the Library of the University shall make it available for inspection and circulation in accordance with its regulations governing materials of this type. I agree that permission to quote from, to copy from, or to publish this dissertation may be granted by the author or, in his/her absence, the professor under whose direction it was written or, in his absence, by the Dean of the Robinson College of Business. Such quoting, copying, or publishing must be solely for scholarly purposes and does not involve potential financial gain. It is understood that any copying from or publication of this dissertation which involves potential gain will not be allowed without written permission of the author. Jill R. Mosteller

NOTICE TO BORROWERS
All dissertations deposited in the Georgia State University Library must be used only in accordance with the stipulations prescribed by the author in the preceding statement. The author of this dissertation is: Jill Renee Mosteller Marketing Department J. Mack Robinson College of Business Georgia State University The director of this dissertation is: Dr. Naveen Donthu Marketing Department J. Mack Robinson College of Business Georgia State University
ONLINE PRODUCT INFORMATION LOAD: IMPACT ON MAXIMIZERS AND
SATISFICERS IN A CHOICE CONTEXT
BY
JILL RENEE MOSTELLER
A Dissertation Submitted in Partial Fulfillment of the Requirements for the Degree
Of
Doctor of Philosophy
In the Robinson College of Business
Of
Georgia State University
GEORGIA STATE UNIVERSITY ROBINSON COLLEGE OF BUSINESS
2007

Copyright by Jill Renee Mosteller
2007
ACCEPTANCE
This dissertation was prepared under the direction of the Jill R. Mosteller’s Dissertation Committee. It has been approved and accepted by all members of that committee, and it has been accepted in partial fulfillment of the requirements for the degree of Doctor of Philosophy in Business Administration in the Robinson College of Business of Georgia State University. H. Fenwick Huss DISSERTATION COMMITTEE Dr. Naveen Donthu
Dr. Sevgin Eroglu
Dr. Corliss G. Thornton
Dr. Detmar Straub

ABSTRACT
ONLINE PRODUCT INFORMATION LOAD; IMPACT ON MAXIMIZERS AND SATISFICERS IN A CHOICE CONTEXT
BY
JILL RENEE MOSTELLER
JULY 2007
Committee Chair: Dr. Naveen Donthu Major Department: Marketing Information load at various thresholds has been asserted to cause a decline in decision quality across several domains, including marketing (Eppler and Mengis 2004). The influence of each information load dimension may vary by study and context (Malhotra 1982; Lurie 2002; Lee and Lee 2004). Given the explosion of information available on the internet, attracting an estimated 144 million U.S. users (Burns 2006a), this experimental research examined how three dimensions of online product information load influenced consumers’ perceived cognitive effort. To the researcher’s knowledge, online product breadth, depth, and density have not been empirically tested together, in a multi-page within website context. A nationwide panel of 268 adult consumers participated in the web-based consumer electronics online search and selection task. Results suggest that a consumer’s perceived cognitive effort with the search and selection task negatively influences choice quality and decision satisfaction. Although product breadth directly influenced both choice quality and cognitive effort negatively, cognitive effort mediated product depth’s influence on choice quality and decision satisfaction. The perception of informational crowding also negatively influenced cognitive effort. Additionally, a choice involvement scale was adapted and developed based upon Schwartz’s (2004) Maximizer and Satisficer scale. Results suggest that the higher one’s choice involvement (tendency toward being a Maximizer), the lower one’s perceived cognitive effort with the search and selection task. Both product and choice involvement demonstrated a direct negative influence on cognitive effort, lending further empirical support for the information processing theory of consumer choice (Bettman 1979). A stimulus-organism-response framework, adapted from environmental psychology, was employed to model the relationships among the constructs tested. Results suggest that this framework may be helpful for guiding future online consumer research.
ACKNOWLEDGEMENTS
The author wishes to recognize several people who have either directly assisted or
indirectly inspired the creation, conceptualization and completion of this dissertation
endeavor.
First, I am deeply thankful for the dissertation committee members who agreed to
serve on my committee. The word ‘serve’ is derived from servitude. Each committee
member has graciously honored me with their guidance and feedback, which is based
upon years of research and academic experience. Collectively in terms of publications,
this committee has contributed well over 100 scholarly journal publications. I feel
fortunate to have had the opportunity to interact and engage with this committee during
my dissertation process. Each member contributed uniquely to my dissertation journey.
Dr. Donthu, my chair, helped me manage the entire process efficiently with a warm sense
of humor. His guidance has helped me to keep a balanced and thoughtful perspective
during this long and sometimes arduous journey. Dr. Eroglu’s enthusiasm,
encouragement, and focus on the theoretical foundation of this dissertation provided me a
scholarly foundation that will continue to serve me well into the future. Dr. Straub’s
expertise in information sciences and experimental design procedures were invaluable.
He is truly a mentor to developing researchers. Dr. Thornton’s academic, as well as
personal interest, with the Maximizer and Satisficer consumer traits provided thought
provoking discussions, contributing to the overall work.
Second, I am thankful to my previous employers, from which the inspiration for
this work was partially derived. The ignition for this flame was based in part from seeing

consumers experience frustration while trying to accomplish a task online. My hope is
that this work will provide some illumination to the business, as well as, the academic
community.
Third, I’d like to thank my family and friends, whose continued support, in a
multitude of ways, has been heartwarming and inspirational. They supported my dream,
even though at times it meant sacrifices, particularly in terms of our time spent together.
Finally, I would like to dedicate this dissertation to my mother, Barbara Anne
Guidi. She was an inspirational woman in many ways. She was a successful business
woman who frequently exclaimed, ‘common sense is not common’ and ‘Jill, you
overanalyze everything’. Well, maybe now I’ve found my professional home. Mother,
may you continue to rest in peace, perhaps now more completely.

TABLE OF CONTENTS
CHAPTER I.................................................................................................................... 1
INTRODUCTION....................................................................................................... 1 PURPOSE OF STUDY ........................................................................................... 3
CHAPTER II .................................................................................................................. 8 LITERATURE REVIEW............................................................................................ 8
INFORMATION LOAD ......................................................................................... 8 ONLINE INFORMATION LOAD........................................................................ 11 CHOICE QUALITY ............................................................................................. 17 CROWDING......................................................................................................... 20 COGNITIVE LOAD AND INFORMATION PROCESSING................................ 23 COGNITIVE EFFORT.......................................................................................... 27 DECISION SATISFACTION................................................................................ 31 PRODUCT INVOLVEMENT............................................................................... 31 CHOICE INVOLVEMENT - MAXIMIZER/SATISFICER .................................. 32
CHAPTER III ............................................................................................................... 34 MODEL AND HYPOTHESES ................................................................................. 34
CHAPTER IV............................................................................................................... 42 RESEARCH DESIGN AND METHODOLOGY .......................................................... 42
EXPERIMENTAL DESIGN ................................................................................. 42 SCENARIO........................................................................................................... 43 STIMULI DEVELOPMENT................................................................................. 44 PRETESTS AND PILOT TESTS.......................................................................... 45 PRETEST.............................................................................................................. 45 PILOT TEST......................................................................................................... 48 MAIN STUDY SAMPLE...................................................................................... 50
CHAPTER V ................................................................................................................ 53 DATA ANALYSIS AND RESULTS........................................................................ 53
NON-RESPONSE BIAS ....................................................................................... 53 REALISM CHECK............................................................................................... 54 MANIPULATION CHECKS ................................................................................ 56 RELIABILITY OF MEASURES .......................................................................... 58
HYPOTHESES RESULTS ....................................................................................... 64 POST HOC ANALYSIS ....................................................................................... 79 SUMMARY OF RESULTS .................................................................................. 80
CHAPTER 6 ................................................................................................................. 85 CONCLUSIONS AND FUTURE DIRECTIONS...................................................... 85
IMPLICATIONS FOR PRACTICE....................................................................... 85 IMPLICATIONS FOR RESEARCH ..................................................................... 85 LIMITATIONS..................................................................................................... 86 FUTURE DIRECTIONS....................................................................................... 87

TABLES....................................................................................................................... 89
Table 1 Overload Model............................................................................................ 89 Table 2 Pre-test Cognitive Effort ............................................................................... 89 Table 3 Pre-test Product Involvement........................................................................ 89 Table 4 Pre-test Choice Involvement ......................................................................... 89 Table 5 Pilot test manipulation checks....................................................................... 90 Table 6 Pilot test Choice Involvement ....................................................................... 90 Table 7 Information Load – Cognitive Effort............................................................. 90 Table 8 Cognitive Effort – Decision Satisfaction ....................................................... 91 Table 9 Top 10 states of Respondents........................................................................ 91 Table 10 Respondents’ Education Profile .................................................................. 92 Table 11 Respondents’ Years of Internet Use ............................................................ 92 Table 12 Multivariate Tests – Breadth Manipulation check ....................................... 92 Table 13 Depth Manipulation check .......................................................................... 92 Table 14 Density – Crowding Scores......................................................................... 93 Table 15 Descriptive Statistics – Perceptions of Crowding ........................................ 93 Table 16 Depth & Density – Total Crowding Score................................................... 93 Table 17 Breadth, Depth, and Density – Overall Information Load............................ 94 Table 18 Overall perceived information load across treatments ................................. 94 Table 19 Reliability Statistics – Perceived web expertise........................................... 94 Table 20 Perceived web expertise items .................................................................... 95 Table 21 Reliability Statistics – Product Involvement................................................ 95 Table 22 Gender differences in product involvement................................................. 95 Table 23 Reliability Statistics – Choice Involvement................................................. 95 Table 24 Choice involvement items........................................................................... 96 Table 25 Choice involvement correlation matrix ....................................................... 96 Table 26 Choice Involvement Component Matrix ..................................................... 96 Table 27 Choice Involvement Factor Analysis........................................................... 96 Table 28 Reliability Statistics – Cognitive Effort....................................................... 97 Table 29 Item-Total Statistics – Cognitive Effort....................................................... 97 Table 30 Treatment – Choice Quality Means............................................................. 97 Table 31 Overall Treatment – Choice Quality............................................................ 98 Table 32 Product Information Breadth – Cognitive Effort ......................................... 98 Table 33 Breadth & Choice Involvement – Cognitive Effort...................................... 98 Table 34 Breadth & Product Involvement – Cognitive Effort .................................... 98 Table 35 Depth – Cognitive Effort............................................................................. 99 Table 36 Depth & Choice Involvement – Cognitive Effort ........................................ 99 Table 37 Depth & Product Involvement – Cognitive Effort ....................................... 99 Table 38 Density – Cognitive Effort ........................................................................ 100 Table 39 Manipulated sub-sample/Density – Cognitive Effort ................................. 100 Table 40 Perceived Crowding (full sample) – Cognitive Effort................................ 100 Table 41 Density & Choice Involvement – Cognitive Effort.................................... 101
Table 42 Density, Choice Involvement, Density x Choice Involvement – Cognitive Effort ...................................................................................................................... 101 Table 43 Density (manipulated sub sample) & Choice Involvement – Cognitive Effort................................................................................................................................ 101 Table 44 Perceived Crowding & Choice Involvement – Cognitive Effort ................ 102 Table 45 Density & Product Involvement – Cognitive Effort................................... 102 Table 46 Density & Product Involvement (sub-sample) – Cognitive Effort.............. 102 Table 47 Crowding & Product Involvement – Cognitive Effort ............................... 103 Table 48 Cognitive Effort – Choice Quality............................................................. 103 Table 49 Cognitive Effort – Time Spent .................................................................. 103 Table 50 Cognitive Effort – Choice Satisfaction...................................................... 103 Table 51 Overall Model Information Load (Breadth, Depth, Crowding) – Choice Quality .................................................................................................................... 104 Table 52 Information Load (Breadth, Depth, Crowding) – Choice Quality .............. 104 Table 53 Overall Model: Breadth, Crowding, & Cognitive Effort – Choice Quality 104 Table 54 Breadth, Crowding, and Cognitive Effort – Choice Quality....................... 105 Table 55 Overall Model: Breadth and Cognitive Effort – Choice Quality ............... 105 Table 56 Breadth and Cognitive Effort – Choice Quality......................................... 105 Table 57 Depth – Choice Quality ............................................................................ 105 Table 58 Depth & Cognitive Effort – Choice Quality .............................................. 106 Table 59 Summary of Hypotheses Results............................................................... 106
FIGURES ................................................................................................................... 108
FIGURE 1 Conceptual Model ................................................................................. 108 FIGURE 2 Experimental Matrix.............................................................................. 109 FIGURE 3 Empirical Results Model ....................................................................... 110
APPENDICES ............................................................................................................ 111 APPENDIX A Pretest Post Experimental Questionnaire......................................... 111 APPENDIX B Experimental Stimuli Treatments..................................................... 115 APPENDIX C SCALES.......................................................................................... 119
REFERENCES ........................................................................................................... 131

CHAPTER I
INTRODUCTION Information load has been examined in a variety of business disciplines, including
management, accounting, organization science, management information systems (MIS)
and marketing (Eppler and Mengis 2004). The overarching theme relates to how a
person’s performance is impacted by the amount of information one is exposed to (Eppler
and Mengis 2004). Research conducted in this area suggests that as the information load
increases, decision accuracy will increase up to a certain point, then decline.
Empirical evidence in the consumer choice domain about what causes information
load has been somewhat extensive and sometimes equivocal on the results asserted and
previous work extended upon (Wilkie 1974; Jacoby, Speller, and Kohn 1974; Scammon
1977; Malhotra 1982; Keller and Staelin 1987; Helgeson and Ursic 1993; Lurie 2002,
2004; Lee and Lee 2004). The number of alternatives and attributes, the quantity and
quality, and the structure of information presented have been asserted to influence
consumer information load. Consumer information load has been examined in a variety
of contexts, most offline. Although decision quality appears to decline at higher levels of
traditional and structural load measurements, the influence of each of the dimensions may
vary by study and context.
Over the past 10 years information available online has exploded, attracting an
estimated 144 million U.S. Internet users (Burns 2006a). Fifty percent of broadband
users say the Internet has influenced a recent purchase (Internet Retailer 2007). Seeking
information is the second most popular Internet use (e-mail is the most popular use), with
2
more than eight out of ten U.S. Internet users stating they have researched a product or
service online (Madden 2003).
Information availability can be considered a key enabler to favorably leveraging
and positioning retail strategies (Grewal, Iyer, and Levy 2004). Are there some
circumstances however, when too much information presented online may work against
retailers? At first glance, the answer may be no. Recent data indicates that U.S.
consumers spent $143 billion dollars online in 2005 (Marketing Sherpa 2006) with retail
spend (excluding travel) accounting for over 66% (Burns 2006c) In addition it is
estimated that U.S. cross-channel shoppers (search online/buy offline) contributed to
$125 billion dollars in offline sales in 2005 (Mendelsohn 2006). The percentage of
Americans who say that the Internet has greatly improved their ability to shop has
doubled from 16% to 32% (Madden 2006). So online consumer expenditures are
increasing and more people are using the Internet to shop and search for information.
Customer satisfaction with the online shopping experience, however, declined
recently, attributed in part to consumers not being able to find what they were looking for
(Burns 2006b). Information abounds on the Internet, but could information presentation
be an enabler as well as a hindrance within the search and selection process?
Information attended to on the Internet has important implications. Information
presented may influence consumer choice and if online information is not considered
helpful, use of that information and the associated web site may decline over time.
Despite information availability and personal convenience, consumers may become
frustrated and dissatisfied when they are not easily and effectively able to accomplish
their shopping tasks (Burns 2005f). Impact may include reduced long term sales

3
potential based upon decreases in shoppers’ likelihood to return and recommend
the web site (Burns 2005f).
PURPOSE OF STUDY Factors that influence how a person may cope with environmental input may be a
function of the difficulty of the task, the amount of interaction, the individual’s personal
characteristics, and one’s previous experience and prior expectations (Harrell and Hutt
1976). Understanding how individual characteristics may interact with online product
information to manifest variance in perceived cognitive effort with the product search and
selection task is one purpose of this study. If high cognitive effort is exerted, how it may
influence product choice, search time, and decision satisfaction may have important
practitioner and academic implications.
From an academic standpoint, there are five interesting questions. One is a
contextual extension of existing theory. Specifically how does the depth of product
information influence the perceived cognitive effort of consumers? One of the unique
attributes of the Internet, as compared physical store contexts, is that the Internet may be
more cognitively demanding of consumers (Chiang 2003). Using the Internet typically
requires reading and attending to detailed information through a series of web pages over
a prolonged timeframe. The information contained in a website is considered to be a key
facet within a web site that determines its perceived usefulness (Argawal and Venkatesh
2002). Visual perceptiveness, reading, comprehension, concentration, and manual
dexterity could be considered especially important skills when shopping online (Olson
and Olson 2003). Offline, one can engage all of the perceptual senses (sight, sound,
smell, touch, and taste) to perceive the environment more holistically. Thus the visual
4
information perceived online may take on particular importance in shaping consumers’
online shopping experience (Chau, Au, and Tam 2000). Previous research suggests that
how information is presented influences decision-making processes (Payne, Bettman, and
Johnson 1993).
A second issue of interest is the empirical testing of spatial crowding and its
influence on cognitive effort as an online atmospheric variable. Although the Internet
may be loaded with information, how the information is presented spatially is posited to
influence cognitive effort. Online design techniques (e.g. spacing of information) that
attenuate cognitive effort may be perceived more favorably by online shoppers. Ease of
use, the cognitive effort required in using a website (Argawal and Venkatesh 2002), has
been positively associated with intentions to use various types of technology. Is there a
related construct that describes the cognitive effort with which a person can process and
evaluate information – a cognitive ease of use per se – that better predicts decision
satisfaction outcomes from exposure to information stimuli? This dissertation will
attempt to answer this question.
The third interesting issue is the refinement and better understanding of what
influences consumers to experience an increase in information load when examining
product information online. Research suggests the structure of information is a better
predictor of consumer information load, other research suggests structure and attribute
depth both contribute (Lurie 2004; Lee and Lee 2004). This research will examine three
different dimensions of product information load, specifically product breath (number of
products), depth (number of features), and density (words per page) that may contribute

5
to perceived consumer information load and see how this may relate to perceived
cognitive effort with the product search and selection task.
The fourth research question is the development and nomological testing of the
construct, cognitive effort, as a mediator between online environmental stimuli and
consumer outcomes. This study will test if a person’s perceived cognitive effort may be a
better predictor of choice quality outcomes than traditional information load measures.
How cognitive effort may manifest variability with decision satisfaction will be one
outcome examined. Previous studies examining cognitive effort have used objective
criteria, like the number of elementary information processes (EIP’s) used or time as a
proxy (Garbarino and Edell 1997; Bettman, Johnson and Payne 1990) for cognitive
effort, not perceptual factors. Total time spent on the task is a second outcome to be
examined. How time spent on the task correlates with cognitive effort, choice quality and
decision satisfaction under different load conditions may provide additional insights.
A fifth research question is examining how the situational trait of product
involvement and the enduring trait of choice involvement (the Maximizer/Satisficer) may
influence the perceived cognitive effort experienced while performing the online search
and selection task. The Maximizer and Satisficer trait has had little empirical testing
within the marketing domain (Schwartz 2004; Schwartz et al 2002), but may be highly
appropriate within the proposed framework and context. Retailers may offer a larger
assortment of products online than offline, due to lower associated costs. Schwartz
(2004) suggests that the plethora of consumer products available may elicit Maximizer
tendencies.
6
From a managerial perspective, insight may be gleaned on how online product
information may influence consumer shopping states and choice outcomes. These
findings may help online marketers to enhance product positioning with the consumer, so
that desired outcomes are enhanced. Time spent during the search and selection task may
provide insight into customer purchase intent and/or if the website is meeting consumers’
needs. Too little, as well as too much time spent on the web site may indicate
dissatisfaction (not finding what they are searching for or inability to easily navigate or
process information presented). Historically a web site’s success may have been
evaluated on the increase in new visitors and the total number of visitors (Moe and Fader
2004). Ironically, a website may be viewed as successful because the ratio of purchases
to unique visitors is increasing and time spent on the site is decreasing (inferring
efficiency), however if the post consumption experience creates consumer regret, what
may be viewed as a successful consumer experience, may lead to dissatisfaction in the
long run. If the consumer feels that an inferior selection was made, the likelihood of
revisiting the site may be attenuated. Too much information may influence consumer
choice from irrelevant attributes, which then may result in post selection regret,
impacting future patronage intentions (Thompson, Hamilton and Rust 2005). Examining
how actual choice quality and decision satisfaction correlate as outcomes may have
interesting practitioner implications regarding short term sales and long term customer
loyalty.
In sum, this study examines product information properties that create variance in
cognitive effort for consumers as they search through pages of product information
online. Is perceived cognitive effort within a search and selection task an important

7
mediator that will help to better predict online consumer behavior decision satisfaction
outcomes? How do consumer product and choice involvement influence cognitive
effort? How does the personality trait of being a Maximizer or Satisficer moderate the
effects of information load? This research will attempt to provide additional insight to
these questions.

8
CHAPTER II
LITERATURE REVIEW
INFORMATION LOAD The concept of information load has been examined in a variety of business disciplines,
including management, accounting, organization science, management information
systems (MIS) and marketing (Eppler and Mengis 2004). The overarching theme among
all of these disciplines relates to how a person’s performance is impacted by the amount
of information one is exposed to (Eppler and Mengis 2004). Research conducted in this
area suggests that as the information load increases, decision accuracy will increase up to
a certain point, then decline. The point where the slope of the curve becomes negative
indicates when information overload occurs. Considerable debate on how and if this
empirical manifestation occurs has been published (Wilkie 1974; Jacoby 1977; Scammon
1977; Malhotra, Jain, and Lagakos 1982; Jacoby 1984; Malhotra 1984).
The first empirical work in marketing to examine information load was by
Jacoby, Speller and Kohn (1974). At the time public policy issues centered on consumer
advocacy and information disclosure around product labeling. Information load was
operationalized as the number of alternatives and the number of attributes per alternative.
Results suggested that information load was positively associated with various outcomes;
decision satisfaction, certainty of best decision and increased levels of confusion during
the task. As the number of alternatives increased, decision satisfaction also increased.
As the number of attributes increased, subjects were more certain and less confused while
making their decisions. Measurement issues raised by peers in this experiment’s results
were addressed in another experiment conducted by the same group of researchers that
9
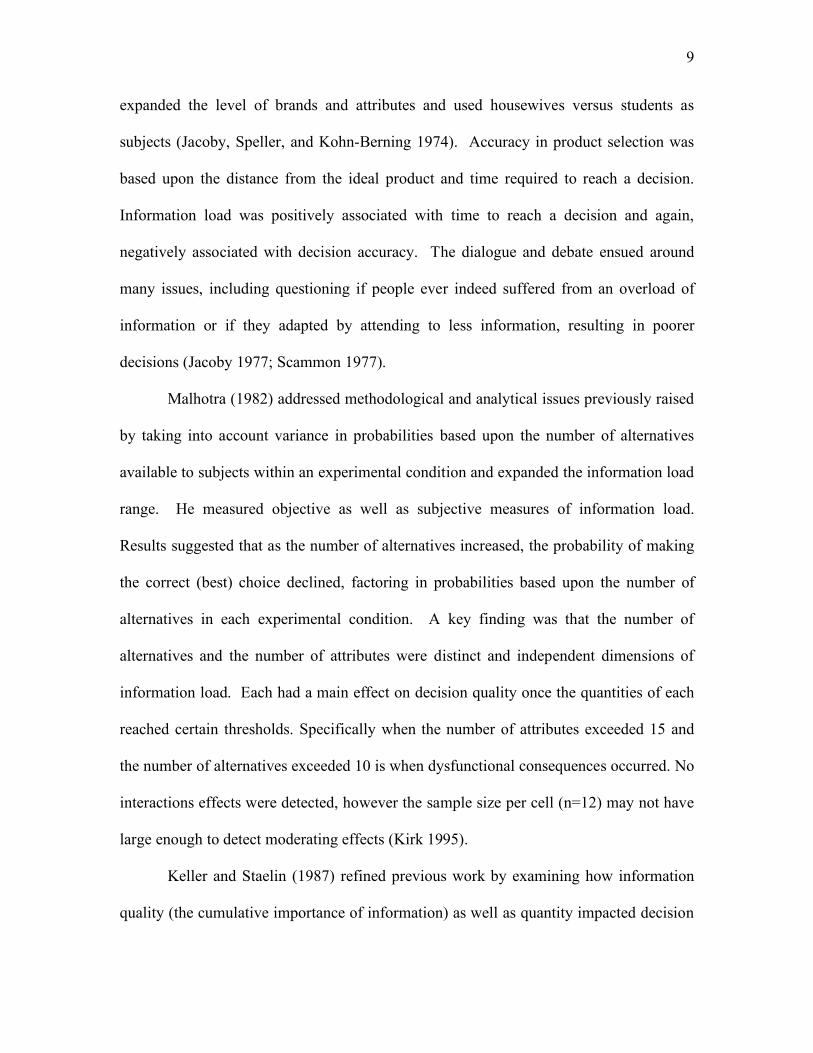
expanded the level of brands and attributes and used housewives versus students as
subjects (Jacoby, Speller, and Kohn-Berning 1974). Accuracy in product selection was
based upon the distance from the ideal product and time required to reach a decision.
Information load was positively associated with time to reach a decision and again,
negatively associated with decision accuracy. The dialogue and debate ensued around
many issues, including questioning if people ever indeed suffered from an overload of
information or if they adapted by attending to less information, resulting in poorer
decisions (Jacoby 1977; Scammon 1977).
Malhotra (1982) addressed methodological and analytical issues previously raised
by taking into account variance in probabilities based upon the number of alternatives
available to subjects within an experimental condition and expanded the information load
range. He measured objective as well as subjective measures of information load.
Results suggested that as the number of alternatives increased, the probability of making
the correct (best) choice declined, factoring in probabilities based upon the number of
alternatives in each experimental condition. A key finding was that the number of
alternatives and the number of attributes were distinct and independent dimensions of
information load. Each had a main effect on decision quality once the quantities of each
reached certain thresholds. Specifically when the number of attributes exceeded 15 and
the number of alternatives exceeded 10 is when dysfunctional consequences occurred. No
interactions effects were detected, however the sample size per cell (n=12) may not have
large enough to detect moderating effects (Kirk 1995).
Keller and Staelin (1987) refined previous work by examining how information
quality (the cumulative importance of information) as well as quantity impacted decision
10
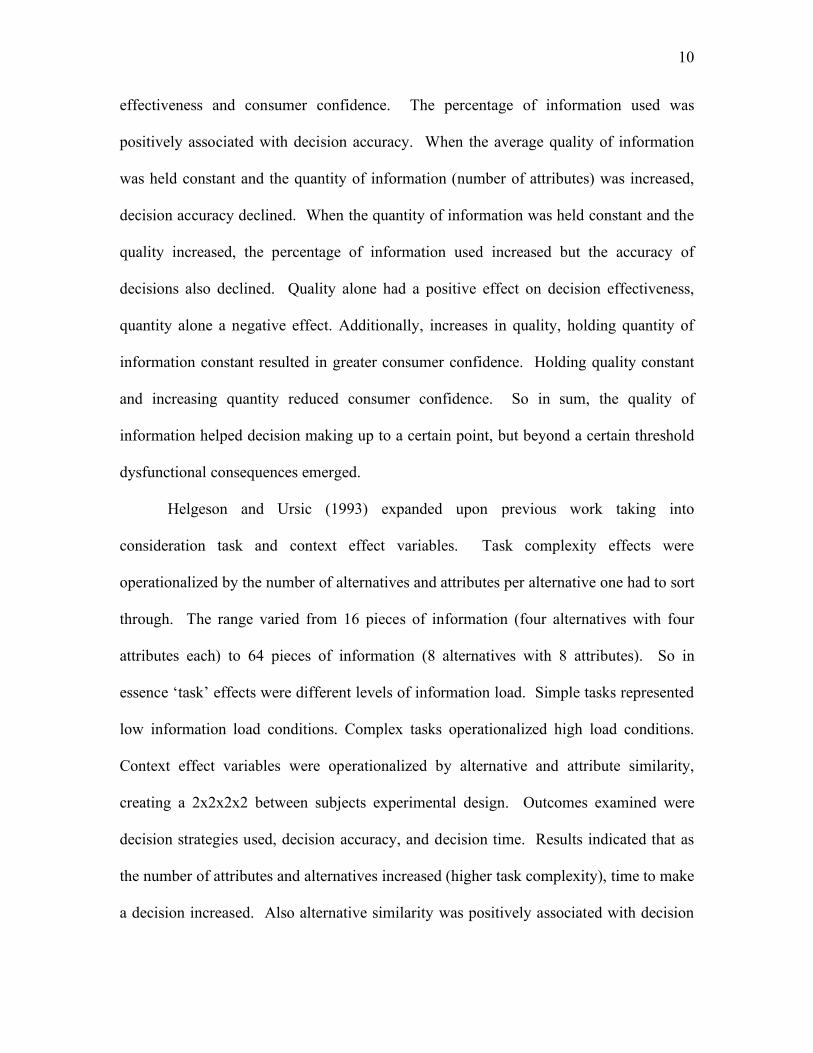
effectiveness and consumer confidence. The percentage of information used was
positively associated with decision accuracy. When the average quality of information
was held constant and the quantity of information (number of attributes) was increased,
decision accuracy declined. When the quantity of information was held constant and the
quality increased, the percentage of information used increased but the accuracy of
decisions also declined. Quality alone had a positive effect on decision effectiveness,
quantity alone a negative effect. Additionally, increases in quality, holding quantity of
information constant resulted in greater consumer confidence. Holding quality constant
and increasing quantity reduced consumer confidence. So in sum, the quality of
information helped decision making up to a certain point, but beyond a certain threshold
dysfunctional consequences emerged.
Helgeson and Ursic (1993) expanded upon previous work taking into
consideration task and context effect variables. Task complexity effects were
operationalized by the number of alternatives and attributes per alternative one had to sort
through. The range varied from 16 pieces of information (four alternatives with four
attributes each) to 64 pieces of information (8 alternatives with 8 attributes). So in
essence ‘task’ effects were different levels of information load. Simple tasks represented
low information load conditions. Complex tasks operationalized high load conditions.
Context effect variables were operationalized by alternative and attribute similarity,
creating a 2x2x2x2 between subjects experimental design. Outcomes examined were
decision strategies used, decision accuracy, and decision time. Results indicated that as
the number of attributes and alternatives increased (higher task complexity), time to make
a decision increased. Also alternative similarity was positively associated with decision

11
time. This may be attributed to subjects having to become more detailed in their
comparisons given that differences were less apparent. Decision-making accuracy was
negatively related to the number of attributes and alternative similarity. These results
support previous research that the number of attributes contribute to information load and
extend work in the area by demonstrating that product similarity may also contribute to
strain in the decision making process.
Up to this point information load had been operationalized in an offline context,
utilizing students, housewives, and adult subjects appropriate for the product(s) selected
for the experimental conditions. Theoretical frameworks using information processing
and decision-making were used to predict assertions and in some cases extend theory.
Next we will discuss research conducted online using the information load construct.
ONLINE INFORMATION LOAD Research examining how information load may influence end user outcomes in an online
context includes information management, management, as well as marketing domains.
Relevant research within each of these domains will be discussed.
From the information management domain, Huang (2000) operationalized
information load on two dimensions, novelty and complexity, pulling from the
environmental psychology literature (Mehrabian and Russell 1974). Environmental
psychology researchers have typically used the stimulus-organism-response framework to
guide research. Typical behavioral responses measured have been approach-and-
avoidance behaviors. In this research subjects visited web sites and then reported their
responses. Subjects reported their perceptions of the web site with regard to novelty and

12
complexity (operationalized as information load) and their subsequent desire to explore
and shop on that site. A decreased desire to shop and/or explore was considered
avoidance, and increased desire was considered approach. Information presented that
was perceived as contrasting, surprising, and rare was high in novelty. Information that
was considered complex, crowded, and of a large scale was scored as high on
complexity. Together these two dimensions of complexity and novelty formed
information load. Complexity was negatively associated and novelty positively
associated with the desire to explore (approach) the website. Complexity was positively
associated with the desire to shop, however the relationship was weak (p=.07/1.68)
(Huang 2000). These results suggest that how information load is operationalized is
critical in determining or predicting different outcomes. In this case the two dimensions
acted in counterbalancing ways, which could have lead to insignificant results if they
could not have been tested individually. The interesting finding, although not robust, is
that complexity may be perceived as favorable if one visits a web site with the intention
of buying. Perhaps the large selection is perceived as being a favorable attribute (e.g
useful in accomplishing a task) when searching for a particular product, however, if the
intention is more recreational (e.g. browsing/hedonic), the large selection may not be
perceived as pleasurable, but more of a headache to navigate through.
Menon and Kahn (2002) also used the environmental stimulus response
framework but used three dimensions: novelty, complexity, and intensity. These three
dimensions operationalized ‘arousal’ in an online setting. Although Menon and Kahn do
not explicitly call their independent variables ‘information load’, ‘arousal’ is similar to
the way in which the ‘stimulus’ of information load has been operationalized using the

13
environmental psychology framework. Novelty was operationalized as the variance in
the types of books offered (breadth of categories) which can be described as the degree of
similarity. Complexity was operationalized as the degree of clutter in the layout (amount
of non-relevant information), which could also suggest the degree of ‘quality’ of
information presented. Intensity referred to the visual atmospherics (e.g., bright colors)
and the quantity of information (high quantity = high intensity). So information
similarity, quality, and quantity were operationalized as stimulation variables in this
experiment. The context of the study was subjects browsing within and between sites in
an online shopping mall. Results suggest that high stimulation is negatively associated
with approach behaviors.
Suri, Long, and Monroe (2003) sought to better understand how task motivation
combined with information load affected price and value perceptions of products
presented online. This research was spurred on by anecdotal evidence that consumers
may be willing to pay more for products purchased online, than less. Their educated
guess was that the information load online might be a contributing factor. Their research
operationalized information load only by the number of alternatives. Seven and nineteen
alternatives represented the low and high information loads respectively. It should also
be noted that subjects simply had to view a one-page computer screen to compare
alternatives. There was no interaction or maneuvering through web pages in the study.
Chaiken’s (1980) Heuristic Systematic Model (HSM) guided the study. Results
suggested that even under conditions of high motivation, high information load might
have caused subjects to resort to heuristic methods of assessing value, by using price as a
proxy (e.g. high price = high value). Under low information load conditions, a more
14
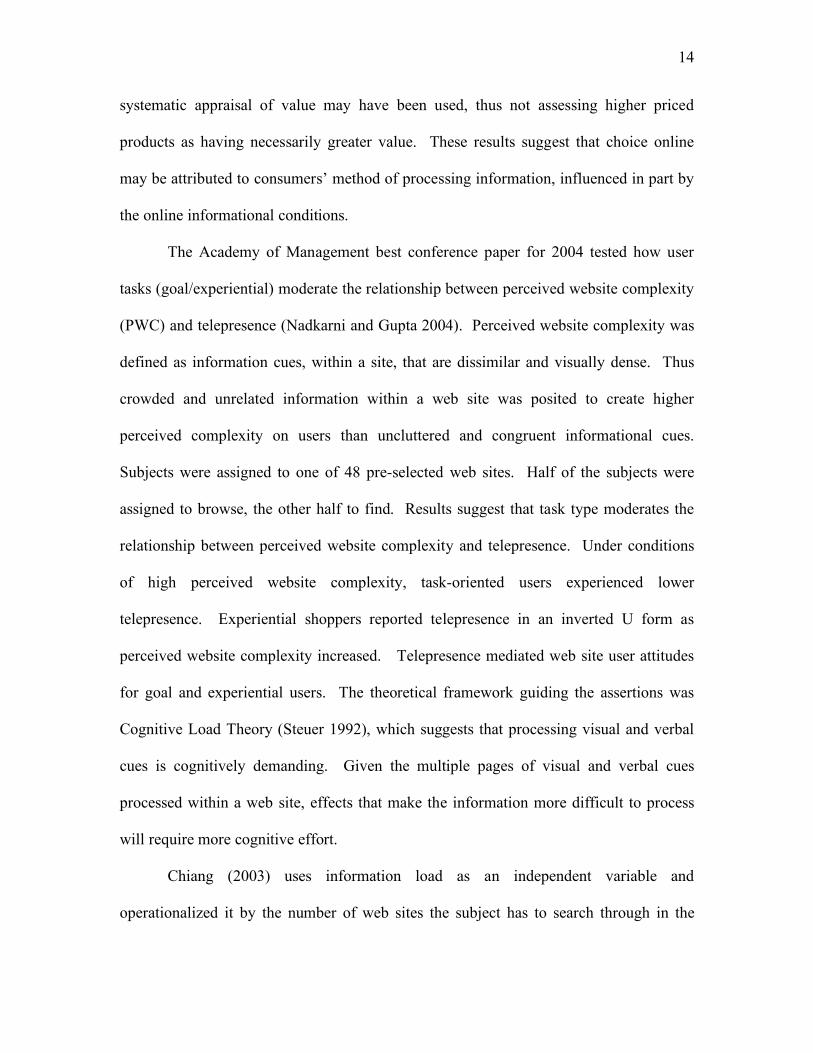
systematic appraisal of value may have been used, thus not assessing higher priced
products as having necessarily greater value. These results suggest that choice online
may be attributed to consumers’ method of processing information, influenced in part by
the online informational conditions.
The Academy of Management best conference paper for 2004 tested how user
tasks (goal/experiential) moderate the relationship between perceived website complexity
(PWC) and telepresence (Nadkarni and Gupta 2004). Perceived website complexity was
defined as information cues, within a site, that are dissimilar and visually dense. Thus
crowded and unrelated information within a web site was posited to create higher
perceived complexity on users than uncluttered and congruent informational cues.
Subjects were assigned to one of 48 pre-selected web sites. Half of the subjects were
assigned to browse, the other half to find. Results suggest that task type moderates the
relationship between perceived website complexity and telepresence. Under conditions
of high perceived website complexity, task-oriented users experienced lower
telepresence. Experiential shoppers reported telepresence in an inverted U form as
perceived website complexity increased. Telepresence mediated web site user attitudes
for goal and experiential users. The theoretical framework guiding the assertions was
Cognitive Load Theory (Steuer 1992), which suggests that processing visual and verbal
cues is cognitively demanding. Given the multiple pages of visual and verbal cues
processed within a web site, effects that make the information more difficult to process
will require more cognitive effort.
Chiang (2003) uses information load as an independent variable and
operationalized it by the number of web sites the subject has to search through in the
15
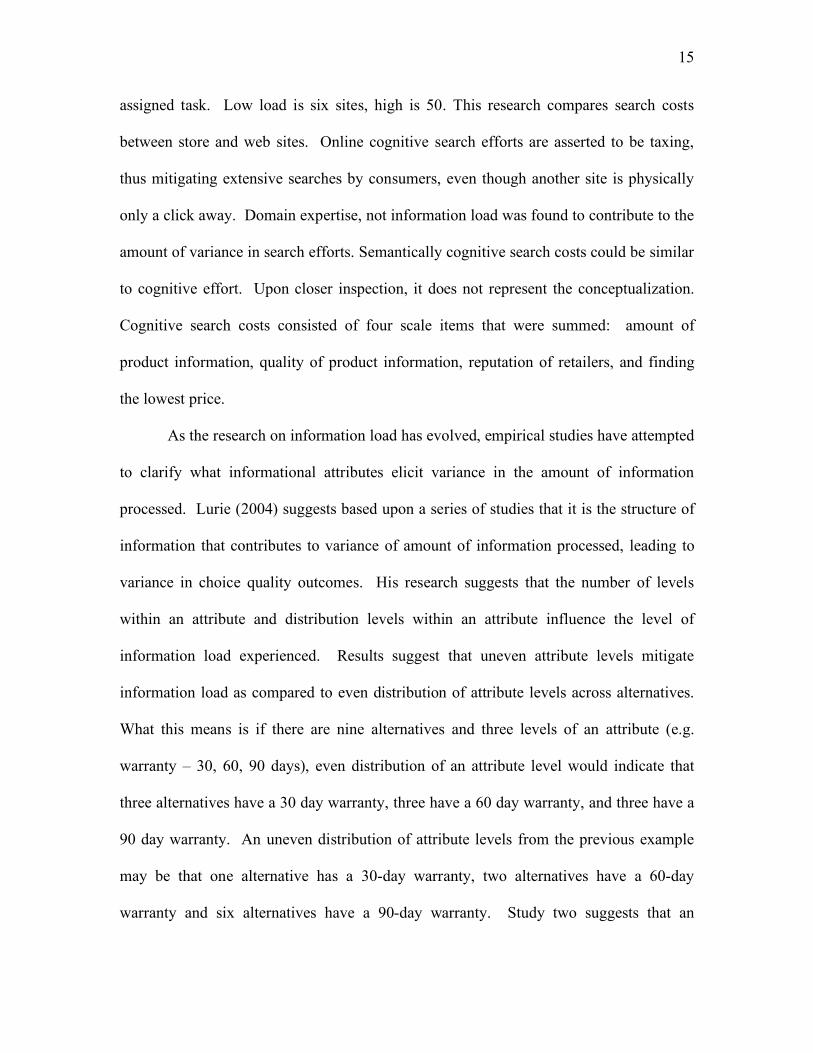
assigned task. Low load is six sites, high is 50. This research compares search costs
between store and web sites. Online cognitive search efforts are asserted to be taxing,
thus mitigating extensive searches by consumers, even though another site is physically
only a click away. Domain expertise, not information load was found to contribute to the
amount of variance in search efforts. Semantically cognitive search costs could be similar
to cognitive effort. Upon closer inspection, it does not represent the conceptualization.
Cognitive search costs consisted of four scale items that were summed: amount of
product information, quality of product information, reputation of retailers, and finding
the lowest price.
As the research on information load has evolved, empirical studies have attempted
to clarify what informational attributes elicit variance in the amount of information
processed. Lurie (2004) suggests based upon a series of studies that it is the structure of
information that contributes to variance of amount of information processed, leading to
variance in choice quality outcomes. His research suggests that the number of levels
within an attribute and distribution levels within an attribute influence the level of
information load experienced. Results suggest that uneven attribute levels mitigate
information load as compared to even distribution of attribute levels across alternatives.
What this means is if there are nine alternatives and three levels of an attribute (e.g.
warranty – 30, 60, 90 days), even distribution of an attribute level would indicate that
three alternatives have a 30 day warranty, three have a 60 day warranty, and three have a
90 day warranty. An uneven distribution of attribute levels from the previous example
may be that one alternative has a 30-day warranty, two alternatives have a 60-day
warranty and six alternatives have a 90-day warranty. Study two suggests that an

16
increase in the levels of attributes also lowers decision quality. As the amount of
information increased, the time spent per acquisition also increased. The information
structure and load were mediated by the decision rule used. Lurie’s contribution in this
area is he has empirically applied a mathematical formula that better predicted choice
outcomes than previous conceptualizations of information load. He has refined how
information load may be measured objectively on four dimensions that appear to better
predict choice quality outcomes. The online context used was a matrix positioned on one
page, displayed on a computer screen.
Lee and Lee (2004) compare traditional and structural approaches to information
load; in addition they extend Lurie’s work by manipulating the levels of attributes. Like
Lurie’s study, the experiment context was an online matrix that displayed the entire set of
product alternatives simultaneously on one a one-page computer screen. The product
was a portable CD player that the subject selected for a friend and each subject had two
minutes to complete the task. After two minutes the matrix disappeared from the screen.
The experiment was a 2x2x2 between subjects design with number of alternatives (18,
27), number of attributes (9, 18) and distribution of attribute levels across alternatives
(equal, unequal) being the independent variables. Contrary to Lurie’s results, increasing
the number of alternatives from 18 to 27, holding everything else constant, did not
significantly decrease the probability of making a correct choice. Mathematically, the
differences in the amount of information bits as calculated by formal information theory
between 18 and 27 alternatives, with the other two conditions being the same, was not
significantly different. Logit regression analysis, accounting for chance, was not
significant for the alternative coefficient. The increase in number of attributes from 9 to

17
18, however, did significantly increase the probability of decreasing choice quality.
Uneven distribution of attribute levels across alternatives also increased the probability of
increasing choice quality, supporting Lurie’s assertions. The number of attributes and
attribute level of distribution did produce significant results with regard to choice quality
and were better predictors of information overload than the number of alternatives.
Regarding subjective states, subjects felt more confused, less confident, and less satisfied
with 18 attributes versus 9. With 27 versus 18 alternatives, subjects were less confident
and more confused. Subjects exposed to unequal distribution levels were more confident
in their decision than those exposed to equal levels of distribution. In sum, the results
provided partial and full support for previous work on information structure. A key
difference is the impact that varying the number of attributes per alternative had on
choice outcomes and subjective states.
In sum, previous research suggests that the study of information load has made
progress in the past 20 – 30 years. Although decision quality appears to decline at higher
levels of traditional and structural load measurements, the influence of each of the
dimensions may vary by study and context. Information load has been operationalized in
different ways, however manipulating the number of alternatives and/or attributes among
treatments is common across many studies. What has been less consistent is the way in
which choice quality is determined. A review of choice quality will now be discussed.
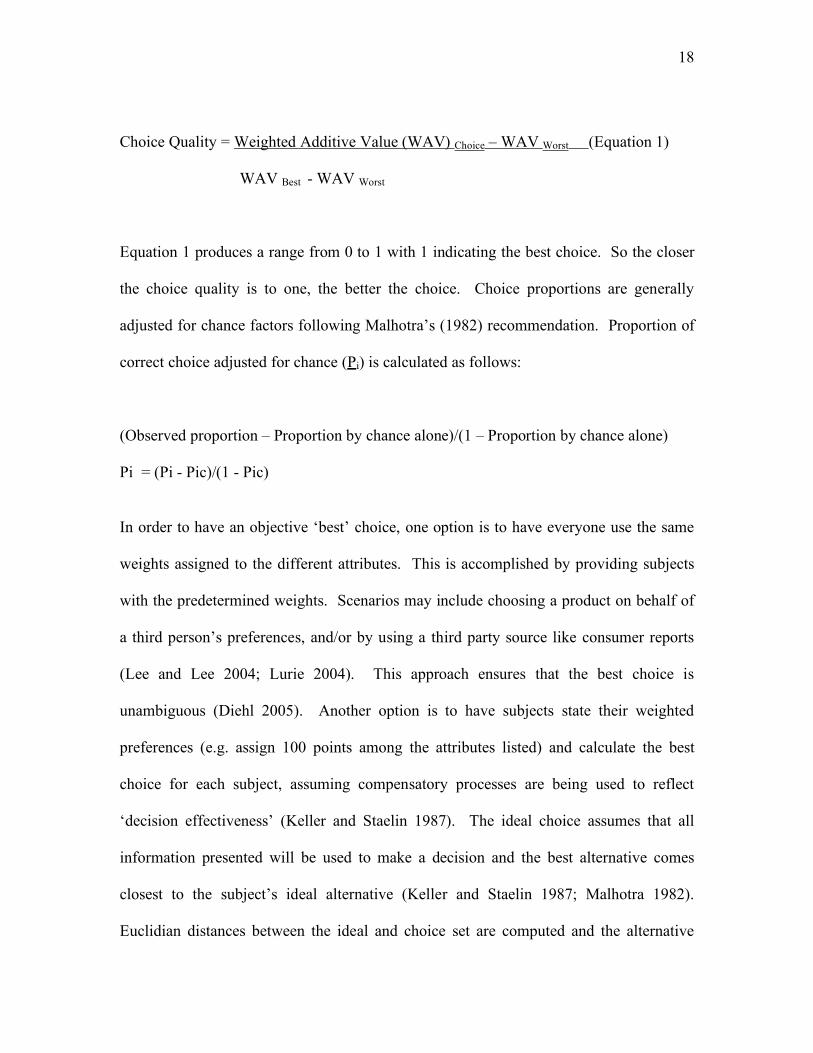
CHOICE QUALITY Choice quality is generally defined as the quality of choice made given the alternatives
available. The best choice may be determined by that which has the greatest weighted
additive utility. As an example Lurie (2004) used the following:
18
Choice Quality = Weighted Additive Value (WAV) Choice – WAV Worst (Equation 1)
WAV Best - WAV Worst
Equation 1 produces a range from 0 to 1 with 1 indicating the best choice. So the closer
the choice quality is to one, the better the choice. Choice proportions are generally
adjusted for chance factors following Malhotra’s (1982) recommendation. Proportion of
correct choice adjusted for chance (Pi) is calculated as follows:
(Observed proportion – Proportion by chance alone)/(1 – Proportion by chance alone)
Pi = (Pi - Pic)/(1 - Pic)
In order to have an objective ‘best’ choice, one option is to have everyone use the same
weights assigned to the different attributes. This is accomplished by providing subjects
with the predetermined weights. Scenarios may include choosing a product on behalf of
a third person’s preferences, and/or by using a third party source like consumer reports
(Lee and Lee 2004; Lurie 2004). This approach ensures that the best choice is
unambiguous (Diehl 2005). Another option is to have subjects state their weighted
preferences (e.g. assign 100 points among the attributes listed) and calculate the best
choice for each subject, assuming compensatory processes are being used to reflect
‘decision effectiveness’ (Keller and Staelin 1987). The ideal choice assumes that all
information presented will be used to make a decision and the best alternative comes
closest to the subject’s ideal alternative (Keller and Staelin 1987; Malhotra 1982).
Euclidian distances between the ideal and choice set are computed and the alternative

19
with the shortest distance is considered the optimal choice (Jacoby, Speller and Kohn
1974; Malhotra 1982). A satisficing choice measure has been operationalized by as
either the closest or second closest to the ideal alternative (Malhotra 1982).
Through a series mathematical steps, Keller and Staelin (1987) calculated task
ease (TE) for each condition based in part on the cumulative differences in total utilities
for each of the alternatives available. The best choice total utility score started the
equation followed by subtracting the utilities from the second best choice and so on.
Large utility differences between alternatives would imply a large TE score, meaning the
task was easier as compared to when differences between alternatives were small (given
the same number of alternatives), which would calculate a smaller TE score, implying
selecting the best alternative would be more difficult. They used this objective measure of
task ease as a variable in regression analysis, in addition to amount of information and the
quality of information to determine a satisficing choice quality outcome.
Meyer and Johnson (1989) questioned this model and reanalyzed Keller and
Staelin’s data. Their conclusions raised some speculation about the accuracy of the
model and concluded that there will always be measurement error when using models to
define optimal decision (Keller and Staelin 1989). Interestingly Keller and Staelin’s
formula relates with the concept that similar products are harder to distinguish, thus
requiring more cognitive effort to distinguish differences in order to make a decision for
selection. Earlier work may have determined best choice by selections that had the least
difference between the ideal choice and the actual choice (Jacoby, Speller, and Kohn
1974) or by using part worth utilities following an additive compensatory rule (Keller and

20
Staelin 1987). Rank order accuracy was another method (Jacoby, Speller, Kohn-Berning
1974).
In sum, the operationalization and calculation of choice quality across various
experiments has not been without active dialogue and discussion. Designing a study that
avoids the use of individual personal preferences and creating an alternative that is a
superior choice based upon objective standards appears to be the most experimentally
robust approach.
CROWDING Perceived crowding has been defined as a psychological state that occurs when a person’s
demand for space exceeds the supply (Stokols 1972). Crowding may refer to the number
of people, objects, or both in a limited space that restricts or interferes with an
individual’s goal achievement (Machleit, Eroglu, and Mantel 2000). The key point is that
crowding is a perceived and subjective state (Eroglu and Harrell 1986). Early empirical
studies used variance in densities of people and objects to see how these atmospheric
variables elicited perceptions of crowding (Harrell, Hutt, and Anderson 1980; Eroglu and
Machleit 1990). Eroglu and Machleit’s (1990) simulation study suggests that high retail
density is positively associated with perceptions of retail crowding, of which is
particularly accentuated under goal oriented task conditions. High retail density
combined with time pressure was negatively related to shopping satisfaction. Hui and
Bateson (1991) found that consumer density directly and positively influenced
perceptions of crowding. Perceived control was also found to attenuate perceptions of
crowding, which may suggest implications in an online environment (Hoffman, Novak
21
and Schlosser 2003). In Machleit, Eroglu and Mantel’s (2000) study, spatial crowding
was associated with negative feelings and a decline in shopping satisfaction.
The concept of crowding has been classified as an environmental variable in
research that may interact with a person to produce a behavioral response (Stokols and
Altman 1987). One framework used in empirical studies has been the Stimulus-
Organism-Response model in offline (Hui and Bateson 1991; Huang 2000), as well as
online contexts (Menon and Kahn 2002; Eroglu, Machleit, and Davis 2003). The
stimulus within this framework can represent a variety of factors from people, objects,
color, music etc. The responses measured can vary as well. Table 1 provides a relevant
summary of factors used in the Overload Model of Crowding. Environmental factors
within the overload model have included the number of interactions, spatial construction,
and environmental demands. Mediators tested include one’s perceived intensity,
complexity, novelty and unfamiliarity of the environment, with the responses including
one’s attention allocation, attention capacity, and cognitive fatigue.
Overload Model of Crowding Saegert’s (1973; 1978) work suggests that high-density environments increase the
demands on peoples’ attention capacity. Milgram (1970) discusses overload in terms of
systems analysis. Specifically as the number of people increase, the overall involvement
allocated to each individual decreases. When demand exceeds capacity, overload occurs
and adaptive responses ensue. The same could apply to information. As the information
presented increases, the allocated attention required by an individual to process the
stimuli increases. When attention effort required exceeds capacity, overload will occur
and adaptive responses like selective screening of stimuli may result and/or feelings of

22
cognitive fatigue (Cohen 1978; 1980). So the overload model, focusing on the number of
interactions (e.g. the number of web pages and products viewed), the spatial construction
of information (the number of features and wording associated with each feature), and the
environmental demands (e.g. task oriented) aligns with the operationalization of the three
independent variables proposed. Information breadth, depth, and density are forms of
online visual stimuli. The interaction of these stimuli with the subject is posited to create
responses.
The environmental stimulus, organism and response framework may be
conducive for online contextual research because one form of behavioral response can be
captured with clickstream data (Menon and Kahn 2002). Capturing the depth (the
number of pages explored within a site) and breadth (the number of different sites
explored) and the respective lack thereof may operationalize approach and avoidance
behaviors. In terms of environmental stimulus, Huang (2000) used novelty and
complexity to operationalize information load. Complexity reflected three factors; degree
of complex information, the scale of information, and the degree of crowdedness.
Novelty reflected dimensions of being surprising, rare, and contrasting. Each dimension
had a different impact on behavior. Complexity was negatively associated with the desire
to explore, whereas novelty had a positive relationship. Eroglu, Machleit and Davis
(2003) found that online stimuli (e.g. color, pictures) that elicited pleasure were
positively related to approach behaviors. Pleasure is one of the emotional responses
modeled by Mehrabian and Russell (1974) in environmental psychology that is posited to
precede behavioral outcomes. In a previous offline study, spatial crowding was
negatively related to pleasure (Machleit, Eroglu, and Mantel 2000).
23
In sum the concept of overload suggests that when the amount and rate of
environmental input exceeds one’s capacity to cope, behavioral adaptation will occur
(Harrell, Hutt, and Anderson 1980). The environmental input can be a wide variety of
factors that captures an array of different dimensions. Approach and avoidance behaviors
from the stimuli are two outcomes that have been modeled. As Kotler (1973) stated,
retailers should focus on designing buying environments that enhance purchase
probabilities. The design of the online retail web site should be no different; however,
retailers need to be mindful of other buyer effects that their online merchandise
presentation may be evoking. Online atmospherics has been defined as the “the
conscious designing of space to create certain buyer effects” (Eroglu, Machleit, and
Davis 2003). Atmospheric effects elicited from informational presentation factors are
explored in the proposed study. Factors that influence how a person may cope with
environmental input may be a function of the difficulty of the task, the amount of
interaction, the individual’s personal characteristics, and his/her previous experience and
prior expectations (Harrell and Hutt 1976). Next research covering the various cognitive
effects from being exposed to stimuli will be discussed.
COGNITIVE LOAD AND INFORMATION PROCESSING Limited Working Memory Research and discussion about how people process information and their respective
limitations can be dated back to at least 1956 when George Miller wrote “The Magical
Number Seven, Plus or Minus Two: Some Limits on Our Capacity for Processing
Information” (Miller 1956). He summarized experiments conducted up to that time that
covered a variety of domains, from musical tone and pitch recognition to the recall of
24
visual displays used in the Air Force. With one-dimensional stimuli he suggested that
people possess a small and finite capacity for making one-dimensional judgments. He
proposed that the “span of absolute judgment is somewhere in the neighborhood of
seven.” (Miller p. 348) with implications being that people are limited in their ability to
receive, process, and remember. In order to manage these limitations, methods of
measuring the load of stimuli presented were suggested.
Processing Capacity
The concept of a limited working memory is incorporated and expanded upon in
the Information Processing Theory of Consumer Choice (Bettman 1979). Within this
framework, processing capacity plays a pivotal role. Factors suggested that influence
one’s processing capacity are motivation and the attention one allocates to the
information. One who is highly motivated is posited to exert more effort, thus positively
influencing processing capacity allocated to the task. An increase in processing capacity
may result in greater attention being directed toward the stimulus, thus influencing the
information that is acquired and evaluated in the decision making process.
The relationship between attention and processing capacity is reciprocal, meaning
that the greater the attention given to a stimulus, the greater the pull on the processing
capacity’s resources. Conversely, a decrease in processing capacity may result in one
attending to less information, thus acquiring and evaluating less information, and
influencing decision processes because of the information used (or ignored) to make a
choice. Thus processing capacity is posited to directly and indirectly influence decision
processes. Processing capacity indirectly affects decision processes through its impact on
attention, information acquisition and evaluation. Processing capacity is also posited to

25
influence the goal hierarchy. How all this relates to the choice outcome is that goal
hierarchy provides the steps necessary to achieve the desired state. As a result, one’s
attention focuses on that information that is perceived to be relevant for the task at hand.
The assumption is one’s goal hierarchy governs one’s attention (Bettman 1979). This
framework suggests that the amount, the rate, and how the information presented may
influence how the person is able to process the information (Painton and Gentry 1985).
Another influential factor is one’s level of motivation to process the information.
The perceived relevancy of the information is to one’s established goals may influence
the level of processing allocated. If the information presented exceeds the person’s
ability to process, cognitive overload may occur (Jacoby 1984; Baum and Paulus 1987;
Eppler and Mengis 2004). The proxy indicator for cognitive overload has been the point
where decision quality declines. Subjective states have been captured as outcome
variables when exposed to stimuli.
Cognitive States
The previous discuss raises the question of how one’s cognitive affect state
during the decision-making process may influence the quality of the decision outcome.
One could describe it as the cognitive-affect state during the process of processing
information. As Turley and Milliman (2000) explain, “atmospheric variables can be
conceptualized as stimuli leading to some cognitive affect within the individual, which in
turn, leads to some behavioral response” (Turley and Milliman 2000, p 194.) The context
of their statement refers to a bricks and mortar store. So, an extension of this work would
be to test how ‘the conscious designing of space’ (Eroglu, Machleit and Davis 2003) with
information create online atmospherics. Specifically how the sequence, spacing, and
26
format of the information affects the cognitive state of a person. Given the intensive
information available on the Internet, the discussion will now focus on cognitive studies
within the Human-computer interaction (HCI) literature.
“Human-computer interaction is the study of how people interact with computing
technology” (Olson and Olson 2003, p 492). The human-computer interaction (HCI)
field includes the field of cognitive psychology, in addition to other social sciences.
Cognitive modeling attempts to understand in detail the involvement of the cognitive,
perceptual and motor components in the moment-by-moment interaction a person has
when interacting with a computer (Olson and Olson 2003). This approach in part,
attempts to better understand and predict what choices people will make when faced with
alternative methods. An overarching framework is the executive process-interactive
control (EPIC) by Kieras and Meyer (1997) (as cited by Olson and Olson 2003).
Components of the model include task environment, working memory, visual and
auditory inputs and visual and auditory processors. All these factors are posited to
facilitate, in part, the moment-by-moment interactions, perceptual processes and
responses.
So human-computer interaction field is not distinctly different from information
processing as discussed in the marketing literature. The EPIC framework is different in
that it overtly acknowledges the visual and auditory inputs and processors as distinct
contributors to behavioral outcomes. The implication is that in the online context, visual
cues may take on a more prominent influence as compared to other shopping contexts.
Like cognitive modeling, the development and testing of the construct cognitive effort
will attempt to better understand how a person’s cognitive and perceptual involvement
27
interacts with the visual stimuli online in a given a task situation to see the perceived
cognitive and affective states it may elicit.
COGNITIVE EFFORT Cognitive effort is defined in this study as one’s perceived degree of cognitive effort
required, in order to accomplish a task, using the information presented. Variance in
perceived cognitive effort among individuals given the same informational stimuli is
likely. One factor may be a person’s product, task, or decision making experience, thus
pulling additional informational sources from long-term memory when processing
information and making a decision. Individual and situational factors may also influence
the informational processing efficiency of subjects (Moschis and Mosteller forthcoming),
thus resulting in the variance of cognitive effort exerted. Individuals with lower
processing efficiency may find the same task more cognitively effortful than others who
are able to process information more efficiently.
Ease of Use
Related concepts to cognitive effort have been used in various domains. In the
information sciences literature ease of use (EOU) is a common construct, typically
associated with the technology acceptance model (Davis 1989; Venkatesh and Davis
1996; Gefen and Straub 2000). One could assert that ease of use may be on the positive
side of the same scale, with high cognitive effort on the negative affect side. Cognitive
effort would be the overall scale descriptor. High cognitive effort denotes effort and low
cognitive effort denotes ease of use. Another perspective is that a person who scores a
system low on ease of use could be interpreted as the system or technology is hard to use,
although that may not be what the respondent meant. That’s an assumption the
28
researcher would prefer to address directly by constructing and testing factors and
developing scales that directly address the research questions proposed, although using
and testing items from related scales in the scale and construct development.
A key distinction between ease of use and cognitive effort is that cognitive effort
is focused on the task and how the information stimulation may facilitate or hinder the
processing of information. So questions relating to the ‘system’ may be inappropriate
given that the system investigated is one’s processing capacity interacting with visual
stimuli. Although one could counter-argue that the ‘system’ is a combination of the
person and the computer generated information. A one-dimensional scale could be
anchored with perceived task ease and task strain. Keller and Staelin (1987) modeled
task ease as a function of information quantity and quality, with quantity of information
having a negative influence and quality of information a positive influence on task ease.
This framework suggests that information that helps to differentiate alternatives (quality)
while not being taxing on processing capabilities (quantity of information attended to),
would elicit greater task ease, thus demanding fewer cognitive resources (less cognitive
effort) than information that was very similar and in great quantity.
This discussion suggests that the factors that may contribute to the development
and measurement of cognitive effort may be related to the ease in which one was able to
accomplish the assigned task. Factors related to the task would be information quantity,
information quality, and the ease in which the online visual presentation facilitated
meaningful comparisons.

29
Stress
Another related state of being with regard to cognitive effort is stress. Stress is an
imbalance between the environmental demands and response capabilities of the organism
(Lazarus 1966). Stress may occur when environmental stimuli tax a person’s coping
abilities (Evans and Cohen 1987). Daily hassles can be characterized as one type of
stressor, which are described as typical events that cause frustration, tension or irritation
(Evans and Cohen 1987). Strain is a result of stress that may have direct effects on
psycho-biological well-being (Terluin, Van Rhenen, Schauffelis, and De Hann 2004). So
changes in psychological well-being from the beginning to the end of the task would
suggest that the task and the information presented could contribute to cognitive stress
and strain. A key implication is that it is the individual’s perception of environmental
demands and coping resources that determine the nature of the stress response (Evans and
Cohen 1987). So if the information stimuli are perceived as exceeding one’s capabilities
of performing the task at hand, stress may result. These findings suggest that the longer
one is exposed to (time) a perceived stressful situation, the more likely strain is to occur.
Thinking costs
Shugan (1980) suggests that there are ‘costs’ associated with decision-making and
that the more difficult the choice (a function of the number of alternatives), the higher the
‘thinking costs’ associated with the decision. This would suggest that those conditions
that have a higher number of alternatives should be associated with higher thinking costs.
On a related note, Iselin (1993) describes the inputs used to make a decision as data load.
This could include the amount of attribute information, as well as the number of
alternatives presented. He suggests that the greater the data load, the greater the filtering

30
of information by the decision-maker. Errors in the filtering process lead to lower
decision quality. So Shugan focuses on the amount of information one attends to as
creating greater cognitive difficulty, whereas Iselin focuses on the effort exerted in the
filtering process. Quantity, load, and uncertainty are three high/low dimensions Iselin
uses to operationalize task difficulty (Iselin 1993). This discussion suggests that
‘thinking costs’ associated with a task are a function of the task complexity and the
quality and quantity of information provided to complete the assignment. Task
complexity would be positively related to ‘thinking costs’, information quality negatively
related, and information quantity may have an inverted U formed relationship.
Confusion
Related subjective measurements captured in information load studies include
decision satisfaction, certainty of best decision, level of confusion while performing the
task, and likelihood of not selecting the product with the greatest value (Jacoby, Speller,
and Kohn 1974b). Within this set, all of them with exception of level of confusion while
performing the task are outcome variables, while level of confusion describes a state
during the process. Thus statements that tap into dimensions similar to confusion (e.g.
complex, difficult), in addition to level of confusion, may be appropriate for testing in the
scale development of cognitive effort. In a related study, subjective states were identified
as either concurrent with and subsequent to the purchase decision (Jacoby, Speller, and
Kohn- Berning 1974a). Level of confusion was a subjective state that was positively
related to the number of alternatives and found to be negatively related to the degree of
relative attractiveness of alternatives (Malhotra 1982). So again, the task complexity if
operationalized as the number of choices, and the quality of information, operationalized

31
as providing product differentiation, appear to be related to a cognitive affect state of
confusion.
DECISION SATISFACTION Decision satisfaction is defined as the degree of satisfaction with one’s choice in a
decision making task. Decision satisfaction has been operationalized as “How satisfied
are you with your decision?” (Jacoby, Speller, and Kohn 1974). Malhotra (1982), as well
as Lee and Lee (2004) have captured this outcome variable in information load
experimental studies. These studies indicate that when people are overloaded they feel
less satisfied. The interesting twist is that under high information load conditions, people
are less satisfied with their choices, assuming they are overloaded. What if they are less
satisfied because they know they did not attend to all the information (e.g. using heuristic
processing) due to high information load conditions, thus they are less satisfied due to
their lack of certainty in making the best decision? In this case there may be a negative
relationship between cognitive effort and decision satisfaction. Why would be a
consumer use cognitive shortcuts? Levels of situational involvement and enduring
choice involvement may provide insight.
PRODUCT INVOLVEMENT Involvement has been defined as a person’s perceived relevance of the object based on
inherent needs, values and interests (Zaichkowsky 1985). If a person has a high need or
interest in an object then it is posited that he/she will be more motivated to exert
processing capacity in processing information related to that object. Conversely, if a
person has little or no interest in the object, then little motivation and thus attention and

32
processing capacity may be allocated (Bettman 1979). Typical items used to measure
involvement include the following semantic anchors: important/unimportant, of no
concern/ of concern, irrelevant/relevant, useless/useful, means a lot to me/means nothing
to me. Involvement, given its influence on processing capacity, which is posited to
influence cognitive strain as an individual variable, will be examined in this study.
CHOICE INVOLVEMENT - MAXIMIZER/SATISFICER Given the increase in product choices available in the marketplace, Schwartz (2004)
suggests that this increase in options has shifted accountability of making the best
product choice from the firm to the consumer. Put another way, historically if a person
went to the grocery store to buy a pound of coffee, there may have been five alternatives.
Given the overall lack of choice, a consumer could justify their decision outcome by
saying to another or thinking to his or herself, ‘well, that’s all that was available, so it’s
not my fault if it was not the best choice.’ Conversely, if a consumer goes into the store
today, he/she may have a choice among 50 different coffees, factoring in brands and
flavors. Under this condition, the consumer may feel greater accountability for making
the ‘best’ choice since the options are so plentiful. Schwartz classifies people into two
overarching categories. One is a Maximizer, the other is a Satisficer. A Maximizer tends
to engage in more product comparisons, take longer to decide on a purchase, is more
likely to experience regret after a purchase, and feel less positive about purchasing
decisions (Schwartz 2004). Another way one could describe a Maximizer is that he/she
may be more likely to engage in ‘analysis paralysis’ – analyze many options extensively
to the point where he/she becomes overwhelmed and avoids making a decision. From a
theoretical standpoint, a Maximizer might be classified as a systematic processor of
33
information and a Satisficer a heuristic processor of information in a choice context
(Chaiken 1980). This personality trait has had little empirical testing within the
marketing domain (Schwartz et al 2002). One study suggests that Maximizers are less
satisfied than Satisficers with consumer decisions and more sensitive to regret (Schwartz
et al 2002). A choice outcome experiment in an online context, where retailers generally
provide the greatest assortment of product information, seems well suited for testing this
personality trait, positioned as an enduring trait of choice involvement (Schwartz 2004).

34
CHAPTER III
MODEL AND HYPOTHESES The model tested is depicted in Figure 1. The three independent variables representing
information load are product breadth, depth and density. Product breadth is
operationalized as the number of alternatives, which will also be a function of the number
of pages viewed. The more alternatives one has to choose from, the more pages one has
to view. Product depth refers to the number of attributes for each alternative. The more
attribute information available, the greater the product depth. Density is the third
dimension and this is represented by the number of words per page. Specifically the
more words associated with the product, the greater the information density. So in a low
density situation, the attribute information may be presented in bullet points. In a high
density situation, the attributes may be described in short sentences.
These three informational dimensions represent the online stimulus. The first two
dimensions, breadth and density, have been studied extensively within an information
processing framework, directly measuring the outcomes depicted in the response section.
The third factor, density, has not been extensively studied within a website context and is
typically examined using an environmental psychology framework (Stimulus-Organism-
Response). This model integrates conceptualizations from information processing theory
and environmental psychology. The consumer factors (organism) represent how the
person perceives and evaluates the informational stimuli. Within this consumer factors
section, motivational factors are examined as moderators on perceived cognitive effort.
These factors are also theoretically congruent with information processing theory, since
motivation plays a pivotal role in the allocation of processing capacity. Cognitive effort
35
is posited to be a mediator between the informational stimuli and response outcomes.
Choice quality is an objective response measure, determined by the weighted additive
utility difference between the actual and worst choice, divided by the weighted additive
utility difference between the best and worst choice (Lurie 2004). The consumer’s
product choice is a behavioral response reflecting choice quality based upon the
alternatives available. Time spent on the task is also an objective behavioral measure,
captured by the online survey software system. Time spent is posited to be indirectly a
function of the amount of information processed, mediated by the perceived effort
required to perform the task. Decision satisfaction is an attitude the consumer forms
based upon the search and selection experience.
It is generally accepted that humans have limited processing capacity to attend to
a certain amount of information at any given time (Epplis and Menger 2004). This
processing limitation suggests that the greater the amount of information one has to
attend to in order to complete the task, the greater the perceived cognitive effort the
information presented in the task will elicit. Previous empirical studies suggest that as the
number of alternatives increases, dysfunctional consequences may occur like declines in
decision certainty and increases in confusion (Jacoby, Speller, and Kohn 1974; Malhotra
1982; Keller and Staelin 1987; Lee and Lee 2004). Malhotra’s (1982) findings suggest
that 25 or more alternatives may be a generalized point across a population where the
processing capacity of people may be overloaded. Hence,
H1: Product information breadth (#alternatives) will be positively related to
perceived cognitive effort with the task.
36
If the hypothesis is supported, then previous empirical work will be supported and theory
extended in a multiple page online viewing context.
Level of motivation is positively related to processing capacity (Bettman 1979).
Since Maximizers can be described as ‘perfectionists’ with regard to choice (Schwartz
2004), they will be more likely to have higher motivation to process all the information,
thus allocating more processing capacity to the task. Under the same information load
conditions, Maximizers should report lower overall cognitive effort as compared to
Satisficers. At low or moderate levels of load, Maximizers may experience lower
cognitive effort due to higher allocated processing capacity and because the load has not
exceed the capabilities of the subject. Hence it is hypothesized that:
H1a: Product information breadth (#alternatives) will be less positively related to
cognitive effort for Maximizers than Satisficers.
To test and distinguish these enduring personality traits from situational traits, product
involvement will also be investigated. Higher product involvement would suggest one’s
motivation to attend and process the information presented would be related to one’s
allocation of processing capacity (Bettman 1979; Zaichkowsky 1985). Higher
involvement thus may attenuate cognitive effort – up to a certain point. At high load
conditions, product involvement may be positively associated with cognitive effort,
however, since product involvement is associated with higher processing capacity
allocation, the following hypothesis is proposed. …
37
H1b: Product information breadth (# alternatives) will be less positively related to
perceived cognitive effort under conditions of high product involvement versus low
product involvement.
An increase in the number of attributes per alternative has been empirically
associated with a decrease in decision accuracy and choice quality and an increase in
confusion (Helgeson and Ursic 1993; Malhotra 1982; Lee and Lee 2004). These
outcomes may suggest that when the number of attributes exceeds a certain threshold,
confusion and/or uncertainty with the task may increase. Therefore it is posited that…
H2: Product information depth (# attributes per alternative) will be positively
related to cognitive effort.
As previously discussed, level of motivation is positively related to processing capacity
(Bettman 1979). Since Maximizers can be described as ‘perfectionists’ with regard to
choice, they will be more likely to have higher motivation to process all the information,
thus allocating more processing capacity to the task. Under the same information load
conditions, Maximizers should report lower overall cognitive effort as compared to
Satisficers. Theoretical explanation from information processing using motivation as a
key influencer of perceived cognitive effort will guide the assertion for the following
hypothesis.
H2a: Product information depth (# attributes per alternative) will be less positively
related to cognitive effort for Maximizers than Satisficers.
38
Situational involvement with the product is posited to relate positively to the processing
capacity allocated to the task, thus mitigating the effects of cognitive effort (Bettman
1979). Variation in involvement is expected to correlate negatively with cognitive effort
up to certain information load thresholds. Therefore the following prediction is offered.
H2b: Product information depth (# attributes per alternative) will be less positively
related to cognitive effort under conditions of high product involvement.
Offline spatial density has been positively associated with perceptions of spatial
crowding, which has been positively associated with negative feelings and negatively
associated with shopping satisfaction (Machleit, Eroglu, and Mantel 2000). Crowding
literature typically associates the density of people and/or objects with perceived
‘crowding’ responses, which may in turn elicit responses of pleasure and arousal, and
manifest into approach or avoidance behaviors. If online informational crowding elicits
variance in cognitive effort, then this finding will be a contribution. Online crowding,
operationalized as words per page, has not been empirically tested for effects. If
decreasing online crowding attenuates cognitive effort under the same information load
conditions, then one practical contribution could be in online merchandising design. This
result would suggest that by enhancing the ‘white space’, a reduction in cognitive effort
may be achieved, which may also associate with favorable attitudes toward the website
and online retailer.
H3: Product information density (# words/page) will be positively related to
cognitive effort.

39
Within this study, density is posited to behave as an environmental stimulus as described
in the Overload model. As the level of stimulus increases, it is suggested that
Maximizers will be more motivated to process the information given their desire to
reduce uncertainty in their decision-making (Schwartz 2004). For each attribute there
will be sentences describing the attribute versus bullet points. This additional
information may be perceived more positively by Maximizers than Satisficers, thus
attenuating perceptions of cognitive effort. At higher loads of attribute levels cognitive
overload may be more likely (Lee and Lee 2004). So although an increase in reported
effort may occur between both Maximizers and Satisficers, it is posited to be greater for
Satisficers.
H3a: Product information density (# words/page) will be less positively related to
cognitive effort for Maximizers than Satisficers.
H3b: Product information density (# words/page) will be less positively related to
cognitive effort under conditions of high product involvement versus low product
involvement.
Given the cognitive processing limitations of humans to be only able to process a limited
amount of information at one time, it is suggested that as the number of chunks of
information (defined as the number of alternatives and the number of attributes per
brand) increases, the ability of a human to process all of the information systematically
will decline. Consumers may adapt by resorting to heuristic processing strategies that

40
help them manage this overload (Payne, Bettman and Johnson 1993). This means that
information may be selectively attended to, thus implying important or relevant
information may be ignored. Therefore the following is suggested.
H4: Cognitive effort will be negatively associated with choice quality. Previous empirical studies suggest that the higher the information load, the more time
spent on the task, simply due to the more time it takes a person to process more
information (Helgeson and Ursic 1993; Epplis and Menger 2004). If this hypothesis is
not supported then discussion around processing style and how that may mediate time
spent can be expatiated upon. In previous research time spent on a choice task has also
been used as a proxy for cognitive effort (Garbarino and Edell 1997). So if cognitive
effort and time spent are considered related, it is expected that perceived cognitive effort
should be positively related time spent on the task. If cognitive effort is positively
associated with information load, then this would suggest that higher cognitive effort may
in a longer time to complete the evaluation and task. Thus the following hypothesis is
offered.
H5: Cognitive effort will be positively related to time spent on task. Complexity theory suggests that environmental complexity is positively associated with
uncertainty. Since cognitive effort is asserted to be positively related to information load
(in essence a more complex online environment), cognitive effort may also be associated
with uncertainty, creating doubt in the consumer’s mind regarding one’s confidence in
his/her selection.

41
Confidence in the product selection is posited to be positively related to decision
satisfaction. Thus it is expected that the degree of uncertainty in making the best decision
may be negatively related to decision satisfaction. Thus the following is predicted.
H6: Cognitive effort will be negatively related to satisfaction with product selection.

42
CHAPTER IV
RESEARCH DESIGN AND METHODOLOGY
EXPERIMENTAL DESIGN The research employed a 2 x 2 x 2 between subjects experimental design. For each
dimension of information load, two levels (high/low) within each dimension were tested.
Presented in Figure 2 is the experimental matrix that outlines how each of the
independent variables and levels will work within each of the cells.
The first dimension of information load is product information breadth, defined as
the number of alternatives presented to each subject. Low and high breadth levels
utilized 10 and 30 alternatives respectively. Results from a pilot test demonstrated
significant perceived differences between subjects exposed to one of these two levels of
alternatives. One factor determining these specific numbers is that the total number of
alternatives is divisible by the number of alternatives presented on each page, so a
consistent number of products are presented on each page in both experimental
conditions. As the matrix in Figure 2 demonstrates, two and six pages were used, with
five alternatives shown per page. Thus the total number of alternatives presented was 10
and 30 respectively.
The alternatives presented were in a matrix format, similar to the other studies
discussed, with alternatives presented horizontally adjacent to each other with their
respective attributes listed underneath.
The product information depth was the second manipulated independent variable.
This dimension was manipulated by varying the number of attributes (5 and 15). The
reason for this descriptor is because the amount of attribute information presented may be
43
considered the informational depth presented about a product. Although the terms of
breadth, depth, and density are used in retailing, these terms are operationalized slightly
differently due to the independent dimensions referring to a product in an informational
context. So product depth refers to the number of attributes presented for each
alternative.
The third independent variable, product information density, refers to the density
of information provided about each attribute. Informational density was operationalized
by the words per page. The words per page can be considered an objective measure of
density and pre-tests in the pilot study confirmed that subjective perceptual differences
exist between low and high-density conditions. For low-density conditions, attributes
were described using bullet points. For high-density conditions, attributes were described
using brief descriptive sentences for each attribute. An example of each of the treatment
conditions is provided in the appendix.
One picture of a product was used in the header. This picture of the product
appeared on each page and was the same picture across all pages and across experimental
treatments. Pictures of individual products for each cell were not used, since these
graphical cues may confound the effects under investigation.
SCENARIO Subjects were tasked with selecting a digital video camera for a person based upon this
person’s predetermined criteria. Subjects were randomly assigned to one of eight
different treatments, as outlined in the matrix discussed previously. There was no time
constraint in terms of making a decision. In addition, to enhance experimental realism,
subjects could click back and forth between product comparison pages freely prior to
44
making a final selection. The final selection page also reiterated the feature criteria and
the relative importance of each feature for the choice task.
STIMULI DEVELOPMENT The price attribute was fixed and the attribute importance on five features provided. This
pre-determined attribute criterion for choice selection was used so the same objective
measure for quality of choice across could be measured against all subjects. A search
across several consumer electronics retailer websites helped to determine the attributes
selected, with the objective of creating experimental realism (Schulz 1999). The
categories and order of attributes listed on each website helped to determine the attributes
chosen. For example if the online retailer offered a search option by attribute (picture
quality), this feature was taken into consideration. In addition, the five attributes selected
typically demonstrated different feature levels of each attribute offered among the
products (e.g. pixels, LCD screen size, and weight).
For the pilot and main study an excel spreadsheet was developed, listing each
attribute in a series of rows with each column representing an alternative. The values for
each attribute level were assigned a numeric value (e.g. 1, 2 or 3) depending upon the
attribute level exhibited (e.g. 30, 60, or 90 day warranty). Care was taken to ensure that
the differences among the levels within each attribute were equivalent so that the numeric
value assigned and used in the weighted added value calculation would represent an
objective score beyond reproach. In addition, for those alternatives with 15 attributes
displayed, two levels for each of the 10 additional attributes were employed. The first
level was scored as 0, the second (higher) level scored as 1. The sum of the simple
counts within each treatment were also analyzed to ensure the best choice was
45
unequivocal if one were to argue that the presence of additional features would enhance
the overall choice quality, above and beyond the levels and respective values of the five
attributes provided.
The number and dispersion of attribute levels across all treatments were then
evaluated to ensure consistency and homogeneity across treatments, minimizing
confounding effects from effects of varying information structure (Lurie 2004). The
differences in quality (calculated by the weighted added utility) between adjacent
alternatives and among all alternatives within and across each treatment were evaluated
to minimize task difficulty confounding effects (Keller and Staelin 1987). The average
difference in quality score among each alternative within a set was kept within a limited
range across all treatments.
Another broader scoped technique employed with the stimuli development was
the randomization of pages within each treatment, to reduce the impact of order effects
influencing one’s product selection (Diehl and Zauberman 2005).
PRETESTS AND PILOT TESTS Prior to launching the main study, paper and pencil experimental instruments were
conducted with students in an undergraduate marketing class. In addition an online
experimental pilot test with a convenience sample of adults was performed.
PRETEST The purpose of the pretest was to test the appropriateness of the experimental procedure
in terms of instruction comprehension, task flow, and to test the reliability of scale items
proposed for key constructs (Perdue and Summers 1986). For the pretest, students in an
46
undergraduate marketing class were used. Students were randomly assigned to one of
two treatments within the context of a choice exercise, as a way of illustrating different
decision making strategies employed by consumers. One treatment consisted of seven
alternatives with seven features per alternative, with features described in a one-word
format. The second treatment consisted of 14 alternatives with 14 features per
alternative. The features in the second treatment used multiple word descriptors. Digital
cameras represented the product alternatives.
Students were tasked with selecting the best product from the alternatives
presented, based upon a five-feature criteria, with all features assigned equal weight.
Afterwards students answered questions to describe their search and selection experience.
Cognitive effort, product involvement, and choice involvement measures were tested for
reliability. A sample of the questionnaire is provided in Appendix A.
The series of questions within question one represented scale items developed to
measure cognitive effort. Question five represented scale items used to measure product
involvement (Zaichkowsky 1985). Questions 6 through 13 represent a sample of scale
items developed by Schwartz (2004) to test to what degree a person may range from
being a Satisficer to a Maximizer in terms of choice involvement.
Preliminary results for the five scale items measuring cognitive effort
demonstrated good reliability across the 32 subjects (α=0.894), as indicated in Table 2.
For product involvement, acceptable reliability measures were also achieved
(α=0.917), as indicated in Table 3, reflecting 8 items.
47
For choice involvement, however, the 8 measures used did not achieve an
acceptable level of reliability (α=0.548), as indicated in Table 4. As a result, additional
scale items were developed for further testing prior to the main study. Also noted was
that product involvement skewed toward the high end across subjects with a mean of 35
out of a possible total of 40 points. The variance of product involvement response scores
was greater among women than men, but not significantly.
Subjects commented on how equally weighting the importance of each of the
attributes contributed to the ease of the selection task. This was also evidenced by marks
made on the paper next to attributes. Several subjects determined their final product by
simply counting the number of best features across all products presented. The product
with the highest number of best features was selected. Best feature is defined as the
product having the highest level of a desired attribute (e.g. 30, 60, or 90 day warranty – a
90 day warranty would be considered the best). This raised the issue that the best product
among the choices offered should be objectively and unequivocally superior to the other
alternatives offered, regardless of the decision strategy employed. Another observation
made during the task is that several subjects unstapled their two product sheets so that
they could compare all alternatives at the same time. A couple of subjects commented
that this strategy contributed to their ease of facilitating the task.
Based upon preliminary paper and pencil test results, several modifications were
made when developing the pilot test. First, the number of alternatives was expanded to
30 items, since no significant difference in choice quality was detected between the two
groups. Second the weighting across the five attributes were varied, to enhance overall
task difficulty, and to potentially achieve greater variance in choice quality results.
48
Third, additional choice involvement scale items were developed based upon extant
review of the choice and regret literature (Simonson 1992; Iyengar and Leeper 2000;
Schwartz et al 2002; Schwartz 2004). These changes were implemented, in addition to
developing the experiment using online software.
PILOT TEST An online experimental instrument was developed and administered to 28 adults, ranging
from 24 to 63 years of age. Ninety-six percent of subjects reported over 5 years of
Internet experience. The purpose of the pilot test was threefold. One purpose was to test
the online survey software for its treatment randomization capabilities. As mentioned
previously, each treatment, representing either two or six pages of products (five
alternatives on each page), needed to be randomized in the order presented to minimize
the potential impact of order effects in the choice selection. Additionally, the treatment
offered to each subject needed to be randomized. The second purpose was to test for
successful manipulation checks for the information load dimensions. Since the
anticipated pilot sample would be small, two extreme treatment conditions were
developed for testing. One treatment represented a low breadth, low depth, and low
density online product load condition. This low-low-low (LLL) treatment consisted of
two pages of five alternative products per page, five attributes per product, and one-word
feature descriptors. The second treatment represented a high-high-high (HHH) (breadth,
depth, density) product information load condition. Thirty products (five alternatives per
page across 6 pages), each with fifteen attributes, and multiple and/or full word
descriptors were provided for each attribute. So the low-low-low condition presented 10
alternatives with 5 features each across two pages. The high-high-high condition

49
presented 30 alternatives with 15 features each across 6 pages. The software was
programmed to randomize the treatment presented to subjects, in addition to randomizing
the order of each page within each treatment. The randomization of treatments was
successfully performed across subjects.
The second purpose was to conduct manipulation checks between these two
conditions, to verify significant perceptual differences existed. Successful manipulation
checks were achieved across all three dimensions, as indicated in table 5.
A third purpose of the pilot was to re-test the reliability of the measures to be used
in the final study. Since the subjects used in the pilot differed in terms of age and
education compared to pre-tests, all measures were rechecked. Cognitive effort and
product involvement both produced acceptable reliabilities (α>.80), however choice
involvement across a different sample did not improve, as indicated in Table 6.
This low reliability for choice involvement suggested that additional scale items
be developed and tested prior to the final main study launch.
Although the power to detect differences in cognitive effort based upon the two
informational load treatments were low (0.39), differences between groups did emerge, as
indicated in table 7.
Pilot tests results also suggested that cognitive effort predicted decision
satisfaction. Regression analysis results suggested that cognitive effort accounted for
41% of the variance in decision satisfaction, as indicated in table 8.
In terms of time spent, there were no significant differences between treatments.
This result suggested that subjects may use various strategies in making a decision. Thus
50
an open-ended dialogue box was provided in the final survey to capture this moderator
or mediator influence.
In terms of choice quality, there were many confounding factors that contributed
to the subjects’ choice quality. Thus measurement of choice quality and the relationship
with other variables could not be asserted with credibility. The experimental instrument
design, for example, did not allow subjects to click back to the page that provided the
criteria for the choice, once one had started to preview the products. These design issues
were addressed and resolved in the final online experimental instrument flow.
Pilot tests results also demonstrated limited variance in product
involvement scores across subjects for a digital camera. Thus prior to the final
experimental instrument launch, additional pre-tests were conducted across a student
population using a variety of the consumer electronic items. A digital video camera
demonstrated the greatest variance in terms of product involvement, with no significant
gender differences.
MAIN STUDY SAMPLE A nationwide sample of consumers participated in the online experimental task. The
questionnaire contained questions that measured and tested for manipulation checks,
realism checks, cognitive effort, choice quality, choice satisfaction, product involvement,
choice involvement (Maximizer versus Satisfier), perceived crowding, demographics,
and perceived web expertise (see appendix D for the actual experimental survey
instrument).
A total of 268 consumers responded and completed the online experimental task
and subsequent survey, with 49 out of 50 state residents represented (Alaska excluded).

51
The number of respondents from the top ten states that were represented with the
respective percentage of all respondents is provided in Table 9. The number of
consumers in all other states represented at least one respondent and up to five
respondents.
The respondents’ profiles in terms of gender, education, and online consumer
electronic purchase experience are highlighted in Table 10. Females represented 59.8%
of the respondents, men 40.2%. Over 80% of respondents reported having some college
education or higher. This educational sample profile aligns with recent U.S. statistics
indicating that 84% of Internet users have some college education (Madden 2006).
To explore if gender was a factor influencing results, given that 60% of the
respondents were women, independent t-tests were performed across a variety of factors.
Choice involvement, product involvement, education level, perceived experimental
realism, time spent on the Internet, and Internet shopping frequency were factors tested.
Only two factors, product involvement and time spent on the Internet, were significantly
different. Women reported higher product involvement for digital video cameras and
men reported spending more time on the Internet.
In terms of age, 50% of respondents were between 18-35, with the remaining 50%
were between the ages of 36-82. Thirty-five percent were 30 years old or younger; the
next thirty-five percent of respondents were between 31-45 years of age. The remaining
subjects (approximately 30%) were between the ages of 46-82, with only 10% of
respondents reporting being over 59. U.S. Internet users tend to index younger with over
80% of 18-29 and 30-49 year olds reporting being Internet users, as compared to just
52
33% of those adults older than 65 (Madden 2006). Additionally statistics indicate that
18-29 year olds go online more so than any other age group (88%) (Madden 2006).
In terms of online consumer electronic purchase experience, 54% of respondents
reported having purchased a consumer electronic product online, with 42% reporting
owning a video camera. Forty-six percent of men reported owning a video camera and
39% of women made this claim. Men also slightly over-indexed compared to women in
terms of consumer electronic purchase experience online (62.6% versus 48.4%
respectively).
Ninety-four percent of the respondents (N=252) reported the number of years they
recalled using the Internet. Ninety-five percent reported within a range of 1-15 years;
the most popular response being 10 years. The actual range varied from 1-28 years. The
distribution is reported in the table 11. The overall majority reported within a range of 7-
15 years using the Internet.
53
CHAPTER V
DATA ANALYSIS AND RESULTS
NON-RESPONSE BIAS
An online panel of consumers was recruited to participate in the online
experimental treatment. Web-based access panels are pools of subjects who have
expressed their willingness to participate in Web surveys on a regular basis (Bosnjak,
Tuten, and Wittman 2005). Of the 359 respondents who opened the invitation, 263
completed the experimental task and answered the post-test questions, yielding a 73%
response rate. This relatively high response and completion rate compared to other
online response rates reported (Roster, Rogers, Hozier, Baker, and Albaum 2007) may be
attributed to several factors. First, subjects were offered an incentive, thus the expected
rewards may have outweighed the expected ‘costs’ for many (Dillman 2007). Second,
the context involved online shopping, an activity common to many Internet users
(Madden 2004). Third, factors determining consumer recruitment may have included
interest and/or experience in consumer electronics. Maximizing the participation from
selected subjects is considered particularly effective because this approach attempts to
eliminate nonresponse bias entirely (Yu and Cooper 1983).
The experimental instrument responses were collected over a six-day period.
Over 50% of the responses were recorded the first day the online experimental instrument
launched. To test for early versus late response bias, subjects were divided into two
groups; first day responders and second to sixth day responders. Several factors were
analyzed to determine early versus late response bias; age, education level, years of

54
experience using the web, gender, time spent in the experimental task, and total time
answering the survey questions. For all these factors, there were no significant
differences between the subjects who responded on the first day versus those who
responded later in the week. Hence, it was concluded that there was no nonresponse bias.
REALISM CHECK An online search for digital video cameras in the $300-$450 price range yielded a range
from 11 to 25 alternatives available from various large online retailers (Best Buy, Circuit
City, Wal-Mart). So the scenario, while using objective choice criteria to create internal
validity, was designed to exhibit experimental realism since the task reflected the breadth
and depth of information shoppers would face when searching for a digital video camera
online (Schulz 1999). To test the face validity of this experimental design, an
experimental realism scale was used to assess the realism of this experiment across all
respondents. After completing the assigned task, subjects rated on a five point scale ‘how
realistic do you think the product information presented reflects what you would expect
to see when searching for this type of product online?” A score of one represented ‘not
realistic at all’ to a score of five meaning ‘completely realistic’. The mean for all 268
subjects was 3.5 with a mode of 4.0. Only 15% of respondents reported a response
indicating the information presented was not realistic. There were no significant
differences in experimental realism among the eight different treatment groups.
Interestingly subjects in the high breadth condition (30 product alternatives) perceived
the information as being less realistic (means ranging from 3.2-3.4) compared to the
subjects in the low breadth conditions (10 product alternatives), even though there was no
statistical significance in the differences. Prior to selecting a digital video camera as the
55
experimental product, an online search for digital video cameras on two large online
consumer electronic retailers’ websites (Best Buy and Circuit City) indicated an
assortment ranging from 19-23 camcorders within a particular price range. Although a
slightly higher realism mean score was achieved in a pilot test, a digital camera was used.
One possible explanation may be that the assortment of digital cameras online is deeper
than that of digital camcorders, and consumers may be aware of these differences.
When examining the realism responses between those subjects who own a video
camera and those who don’t, some interesting trends emerge. As stated previously,
41.8% (n=112) of subjects reported owning a video camera. Sixty-three percent of these
consumers scored the information presented as being somewhat to completely realistic,
compared to 54.9% of those who reported not owning a digital video camera. So those
who have experience acquiring this type of consumer electronic item reported higher
realism than those who have not acquired this type of product. Although there were no
significant statistical differences between these two groups, significant differences did
emerge between those subjects who have purchased a consumer electronic item online
versus those who have not (p=.001). Over 66% of respondents who have purchased a
consumer electronics item online reported the information presented as being somewhat
to completely realistic, as compared to 41.5% of those who reported never purchasing a
consumer electronic item online. Thus even though the overall realism scores are not as
high as experienced in the pilot test, the realism scores are more positive with those
subjects who have experience with the actual consumer electronic item and/or purchasing
a consumer electronic item online. These different expectations based upon prior
experience may have marketing implications. One is that for consumers shopping for the
56
first time online for a consumer electronics item, the initial assortment may be larger than
what is anticipated. How the consumer will respond and adapt to this condition may have
significant marketing implications, some of what may be uncovered and discussed later
in this research.
MANIPULATION CHECKS There were three individual and one overall manipulation check performed. The three
individual manipulation checks tested for significant differences perceived by subjects on
the information’s breadth (number of alternative products), depth (number of features per
product provided), and density (number of words and consequently affecting the amount
of space per page). The fourth manipulation check asked subjects to rate the overall
amount of information they perceived to be provided during the task.
For each individual manipulation check, two slightly different questions were
asked. For breadth and depth, subjects were asked to rate on a five-point scale if there
were ‘too few’ to ‘too many’ products or features presented and if the number of products
or features presented were ‘insufficient’ to ‘overwhelming.’ The first statement
attempted to capture the respondents’ cognitive perception of the amount of information
presented. The second statement attempted to capture the emotional response elicited
from processing the information.
Breadth
As seen in table 12, the breadth manipulation check demonstrated significant differences
between the high and low breadth conditions for both statements (p=.000). The high
breadth condition presented 30 alternatives over six pages, whereas the low breadth

57
condition presented 10 alternatives over two pages. The number of alternatives per page
was held constant.
Depth
Significant perceptual differences between subjects exposed to the high depth (15
features per product) versus the low depth condition (five features) were also reported
(p=.000) for both questions. These results are highlighted in table 13.
Density
For the density manipulation check, however, no significant differences were detected
between the low and high condition. As indicated in table 14, the mean scores and
variances were both groups were almost identical.
Given the low variance between groups, the statistical power to detect differences
was diminished as well (Cook and Campbell 1979). Reflecting back upon the stimuli, the
most significant perceptual difference in terms of space on each page seemed to be
demonstrated in those conditions where each product had 15 features. Spacing
differences did not appear significant when looking at a page that contained only five
features, even with the words written out. Additional tests were performed to see if
perceptual crowding differences existed between subjects who were exposed to different
depth conditions. Results confirmed significant differences (p=.004) in total perceived
crowding scores between low and high depth conditions, as demonstrated in table 15.
Analysis, as indicated in table 16, excluded breadth as a variable because this measure
captured perceptual information load across pages, not within a page. So a perceptual
crowding manipulation was successfully executed but only between those subjects who
experienced variance in depth of features presented (p=.004).
58
Overall perceived information load
Respondents perception of the overall amount of information load based upon the three
factors of breadth, depth, and density was significant (p=.000). As table 17 results
indicate, product depth appears to be the most powerful driver, followed by partial
support for density (p=0.054), and then breadth (p=.093). It should be noted, however,
that the observed power for density and breadth was not as strong as it was for depth.
As the table 18 demonstrates, the overall perception of information load increases
as expected from a low breadth, depth, and density condition to the high treatment
conditions across all three dimensions. The mean scores progress from a low score of 4.0
to a high score of 5.17, representing the highest objective and perceptive load condition
RELIABILITY OF MEASURES Perceived web expertise Respondents were asked to evaluate themselves on four tasks or activities performed on
the web. The four items represented perceived web expertise, which has demonstrated
good reliability in previous studies (Yaveroglu 2002). Among these subjects, good
reliability for this measure was also achieved (α = 0.911), indicated in table 19. Table 20
shows the questions representing the scale. Although the scale demonstrated good
reliability, the variance around each of the items was limited. This limited variance may
suppress the power of this measure to act as a covariate in later analysis, if needed
(Cohen, Cohen, Aiken and West 2003).

59
Given the wide age range of respondents, correlation analysis was performed to
see how perceived web expertise, age, and years of Internet use may relate. As one might
suspect there was a positive and significant relationship between age and years of Internet
use (.169, p=.007). In addition there was a stronger relationship between perceived web
expertise and years of Internet use (.271, p=.000). There was no significant relationship,
however, between age and perceived web expertise. This result suggests that younger
adults may perceive themselves to be more proficient on the web than their older
counterparts.
Product Involvement Given that younger consumers tend to be highly involved with technology (Burns
2006d), their involvement with consumer electronic products may also be higher than the
general population. Thus greater variance among a more diversely aged population
would be expected. The scale items used were originally developed by Zaichkowsky
(1985). The seven point scale produced a reliability score of 0.968 (table 21). The
means and variance associated with the overall product involvement scores indicates
some range and the differences between men and women were significant (p=.022).
In this sample, women demonstrated greater product involvement and slightly less
overall variance than men (table 22). Overall a subject responding to the 7 item, five
point scale could produce a score ranging from 7 to 35, 35 indicating the highest product
involvement score. An overall mean of 26.56 points suggests that the subjects had an
average response of a 5 on each of the five items, indicating some positive level of
involvement with digital video cameras.
60
Choice Involvement - Maximizers and Satisficers
Several scale items originally developed by Schwartz (2002, 2004), in addition to four
items developed for this study were used to measure enduring choice involvement. Pilot
test scale items used previously produced low reliability. Additionally factor analysis
suggested three different factors emerged from these scale items. As a result, additional
scale items were developed that focused on product choice contexts and how regret in
making a poor choice may drive effort. Schwartz’s scale items focus on global contexts
(shopping, listening to the radio, choosing a partner), whereas the additional scale items
added focused on product choice contexts.
Results from reliability and factor analysis (see tables 23 to 25) suggest that four
items of the 11 tested correlate and load positively with each other.
These choice involvement scale items attempt to uncover the motivations behind
the decision process. Those subjects who are more likely to seek all possibilities or
options available because they are motivated to the make the best choice, establish high
standards for themselves and want to avoid feeling the regret of making a bad decision
are posited to be drivers of high choice involvement. Schwartz suggests that people who
demonstrate high choice involvement are likely to engage in ‘analysis paralysis.’ One
marketing implication is that a consumer exposed to a large product assortment, may
defer making a buying decision due to the uncertainty of the outcome (Iyengar and
Leeper 2000).
Although the reliability analysis of the full set of questions yielded what could be
considered an acceptable score (α=0.73), factor analysis suggested three different
components being extracted from the set of questions. These three factors contributed to
61
53% of the explained variance. Conversely, when the final four items were loaded for
factor analysis, only one component was extracted (table 26). This factor accounted for
over 59% of the variance, as demonstrated in table 27. Thus these four scale items were
used in the analyses for choice involvement for the applicable hypotheses.
Cognitive Effort Five items on a seven-point scale comprised the construct, ‘perceived cognitive effort
with the task’. Analyses from 268 subjects’ responses yield a reliability coefficient of
0.952 (table 28). Subjects were asked to describe their search and selection experience
on a seven point scale, reporting varying degrees of difficulty from ‘extremely difficult’
(scored a 7) to ‘extremely easy’ (scored a 1). The ability to evaluate product features,
distinguish product differences, compare products, process features offered, and select
the best product were items asked. These reflective indicators of cognitive effort and
their relationship with each other are displayed in table 29. As indicated in table 29,
reflective indicators of a latent construct are internally consistent and equally valid, so
that if an indicator is removed, the construct validity generally remains unchanged
(Jarvis, Mackenzie, and Podsadoff 2003). Given that the indicators do share a common
theme and that the measures are posited to have the same antecedents and consequences,
lends support for the items to be considered reflective versus formative.
Choice quality
Choice quality was calculated using a mathematical formula that is derived from the
weighted added values (WAV) of the product chosen and those of the best and worst
62
weighted added value scores (Lurie 2004). Specifically the formula calculated as
follows:
Choice Quality = (WAVchosen – WAVworst)/(WAVbest - WAVworst) The range in scores would vary from a low of zero to a high score of one if the best
choice is chosen. An ANOVA was initially run to see how the choice quality scores
varied between different experimental treatments. The overall means for each of the
treatments is shown in table 30.
There were significant overall differences on choice quality (p=.001) based upon
information load treatments, as seen in table 31 The assumption with choice quality is
that the best choice utilizes compensatory process and utilizes all the information
presented. Although this may not be considered realistic, this has been the practice
(Eppler and Mengis 2004; Lurie 2004; Lee and Lee 2004; Lurie 1999; Malhotra 1982).
Significant differences in choice quality will be examined between each of the cells.
Also, the information captured would also allow the researcher to capture what has been
called ‘satisficing’ choices (Malhotra 1982), choices that are scored highly (e.g. 0.88-
.0.94), although not perfect (1.0). Cognitive effort will then be added as an independent
variable to test for mediation effects (Baron and Kenny 1986). Tests for significance and
variance accounted for can be analyzed among the different regression equations.
Time Spent
The second dependent variable, time spent, represents the time from when the first page
of product information was viewed to when the final product choice was made. The
online survey software captured this information, so the time recorded is the actual total
63
time spent versus a self-reported time. The total time is measured in terms of seconds. It
is expected that time spent will be positively related to product information load.
Previous research suggests that the more complex the information, the more time it takes
a person to reach a decision (Helgeson and Ursic 1993).
Overall significant differences in time spent on the task existed among the
different treatment groups (F=3.453, p=.001). Post hoc analysis showed significant
differences in total time spent between those conditions that varied in terms of breadth
and depth. A regression analysis using the three dimensions of information load
regressed on time spent yields an overall significant result (F=7.3, p=.000), with breadth
and depth yielding positive and significant beta coefficients (β=0.22, p=.000,β=.160,
p=.008) respectively.
Time spent on a choice task has also been used as a proxy for cognitive effort
(Garbarino and Edell 1997). Whether this relationship will be linear across the ranges
tested has yet to be determined. The results can be plotted to see the type of relationship
that may exist and then run the appropriate statistical analysis (e.g. regression with time
as the dependent variable) for curvilinear effects.
Satisfaction with Decision
For satisfaction with decision, a seven point scale is used. Decision satisfaction has been
operationalized as “How satisfied are you with your decision? (1 – very dissatisfied; 7 –
very satisfied) (Jacoby, Speller, and Kohn 1974).
64
HYPOTHESES RESULTS
H1: Product information breadth (#alternatives) will be positively related to
cognitive effort. SUPPORTED
An ANOVA with product breadth (high/low) as the independent variable and cognitive
effort as the dependent variable was performed. As seen in table 32, a significant
difference in cognitive effort between low and high product breadth conditions was
obtained (p = 0.000) with high product depth conditions yielding higher overall cognitive
effort scores. Results support a positive relationship between product information
breadth and perceived cognitive effort with the search and selection task (β=0.333).
Results from regression analysis suggest that the number of product alternatives
contributes 10% to the variance explained in cognitive effort. Previous choice studies
conducted in a computer-mediated environment typically provide all alternative
information on one page. This study provided information across multiple pages. This
means that subjects were not allowed to view all options at once, but were allowed to
scroll back and forth between pages.
In earlier paper and pencil pre-tests, the researcher observed subjects unstapling
the sheets of product information so they could view all products side by side. In
addition, the product sheets collected, post the task in these pre-tests, frequently had
crossed-out marks on products and feature attributes as a means of eliminating and not
attending to pieces of information deemed irrelevant. So although the results are not
surprising, the significant relationship between product breadth and perceived cognitive
effort with the task contributes to the body of knowledge in this area. How the channel

65
context (offline versus online), given the same product breadth may influence perceived
cognitive effort with the search and selection task may be theoretically as well as
managerially insightful for future study.
H1a: Product information breadth (#alternatives) will be less positively related to
cognitive effort for Maximizers than Satisficers. NOT SUPPORTED
Respondents were scored on a choice involvement continuum scale where a person with
a high score may be described as a Maximizer and a person with a low score, described
as a Satisficer. A higher choice involvement score would suggest that a person may be
more of a Maximizer when making a decision among various products offered as
compared to others with a lower choice involvement score. A relatively lower score
would suggest a person may be lower on choice involvement, thus more likely to engage
‘satisficing’ decision strategies when making a decision.
Regression analysis was performed, coding the breadth conditions -1, +1 for low
and high respectively, and using centered choice involvement scores to test for
interaction effects (Cohen, Cohen, West, and Aiken 2003). To maximize the statistical
power to detect significant interaction effects, McClelland and Judd (1993) recommend
coding categorical treatments in this manner so the product of the two variables will yield
a greater range of information, as compared to dummy coding for example.
As indicated in Table 33, there were no significant interaction effects between
choice involvement and product breadth, thus choice involvement does not appear to
moderate product breadth, in terms of cognitive effort. Choice involvement, however,
does exert a significant negative main effect on cognitive effort (p=.017). The negative
66
beta coefficient for the centered choice involvement score indicates that those subjects
who scored above the average for choice involvement (Maximizers) reported an overall
lower cognitive effort score, compared to those who scored below average on choice
involvement (Satisficers). This result suggests that the higher one’s choice involvement,
the lower one’s perceived cognitive effort with the task. The first-order coefficients in
regression equations containing interaction terms represent the regression of Y on each
predictor at the value of zero on the other predictor (Cohen et al 2003). So a value of 0
for the breadth condition would represent a medium breadth condition, given that low and
high conditions were coded as -1 and +1 respectively.
This result supports information process theory, given that Maximizers are more
highly involved in the choice process, thus allocating more processing capacity to the
task. Allocating more processing capacity would suggest the subject perceives less effort
performing the task. To the researcher’s knowledge, choice involvement tested within a
computer mediated environment, has not been empirically tested to date. Thus the
construct and the context together, help to extend and provide additional support to the
information processing theory of consumer choice.
H1b: Product information breadth (# alternatives) will be less positively related to
cognitive effort under conditions of high product involvement. NOT SUPPORTED
Regression analyses, similarly to what was performed for H1a, was conducted using
breadth with product involvement substituted for choice involvement. As seen in table
28, product involvement exerted a significant negative effect on cognitive effort, but the
interaction between breadth and product involvement was not statistically significant

67
(p=.575). Thus product involvement does not moderate product breadth, but operates as
a main effect on cognitive effort. The negative beta coefficient for the centered product
involvement score indicates that those subjects who scored above the average for product
involvement reported an overall lower cognitive effort score. The first-order coefficients
in regression equations containing interaction terms represent the regression of Y on each
predictor at the value of zero on the other predictor (Cohen et al 2003). So a value of 0
for the breadth condition would represent a medium breadth condition, given that low and
high conditions were coded as -1 and +1 respectively.
H2: Product information depth (# attributes per alternative) will be positively
related to cognitive effort. SUPPORTED
A regression was performed with the dummy coded variables of low and high product
information depth (0/1), regressed on cognitive effort. As seen in table 35 the hypothesis
was supported given the positive value of the beta coefficient for depth and being
statistically significant (β=0.150, p=.014), however it should be noted that the impact on
cognitive effort was minor, accounting for less than two percent of the variance.
Reflecting upon the assigned task, product information depth’s relatively low
impact on cognitive effort is not surprising. The task assigned is to select the best
product, thus the product features may help to distinguish desirable products from less
desirable alternatives. In half the treatment conditions, subjects were provided with five
feature attributes, all which were relevant to the choice assignment. Thus the quality of
information in these treatments may have been considered high by the subjects. Quality
of information has been operationalized as the ratio of relevant to non-relevant
information provided (Keller and Staelin 1987). When information load is held constant

68
and quality of information increased, decision effectiveness improves (Keller and Staelin
1987). Thus the attribute information may have to a certain point mitigated perceived
cognitive effort because the information was helpful in distinguishing and selecting the
best alternative.
Although the result may not be surprising, it does help to put the information load
debate in a new perspective. Previous debates centered upon which information load
dimension is more influential in terms of objective choice quality– features or number of
alternatives (Lee and Lee 2004). This research shifts the perspective to examine how the
information influences consumers’ cognitive states while proceeding through the search
and selection task. This result suggests that attribute information requires effort (thinking
costs) but the benefits of the information (value) may offset the costs in terms of the task
at hand, thus the lower overall influence on cognitive effort. Given that the necessary
information to make the best decision was provided in all treatments, comparing this
information across the number of alternatives may be the key driver of effort required to
perform the task well within this context.
H2a: Product information depth (# attributes per alternative) will be less positively
related to cognitive effort for Maximizers than Satisficers. NOT SUPPORTED
A regression analysis, similar to that performed for H1a, was performed (replacing
breadth by depth). As seen in table 36, there are no significant interaction effects detected
between product depth and choice involvement. This result suggests that choice
involvement does not moderate product depth. The model does suggest, however, that
choice involvement does exert a negative main effect on cognitive effort. The choice
69
involvement scores are centered, thus those subjects who score above the average on
choice involvement (Maximizers), are predicted to score lower on cognitive effort,
compared to those who score lower on the choice involvement scale (Satisficers).
Satisficers would report a negative centered score, thus the product of two negative
scores would yield a positive number – adding to the cognitive effort score.
This result supports information processing theory in that choice involvement
mitigates perceived cognitive effort when examining product attribute information in an
online context. An extension of this work may be to explore processing strategy
differences between Maximizers and Satisficers, taking into account the amount of
information absorbed during similar shopping tasks. Since attribute information enables
product differentiation, the decision strategy differences Maximizers and Satisficers may
be employ may provide theoretical, as well as managerial insights in terms of
merchandising and promotion.
H2b: Product information depth (# attributes per alternative) will be less positively
related to cognitive effort under conditions of high product involvement. NOT
SUPPORTED
A regression analysis was performed, similarly as outlined in H2a, substituting a centered
product involvement for choice involvement and the respective interactive product
between depth and product involvement. Results, as outlined in table 37, indicate that
even though the overall model is significant (p=.000), the interaction between product
depth (attributes) and product involvement is not statistically significant. Therefore,
results suggest product involvement does not moderate the cognitive effort associated
70
with viewing product attribute information. What the results do suggest, however, is that
product involvement exerts a negative main effect on cognitive effort (p=.000). Thus,
subjects who scored above average in product involvement were more likely to report
lower perceived cognitive effort associated with the task, as compared to those who
scored below average on product involvement. As previously noted, the product
involvement score is centered, thus a person with a below average product involvement
score would be scored negatively. The product of two negative scores is a positive
output. According to the regression model, below average product involvement would
contribute positively to the cognitive effort score.
H3: Product information density (# words/page) will be positively related to
cognitive effort. NOT SUPPORTED with full sample.
An ANOVA was run with density as the independent variables and cognitive effort as
the dependent variable. As indicated in table 38, density did not have a statistically
significant positive relationship on cognitive effort. This is understandable given that the
manipulation checks were not significant between treatments for the varying density
conditions. In previous studies measuring density, density itself does not elicit variance
in responses but rather the subjects’ perception of crowding based upon what they
experienced (Eroglu and Machleit 1990; Hui and Bateson 1991). Eroglu and Machleit’s
(1990) simulation study suggests high retail density (brick and mortar context) is
positively associated with perceptions of retail crowding, particularly accentuated under
goal oriented task conditions. Hui and Bateson (1991) found that consumer density
71
directly and positively influenced perceptions of crowding. Hence two additional
hypotheses (H3 1 and H3 2) were tested.
H3 1: Product information density, for those subjects who perceived crowding, will
be positively related to cognitive effort. NOT SUPPORTED with manipulated sub-
sample.
Next analysis was conducted using only those subjects who were manipulated, meaning
they perceived the pages of information to be crowded (a score greater than three on a
five point scale). The crowding manipulation check scores were regressed on cognitive
effort. From an original sample size of 268, 112 subjects reported experiencing some
form of density manipulation. These subjects skewed toward experiencing a ‘crowded’
effect, with a mean score of 4.11 on a five point scale ranging from one indicating a
perception of the page being ‘spacious’ to a score of five, indicating the information on
each page appeared ‘crowded’. As seen in Table 39, the manipulated sample also
revealed no significant differences of density on perceived cognitive effort with the task.
So with the full sample, H3 was not supported. With a subset of respondents who
did experience the manipulated effect, density for H3 1 was also not supported. Based
upon previous studies that suggest perceptions of crowding elicit perceptual responses
(Eroglu and Machleit 1990; Hui and Bateson 1991), a second alternative hypothesis was
developed and tested.
H3 2: Perceived crowding will be positively related to cognitive effort.
SUPPORTED
72
With the full sample (n=268), perceived crowding was regressed on cognitive effort
(Table 40). The positive standardized beta coefficient (β=.336, p=.000) accounted for a
little over 10% of the total variance. Thus a modified version of H3 is supported (H3 2),
substituting perceived crowding for density.
This result, although not originally posited, contributes to the theoretical testing of
perceived crowding in an online, multiple page context, using informational properties as
the stimuli. As discussed previously, crowding has been operationalized in online
contexts, primarily between websites and capturing approach and avoidance behavioral
responses. This finding extends not only the contextual application of environmental
crowding, but how online environmental variables may influence cognitive states. Given
perceived crowding impacts perceived cognitive effort positively, future studies
exploring online design factors that may contribute to perceptions of crowding may be
beneficial. If certain website design factors elicit perceptions of crowding, then design
alterations can be made to reduce the associated cognitive effort. If cognitive effort is
positively associated with website ease of use, then such modifications may increase
consumers’ likelihood to return (Venkatesh and Davis 2000).
H3a: Product information density (# words/page) will be less positively related to
cognitive effort for Maximizers than Satisficers. NOT SUPPORTED
Regression analysis was performed coding low and high density conditions as -1/+1
respectively, along with centered choice involvement scores as first order independent
variables. The respective product of these two variables formed the interaction variable
to test for moderation (Baron and Kenny 1986). As indicated in table 41, choice

73
involvement does not moderate the effects of density on cognitive effort, but does exert a
significant main effect (p=.002)
This result is understandable given that density did not have main effect on
cognitive effort in previous analysis reported. The overall model was significant, as
indicated in table 42, however, the variance within choice involvement appears to be
driving the overall significant results.
H3a 1: Product information density, for those subjects who perceived crowding,
will be less positively related to cognitive effort for Maximizers than Satisficers.
NOT SUPPORTED
Regression analysis with the manipulated sub-sample (N=103) did not produce
significant results for the overall model, as indicated in table 43.
H3a 2: Perceived crowding will be less positively related to cognitive effort for
Maximizers than Satisficers. NOT SUPPORTED.
Regression analysis was performed in a similar manner as outlined in H1a. Perceived
crowding and choice involvement were independent variables analyzed, along with the
respective interaction term, with cognitive effort as the dependent variable. Although the
overall model was significant (p=.000), the interaction term for both first order variables
was not significant (p=0.588) as indicated in table 44. These results suggest that choice
involvement does not moderate the effects of perceived crowding on cognitive effort, but
exerts a direct negative influence. Thus, those subjects who scored above average on the
choice involvement scale (Maximizers) overall would be likely to report lower cognitive

74
effort scores as compared to those subjects who scored lower than average on choice
involvement.
These results extend previous research in two ways. First, perceived crowding and
choice involvement are empirically tested together and demonstrate significant effects in
an online choice context. Secondly, both constructs empirically demonstrate an effect on
cognitive effort. To the researcher’s knowledge, these three variables (cognitive effort,
perceived crowding, and choice involvement) have not been empirically tested together
in an offline or an online context. These latter two variables, within this particular
sample, accounted for approximately 13% of variance of cognitive effort.
H3b: Product information density (# words/page) will be less positively related to
cognitive effort for those with high product involvement. NOT SUPPORTED
Regression analysis was performed coding low and high density conditions as -1/+1
respectively, along with centered product involvement scores as first order independent
variables. The respective product of these two variables formed the interaction variable
to test for moderation (Baron and Kenny 1986). As indicated in table 45, product
involvement does not moderate the effects of density on cognitive effort, but does exert a
significant main effect (p=000.)
This result is understandable given that density did not have main effect on
cognitive effort in previous analysis reported. The overall model was significant
(p=.000), however, product involvement appears to be driving the overall significant
results. The negative beta coefficients associated with product involvement do suggest
75
that a person with an above average product involvement, is predicted to experience
overall less cognitive effort, than a person with below average product involvement.
H3b 1: Product information density (# words/page), for those who perceived
crowding effects, will be less positively related to cognitive effort under conditions of
high product involvement. NOT SUPPORTED
Similarly to the steps outlined in H3b, a regression analysis was performed with a
manipulated sub-sample of respondents who perceived crowding. Density and product
involvement, along with their product term, were analyzed to test for effects on cognitive
effort. As indicated in table 46, product involvement does not moderate density (p=.816)
for the manipulated sub-sample of respondents who perceived crowding. The overall
model was significant (p=.011), however this is attributed to the main effects of product
involvement on cognitive effort (p=.004).
H3b 2: Perceived crowding will be less positively related to cognitive effort under
conditions of high product involvement. NOT SUPPORTED
Since the perception of crowding does have a positive effect on cognitive effort, the
impact of product involvement and the perceptions of crowding on cognitive effort were
analyzed. Perceptions of crowding and product involvement, along with the interaction
term of both, were independent variables and cognitive effort was the dependent variable.
The results presented in table 47 suggest that product involvement does not moderate
perceptions of crowding, but acts as a significant main effect. The overall model was
76
significant, attributed to the significant positive effect of crowding and the negative main
effect of product involvement on cognitive effort. This model accounted for 18.6% of the
variance in cognitive effort.
These results suggest that perceived crowded informational conditions positively
contributes to the cognitive effort in an online search and selection task. In addition, a
person who is highly involved in the product category may not perceive an effortful
search and selection process as compared to another consumer who is not as involved in
the product category. These results align with previous findings that suggest the task
orientation (goal/experiential) of the user may moderate perceptions of perceived website
complexity (Nadkarni and Gupta 2004). A person with high product involvement may
be more likely to be goal-oriented (e.g. purpose of acquiring knowledge), as compared to
an experiential user who may be just browsing for entertainment.
H4: Cognitive effort will be negatively associated with choice quality
SUPPORTED
Choice quality was regressed on cognitive effort. Choice quality was measured as the
weighted additive value (WAV) of the product chosen minus the weighted additive value
of the worst choice available, divided by the difference between the WAV best and WAV
worst choice. Results suggest (table 48) perceived cognitive effort with the task is
negatively associated with choice quality (β=-.239, p=.000). Although the hypothesis is
supported, it should be noted that cognitive effort only accounted for less than 6% of
variance in choice quality.
This result may be considered significant for two reasons. First, a perceived
individual state empirically demonstrates influence on choice quality. Typically

77
objectively measured informational factors have been manipulated to test for choice
quality differences. This research attempts to test for a mediation variable that may also
predict the quality of choice outcomes. Although the variance accounted for is minimal,
this study may open the research door for future studies to explore other factors that may
mediate objective informational properties influence on choice outcomes.
H5: Cognitive effort will be positively related to time spent on task.
NOT SUPPORTED Time spent on task was regressed on cognitive effort (table 49). This relationship was
not statistically significant. This result is interesting because in previous studies, time
spent on task has been used as a proxy for ‘cognitive effort’ (Garbarino and Edell 1997).
Stated differently, if a person spent more time performing a task, the assumption was that
he or she was exerting more effort. These results suggest no direct relationship.
Given this result, an alternative explanation may be that subjects adapt to their
information environment by using different decision strategies, thus attenuating time
spent with high loads of information (Payne, Bettman, and Johnson 1993). Variance in
decision strategies could be driven by a variety of factors. One factor could be the
subject’s seriousness of the task. Since there were no incentives for selecting the best
product, only an incentive for finishing the survey (online panel incentive points for
completing the survey), respondents may have rushed through the task, more interested in
finishing rather than making the best selection. In addition there was no feedback
mechanism incorporated into the survey to tell the subject how well he/she actually
performed based upon the criteria provided. Another explanation may be that since the
product selection was not a real purchase with risk implications, the task was not given
78
serious consideration. Thus time spent on the task for many respondents may have been
moderated by this less than serious consideration for the assigned task. Another
observation was noted when investigating those subjects who made poor choice
decisions. Several subjects commented that they became overwhelmed and finally just
picked one product. This would suggest that negative feelings may have propelled the
subjects to end the task prematurely, to avoid prolonging these feelings. These
alternative explanations, although not empirically measured and tested in this study,
suggest that there may several factors that may moderate the time spent on the task.
Given that time is a measure firms do capture when examining online behavior, future
studies that examine potential moderators and mediators to time spent on the task may be
beneficial.
H6: Cognitive effort will be negatively related to satisfaction with product selection.
SUPPORTED
A regression analysis was performed with cognitive effort as the independent variable
and choice satisfaction as the dependent variable. Regression analysis results in table 50
suggest that cognitive effort accounts for almost 30% of the variance in choice
satisfaction. The standardized beta coefficient for cognitive effort was negative and
significant (β= -.544, p=000).
This result suggests that consumers may be more satisfied with their choice, when
the selection process is not effortful. Decisions that require effort may be perceived as
difficult, creating doubt in the mind of a consumer, thus attenuating one’s confidence of
making a good choice. Choice confidence and choice satisfaction were strongly
79
correlated within this sample (0.772, p=.000), with subjects reporting a lower choice
confidence mean (4.78), compared to choice satisfaction (5.04). Since Maximizers
exerted overall less cognitive effort than Satisficers, this would suggest that Maximizers
may be more satisfied with their product selection than Satisficers. Comparing the choice
satisfaction means between both groups yielded significant differences (p=.000), with
Maximizers reporting a mean score of 5.34 compared to Satisficers with a mean
satisfaction score of 4.72.
POST HOC ANALYSIS Cognitive Effort as a Mediator
Although not hypothesized, the test for mediation using cognitive effort was performed.
Regression analyses were performed as outlined in previous research to test for mediation
(Baron and Kenny 1986). First, three information load factors, breadth, depth, and
perceived crowding, were regressed on choice quality. Since perceived crowding had an
impact on cognitive effort, not density, this dimension was used as the third information
variable. The overall model was significant (table 51), however depth as an individual
factor was not statistically significant (p=.463). Breadth (β = -.259, p=.000) and
crowding (β= -.123, p=.044) had a negative relationship to cognitive effort (table 52).
As indicated earlier, cognitive effort also had a significant relationship with choice
quality (β = -.333, p=.000). Next all three factors, breadth, crowding and cognitive effort
were regressed on choice quality. Depth was not included because there was no
relationship with choice quality and a relationship between depth and cognitive effort had

80
already been established (see H2). The overall model, as indicated in table 53, was
significant (p=.000), accounting for approximately 9.5% variance in choice quality.
Upon closer inspection of the actual model, as illustrated in table 54, breadth and
cognitive effort remained significant, but with both beta coefficients diminishing.
Crowding became insignificant. These results suggest that breadth and cognitive effort
both act as independent factors related to choice quality (see table 55), noting also that
breadth demonstrated a significant positive relationship with cognitive effort (table 32).
When cognitive effort and breadth are analyzed on choice quality (table 56), both exert a
significant negative effect.
According to Baron and Kenny (1986), in order for cognitive effort to mediate the
relationship between breadth and choice quality, the relationship between breadth and
choice quality should become insignificant when cognitive effort is inserted into the
regression model. The results in table 50 suggest otherwise. Results suggest that both
breadth and cognitive effort both exert a direct influence and also may covary.
Conversely, product information depth, individually, was not significantly related to
choice quality, but was statistically significantly related with cognitive effort (table 57).
So although cognitive effort may not mediate product breadth, these results suggest that
cognitive effort may mediate between product depth and choice quality, given that when
cognitive effort is added to the regression equation, the overall model is significant
(p=.000) but depth is insignificant and cognitive effort remains significant (table 58).
SUMMARY OF RESULTS
Table 59 summarizes the results of the hypotheses proposed and tested. Figure 3 models
the empirically supported relationships among the variables and constructs tested.
81
Product information breadth and depth both influenced perceived cognitive effort in a
positive manner. Product information density had no effect on cognitive effort, but did
influence perceived crowding, which in turn positively influenced cognitive effort.
Product and choice involvement did not moderate the relationship between the
three product informational dimensions and cognitive effort. Results suggest that product
and choice involvement exerted a direct negative effect on perceived cognitive effort with
the task.
Cognitive effort exerted a negative influence on choice quality and decision
satisfaction. There was no significant relationship between cognitive effort and time
spent on the task.
DISCUSSION OF RESULTS Results from this empirical study warrant several areas of discussion. First, in terms of
decision making contexts and choice quality the following comments are offered. Within
a multiple page online context, breadth of products made a more significant impact on
choice quality than the other dimensions tested. Although this may not be surprising
given that more products increase the odds of making a poor choice (Malhotra 1982), it
should be noted that depth had no impact on choice quality. This departs from previous
studies (Lee and Lee 2004) conducted in an online context. One could argue that given
the quasi -experiment, the actual quality of decisions in a real purchase situation may
improve, and hence the task did not mirror reality. Given that a percentage of subjects in
all but two groups did select the best product counters this argument. In addition it
should be noted that time was not limited in the task assigned. Previous experiments
typically give subjects only a limited amount of time, to induce stress and potential

82
overload (Lurie 2004; Lee and Lee 2004; Suri, Long, and Monroe 2003). This study,
although employing experimental treatments, attempted to simulate a typical online
search and selection process a consumer may experience when looking for a consumer
electronics product. Subjects who have experience researching and purchasing similar
consumer electronics item online rated the information stimuli as being realistic to what
they would anticipate viewing.
Secondly, product information breadth and depth did influence the perceived
cognitive effort with the task. Given this result, in addition to the finding that cognitive
effort is negatively associated with decision satisfaction; online retailers may need to be
mindful of the product assortments and respective product information provided to
consumers. Although recent studies indicate many consumers search online for
consumer electronic product information, providing too much information may not have
desirable results. Recent studies suggest that purchase cost is positively related to search
time spent on the Internet (Burns 2006d). Although the greater the amount of
information collected may help to mitigate the consumer’s perceived risk with the
purchase decision, at what point does cognitive effort hit a threshold where doubt with
making a decision starts to manifest? The good news is that product involvement and
choice involvement directly mitigate perceived cognitive effort under similar
informational load conditions. So those consumers who are seriously searching for
information may be less likely to perceive high cognitive effort with the task. On a
related note, Maximizers tended to be more satisfied with their decision as compared to
Satisficers. From a theoretical standpoint, information processing theory of consumer
choice (Bettman 1979) was supported and extended with the testing of this choice
83
involvement construct. Although the items used to develop this construct were a reduced
and modified subset of Schwartz’s (2004) items, the items performed well together.
These results suggest that further testing and development of the choice involvement
construct may be beneficial, particularly within a marketing and decision-making
domain.
On a third note, perceived crowding of informational stimuli empirically
demonstrated a significant effect on cognitive effort. Typically within the environmental
psychology framework, affective states of arousal may be captured, which then influence
approach or avoidance behaviors (Donovan and Rossiter 1982). In this study, the impact
of perceived crowding on a perceived cognitive state was demonstrated within a choice
context. To the researcher’s knowledge, within an online choice context, this has not
been empirically tested to date. Besides the theoretical extension within the
environmental psychology framework, there may be managerial implications as well.
One implication is that the white space allocated to web pages may impact how easily
visitors can process the information presented. The cognitive effort required to process
information presented may be closely related to a website perceived ease of use.
Previous studies suggest that ease of use may be an important factor in terms of perceived
usefulness and the likelihood to revisit site (Agarwal and Karahanna 2000; Venkatesh
and Davis 1996; Davis 1989).
A fourth point is that cognitive effort performed as well or better than traditional
information load variables in predicting choice quality outcomes. Although the variance
accounted for was minimal, what the results do demonstrate is that this construct may be
helpful in future studies to better understand perceptual influences on decision-making.

84
Just as the environmental psychology domain takes into account how a person’s
perception of the situation influences behavior, perhaps the examination of perceptual
states within the consumer decision making context should be given more attention.
Related to decision outcomes, perceived cognitive effort with the task
demonstrated considerable influence on decision satisfaction. This may mean not
displaying all of the products that are available, online or offline, unless the customer can
drill down to a subset that is easy to manage. Previous field research in a store setting
demonstrated that fewer sales occurred when a larger assortment of product was
presented (Iyengar and Leeper 2000). Online, research suggests that reducing
consumers’ search costs enhances the shopping experience (Lynch and Ariely 2000).
Lastly, the study suggests that there is no relationship between time spent on the
task and perceived cognitive effort. One immediate implication is that time spent has
been used as a proxy for cognitive effort in previous studies (Edell and Garbarino 1997).
This result suggests there may be several moderators or mediators influencing the time
spent. As mentioned, some subjects commented on being overwhelmed and thus just
picking a product to end the task. This behavior could be explained within the
environmental psychology framework: the information load (stimulus) elicited an
undesirable state (organism), which led to the person avoiding the continued interaction
by ending it (response). Other influencers may include the various decision strategies
employed by subjects. These decision strategies, in turn, may be influenced by the
information presented, in addition to other situational or personal traits (Payne, Bettman,
and Johnson 1993).

85
CHAPTER 6
CONCLUSIONS AND FUTURE DIRECTIONS
IMPLICATIONS FOR PRACTICE These results suggest that there are firm controlled factors (product breadth, depth, and
density) and individual factors (product involvement and choice involvement) that elicit
consumer perceptions to form cognitive states. This cognitive effort state in turn
influences choice outcomes and satisfaction with the decision. From an online retailer
perspective, how a firm presents product information may influence the perceived
cognitive effort associated with the search and selection task. If a firm presents product
information in a way that increases perceived cognitive effort, lower choice quality and
decision satisfaction may result. One managerial implication suggested from this result, is
that marketers should position their product alternatives so it is easy for the consumer to
make a smart choice. This may mean not displaying all of the products that are available,
online. Besides testing websites for overall perceived ease of use, testing websites for the
ease of being able to process the information presented on each web page may also be
beneficial. If website informational design efforts increase choice quality and choice
satisfaction, then higher loyalty to the site and the firm may result.
IMPLICATIONS FOR RESEARCH The study suggests that there is no relationship between time spent on the task and
perceived cognitive effort. One immediate implication is that time spent has been used as
a proxy for cognitive effort in previous studies (Edell and Garbarino 1997). What this
result suggests is that there may be several moderators or mediators influencing the time
spent.

86
The construct, cognitive effort, demonstrated good reliability within this choice
experiment. In addition a modified scale for choice involvement was developed and also
demonstrated good reliability. Both of these measures may be worthwhile constructs
used to further test different types of marketing exchanges.
Cognitive effort performed as well or better than traditional information load
variables in predicting choice quality outcomes. Although the variance accounted for
was minimal, what the results do demonstrate is that this construct may be helpful in
future studies to better understand perceptual influences in decision making. Just as the
environmental psychology domain takes into account how a person’s perception of the
situation influences behavior, perhaps the examination of perceptual states within the
consumer decision making context should be given more attention. As an example, in
this study perceived crowding demonstrated an effect on cognitive effort within a choice
context. Examination and integration across variables used in different theoretical
frameworks may yield a more integrated and robust picture of the phenomena under
study.
LIMITATIONS The results of the study cannot be extrapolated to the general population, given the
sample may not be entirely representative of all U.S. consumers. The sample, however,
does align with the profile of many U.S. Internet users.
Ideally respondents distributed more evenly across all treatment conditions would
have added more statistical robustness in testing the hypotheses. As noted by Cohen,
Cohen, Aiken, and West (2003), the sample size required to adequately detect interaction
effects, if they do exist, can be substantial. The inability to detect an interaction due to a
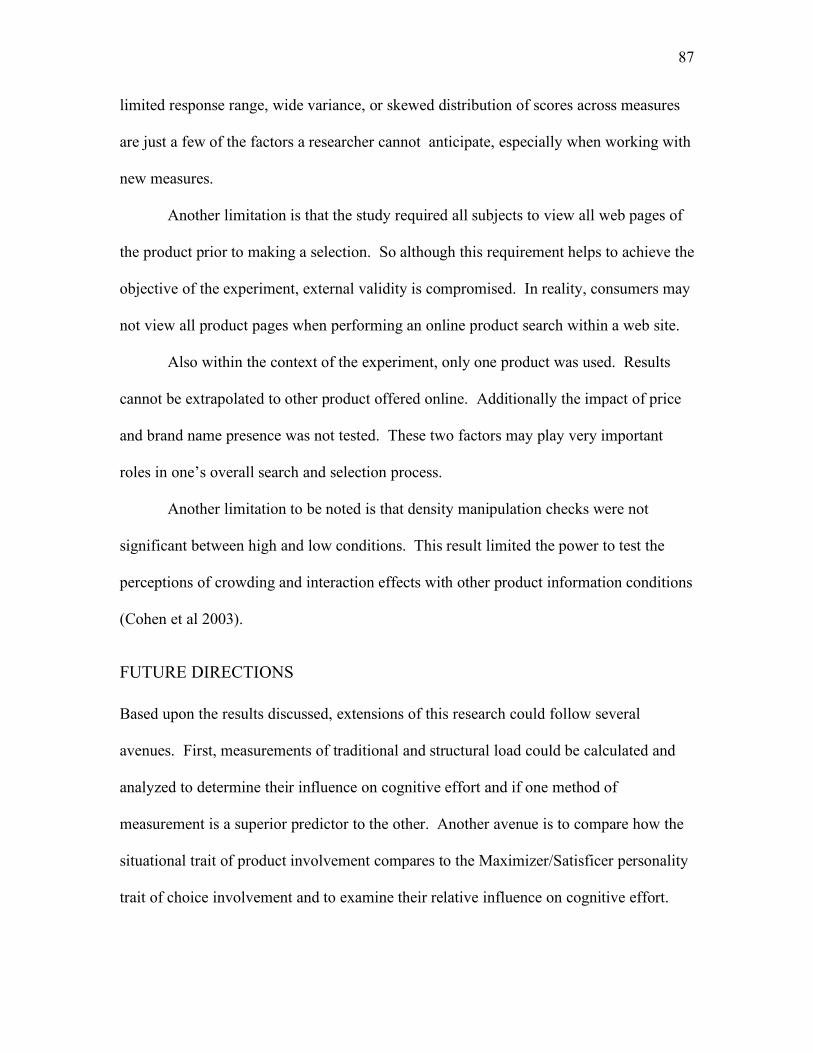
87
limited response range, wide variance, or skewed distribution of scores across measures
are just a few of the factors a researcher cannot anticipate, especially when working with
new measures.
Another limitation is that the study required all subjects to view all web pages of
the product prior to making a selection. So although this requirement helps to achieve the
objective of the experiment, external validity is compromised. In reality, consumers may
not view all product pages when performing an online product search within a web site.
Also within the context of the experiment, only one product was used. Results
cannot be extrapolated to other product offered online. Additionally the impact of price
and brand name presence was not tested. These two factors may play very important
roles in one’s overall search and selection process.
Another limitation to be noted is that density manipulation checks were not
significant between high and low conditions. This result limited the power to test the
perceptions of crowding and interaction effects with other product information conditions
(Cohen et al 2003).
FUTURE DIRECTIONS Based upon the results discussed, extensions of this research could follow several
avenues. First, measurements of traditional and structural load could be calculated and
analyzed to determine their influence on cognitive effort and if one method of
measurement is a superior predictor to the other. Another avenue is to compare how the
situational trait of product involvement compares to the Maximizer/Satisficer personality
trait of choice involvement and to examine their relative influence on cognitive effort.

88
Beyond the data captured in this study, other outcome variables can be captured
and analyzed. Examples include attitude toward the retailer, perceived usefulness of the
information presented and the perceived ease of use of processing the information
presented. These constructs could then be implemented and exploratory relationships
could be tested. Another extension would be to see how consumers across different age
groups vary. Given that cognitive processing is purported to decline steadily over time,
how this may impact processing by consumers with different capabilities may also be
insightful.
Online retailers vary in the way they present their merchandise information.
Another possible extension would be to compare how a matrix layout (as conducted in
this study) and presenting products with a vertical orientation (e.g. scrolling down one
product at a time) influence cognitive effort and the perceived usefulness of the
information presented.
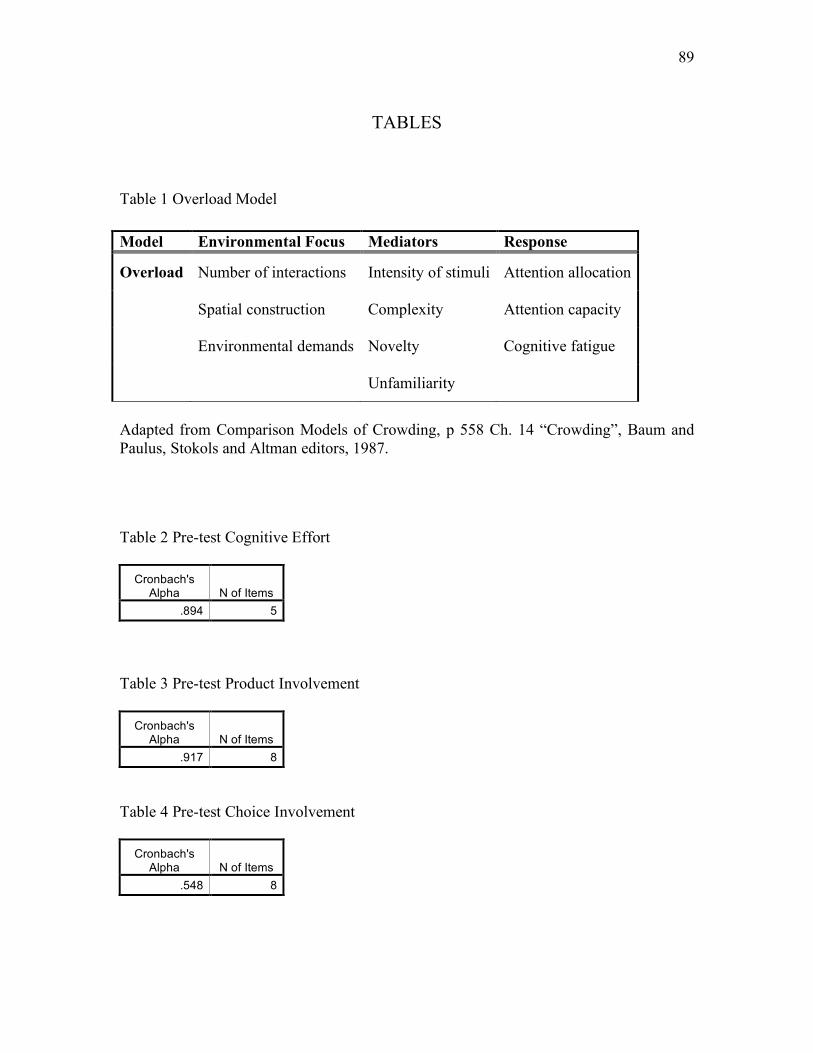
89
TABLES
Table 1 Overload Model Model Environmental Focus Mediators Response
Overload Number of interactions Intensity of stimuli Attention allocation
Spatial construction Complexity Attention capacity
Environmental demands Novelty Cognitive fatigue
Unfamiliarity
Adapted from Comparison Models of Crowding, p 558 Ch. 14 “Crowding”, Baum and Paulus, Stokols and Altman editors, 1987.
Table 2 Pre-test Cognitive Effort
Cronbach's Alpha N of Items
.894 5
Table 3 Pre-test Product Involvement
Cronbach's Alpha N of Items
.917 8
Table 4 Pre-test Choice Involvement
Cronbach's Alpha N of Items
.548 8
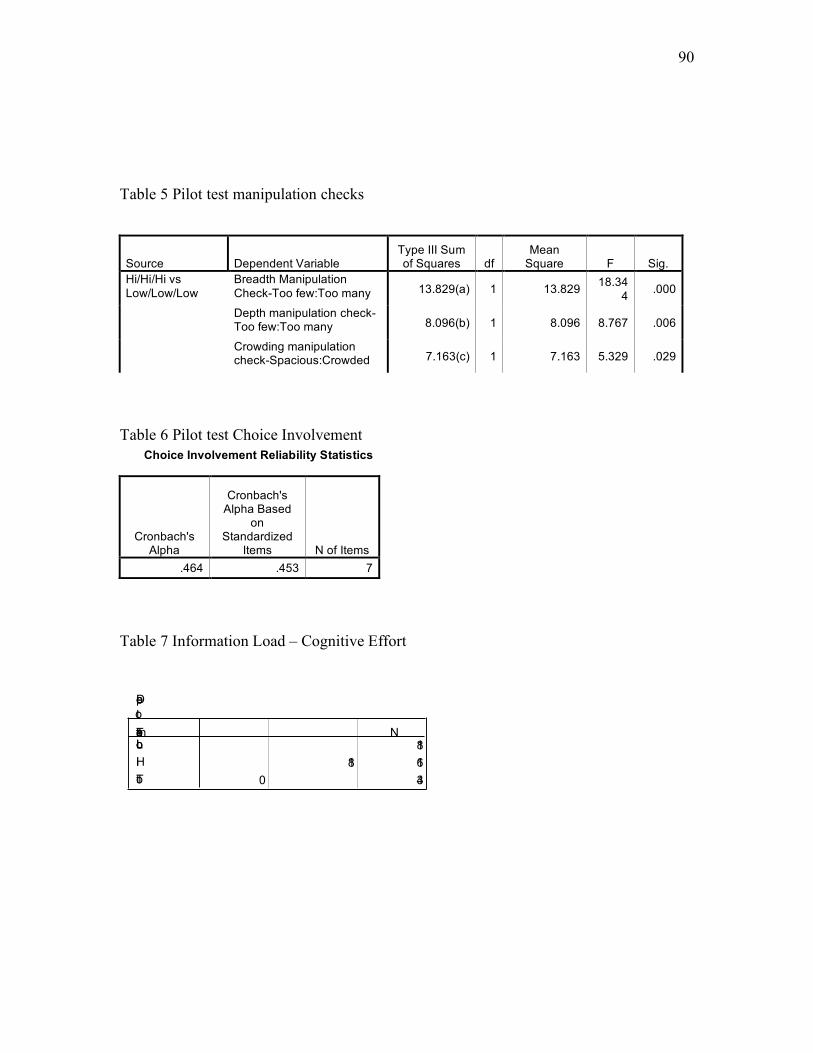
90
Table 5 Pilot test manipulation checks
Source Dependent Variable Type III Sum of Squares df
Mean Square F Sig.
Hi/Hi/Hi vs Low/Low/Low
Breadth Manipulation Check-Too few:Too many 13.829(a) 1 13.829 18.34
4 .000
Depth manipulation check-Too few:Too many 8.096(b) 1 8.096 8.767 .006
Crowding manipulation check-Spacious:Crowded 7.163(c) 1 7.163 5.329 .029
Table 6 Pilot test Choice Involvement Choice Involvement Reliability Statistics
Cronbach's Alpha
Cronbach's Alpha Based
on Standardized
Items N of Items .464 .453 7
Table 7 Information Load – Cognitive Effort
Descri p tive S ta tistics
Dependen t Vari able : Cognitiv e effort scale w/o ability
to d is ti n gu ish differences
13.7785.5153 18
17.4 38 6.79 18 16
15.5 0 06.3305 34
TreatmentLo Lo Lo
Hi Hi H i
Tota l
Mean Std. D e viat io nN
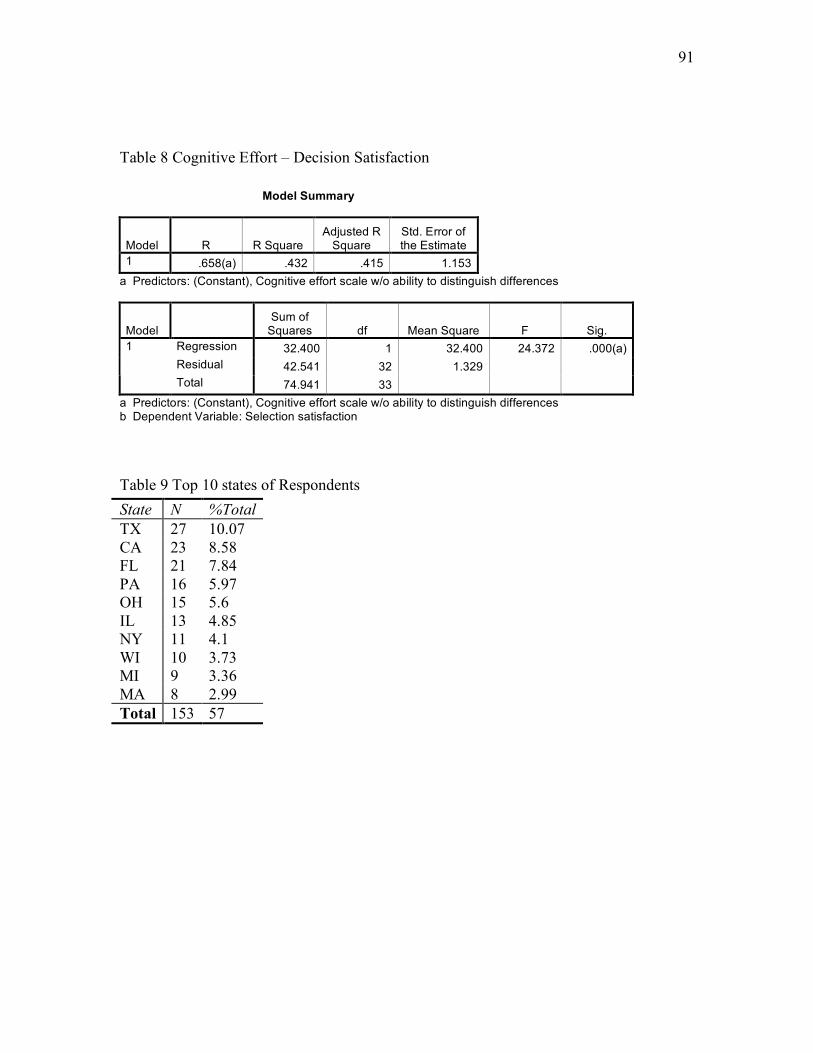
91
Table 8 Cognitive Effort – Decision Satisfaction Model Summary
Model R R Square Adjusted R
Square Std. Error of the Estimate
1 .658(a) .432 .415 1.153 a Predictors: (Constant), Cognitive effort scale w/o ability to distinguish differences
Model
Sum of Squares df Mean Square F Sig.
Regression 32.400 1 32.400 24.372 .000(a) Residual 42.541 32 1.329
1
Total 74.941 33 a Predictors: (Constant), Cognitive effort scale w/o ability to distinguish differences b Dependent Variable: Selection satisfaction
Table 9 Top 10 states of Respondents State N %Total TX 27 10.07 CA 23 8.58 FL 21 7.84 PA 16 5.97 OH 15 5.6 IL 13 4.85 NY 11 4.1 WI 10 3.73 MI 9 3.36 MA 8 2.99 Total 153 57
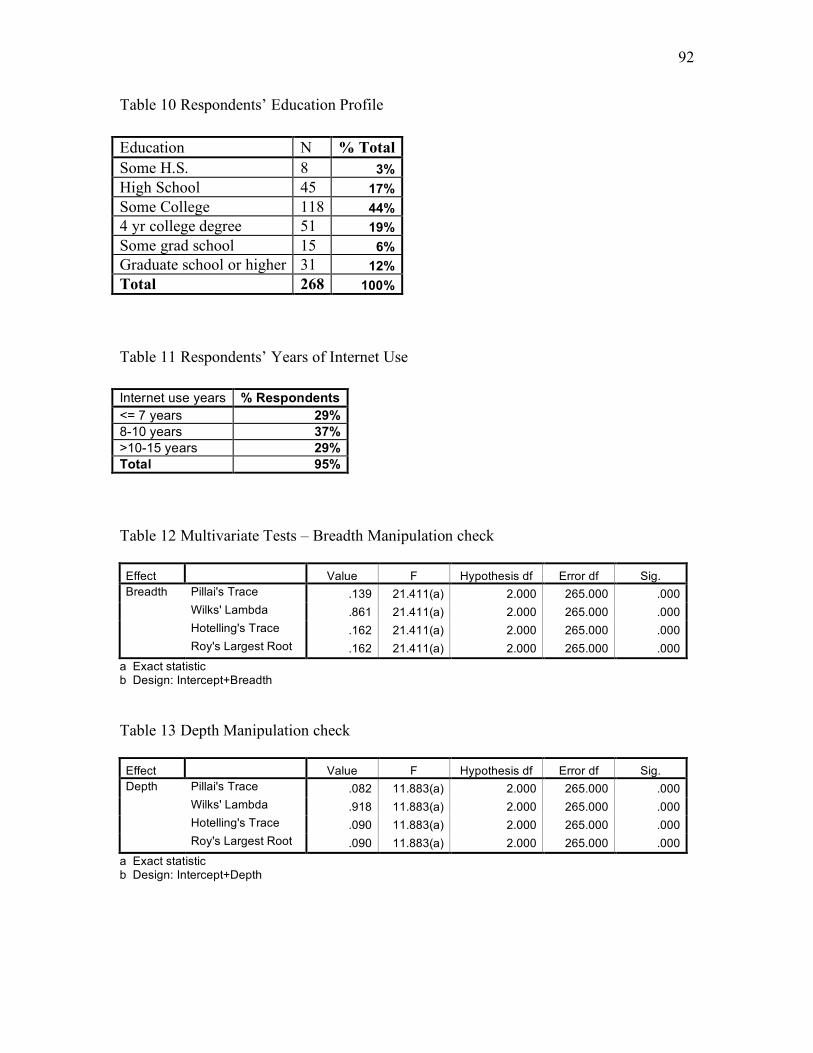
92
Table 10 Respondents’ Education Profile Education N % Total Some H.S. 8 3% High School 45 17% Some College 118 44% 4 yr college degree 51 19% Some grad school 15 6% Graduate school or higher 31 12% Total 268 100%
Table 11 Respondents’ Years of Internet Use Internet use years % Respondents <= 7 years 29% 8-10 years 37% >10-15 years 29% Total 95%
Table 12 Multivariate Tests – Breadth Manipulation check Effect Value F Hypothesis df Error df Sig. Breadth Pillai's Trace .139 21.411(a) 2.000 265.000 .000 Wilks' Lambda .861 21.411(a) 2.000 265.000 .000 Hotelling's Trace .162 21.411(a) 2.000 265.000 .000 Roy's Largest Root .162 21.411(a) 2.000 265.000 .000
a Exact statistic b Design: Intercept+Breadth
Table 13 Depth Manipulation check Effect Value F Hypothesis df Error df Sig. Depth Pillai's Trace .082 11.883(a) 2.000 265.000 .000 Wilks' Lambda .918 11.883(a) 2.000 265.000 .000 Hotelling's Trace .090 11.883(a) 2.000 265.000 .000 Roy's Largest Root .090 11.883(a) 2.000 265.000 .000
a Exact statistic b Design: Intercept+Depth
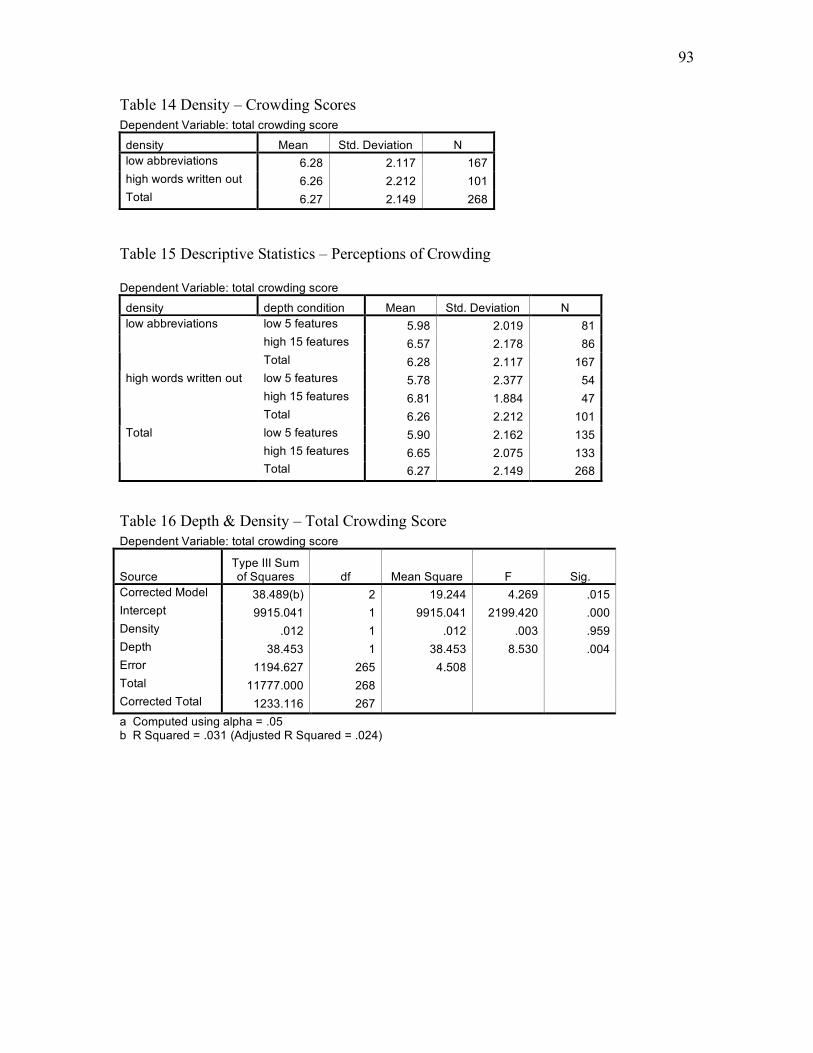
93
Table 14 Density – Crowding Scores Dependent Variable: total crowding score
density Mean Std. Deviation N low abbreviations 6.28 2.117 167 high words written out 6.26 2.212 101 Total 6.27 2.149 268
Table 15 Descriptive Statistics – Perceptions of Crowding Dependent Variable: total crowding score
density depth condition Mean Std. Deviation N low 5 features 5.98 2.019 81 high 15 features 6.57 2.178 86
low abbreviations
Total 6.28 2.117 167 low 5 features 5.78 2.377 54 high 15 features 6.81 1.884 47
high words written out
Total 6.26 2.212 101 low 5 features 5.90 2.162 135 high 15 features 6.65 2.075 133
Total
Total 6.27 2.149 268
Table 16 Depth & Density – Total Crowding Score Dependent Variable: total crowding score
Source Type III Sum of Squares df Mean Square F Sig.
Corrected Model 38.489(b) 2 19.244 4.269 .015 Intercept 9915.041 1 9915.041 2199.420 .000 Density .012 1 .012 .003 .959 Depth 38.453 1 38.453 8.530 .004 Error 1194.627 265 4.508 Total 11777.000 268 Corrected Total 1233.116 267 a Computed using alpha = .05 b R Squared = .031 (Adjusted R Squared = .024)
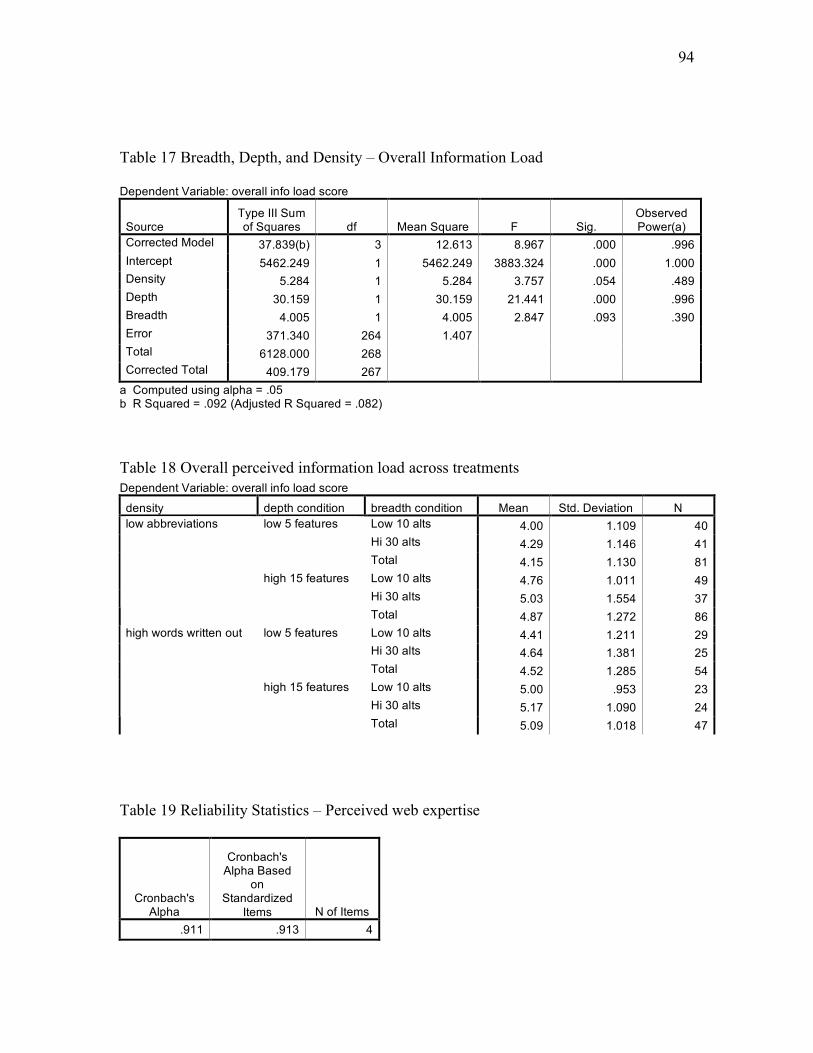
94
Table 17 Breadth, Depth, and Density – Overall Information Load Dependent Variable: overall info load score
Source Type III Sum of Squares df Mean Square F Sig.
Observed Power(a)
Corrected Model 37.839(b) 3 12.613 8.967 .000 .996 Intercept 5462.249 1 5462.249 3883.324 .000 1.000 Density 5.284 1 5.284 3.757 .054 .489 Depth 30.159 1 30.159 21.441 .000 .996 Breadth 4.005 1 4.005 2.847 .093 .390 Error 371.340 264 1.407 Total 6128.000 268 Corrected Total 409.179 267
a Computed using alpha = .05 b R Squared = .092 (Adjusted R Squared = .082)
Table 18 Overall perceived information load across treatments Dependent Variable: overall info load score
density depth condition breadth condition Mean Std. Deviation N Low 10 alts 4.00 1.109 40 Hi 30 alts 4.29 1.146 41
low 5 features
Total 4.15 1.130 81 Low 10 alts 4.76 1.011 49 Hi 30 alts 5.03 1.554 37
low abbreviations
high 15 features
Total 4.87 1.272 86 Low 10 alts 4.41 1.211 29 Hi 30 alts 4.64 1.381 25
low 5 features
Total 4.52 1.285 54 Low 10 alts 5.00 .953 23 Hi 30 alts 5.17 1.090 24
high words written out
high 15 features
Total 5.09 1.018 47
Table 19 Reliability Statistics – Perceived web expertise
Cronbach's Alpha
Cronbach's Alpha Based
on Standardized
Items N of Items .911 .913 4
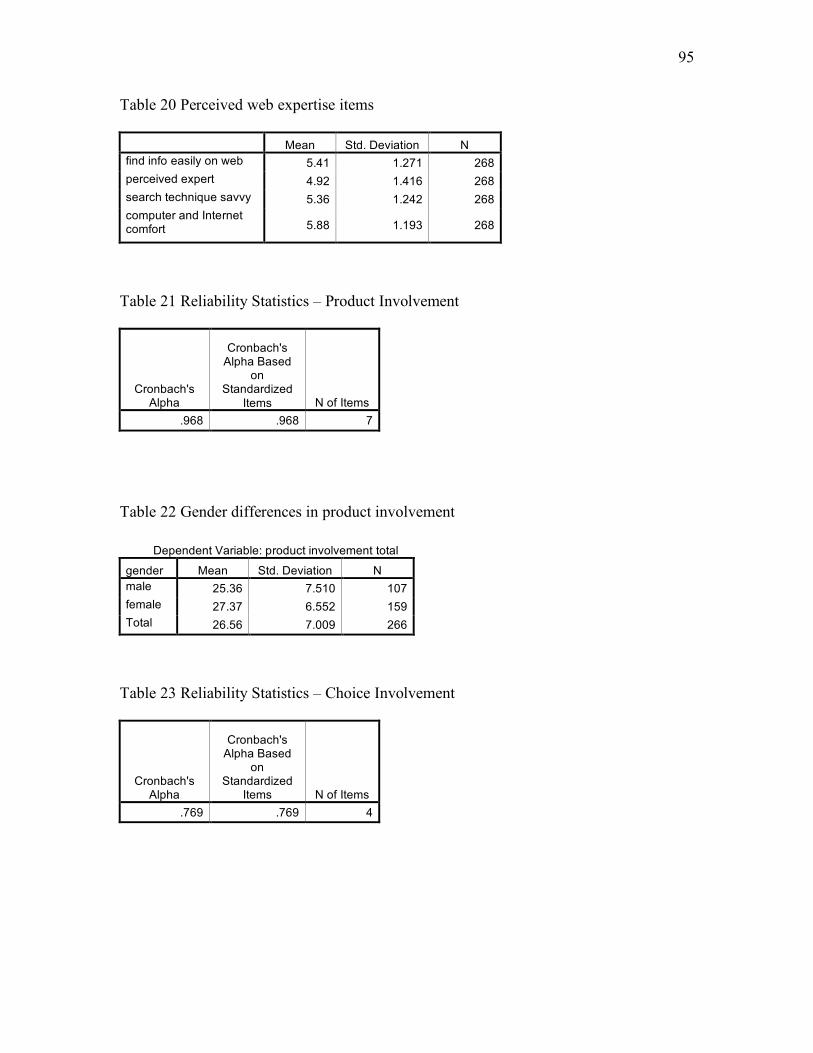
95
Table 20 Perceived web expertise items Mean Std. Deviation N find info easily on web 5.41 1.271 268 perceived expert 4.92 1.416 268 search technique savvy 5.36 1.242 268 computer and Internet comfort 5.88 1.193 268
Table 21 Reliability Statistics – Product Involvement
Cronbach's Alpha
Cronbach's Alpha Based
on Standardized
Items N of Items .968 .968 7
Table 22 Gender differences in product involvement Dependent Variable: product involvement total
gender Mean Std. Deviation N male 25.36 7.510 107 female 27.37 6.552 159 Total 26.56 7.009 266
Table 23 Reliability Statistics – Choice Involvement
Cronbach's Alpha
Cronbach's Alpha Based
on Standardized
Items N of Items .769 .769 4

96
Table 24 Choice involvement items Mean Std. Deviation N all other possibilities 4.96 1.382 256 high self standards 5.18 1.297 256 seek all options 5.17 1.325 256 pain search and regret 5.16 1.428 256
Table 25 Choice involvement correlation matrix
all other
possibilities high self
standards seek all options
pain search and regret
all other possibilities 1.000 .351 .579 .406 high self standards .351 1.000 .425 .430 seek all options .579 .425 1.000 .533 pain search and regret .406 .430 .533 1.000
Table 26 Choice Involvement Component Matrix
Choice Involvement Component
1 all other possibilities .763 high self standards .698 seek all options .840 pain search and regret .772
Extraction Method: Principal Component Analysis. One component extracted.
Table 27 Choice Involvement Factor Analysis
Initial Eigenvalues Extraction Sums of Squared Loadings Component Total % of Variance Cumulative % Total % of Variance Cumulative % 1 2.371 59.264 59.264 2.371 59.264 59.264 2 .684 17.106 76.370 3 .558 13.951 90.320 4 .387 9.680 100.000
Extraction Method: Principal Component Analysis.

97
Table 28 Reliability Statistics – Cognitive Effort
Cronbach's Alpha
Cronbach's Alpha Based
on Standardized
Items N of Items .952 .952 5
Table 29 Item-Total Statistics – Cognitive Effort
Scale Mean if Item Deleted
Scale Variance if
Item Deleted
Corrected Item-Total Correlation
Squared Multiple
Correlation
Cronbach's Alpha if Item
Deleted compare alternatives 15.31 38.941 .854 .730 .943 evaluate attributes 15.47 40.527 .869 .762 .940 distinguish betw alts 15.45 39.529 .877 .772 .939 select best 15.11 40.190 .846 .720 .944 compare attributes 15.34 39.819 .892 .799 .936
Table 30 Treatment – Choice Quality Means Dependent Variable: Choice quality
95% Confidence Interval treatment Mean Std. Error Lower Bound Upper Bound HHH .714 .048 .620 .808 HHL .664 .039 .587 .741 HLL .755 .039 .679 .831 HLH .620 .048 .526 .714 LHH .814 .050 .716 .911 LHL .783 .034 .715 .850 LLH .817 .043 .732 .903 LLL .855 .038 .780 .930

98
Table 31 Overall Treatment – Choice Quality
Sum of
Squares df Mean Square F Sig. Contrast 1.604 7 .229 3.575 .001 Error 18.655 291 .064
Table 32 Product Information Breadth – Cognitive Effort
Unstandardized Coefficients
Standardized Coefficients
Model B Std. Error Beta t Sig. (Constant) 16.626 .627 26.525 .000 1 breadth condition 5.207 .909 .333 5.729 .000
a Dependent Variable: cognitive effort total (Adjusted R squared =0.108)
Table 33 Breadth & Choice Involvement – Cognitive Effort
Model Unstandardized
Coefficients Standardized Coefficients t Sig.
B Std. Error Beta 1 (Constant) 19.105 .472 40.483 .000 Brdth2 2.390 .472 .306 5.064 .000 CI Centered -.273 .114 -.146 -2.394 .017 breadth2xCI -.018 .114 -.009 -.158 .874
a Dependent Variable: cognitive effort total
Table 34 Breadth & Product Involvement – Cognitive Effort
Model Unstandardized
Coefficients Standardized Coefficients t Sig.
B Std. Error Beta 1 (Constant) 19.169 .444 43.178 .000 Brdth2 2.237 .444 .286 5.040 .000 centered product
involvement -.299 .063 -.270 -4.746 .000
breadth2xproduct involv -.035 .063 -.031 -.561 .575 a Dependent Variable: cognitive effort total

99
Table 35 Depth – Cognitive Effort
Unstandardized Coefficients
Standardized Coefficients
Model B Std. Error Beta t Sig. (Constant) 18.000 .668 26.936 .000 1 depth condition 2.353 .949 .150 2.481 .014
a Dependent Variable: cognitive effort total (.019 Adjusted R squared)
Table 36 Depth & Choice Involvement – Cognitive Effort
Unstandardized Coefficients
Standardized Coefficients
Model B Std. Error Beta t Sig. (Constant) 19.053 .481 39.639 .000 Depth2 1.032 .481 .132 2.147 .033 depth2 x CI -.085 .116 -.045 -.731 .466
1
CI Centered -.372 .116 -.198 -3.213 .001 a Dependent Variable: cognitive effort total
Table 37 Depth & Product Involvement – Cognitive Effort
Unstandardized Coefficients
Standardized Coefficients
Model B Std. Error Beta t Sig. (Constant) 19.098 .451 42.386 .000 Depth2 1.212 .451 .155 2.691 .008 centered product involvement -.356 .064 -.321 -5.553 .000
1
depth2 x product involv .078 .064 .071 1.221 .223 a Dependent Variable: cognitive effort total

100
Table 38 Density – Cognitive Effort Dependent Variable: cognitive effort total
Source Type IV Sum of Squares df Mean Square F Sig.
Corrected Model .720(a) 1 .720 .012 .914 Intercept 91350.698 1 91350.698 1487.306 .000 Density .720 1 .720 .012 .914 Error 16153.529 263 61.420 Total 112848.000 265 Corrected Total 16154.249 264
a R Squared = .000 (Adjusted R Squared = -.004)
Table 39 Manipulated sub-sample/Density – Cognitive Effort
Model Sum of
Squares df Mean Square F Sig. Regression 65.056 1 65.056 1.064 .305(a) Residual 6725.435 110 61.140
1
Total 6790.491 111 a Predictors: (Constant), density b Dependent Variable: cognitive effort total c Selecting only cases for which crowding spacious:crowded >= 4
Table 40 Perceived Crowding (full sample) – Cognitive Effort
Unstandardized Coefficients
Standardized Coefficients
Model B Std. Error Beta t Sig. (Constant) 11.478 1.395 8.231 .000 1 crowding spacious:crowded 2.273 .393 .336 5.781 .000
a Dependent Variable: cognitive effort total (Adjusted R squared = .109)
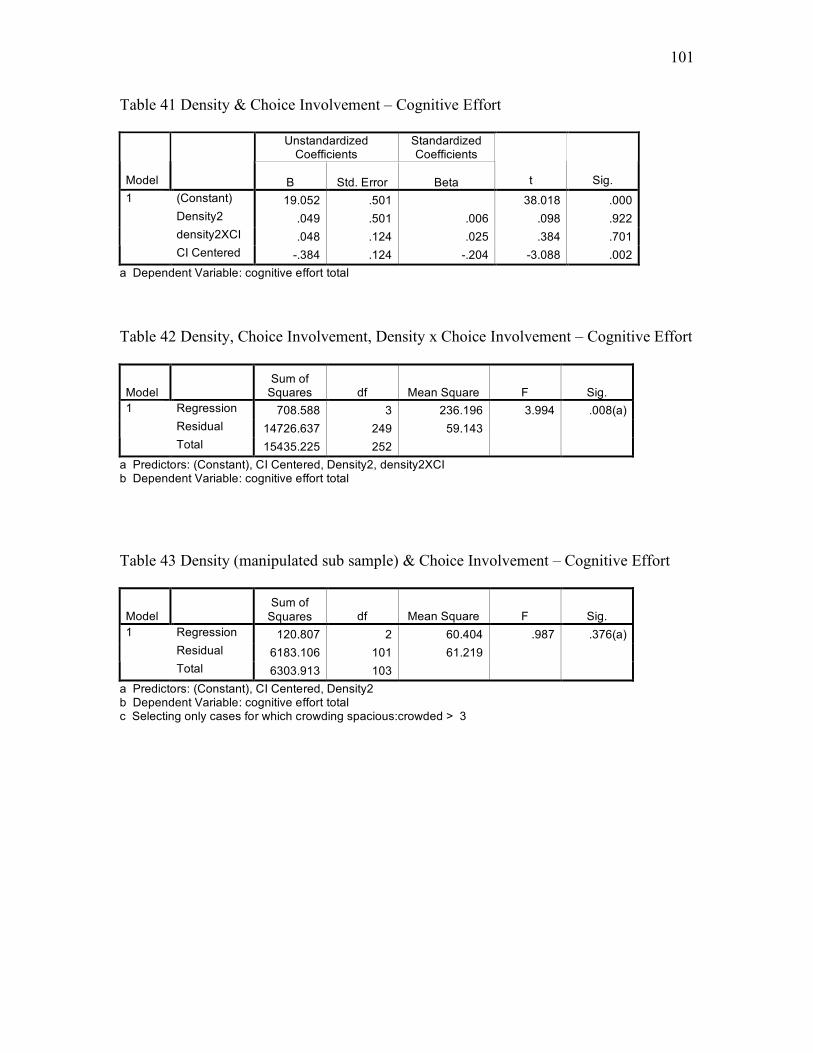
101
Table 41 Density & Choice Involvement – Cognitive Effort
Unstandardized Coefficients
Standardized Coefficients
Model B Std. Error Beta t Sig. (Constant) 19.052 .501 38.018 .000 Density2 .049 .501 .006 .098 .922 density2XCI .048 .124 .025 .384 .701
1
CI Centered -.384 .124 -.204 -3.088 .002 a Dependent Variable: cognitive effort total
Table 42 Density, Choice Involvement, Density x Choice Involvement – Cognitive Effort
Model Sum of
Squares df Mean Square F Sig. Regression 708.588 3 236.196 3.994 .008(a) Residual 14726.637 249 59.143
1
Total 15435.225 252 a Predictors: (Constant), CI Centered, Density2, density2XCI b Dependent Variable: cognitive effort total
Table 43 Density (manipulated sub sample) & Choice Involvement – Cognitive Effort
Model Sum of
Squares df Mean Square F Sig. Regression 120.807 2 60.404 .987 .376(a) Residual 6183.106 101 61.219
1
Total 6303.913 103 a Predictors: (Constant), CI Centered, Density2 b Dependent Variable: cognitive effort total c Selecting only cases for which crowding spacious:crowded > 3

102
Table 44 Perceived Crowding & Choice Involvement – Cognitive Effort
Unstandardized Coefficients
Standardized Coefficients
Model B Std. Error Beta t Sig. (Constant) 19.125 .461 41.450 .000 Choice Involvement -.341 .111 -.182 -3.067 .002 Perceived crowding 2.078 .405 .305 5.128 .000
1
choice involvement x crowding - both centered .049 .090 .032 .542 .588
a Dependent Variable: cognitive effort total
Table 45 Density & Product Involvement – Cognitive Effort
Unstandardized Coefficients
Standardized Coefficients
Model B Std. Error Beta t Sig. (Constant) 19.121 .471 40.597 .000 Density2 .073 .471 .009 .154 .878 density2xProdInvolv -.038 .068 -.034 -.553 .581
1
centered product involvement -.367 .068 -.331 -5.379 .000
a Dependent Variable: cognitive effort total
Table 46 Density & Product Involvement (sub-sample) – Cognitive Effort
Unstandardized Coefficients
Standardized Coefficients
Model B Std. Error Beta t Sig. (Constant) 21.807 .737 29.601 .000 Density2 .484 .737 .061 .657 .512 density2xProdInvolv .024 .104 .023 .233 .816
1
centered product involvement -.306 .104 -.290 -2.955 .004
a Dependent Variable: cognitive effort total b Selecting only cases for which crowding spacious:crowded > 3
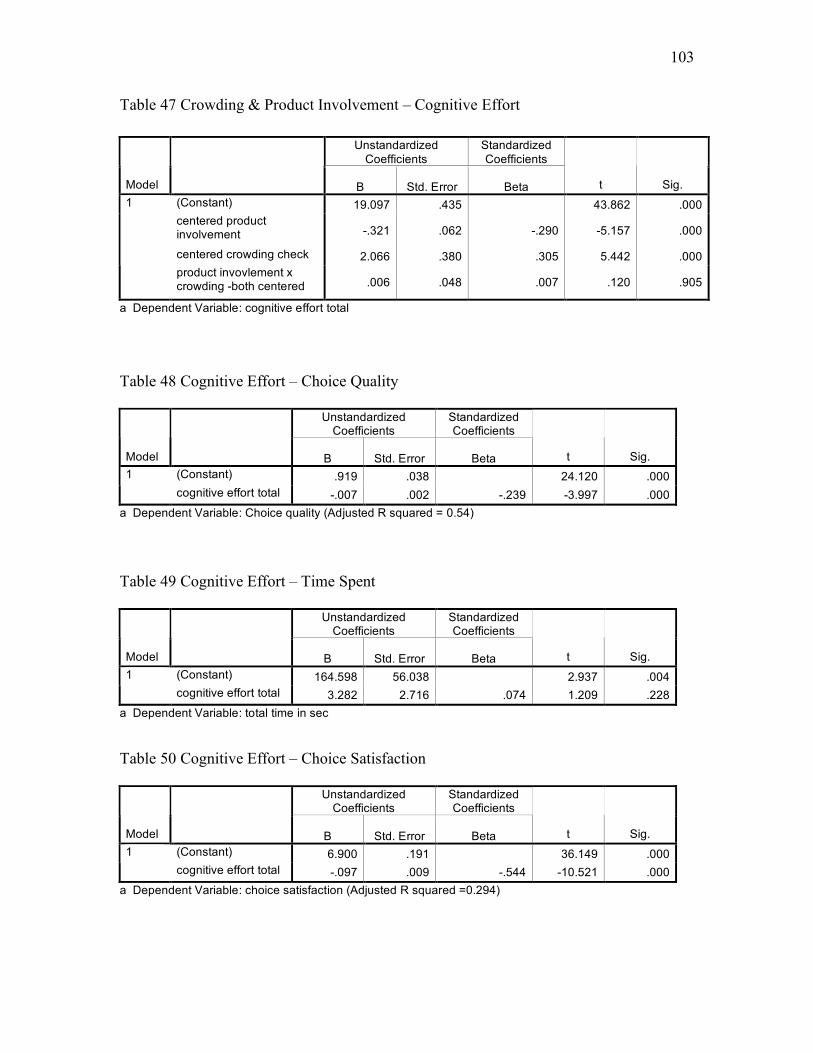
103
Table 47 Crowding & Product Involvement – Cognitive Effort
Unstandardized Coefficients
Standardized Coefficients
Model B Std. Error Beta t Sig. (Constant) 19.097 .435 43.862 .000 centered product involvement -.321 .062 -.290 -5.157 .000
centered crowding check 2.066 .380 .305 5.442 .000
1
product invovlement x crowding -both centered .006 .048 .007 .120 .905
a Dependent Variable: cognitive effort total
Table 48 Cognitive Effort – Choice Quality
Unstandardized Coefficients
Standardized Coefficients
Model B Std. Error Beta t Sig. (Constant) .919 .038 24.120 .000 1 cognitive effort total -.007 .002 -.239 -3.997 .000
a Dependent Variable: Choice quality (Adjusted R squared = 0.54)
Table 49 Cognitive Effort – Time Spent
Unstandardized Coefficients
Standardized Coefficients
Model B Std. Error Beta t Sig. (Constant) 164.598 56.038 2.937 .004 1 cognitive effort total 3.282 2.716 .074 1.209 .228
a Dependent Variable: total time in sec
Table 50 Cognitive Effort – Choice Satisfaction
Unstandardized Coefficients
Standardized Coefficients
Model B Std. Error Beta t Sig. (Constant) 6.900 .191 36.149 .000 1 cognitive effort total -.097 .009 -.544 -10.521 .000
a Dependent Variable: choice satisfaction (Adjusted R squared =0.294)

104
Table 51 Overall Model Information Load (Breadth, Depth, Crowding) – Choice Quality
Model Sum of
Squares df Mean Square F Sig. Regression 1.413 3 .471 8.823 .000(a) Residual 13.938 261 .053
1
Total 15.351 264 a Predictors: (Constant), crowding spacious:crowded, breadth condition, depth condition b Dependent Variable: Choice quality
Table 52 Information Load (Breadth, Depth, Crowding) – Choice Quality
Unstandardized Coefficients
Standardized Coefficients
Model B Std. Error Beta t Sig. (Constant) .934 .045 20.721 .000 breadth condition -.125 .029 -.259 -4.377 .000 depth condition -.021 .029 -.045 -.736 .463
1
crowding spacious:crowded -.026 .013 -.123 -2.028 .044
a Dependent Variable: Choice quality
Table 53 Overall Model: Breadth, Crowding, & Cognitive Effort – Choice Quality
Model Sum of
Squares df Mean Square F Sig. Regression 1.613 3 .538 10.212 .000(a) Residual 13.739 261 .053
1
Total 15.351 264 a Predictors: (Constant), cognitive effort total, breadth condition, crowding spacious:crowded b Dependent Variable: Choice quality
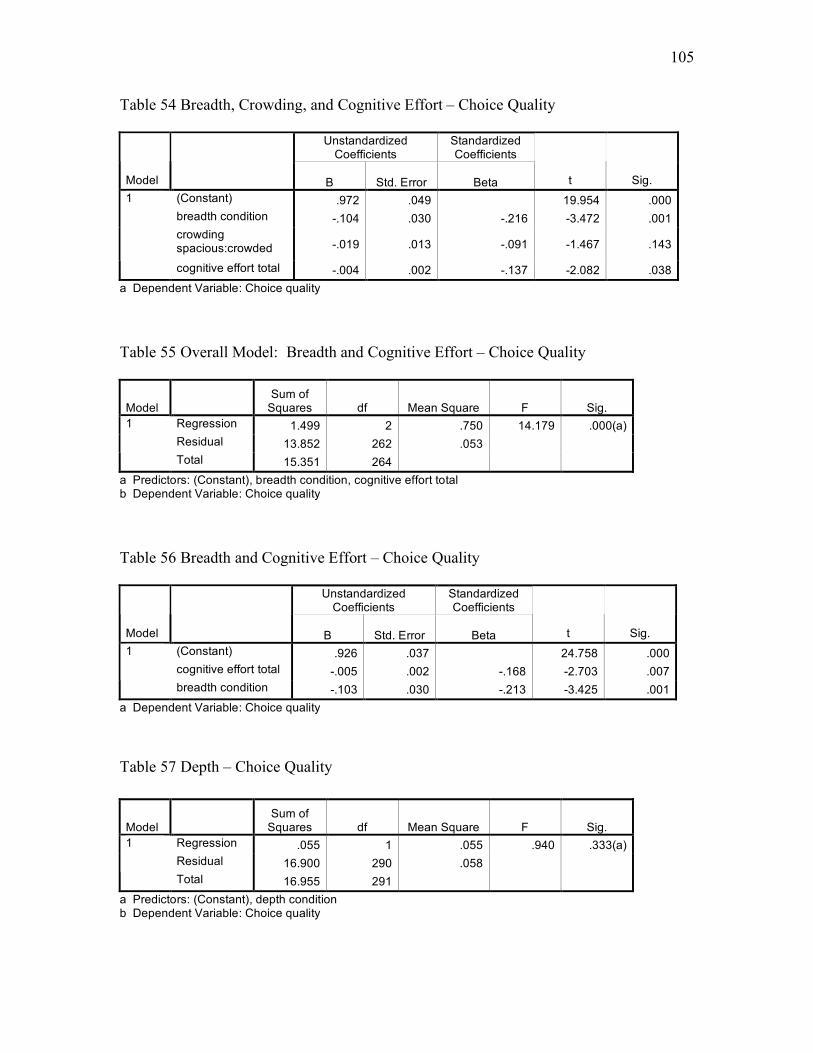
105
Table 54 Breadth, Crowding, and Cognitive Effort – Choice Quality
Unstandardized Coefficients
Standardized Coefficients
Model B Std. Error Beta t Sig. (Constant) .972 .049 19.954 .000 breadth condition -.104 .030 -.216 -3.472 .001 crowding spacious:crowded -.019 .013 -.091 -1.467 .143
1
cognitive effort total -.004 .002 -.137 -2.082 .038 a Dependent Variable: Choice quality
Table 55 Overall Model: Breadth and Cognitive Effort – Choice Quality
Model Sum of
Squares df Mean Square F Sig. Regression 1.499 2 .750 14.179 .000(a) Residual 13.852 262 .053
1
Total 15.351 264 a Predictors: (Constant), breadth condition, cognitive effort total b Dependent Variable: Choice quality
Table 56 Breadth and Cognitive Effort – Choice Quality
Unstandardized Coefficients
Standardized Coefficients
Model B Std. Error Beta t Sig. (Constant) .926 .037 24.758 .000 cognitive effort total -.005 .002 -.168 -2.703 .007
1
breadth condition -.103 .030 -.213 -3.425 .001 a Dependent Variable: Choice quality
Table 57 Depth – Choice Quality
Model Sum of
Squares df Mean Square F Sig. Regression .055 1 .055 .940 .333(a) Residual 16.900 290 .058
1
Total 16.955 291 a Predictors: (Constant), depth condition b Dependent Variable: Choice quality
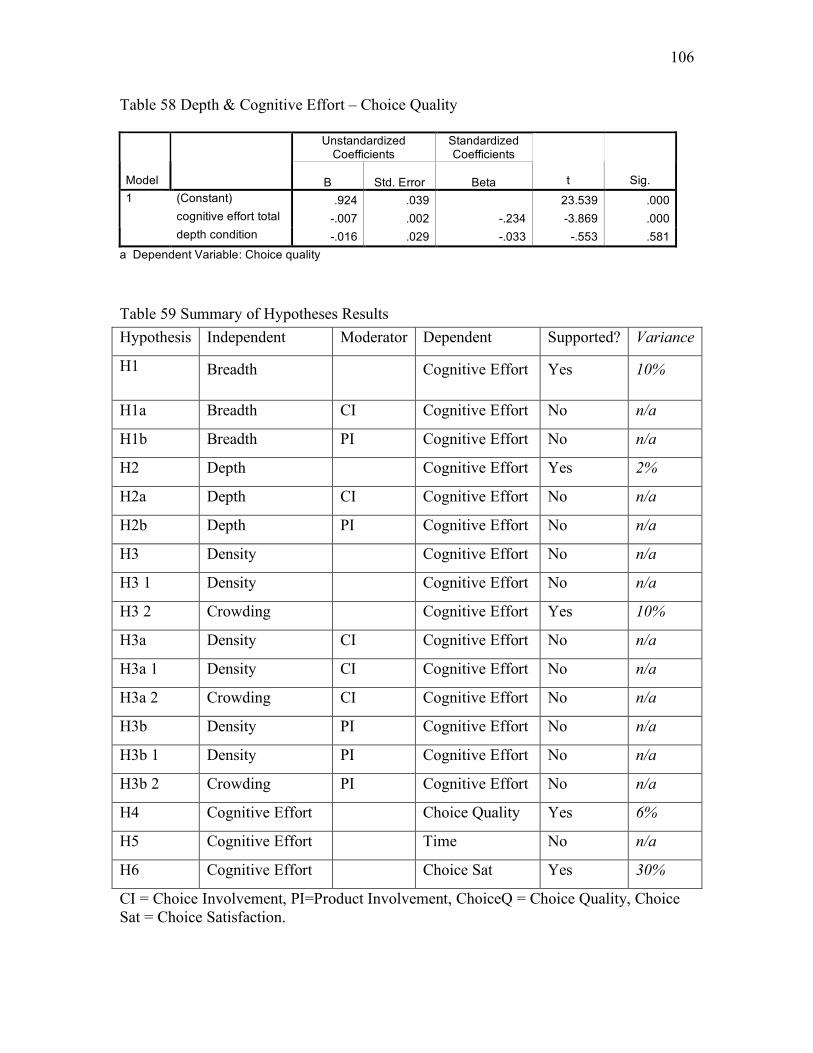
106
Table 58 Depth & Cognitive Effort – Choice Quality
Unstandardized Coefficients
Standardized Coefficients
Model B Std. Error Beta t Sig. (Constant) .924 .039 23.539 .000 cognitive effort total -.007 .002 -.234 -3.869 .000
1
depth condition -.016 .029 -.033 -.553 .581 a Dependent Variable: Choice quality
Table 59 Summary of Hypotheses Results Hypothesis Independent
Variable
V
Moderator Dependent
Variable
Supported? Variance
H1 Breadth Cognitive Effort Yes 10%
H1a Breadth CI Cognitive Effort No n/a
H1b Breadth PI Cognitive Effort
CE
No n/a
H2 Depth Cognitive Effort
CE
Yes 2%
H2a Depth CI Cognitive Effort No n/a
H2b Depth PI Cognitive Effort No n/a
H3 Density Cognitive Effort
CE
No n/a
H3 1 Density Cognitive Effort
CE
No n/a
H3 2 Crowding Cognitive Effort
CE
Yes 10%
H3a Density CI Cognitive Effort
CE
No n/a
H3a 1 Density CI Cognitive Effort
CE
No n/a
H3a 2 Crowding CI Cognitive Effort
CE
No n/a
H3b Density PI Cognitive Effort
CE
No n/a
H3b 1 Density PI Cognitive Effort
CE
No n/a
H3b 2 Crowding PI Cognitive Effort
CE
No n/a
H4 Cognitive Effort
CE
Choice Quality Yes 6%
H5 Cognitive Effort
CE
Time No n/a
H6 Cognitive Effort
CE
Choice Sat Yes 30%
CI = Choice Involvement, PI=Product Involvement, ChoiceQ = Choice Quality, Choice Sat = Choice Satisfaction.

107
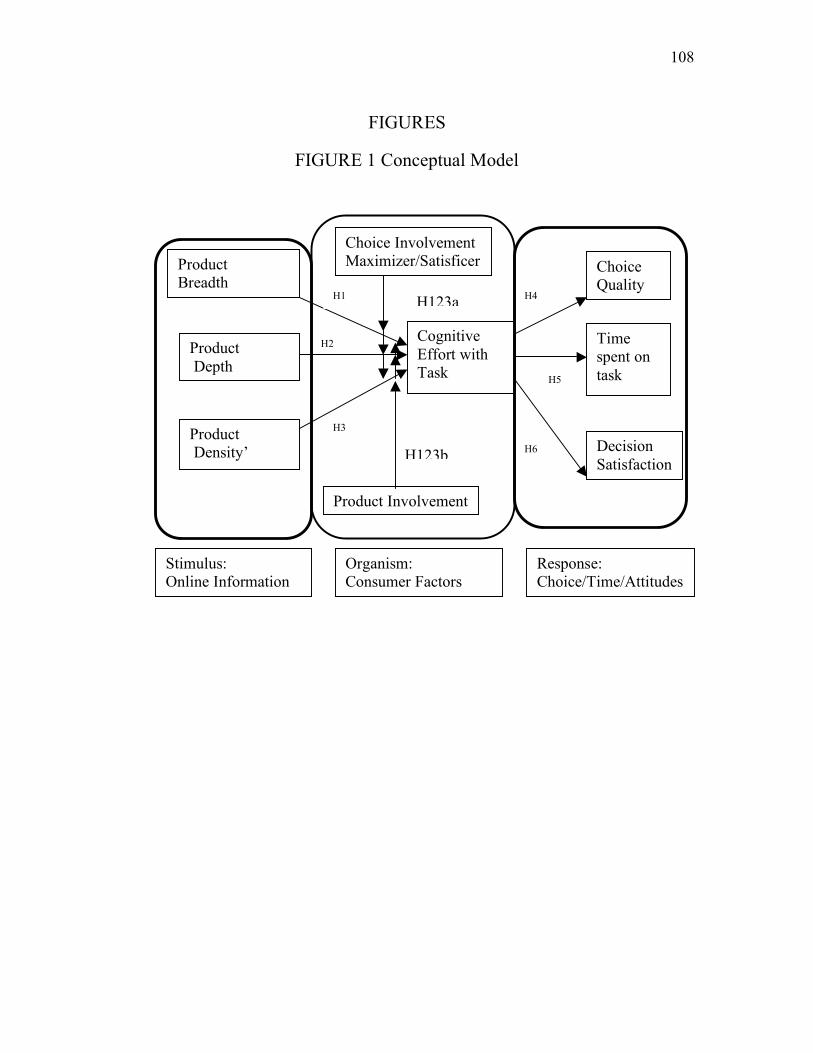
108
FIGURES
FIGURE 1 Conceptual Model
Product Breadth
Product Density’
Product Involvement
Cognitive Effort with Task
Choice Quality
Time spent on task
Decision Satisfaction
Choice Involvement Maximizer/Satisficer
H2
H1
H123b
H123a H4
H5
H6
Product Depth
H3
Stimulus: Online Information
Organism: Consumer Factors
Response: Choice/Time/Attitudes

109
FIGURE 2 Experimental Matrix
BREADTH DEPTH DENSITY
Low High
Low (5 attributes)
HLL (30 alts/5attrib each)[150]
HLH (30 alts/5attrib each)[150])
# Pa
ges
Hig
h –
6 pa
ges
High (15 attributes)
HHL (30alts/15attrib each) [450]
HHH (30 lts/15attrib each) [450]
Low (5 attributes)
LLL (10alts/5attrib each) [50])
LLL (10alts/5attrib each) [50]
Web
site
Pro
duct
Info
rmat
ion
Load
Pr
oduc
ts B
read
th/#
Alte
rnat
ives
Lo
w (1
0 al
tern
ativ
es)/
Hig
h (3
0 al
tern
ativ
es)
# Pa
ges
Low
– 2
pag
es
High (15 attributes)
LHL (10alts,15attrib each) [150]
LHH (10alts,15 attrib each)[150]
[#] indicates the number of informational pieces provided across the total number of pages. Ex: # alternatives x # attributes per alternative = total # of informational pieces L=Low, H=High, sequence = breadth, depth, and density
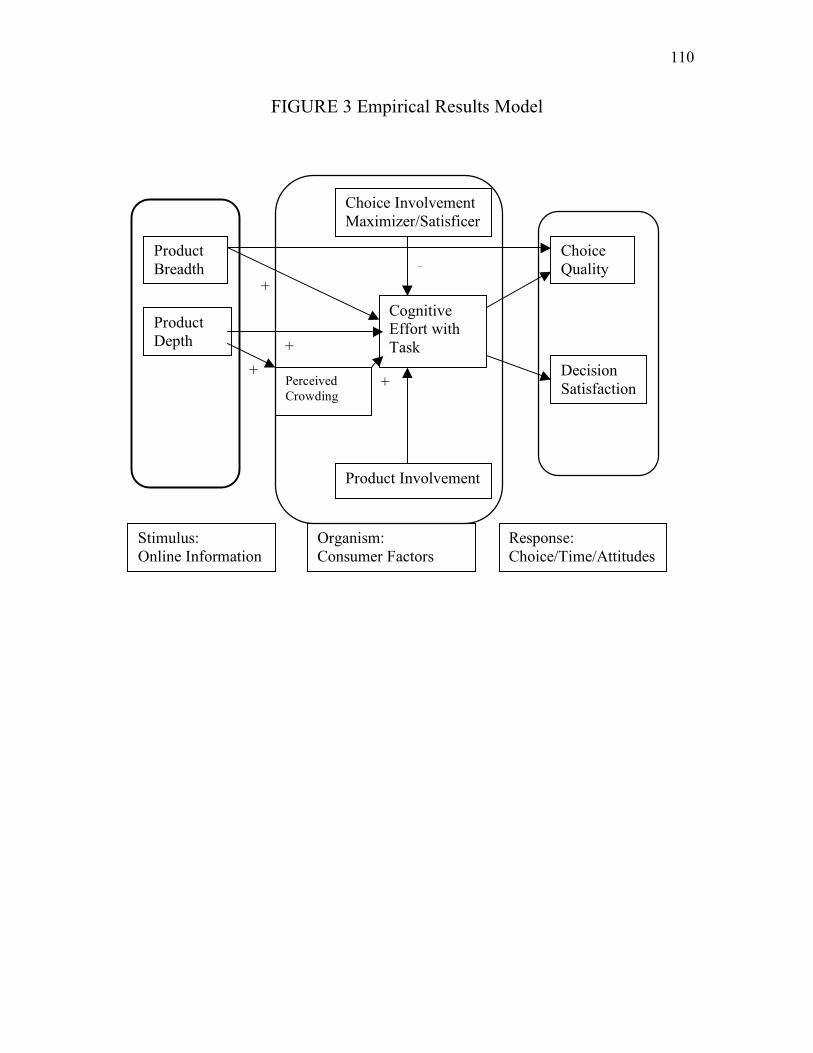
110
FIGURE 3 Empirical Results Model
Product Breadth
Product Involvement
Cognitive Effort with Task
Choice Quality
Decision Satisfaction
Choice Involvement Maximizer/Satisficer
Product Depth
Stimulus: Online Information
Organism: Consumer Factors
Response: Choice/Time/Attitudes
Perceived Crowding
- -
-
-
-
+
+
+ +
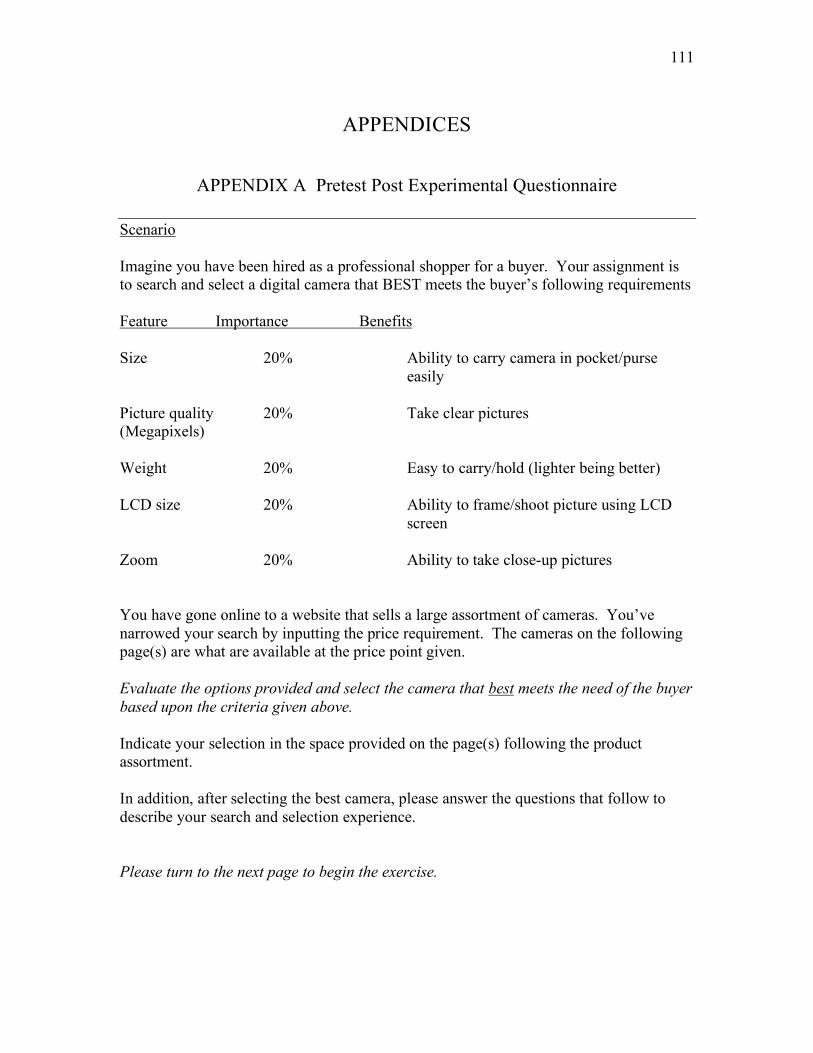
111
APPENDICES
APPENDIX A Pretest Post Experimental Questionnaire
Scenario Imagine you have been hired as a professional shopper for a buyer. Your assignment is to search and select a digital camera that BEST meets the buyer’s following requirements Feature Importance Benefits Size 20% Ability to carry camera in pocket/purse easily Picture quality 20% Take clear pictures (Megapixels) Weight 20% Easy to carry/hold (lighter being better) LCD size 20% Ability to frame/shoot picture using LCD screen Zoom 20% Ability to take close-up pictures You have gone online to a website that sells a large assortment of cameras. You’ve narrowed your search by inputting the price requirement. The cameras on the following page(s) are what are available at the price point given. Evaluate the options provided and select the camera that best meets the need of the buyer based upon the criteria given above. Indicate your selection in the space provided on the page(s) following the product assortment. In addition, after selecting the best camera, please answer the questions that follow to describe your search and selection experience. Please turn to the next page to begin the exercise.

112
Please write in the space provided the model number of the digital camera selected. __________________
Please circle the number for each statement that best describes your search and selection experience. 1. The product information presented made it Extremely Extremely Easy Difficult
1 2 3 4 5 6 7 For me to compare products 1 2 3 4 5 6 7 For me to evaluate the product features 1 2 3 4 5 6 7 For me to distinguish product differences 1 2 3 4 5 6 7 For me to select the best product 1 2 3 4 5 6 7 For me to process the features offered
2. When evaluating the products I felt Strongly
Agree Agree Slightly
Agree Neither Slightly
Disagree Disagree Strongly
Disagree confident 1 2 3 4 5 6 7 confused 1 2 3 4 5 6 7
bored 1 2 3 4 5 6 7 overwhelmed 1 2 3 4 5 6 7
stressed 1 2 3 4 5 6 7 challenged 1 2 3 4 5 6 7
at ease 1 2 3 4 5 6 7 relaxed 1 2 3 4 5 6 7
3. When choosing the best product I felt Strongly
Agree Agree Slightly
Agree Neither Slightly
Disagree Disagree Strongly
Disagree confident 1 2 3 4 5 6 7 confused 1 2 3 4 5 6 7
challenged 1 2 3 4 5 6 7 overwhelmed 1 2 3 4 5 6 7
stressed 1 2 3 4 5 6 7 bored 1 2 3 4 5 6 7 at ease 1 2 3 4 5 6 7 relaxed 1 2 3 4 5 6 7
4. How satisfied are you with camera chosen? Very dissatisfied
Dissatisfied Slightly Dissatisfied
Neither Slightly Satisfied
Satisfied Very Satisfied
1 2 3 4 5 6 7
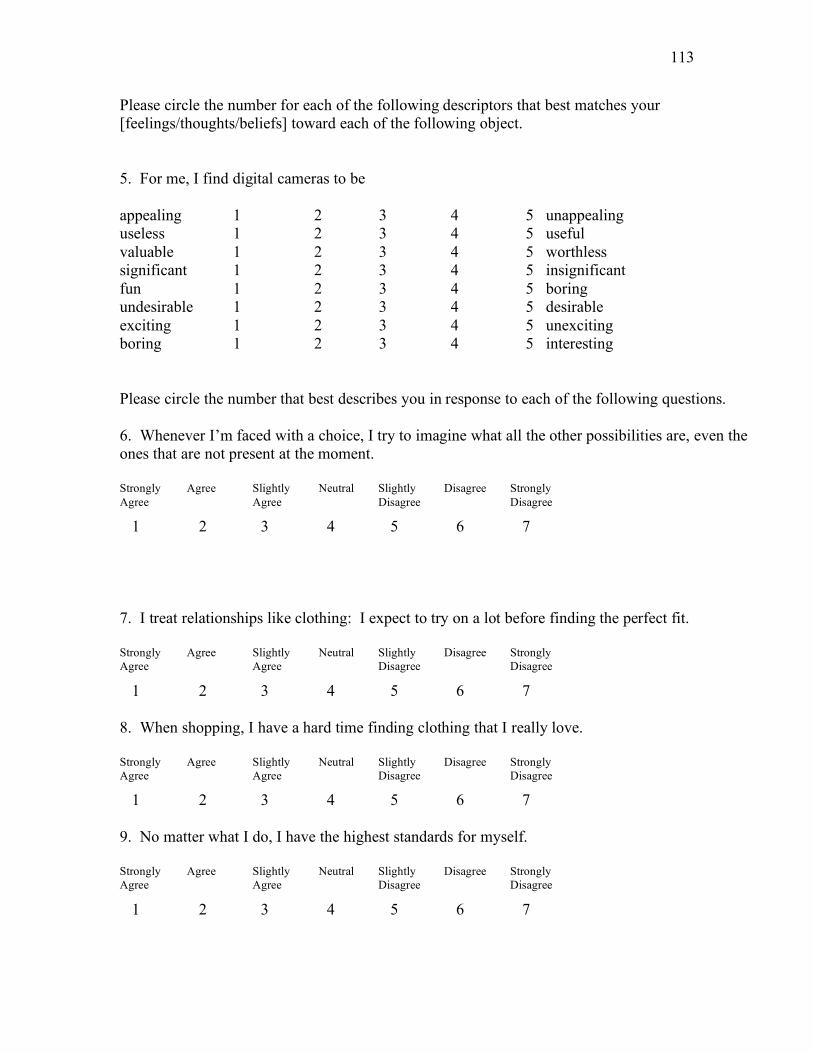
113
Please circle the number for each of the following descriptors that best matches your [feelings/thoughts/beliefs] toward each of the following object.
5. For me, I find digital cameras to be appealing 1 2 3 4 5 unappealing useless 1 2 3 4 5 useful valuable 1 2 3 4 5 worthless significant 1 2 3 4 5 insignificant fun 1 2 3 4 5 boring undesirable 1 2 3 4 5 desirable exciting 1 2 3 4 5 unexciting boring 1 2 3 4 5 interesting Please circle the number that best describes you in response to each of the following questions. 6. Whenever I’m faced with a choice, I try to imagine what all the other possibilities are, even the ones that are not present at the moment. Strongly Agree
Agree Slightly Agree
Neutral Slightly Disagree
Disagree Strongly Disagree
1 2 3 4 5 6 7 7. I treat relationships like clothing: I expect to try on a lot before finding the perfect fit. Strongly Agree
Agree Slightly Agree
Neutral Slightly Disagree
Disagree Strongly Disagree
1 2 3 4 5 6 7 8. When shopping, I have a hard time finding clothing that I really love. Strongly Agree
Agree Slightly Agree
Neutral Slightly Disagree
Disagree Strongly Disagree
1 2 3 4 5 6 7 9. No matter what I do, I have the highest standards for myself. Strongly Agree
Agree Slightly Agree
Neutral Slightly Disagree
Disagree Strongly Disagree
1 2 3 4 5 6 7

114
10. I often fantasize about living in ways that are quite different from my actual life. Strongly Agree
Agree Slightly Agree
Neutral Slightly Disagree
Disagree Strongly Disagree
1 2 3 4 5 6 7 11. I never settle for second best. Strongly Agree
Agree Slightly Agree
Neutral Slightly Disagree
Disagree Strongly Disagree
1 2 3 4 5 6 7 12. When I watch TV, I channel surf, often scanning through the available options even while attempting to watch one program. Strongly Agree
Agree Slightly Agree
Neutral Slightly Disagree
Disagree Strongly Disagree
Not Applicable
1 2 3 4 5 6 7 8 13. When I am listening to the radio, I often check other stations to see if something better is playing, even if I’m relatively satisfied with what I’m listening to. Strongly Agree
Agree Slightly Agree
Neutral Slightly Disagree
Disagree Strongly Disagree
Not Applicable
1 2 3 4 5 6 7 8 Please describe how you sorted through the information provided and made your final choice. Please feel free to write on the back of this sheet if you need more space.

115
APPENDIX B Experimental Stimuli Treatments H-High L-Low Breadth (#alternatives)/Depth (#attributes/alternative)/Density
H/H/H – 6 pages
H/H/L – 6 pages

116
HLH - 6 pages
HLL 6 pages
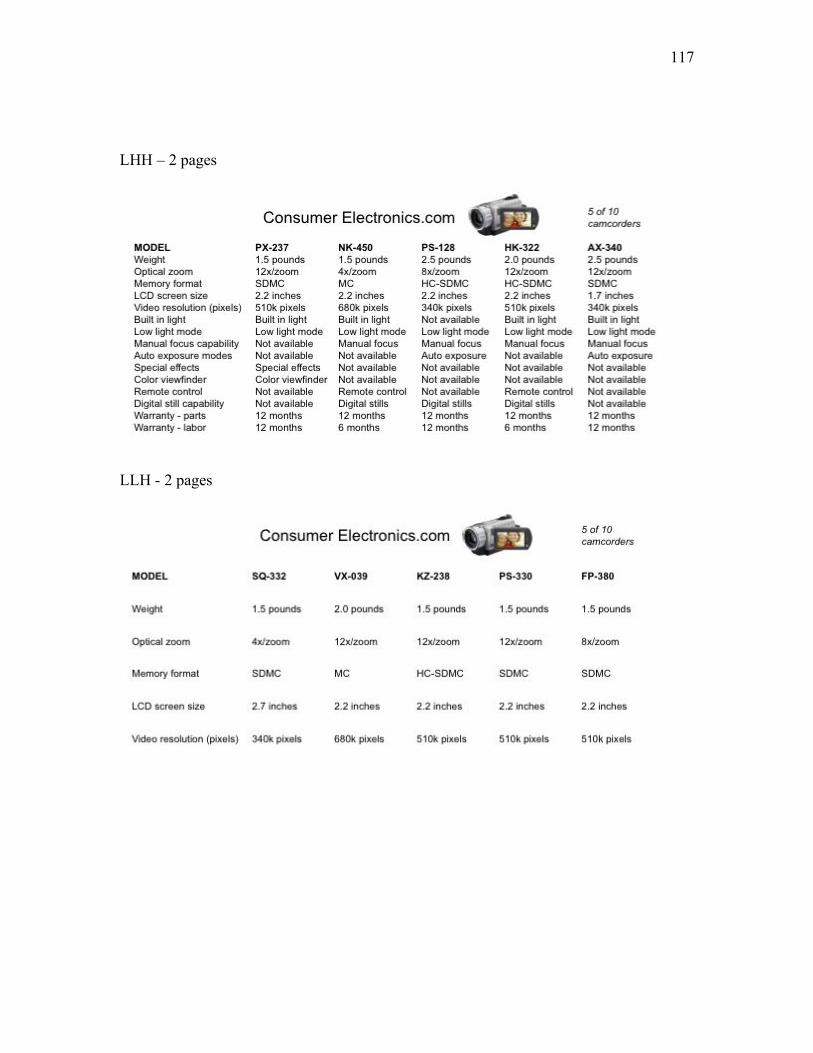
117
LHH – 2 pages
LLH - 2 pages
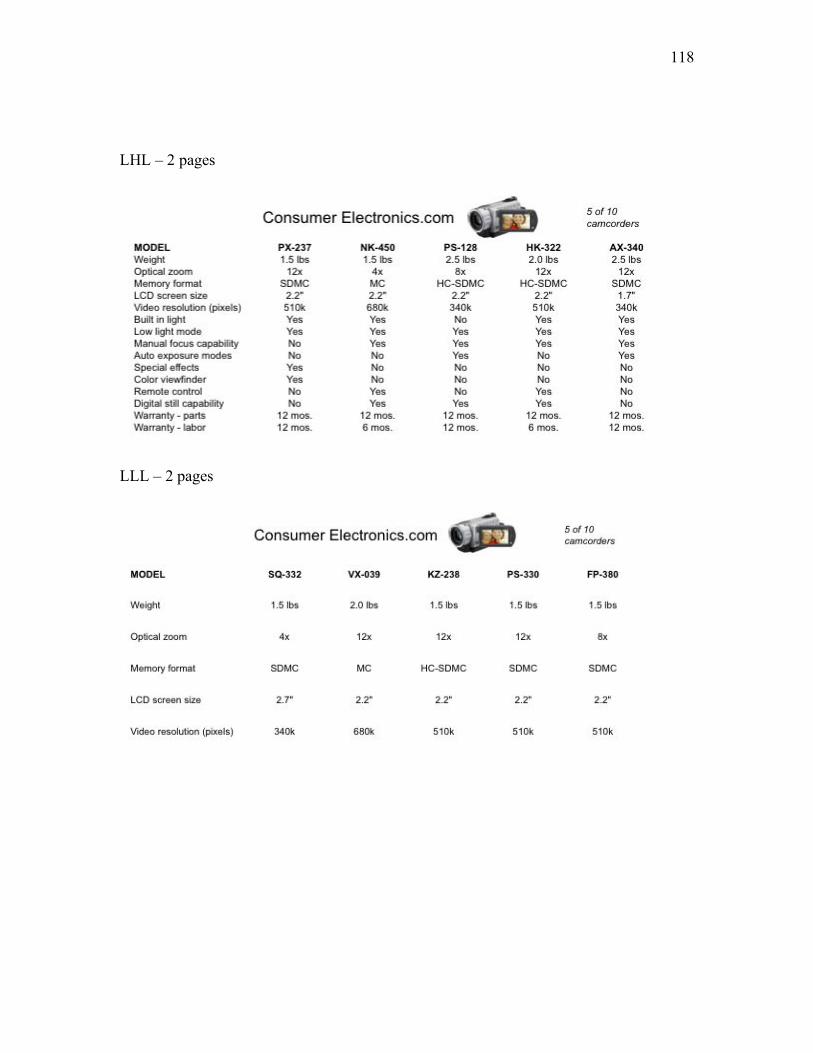
118
LHL – 2 pages
LLL – 2 pages

119
APPENDIX C SCALES
Product Involvement Reliability Statistics
Cronbach's Alpha N of Items
.963 6
Scale Items Used unappealing:appealing useless:useful worthless:valuable Insignificant:significant boring:fun undesirable:desirable unexciting:exciting
Choice Involvement
Cronbach's Alpha
Cronbach's Alpha Based
on Standardized
Items N of Items .769 .769 4
Item Statistics Mean Std. Deviation N all other possibilities 4.96 1.382 256 high self standards 5.18 1.297 256 seek all options 5.17 1.325 256 pain search and regret 5.16 1.428 256

120
Cognitive Effort
Cronbach's Alpha
Cronbach's Alpha Based
on Standardized
Items N of Items .952 .952 5
Item Statistics Mean Std. Deviation N compare alternatives 3.86 1.806 268 evaluate attributes 3.70 1.647 268 distinguish between alternatives 3.72 1.720 268
select best 4.06 1.709 268 compare attributes 3.83 1.673 268
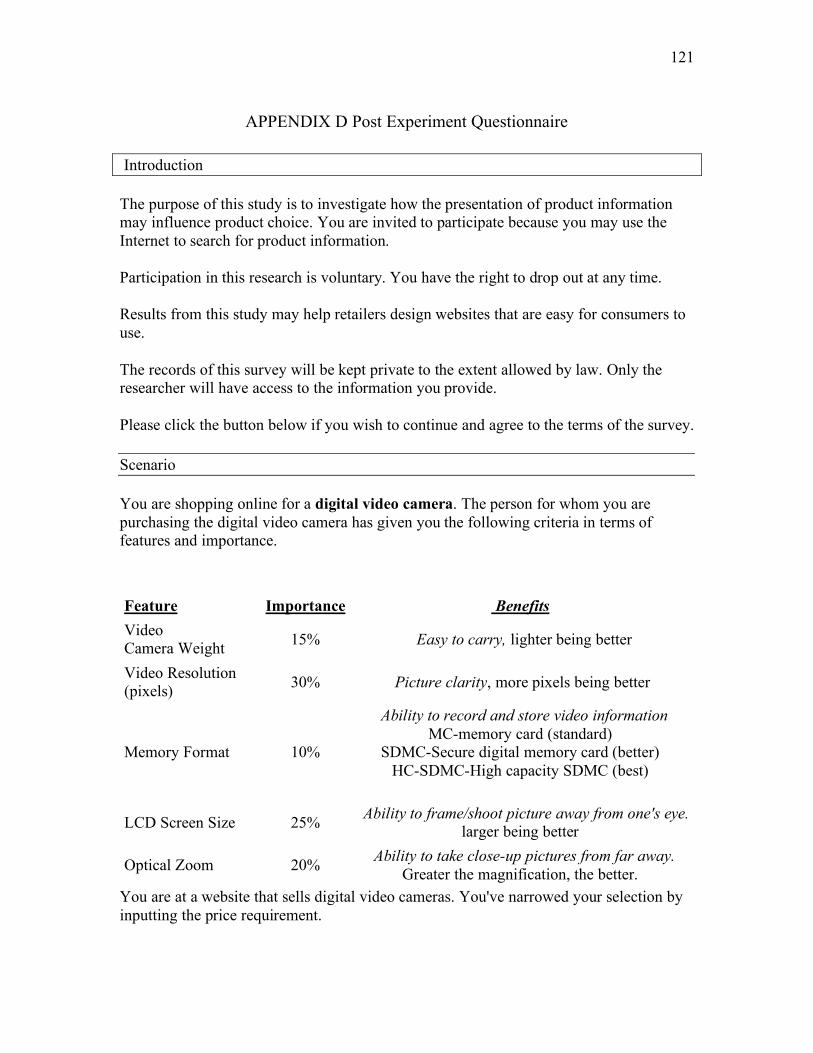
121
APPENDIX D Post Experiment Questionnaire
Introduction The purpose of this study is to investigate how the presentation of product information may influence product choice. You are invited to participate because you may use the Internet to search for product information. Participation in this research is voluntary. You have the right to drop out at any time.
Results from this study may help retailers design websites that are easy for consumers to use.
The records of this survey will be kept private to the extent allowed by law. Only the researcher will have access to the information you provide.
Please click the button below if you wish to continue and agree to the terms of the survey.
Scenario
You are shopping online for a digital video camera. The person for whom you are purchasing the digital video camera has given you the following criteria in terms of features and importance.
Feature Importance Benefits Video Camera Weight 15% Easy to carry, lighter being better
Video Resolution (pixels) 30% Picture clarity, more pixels being better
Memory Format 10%
Ability to record and store video information MC-memory card (standard)
SDMC-Secure digital memory card (better) HC-SDMC-High capacity SDMC (best)
LCD Screen Size 25% Ability to frame/shoot picture away from one's eye. larger being better
Optical Zoom 20% Ability to take close-up pictures from far away. Greater the magnification, the better.
You are at a website that sells digital video cameras. You've narrowed your selection by inputting the price requirement.

122
The digital video cameras presented on the following pages are what are available at the same price point. After you evaluate the digital video cameras provided, you will be asked to select the camera that you believe BEST meets the criteria provided above. Please note that you will NOT be able to refer to this page again once you start viewing the digital video cameras. (The importance weights for each feature...the more the weight, the more important the feature ...will be given again when you are asked to make your final choice)
Subject is transferred to survey site where one of eight treatment conditions are presented as outlined in Appendix A.
Post Treatment Survey Questions
While clicking through the product pages, the product information loaded
Very slowly Slowly Neither
slowly nor quickly
Quickly Very quickly Don't recall
Cognitive Effort Scale Items Please select the response for each statement that best describes your search and selection experience. The product information presented made it
Extremely difficult Difficult Somewhat
difficult
Neither easy nor difficult
Somewhat easy Easy Extremely
easy
To select the best product
To process the features offered
To evaluate product features
To distinguish product differences
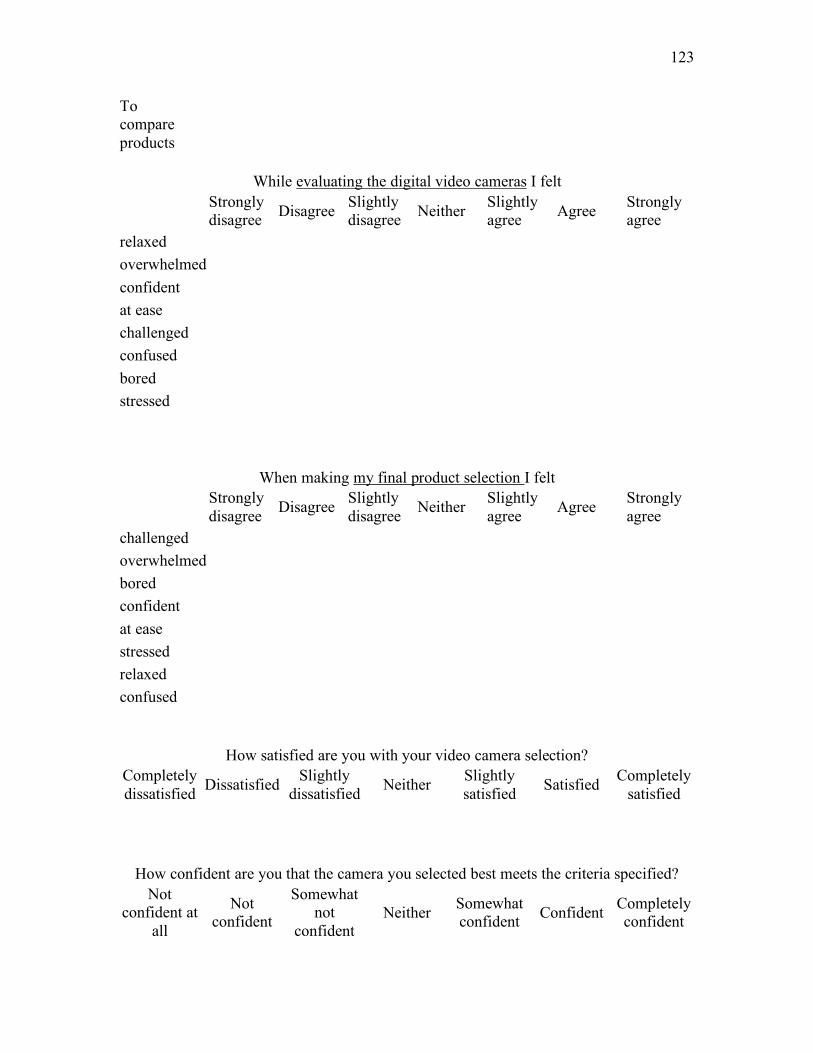
123
To compare products
While evaluating the digital video cameras I felt
Strongly disagree Disagree Slightly
disagree Neither Slightly agree Agree Strongly
agree relaxed overwhelmed confident at ease challenged confused bored stressed
When making my final product selection I felt
Strongly disagree Disagree Slightly
disagree Neither Slightly agree Agree Strongly
agree challenged overwhelmed bored confident at ease stressed relaxed confused
How satisfied are you with your video camera selection? Completely dissatisfied Dissatisfied Slightly
dissatisfied Neither Slightly satisfied Satisfied Completely
satisfied
How confident are you that the camera you selected best meets the criteria specified? Not
confident at all
Not confident
Somewhat not
confident Neither Somewhat
confident Confident Completely confident
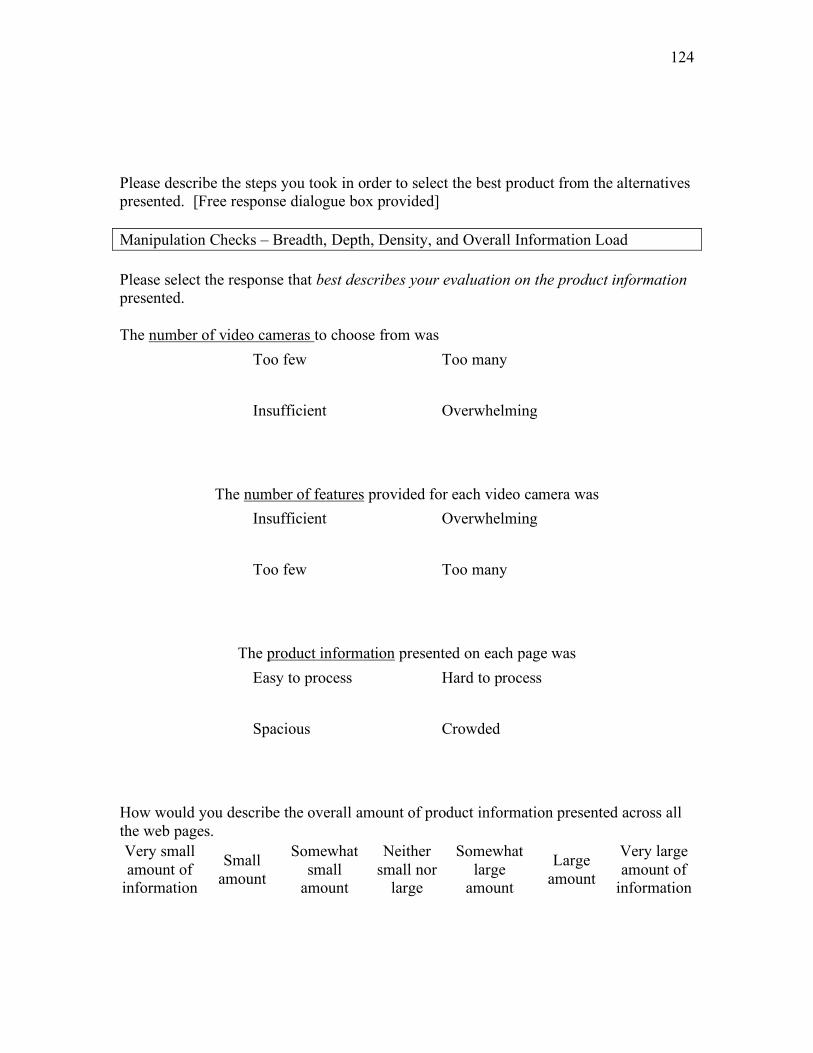
124
Please describe the steps you took in order to select the best product from the alternatives presented. [Free response dialogue box provided] Manipulation Checks – Breadth, Depth, Density, and Overall Information Load Please select the response that best describes your evaluation on the product information presented.
The number of video cameras to choose from was Too few Too many
Insufficient Overwhelming
The number of features provided for each video camera was Insufficient Overwhelming
Too few Too many
The product information presented on each page was Easy to process Hard to process
Spacious Crowded
How would you describe the overall amount of product information presented across all the web pages. Very small amount of
information
Small amount
Somewhat small
amount
Neither small nor
large
Somewhat large
amount
Large amount
Very large amount of
information
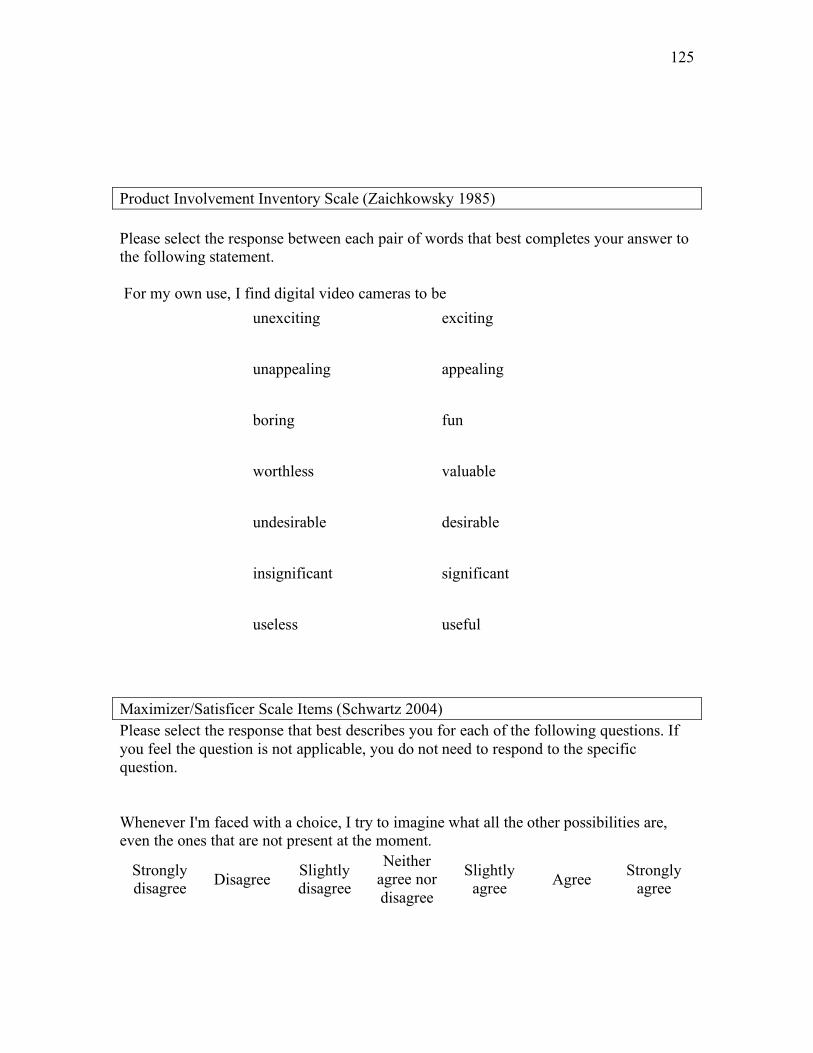
125
Product Involvement Inventory Scale (Zaichkowsky 1985) Please select the response between each pair of words that best completes your answer to the following statement. For my own use, I find digital video cameras to be
unexciting exciting
unappealing appealing
boring fun
worthless valuable
undesirable desirable
insignificant significant
useless useful
Maximizer/Satisficer Scale Items (Schwartz 2004) Please select the response that best describes you for each of the following questions. If you feel the question is not applicable, you do not need to respond to the specific question. Whenever I'm faced with a choice, I try to imagine what all the other possibilities are, even the ones that are not present at the moment.
Strongly disagree Disagree Slightly
disagree
Neither agree nor disagree
Slightly agree Agree Strongly
agree
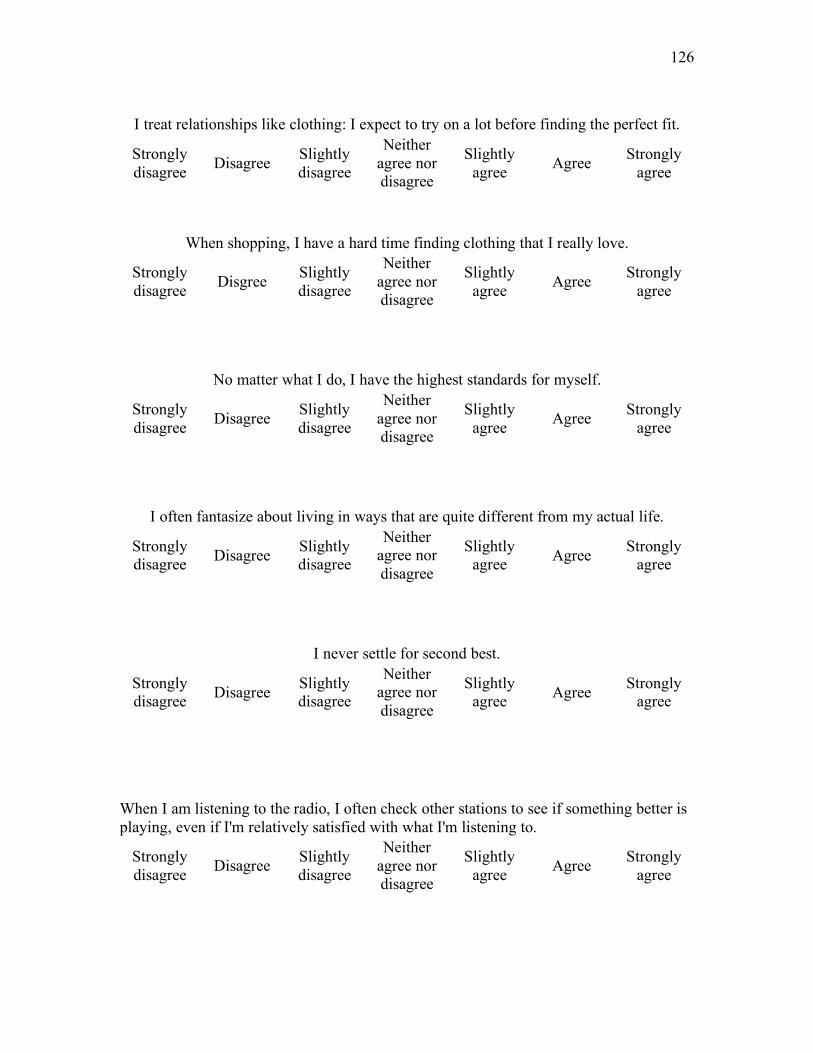
126
I treat relationships like clothing: I expect to try on a lot before finding the perfect fit.
Strongly disagree Disagree Slightly
disagree
Neither agree nor disagree
Slightly agree Agree Strongly
agree
When shopping, I have a hard time finding clothing that I really love.
Strongly disagree Disgree Slightly
disagree
Neither agree nor disagree
Slightly agree Agree Strongly
agree
No matter what I do, I have the highest standards for myself.
Strongly disagree Disagree Slightly
disagree
Neither agree nor disagree
Slightly agree Agree Strongly
agree
I often fantasize about living in ways that are quite different from my actual life.
Strongly disagree Disagree Slightly
disagree
Neither agree nor disagree
Slightly agree Agree Strongly
agree
I never settle for second best.
Strongly disagree Disagree Slightly
disagree
Neither agree nor disagree
Slightly agree Agree Strongly
agree
When I am listening to the radio, I often check other stations to see if something better is playing, even if I'm relatively satisfied with what I'm listening to.
Strongly disagree Disagree Slightly
disagree
Neither agree nor disagree
Slightly agree Agree Strongly
agree

127
Additional Choice Involvement scale items developed and tested Please select the response that best describes you for each of the following situations. If the situation described is not applicable to you, you do not have to respond to the question. I generally explore all available product options before making a decision.
Strongly disagree Disagree Slightly
disagree
Neither agree nor disagree
Slightly agree Agree Strongly
agree
I generally continue to evaluate and compare my purchase decision with other similar products after the purchase has been made.
Strongly disagree Disagree Slightly
disagree
Neither agree nor disagree
Slightly agree Agree Strongly
agree
When there doesn’t appear to be any significant differences in the products available, I will exert only the effort necessary to make a satisfactory choice.
Strongly disagree Disagree Slightly
disagree
Neither agree nor disagree
Slightly agree Agree Strongly
agree
I would rather feel the pain of exhaustingly searching for the best product/service upfront rather than experiencing the potential pain of making a poor decision afterwards.
Strongly disagree Disagree Slightly
disagree
Neither agree nor disagree
Slightly agree Agree Strongly
agree

128
Demographics
Please type in your current age
Please indicate your gender
Male
Female
Please type in your current residence information in the space provided Country State (if in U.S.) Zipcode (if applicable)
Please indicate your highest level of education.
Some high school
High school
Some college
4 year college (B.A., B.S., etc.)
Some graduate school
Graduate school (M.A., M.S., MBA, J.D. or higher) Covariates
Do you currently own a digital video camera?
Yes
No
Have you ever purchased a consumer electronic item online?
Yes
No
Realism Scale Item How realistic do you think the product information presented reflects what you would expect to see when searching for this type of product online?
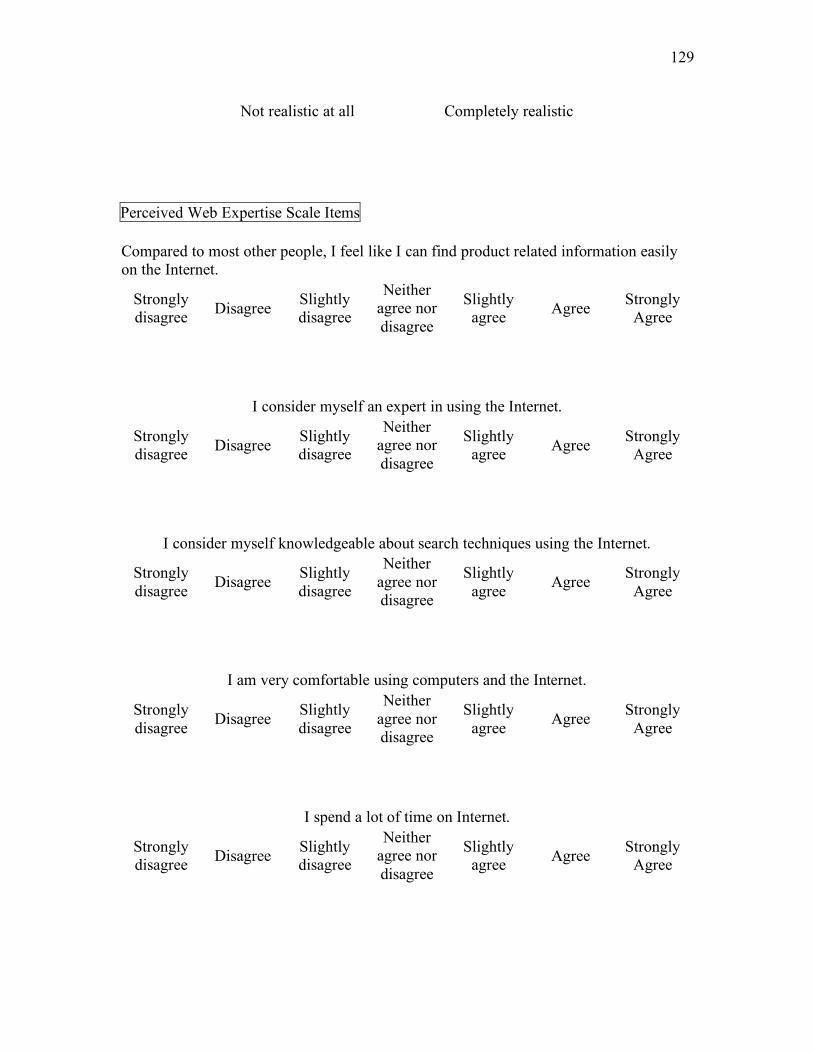
129
Not realistic at all Completely realistic
Perceived Web Expertise Scale Items
Compared to most other people, I feel like I can find product related information easily on the Internet.
Strongly disagree Disagree Slightly
disagree
Neither agree nor disagree
Slightly agree Agree Strongly
Agree
I consider myself an expert in using the Internet.
Strongly disagree Disagree Slightly
disagree
Neither agree nor disagree
Slightly agree Agree Strongly
Agree
I consider myself knowledgeable about search techniques using the Internet.
Strongly disagree Disagree Slightly
disagree
Neither agree nor disagree
Slightly agree Agree Strongly
Agree
I am very comfortable using computers and the Internet.
Strongly disagree Disagree Slightly
disagree
Neither agree nor disagree
Slightly agree Agree Strongly
Agree
I spend a lot of time on Internet.
Strongly disagree Disagree Slightly
disagree
Neither agree nor disagree
Slightly agree Agree Strongly
Agree

130
I often use the Internet for shopping.
Strongly disagree Disagree Slightly
disagree
Neither agree nor disagree
Slightly agree Agree Strongly
Agree
Please type in the approximate number of years (or specify months if applicable) that you have been using the Internet.
131
REFERENCES
Agarwal, Ritu and Viswanath Venkatesh (2002), "Assessing a Firm's Web Presence: A Heuristic Evaluation Procedure for the Measurement of Usability," Information Systems Research, 13 (2), 168-86. Baron, Reuben M. and David A. Kenny (1986), "The moderator-mediator variable distinction in social psychological research: Conceptual, strategic, and statistical considerations," Journal of Personality and Social Psychology, 51 (6), 1173. Baum, Andrew and Paul B. Paulus (1987), "Crowding," in Handbook of Environmental Psychology, Daniel Stokols and Irwin Altman, Eds. Vol. 1. New York: John Wiley & Sons, Inc. Berlyne, D. E. (1958), "The Influence of Complexity and Novelty in Visual Figures on Orienting Responses," Journal of Experimental Psychology, 55, 289-96. Bettman, James R. (1979), An Information Processing Theory of Consumer Choice: Addison-Wesley. Bosnjak, Michael, Tracy L. Tuten, Werner W. Wittman (2005), “Unit(Non)Response in Web-Based Access Panel Surveys: An Extended Planned Behavior Approach,” Psychology & Marketing, 22 (6), 489-505. Burns, Enid (2006a), "Active Home Web Use by Country, March 2006." April 24, 2006 ed.: www.clickz.com. ---- (2006b), "Holiday Season Dragged Online Customer Satisfaction Down." January 11, 2006 ed. Vol. 2006: www.clickz.com. ---- (2006c), "Online Retail Sales Grew," in ClickZ Stats. January 5, 2006 ed. ---- (2006d), "On Quarter of Consumer Electronics Purchases Researched Online," in ClickZStats Vol. 2007. ---- (2005e), "Retailers, Clean Up Your Online Stores." November 29, 2005 ed.: www.clickz.com. ---- (2005f), "Satisfaction with Online Shopping Dips," Vol. 2006: www.clickz.com. Chaiken, Shelley (1980), "Heuristic versus Systematic Processing and the Use of Source versus Message Cues in Persuasion," Journal of Personality and Social Psychology (39), 752-66.
132
Chau, P.Y.K., G. Au, and K.Y. Tam (2000), "Impact of Information Presentation Modes on Online Shopping: An Empirical Evaluation of a Broadband Interactive Shopping Service," Journal of Organizational Computing and Electronic Commerce (10), 1-22. Chen, Qimei, Sandra Clifford, and William D. Wells (2002), "Attitude Toward the Site II: New Information," Journal of Advertising Research (March/April), 33-45. Cohen, Jacob, Patricia Cohen, Stephen G. West, and Leona S. Aiken (2003), “Applied Multiple Regression/Correlation Analysis for the Behavioral Sciences,” Third Edition, Laurence Erlbaum Associates, Mahwah, NJ. Cohen, S.A. (1980), "Aftereffects of Stress on Human Performance and Social Behavior: A Review of Research and Theory," Psychological Bulletin, 88, 82-108. ---- (1978), "Environmental Load and the Allocation of Attention," in Advances in Environmental Psychology, J.E. Singer & S. Valins A. Baum, Ed. Vol. 1. Hillsdale, NJ: Erlbaum. Cook, Thomas D. and Donald T. Campbell (1979), Quasi-Experimentation; Design and Analysis Issues for Field Settings, Houghton Mifflin Boston. Davis, Fred D. (1989), "Perceived Usefulness, Perceived Ease of Use, and User Acceptance of Information Technology," MIS Quarterly, 13, 319-39. Diehl, Kristin (2005), "When Two Rights Make a Wrong: Searching Too Much in Ordered Environments," Journal of Marketing Research, 42 (3), 313-22. Diehl, Kristin and Gal Zauberman (2005), "Searching Ordered Sets: Evaluations from Sequences under Search," Journal of Consumer Research, 31 (4), 824-32. Dillman, Don A., (2007), Mail and Internet Surveys: The Tailored Design Method. Second Edition. John Wiley & Sons, Inc. New Jersey. Donovan, Robert J. and John R. Rossiter (1982), "Store Atmosphere: An Environmental Psychology Approach," Journal of Retailing, 58 (1), 34. Eppler, Martin and Jeanne Mengis (2004), "The Concept of Information Overload: A Review of Literature from Organization Science, Accounting, Marketing, MIS, and Related Disciplines," Information Society, 20 (5), 325-44. Eroglu, Sevgin A. and Karen A. Machleit (1990), "An Empirical Study of Retail Crowding: Antecedents and Consequences," Journal of Retailing, 66 (2), 201-21. Eroglu, Sevgin and Gilbert D. Harrell (1986), "Retail Crowding: Theoretical and Strategic Implications," Journal of Retailing, 62 (4), 346-63.
133
Eroglu, Sevgin, Karen A. Machleit, and Lenita Davis (2003), "Empirical Testing of a Model of Online Store Atmospherics and Shopper Responses," Psychology & Marketing, 20 (2), 139-50. Evans, Gary W. and Sheldon Cohen (1987), "Environmental Stress," in Handbook of Environmental Psychology, Daniel Stokols and Irwin Altman, Eds. New York: John-Wiley & Sons. Gefen, David and Detmar Straub (2000), “The Relative Importance of Perceived Ease of Use in IS adoption: a Study of E-commerce Adoption,” Journal of the Association for Information Systems, (1), pages 1-28. Gilles Laurent and Jean-Noel Kapferer (1985), “Measuring Consumer Involvement Profiles,” Journal of Marketing Research, 22, (February), 41-52 Grewal, Dhruv, Gopalkrishnan R. Iyer, and Michael Levy (2004), "Internet Retailing: Enablers, Limiters, and Market Consequences," Journal of Business Research, 57, 703-13. Gupta, Reetika, Sucheta Nadkarni, and Stephen J. Gould (2005), ""Is this Site Confusing or Interesting?" A Perceived Web site Complexity (PWC) Scale for Assessing Consumer Internet Interactivity," Advances in Consumer Research, 32, 42-50. Harrell, Gilbert D. and Michael D. Hutt (1976), "Buyer Behavior Under Conditions of Crowding: An Initial Framework," Advances in Consumer Research, 3 (1), 36-40. Harrell, Gilbert D., Michael D. Hutt, and James C. Anderson (1980), "Path Analysis of Buyer Behavior Under Conditions of Crowding," Journal of Marketing Research (JMR), 17 (1), 45-51. Helgeson, James G. and Michael L. Ursic (1993), "Information load, cost/benefit assessment and decision strategy variability," Journal of the Academy of Marketing Science, 21 (1), 13-20. Hoffman, Donna L. (2005), "A Decade of Empirical Research on Online Consumer Behavior," in ACR Doctoral Symposium. San Antonio, TX. Hoffman, Donna L., Thomas P. Novak, and Ann E. Schlosser (2003), "Locus of Control, Web Use, and Consumer Attitudes toward Internet Regulation," Journal of Public Policy & Marketing, 22 (1), 41. Huang, Ming-Hui (2000), "Information Load: Its Relationship to Online Exploratory and Shopping Behavior," International Journal of Information Management, 20, 337-47.

134
Hui, Michael K. and John E. G. Bateson (1991), "Perceived Control and the Effects of Crowding and Consumer Choice on the Service Experience," Journal of Consumer Research, 18 (September), 174-84. Huizingh, Eelko K.R.E. and Janny C. Hoekstra (2003), "Why Do Consumers Like Websites?" Journal of Targeting, Measurement and Analysis for Marketing, 11 (4), 350-61. Internet Retailer (2007), “50% of Broadband Users say Internet influenced a Recent Purchase”, accessed May 15, 2007, www.Internetretailer.com/dailyNews.asp?id=21637. Iselin, Errol R. (1993), "The Effects of the Information and Data Properties of Financial Ratios and Statements on Managerial Decision Quality," Journal of Business Finance & Accounting, 20 (2), 249-66. Iyengar, Sheena S. and Mark R. Leeper (2000), "When Choice is Demotivating: Can One Desire Too Much of a Good Thing?" Journal of Personality and Social Psychology, 79 (6), 995-1006. Jacoby, Jacob (1977), "Information Load and Decision Quality: Some Contested Issues," Journal of Marketing Research (JMR), 14 (4), 569. ---- (1984), "Perspectives on Information Overload," Journal of Consumer Research, 10 (4), 432-36. Jacoby, Jacob, Donald E. Speller, and Carol Kohn Berning (1974a), "Brand Choice Behavior as a Function of Information Load: Replication and Extension," Journal of Consumer Research, 1 (1), 33-42. Jacoby, Jacob, Donald E. Speller, and Carol A. Kohn (1974b), "Brand Choice Behavior as a Function of Information Load," Journal of Marketing Research (JMR), 11 (1), 63-69. Jarvis, Cheryl Burke, Scott B. Mackenzie, Philip M. Podsakoff, David Glenn Mick, and William O. Bearden (2003), “A Critical Review of Construct Indicators and Measurement Misspecification in Marketing and Consumer Research,” Journal of Consumer Research, 30 (2), p199-218. Keller, Kevin Lane and Richard Staelin (1989), "Assessing Biases in Measuring Decision Effectiveness and Information Overload," Journal of Consumer Research, 15 (4), 504-08. ---- (1987), "Effects of Quality and Quantity of Information on Decision Effectiveness," Journal of Consumer Research, 14 (2), 200-13. Kerner, Sean Michael (2004), "Majority of US Consumers Research Online, Buy Offline," www.clickz.com.
135
Kirk, Roger E. (1995), Experimental Design: Procedures for the Behavioral Sciences. Pacific Grove, CA: Brooks/Cole. Kivetz, Ran and Itamar Simonson (2000), "The Effects of Incomplete Information on Consumer Choice," Journal of Marketing Research (JMR), 37 (4), 427-48. Kotler, Phil (1973), "Atmospherics as a Marketing Tool," Journal of Retailing, 49, 48-64. Lazarus, R.S. (1966), Psychological Stress and the Coping Process. New York: McGraw-Hill. Lee, Byung-Kwan and Wei-Na Lee (2004), "The Effect of Information Overload on Consumer Choice Quality in an On-Line Environment," Psychology & Marketing, 21 (3), 159-83. Lurie, Nicholas H. (2002), "Decision Making in Information-Rich Environments: The Role of Information Structure," in Association for Consumer Research, S. Broniarczyk (Ed.) Vol. 29. Provo, UT. ---- (2004), "Decision Making in Information-Rich Environments: The Role of Information Structure," Journal of Consumer Research, 30 (4), 473-86. Lynch, John G., and Dan Ariely (2000), “Wine Online: Search Costs Affect Competition on Price, Quality, and Distribution,” Marketing Science, 19 (1), 83-103. Machleit, Karen A., Sevgin A. Eroglu, and Susan Powell Mantel (2000), "Perceived Retail Crowding and Shopping Satisfaction: What Modifies This Relationship?" Journal of Consumer Psychology, 9 (1), 29. Madden, Mary (2003), "America's Online Pursuits: The Changing Picture of Who's Online and What They Do." Washington D.C.: Pew Internet and American Life Project. ---- (2006), "Internet Penetration and Impact." http://pewInternet.org: Pew Internet and American Life Project. Malhotra, Naresh K. (1982), "Information Load and Consumer Decision Making," Journal of Consumer Research, 8 (4), 419-30. ---- (1984), "Reflections on the Information Overload Paradigm in Consumer Decision Making," Journal of Consumer Research, 10 (4), 436-41. Malhotra, Naresh K., Arun K. Jain, and Stephen W. Lagakos (1982), "The information overload controversy: An alternative viewpoint," Journal of Marketing, 46 (2), 27-37. McClelland, G.H., and C.M. Judd (1993), “Statistical Difficulties of Detecting Interactions and Moderator Effects,” Psychological Bulletin, 114, 376-390.

136
Mehrabian, Albert and James A. Russell (1974), An approach to environmental psychology. Cambridge, MA: The MIT Press. Mendelsohn, Tamara (2006), "Understanding US Cross-Channel Shoppers," Forrester Research. Menon, Satya and Barbara Kahn (2002), "Cross-category effects of induced arousal and pleasure on the Internet shopping experience," Journal of Retailing, 78 (1), 31-40. Meyer, Robert J. and Eric J. Johnson (1989), "Information Overload and the Nonrobustness of Linear Models: A Comment on Keller Staelin," Journal of Consumer Research, 15 (4), 498-503. Milgram, Stanley (1970), "The experience of living in cities," Science, Vol. 167 (3924), 1461-68. Miller, J. A. (1956), "The Magical Number Seven Plus or Minus Two: Some Limits on our Capacity for Processing Information," Psychological Review (63), 81-97. Moorman, Christine, Kristin Diehl, David Brinberg, and Blair Kidwell (2004), "Subjective Knowledge, Search Locations, and Consumer Choice," Journal of Consumer Research, 31 (3), 673-80. Moschis, George P. and Jill R. Mosteller (Forthcoming), "A Conceptual Framework of Older Adults Susceptibility to Marketing Communications," Georgia State University. Nadkarni, Sucheta and Reetika Gupta (2004), "Perceived Website Complexity, Telepresence and User Attitudes: The Moderating Role of Online User Tasks," Academy of Management Proceedings, A1. Olson, Gary M. and Judith S. Olson (2003), "Human Computer Interaction: Psychological Aspects of the Human Use of Computing," Annual Review of Psychology, 54, 491-516. Painton, Scott and James W. Gentry (1985), "Another Look at the Impact of Information Presentation Format," Journal of Consumer Research, 12 (September), 240-44. Payne, John W., James R. Bettman, and Eric J. Johnson (1993), The Adaptive Decision Maker. New York, NY: Cambridge University Press. Perdue, Barbara C., John O. Summers (1986), “Checking the Success of Manipulations in Marketing Experiments,” Journal of Marketing Research, 23, November, (4), p317-326. Roster, Catherine., Robert D. Rogers, George C. Hozier Jr., Kenneth G. Baker, and Gerald Albaum (2007), “Management of Marketing Research Projects: Does Delivery
137
Method Matter Anymore in Survey Research?,” Journal of Marketing Theory and Practice, 15 (2), p127-44. Saegert, S. (1973), "Crowding: Cognitive Overload and Behavioral Constraint," in EDRA IV, W. Preiser (Ed.). Stroudsburg, PA. ---- (1978), "High-Density Environments: Their Personal and Social Consequences," in Human Response to Crowding, A. Baum & Y.M. Epstein, Ed. Hillsdale, NJ: Erlbaum. Scammon, D.L. (1977), "'Information Load' and Consumers," Journal of Consumer Research (4), 148-56. Sharma, Subhash, Richard M. Durand, and Oded Gur-Arie, (1981), “Identification and Analysis of Moderator Variables,” Journal of Marketing Research, 18, August, 291-300. Schulz, Axel K.-D (1999), “Experimental Research in a Management Accounting Context,” Accounting & Finance, 39 (1), p29-41. Schwartz, Barry (2004), The Paradox of Choice: Why More is Less. New York, NY: HarperCollins Publishers Inc. Schwartz, Barry, Andrew Ward, Sonja Lyubomirsky, John Monterosso, White Katherine, and Darrin R. Lehman (2002), "Maximizing Versus Satisficing: Happiness Is a Matter of Choice," Journal of Personality and Social Psychology, 83(5), 1178-97. Shugan, Steve (1980), “The Cost of Thinking”, Journal of Consumer Research, 7 (2) 99-112. Simonson, Itamar (1992), "The Influence of Anticipating Regret and Responsiblity on Purchase Decisions," Journal of Consumer Research, 19, 105-18. Steuer, Jonathan (1992), "Defining Virtual Reality: Dimensions Determining Telepresence," Journal of Communications, 42 (4), 73-93. Stokols, Daniel (1972), "On the distinction between density and crowding: Some implications for future research," Psychological Review, Vol. 79 (3), 275-77. Suri, Rajneesh, Mary Long, and Kent B. Monroe (2003), "The Impact of the Internet and Consumer Motivation on Evaluation of Prices," Journal of Business Research, 56 (5), 379-90. Terluin, Berlend, Willem Van Rhenen, Wilmar B. Schaufelis, and Marten De Haan (2004), “The Four-Dimensional Sympton Questionnaire (4DSQ): Measuring Distress and Other Mental Health Problems in a Working Population,” Work and Stress, July, 18 (3), 187-207.

138
Thompson, Debora Viana, Rebecca W. Hamilton, and Roland T. Rust (2005), "Feature Fatigue: When Product Capabilities Become Too Much of a Good Thing," Journal of Marketing Research, 17 (November), 431-42. Turley, L.W. and Ronald E. Milliman (2000), "Atmospheric Effects on Shopping Behavior: A Review of the Experimental Evidence," Journal of Business Research, 49, 193-211. Venkatesh, Viswanath and Fred D. Davis (1996), "A Model of the Antecedents of Perceived Ease of Use: Development and Test," Decision Sciences, 27 (3), 451-81. ---- (2000), "A Theoretical Extension of the Technology Acceptance Model: Four Longitudinal Field Studies," Management Science, 46 (2), 186-204. Wilkie, William L. (1974), "Analysis of effects of information load," Journal of Marketing Research, 11 (4), 462-66. Yaveroglu, Idil Sayrac (2002), "A Comparison of Cue Utilization in Online and Offline Environments and the Moderating Role of Web Expertise," Georgia State University. Yu, Julie and Harris Cooper (1983), “A Quantitative Review of Research Design Effects on Response Rates to Questionniares,” Journal of Marketing Research, 20, (February), 36-44. Zaichkowsky, Judith Lynne (1985), "Measuring the Involvement Construct," Journal of Consumer Research, 12 (3), 341.