impacts of clustering of vegetable farmers in the philippines
TRANSCRIPT

190
Impacts of clustering of vegetable farmers in the Philippines
Maria Fay Rola-Rubzen1, Roy Murray-Prior1, Peter J. Batt1, Sylvia B. Concepcion2, Rodel R. Real2, Ruby Jane G. Lamban2,
Jerick.T. Axalan2, Malou O. Montiflor2, Floro T. Israel3, Dante Apara3 and Ricarte H. Bacus3
Abstract
This assessment was made as part of a systematic process of evaluating the impacts of clustering vegetable farmers in the southern Philippines. Program theory was used to map the impacts. The performance of cluster and non-cluster farmers was compared. Farmers’ performance before and after clustering was also examined. The study found that, on average, cluster farmers had higher incomes than non-cluster farmers. Moreover, farmers increased their income by about 47% after clustering. Examining the returns on investment in the research project, it was found that the net present value (NPV) was 35.3 million pesos, the internal rate of return (IRR) 48.6% and the benefit:cost ratio (BCR) 2.47. When spillover effects were considered at a 5% adoption rate, the NPV, IRR and BCR increased to 106.9 million pesos, 81.5% and 3.8, respectively.
Introduction
One of the most vexing problems in developing coun-tries is the persistence of poverty. In the Philippines, poverty levels remain high at about 26.5% (Virola 2011). In 2009, the number of people below the pov-erty line was recorded at 23.1 million, which trans-lates to about 970,000 more impoverished Filipinos than there were in 2006. According to IFAD (2011, 2012), Mindanao includes the highest incidences of poverty and many of the poor people in Mindanao are smallholder farmers.
Smallholder farmers are faced with numerous constraints, including low productivity, poor-quality
product and low returns for their produce. This, in turn, is due to a multitude of issues, including lack of technical know-how, use of low-yielding varieties, inefficient or non-optimal input use, poor farm man-agement practices and poor postharvest practices. In addition, farmers also lack information about prices and markets, and face institutional and infrastructural constraints that translate into high transaction costs and inability to access markets, particularly high-value markets. Thus, farmers are being bypassed by the opportunities arising from globalisation and the fast-changing consumer demand.
Past development projects focused on either the production side or the marketing side. However, given the wide ranging and complex issues faced by farmers, a more holistic approach is needed to meet their needs. Moreover, as an understanding of what the market wants is important to be able to gain access to desired markets, an integrated approach looking at the entire supply chain is important. But the question is: How can this be done in practice? Most farmers in the Philippines are smallholder
1 Curtin University, Bentley, Western Australia 6102, Australia
* Corresponding author: [email protected] School of Management, University of the Philippines
Mindanao, Davao, Philippines3 University of the Philippines Strategic Research
and Management Foundation Inc., University of the Philippines Mindanao, Davao, Philippines

191
farmers with small-scale operations, have poor capi-talisation and access to credit, may not immediately have the capacity to deliver the requirements of high-value markets and do not have the confidence to approach and negotiate with new high-value markets. Yet, understanding and accessing these markets could help hasten income improvements and thus alleviate poverty.
With this challenge in mind, a group of research-ers under an Australian Centre for International Agricultural Research (ACIAR)-funded project, investigated a process that has the potential to enhance farmers’ understanding of the value chain. This enhancement would allow them to identify opportunities and constraints along the chain and, at the same time, implement a range of actions and interventions to overcome constraints across the production and marketing spectrum that would enable them to take up opportunities to increase their incomes. This process involved is ‘clustering’.
The power of clustering
Clustering is a form of collaborative marketing wherein a group of farmers organise to collectively market their produce. There are many forms of col-laborative marketing, including cooperatives, grower associations and cluster-marketing groups.
Clustering is not a new approach. In fact, agro-based clustering is becoming one of the key approaches development practitioners are using to progress the agricultural sector (Galvez-Nogales 2010; Theus and Zeng 2012). In agro-clusters, pro-ducers in the same agricultural sectors get together to participate in value chains to gain market oppor-tunities and overcome common challenges. Galvez-Nogales, an FAO marketing economist, analysed agro-based clusters in different regions. According to her, agro-based clustering is an efficient and sustainable way of linking farmers to global value chains. The approach has benefits in terms of diffus-ing innovations, using and creating farm services, and increasing access to markets and information.
The Catholic Relief Services (CRS) has also been applying the clustering process to farmers in Mindanao, in their case using an eight-step clustering process (CRS–Philippines 2007). The CRS eight-step clustering approach involves organising smallholder farmers into ‘clusters’ of 5–15 farmers to supply high-quality vegetables to market specifications and to the volume required by buyers. One of the
characteristics of the CRS eight-step process is that it is market-driven. Farmers start with understanding market needs, then plan production and marketing with a view to responding to those needs. In the pro-cess, farmers produce the type of vegetables needed, to the quality specifications required and guided by the knowledge that they are producing what the market wants when it needs it. As a consequence, farmers know their targets and they are producing with the knowledge that markets are more likely to buy their products. It is also quite likely that they can obtain higher prices for their produce.
The project
In 2006, an ACIAR project in Mindanao, southern Philippines, began looking at ways smallholder farm-ers in that region could participate better in value chains. The aims of the project were:
to improve the capacity of smallholder vegetable farmers to better fulfil the needs of traditional and institutional buyersto assist smallholder vegetable producers in Mindanao to adopt effective market linkage mechanisms via collaborative marketing arrange-ments and clusters to identify and propose potential interventions at the farmer and market intermediary level to improve the performance of value chains in the southern Philippines vegetable industryThe project involved the analysis of value chains
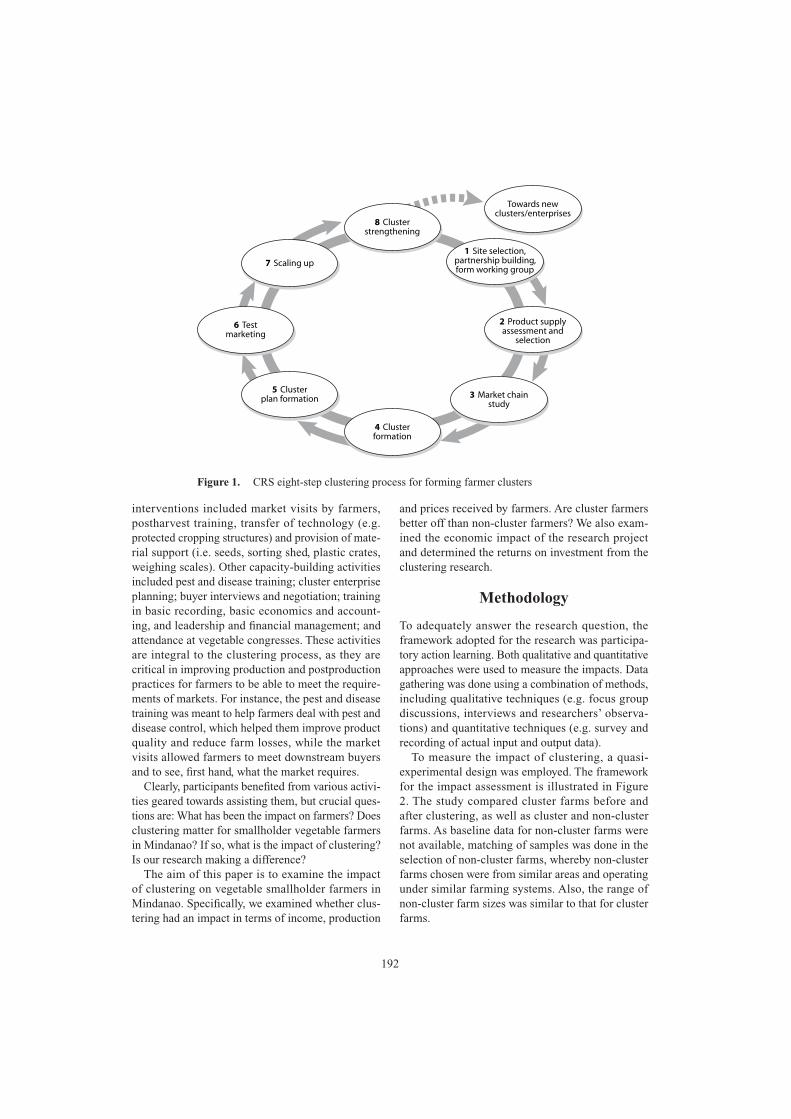
forged from collaborative marketing arrangements of farmers. The CRS eight-step approach was used in the formation of clusters. The implementation of clustering under the CRS eight-step approach fol-lows a sequential process that prepares farmers to link with different negotiated markets. The process is illustrated in Figure 1.
A total of 29 clusters comprising 360 farmers (228 males; 132 females) participated in the pro-ject from nine locations in the southern Philippines (South Cotabato (Lake Sebu, Tupi, Surallah and Koronadal City); Bukidnon (Malayabalay, Lantapan and Impasug-ong); Davao City (Calinan and Marilog)).
As part of the process, interventions and capacity-building activities were conducted with each cluster. Between 2008 to 2011, 69 activities were held, involving 14 different types of capacity-building activities. The total participant count was 1,242, comprising 755 males and 487 females. The
192
interventions included market visits by farmers, postharvest training, transfer of technology (e.g. protected cropping structures) and provision of mate-rial support (i.e. seeds, sorting shed, plastic crates, weighing scales). Other capacity-building activities included pest and disease training; cluster enterprise planning; buyer interviews and negotiation; training in basic recording, basic economics and account-ing, and leadership and financial management; and attendance at vegetable congresses. These activities are integral to the clustering process, as they are critical in improving production and postproduction practices for farmers to be able to meet the require-ments of markets. For instance, the pest and disease training was meant to help farmers deal with pest and disease control, which helped them improve product quality and reduce farm losses, while the market visits allowed farmers to meet downstream buyers and to see, first hand, what the market requires.
Clearly, participants benefited from various activi-ties geared towards assisting them, but crucial ques-tions are: What has been the impact on farmers? Does clustering matter for smallholder vegetable farmers in Mindanao? If so, what is the impact of clustering? Is our research making a difference?
The aim of this paper is to examine the impact of clustering on vegetable smallholder farmers in Mindanao. Specifically, we examined whether clus-tering had an impact in terms of income, production
and prices received by farmers. Are cluster farmers better off than non-cluster farmers? We also exam-ined the economic impact of the research project and determined the returns on investment from the clustering research.
Methodology
To adequately answer the research question, the framework adopted for the research was participa-tory action learning. Both qualitative and quantitative approaches were used to measure the impacts. Data gathering was done using a combination of methods, including qualitative techniques (e.g. focus group discussions, interviews and researchers’ observa-tions) and quantitative techniques (e.g. survey and recording of actual input and output data).
To measure the impact of clustering, a quasi-experimental design was employed. The framework for the impact assessment is illustrated in Figure 2. The study compared cluster farms before and after clustering, as well as cluster and non-cluster farms. As baseline data for non-cluster farms were not available, matching of samples was done in the selection of non-cluster farms, whereby non-cluster farms chosen were from similar areas and operating under similar farming systems. Also, the range of non-cluster farm sizes was similar to that for cluster farms.
Figure 1. CRS eight-step clustering process for forming farmer clusters
Towards newclusters/enterprises
3 Market chainstudy
4 Clusterformation
5 Clusterplan formation
6 Testmarketing
8 Clusterstrengthening
7 Scaling up1 Site selection,
partnership building,form working group
2 Product supplyassessment and
selection

193
Structured interviews were conducted with 174 farmers from the three research sites. Baseline interviews were conducted with 48 farmers. These were used for the ‘before clustering’ scenario, while 61 cluster farmers were interviewed for the ‘after clustering’ scenario. Meanwhile, 65 farmers who did not belong to any cluster were interviewed as non-cluster farmers. The numbers of farmers interviewed are shown in Table 1.
To assess the impacts of clustering smallholder growers on marketing vegetable produce, economic analyses such as gross margin analysis and costs and returns analysis were conducted on both the cluster farm groups and the non-cluster groups, as well as on the cluster groups before and after clustering. To assess the economic impact of the research project, cost–benefit analysis was carried out. The net present value (NPV), internal rate of return (IRR) and benefit:cost ratio (BCR) were calculated at the farm-level for two scenarios —without adop-tion and with adoption. Further analyses were also made assuming spillover effects in the community for both situations with no adoption and with adop-tion. The results of the analyses are discussed later in the paper. Before going to the results section, we first discuss the program theory of the clustering
approach—how project inputs were converted to outputs and outcomes, and how impacts were achieved in the project.
From inputs to outcomes: program theory of the eight-step
clustering approach
The main aim of the clustering approach is to increase the net returns or incomes of smallholder farmers. How did the project get to that outcome?
The project employed a logic framework which supposes that inputs (resources) used in the activities (project interventions) result in outputs (production) that will lead to outcomes (improved incomes) with ultimate impact (poverty reduction). The underpin-ning theory of clustering vegetable growers is that bringing farmers together to build a critical mass and honing their skills and capacity in production and marketing will enable them to respond to market demand and requirements. This will allow them to participate in modern value chains and benefit from receiving better prices than what they would have received from their traditional markets. To follow the path from inputs to outputs, program theory was utilised.
As mentioned previously, the clustering approach follows a sequential process that builds farmers’ capacity to link with different markets and the whole supply chain more effectively and efficiently. A critical component in the CRS eight-step cluster-ing process is improving farm-to-market linkages. Improving marketing alliances allows smallholder farmers to link with institutional buyers, thus improv-ing their access to institutional markets and other value chains. By having access to the institutional markets, smallholders receive higher prices for their produce, which results in higher vegetable sales and therefore increases household income. This in turn will help reduce poverty in the country, the ultimate developmental goal (Figure 3).
The program theory for the clustering approach was mapped to explore the path from inputs to
Figure 2. Framework for measuring impact of clustering
Before After
Cluster
Non-cluster
Table 1. Smallholder survey participants
Area No. of cluster farmers No. of non- cluster farmers Total
Before 48 – 48
After 61 65 126
Total 109 65 174

194
outcomes (Figure 4). The key intervention activities in the eight-step clustering process involve: link-ing farmers with supply-chain partners including institutional markets; improving understanding of markets through market visits and market research (including walking the supply chain); training in production and farm management, alternative pest and disease control, postharvest practices, financial management and record keeping; provision of inputs and resources such as seed, plastic crates, weighing scales and fertilisers; and transfer of technology to farmers. These interventions result in improved
market chain linkages, higher production and pro-ductivity, improved postharvest practices, decreased postharvest losses, higher product quality and better prices received for their produce. All these translate into higher incomes from vegetable production, thus contributing to household income. Having more secure markets also reduces the risks to farmers.
As illustrated in Figure 4, improving smallholders’ knowledge on production will improve their ability to improve the quality of the produce, reduce loss and wastage and improve overall production. This process will lead to farmers obtaining higher market
Figure 3. Pathway to increased income and poverty reduction through clustering
Improve marketing alliance
through 8-step clustering process
Linking farmers with institutional
buyers
Improved access to
institutional markets
Higher prices received
Increased income from
sales of vegetables
Increased household
income Decrease poverty
Figure 4. Program theory of the impact of clustering on smallholder farmers’ incomes

195
prices for their produce. Similarly, leveraging the higher production level emanating from improved productivity and product consolidation with other cluster members, as well as their improved ability to plan farm production, cluster farmers are better able to cope with and meet market demand, producing what the market wants in a timely fashion. The end result of these interventions is higher returns and higher household income.
In the same manner, provision of some farm inputs such as seed, plastic crates, weighing scales and ferti-lisers will lead to increased production levels, lower wastage and higher volumes of marketable products, leading to higher returns on sales and, ultimately, improved incomes for smallholder households.
Results and discussion
The results of the impact analysis are presented below. The discussion focuses on the impact on returns from vegetable production, on volume of pro-duction, prices received and on household income. The return on investment in the research project is then presented.
Impacts of clustering
Impact on production
Results of the comparison of production levels of farms before and after clustering show that the
volume of production increased in 9 of the 11 com-modities (Figure 5). The most dramatic increase was in tomato production, which increased from 665 kg to over 4.3 tonnes (t), eggplant from 0.5 t to close to 3 t and chayote from 720 kg to 2.4 t. However, sword pepper declined, perhaps because farmers shifted to other crops that had relatively higher profitability.
The increase in production is reflected in the increase in the output value, with significant increases in the value of production of six commodities post clustering. The value of production of sweet pepper increased from 27,538 to 39,697 pesos; eggplant from 4,489 to 41,259 pesos; chayote from 2,880 to 28,078 pesos; and tomato from 8,720 to 41,686 pesos. As expected, the value of production of sword pepper declined in the post-clustering scenario in line with the fall in output (see Figure 6).
Comparing the performance of cluster and non-cluster farms, the results of the analysis showed that cluster farm production levels were higher than non-cluster farmers for all but one crop. Most produce showed significant differences in production levels, while marginal increases were shown on pechay and string beans. Again, the difference in tomato pro-duction between cluster (over 4.3 t) and non-cluster (1.6 t) was the most dramatic (Figure 7).
Comparing the value of production of cluster farmers and non-cluster farmers, cluster farmers had higher values of production for six of eight commodi-ties (Figure 8).
Figure 5. Volume of production before and after clustering
1,12
7
262
263 50
0 720
221
176
665
406
120 27
1
1,47
6
502
1,16
2
2,99
5
2,41
1
216
208
4,36
7
534
233
67
0
500
1,000
1,500
2,000
2,500
3,000
3,500
4,000
4,500
5,000
Sweetpepper
Bittergourd
Squash Eggplant Chayote Pechay Stringbeans
Tomato Baguiobeans
Okra Swordpepper
Before
After
Pro
du
ctio
n (k
g)

196
Figure 6. Value of vegetable production before and after clustering
Figure 7. Vegetable production of cluster versus non-cluster farms
27,5
38
6,23
6
1,17
8 4,48
9
2,88
0
3,88
1
2,80
8
8,72
0
8,55
0
1,80
0
5,88
8
39,6
97
13,0
73
10,1
45
41,2
59
28,0
78
1,92
8
3,16
8
41,6
86
5,61
3
3,51
0
2,16
0
0
5,000
10,000
15,000
20,000
25,000
30,000
35,000
40,000
45,000
Sweetpepper
Bittergourd
Squash Egg-plant
Chayote Pechay Stringbeans
Tomato Baguiobeans
Okra Swordpepper
Before
After
Valu
e o
f pro
du
ctio
n (p
eso
s)
1,47
6
502
1,16
2
2,99
5
216
208
4,36
7
534
1,25
9
345
771
3,56
0
199
170
1,59
7
250
0
500
1,000
1,500
2,000
2,500
3,000
3,500
4,000
4,500
5,000
Sweetpepper
Bittergourd
Squash Eggplant Pechay Stringbeans
Tomato Baguiobeans
Cluster
Non-cluster
Pro
du
ctio
n (k
g)

197
Impact on prices received by farmers
Clustering benefited farmers by gaining them access to institutional markets, allowing greater market certainty and higher prices for their produce. Figure 9 shows price comparisons for selected com-modities in traditional and institutional markets. Institutional market prices were always higher by about 10–25 pesos/kg. Farmers who used to supply their produce only in traditional markets were able to benefit from the premium prices supermarkets pay to their suppliers. At the same time, farmers were still able to sell to traditional markets, particularly the products that did not meet the market specifications of institutional buyers.
Impact on net income of farmers
On average, the net income from vegetable produc-tion increased for most vegetables after clustering. Significant increases in net income were recorded for sweet pepper, eggplant, chayote and tomato after clustering (Figure 10). Once again, cluster farms performed better in terms of net incomes from their vegetable enterprise. Comparing cluster and non-cluster farms, the results showed that the net incomes of cluster farms growing eggplant, tomato, sweet pepper and squash were significantly higher than those of non-cluster farms. It is only in pechay
production that the non-cluster farms performed bet-ter than cluster farms, but the net income from this activity was quite small (Figure 11).
Impact on household income
Looking at the overall household income, the results indicate that the monthly income increased by 47% among the participating cluster farm-ers: from 4,904 pesos/month before the project to 7,192 pesos/month after the project. Furthermore, the average household income of cluster farmers is higher by about 18% than that of non-cluster farm-ers (Figure 12). Therefore, clustering has indeed been beneficial to farmers in terms of its impact on household income.
Returns on project investment
Clearly, the clustering process has benefited farmers. These benefits came from a multitude of factors including improvements in production levels, improvements in postharvest production and better prices received. The next question is: What is the return on investment for the project?
Economic impact of the project
To answer this question, a cost–benefit analysis of the project was conducted. The project investment for this research was quite significant, with key
Figure 8. Value of vegetable production of cluster versus non-cluster farms
39,6
97
13,0
73
10,1
45
41,2
59
1,92
8
3,16
8
41,6
86
5,61
3
30,0
48
7,97
6
4,50
6
30,3
80
3,26
7
3,40
0
21,9
91
4,36
5
0
5000
10000
15000
20000
25000
30000
35000
40000
45000
Sweetpepper
Bittergourd
Squash Eggplant Pechay Stringbeans
Tomato Baguiobeans
Cluster
Non-cluster
Valu
e o
f pro
du
ctio
n (p
eso
s)

198
Figure 9. Price comparisons for vegetables sold in institutional and traditional markets: (a) carrot; (b) cabbage; (c) bitter gourd; (d) eggplant; (e) cauliflower; (f) squash
0
5
10
15
20
25
30
35
40 (a)
(c)
(e)
(d)
(f )
(b)M
ar-1
1
Ap
r-11
May
-11
Jun
-11
Jul-
11
Au
g-1
1
Institutional
Traditional
0
5
10
15
20
25
30
35
40
45
50
Mar
-11
Ap
r-11
M
ay-1
1 Ju
n-1
1 Ju
l-11
A
ug
-11
Sep
-11
Oct
-11
No
v-11
D
ec-1
1 Ja
n-1
2 Fe
b-1
2 M
ar-1
2 A
pr-
12
May
-12
Jun
-12
0
10
20
30
40
50
60
Mar
-11
Ap
r-11
M
ay-1
1 Ju
n-1
1 Ju
l-11
A
ug
-11
Sep
-11
Oct
-11
No
v-11
D
ec-1
1 Ja
n-1
2 Fe
b-1
2 M
ar-1
2 A
pr-
12
May
-12
Jun
-12
0
5
10
15
20
25
30
35
40 M
ar-1
1 A
pr-
11
May
-11
Jun
-11
Jul-
11
Au
g-1
1 Se
p-1
1 O
ct-1
1 N
ov-
11
Dec
-11
Jan
-12
Feb
-12
Mar
-12
Ap
r-12
M
ay-1
2 Ju
n-1
2
0
2
4
6
8
10
12
14
16
18
20
Mar
-11
Ap
r-11
M
ay-1
1 Ju
n-1
1 Ju
l-11
A
ug
-11
Sep
-11
Oct
-11
No
v-11
D
ec-1
1 Ja
n-1
2 Fe
b-1
2 M
ar-1
2 A
pr-
12
May
-12
Jun
-12
Pric
e re
ceiv
ed (p
eso
s)Pr
ice
rece
ived
(pes
os)
Pric
e re
ceiv
ed (p
eso
s)
Pric
e re
ceiv
ed (p
eso
s)Pr
ice
rece
ived
(pes
os)
Pric
e re
ceiv
ed (p
eso
s)
Traditional
Institutional
Traditional
Institutional
Traditional
Institutional
Traditional
Traditional
Institutional
Institutional
0
20
40
60
80
100
120
Mar
-11
Ap
r-11
M
ay-1
1 Ju
n-1
1 Ju
l-11
A
ug
-11
Sep
-11
Oct
-11
No
v-11
D
ec-1
1 Ja
n-1
2 Fe
b-1
2 M
ar-1
2 A
pr-
12
May
-12
Jun
-12

199
Figure 10. Net incomes from vegetables before and after clustering
Figure 11. Net income from vegetables of cluster versus non-cluster farms
–11,
239
2,79
4
–981
–491
1,27
8
1,52
2
1,25
7 4,52
6
6,42
1
480 3,
405
22,4
13
9,41
7
6,86
2
34,3
49
26,5
52
1,25
2
2,28
4
23,4
59
3,67
3
1,94
5
1,73
2
–20,000
–10,000
0
10,000
20,000
30,000
40,000
Sweetpepper
Bittergourd
Squash Egg-plant
Chayote Pechay Stringbeans
Tomato Baguiobeans
Okra Swordpepper
Before
After
Net
inco
me
(pes
os)
Net
inco
me
(pes
os) 22
,413
9,41
7
6,86
2
34,3
49
1,25
2
2,28
4
23,4
59
1,12
0
18,3
62
6,41
6
2,33
3
22,5
58
2,04
3
1,33
4
16,4
66
–2,382–5000
0
5000
10000
15000
20000
25000
30000
35000
40000
Sweetpepper
Bittergourd
Squash Eggplant Pechay String beans Tomato Baguio beans
Cluster
Non-cluster

200
contributions coming from ACIAR (A$799,990), Curtin University (A$193,035) and other partners including farmers (A$31,522). The benefits flowed mainly from the changes (improvement) in the net income of farmers directly affected by the project.
Four scenarios were modelled: 1. Farm-level impacts only, under no adoption; 2. Inclusion of spillover effects under no adoption; 3. Farm-level impacts, with adoption; and 4. Inclusion of spillover effects, with adoption.
Under the first scenario (Model 1), it was assumed that no-one adopted the clustering process apart from the project participants (cluster members) and that there were no spillover effects. This base model, therefore looked at only farm-level impacts. The planning period was 20 years and discount rate used was 8%. The results of this analysis showed that the net NPV of the project was 35 million pesos. The IRR was 49% and the BCR 2.5 (Table 2). The analy-sis further showed that the project will break even on a cumulative discounted basis in year 5.
In the second scenario (Model 2: Spillover no adoption), it was assumed that there will be some spillover effects to the community brought about by employment effects of clustering. As farmers increase their production, they are able to hire other people to help in either farm activities as hired labour or in marketing.
The results of the analysis showed that when spillover effects were taken into consideration, the NPV increased to 47 million pesos, IRR to 78% and
BCR to 2.9 (Table 2). The project also breaks even faster; at 4 years on a cumulative discounted basis.
Most technologies or interventions, particularly those that are seen to be successful, are likely to be adopted. In Models 3 and 4 it was assumed that there would be a conservative 5% adoption rate. Model 3 therefore analyses the farm-level impacts of the project assuming 5% adoption of clustering. Once again, the project time frame is 20 years and the discount rate 8%.
The results of this analysis showed that NPV under this scenario was 107 million pesos, IRR was 82% and BCR 3.8. Meanwhile, for Model 4: Spillover with adoption, NPV was 134 million pesos, IRR was 144% and BCR 4.5. The project is expected to break even at 4 and 3 years, under Models 3 and 4, respectively (Table 2).
Discussion
The results of this study showed that there are significant benefits in clustering. For smallholder growers, the eight-step clustering process facilitated farmers’ understanding of markets, thus enabling them to identify and meet institutional buyers’ needs, and thereby participate in modern value chains. A critical outcome of clustering for smallholder farmers was the access to modern institutional markets, food processors and supermarkets. By forming clusters, farmers were able to access market information and gain bargaining power with institutional buyers. Their
Figure 12. Farm households’ average monthly incomes (a) before and after clustering, and (b) average monthly incomes of cluster versus non-cluster farms
7,192
6,095
0
1000
2000
3000
4000
5000
6000
7000
8000
Cluster Non-cluster
4,904
7,192
0
1000
2000
3000
4000
5000
6000
7000
8000
Before After
Inco
me
(pes
os)
Inco
me
(pes
os)
(a) (b)

201
collective power for bargaining was useful not only in negotiating prices with buyers; it also enabled them to access farm inputs such as seeds, fertilisers and credit, technologies and external assistance through farm support programs.
Similarly, better understanding of what the market needs helped them to make informed decisions about what crops to grow. They were able to cultivate crops for a market that they knew about. Farmers’ awareness of market specifications and standards also improved, and they were therefore able to adjust their product choices and conduct value-adding activities such as sorting, grading and packaging according to buyer specifications, assuring them access to high-value markets. Improved production and post-production practices also resulted in lower farm and postharvest losses and a reduction in the volume of rejected product, thus yielding higher returns to smallholders.
The benefits of clustering, however, go beyond the farm gate. Farmers were not the only beneficiar-ies in the clustering process. Clustering benefited buyers and institutional markets in terms of these downstream players having direct access to farmers, easier product consolidation and being able to obtain quality and quantity assurances from smallholders. Previously, reliable delivery of supply from small-holder growers could not be assured. Clustering has now made it possible for institutional buyers to obtain the bulk quantities they require, without having to deal with numerous smallholder growers. Furthermore, the shortage in meeting domestic mar-ket demand for fresh vegetables can now be better filled by smallholders’ produce, with further impacts on food security in rural and regional areas.
There were also social impacts that resulted from clustering. The social impacts of clustering include creation of social capital, improved relationships among producers and empowerment of smallholder farmers.
Benefits to partner agencies were also noted. Farmer clusters enabled efficient use of scarce
resources and services when it came to partnering with donor agencies and international development organisations. Partnering with the established clusters allowed development organisations a wider area of coverage in delivering programs and services to farmers. In fact, enhanced production-oriented liveli-hood, agriculture and natural resource management projects were facilitated through the clusters, result-ing in win–win situations for the farmers as well as for partnering agencies. Most importantly with farmer clusters, the continuity and sustainability of interventions are likely to be better.
Summary and conclusion
The evidence from this study showed that the eco-nomic impact of clustering is positive. Clustering allowed smallholder farmers to access higher market prices for their farm produce, increased their productivity and improved profitability. In saying this, it must be stressed that grouping farmers per se, will not bring about similar impacts. Rather, the holistic approach of the eight-step clustering process is critical. Clustering’s success is brought about by a multitude of factors inherent in the process that give cluster farmers a competitive advantage over non-cluster farmers. The sequential process of the eight-step clustering process, which has merged understanding of markets, building farmers’ capacity to respond to market needs, linking farmers’ to mar-kets, planning and implementation, are all important for this approach to be successful.
This research proves that investment in agroenter-prise development through clustering is worthwhile. Modest adoption almost doubles the return on invest-ment. The collective power of farmers in clustering, coupled with their enhanced capacity, improved the production and marketing capability of cluster farmers. They now have a better understanding of the market they are targeting, and collectively they have better bargaining power, improved production
Table 2. Economic analysis of the project
Indicator No adoption With adoption
Farm-level only(Model 1)
Spillover(Model 2)
Farm-level only(Model 3)
Spillover(Model 4)
Net present value (million pesos) 35 47 107 134
Internal rate of return (%) 49 78 82 144
Benefit:cost ratio 2.5 2.9 3.8 4.5

202
(quality- and quantity-wise), allowing them to achieve higher market prices for their produce, and ultimately achieving increased incomes.
References
CRS (Catholic Relief Services)–Philippines 2007. The clustering approach to agroenterprise development for small farmers: the CRS–Philippines experience—a guidebook for facilitators. CRS–USCCB, Philippine Program. Davao: Philippines.
Galvez-Nogales E. 2010. Agro-based clusters in devel-oping countries: staying competitive in a globalized economy. Agricultural Management, Marketing and Finance Occasional Paper No. 25. Food and Agriculture Organization of the United Nations: Rome.
IFAD (International Fund for Agricultural Development) 2011. Rural poverty report 2011. New realities, new challenges: new opportunities for tomorrow’s generation. International Fund for Agricultural Development: Rome.
— 2012. Rural poverty portal: rural poverty in the Philippines. At <http://www.ruralpovertyportal.org/web/rural-poverty-portal/country/home/tags/philippines, accessed 28 July 2012.
Theus F. and Zeng D. 2012. Agricultural clusters in agri-cultural innovations systems: an investment sourcebook. World Bank: Washington, DC.
Virola R.A. 2011. 2009 official poverty statistics. Press conference at the National Statistics Coordination Board: Makati City, Philippines. Accessible at <www.nscb.gov.ph/poverty/2009/Presentation_RAVirola.pdf>.