impacts of variable renewable energy on bulk power … · impacts of variable renewable energy on...
TRANSCRIPT
Impacts of Variable Renewable Energy on Bulk Power System
Assets, Pricing, and Costs
Ryan Wiser, Andrew Mills, Joachim Seel
Todd Levin and Audun Botterud
Report Summary
November 2017
This work was supported by the Transmission Permitting & Technical Assistance Division of the U.S.
Department of Energy’s Office of Electricity Delivery and Energy Reliability under Lawrence Berkeley
National Laboratory Contract No. DE-AC02-05CH11231, and by Argonne National Laboratory.
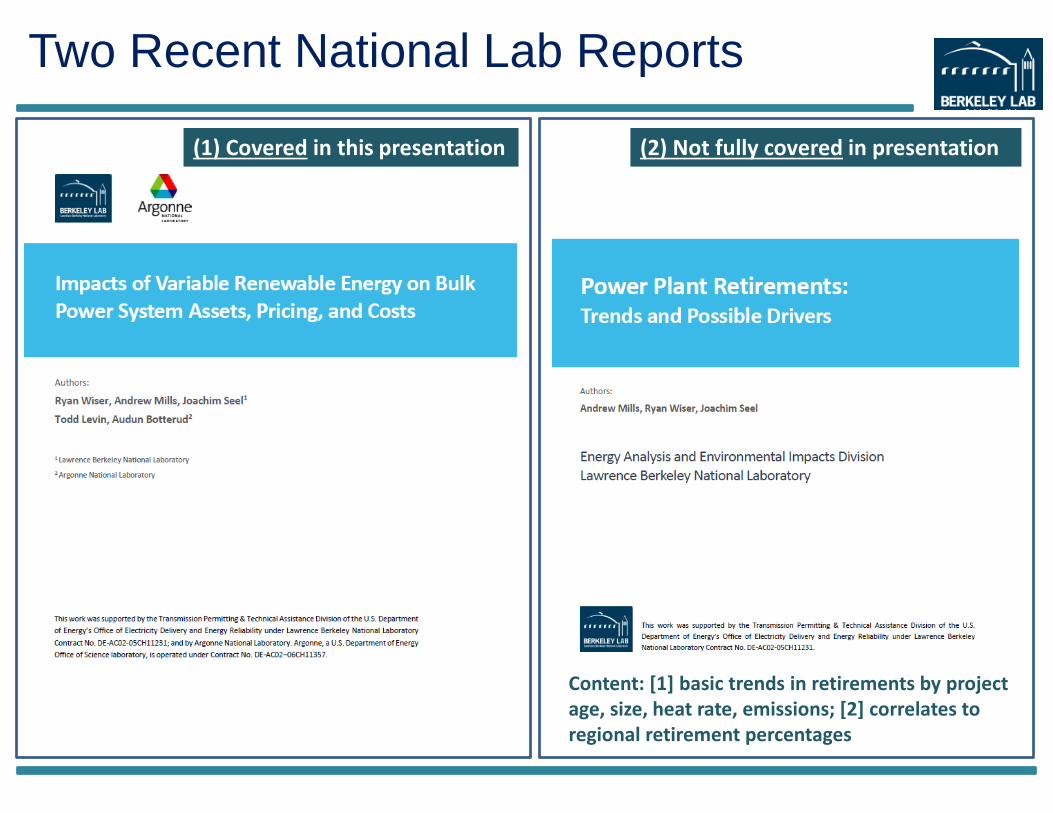
Two Recent National Lab Reports
(1) Covered in this presentation (2) Not fully covered in presentation
Content: [1] basic trends in retirements by project age, size, heat rate, emissions; [2] correlates to regional retirement percentages
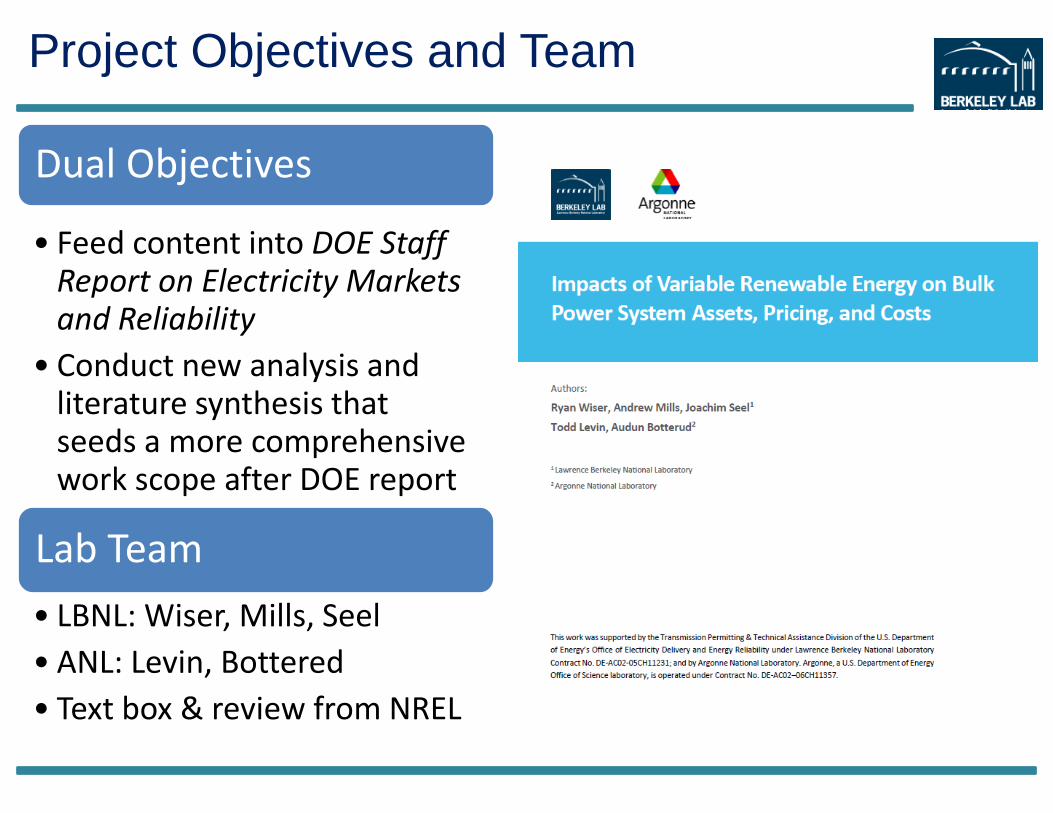
Project Objectives and Team
Dual Objectives
• Feed content into DOE Staff Report on Electricity Markets and Reliability
• Conduct new analysis and literature synthesis that seeds a more comprehensive work scope after DOE report
Lab Team
• LBNL: Wiser, Mills, Seel
• ANL: Levin, Bottered
• Text box & review from NREL
Presentation Scope
Summarize findings from LBNL/ANL report
• Introduction and Scope
• Economic Underpinning and Expectations
• Historical Observed Impacts of VRE on the Bulk Power System
• Prospective Future Impacts of VRE on the Bulk Power System
• System Value and System Costs of Variable Renewable Energy
Highlight future work to build on this foundation
4

Introduction and Scope
5
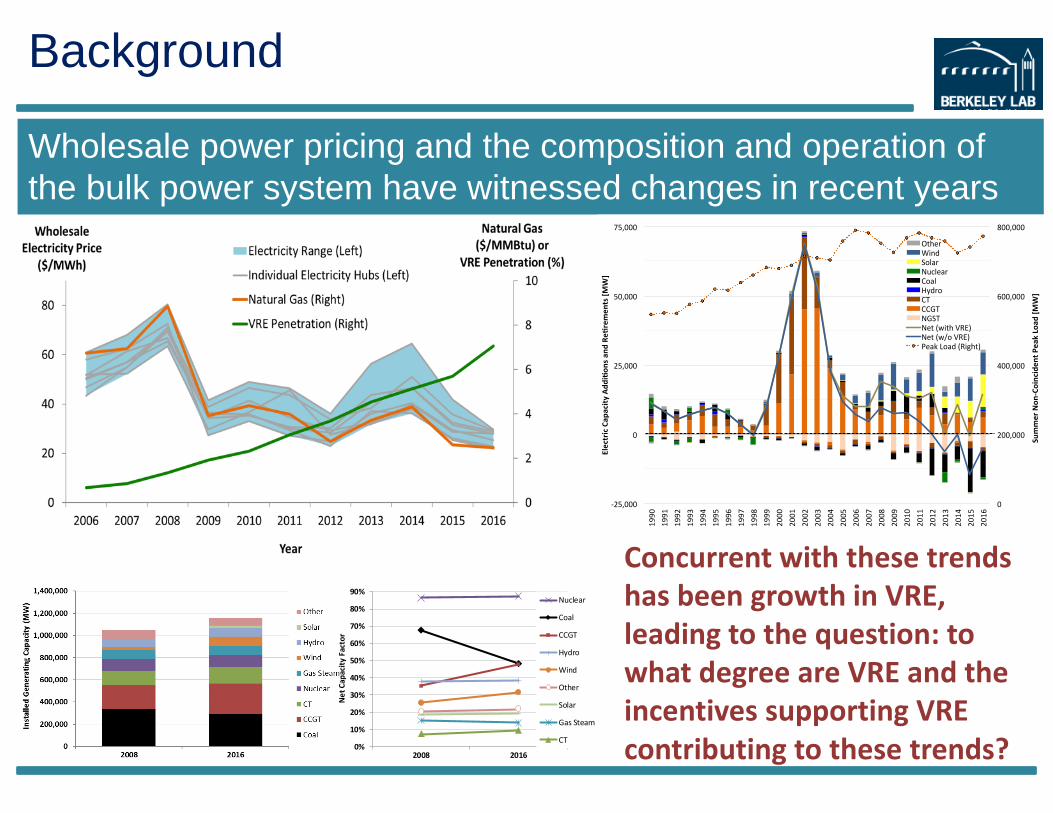
Background
Wholesale power pricing and the composition and operation of
the bulk power system have witnessed changes in recent years
0%
10%
20%
30%
40%
50%
60%
70%
80%
90%
2008 2016
Ne
t C
apac
ity
Fact
or
Nuclear
Coal
CCGT
Hydro
Wind
Other
Solar
Gas Steam
CT
Concurrent with these trendshas been growth in VRE, leading to the question: towhat degree are VRE and the incentives supporting VRE contributing to these trends?
0
200,000
400,000
600,000
800,000
-25,000
0
25,000
50,000
75,000
1990
1991
1992
1993
1994
1995
1996
1997
1998
1999
2000
2001
2002
2003
2004
2005
2006
2007
2008
2009
2010
2011
2012
2013
2014
2015
2016
SummerNon-CoincidentPeakLoad[MW]
ElectricCapacityAddionsandRe
rements[MW]
OtherWindSolarNuclearCoalHydroCTCCGTNGSTNet(withVRE)Net(w/oVRE)PeakLoad(Right)

Objectives and Paper Scope
Synthesize available literature, data & analysis on the degree to
which growth in variable renewable energy (VRE) has impacted
or might impact bulk power system assets, pricing, and costs
– wholesale power market pricing
– operation of other power plants, and
– incentives for generation asset retirement and investment
Where possible, frame impacts of VRE within the context of
other possible drivers for some of the same trends; we do not
analyze impacts on specific power plants, instead focusing on
national and regional system-level trends
Finally, consequent to the unique characteristics of VRE,
highlight the implications of the paper’s findings for the ‘system
value’ or ‘system costs’ of VRE

Caveats to Project and Paper Scope
Primarily literature and data synthesis; analyzing the impacts of
VRE on bulk power markets is a complex area and there is much
more work to be pursued in all of the areas covered in this report
Report does not comprehensively address issues related to short
time-scale variations in VRE and the technical characteristics of
VRE as they affect power system reliability and VRE integration
Report does not address market design and compensation
mechanism design under a changing mix of generation, a
focus of the recent FERC conference and considerable
other additional work
We seek to draw generalizable findings, but all of the issues
addressed are context dependent, affected by underlying generation mix of the system, amount of VRE,
and the design and structure of the bulk power system
8
Each chapter ends w/ section on further research needs

Economic Underpinning and
Expectations
9
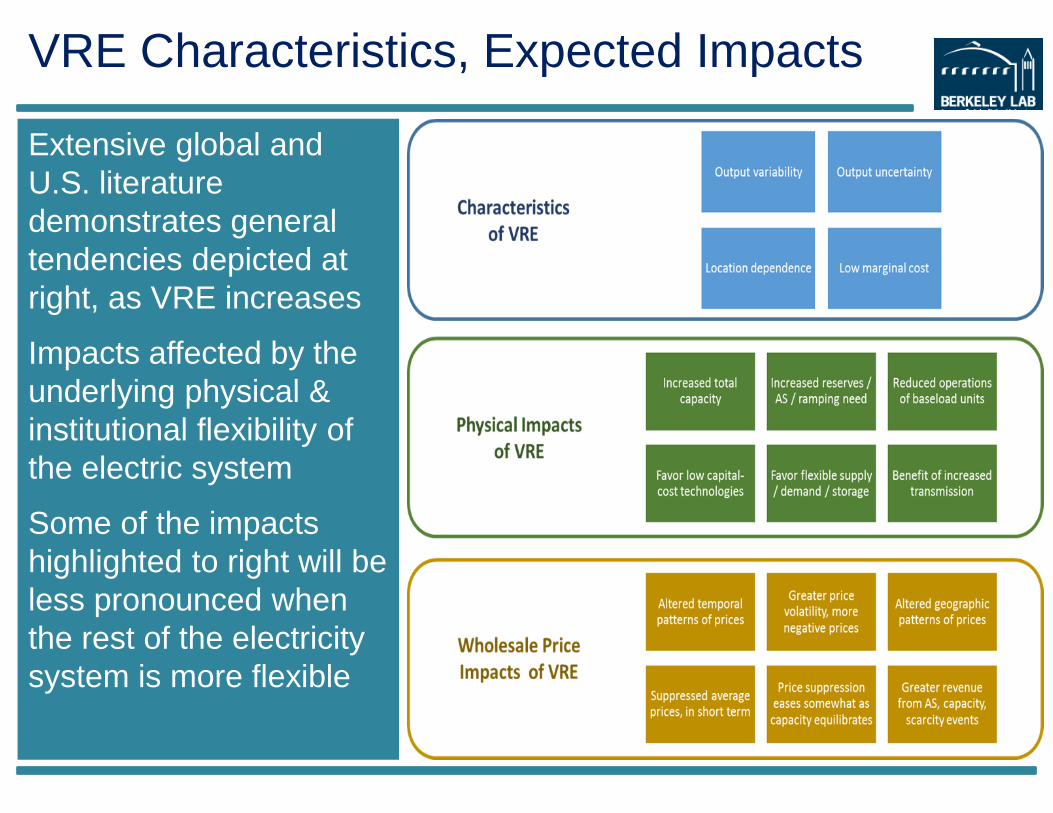
VRE Characteristics, Expected Impacts
Extensive global and
U.S. literature
demonstrates general
tendencies depicted at
right, as VRE increases
Impacts affected by the
underlying physical &
institutional flexibility of
the electric system
Some of the impacts
highlighted to right will be
less pronounced when
the rest of the electricity
system is more flexible
Impacts of VRE Policies and Incentives
• Useful to separate the distinct effects of policy support for
VRE (or any other type of generation): one that affects
deployment, and the other that impacts bidding behavior
• As it relates to bidding behavior, PTC and RPS create
incentives for VRE plant owners and purchasers to bid that
generation into wholesale markets at negative prices
– Wind and solar are not the only resources that bid negative prices in
wholesale electricity markets
– Nor are wind and solar the only resource that benefit from federal,
state, or local incentives of one form or another
• Whether either of these impacts—the deployment impact or
the bidding impact—is considered a ‘market distortion’
depends on perspective
11
Historical Observed Impacts of
VRE on the Bulk Power System
12

Chapter Content
Impacts of VRE on average wholesale prices
• Literature review of previous U.S.-based assessments
• Own analysis focused on CAISO and ERCOT
Impacts of VRE on wholesale price variability
• Negative prices: frequency, impacts, causes
• Price volatility, high prices, temporal patterns [see full report]
• Locational impacts: influence of transmission on specific hubs
Impacts of VRE on recent thermal-plant retirements
Directions for future research
Focus on LMPs, not capacity or AS; where possible, impacts placed
within a broader context of other drivers for wholesale price patterns

Average Price Impacts: Literature Review
14
Low marginal-cost generation (and negative bidding) will push the
supply curve out, reducing wholesale prices at least in the near term;
several studies have used historical prices and statistical methods to
estimate this VRE “merit order” effect
See also: Makovich and Richards (2017), Hibbard, Tierney, and Franklin (2017), Hogan and Pope (2017)
Study Applicable Region
Time Period Average VRE Penetration (% of demand)
Decrease in Average Wholesale Price from Average VRE
Woo et al. 2011 ERCOT 2007-2010 Wind: 5.1% Wind: $2.7/MWh (ERCOT North) $6.8/MWh (ERCOT West)
Woo et al. 2013 Pacific NW (Mid-C)
2006-2012 N/A Wind: $3.9/MWh
Woo et al. 2014 CAISO (SP15)
2010-2012 Wind: 3.4% Solar: 0.6%
Wind: $8.9/MWh Solar: $1.2/MWh
Woo et al. 2016 CAISO (SP15)
2012-2015 Wind: 4.3% Solar: 2.6%
Wind: $7.7/MWh Solar: $2.1/MWh
Gil and Jin 2013 PJM 2010 Wind: 1.3% Wind: $5.3/MWh
Wiser et al. 2016a Various regions
2013 RPS energy: 0%-16% depending on the region
RPS energy: $0 to $4.6/MWh depending on the region
Jenkins 2017b PJM 2008-2016 N/A Wind: $1-2.5/MWh
Haratyk 2017 b Midwest Mid-Atlantic
2008-2015 2008-2015
N/A Wind: $4.6/MWh Wind: $0/MWh
Notes: a – Price effect is estimated impact of RPS energy relative to price without RPS energy in 2013 before making adjustments due to the decay effect discussed by the authors. b – Decrease in average wholesale price is based on change in wind energy from 2008-2016 (Jenkins 2017) or 2008-2015 (Haratyk 2017), rather than the decrease from average wind reported in other rows.

Our Analysis Shows Limited VRE Impact on Annual Average Wholesale Prices
Used simple fundamental “supply curve” model to estimate wholesale
prices in 2016 and 2008, and factors that drove prices down over this
period; see details in full report and appendix
15
ERCOT CAISO
Natural gas price decline is the dominant driver in reduced average
annual wholesale prices from 2008 to 2016 in ERCOT and CAISO;
VRE impacts are modest, in part due to relatively flat supply curve

Negative Prices at Many Large Trading Hubs Are Rare, but Increasing in Some with VRE
Focuses on selected major trading hubs; negative prices almost non-
existent in day-ahead market (though lower average real-time prices
may also lower average day-ahead prices)
16
CAISO unique in high frequency of negative prices; VRE does appear
to play a role, but not exclusively, in driving these events
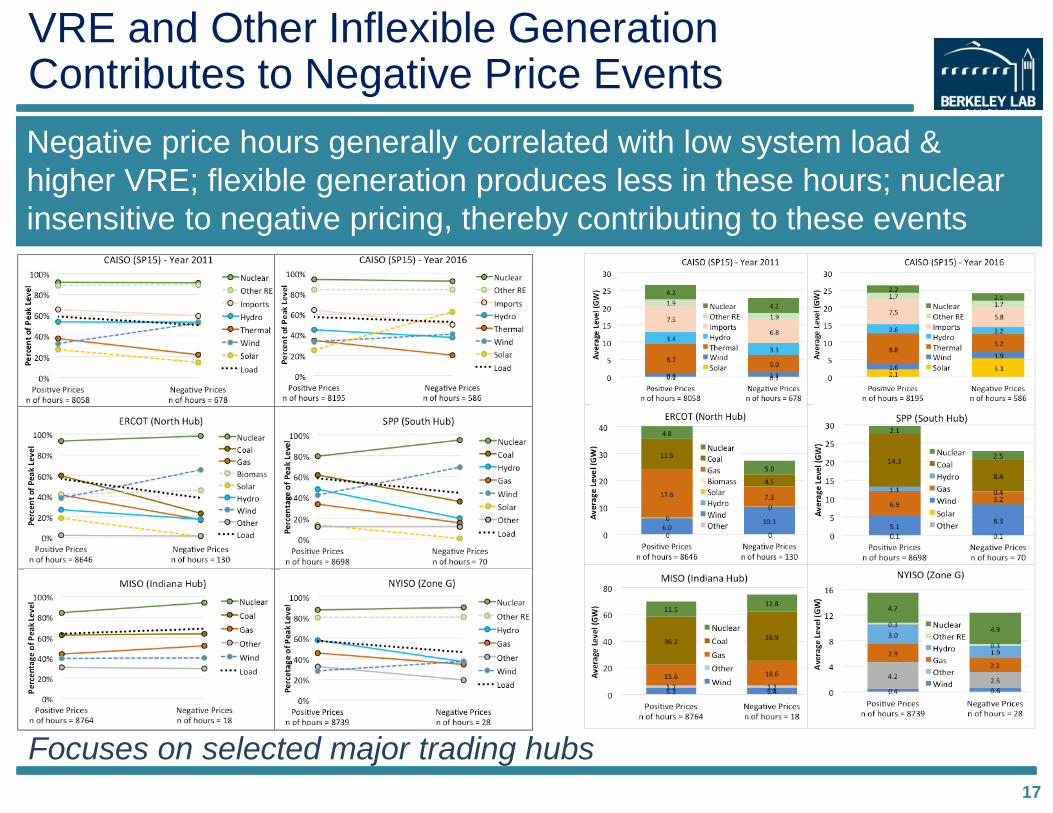
VRE and Other Inflexible Generation Contributes to Negative Price Events
Focuses on selected major trading hubs
17
Negative price hours generally correlated with low system load &
higher VRE; flexible generation produces less in these hours; nuclear
insensitive to negative pricing, thereby contributing to these events
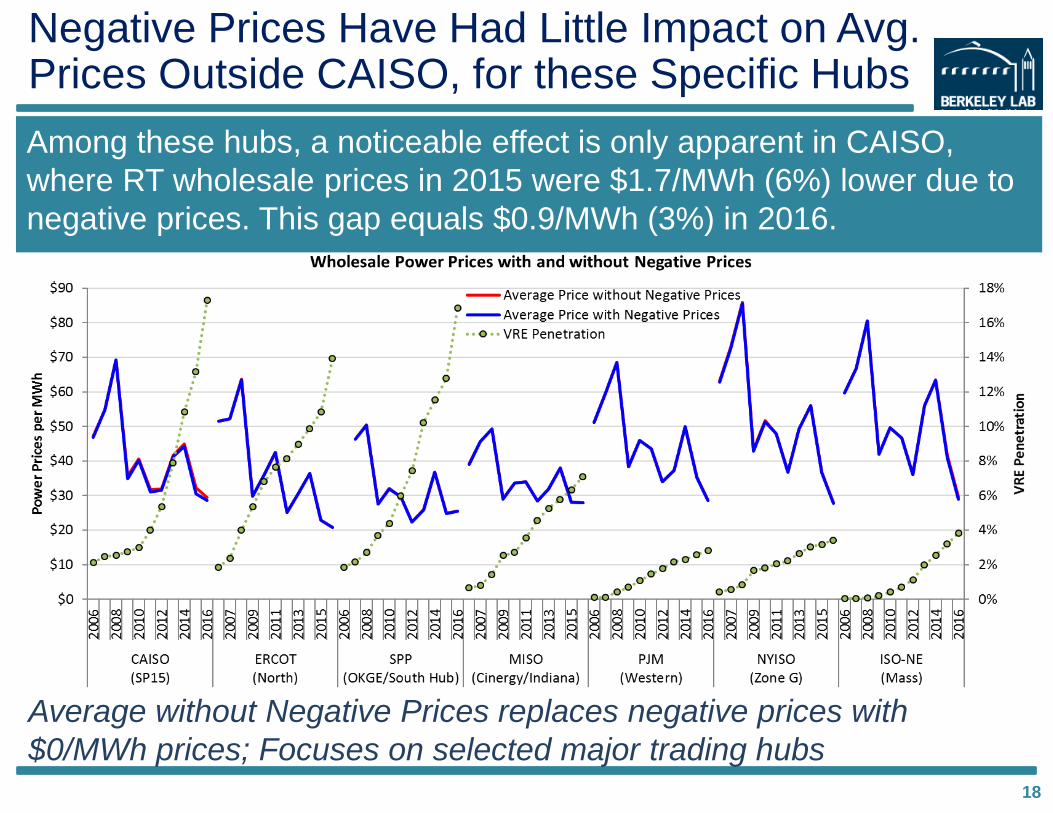
Negative Prices Have Had Little Impact on Avg. Prices Outside CAISO, for these Specific Hubs
18
Among these hubs, a noticeable effect is only apparent in CAISO,
where RT wholesale prices in 2015 were $1.7/MWh (6%) lower due to
negative prices. This gap equals $0.9/MWh (3%) in 2016.
Average without Negative Prices replaces negative prices with
$0/MWh prices; Focuses on selected major trading hubs
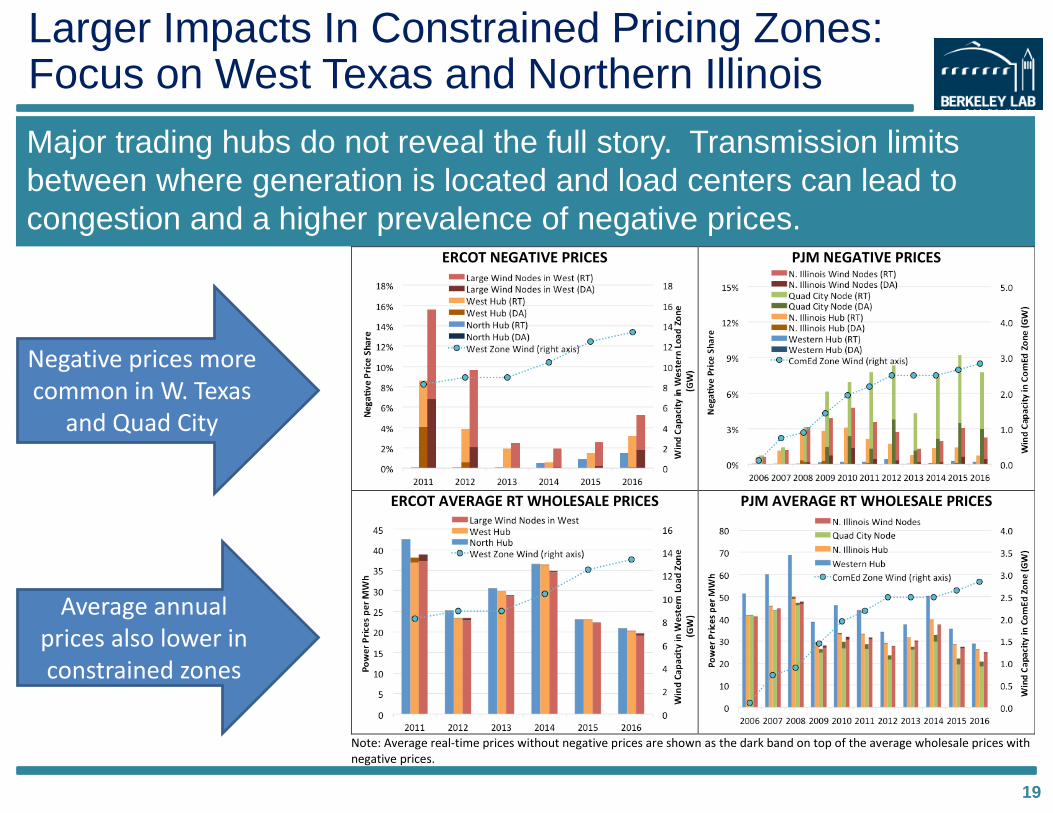
Larger Impacts In Constrained Pricing Zones: Focus on West Texas and Northern Illinois
19
Major trading hubs do not reveal the full story. Transmission limits
between where generation is located and load centers can lead to
congestion and a higher prevalence of negative prices.
Negative prices more common in W. Texas
and Quad City
Average annual prices also lower in constrained zones
ERCOT NEGATIVE PRICES
PJM NEGATIVE PRICES
ERCOT AVERAGE RT WHOLESALE PRICES
PJM AVERAGE RT WHOLESALE PRICES
Note: Average real-time prices without negative prices are shown as the dark band on top of the average wholesale prices with negative prices.

Thermal Plant Retirement Drivers Are Diverse
Variations in recent (2010-
2016) regional thermal plant
retirement percentages
correlated with nine possible
drivers
• VRE penetration in percentage terms, considering utility-scale wind and PV and distributed PV
• Regional growth (or contraction) in electrical load from 2010 to 2016
• Average planning reserve margin (based on summer capacity and peak loads) from 2010 to 2016
• Average SO2 emissions rates of the 25% of coal plants in each region with the highest emissions
• Average percent sulfur content of coal delivered to the region from 2010 to 2015
• Ratio of delivered coal prices to delivered gas prices in the region from 2010 to 2016
• Average regional delivered natural gas price from 2010 to 2016
• Average age of the oldest 25% of thermal power plants in the region in 2010
• New non-VRE capacity additions since 2010 as a percentage of total non-VRE capacity
20

VRE Has Not Played Major Role Historically;Is a Contributor for Some Specific Plants
21
ERCOT
FRCC
MISO
ISO-NE+NYISO
PJM
SERC
SPP
WECC
0%
5%
10%
15%
5% 10% 15% 20% 25%
Re
redCapacitySince2010
asaPercentageofNon-VRECapacity
AverageSummerCapacityMarginfrom2010to2016
AllThermalRe rements Coal&NuclearRe rements
Based on correlations, the strongest predictors of regional retirement variations include SO2
emissions rates, planning reserve margins, variations in load growth or contraction, and the age of older thermal plants. Additional apparent predictors include the ratio of coal to gas prices and delivered natural gas prices. Other factors appear to play lesser roles: VRE penetration, recent non-VRE additions, and whether the region hosts an ISO or remains regulated.
Stronger predictors of retirements
Weaker predictor of retirements
Prospective Future Impacts of
VRE on the Bulk Power System
22

Chapter Content
Selected studies take one of two approaches
• Fix capacity of the existing generation fleet irrespective of the introduction of new VRE
• Define investment and retirement of thermal units for each scenario of VRE capacity
Many additional caveats apply to this review
• Selective study selection, certainly not fully comprehensive
• Generally presume competitive wholesale electricity markets, with simplified modeling
• Different timeframes, approaches, models, resolution, regions, and assumptions
• Not appropriate to make direct comparisons across different studies and regions
• Most studies focus on short- to medium- term impacts; fewer long-term equilibrium
• Most studies explored aggressive VRE penetration levels—well above current levels
Directions for future research
Building on the anticipated directional impacts and the historical
observed impacts, in this chapter we review selected U.S.-based
literature that models prospective future impacts of high VRE

VRE Decreases Average Wholesale Prices in the Short Run; Less Pronounced in Long Run
Many studies do
not reflect
equilibrium
conditions; in
the long run,
price impacts
expected to be
less pronounced
due to changes
in the generation
mix as that mix
adapts to higher
levels of VRE
24
Systems with high penetrations of other low marginal cost
resources—e.g. nuclear—would experience similar dynamics

VRE Impacts Capacity Factors of Thermal Power Plants
Capacity factors tend to
decrease for thermal units
with increasing VRE.
Nuclear units are typically
modeled as inflexible
baseload generation, in
which case capacity factors
are not influenced by VRE.
25
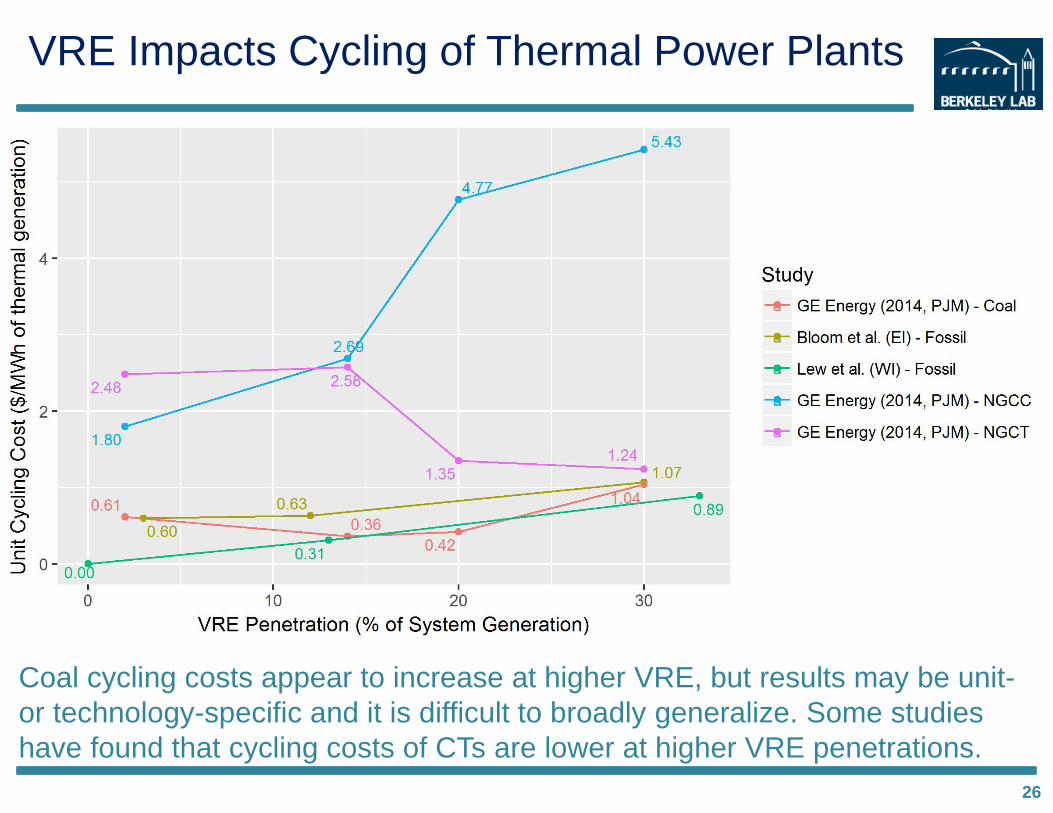
VRE Impacts Cycling of Thermal Power Plants
Coal cycling costs appear to increase at higher VRE, but results may be unit-
or technology-specific and it is difficult to broadly generalize. Some studies
have found that cycling costs of CTs are lower at higher VRE penetrations.
26
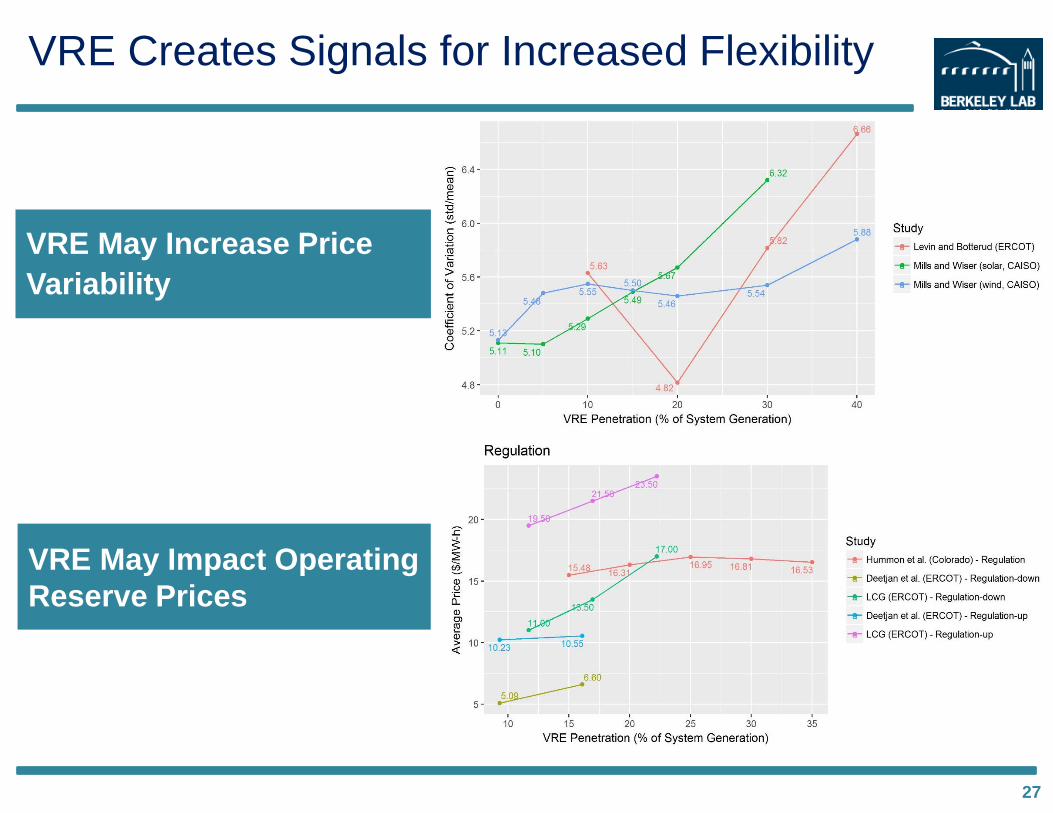
VRE Creates Signals for Increased Flexibility
27
VRE May Increase Price
Variability
VRE May Impact Operating
Reserve Prices

VRE Reduces Revenue & Operating Profits of Nuclear & Coal; Flexible Gas Less Exposed
• Operating profits of gas fired generators are less exposed to
increasing VRE levels given their flexibility characteristics
• Few studies comprehensively included possible revenues
from capacity and AS markets, making comparisons difficult
28
Nuclear &
coal profits /
revenues
generally
decrease
with VRE;
magnitude
differs based
in part on
whether
longer-term
equilibrium
solutions are
explored

System Value and System Costs of
Variable Renewable Energy
29

Chapter Content
Ideally, invest up to point where LCOE = “system value”
• System value includes energy, capacity, balancing, and transmission considerations
• Narrow definition used here focused on avoidable direct costs; not limited to VRE
• Acknowledge other societal values that often drive policy: diversity, environmental, etc.
• “Market value” sometimes different from “system value” as not all values are priced
Alternatively, “system cost” sometimes introduced as adder to LCOE
• All technologies have system costs, not limited to only VRE
• A controversial and complicated area of research and application
• Challenging to account for all relevant differences in simplified framework
Directions for future research
LCOE is an imperfect measure of the relative economics of
generation resources: introduce and synthesize literature on the
“system value” and “system cost” of VRE (and other resources)

System Value of VRE Varies by Technology and Location, Changes with VRE Penetration
• System value of PV often exceeds
that of flat-block at low penetration
• As penetrations increase, value of
PV declines rapidly
• System value of wind is lower than
PV at low penetrations
• As penetrations increase, system
value of wind declines, but at
slower rate than PV
• Multiple options to slow declining
system value of VRE
Literature not always inclusive of all values
31
(a)
Source: Hirth, Ueckerdt, and Edenhofer (2015)
(b)
Source: Hirth, Ueckerdt, and Edenhofer (2015)
(c)
Source: Hirth (2013) (d)
Source: Mills and Wiser (2012)
(e)
Source: Denholm et al. (2016)
CAISO (PV and wind)
Source: LBNL analysis
ERCOT (wind)
Source: LBNL analysis
0%
2%
4%
6%
8%
10%
12%
14%
0%
20%
40%
60%
80%
100%
120%
140%
2011 2012 2013 2014 2015 2016
Pe
ne
trat
ion
Rat
e
Val
ue
Fac
tor
Solar Penetration
Wind Penetration
Solar Value Factor
Wind Value Factor

System Value Is Impacted by Energy, Capacity, Balancing, and Transmission
Most literature has focused on VRE, but impacts are not
restricted to VRE
32
Source: Milligan et al. (2017) Source: Mills and Wiser (2012b)
Study
Wind Penetration Level Low High
Notes
Survey of transmission planning studies in the U.S. (Mills, Wiser, and Porter 2012)
$15/MWh Extremely wide cost range in individual studies; estimate based on median study
Western Wind and Solar Integration Study (GE Energy 2010b)
$0/MWh $18/MWh
Low penetration and local development of wind requires no additional transmission; high penetration and geographically concentrated wind requires more transmission
Eastern Wind Integration and Transmission Study (EnerNex Corp. 2010)
$10-20/MWh Lower transmission cost associated with lots of offshore wind; higher transmission cost for scenario with all onshore wind
ERCOT CREZ (RS&H 2011) $29/MWh October 2011 estimate of CREZ transmission costs; actual costs ended up higher1
20% Wind Energy by 2030 Study (DOE 2008)
$10/MWh Transmission expansion based on ReEDS model; 25% of wind did not require new transmission investment
Wind Vision: A New Era of Wind Power in the United States (DOE 2015)
$5/MWh Transmission expansion based on ReEDS model
Analysis of Western Renewable Energy Zones (Mills, Phadke, and Wiser 2011)
$20/MWh $25/MWh
Includes estimate of cost of losses, and assumes that all existing transmission is fully utilized and that new transmission cost is fully assigned to wind; does not consider ‘local’ wind
1 See also: Andrade and Baldick (2017)
“System Costs” Of VRE: An Alternative to the System Value Perspective
• Policymakers sometimes seek to avoid sophisticated
models that capture cost and system value differences
• Given the limits of LCOE, some research has involved the
creation of adjustments to the LCOE of wind and PV to
account for the so called “system costs” of VRE
• Can compare resources based on LCOE + system cost, but
need to estimate system cost for all resource options and
avoid double counting
• Two methods for assessing system cost in the literature:
– Difference between system value of a resource relative to a flat block
– Separate calculation of energy, capacity, balancing, transmission cost
• Given complexities, decision-makers typically use models,
do not consider “system costs” as separately identifiable
33

System Cost Estimates for VRE Span a Wide Range, Depend on Myriad of Factors
Estimating ‘System Costs’ from Value Factor Estimates
• Solar: ~ -10/MWh at low penetration, +$10-30 at 15% penetration, and +$30 at 30% penetration
• Wind: ~ +$5/MWh at low penetration, +$5-15 at 15% penetration, and +$7.5-25 at 30% penetration
• Transmission, not fully considered above, might represent a negative system cost for some PV located near load to an additional system cost of ~$15/MWh or more for remote VRE
Estimating ‘System Costs’ from Underlying Drivers
• IPCC: $7-30/MWh for wind up to 20%
• Hirth et al: $27-38/MWh for wind at 30-40%
• IEA: $17/MWh for VRE in 2035
• Agora: $6-22/MWh for 50% VRE
• Scholz et al: $13-30/MWh for VRE growing from 20% to 100%
34
Conclusions
35

Summary of Findings
• VRE is already impacting the bulk power market
• VRE impacts on average wholesale prices have been modest
• VRE impacts on power plant retirements have so far been limited
• VRE impacts on the bulk power market will grow with penetration
• The ’system value’ of VRE will decline with penetration
• Power system flexibility can reduce the rate of VRE value decline
All generation types are unique in some respect, and wholesale markets, industry investments, and operational procedures have evolved to
manage the characteristics of a changing generation fleet. With increased VRE, power system planners, operators, regulators, and policymakers
will continue to be challenged to develop methods to
smoothly and cost-effectively manage the reliable
integration of these new sources of electricity supply.
Future Work that Builds on
this Foundation
37
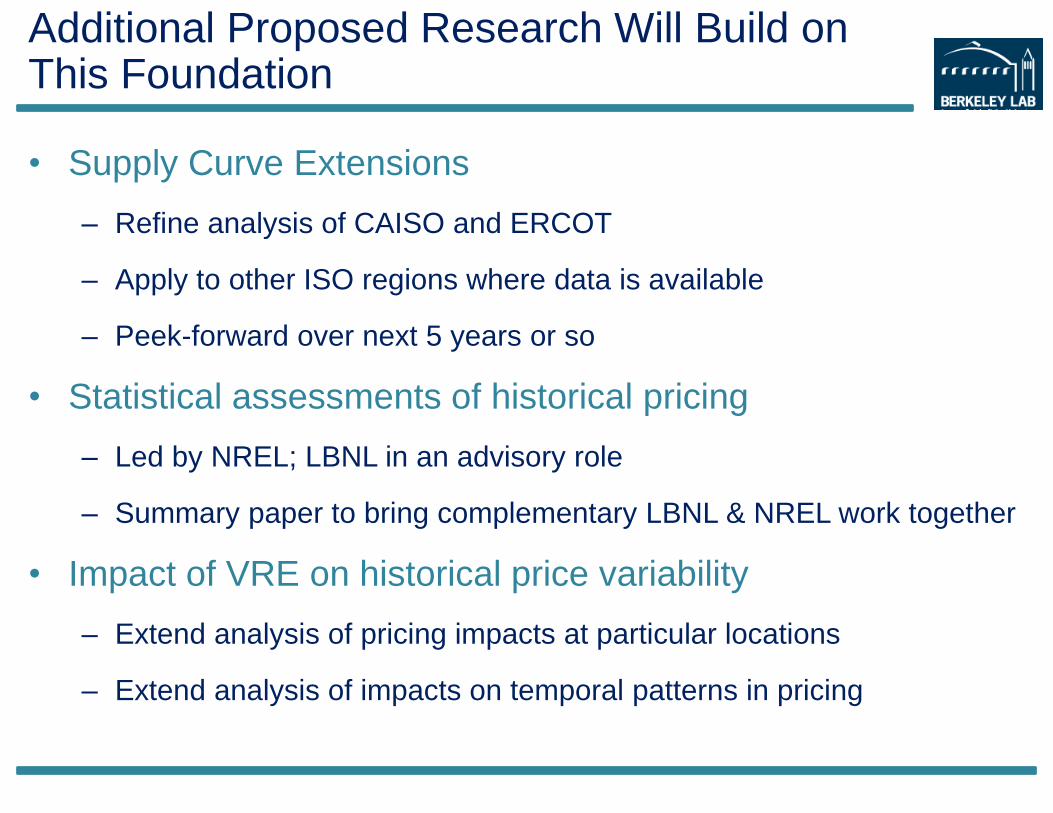
Additional Proposed Research Will Build on This Foundation
• Supply Curve Extensions
– Refine analysis of CAISO and ERCOT
– Apply to other ISO regions where data is available
– Peek-forward over next 5 years or so
• Statistical assessments of historical pricing
– Led by NREL; LBNL in an advisory role
– Summary paper to bring complementary LBNL & NREL work together
• Impact of VRE on historical price variability
– Extend analysis of pricing impacts at particular locations
– Extend analysis of impacts on temporal patterns in pricing