impaired visual processing of contralesional stimuli in
TRANSCRIPT

Impaired visual processing of contralesionalstimuli in neglect patients: a visual-evokedpotential studyFrancesco Di Russo,1,2 Teresa Aprile,1,2 Grazia Spitoni2 and Donatella Spinelli1,2
1Department of Education in Sports and Human Movement, University of Motor Sciences (IUSM) and 2Santa LuciaFoundation IRCCS, Rome, Italy
Correspondence to: Dr Francesco Di Russo, Department of Education in Sports and Human Movement, University ofMotor Sciences (IUSM), Piazza L. De Bosis, 15 (Foro Italico) 00194 Rome, Italy.E-mail: [email protected]
Transient visual-evoked potentials (VEPs) were recorded in 11 patients with right brain damage and spatialneglect. High-resolution EEG was recorded using focal stimuli located in the four visual quadrants. VEPs toleft stimuli, i.e. located in the neglected side, were compared to VEPs to right stimuli. Results showedthat bottom-up processing of a visual stimulus located in the neglected hemifield was intact up to �130msfrom stimulus onset.Hemispheric differences were not significant for either C1 or P1 components representingthe activity of striate and extrastriate areas, respectively. In contrast, visual processing in more dorsal areasadjacent to the superior parietal lobe was changed from normal. We failed to record the N1a componentfor left visual field stimuli expected in the 130^160ms time range. Furthermore, the N1p (140^180ms) and P2(180^220) components were delayed and/or reduced in amplitude for stimuli located on the neglected side.The source of the N1a was previously localized in the intraparietal sulcus in the dorsal occipital cortex; N1pmay represent a reactivation of areaV3A and P2 reactivation of occipital visual areas including V1 due to top-down feedbacks. Six patients with left brain damage (LBD) and no neglect and 21 healthy subjects were alsotested in the same experimental conditions used for patients with neglect. In LBD patients, all componentsevoked by contralesional stimuli were comparable to ipsilesional components.Overall, data allow localizing intime and space the processing deficit specific for patients with neglect.The first takes place around130ms in thebottom-up processing at the level of the anatomically intact dorsal parietal areas; the second is located at thelevel of the reactivation of the striate and extrastriate areas via feedback connections from higher visual areas.The two functional impairments were limited to left-field stimuli.
Keywords: neglect; visual cortex; pattern-onset VEP; visual quadrants; neuropsychology; attention deficit
Abbreviations: ERP=event-related potentials; LVF= left visual field; RVF=right visual field
Received July 25, 2007. Revised October 8, 2007. Accepted October 18, 2007
IntroductionUnilateral spatial neglect (hereafter called neglect) mayfollow unilateral brain damage; the disorder is relativelycommon and persistent after cerebral vascular damage tothe right hemisphere (while it is rare and transitoryafter left-brain damage) (e.g. Bisiach and Vallar, 2000).The lesions are typically large and diffuse, involving theright inferior parietal cortex, the ventral frontal cortex andthe superior temporal cortex (e.g. Committeri et al., 2007).Neglect patients fail to respond, orient to or report stimuli
located in the left contralesional space (e.g. Bisiach andVallar, 2000).
The observation that neglect may be detected in differentsensory modalities, its presence in cognitive tasks, such as
imagery, and the notion that primary sensory areas are
generally spared support an interpretation of the disorder
in terms of a high-order deficit (Heilman and Valenstein,
1979) rather than a sensory-perceptual one (Denny-Brown
et al., 1952). This largely accepted view leads to the
implicit corollary assumption that sensory processing of
doi:10.1093/brain/awm281 Brain (2007) Page 1 of 13
� The Author (2007). Published by Oxford University Press on behalf of the Guarantors of Brain. All rights reserved. For Permissions, please email: [email protected]
Brain Advance Access published November 16, 2007

contralesional stimuli is intact. Early event-related poten-tials (ERPs) studies confirmed this idea, reporting normalcortical activity evoked by stimuli located on the neglectedside (Lhermitte et al., 1985; Vallar et al., 1991; Viggianoet al., 1995). In contrast, some electrophysiological data andrecent functional magnetic resonance (fMRI) data supportthe view that changes in contralesional stimulus processingare present.
In various studies investigating the visual domain, wefound that contralesional-evoked activity was different fromipsilesional-evoked activity. Steady-state visual-evokedpotential (SSVEP) apparent latencies to contralesionalstimuli were systematically longer (10–30 ms) than ipsile-sional ones (Spinelli et al., 1994; Spinelli and Di Russo,1996; Pitzalis et al., 1997) (See also supplementary Tables Iand II). Verleger and co-workers noted that the N1component evoked by left visual field (LVF) stimuli wasreduced at the right recording site (Verleger et al., 1996).With fMRI, Corbetta and coworkers showed that, in acuteneglect patients, the anatomically intact right striate cortexwas less activated by visual stimulation than the left striatecortex and that the response to contralesional stimuli in theright cortex was smaller than the ipsilesional response(Corbetta et al., 2005).
In the auditory domain, Deouell and co-workers(e.g. Deouell et al., 2000) showed that the N1 component(peak between 70 and 130 ms) evoked by left- and right-sided stimuli was larger over the intact hemispherein neglect patients and was larger over the hemispherecontralateral to the side of stimulation in healthy subjects.Further, differences between contralesional- and ipsile-sional-evoked activity were observed in the mismatchnegativity (MMN, peaking between 100 and 250 ms),associated with a pre-attentive mechanism.
Somewhat similar results were obtained in extinctionpatients. The P1 and N1 components were absent orreduced for the extinguished visual stimulus with respect tothe perceived stimulus (Marzi et al., 2000; Driver et al.,2001). Marzi and co-workers also investigated extinctionpatients using unilateral stimulation. In this condition,the P1 component was found to be highly variable acrosspatients; the N1 component (140–200 ms) evoked in theright hemisphere by LVF stimulation (the extinction side)was smaller than the response evoked in the left hemisphereby right visual field (RVF) stimulation (Marzi et al., 2001;similar results in Driver et al., 2001). Impairment of callosaltransfer was reported by Vuilleumier et al., 2001. fMRIstudies found stronger activation for consciously detectedvs. extinguished stimuli in visual cortices including theprimary visual area (V1) in the right hemisphere (Driveret al., 2001) or not including V1 (Rees et al., 2000;Vuilleumier et al., 2001).
Although some contrasts are present in the datareported above (differences among studies are not surpris-ing considering the variability of patients and techniques(ERP vs. fMRI or, within ERPs studies, different stimuli
and different recording characteristics), we may summarizesaying that (i) early sensory cortices are activated bystimuli that escape awareness (see also Driver et al., 2001)and (ii) differential activation between perceived vs.neglected/extinguished stimuli are clearly documented.Thus, contralesional stimulus processing in neglect (andextinction) is different from normal processing (see Marziet al., 2001 for a similar conclusion). What remains to bedefined is the level (or levels) of processing at which suchchanges take place. The present work is devoted to this aim,limited to the visual domain.
In our previous studies, based on the hypothesis thatSSVEPs mostly reflect V1 activity and considering that theoccipital cortex was intact in most neglect patients studied,we speculated that the observed changes should reflectfunctional changes. These changes might be due to anabnormal top-down feedback by higher cortical areas tovisual cortices, including V1 (Spinelli et al., 1994).This speculation is now reinforced by a study in normalsubjects showing that the main generators of SSVEPs are V1and the middle temporal cortex (MT) (Di Russo et al.,2007). An alternative hypothesis, proposed by Marzi andco-workers (2001) in a discussion of extinction patients’data, is that abnormal processing of contralesional stimulioccurs beyond V1 at a level corresponding, in terms ofinformation processing, to the focusing of spatial attention.
In the present study, we investigated the neural level(or levels) at which changes from normal can be detected inneglect by evaluating the functional integrity of (i) theprocessing stages representing bottom-up visual activityand (ii) the reactivation of visual cortices representing top-down feedback modulation.
To pursue this aim, we took advantage of the hightemporal resolution of the transient VEPs and the spatialresolution provided by a dense recording array. Wemeasured the integrity of the different processing stagesby examining various VEP components. The methodologi-cal basis for such an approach was provided by ourprevious experience with healthy subjects using VEP andfMRI in conjunction (Di Russo et al., 2002b). This allowedfor a very accurate source localization of differentVEP components. Here, we applied in patients with neglectthe same stimulus paradigm and recording set-up to studythe following five VEPs components.
The first investigated component was the C1 (also calledN75) which reflects the activity of the primary visual cortexV1 about 60–100 ms after stimulus onset. The secondcomponent was the P1 (also called P100). The P1 reflectsthe conjoined activity of the dorsal visual areas V3A andthe ventral V4 in the 85–130 ms range.
The third investigated component was the N1a. In thepast, the N1 component present in the 130–180 ms timewindow was considered a single component; howeverprevious studies (Clark et al., 1995; Clark and Hillyard,1996; Martinez et al., 2001; Di Russo et al., 2002b) showedthat N1 is actually a complex including two major
Page 2 of 13 Brain (2007) F. Di Russo et al.

sub-components, the anterior N1 (130–160 ms; herereferred to as N1a) and the posterior N1 (140–180 ms;here referred to as N1p). A study combining ERP and fMRIdata, showed that the N1a (peaking on central sites) seemsto reflect the activity within the intraparietal sulcus (IPS)in the dorsal parieto occipital cortex (Di Russo et al.,2002b); this was confirmed by further studies in differentlaboratories (Di Russo et al., 2003, 2005). According to thisview, N1a reflects bottom-up stimulus processing at a level(dorsal IPS areas) dealing with spatial attention and visuo-motor control (eye and hand movements; e.g. Astafievet al., 2003).
The fourth and fifth investigated components were theN1p and P2. Both may be considered reactivation of theoccipital lobes. The notion of reactivation of visual corticesis relatively new, and few investigations in humans try todefine specific ERPs components marking this process. It iswidely known that reciprocal interconnections betweenmost areas of the visual cortex are rich (e.g. Felleman andvan Essen, 1991) and that there are at least as many fibresfeeding back into the primary cortex area as fibres feedingforward. The role of the backward connections is in themodulation of the activity of lower areas, possibly tocontrol information analysis at early levels (e.g. Tononiet al., 1992); however only recent data on single cells havedirectly supported this view (e.g. Sillito et al., 2006).In humans, the highly sensitive chronometric informationof ERPs plus source analysis studies associated with fMRIare, at present, the best method available to investigateactivation and re-activation of visual areas. The occipitalregion is activated first at 60–100 ms from stimulus onset(C1 and P1 components), then again 80 ms later (N1p),and again (P2 component) with a temporal delay of 120 msfrom C1 onset. It has been proposed (e.g. Di Russo et al.,2003) that N1p reflects a reactivation of the extrastriatevisual areas V3A, while the P2 (or P200) component (peaklatency around 180–220 ms) involves reactivation of occi-pital areas including V1. Thus, N1p and P2 may beconsidered feedbacks from higher areas on extrastriate andstriate areas.
Data collected in several laboratories has providedconverging evidence to the view of reverberating activityas top-down feedback on early visual areas in attentionaltasks 140–220 ms after the stimulus onset. Martinez et al.(2001) and Noesselt et al. (2002) combined ERP and fMRIdata; Barnikol et al. (2006) and Murray et al. (2002)combined magneto-encephalogram (MEG) and VEP/fMRIdata to show the effect of recurrent activation mechanismsincluding V1 and extrastriate areas and corticofugal feed-back loops. Olson and colleagues (2001) recorded intracra-nial ERPs in humans and found reactivation feedbacks inareas V1 and V2 beginning 200 ms after the stimulus onset.Overall, in the present study, on the basis of evidencereported above, we assume that both N1p and P2 arefeedback from higher areas on extrastriate and striate areas.
In the present study, we tested the efficiency of bottom-up neural processing of contralesional stimuli from V1 toIPS in the dorsal parieto-occipital cortex. Considering thatthese regions are usually spared in neglect patients,we suggest that a sensory function may be abnormal evenif the sensory area is anatomically intact. Similarly, visuo-motor behaviour may be impaired, as in neglect, even ifthe region representing a plausible substrate for neglect,i.e. the dorsal parietal cortex, is anatomically intact [seethe model of Corbetta et al. (2005)]. Indeed the ERPs are avery sensitive method to test the functional integrity ofcortical areas.
One specific goal of the study was to link the data ofour previous studies using SSVEP in neglect with thepresent data of transient-VEPs. In particular, we aimed totest the hypothesis of a change from normal in the top-down feedback to visual cortices. Thus we measuredmodifications to N1p and P2 components, which weconsider expressions of top-down feedback.
Material and MethodsSubjects and plan of the studyWe studied 11 patients with unilateral lesions of the right
hemisphere and visuo-spatial neglect (Table 1, N1–11). In this
group, as well as in the other groups, we compared ERPs to left
and right visual field stimuli; thus, each patient (subject) had
himself/herself as a control. As an additional control, we studied
six patients with unilateral lesions of the left hemisphere andwithout neglect (Table 1, L1–6). Patients were selected according
to demographic and clinical characteristics. All patients had
vascular pathologies. Lesions, assessed with MRI scans, were large
and heterogeneous, generally involving many cortical and sub-
cortical areas. No occipital lesions were reported. The presence of
spatial neglect was assessed using a standard neuropsychologicalbattery of tests that included two cancellation tasks (Line and
Letter Cancellation tests), the Wundt–Jastrow Area Illusion test
and the Sentence Reading test. Patients who failed on at least
two out of the four tests were classified as neglect patients
(Pizzamiglio et al., 1989). All left brain damage (LBD) patients
scored within the normal range on the four tests. All patients hadintact visual fields based on standard kinetic Goldmann perimetry
and were choose on the basis of their ability to keep the fixation
for at least 30 s. The two groups of patients did not differ for sex
(chi-squared = 0.69; ns), age (t(15) = 1.04 ns), time from lesion
(t(15) = 1.92 ns) or schooling (t(15) = 0.23 ns). Additional statistical
comparisons were run between the two groups of patients inorder to evaluate some specific questions (see additional analyses
in the results section). To link present data to the previous high-
resolution source localization study combining fMRI and VEPs
(Di Russo et al., 2002b) conducted in a different laboratory, 21
healthy subjects were also tested. The healthy group was much
younger than the patients group and was not used for statisticalcomparison with the patients groups. Mean age of healthy subjects
(nine females) was 30.4 years. Informed consent was obtained
from each participant; all procedures were approved by the local
ethics committee. All participants were right-handed and had
normal or corrected-to-normal visual acuity.
Impaired visual processing in neglects Brain (2007) Page 3 of 13

StimuliThe stimuli consisted of small circular Gabor gratings, which weremodulated sinusoidally in black and white and horizontallyoriented (Fig. 1); each stimulus had a diameter of 2 of visual
angle and a spatial frequency modulation of 3 cycles per degree.Stimuli were flashed for a 66 ms duration against a gray back-ground (22 cd/m2) that was equiluminant with the mean lumin-
ance of the grating pattern, which was modulated at a contrastof 32%. Stimuli were presented binocularly in randomized
sequences in the four quadrants of the left visual field (LVF)and right visual field (RVF) at a fast rate (SOAs varying between350 and 650 ms). Stimulus positions were cantered along an arcthat was equidistant (4�) from a central fixation point. For moredetails, see the supplementary methods.
ProcedureParticipants were comfortably seated in a dimly lit sound-attenuated and electrically shielded room while stimuli werepresented on a video monitor at a viewing distance of 114 cm.Subjects were trained to maintain stable fixation on a central cross(0.2�) throughout stimulus presentation. Each run lasted 120 sfollowed by a 30 s rest period, with longer breaks interspersed.A total of 18 runs or more were carried out in order to deliver atleast 800 stimuli to each quadrant. The subjects were givenfeedback on their ability to maintain fixation, and EEG recordingwas paused each time the subject lost fixation.
Electrophysiological recording and data analysisThe EEG was recorded using a BrainVision system from64 electrodes placed according to the 10–10 system montage(Di Russo et al., 2002b). All scalp channels were referenced to theleft mastoid (M1). Horizontal eye movements were monitoredwith a bipolar recording from electrodes at the left and right outercanthi. Blinks and vertical eye movements were recorded withan electrode below the left eye, which was referenced to site Fp1.The EEG from each electrode site was digitized at 250 Hz with anamplifier bandpass of 0.01–60 Hz, including a 50 Hz notch filter,and was stored for off-line averaging. Computerized artifactrejection was performed prior to signal averaging in order todiscard epochs in which deviations in eye position, blinks oramplifier blocking occurred. All epochs (from �100 to 500 ms
Table 1 Demographic and clinical data of neglect (N) and LBD (L) patients
Patient Age TFO Sex Lesionaetiology
Lesiontype
Lesion site Linecancell.
Lettercancell.
Wundt^Jastrow SentenceReading
N1 55 105 M I C R-FTP + + + +N2 78 162 M I C R-FP � + + +N3 48 77 F H C R-P � + + �
N4 71 125 F I CSC R-FTP + + + +N5 77 82 F I CSC R-F � + + �
N6 51 445 M I CSC R-F � + + �
N7 60 99 M I C R-TP � + + +N8 50 271 F I C R-FTP � + + �
N9 71 293 M I CSC R-FP � + + +N10 71 130 M I CSC R-FTP + + � +N11 69 227 F I CSC R-FTP � + + �
Mean 63.7 183L1 55 485 M I CSC L-F � � � �
L2 65 68 M I C L-P � � � �
L3 56 164 F I CSC L-TP � � � �
L4 71 52 M I C L-TP � � � �
L5 67 467 M H C L-FP � � � �
L6 50 32 F I CSC L-FTP � � � �
Mean 60.7 211
TFO=time from onset (days). Lesions aetiology (MRI data): H=haemorrhagic, I = ischaemic. Lesions type: C=cortical, SC=sub-cortical,CSC=cortical-subcortical. Lesion site: L= left, R=right, F= frontal, T= temporal, P=parietal. Neglect tests: + identifies pathologicalperformances according to standard normative values (Pizzamiglio et al., 1989).
Fig. 1 Stimuli used in the experiment. Circular Gabor gratingswere flashed at one of the four locations in random order.The size,spatial frequency and location of stimuli were selected in order tobetter differentiate the contribution of different brain areas.
Page 4 of 13 Brain (2007) F. Di Russo et al.

after the stimulus onset) in which EOG amplitudes were greaterthan �80 mV and EEG amplitudes were greater than �60 mV wereexcluded from further analysis. On average, 9.5%, 19% and 20%of the trials were rejected for violating these artifact criteria in thehealthy subject, LBD and Neglect group, respectively. VEPs wereaveraged separately for stimuli in each quadrant in epochs thatbegan 100 ms prior to the stimulus onset and lasted for 1100 ms.The amplitudes of the different VEP components were measuredas peak values within specified windows with respect to the 100 mspre-stimulus baseline. Three-dimensional topographical maps ofscalp voltage over time were obtained for the VEPs to stimuli ineach of the four quadrants using the BESA 2000 V5.1.4 system.
Separate analyses of variance (ANOVAs) were used to evaluatehemispheric differences within each group on the different VEPcomponents. The ANOVA factor was Hemifield (left vs. right).Separate ANOVAs were conducted on amplitudes and latenciesfor each VEP component of interest (i.e. C1, P1, N1a, N1p andP2). Component amplitudes were measured as peak voltagedeflections within five specified time intervals (70–90, 90–120,130–160, 140–200 and 200–280 ms) with respect to a 100 ms pre-stimulus baseline. These intervals were the same for all groupsand were based on previous studies which used the same VEPparadigm (Di Russo et al., 2002b, 2003). The analyses of the VEPcomponents were based on the grand average of each groupand were carried out at the electrode sites where the componentswere maximal in amplitude, separately for VEPs to upper andlower field stimuli. A further analysis was conducted in thepatients groups using the electrodes selected in the grand averageof the healthy subject group. The Greenhouse-Geisser correctionwas applied to the results. The significance level was set atP50.05.
ResultsVEP waveforms and topography
Neglect patientsThe spatio-temporal structure of the VEPs to stimuli ineach of the four quadrants is shown in Fig. 2. The majorcomponents’ amplitudes, latencies and topographic proper-ties are reported in Table 2. In the same table are alsoreported the statistical comparisons between responses toleft and right stimuli for this group of patients.
The earliest component (C1) had an average onsetlatency of about 55 ms and a peak latency of 80–84 ms. Forupper field stimuli, the C1 was most prominent atipsilateral occipito-parietal sites, close to the midline; forlower field stimuli, the C1 was largest at contralateraloccipito-parietal sites, close to the midline. In all subjects,the C1 varied systematically in polarity as a function ofstimulus position, i.e. it was negative for stimuli in theupper fields and positive for stimuli in the lower fields.Hemispheric differences were not significant (all P-values40.5).
Overlapping in time with the C1, the P1 component waselicited at contralateral occipito-temporal sites. This com-ponent had an average onset latency of 70 ms and peaklatency of 110 ms for the upper fields (95 ms for the lowerfields). These latency differences are most likely attributable
to overlap with the polarity inverting C1 (e.g. Di Russoet al., 2002b). The P1 did not change in polarity and variedlittle in amplitude for stimuli in the upper vs. lowerhemifields. Hemispheric differences were not significant(all P-values 40.5).
While hemispheric differences were not significant forthe earlier components, these were evident for componentswith latencies longer than 130 ms. Responses to contrale-sional stimuli were clearly defective.
In the interval between 130 and 180 ms, several negativewaves were elicited concurrently at different scalp locations.This complex of spatially and temporally overlappingwaves is often referred to collectively as the N1 component;however, recent studies have detected two different sub-components: N1a and N1p (e.g. Martinez et al. 2001).The two sub-components were well detectable in healthysubjects and LBD patients (see below) and quite welldetectable in the ipsilesional responses of patients withneglect. In contrast, one of the two sub-components (N1a)
Fig. 2 Neglect patients.Grand-averaged VEPs to stimulilocated in the left (blue lines) and right (red lines) visual fields.Electrode locations correspond to the peak activity of labeledVEP components. N1a=anterior N1, N1p=posterior N1.The negative activity present for the upper left quadrant around180ms on C2 electrode is part of the later N1p componentpeaking on posterior sites, as shown in Fig. 3.Waveforms arederived by more than 7200 trials per quadrant.
Impaired visual processing in neglects Brain (2007) Page 5 of 13

was absent for contralesional stimuli in the patients withneglect.
A small N1a component was present for the RVF; it wasprominent at contralateral frontal-central sites and peakedat 135–140 ms. The same component was not detectable forLVF. Obviously, statistical hemispheric comparisons, madeon the peak value in the specific time window, weresignificant for both upper and lower quadrants. Moreover,to statistically test the absence of the N1a component forLVF stimuli, we compared responses’ amplitudes (0.05 and0.07 mV for upper and lower fields, respectively) to the100 ms pre-stimulus baseline. The differences were notsignificant (t1051 ns).
The N1p component was distributed over contralateralparieto-occipital sites. The N1p component evoked by thecontralesional stimulus, resulted significantly delayed(P50.01) and reduced in amplitude (P50.01) for theupper left stimulus compared to the upper right one. Forthe lower fields, the N1p to left stimuli resulted reduced inamplitude (P50.01) but not significantly changed inlatency with respect to right stimuli.
The fifth investigated component was the positive waveP2, distributed over contralateral parieto-occipital sites. TheP2 component evoked by the contralesional stimulus wassignificantly delayed (P50.01) but not reduced in ampli-tude (even though a tendency was present) for the upperportion of the visual field. For the lower fields, the P2 wasboth delayed (P50.01) and reduced in amplitude(P50.01) with respect to the ipsilesional component.
Voltage topographiesFigure 3 shows the voltage topographies of the componentsfound in the neglect patients. The C1 component wasnegative and maximal in amplitude between the occipito-parietal midline for the upper left stimulus and ipsilateralfor the upper right stimulus. For the lower field stimuli, C1amplitude was positive and maximal at contralateraloccipito-parietal sites. The P1 was largest over contralateralparietal sites; its focus was located more superiorly forstimuli in the lower fields.
The N1a, detectable for right stimuli only, was largest oncontralateral fronto-central sites. For the upper LVF, somenegative activity was present around 180 ms on centralelectrodes (C2 electrode in the upper panel of Fig. 2). Toexclude the likelihood of a delayed N1a, the scalptopography in the upper panel of Fig. 3 shows a clearposterior distribution at around 170 ms, which is morelikely ascribable to an anterior spreading of a later N1pcomponent peaking on posterior sites. At 180 ms thetopography (not shown) was very similar to that shownin Fig. 3. The N1p was largest over the contralateraltemporal-occipital sites. Finally, the P2 was distributed overthe contralateral occipito-temporal site for the upper fieldsand at the contralateral occipital sites close to the midlinefor the lower fields.
Healthy subjects and LBD patientsThe spatio-temporal structure of the VEPs to stimuli ineach of the four quadrants is shown in Figs 4 and 5 for
Table 2 VEP components identified in neglect patients
VEP component Stimulus position Peakelectrode
Peaklatency
P-value Peakamplitude
P-value
C1 (70^90ms) Upper left POz 82 ns �0.49 nsUpper right O2 82 �0.53Lower Left P4 82 ns 0.71 nsLower Right PO3 84 0.84
P1 (90^120ms) Upper left CP4 110 ns 0.70 nsUpper right P3 100 0.75Lower Left CP4 95 ns 0.68 nsLower Right P5 95 0.73
N1a (130^160ms) Upper left C2 145 ns 0.05 50.05Upper right FC3 140 0.42Lower Left FC4 135 ns 0.07 50.05Lower Right FC3 135 0.35
N1p (140^200ms) Upper left PO8 168 50.01 �0.63 50.05Upper right PO7 150 �1.03Lower Left PO2 147 ns �0.64 50.01Lower Right PO7 144 �2.48
P2 (200^280ms) Upper left PO8 245 50.05 1.28 nsUpper right PO7 220 1.46Lower Left PO2 244 50.05 1.12 50.05Lower Right PO7 224 2.10
Latencies (ms) and amplitudes (mV) are measured on the corresponding peak electrode within the indicated interval. P-values indicated thestatistical comparison between left and right visual fields. ns=not-significant.
Page 6 of 13 Brain (2007) F. Di Russo et al.

healthy subjects and LBD patients, respectively. The majorcomponents’ amplitudes, latencies and topographic proper-ties are reported in Tables 3 and 4 (for voltage maps seeFigs 6 and 7) for healthy subjects and LBD patients,respectively. In the same tables are also reported thestatistical comparison between responses to left and rightstimuli within each group. The main result is that, for bothgroups and for all five components investigated, the latencyand the amplitude of responses to right and left stimuliwere comparable (all P-values were non-significant).
Similar to neglect patients, the earliest component (C1)in both healthy subjects and LBD patients had an averageonset latency of about 55 ms and a peak latency of80–84 ms. Distribution and polarity of the C1 componentfor upper and lower field stimuli was similar to thatdescribed above for patients with neglect. The onlydifference between the data on healthy subjects and patients(both LBD and neglect) was the amplitude of the C1component, which was larger in the healthy group.
The P1 component had an average onset latency of72–80 ms and a peak latency of 105 ms for the upper fields
and 100 ms for the lower fields. P1 characteristics were veryclose to those reported for the neglect group.
In both healthy subjects and LBD patients the two sub-components of N1 were well detectable. N1a was prom-inent at contralateral frontal-central sites and peaked at135–145 ms, and N1p was distributed over contralateralparieto-occipital sites and peaked at 145–155 ms. In agree-ment with previous studies (e.g. Di Russo et al., 2002b), theanterior N1a did not change appreciably in latency oramplitude for stimuli at the four spatial positions, whileN1p to lower field stimuli was earlier and larger than theN1p to upper field stimuli. Finally, the P2 componentpeaked at 210–220 ms and was distributed over contral-ateral parieto-occipital sites.
Voltage topographiesThe voltage maps of healthy subjects (see Fig 6), as well asthe grand-average recordings, matched perfectly the datarecorded in a previous high-resolution localization studycombining VEPs and fMRI and which used the samestimulation paradigm (Di Russo et al., 2002b). This match
Fig. 3 Neglect patients. Spline-interpolated 3D voltage maps inthe neglect patients’ group of VEP components elicited by stimuliin each quadrant. Latencies of maps are indicated below eachpanel. Note that for LVF stimuli in both upper and lowerquadrants the brain activity at the latency corresponding to theexpected latency for the N1a component was not symmetricalto the activity recorded for the RVF stimuli.
Fig. 4 Healthy subjects.Grand-averaged VEPs. For details seeFig. 2.Waveforms are derived by more than 15,000 trials perquadrant.
Impaired visual processing in neglects Brain (2007) Page 7 of 13

allows us to assume that the neural origin of the VEPcomponents recorded in the present study is the same asthat found previously.
Control analysesAs stated in the methods section, all comparisons wereplanned between left- and right-stimuli responses withineach group. However, an additional comparison was carriedon between patients groups limited to the early compo-nents’ (C1 and P1) amplitudes and latencies to the fourquadrant stimuli to exclude the presence of specific visualsensitivity deficits in neglects. No significant difference wasfound between groups either for responses to the samequadrants or for responses to contralesional quadrants (allt(15)41.2 ns).
DiscussionIn the study of neglect (and extinction), an open questionis whether the visual processing of contralesional stimuli isnormal or not; if it is not, the level of processing failure hasto be assessed. In the last decade, this question has receivedlittle attention; studies have been primarily based onelectrophysiological, and rarely on fMRI, recording. Thelack of data is not surprising considering the difficulty ofapplying these techniques in patients suffering from severebrain damage.
The present study contributes to answering this questionby analysing the electrical activity of different cortical areasinvolved in the processing of left and right visual fieldstimuli. Results showed two main functional impairments
Table 3 VEP components identified in healthy subjects
VEP component Stimulusposition
Peakelectrode
Peaklatency
P-value Peakamplitude
P-value
C1 (70^90ms) Upper left PO1 80 ns �0.86 nsUpper right PO4 80 �0.83Lower Left PO2 84 ns 1.13 nsLower Right PO3 84 0.99
P1 (90^120ms) Upper left PO8 105 ns 0.75 nsUpper right P7 105 0.72Lower Left PO8 100 ns 0.65 nsLower Right P5 100 0.62
N1a (130^160ms) Upper left FC4 135 ns �0.67 nsUpper right FC3 135 �0.58Lower Left FC4 135 ns �0.55 nsLower Right FC3 135 �0.68
N1p (140^200ms) Upper left PO8 155 ns �1.28 nsUpper right P7 155 �0.95Lower Left PO4 148 ns �2.78 nsLower Right PO3 148 �2.18
P2 (200^280ms) Upper left PO2 210 ns 2.12 nsUpper right PO3 210 2.16Lower Left PO2 215 ns 1.98 nsLower Right PO1 215 1.85
Latencies (ms) and amplitudes (mV) are measured on the corresponding peak electrode within the indicated interval. P-values indicated thestatistical comparison between left and right visual fields. ns=not-significant.
Fig. 5 LBD patients.Grand-averaged VEPs. For details, seeFig. 2.Waveforms are derived by more than 4000 trials perquadrant.
Page 8 of 13 Brain (2007) F. Di Russo et al.
specific for left-field stimuli. The first takes place inbottom-up processing at the level of the anatomicallyintact dorsal parietal areas; the second is located at the levelof the reactivation of the striate and extrastriate areas viafeedback connections from higher visual areas.
Bottom-up processing of visual stimuli located in theneglected hemifield was spared up to ca. 130 ms fromstimulus onset. V1 activity evoked by contralesional stimuli(shown by the C1 component) was comparable to theactivity evoked by ipsilesional stimuli. The latency wasnormal and the polarity inversion for upper and lowerhemifields was regularly present. Similarly, the two extra-striate areas (dorsal V3A and ventral V4) responsible for theP1 component generation were activated comparably by leftand right stimuli.
Compared to healthy subjects, C1 amplitudes of neglectpatients look reduced. However, this does not support theview of any specific contralesional sensory impairment. Theamplitude reduction was identical for stimuli displayed inleft and right visual field; moreover, C1 amplitude wascomparable in patients with neglect and in patients withoutneglect (LBD patients). The more likely explanation foramplitude reduction is a decrement in the signal-to-noiseratio for high spatial frequency gratings due to aging (bothneglect and LBD patients were much older than healthysubjects), possibly associated with unspecific decrement ofvisual sensitivity (Porciatti et al., 1992). However, effects ofdrugs cannot be excluded (e.g. Geller et al., 2005).
From studies in healthy subjects (Hillyard et al., 1998;Martinez et al., 2001; Di Russo et al., 2003; Natale et al.,
2006), we know that P1 represents the first processing stageat which attentional effects can be documented. Accordingto Natale et al. (2006), P1 is modulated by endogenous,sustained focusing of attention. The present data showedthat this latter stage of attention-modulated visual proces-sing was normal in the patients with neglect. Consistently,patients with neglect have spared voluntary attentionalcontrol (e.g. Natale et al., 2005).
In contrast to the intact early bottom-up striate andextrastriate activity generating the C1 and P1, visualprocessing in more dorsal areas adjacent to the parietallobe was profoundly altered. In no patients with neglect wewere able to record the N1a component for LVF stimuli,which was expected to be in the 130–160 ms time range.Three studies have localized the source of the N1a in themost dorsal IPS regions, i.e. between the posterior IPS(pIPS) and the horizontal IPS (hIPS) (Martinez et al., 2001;Di Russo et al., 2002b; 2005). These parietal regions aremore dorsal than those anatomically damaged in neglect(Corbetta et al., 2005; Committeri et al., 2007); indeed, ourMRI data do not indicate lesions in these areas (Table 1).In any case, the absence of N1a for contralesional stimuliwas a feature of all neglect patients.
This feature cannot be due to an early sensory deficit.Previous works in healthy subjects and patients (e.g. Brusaet al. 2001) found that the visual sensitivity is strictlyrelated to the C1 and P1 amplitude and latency, so thatlower sensitivity is correlated to smaller amplitude andlonger latency of these two early VEP components. Inpatients with neglect, C1 and P1 to contralesional stimuli
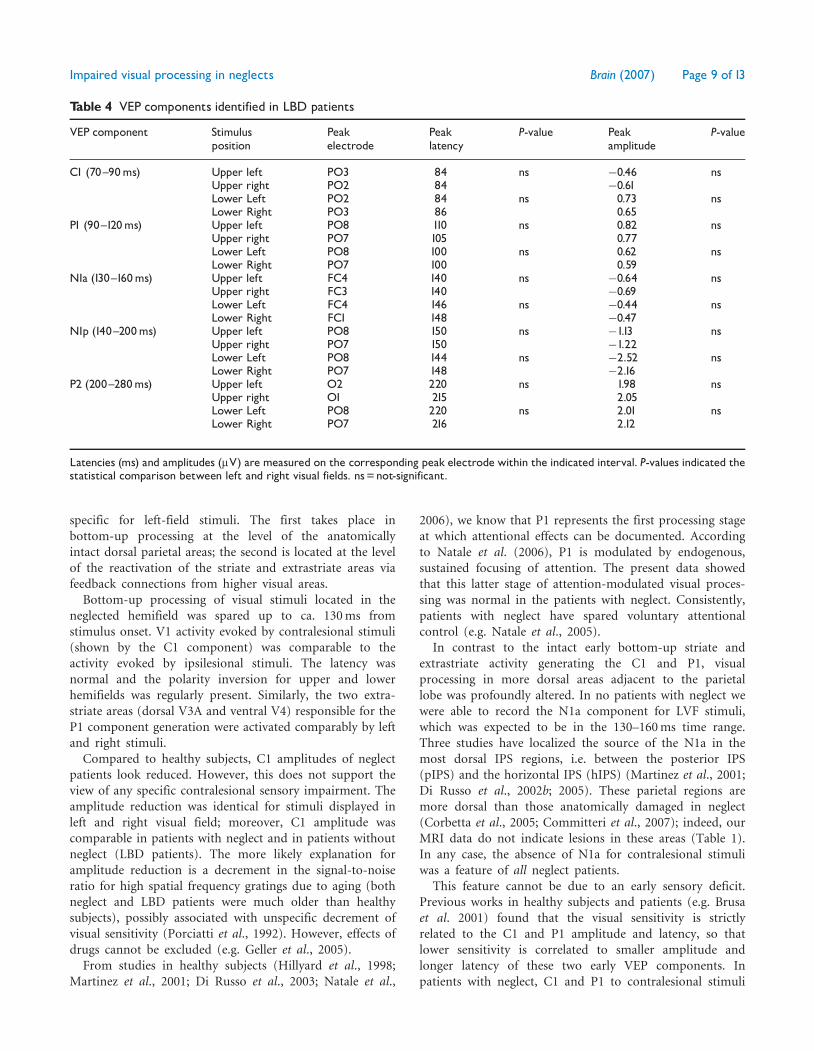
Table 4 VEP components identified in LBD patients
VEP component Stimulusposition
Peakelectrode
Peaklatency
P-value Peakamplitude
P-value
C1 (70^90ms) Upper left PO3 84 ns �0.46 nsUpper right PO2 84 �0.61Lower Left PO2 84 ns 0.73 nsLower Right PO3 86 0.65
P1 (90^120ms) Upper left PO8 110 ns 0.82 nsUpper right PO7 105 0.77Lower Left PO8 100 ns 0.62 nsLower Right PO7 100 0.59
N1a (130^160ms) Upper left FC4 140 ns �0.64 nsUpper right FC3 140 �0.69Lower Left FC4 146 ns �0.44 nsLower Right FC1 148 �0.47
N1p (140^200ms) Upper left PO8 150 ns �1.13 nsUpper right PO7 150 �1.22Lower Left PO8 144 ns �2.52 nsLower Right PO7 148 �2.16
P2 (200^280ms) Upper left O2 220 ns 1.98 nsUpper right O1 215 2.05Lower Left PO8 220 ns 2.01 nsLower Right PO7 216 2.12
Latencies (ms) and amplitudes (mV) are measured on the corresponding peak electrode within the indicated interval. P-values indicated thestatistical comparison between left and right visual fields. ns=not-significant.
Impaired visual processing in neglects Brain (2007) Page 9 of 13

were found to be comparable to C1 and P1 to ipsilesionalstimuli, while N1a was missing only for contralesionalstimuli. Moreover, note that in LBD control patients,the N1a contralesional component was comparable inamplitude and latency to the ipsilesional component,despite extended brain lesions (Table 1). Overall, themissing N1a in the neglect patients seems to reflect afunctional deficit at a relatively high level of bottom-upstimulus processing rather than structural damage to theneural generators. This view is compatible with Corbetta &co-workers’ model of neglect (Corbetta et al., 2005),which predicts functional impairment of the right hemi-sphere dorsal attention network even when it is anatomi-cally intact.
According to single-cell data from monkeys (Grefkes andFink, 2005), dorsal IPS areas are concerned with theintegration of multimodal information for constructing aspatial representation of the external world. In monkeys,these areas serve as interfaces between the perceptualand motor systems for controlling arm and eye movementsin space. In humans, many fMRI studies show that the IPSis constituted by a mosaic of areas subserving goals similar
to those described for analogous regions in the monkey.The human dorsal IPS areas deal with spatial attention andvisuo-motor control [eye and hand movements (Corbettaet al., 2000; Connolly et al., 2002; Astafiev et al., 2003;Kincade et al., 2005)], contain visuo-topic maps ofcontralateral space (Sereno et al., 2001; Silver et al., 2005)and are involved in goal-directed stimulus and responseselection (Corbetta and Shulman, 2002). A saccade-relatedarea (putative homologue of the macaque LIP) at theconfluence of the hIPS and pIPS has been described byfMRI studies (Sereno et al., 2001). The LIP area overlapswith the dorsal IPS region generating the N1a component.Taking all of the data into consideration, we deduce thatin humans a processing deficit in dorsal IPS regions maycontribute to defective stimulus detection, response andspatial orienting on the contralesional side. This latterbehaviour is a typical feature of neglects; note, for example,neglect patients’ slow reaction times and modest perfor-mance in target detection in the contralesional hemifield,even when uncertainty about stimulus position isexcluded (Natale et al., 2005). This deficit was attributedto impairment of the automatic triggering of attentionto the site of target presentation following stimulusappearance, which may not be compensated by spared
Fig. 6 Healthy subjects. Spline-interpolated 3D voltage maps ofVEP components. Note that the N1a topography appears moreposterior for lower quadrant stimuli likely because the N1pcomponent reaches the peak earlier, shifting the N1a topographyposteriorly.
Fig. 7 LBD patients. Spline-interpolated 3D voltage maps of VEPcomponents.
Page 10 of 13 Brain (2007) F. Di Russo et al.
endogenous attention. The N1a component generated inthe dorsal IPS would be the electrophysiological counter-part of this behaviour.
Within a competition model (Marzi et al., 2001),bottom-up signals evoked by ipsilesional stimuli may gainpriority for consciousness and action at this neural level,starting about 130 ms from stimulus onset. If defectivespatial encoding of an external event and related prepara-tion to act are critical for establishing conscious awarenessof the event itself (Berti and Rizzolati, 1992; Deouell, 2002),we can consider the missing N1a component the electro-physiological counterpart of the defective mechanism forstimulus awareness in neglect.
Another, not alternative, mechanism may be basedon top-down feedbacks. As described in the introduction,it seems that the components following the N1a reflectreactivation of visual areas (Nobre et al., 1998; Martinezet al., 2001; Olson et al., 2001; Noesselt et al., 2002; DiRusso et al., 2003). A first feedback stage is representedby the parietal-occipital N1p component (140–180 ms) anda later stage by the P2 component (180–220 ms). Thesecontralesional components were selectively changed inneglect patients (no contralesional change was observed inLBD patients). The latencies of N1p and P2 to contrale-sional stimuli were longer and/or the amplitudes werereduced compared to ipsilesional stimuli.
The impairment of the contralesional N1p and P2observed in all patients with neglect supports the hypothesisof defective top-down modulation of visual cortices activity.This impaired feedback might contribute to explainthe poor perception/awareness of visual stimuli locatedon the neglected/extinguished side. In fact, it may be notedthat the average fixation time (�300 ms) is much longerthan the short time used for the transient presentation(66 ms) in the laboratory set. Thus, the time span of asingle fixation in ecological conditions is long enough toallow full expression of top-down feedbacks to striate andextrastriate areas. In contrast the effect of this feedbackcannot be recorded in the early transient components(C1 and P1). In this view, we suggest that the sensoryanalysis of the contralesional stimulus taking place in earlyvisual areas after their first activation is not normal.
Let us clarify this suggestion that seems to contradict ourprevious statement that bottom-up processing is intactup to 130 ms from stimulus onset and V1, V3 and V4activities are normal. The first activity elicited in V1, V3and V4 by contralesional stimulus (C1 peaking at 80 ms,and P1 peaking at 100 ms) is intact, but the reactivationof the same areas (as represented by N1p and P2 peakingat 150 and 210 ms) related to the processing of the samestimulus is changed from normal.
As pointed out in the introduction, the role ofdescending feedback pathways in perception is only partlyclear. Evidence for feedback modulation of activity inlower-tier visual areas has been shown in macaque V1during figure-ground segregation (Kapadia et al., 1995;
Lamme, 1995; Zipser et al., 1996; Hupe et al., 1998; Lammeet al., 1998, 1999; Lamme and Spekreijse, 2000) and motionperception (Sillito et al., 2006). Consistent with reentrantfeedback modulations from higher-tier areas (Lamme andRoelfsema, 2000), these modulations occurred considerablylater than the initial onset of activity of the same V1neurons (Zipser et al., 1996; Lamme and Spekreijse, 2000)and were suppressed by anesthesia in higher areas (Lammeet al., 1998). ERP studies describing the feedback (Nobreet al., 1998; Olson et al., 2001; Martinez et al., 2001;Noesselt et al., 2002; Di Russo et al., 2003) proposed that itmight improve the salience of stimuli to attended locations.Indeed, at the single-cell level feedback pathways facilitatethe basic visual processing responsible for figure-groundsegregation and motion direction perception. Defectivefeedback, such as in patients with neglect, may impairstimulus perception of both stationary and moving stimuli.Previous studies suggested that the source of feedback to V1might be the posterior fusiform gyrus (area V4/V8) andthe source of feedback to extrastriate areas might arisefrom areas in the inferior temporal cortex, considered thehuman homologues of macaque areas TEO and TE(e.g. Olson et al., 2001).
In the present study with transient stimulation, we wereable to detect V1 reactivation (P2 component). However,reactivation was certainly dominant together to V5/MTactivity in the SSVEP condition. V1 and MT/V5 are in factthe main generators of SSVEP (Di Russo et al., 2007),and the SSVEP averaging time is on the order of manyseconds, thus, allowing full expression of defective top-down feedback on V1. Consistent with the idea thatSSVEPs allow full expression of top-down feedbacks,we observed in neglect patients changes of the SSVEP toLVF (neglected) stimuli with respect to RVF stimuli (seesupplementary Table 1). Also, in healthy subjects, changesof SSVEP analogous to those recorded in neglect wereassociated to attended vs. unattended stimuli and good vs.poor awareness of the stimuli (see supplementary Table 2);(Di Russo and Spinelli, 2002a).
In summary, the present data obtained with transientVEP in neglect patients allowed for the localization of thecontralesional input processing deficit in time and space.Bottom-up processing around 130 ms at the IPS levelis defective, and top-down feedback in striate andextrastriate areas in the range 140–220 ms is impaired.The correlate of such defective electrophysiological signals isa visuo-motor and perceptual deficit, with poor awareness,slow reaction times and poor detection of stimuli in thecontralesional hemifield.
The present data contribute toward an understanding ofneglect syndrome and may offer electrophysiologicalmarkers for measuring recovery.
Supplementary materialSupplementary material is available at Brain online.
Impaired visual processing in neglects Brain (2007) Page 11 of 13

AcknowledgementsThis research was supported by Italian grants from MIUR(PRIN) and from IUSM to D. Spinelli. We thank theNeuropsychology Unit of the Santa Lucia Foundation forproviding information on patients’ fMRI data. We aregrateful to Steven A. Hillyard, Concetta Morrone, SabrinaPitzalis and Pierluigi Zoccolotti for comments on an earlierversion of the manuscript.
ReferencesAstafiev SV, Shulman GL, Stanley CM, Snyder AZ, Van Essen DC,
Corbetta M. Functional organization of human intraparietal and frontal
cortex for attending, looking, and pointing. J Neurosci 2003; 23:
4689–99.
Barnikol UB, Amunts K, Dammers J, Mohlberg H, Fieseler T, Malikovic A,
et al. Pattern reversal visual evoked responses of V1/V2 and V5/MT as
revealed by MEG combined with probabilistic cytoarchitectonic maps.
Neuroimage 2006; 31: 86–108.
Berti A, Rizzolatti G. Visual processing without awareness: evidence from
unilateral neglect. J Cogn Neurosci 1992; 4: 345–51.
Bisiach E, Vallar G. Unilateral neglect in humans. In: Boller F, Grafman J,
editors. Handbook of neuropsychology. 2nd edn., Vol. 1. Amsterdam:
Elsevier; 2000. p. 459.
Brusa A, Jones SJ, Plant GT. Long-term remyelination after optic neuritis:
a 2-year visual evoked potential and psychophysical serial study. Brain
2001; 124: 468–79.
Clark VP, Fan S, Hillyard SA. Identification of early visually evoked
potential generators by retinotopic and topographic analysis. Hum Brain
Mapp 1995; 2: 170–87.
Clark V, Hillyard SA. Spatial selective attention affects early extrastriate
but not striate components of the visual evoked potential. J Cogn
Neurosci 1996; 8: 387–402.
Committeri G, Pitzalis S, Galati G, Patria F, Pelle G, Sabatini U, et al.
Neural bases of personal and extrapersonal neglect in humans. Brain
2007; 130: 431–41.
Connolly JD, Goodale MA, Menon RS, Munoz DP. Human fMRI evidence
for the neural correlates of preparatory set. Nat Neurosci 2002; 5:
1345–52.
Corbetta M, Kincade JM, Ollinger JM, McAvoy MP, Shulman GL.
Voluntary orienting is dissociated from target detection in human
posterior parietal cortex. Nat Neurosci 2000; 3: 292–7.
Corbetta M, Kincade MJ, Lewis C, Snyder AZ, Sapir A. Neural basis and
recovery of spatial attention deficits in spatial neglect. Nat Neurosci
2005; 8: 1603–10.
Corbetta M, Shulman GL. Control of goal-directed and stimulus-driven
attention in the brain. Nat Rev Neurosci 2002; 3: 201–15.
Denny-Brown D, Meyer JS, Horenstein S. The significance of perceptual
rivalry resulting from parietal lesion. Brain 1952; 75: 434–71.
Deouell LY, Bentin S, Soroker N. Electrophysiological evidence for an
early (pre-attentive) information processing deficit in patients with
right hemisphere damage and unilateral neglect. Brain 2000; 123:
353–65.
Deouell LY. Pre-requisites for conscious awareness: clues from
electrophysiological and behavioral studies of unilateral neglect patients.
Conscious Cogn 2002; 11: 546–67.
Di Russo F, Martınez A, Hillyard SA. Source analysis of event-related
cortical activity during visuo-spatial attention. Cereb Cortex 2003; 13:
486–99.
Di Russo F, Martınez A, Sereno MI, Pitzalis S, Hillyard SA. The cortical
sources of the early components of the visual evoked potential. Hum
Brain Mapp 2002b; 15: 95–111.
Di Russo F, Pitzalis S, Aprile T, Spitoni G, Patria F, Stella A, et al.
Spatio-temporal analysis of the cortical sources of the steady-state visual
evoked potential. Hum Brain Mapp 2007; 24: 323–34.
Di Russo F, Pitzalis S, Spitoni G, Aprile T, Patria F, Spinelli D, et al.
Identification of the neural sources of the pattern-reversal VEP.
NeuroImage 2005; 24: 874–86.
Di Russo F, Spinelli D. Effects of sustained, voluntary attention on
amplitude and latency of steady-state visual evoked potential: a costs
and benefits analysis. Clin Neurophysiol 2002a; 113: 1771–77.
Driver J, Vuilleumier P, Eimer M, Rees G. Functional magnetic
resonance imaging and evoked potential correlates of conscious and
unconscious vision in parietal extinction patients. NeuroImage 2001; 14:
S68–S75.
Felleman DJ, van Essen DC. Distributed hierarchical processing in the
primate cerebral cortex. Cereb Cortex 1991; 1: 1–47.
Geller AM, Hudnell HK, Vaughn BV, Messenheimer JA, Boyes WK.
Epilepsy and medication effects on the pattern visual evoked potential.
Doc Ophthalmol 2005; 110: 121–31.
Grefkes C, Fink GR. The functional organization of the intraparietal sulcus
in humans and monkeys. J Anat 2005; 207: 3–17.
Heilman KM, Valenstein E. Mechanisms underlying hemispatial neglect.
Ann Neurol 1979; 5: 166–70.
Hillyard SA, Vogel EK, Luck SJ. Sensory gain control (amplification)
as a mechanism of selective attention: electrophysiological and
neuroimaging evidence. Philos Trans R Soc Lond B Biol Sci 1998;
353: 1257–67.
Hupe JM, James AC, Payne BR, Lomber SG, Girard P, Bullier J. Cortical
feedback improves discrimination between figure and background by
V1, V2 and V3 neurons. Nature 1998; 394: 784–7.
Kapadia MK, Ito M, Gilbert CD, Westheimer G. Improvement in visual
sensitivity by changes in local context: parallel studies in human
observers and in V1 of alert monkeys. Neuron 1995; 15: 843–56.
Kincade JM, Abrams RA, Astafiev SV, Shulman GL, Corbetta M. An
event-related functional magnetic resonance imaging study of
voluntary and stimulus-driven orienting of attention. J Neurosci 2005;
25: 4593–604.
Lamme VA. The neurophysiology of figure-ground segregation in primary
visual cortex. J Neurosci 1995; 15: 1605–15.
Lamme VA, Super H, Spekreijse H. Feedforward, horizontal, and
feedback processing in the visual cortex. Curr Opin Neurobiol 1998;
8: 529–35.
Lamme VA, Rodriguez-Rodriguez V, Spekreijse H. Separate processing
dynamics for texture elements, boundaries and surfaces in primary
visual cortex of the macaque monkey. Cereb Cortex 1999; 9: 406–13.
Lamme VA, Roelfsema PR. The distinct modes of vision offered
by feedforward and recurrent processing. Trends Neurosci 2000; 23:
571–9.
Lamme VA, Spekreijse H. Modulations of primary visual cortex activity
representing attentive and conscious scene perception. Front Biosci
2000; 5: D232–43.
Lhermitte F, Turrel E, Le Brigand D, Chain F. Unilateral visual neglect and
wave P300. A study of nine cases with unilateral lesions of the parietal
lobes. Arch Neurol 1985; 42: 567–73.
Martinez A, Di Russo F, Anllo-Vento L, Sereno MI, Buxton RB,
Hillyard SA. Putting spatial attention on the map: timing and
localization of stimulus selection processes in striate and extrastriate
visual areas. Vis Res 2001; 41: 1437–57.
Marzi CA, Girelli M, Miniussi C, Smania N, Maravita A.
Electrophysiological correlates of conscious vision: evidence from
unilateral extinction. J Cogn Neurosci 2000; 12: 869–77.
Marzi CA, Girelli M, Natale E, Miniussi C. What exactly is extinguished
in unilateral visual extinction? Neurophysiological evidence. Neuro-
psychologia 2001; 39: 1354–66.
Murray MM, Wylie GR, Higgins BA, Javitt DC, Schroeder CE, Foxe JJ.
The spatiotemporal dynamics of illusory contour processing: combined
high-density electrical mapping, source analysis, and functional
magnetic resonance imaging. J Neurosci 2002; 22: 5055–73.
Natale E, Marzi CA, Girelli M, Pavone EF, Pollmann S. ERP and fMRI
correlates of endogenous and exogenous focusing of visual spatial
attention. Eur J Neurosci 2006; 23: 2511–21.
Page 12 of 13 Brain (2007) F. Di Russo et al.
Natale E, Posteraro L, Prior M, Marzi CA. What kind of visual
spatial attention is impaired in neglect? Neuropsychologia 2005; 43:
1072–85.
Nobre AC, Allison T, McCarthy G. Modulation of human extrastriate
visual processing by selective attention to colours and words. Brain
1998; 121: 1357–68.
Noesselt T, Hillyard SA, Woldorff MG, Schoenfeld A, Hagner T, Jancke L,
et al. Delayed striate cortical activation during spatial attention. Neuron
2002; 35: 575–87.
Olson IR, Chun MM, Allison T. Contextual guidance of attention: human
intracranial event-related potential evidence for feedback modulation in
anatomically early temporally late stages of visual processing. Brain
2001; 124: 1417–25.
Pitzalis S, Spinelli D, Zoccolotti P. Vertical neglect: behavioural and
electrophysiological data. Cortex 1997; 33: 679–88.
Pizzamiglio L, Judica A, Razzano C, Zoccolotti P. Toward a comprehensive
diagnosis of visual-spatial disorders in unilateral brain damaged patients.
Psychol Assess 1989; 5: 199–218.
Porciatti V, Burr DC, Morrone MC, Fiorentini A. The effects of aging on
the pattern electroretinogram and visual evoked potential in humans.
Vis Res 1992; 32: 1199–209.
Rees G, Wojciulik E, Clarke K, Husain M, Frith C, Driver J. Unconscious
activation of visual cortex in the damaged right hemisphere of a parietal
patient with extinction. Brain 2000; 123: 1624–33.
Sereno MI, Pitzalis S, Martinez A. Mapping of contralateral space in
retinotopic coordinates by a parietal cortical area in humans. Science
2001; 294: 1350–4.
Sillito AM, Cudeiro J, Jones HE. Always returning: feedback and
sensory processing in visual cortex and thalamus. Trends Neurosci
2006; 29: 307–16.
Silver MA, Ress D, Heeger DJ. Topographic maps of visual spatial
attention in human parietal cortex. J Neurophysiol. 2005; 94: 1358–71.
Spinelli D, Burr DC, Morrone MC. Spatial neglect is associated with
increased latencies of visual evoked potentials. Vis Neurosci 1994; 11:
909–18.
Spinelli D, Di Russo F. Visual evoked potentials are affected by trunk
rotation in neglect patients. NeuroReport 1996; 7: 553–6.
Tononi G, Sporns O, Edelman GM. Re-entry and the problem of
integrating multiple cortical areas: simulation of dynamic integration in
the visual system. Cereb Cortex 1992; 2: 310–35.
Vallar G, Sandroni P, Rusconi M, Barbieri S. Hemianopia, hemianesthesia
and spatial neglect. A study with evoked potentials. Neurology 1991; 41:
1918–22.
Verleger R, Heide W, Butt C, Wascher E, Kompf D. On-line correlates of
right parietal patients’ attention deficits. Electroencephalogr Clin
Neurophysiol 1996; 99: 444–57.
Viggiano MP, Spinelli D, Mecacci L. Pattern-reversal visual evoked potential
in patients with hemineglect syndrome. Brain Cogn 1995; 27: 17–35.
Vuilleumier P, Valenza N, Landis T. Explicit and implicit perception
of illusory contours in unilateral spatial neglect: behavioural and
anatomical correlates of preattentive grouping mechanisms.
Neuropsychologia 2001; 39: 597–610.
Zipser K, Lamme VA, Schiller PH. Contextual modulation in primary
visual cortex. J Neurosci 1996; 16: 7376–89.
Impaired visual processing in neglects Brain (2007) Page 13 of 13