implementing lean construction using the last planner ...known lc technique is the last planner...
TRANSCRIPT
Implementing Lean Construction using the Last Planner System in Northern Iraq
Twana Othman Muhammed Amin
Submitted to the
Institute of Graduate Studies and Research in partial fulfillment of the requirements for the degree of
Master of Science in
Civil Engineering
Eastern Mediterranean University February 2016
Gazimağusa, North Cyprus
ii
Approval of the Institute of Graduate Studies and Research
Prof. Dr. Cem Tanova Acting Director
I certify that this thesis satisfies the requirements as a thesis for the degree of Master of Science in Civil Engineering.
Prof. Dr. Özgür Eren Chair, Department of Civil Engineering
We certify that we have read this thesis and that in our opinion it is fully adequate in scope and quality as a thesis for the degree of Master of Science in Civil Engineering.
Assoc. Prof. Dr. İbrahim Yitmen Supervisor
Examining Committee 1. Prof. Dr. Tahir Çelik
2. Assoc. Prof. Dr. İbrahim Yitmen
3. Dr. Tolga Çelik
iii
ABSTRACT
With the continuous decline in profit margins and increased competition in
construction projects, construction contractors are continuing to search for ways of
eliminating waste and increasing profit. One important improvement initiative, with
direct practical impacts, has been the adoption of Lean Construction (LC). The best
known LC technique is the Last Planner System (LPS), which has been demonstrated
as a very useful tool for the management of the construction process and the
continuous monitoring of planning efficiency.
Nowadays, in Northern Iraq the increased economic growth as well as urbanization
in developing cities has led into extensive construction activities that generate large
amounts of wastes. Wastes in construction projects resulted into huge financial
setbacks to builders and contractors. In addition to this, it may also cause significant
effects over aesthetics, health, and the general environment. These wastes needs to
be managed as well as their impacts needs to be ascertained to pave way for their
proper management, however in many cities of Iraq waste management is still a
problem.
The main objective of this study is to investigate the causes of waste in construction
industry, at which level LC and LPS been implemented, and the effects of
implementing LC using LPS in Northern Iraq. The research includes an extensive
literature study, interviews with civil engineers, project managers, contractors, and a
case study, analysis of this information to develop findings, and extending these to
present the key issues that could be targeted for implementing LC using LPS. The
iv
study will thus contribute to improving management practice and may aid the
establishment of a basis for the development of further research in the area of LC.
The research outcomes can inform practitioners of the opportunity to implement
alternative management methods in construction, and give a good account of the
opportunities and challenges. Beside the direct benefits to managerial practice, the
study will also contribute to practice by offering practical recommendation that can
assist in the achievement of the full potential of lean and LPS in Northern Iraq.
Keywords: Lean Construction, Last Planner System, Waste Management, North Iraq
Construction Industry.
v
ÖZ
Kar marjlarındaki sürekli düşüş ve inşaat projelerinde artan rekabet ile, inşaat
müteahhitleri israfları gidermenin ve karlarını artırmanın yollarını aramaya devam
etmektedirler. Bir önemli gelişme, doğrudan pratik etkileri olan, Yalın İnşaat (Yİ)
girişiminin benimsenmesi olmuştur. En iyi bilinen Yİ tekniği yapım sürecinin
yönetimi ve planlama verimliliğinin sürekli olarak izlenmesi için çok yararlı bir araç
olarak ortaya konan Son Planlayıcı Sistemi (SPS) 'dir.
Günümüzde, Kuzey Irak'ta artan ekonomik büyümenin yanı sıra gelişen şehirlerde
kentleşmenin getirdiği kapsamlı inşaat faaliyetleri nedeniyle büyük miktarda israflar
ortaya çıkmıştır. İnşaat projelerinde israflar inşaatçılar ve müteahhitler için büyük
mali başarısızlıklarla sonuçlanmıştır. Buna ek olarak, aynı zamanda estetik, sağlık,
ve genel çevre üzerinde önemli etkilere de neden olmaktadır. Bu israfların
yönetilmesinin yanısıra onların etkilerinin uygun olarak tespit edilmesi için doğru
yönetime ihtiyaç olmasına rağmen Irak‘ın birçok şehrinde israf yönetimi hala bir
sorundur.
Bu çalışmanın temel amacı Kuzey Irak‘ta yapımdaki israfın nedenlerinin
araştırılması, ve Yİ ve SPS uygulamalarının ve etkilerinin ne düzeyde olduğunun
belirlenmesidir. Bu araştırma kapsamlı bir literatür çalışmasını, inşaat mühendisleri,
proje yöneticileri ve müteahhitlerle yapılan mülakatları, vaka analizini ve bu
bilgilerin analizi ile bulguların geliştirilerek SPS kullanımı ile Yİ uygulamasının
hedeflenmesini sağlayacak önemli konuları içerir. Bu çalışma böylelikle yönetim
pratiğini geliştirmeye katkıda bulunacak ve Yİ alanında ileriki araştırmalara bir temel

vi
oluşturulmasında yardımcı olacaktır. Araştırma sonuçları yapımda alternatif yönetim
yöntemlerini uygulama fırsatları için uygulayıcıları bilgilendirebilir ve firsatlar ve
zorluklar için iyi bir hesap verebilir. Çalışma, yönetsel uygulamaya doğrudan
faydalar yanında, aynı zamanda Kuzey Irak'ta tam yalın inşaat ve SPS uygulama
potansiyelinin başarılmasında yardımcı olabilicek pratik öneriler sunarak katkıda
bulunacaktır.
Anahtar Kelimeler: Yalın İnşaat, Son Planlayı Sistemi, İsraf Yönetimi, Kuzey Irak
İnşaat Sektörü

vii
To my beloved family

viii
ACKNOWLEDGEMENT
The support and collaboration of numerous people, made this study to be impossible
to whom I am obliged for their commitment. To start with, I am appreciative to the
Almighty and Glorious God, for the every single interminable gift. Additionally I
might want to say thanks to Assoc. Professor Dr. Ibrahim Yitmen for all his care and
guidance on the way to the achievement of this exploration.
I might truly want to thank my friend and my sister Avesta, for demonstrating
enthusiasm for my study and sharing profitable data. Additionally I might want to
thank all the undertaking members who indicated extraordinary enthusiasm for Last
Planner System. Without their bolster, investment, and recommendations this
exploration would not have been completed.
To wrap things up, my sincere appreciation goes to my parents and my older brother
Zana Othman for their love, support, and unwavering trust in my abilities. I am
fortunate to have them in my life. My special thank is reserved for my beloved wife
Hozan Ahmed who has established highest performance standards for me to work
more diligently and follow her path.
ix
TABLE OF CONTENTS
ABSTRACT ............................................................................................................... iii
ÖZ ................................................................................................................................ v
DEDICATION……………………………………………………………………...vii
ACKNOWLEDGEMENT…………………………………………………………viii
LIST OF TABLES………………………………………………………………...xiv
LIST OF FIGURES ................................................................................................ .xv
LIST OF ABBREVIATIONS……………………………………………………xviii
1 INTRODUCTION ................................................................................................... 1
1.1 Background ....................................................................................................... 1
1.2 Problem Statement ............................................................................................ 4
1.3 The Scope and Objectives of the Study ............................................................ 5
1.4 Methodology ..................................................................................................... 6
1.5 Expected Consequences ................................................................................... 6
1.6 Structure of Thesis ............................................................................................ 7
2 LITERATURE REVIEW......................................................................................... 8
2.1 Introduction ....................................................................................................... 8
2.2 Lean Construction History ................................................................................ 8
2.2.1 Lean Production History ............................................................................ 8
2.2.2 Lean Construction ………………………………………………….……9
2.2.3 Lean Project Delivery System…………………………………………..10
2.2.4 Fundamental Lean Principles…………………………………………...11
2.2.4.1 Meeting Costumer‘s Requirements …………………………...11
2.2.4.2 Reducing Non- Value Adding Activities ……………………...12

x
2.2.4.3 Reducing Cycle Time …………….…………………………...12
2.2.4.4 Reducing Variability ………………………………….……….13
2.2.4.5 Increasing Flexibility…………………………………………..13
2.2.4.6 Increasing Transparency……………………………………… 13
2.2.4.7 Maintaining Continuous Improvement ………………….…….13
2.2.4.8 Disentangling by Reducing Numeral of Stages………….….....14
2.2.4.9 Fixating Switch on the Comprehensive Procedure ……….…...14
2.2.4.10 Adjusting Flow Improvement with Conversion Improvement14
2.2.4.11 Benchmarking ………………………………………………..14
2.2.4.12 Lean Construction Tackles and Methods…………………….14
2.2.5 Lean and Traditional Construction Management differences……….….. 16
2.2.6 Utilizations of Lean Ideas in Manufacture Industry………..……….…..17
2.2.6.1 Improving Labor Workflow in Construction …………….……18
2.2.6.2 Formwork Engineering …………………………………….….18
2.2.6.3 Construction Projects ……………………………………….…18
2.2.6.4 Precast Concrete Fabrication ……………………….…………18
2.2.6.5 Infrastructure Projects.................................................................18
2.3 Wastes in Construction ................................................................................... 19
2.3.1 What Is Waste? ........................................................................................ 19
2.3.2 Classification of Waste ............................................................................ 20
2.3.3 Underutilized People …………………………………………………...20
2.4 Lean Philosophy of Project Planning .............................................................. 20
2.5 Key Principles of Lean Construction .............................................................. 22
2.6 Last Planner System ........................................................................................ 22
2.7 Should-Can-Will-Did Analysis ....................................................................... 24
2.8 Last Planner System Essentials ....................................................................... 27
xi
2.8.1 Milestone Schedule .................................................................................. 27
2.8.2 Pull Schedule (Baseline-Schedule) .......................................................... 27
2.8.3 Look Ahead Plan ...................................................................................... 27
2.8.4 Identifying Constraints ............................................................................. 28
2.8.5 Preparing Weekly Workplace .................................................................. 28
2.9 Chapter Summary............................................................................................ 29
3 RESEARCH METHODOLOGY ........................................................................... 30
3.1 Introduction ..................................................................................................... 30
3.2 Research Questions and Hypotheses .............................................................. 30
3.2.1 What are the Causes of Waste in Construction Industry? ........................ 30
3.2.2 At which Level Has Lean Construction and LPS Implemented? ............ 31
3.2.3 It is Appropriate to implement Lean Construction? ................................ 32
3.3 Participants ...................................................................................................... 32
3.4 Sample Size ..................................................................................................... 33
3.5 Research Tool.................................................................................................. 34
3.6 The Purpose and Content of the Study ............................................................ 35
3.6.1 Piloting the Study ..................................................................................... 35
3.6.2 Interviews ................................................................................................. 36
3.6.3 Case Study ................................................................................................ 37
3.6.4 Questionnaire Layout and the Length ...................................................... 38
3.7 Data Collection and Limitations ..................................................................... 39
3.8 Data Analysis .................................................................................................. 39
3.9 Summary of the Chapter ................................................................................. 39
4 RESULTS AND DISCUSSION ............................................................................ 41
4.1Section one: Practical Study Findings and Discussion .................................... 41

xii
4.1.1 The Case Study ........................................................................................ 41
4.1.1.1 The Sample Project ............................................................................ 41
4.1.2 The Implementation of the Last Planner System .................................... 42
4.1.2.1 Stage One ........................................................................................... 43
4.1.2.2 Stage Two .......................................................................................... 43
4.1.2.3 Stage Three ........................................................................................ 46
4.1.2.4 Stage Four .......................................................................................... 47
4.1.3 Weekly Percent Plan Complete .............................................................. 48
4.1.4 Percentage Plan Complete ....................................................................... 50
4.1.5 Reasons for Incomplete Assignments ..................................................... 52
4.1.6 Summary of the Study ............................................................................ 56
4.2 Section Two: The Questionnaire and Interviews ........................................... 57
4.2.1 General Information ................................................................................. 57
4.2.1.1 Gender ................................................................................................ 57
4.2.1.2 Age ..................................................................................................... 57
4.2.1.3 Work Places of Participants? ............................................................. 58
4.2.1.4 Education Level of Participants? ....................................................... 58
4.2.1.5 Position of Participants in Industry? .................................................. 59
4.2.1.6 Type of Organization ......................................................................... 60
4.2.1.7 Experience within Construction Industry .......................................... 60
4.2.1.8 Summary of the Participants‘ General Information ........................... 61
4.2.2 Lean Construction Experience ................................................................. 61
4.2.2.1 Experience with the Last Planner System .......................................... 61
4.2.2.2 Having Information about the Last Planner System ........................... 62
4.2.2.3 The Results Achieved, Satisfactory or Not? ...................................... 63

xiii
4.2.2.4 Summary of the Participants‘ Experience ........................................... 64
4.2.3 Lean Construction Using Last Planner System and Other Factors ........... 64
4.2.3.1 What Are The Effects? ........................................................................ 65
4.2.3.2 Arrangement in Reducing Waste in Construction Industry ............... 72
4.2.3.3 Usefulness of Weekly Work Plan and Percentage Plan Complete......76
4.2.3.4 Rating of Critical Success Factors ....................................................... 77
4.2.3.5 Main Difficulties Faced By the Company……………………....…...81
4.2.3.6 Challenges of Implementation at Organizational Level Instruction ...84
4.2.3.7 Implementation of LPS in the Future Projects……...……………..…89
4.2.3.8 Summary of the Results………………………..…………………..…91
4.4 Summary of the Chapter………………………………………….…..….….91
4.5 Implementation of Lean Construction…...……………………….……...….92
5 CONCLUSION AND RECOMENDATION….…………………………….......94
5.1 Conclusions...………………………………………………………….…….94
5.2 Challenges of LC…………...…………………………………………….….95
5.3 Suggestions for the Study ………..……………………………………….…95
5.4 Recommendations for Further research ………………………………….....,95
REFERENCES…………………………………………………………………..….97
APPENDICES……………………………………………………………………..105
Appendix A: Introduction Letter……………………………………………….106
Appendix B: Survey Questions………………………………………………...107

xiv
LIST OF TABLES
Table 2.1: Summary of the tools and techniques in Lean Construction .................... 15
Table 4.2: Percentage plan complete ........................................................................ 50

xv
LIST OF FIGURES
Figure 2.1: Lean Project Delivery System ................................................................ 11
Figure 2.2: Planning stages levels in the Last Planner System. ................................ 24
Figure 2.3: Traditional Planning Process ………………………….....…………… 26
Figure 2.4: Last Planner Planning Process…………………...………………….. . 26
Figure 2.5: Weekly Planning and Execution Cycle…….…………...….………… 29
Figure 4.1: Stages‘ Definition. .................................................................................. 43
Figure 4.2: MS Project……………………………………………………………..44
Figure 4.3: Primavera and Percentage Plan Complete…………………………..…45
Figure 4.4: Coordination of Construction Sequence on Billboard………….….…..45
Figure 4.5: Outcome of Pull Production Planning Meeting. ..................................... 46
Figure 4.6: Preparing Weekly Work Plan from 6 Week Look Ahead Plan. ............. 47
Figure 4.7: PPC1 Ratio for As-built & WWP. .......................................................... 51
Figure 4.8: PPC2 Ratio for As-built & 3WLAP. ...................................................... 52
Figure 4.9: PPC3 Ratio for As-built & Baseline Schedule. ...................................... 52
Figure 4.10: Reasons for uncompleted tasks over the entire Period of the Project...53
Figure 4.11: Suggested Framework for Implementing the LPS in Construction. ..... 55
Figure 4.12: Factors Affecting Sustainability. .......................................................... 57
Figure 4.13: Experts' Viewpoint about Lean and BIM. ............................................ 58
Figure 4.14: Problem in Lean Execution. ................................................................. 58
Figure 4.15: The Participants' Education Level.. ...................................................... 59
Figure 4.16: The Participants' Position within Construction Industry. ..................... 60
Figure 4.17: The Organizations of the Participants. ................................................. 60
Figure 4.18: The Participants' Experience within Construction Industry.. ............... 61
xvi
Figure 4.19: The Participants' Experience with Lean Construction. ......................... 62
Figure 4.20: The Percentage of Participants who have information about the LPS . 63
Figure 4.21: The Achievements Satisfactions Rate. ................................................. 64
Figure 4.22: The Idle Time effect according to the Participants' Responses. ........... 65
Figure 4.23: The Effect of excess movement of Equipment and unnecessary
Transportation on increasing waste. ........................................................................... 67
Figure 4.24: The Effect of Equipment Presence on Time. ........................................ 68
Figure 4.25: The Effect of Correction or Defects. .................................................... 68
Figure 4.26: The Effect of Underutilized Individuals. .............................................. 69
Figure 4.27: The Effect of Poor Communication among Disciplines. ...................... 70
Figure 4.28: The Effect of Workers Level of Skill. .................................................. 71
Figure 4.29: Effect of Workplace Safety ................................................................. 71
Figure 4.30: The Effect of Poor Management. ......................................................... 72
Figure 4.31: The Effect of Government on Reducing Waste. .................................. 73
Figure 4.32: The Effect of LPS and New Management Paradigm Effect on
Reducing Waste according to the Participants' View. ............................................... 74
Figure 4.33: The Effect of Expanding Awareness within Industry on Reducing
Waste. ......................................................................................................................... 75
Figure 4.34: The Effect of Ideas Sharing on Reducing Waste according to the
Participants. ................................................................................................................ 76
Figure 4.35: WWP and PPC are according to the Participants. ................................ 77
Figure 4.36: Top Management Support's Effect as one of the CSFs…………..….78
Figure 4.37: The Participants' View about Contractual Commitments. ................... 78
Figure 4.38: The Effectiveness of the entire Project Participants' Involvement. ...... 79
Figure 4.39: Communication and Coordination Effectiveness as CSF according to

xvii
Questionnaires' Respondents. ..................................................................................... 80
Figure 4.40: The Effectiveness of Relationship with Subs as CSF........................... 81
Figure 4.41: The Effect of the Owner and the Engineer's Involvement on
Difficulties.................................................................................................................. 82
Figure 4.42: The Effect of Contractor and Subcontractor's Involvement on Creating
Difficulties.................................................................................................................. 83
Figure 4.43: The Effect of Educating People with LPS on Creating Difficulties for
the Companies. ........................................................................................................... 84
Figure 4.44: The Participants' View about the Leadership for Implementing LPS and
Management Committing to Implement LPS.. .......................................................... 85
Figure 4.45: The Participants' View about people who are unwilling to change when
new systems are Introduced and those are reluctant to implement
LPS……………………………………………………………………………….....86
Figure 4.46: Participants' View about Unskilled People and Lack of Knowledge in
using LPS for Planning and Control in their Organizations…………………..…….87
Figure 4.47: Participants‘ Opinion about the Difficulties of Implementing LPS and
external challenges in implementing it.......................................................................88
Figure 4.48: The Participants' View about the Teams and the Team Member‘s
Collaboration……………………………………………………………………..….89
Figure 4.49: The Participants' Opinion regarding the Implementation of LPS in the
Future…………………………………………………………………………...…...91
Figure 4.50: Model Development of Last Planner System……………...……….…93
xviii
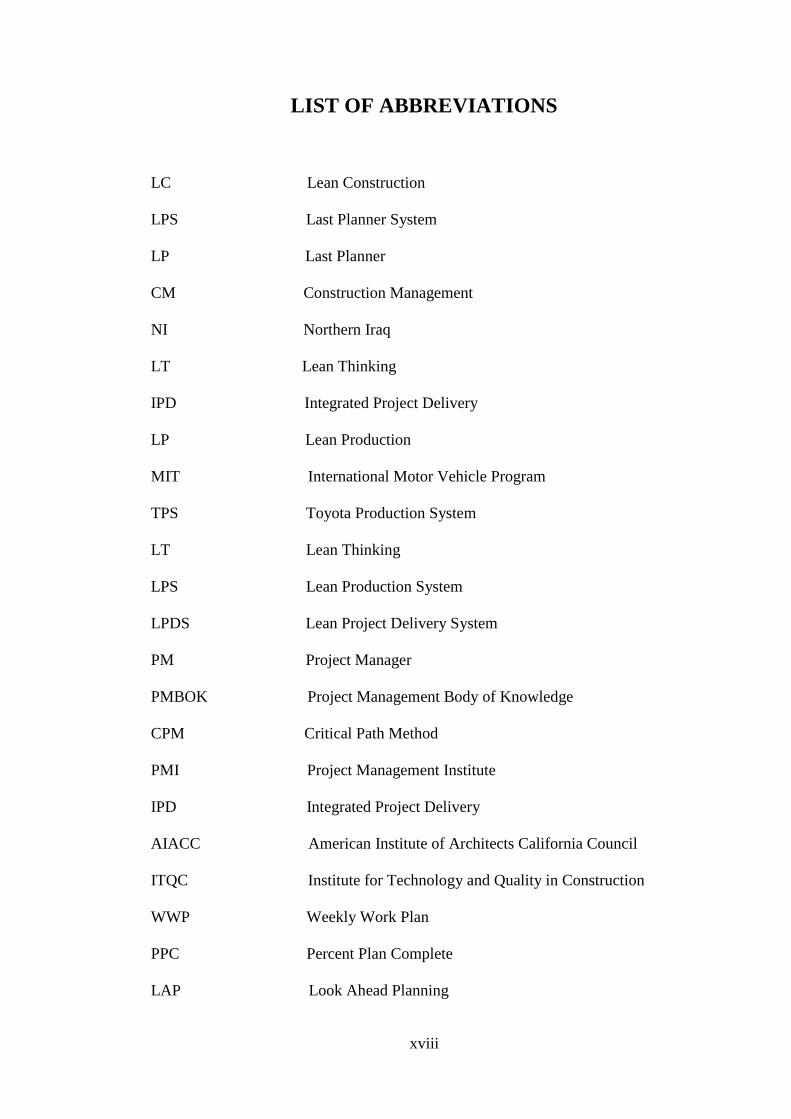
LIST OF ABBREVIATIONS
LC Lean Construction
LPS Last Planner System
LP Last Planner
CM Construction Management
NI Northern Iraq
LT Lean Thinking
IPD Integrated Project Delivery
LP Lean Production
MIT International Motor Vehicle Program
TPS Toyota Production System
LT Lean Thinking
LPS Lean Production System
LPDS Lean Project Delivery System
PM Project Manager
PMBOK Project Management Body of Knowledge
CPM Critical Path Method
PMI Project Management Institute
IPD Integrated Project Delivery
AIACC American Institute of Architects California Council
ITQC Institute for Technology and Quality in Construction
WWP Weekly Work Plan
PPC Percent Plan Complete
LAP Look Ahead Planning
xix
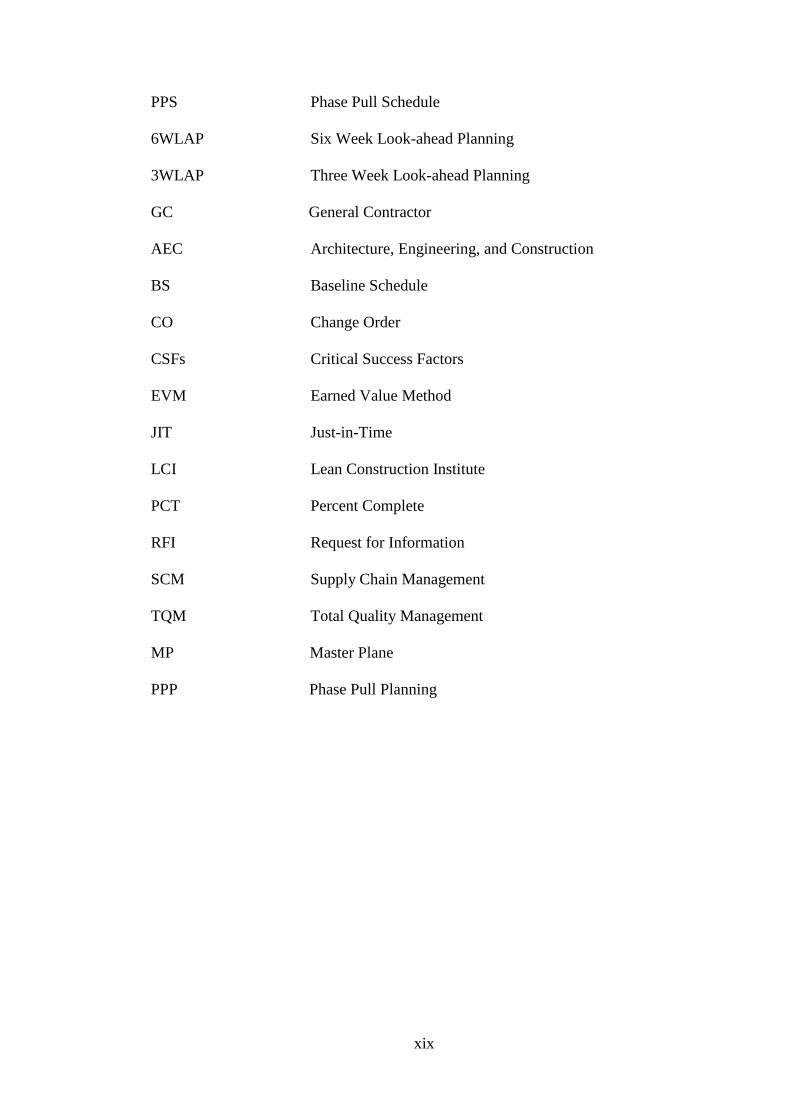
PPS Phase Pull Schedule
6WLAP Six Week Look-ahead Planning
3WLAP Three Week Look-ahead Planning
GC General Contractor
AEC Architecture, Engineering, and Construction
BS Baseline Schedule
CO Change Order
CSFs Critical Success Factors
EVM Earned Value Method
JIT Just-in-Time
LCI Lean Construction Institute
PCT Percent Complete
RFI Request for Information
SCM Supply Chain Management
TQM Total Quality Management
MP Master Plane
PPP Phase Pull Planning
1
Chapter 1
INTRODUCTION
1.1 Background
The recent studies and surveys show that 30% of the construction costs are resulting
from lack of efficiency, mistake, sustainability and absence of communication
Forbes et al. (2004). The construction industry in the developed and developing
countries confronts with such similar troubling obstacles. In these countries the
concept of construction performance suffers from lack of concentration on the
efficiency and initiative quality. The study of many researches brought out the
industry tendency to qualify construction performance in terms of the following
requirements: completion on time, completion within the funded budget, meeting the
construction requirements and codes (Koskela, 2008). Indeed, very little attention
devoted to the construction proprietor as a key performance measurement. Koskela
(2008) advised that exclusively explanatory studies and novel management
techniques could be progressed and practically implemented in the non-traditional
research approaches such as construction and action research. This may help to
address several of the persistent managerial troubles to raise performance and lead to
much knowledge in the construction management (CM) field.
Construction is a series of actions intended to gain a certain output (Koskela, 1992).
The process of construction is ordinarily broken down into main stages, for each the
cost of materials, machinery equipment and workforce is estimated and time frame

2
for completing each stage. These stages assuredly consist of certain activities
converting inputs into outputs and can be separately accomplished. In each stage of
construction and design processes wastes directly or indirectly are produced. The
reduction of waste within design is incredibly complicated since the amount of
materials and number of planned activities could be very huge to the
accomplishment of a single product such as an infrastructure project or a building
(Koskela, 1992). Whereas, more waste creators added in various construction stages
or through sub-contracting, process becomes more and more complicated (Keys,
Baldwin, & Austin, 2000). Lack of a theoretical and conceptual framework in
construction still exists in spite of these shortages of the activity models. The focus
on activities conceals the waste generated in the ongoing activities through
unpredicted resource delivery or release of work. In other words such current events
and production forms make these activities be taken into account and disregard
shortcomings and value considerations (Koskela, 1992).
Construction waste is arranged based on type, quantity, etc. Despite of dissimilar
arrangements, most of them follow the same principle idea. Shingo (1984) separated
construction waste into seven kinds based on their reasons. These reasons are the
organization itself, stock, operation, transportation, waiting period, overproduction,
and defect. In another study, Koskela (1992) counted deficiency, revise, project
error, oversight, replace sequence, safety, cost and over consumption of materials as
waste collections that arisen in construction procedures.
The gradual growth of international cooperation and absence of experts or
experienced efforts, require urgent demand to increase the excellence of standards,

3
creativeness and the implementation of fresh skill to the construction projection
(Koskela, 1992).
The wastes are affected by many restraints of the design process; such as the
complexity of design, selection of the materials, coordination and communications
within different disciplines (Keys, Baldwin, & Austin, 2000).
The earlier published researches mainly aimed at accelerating the implementation
construction process and improving the overall productivity with the introduction of
new technologies, and equipment keeping the common project management
techniques. The focus mainly was on time-cost- quality tradeoff. However, LC as a
new form of project management reinforced by powerful capabilities through
application of BIM expected to provide variety of procedures and results expected to
the achievement of efficiency in resources and more sustainable buildings.
LC maximizes value and reduces waste. It accomplishes these objectives through the
use of Supply Chain Management (SCM), Just-In-Time (JIT) techniques as well as
sharing information to all the concerned and involved parties of the production
process. Lean concept that developed by Taichii Ohno in the 1950s, based on lean
manufacturing. The lean philosophy includes minimizing waste in all forms and
continuous improvement of processes and systems.
Ballard and Howell (2003) planned the LPS as one of the methods for applying lean
techniques to construction. It provides productive unit and workflow controls and
alleviates swift responses to correct for deviations from expected outcomes through
4
using root cause analysis. Control is defined as ―causing events to conform to plan,‖
as opposed to the construction tradition of monitoring progress against schedule and
budget projections. LPS focuses on the reduction of workflow hesitation. It was
established to help the project planner in decreasing the doubt inherent in the
preparation procedure. LPS uses a systematic process to produce reliable work plans
targeted at protecting the downstream work procedures from upstream indecision by
means of planning and corresponding the workload to obtainable resources. ―The
person accountable for creating the latest level of plans in the planning hierarchy‖
Kartam et al. (1995a & 1995b).
Architecture, Engineering, and Construction (AEC) procedures are essentially
changeable and indeterminate. The LPS has been effectively executed in
manufacture schemes to expand the dependability of planning, manufacture process,
and improving the workflow in project and construction processes (Ballard &
Howell, 2004). The LPS suggests a methodical procedure for construction planning,
assumed the administrations complicated have comprised a ―lean philosophy‖.
1.2 Problem Statement
One important improvement initiative, with direct practical impacts, has been the
adoption of LC. Since the early 1990s, LC has evolved as a new way to manage
construction more efficiently and effectively. Diverse lean techniques have been
adopted in practice, aiming to enhance project management by eliminating waste,
improving planning efficiency and reliability, improving productivity and
maximizing value.

5
The best known lean construction technique is the LPS, which has been
demonstrated as a very useful tool for the management of the construction process
and the continuous monitoring of planning efficiency. LPS has been tested in the
field and refined over the last decade, with many reported benefits in diverse
environments around the world. Now days, in Iraq the increased economic growth as
well as urbanization in developing countries have led into extensive construction
activities that generate large amounts of wastes. Material wastage in construction
projects resulted into huge financial setbacks to builders and contractors. In addition
to this, it may also cause significant effects over aesthetics, health, and the general
environment. These wastes needs to be managed as well as their impacts needs to be
ascertained to pave way for their proper management, however in many cities of Iraq
wastes materials management is still a problem.
1.3 The scope and objectives of the study
The main objective of this study is to investigate the causes of waste in construction
industry, at which level LC and LPS been implemented, and the effects of
implementing LC using LPS in Northern Iraq. The research includes an extensive
literature study, interviews with civil engineers, project managers, contractors, and a
case study, analysis of this information to develop findings, and extending these to
present the key issues that could be targeted for implementing LC using LPS. The
study will thus contribute to improving management practice and may aid the
establishment of a basis for the development of further research in the area of LC.
The research outcomes can inform practitioners of the opportunity to implement
alternative management methods in construction, and give a good account of the
opportunities and challenges. Beside the direct benefits to managerial practice, the
study will also contribute to practice by offering practical recommendation that can
6
assist in the achievement of the full potential of lean and LPS in Northern Iraq.
The questions raised in this research are as follows:
1. What are the causes of Waste in construction industry of NI?
2. At which level has LC and LPS implemented in NI?
3. What will be the effects of implementing LC in NI?
1.4 Methodology
This study was executed in five major stages.
1. Literature survey; intensive study of the earlier works in the area of LC that
assisted the researcher in developing implementation strategy.
2. Research Design; this stage concentrates on initial framework development
for implementing LPS in Construction Industry.
3. Data Collection; methods for data collection including interviews,
questionnaires, case study and documentary analysis.
4. Data Analysis and Evaluation; a simply meaningful analysis of measured
data and evaluation of LPS implementation executed objectives of this thesis.
5. Final Report; an overview of the outcomes of the research have been
recorded and documented in this thesis.
1.5 Expected Consequences
The following outcomes are expected in this study:
1. The advantages of LPS will be presented through the improved performance
of the project planning process at every phase.
2. The related industries will be furnished with the studies demonstrating
possible obstacles and associating issues of the implementation of LPS at a
construction project.
3. Recommendations and suggested ideas will be processed to overcome such
7
possible difficulties for more effective implementation of LPS.
1.6 Structure of Thesis
Chapter one presents introduction, problem statement, methodology and the probable
outcomes of this research. Chapter two provides a literature review on the LPS and
tools for executing LPS. Chapter three illustrates LPS implementation strategies in
detail through step by step and how to collect data from the construction industry and
case study. Chapter four outlines the results and consequences of the research and
implementing this tool in the case study. Chapter five draws conclusions and offers
recommendations for further studies. References and appendixes are provided at the
end of this research.

8
Chapter 2
THE LITERATURE REVIEW
2.1 Introduction
This chapter will examine the Implementation of LC using the LPS in different
reigns of the world based on previous researches and existing literature. Firstly, the
key principles of lean construction will be explained. Secondly, the lean philosophy
of project planning will be discussed. Then, the chapter illustrates some scholars'
views about LPS. Finally, LPS essentials will be presented.
2.2 History of LC
2.2.1 History of Lean Production
According to Womack, Jones and Roos (1990), the term ―Lean Production‖ was first
introduced by John Krafcik of MIT International Motor Vehicle Program as a new
production methodology in which fever resources, manpower, manufacturing space,
engineering hours, tools and inventory warehouses are used in comparing to mass
production. Following Henry Ford‘s flow-based production management, which
covers advantages of both mass production and craft production, Japanese Toyota‘s
Engineers Ohna and Shingo have developed The Toyota Production System (TPS).
The main goals of TPS were customer satisfaction, zero waste, minimizing the
inventory and product perfection.
Lean thinking is focusing on the value of the product more than the administration
process (Howell, 1999).Lean thinking considers the entire project as one large

9
operation, on the other hand the current project management methodologies which
consider the projects as combination of activities.
The Lean production model focuses on the final value produced to the customer,
since the total cost and duration of the whole project are more significant than the
cost or duration of any single activity. Commonly, organization is talented by central
schedule while the work flow facts are achieved through the association by people
who are alert of and funding project goals (Howell, 1999). Value, material and the
program of information and materials to achievement are the key purposes of Lean
production theory.
In a production system, waste can be defined according to the performance criteria.
If the client‘s specific requirements are failed to be met, this is considered to be
waste. Waste can be diminishing by reducing the differences between the current
situation and the perfection (Howell, 1999).
2.2.2 Lean Construction (LC)
The term ―Lean Construction‖ was devised by Glen Ballard and Gregory Howell in
1990s of through implementation of Ohno‘s production system design criteria as a
standard of precision. Unlike the industrial where unalike parts are complete to
collect the final invention, designing and constructing a single project in highly
inexact situation under the compression of time and calendar is totally dissimilar.
Transformation of the Lean Production System (LPS) from concepts, into practice
has been initiated by many researchers (Womack & Jones, 1996).
LC is a project delivery system based on the perception of production management
10
warranting the reliability and speed of value delivery. In general, work on Lean
Construction is direct via two core concepts; Koskela‘s Transformation-Flow-Value
and Last Planner methods of production control by Ballard and Howell.
According to Koskela (2000), LC is based on two production theories: flow and
value. First, the flow concept emphasizes on the waste reduction. Second is the value
generation concept takes the value delivered to the customer into consideration. The
LC practices and methods based on both of these concepts are significantly diverse
from those based on the traditional transformation concept of production which
perceives production as transformation of inputs into outputs (Koskela L., 2000).
2.2.3 Lean Project Delivery System (LPDS)
Lean Project Delivery System (LPDS) is a construction management methodology
inspired by Toyota Production System (TPS), focuses on producing value without
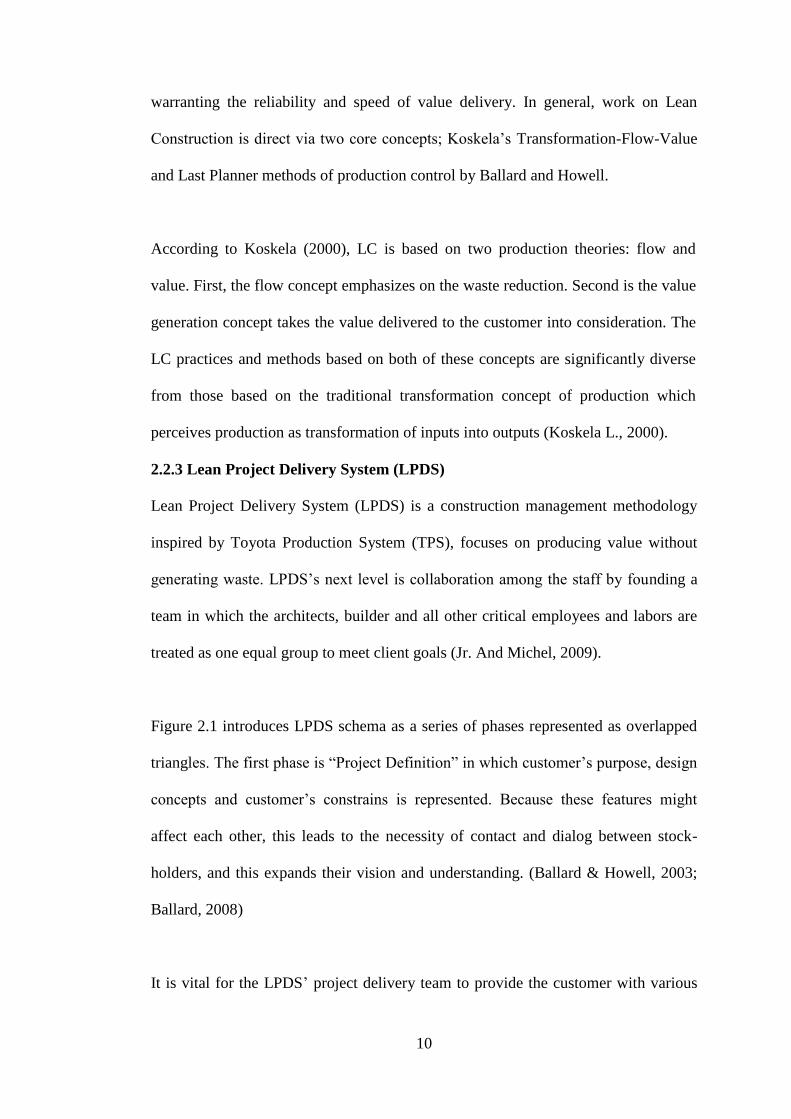
generating waste. LPDS‘s next level is collaboration among the staff by founding a
team in which the architects, builder and all other critical employees and labors are
treated as one equal group to meet client goals (Jr. And Michel, 2009).
Figure 2.1 introduces LPDS schema as a series of phases represented as overlapped
triangles. The first phase is ―Project Definition‖ in which customer‘s purpose, design
concepts and customer‘s constrains is represented. Because these features might
affect each other, this leads to the necessity of contact and dialog between stock-
holders, and this expands their vision and understanding. (Ballard & Howell, 2003;
Ballard, 2008)
It is vital for the LPDS‘ project delivery team to provide the customer with various

11
ideas and help the clients to decide what they require, then afford their needs. Once
the customers‘ purpose and constrains are recognized, it will be easier to introduce
alternative ways for accomplishing the required project apart from those methods
that have previously considered. Moreover, this process also helps clienteles to
comprehend the penalties of their needs.
Figure 2.1: Lean Project Delivery System
2.2.4 Fundamental Lean Principals
In the light of Lauri Koskela‘s work; the following list of principles are thought to be
important to Lean production (Diekmann, Krewedl, Balonick, Stewart, & Won,
2004):
2.2.4.1 Meeting Customer’s Requirements
The product quality which is required by the customer should be taken into
consideration. The production success depends on the customer satisfaction. As a
practical approach, the customer requirements should be determined and analyzed in
each production stage.

12
2.2.4.2 Reducing Non-Value Adding Activities.
Three fundamental drivers of non-worth included exercises are generally known:
1. Production framework structure, which recommends that the regulation of
physical stream can be restricted through information and material.
2. Production framework controlling means.
3. Production framework nature, for example, machine disappointments,
fortuitous events or blames or deserts.
2.2.4.3 Reducing Cycle Time
Process duration is the whole time required to finish a venture.
It can be arranged as:
1. Process duration = Processing time + checkup time + Waiting time + Moving
time The accompanying exercises have been distinguished to lessen process
duration:
2. Removing work in advancement (WIP).
3. Reducing the group size.
4. Changing the undertaking diagram to diminish the moving space.
5. Making the stuffs movement, smooth and synchronize.
6. Diminish changeability.
7. Untying the main value adding order from support activities.
8. Assembling the activities to flow in parallel order instead of consecutive
order to save time and budget.
2.2.4.4 Reducing Variability
It is believed that Variability increases cycle time; variability of activity period
supplements is including exercises. Here is some recommended variability lessening
methodologies:
13
1. Activity regulation, this can be performed through executing standard
methods.
2. Mistake-sealing techniques.
2.2.4.5 Increasing flexibility
It is crucial to expand the creation line ability to take care of the business sector
demand and alterations Stalk (1990), prescribes the accompanying exercises to build
the yield adaptability:
1. Minimizing the parcel size however much as could reasonably be expected to
coordinate the interest.
2. Reducing the operation and changeover inconveniences.
3. Modifying as late in the advancement as potential.
4. Providing Multi-gifted workforce preparing.
2.2.4.6 Increasing Transparency
To solve the detected mistakes fast and easily, it is crucial the entire flow operation
to be observable and clear for all those who involved in the project.
2.2.4.7 Maintaining Continuous Improvement
The operation and the project‘s management techniques should be improved
incessantly. These are some approaches which are considered to be critical for
continuous improvement:
1. Progression assessing and monitoring.
2. Expanding the target‘s setting in order to the problems and solves them.
3. Bountiful all staffs the development duty; fixed development should be
essential and satisfied from every separation within the association.
4. Applying standard methods as best practice plans in order to challenge
continuous improvement with better techniques.

14
5. Connecting improvement to control, improvement should eliminate the
present control restrictions and problems from the root rather than reducing
their influence.
2.2.4.8 Disentangling by Reducing Numeral of Stages, Portions and Connections
Difficulty causes waste and supplementary expenses. The process should be
restructured through fusing activities, using standard tools and materials in addition
to reducing the amount of required control information.
The following methods are considered to be practical approaches to simplifications:
1. Flows limitation through combining activities.
2. Changing the design to reduce the parts of the product.
3. Systematizing tools, material and other parts.
4. Spiriting linkages.
5. Minimizing there required.
2.2.4.9 Fixating Switch on the Comprehensive Procedure
For maximum movement control the focus must be on the entire process, and section
flow can be avoided since it causes to sub-optimization.
2.2.4.10 Adjusting Flow Improvement with Conversion Improvement
1. In order to create a balance with in the process both flow improvement.
2. And conversion improvement s should be analyzed individually. Never the
less they are interrelated.
2.2.4.11 Benchmarking
Benchmarking supports break though the improvement of the process through some
fundamental recon figuration.
2.2.4.12 Lean Construction Tools and Methods

15
The tools and methods applied to accomplish Lean Construction have been studied
by Salem et al. (2006) and Minkarah (2006) as shown in Table 2.1.
Table 2.1: Summary of the tools and techniques in Lean Construction
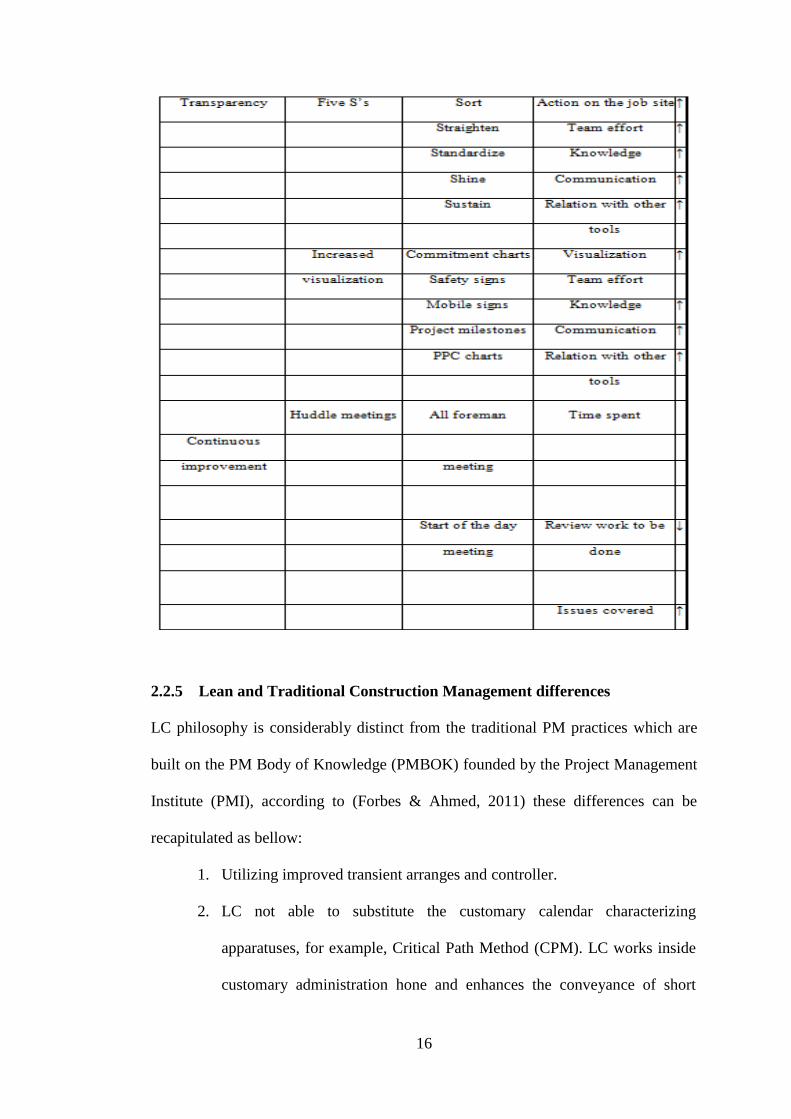
16
2.2.5 Lean and Traditional Construction Management differences
LC philosophy is considerably distinct from the traditional PM practices which are
built on the PM Body of Knowledge (PMBOK) founded by the Project Management
Institute (PMI), according to (Forbes & Ahmed, 2011) these differences can be
recapitulated as bellow:
1. Utilizing improved transient arranges and controller.
2. LC not able to substitute the customary calendar characterizing
apparatuses, for example, Critical Path Method (CPM). LC works inside
customary administration hone and enhances the conveyance of short
17
term.
3. LC believes that planning effectiveness should be restricted because of
the unplanned actions, which sometimes occur. Implementation of
arranged methods, embracing scheduling techniques, centering the short
term plans for instance, The LP is considered more effective.
4. The LC‘s concern is the value, while traditional PM‘s philosophy is to
focus on the schedule, and cost control.
5. Knowledge and flexibility enable LC to contract with indecision and
accidental activities especially in compound schemes, whereas CPM is an
estimation of completed also it is less real in managing the particulars of
the way that the work should be done.
6. In General, PMBOK works well with rather simple and expectable
projects; on the other hand LC is considered to be more effective.
2.2.6 Utilizations of Lean Ideas in Manufacture Industry
In an attempt to overcome the problem of accumulation of WIP, lean concepts might
be executed through on-site process visualization. This can be performed through
using status board generator software by drawing small icons that each one indicates
the work state as well as the future tasks. The status board helps the work supervisor
to assign the team effectively according to the nature of the work, which task needs
to be done first and which one requires to be ready on.
Furthermore, the status board is beneficial in progress monitoring and making the
project tutus data and information clear and available in all management stages.
Consequently computer aided visualization tools improve the workflow through
revealing the progress amount and the obstacles of the process Sacks, Treckmann, &
18
Rozenfeld, (2009).
2.2.6.1 Improving Labor Workflow in Construction
The influence of work flow as a lean principle on the labor work flow has been the
core of several studies. In 2003, a study involved 3 bridges construction in 137
working days, the flexible capacity method was chosen as a possible concluded that
incompetent labor flow results in ineffectual flow management (Thomas and et al,
2003).
Randolph et.al (2002) used data from 14 concrete framework project to conduct a
study to explore the issue of construction variability and its influence on project
performance; they found that decreasing the variability in labor productivity is more
correlated to better performance than declining variability.
2.2.6.2 Formwork Engineering
These enhancements are due to the fact that LC decreases the wastes caused by
walking and looking for mold assembly and machining.
2.2.3.3 Construction Projects
The aftereffects of actualizing LC strategies in a venture of building 80 lodging units
in Nigeria, demonstrated that time administration improvements lead to sparing
spending plan, following the undertaking was finished in 62 days rather than 90 days
(Adamu and Hamid, 2012).
2.2.6.4 Precast Concrete Fabrication
Executing incline ideas in development of precast cement lessen process duration,
and enhance the efficiency (Ballard, Harper, and Zabelle, 2003).
2.2.6.5 Infrastructure Projects
Lean techniques implemented in a study about tunneling project. The research‘s

19
results were increasing of the productivity by 43%, the project completed on time,
and the profits were doubled (Wodalski, and et al, 2011).
2.3 Wastes in Construction
2.3.1 What is Waste?
Waste is the unnecessary use of time, materials and energy. Koskela (1992) defines
waste as using more than the required amount of tools, materials and abilities in
production of a building waste often adds extra expense without increasing the value
of the final version of the product.
Tommelein(2015: ) supports Koskela‘s claim and states that:
‗‗In short, waste is anything the customer is not happy to pay for‖
However waste in construction contains many things, the majority of the studies have
focused only on the waste of materials. This is considered as one of the reasons that
affects the construction process and results in wasting many other things. One of
researches about material waste measurement is the study which – conducted by
Agopyan et.al. Formoso et al. (1999) summarized the main points as;
1. Some firms have ignored about the waste in materials, as they do not
apply a clear material management procedures to avoid waste in sites to
control the material usage.
2. Most of building companies are not aware about the waste amount, and
how to avoid it.
3. The main reason of waste in building construction relates poor planning
to the beginning such as, insufficient design, and deficiency.
20
2.3.2 Classifications of Wastes
The extent of unavoidable waste is various depending on the project‘s location,
organization and on the implemented technology.
Waste can likewise be considered by birthplaces, i.e. the stage in the system
associated with the main driver of waste. Normally waste is distinguished inside of
the generation stage; however there is the likelihood of having waste in prior stages,
for example, arranging, plan, supply, and preparing of labor.
By (1989), proposes that Waste can be ordered into seven sorts as indicated by its
temperament, the eighth waste sort is, – underutilized laborers' gifts - was presented
by Bodek (2007).
2.3.3 Underutilized People
It is essential to employee skilled people, but as Garret and Lee (2010) state
inefficient use of these people‘s mental and physical capabilities results in waste.
2.4 Lean Philosophy of Project Planning
Ballard (1994) states that planning more efficiently is one of the effective ways to
increase productivity, though reducing delays ,completing the job in the best
constructability order, connecting labors to available work, and organizing multiple
reliant activities, etc. . Planning and control are considered to be interrelated and
complementary processes in LC maintained during the project.
Planning constructs the strategies required to get to the project objectives. At the
same time, control pursuits that each event occurs according to the planned sequence,
in order to re-plan when the previously established arrangements are no longer
appropriate or convenient. When events go in a wrong direction, feedback will be
21
help full to get experience and making better plans in the future (Ballard 2000;
Howell 1999). Howell (1999) claims that control has been redefined from
―monitoring results‖ to ―making things happen.‖ A planning system‘s performance is
developed to promise dependable workflow and expectable project results. In Lean
Construction, planning and control are the two sides of a coin that spin during a
project:
• Planning: refers to standards for accomplishment and plan making for
reaching objectives.
• Control: Causes actions to be accordance with the strategy and endorsing
experience and re-planning.
Ballard (1994) believes that improved preparation is the result of overcoming
common obstacles in the construction manufacturing, including:
1. Organization focuses on controller, which avoids evil deviations; and neglects
innovation, which causes decent deviations.
2. Planning is considered to be the aids and aptitudes of the people who are
responsible of planning rather than to be a system.
3. Planning consists of scheduling, in the first place while crew level planning
takes the secondary concern.
4. Planning scheme presentation is insignificant.
5. Analyzing arrangement letdowns and solving the problems from the root is
neglected.
The LPS which is known as one of the best techniques which has been confirmed to
be a beneficial tool for the construction process management, and continuous
22
observing of the planning effectiveness.
The LP includes; master plan, level planning, look-ahead planning, weekly work
planning (WWP), Percent Planned Complete (PPC) and reasons behind
incompletion, Systematically implemented last planes brings several advantages and
adds benefits to overall construction management and planning practice in particular.
2.5 Key Principles of LC
According to Womack and Jones (1996) following five key principles are vital for
any LC system.
1. Value: The customer‘s requirements should be clarify in order to indicate
activities or products that improve the value.
2. Value Stream: The construction process can be developed through planning
the entire value stream, forming collaboration among participants,
recognizing and reducing waste.
3. Flow: Business flow contains project data (specifications, agreements,
strategies, etc.). Job site flow includes the activities and the way that these
activities should be managed.
4. Supply flow: refers to all the constituents which are used in a project.
5. Pull: The participants‘ efforts stabilize pulls throughout the construction
procedure.
6. Perfection: Includes work guidelines, procedures and quality controls.
2.6 Last Planner System (LPS)
Ballard (2000) and Howell (1999) developed the LPS as a construction planning and
control system in order to reduce variations in construction work flow, improving
future planning, and eliminating construction operation uncertainty.
23
At the beginning the system experienced variations in workflow at the WWP stage,
and then it was prolonged to shelter the whole planning and schedule improvement
process from master planning to phase planning through Look-ahead Planning (LAP)
and WWP.
As a lean tool, LPS suggests:
1. Planning in more detail as it is time to perform the work,
2. Improving the work plan through consultation with the project performance
team.
3. Team working, to remove work constrains, complete the work and increase,
and work plans‘ reliability.
4. Making reliable promises completing the work based on collaboration and
negotiation with the project contributors.
5. Catting experience from planning failures, solving the problems‘ root causes
and preventing their repetition (Ballard, 2000; Ballard et al., 2007).
Figure 2.2 shows the LPS planning processes with different sequential spans: master
scheduling, phase scheduling, look-ahead planning, and weekly work planning.

24
Figure 2.2: Planning Stages / Levels in the LPS
The master schedule is the product of front-end planning describes the works that
should be carried out over the duration of a project
Commitment planning refers to the most thorough plan in the system representing
interdependence among the various work specialist organizations. It directly governs
the production produce. When each plan period finished, the work is reviewed to
measure the reliability of the planning and the construction system. Examining the
reasons of plan failures and solving the problems are significant for continuous
improvement Ballard, (2000).
2.7 Should-Can-Will-Did Analysis
Decisions regarding concerning the work order according to the time and used
resources and methods are made at every phase of the process, and occur throughout
the project, which eventually leads the designers to produce assignments that direct
physical production. The ―last planner‖ is the last in the process because the
production of planning process is not directed for a lower level planning procedure,
25
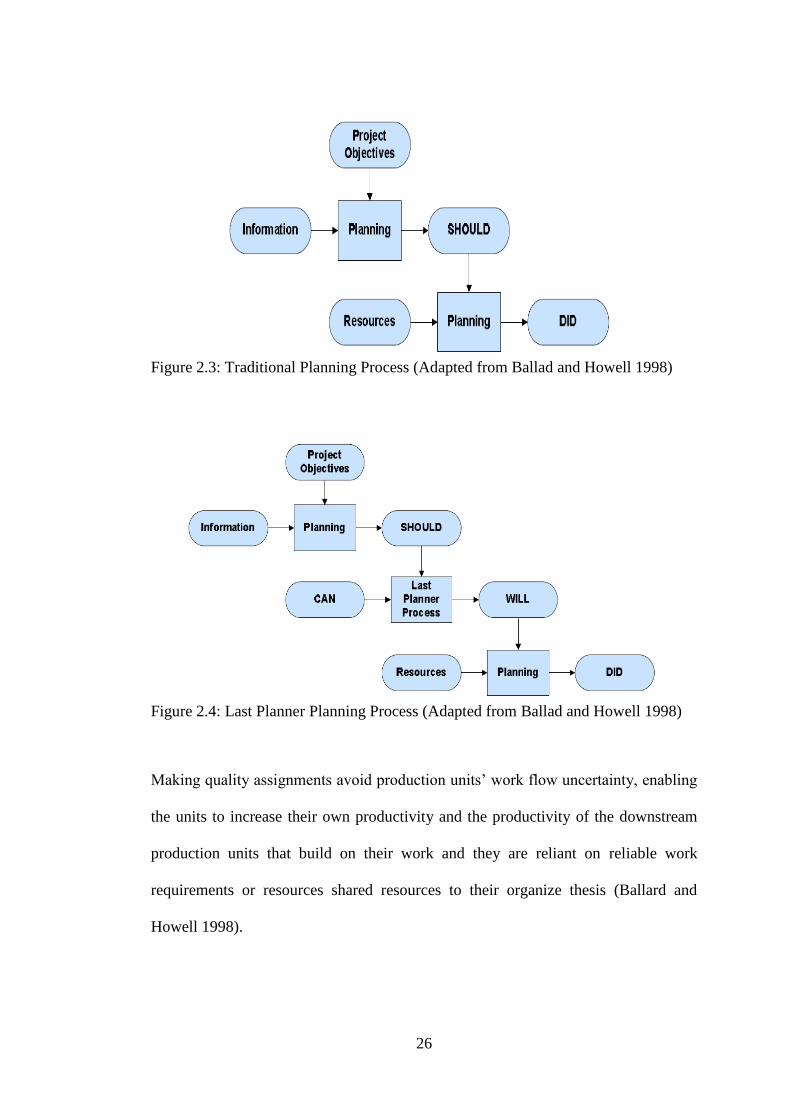
and the production results are shown in Figure 2.3 (Ballard and Howell, 1998).
Stabilizing the work environment though imitates learning to make and maintain
commitments. Last planners can be predicted to make commitments (WILL) to doing
what (SHOULD) be done, only to the point that it (CAN) be done. Demonstrating
this as a rule might be: Selecting assignments from feasible accumulation; i.e. from
activities that can be done.
LP provides the field only with only workable jobs, the traditional practice (Figure
2.4) pushes assignments on construction team and design body in order to complete
the job on scheduled dates. In addition to looking ahead and indicating future tasks
for constraints, assignments are also anticipated to encounter the exact feature
requirements for definition, order and size. Furthermore, mistakes still occur, for this
purpose the control system is designed in a way that promotes learning from plan
failures, and avoiding repeating the same mistakes.
26
Figure 2.3: Traditional Planning Process (Adapted from Ballad and Howell 1998)
Figure 2.4: Last Planner Planning Process (Adapted from Ballad and Howell 1998)
Making quality assignments avoid production units‘ work flow uncertainty, enabling
the units to increase their own productivity and the productivity of the downstream
production units that build on their work and they are reliant on reliable work
requirements or resources shared resources to their organize thesis (Ballard and
Howell 1998).
27
2.8 LPS Essentials
The LPS essentials can be categorized to:
2.8.1 Milestone Schedule
The milestone schedule expected to divide the project into logical stages. The
duration should be appropriate for those who are in charge of the project in order to
complete the planned work confidently. Establishing convenient duration possibly
requires improvement of a more thorough CPM, and negotiation and investigation
with the project‘s producers, designers and constructions.
2.8.2 Pull Schedule (Baseline Schedule)
1. It is all the team members‘ responsibility to complete the work which is the
milestone in improving the Phase Pull Schedule (PPS).
2. Face to face discussion develops PPS which establishes context, delineates
the milestone deliverable, improves an implemented strategy, classifies tasks
and arranges them in a pull plan working from the end of the phase back.
3. All chores on the PPS should produce a deliverable defined which suits and
accepted by the customer.
4. PPS completes when the team members approve the hand-off criteria
between activities, order and timing of the work. The team members feel
confident because they have access to sufficient resources and time
accomplish the activity also have identified long lead supplies.
2.8.3 Look-ahead Plan (LAP)
1. Activities in the PPS well-known tasks in the 6 Week Look-ahead Plan
(6WLAP) each week.
2. Keeping the record of the linkage concerning tasks in the LAP and PPS
activities.
28
3. Sub-tasks can be formed and connected to tasks in the LAP. The hand-off of
work between trades is usually established in PPS level tasks. Sub-tasks are
typically accomplished within each task.
4. Tasks and sub-tasks are deliverables.
2.8.4 Identifying Constraints
1. Constraints are the directives, resources and required work which are required
to begin and complete the tasks but not shown on the PPS.
2. The connection between constraints and tasks will be sustained.
3. Tasks (and sub-tasks) on LAP are screened for constructions by the
responsible people and at least when assigned to LP.
4. That who are in charge of the tasks removes those constraints within their
authority or ask for help from shoes who beyond their authority.
5. The constraint log present the task‘s condition in workflow loop in terms of –
declined, approved, in negotiation, guaranteed, in progress, or completed.
6. The LAP (and possibly the PPS) is various in responding to constraints that
are irremovable by the time required.
2.8.5 Preparing Weekly Work Plan (WWP)
1. The tasks in the WWP should be in the 6WLAP and connected to PPS.
2. WWP should include only tasks that are ready to be executed, which means
that all their constraints have been removed. The LP is assured that any
remained tasks, the site and the staff will be available whenever required.
3. Occasionally, tasks which are not in a ready condition may include in WWP
even though the LP is unconfident that they can be completed. In this case, it
is required to notify to next LP that the mission might not be delivered.
4. Assignments on the WWP are sized for daily accomplishment. Larger

29
assignments could be made however this is impractical, because the work
spans several days and it is difficult to establish.
5. The tasks should be inspected in WWP before the crew starts their job.
Figure 2.5: Weekly Planning and Execution Cycle
2.9 Chapter Summary
In this chapter based on comprehensive literature and scholars view the general sense
of the concept of LC and its key principles, lean philosophy of project planning, LPS
and its essentials in adding to should-can-will-did analysis have been presented.
Moreover, the levels of LPS were briefly discussed and additionally, a clear
comparison between the traditional planning process and LP process were
established.
30
Chapter 3
RESEARCH METHODOLOGY
3.1 Introduction
This chapter illustrates the empirical research and explains the utilized practice in
this study such as, questionnaire, interviews, and case study, the advantages and
details indicating these methods. Furthermore it demonstrates the research questions
and their assumptions, the applicants of the study, the statistics and data collection
method and analyses.
3.2 Research Questions
Through a survey conducted among Kurdish engineers, contractors and
subcontractors following a case study conducted by the researcher, this research
intended to find what are their viewpoints about LC using LPS in Northern Iraq (NI)
construction industry. Based on the literature review presented in earlier chapters and
researches some questions were outlined to comprehend the participants' opinions.
These responses will be evaluated and analyzed under the theoretical studies
guidance in Chapter two.
In this section the demands are categorized into three dissimilar groups:
3.2.1 What are the Causes of Waste in Construction Industry?
This question deals with waste factors.
Which factors affect waste?

31
What should be done to reduce waste?
It is expected that the gap between two activities, unnecessary movement of
materials and workers, lack or inefficiency of the equipment, unskilled employees,
poor management and lack of communication among the staff and other people who
are connected with the project are amongst the fundamental factors that may cause
waste.
Moreover, it is predicted that Government, new project management, tools such as
LPS, increasing the awareness, and discussing the ideas with the employees can
support actions and contribute in reducing waste.
3.2.2 At which level has LC and LPS implemented in NI?
This question deals with the existence of LC in construction industry in NI:
Are there many factors that cause waste in construction, and is it necessary to
take an action to improve construction industry in the NI through using up-to-
date methods?
What is the benefit of WWP and PPC in construction industry?
Depending on the viewpoint that NI is one of the third world countries, there might
be a very little information about LC. It is expected that LC has not been
implemented in NI, and due to this there are many factors that contribute in
increasing waste. Also it is expected that contractors, engineers and sub-contractors
imply different ways to reduce waste rather than implying LC using LPS.

32
3.2.3 Is it appropriate to implement LC in NI in the future?
Concerning to this demand, the participants are inquired to response more precisely
the following questions:
What is the CSF for implementing LC in NI?
What are the main difficulties faced by the companies during the
implementation? And what are the factors that promote the implementation of
LPS.
Depending on the participants' experience, this question intended to find out to what
extent they desire this method to be implemented in construction industry in NI in
the future. However, it is expected that the participants may have very limited
information about LC and LPS but they might like the idea and the approaches to be
executed in the future.
Additionally, since NI is trying to develop, executing new methods is one of the
indispensable steps to take. For this reason, evaluating experienced people's
involvements, assessing the problems faced by the companies, and taking the
participants‘ views about Critical Success Factors into consideration are crucial as
well.
3.3 Participants
The participants of this survey like Sekaran introduces them 'population' are Kurdish
contractors and engineers that the presently working on construction projects in both
public and private sectors.

33
The main cause behind choosing these people is that they have knowledge about the
construction industry and they might have enough information which enriches the
study.
3.4 Sample Size
Indicating an appropriate sample size to be investigated is one of the most difficult
parts of the studies because it requires cautious consideration. The sample size
should be chosen wisely since a small model cannot represent a dependable data at
the same time large sample size consumes both the researcher and the participants'
resources and time. The scholars claim that the sample size determination might be
influenced by:
The extent of the participants' wish to take a part in the research.
The extent of data risking because of some factors, such as, confidence.
The available resources for the researcher. for instance, the essential
technology, time, and size of participants.
Also Dornyei (2002) asserts that, a proper data and results are the result of a proper
sample size nevertheless often it might require more time and effort.
60 male and female participants received the questionnaire. Some of the participants
were handed the questionnaires directly whereas the others due to the distance,
received it through email. 52 of them completed the questionnaire and returned it on
time. Then, four of them participated in the interviews and the fifth one was a group
interview. Furthermore, one case study has been included. The reason for choosing
this sample size was, this number is handy to manage, most people are busy and they
might unavailable or uncooperative and there was not any available data about how
34
many construction companies or engineers are in NI. Also due to the countryside of
the content and the investigation topic, Google form was used and certain people
were chosen to participate instead of using new technology such as 'Survey monkey'
to make sure only those who are connected with construction industry complete the
questionnaire.
3.5 Research Tool
Both qualitative and quantitative methods have been used. Based on McDonough
and McDonough (1997) researches, questionnaire, interviews and case study were
the key tools that have been used in this investigation. All the data was collected
from the applicants' knowledge throughout working in construction sites in the NI.
A 'mixed method' as Lund (2012) calls it, has been chosen because none of them is
superior to the other, and both offer different benefits, as was emphasized by Burns
(1999).
As Marshal and Rossman (1999) state that qualitative study offers more information,
the reasons for choosing specific answers, as well as the respondents‘ opinion of
certain experience. Whereas quantitative method which refers to questionnaire in this
research supports the researcher to collect more data about various issues in a shorter
time (Cohen et al., 2000). In other words although, questionnaire includes many
questions about different issues, the respondents may not feel free in answering
them. Also it is possible to investigate and implicate people from diverse geographic
areas and it is easy to analyze the data through using technology and computer
software packages, for example, Microsoft office and Excel.

35
Eventually, to avoid being biased, Likert scale or multiple choice questions were
used because the researcher has no role in affecting the participants' view and all the
nominees reply the same questions under the same conditions (Seliger and Shohamy,
1989).Furthermore, in the first section some questions had 'others' as an option in
order to participants write their answers if it was different from the options.
One more point is that questionnaires have some as disadvantages as well as
advantages as Dornyei (2003) and Bell (2002) suggests the researchers‘ duty to
design the questionnaire and examining the data carefully. For instance the
respondents may choose an answer or agree to a statement to satisfy the researcher.
Another drawback is the low return rate. Respondents might forget about the
procedures and overlook shelve them.
3.6 The Purpose and Content of the Study
Almost all the questions reflect the content of the study also selected are connected
to participants' basic evidence. Based on some earlier studies and researches in
different reigns in the world, in addition to the researcher's experience as an engineer
in NI, some new questions were designed to be appropriate to the content and the
new context of the study.
The aim of this study is to answer the research questions and explore the experience
of the LC method using LPS implementation in NI and its success rate in the future.
3.6.1 Piloting the study
Piloting is one of the significant steps of any study because it assists the researcher to
get more information from the participants to design more relevant question and
suitable options to improve the questionnaire before releasing it. Likewise, it helps to

36
make the questionnaire appropriate according to the devoted time, environment and
sometimes the political and the economic situation of the country in which the
researcher conducts the study. Hedrick et al. (1993) asserts that piloting facilitates
testing the whole procedure, such as, indicating the time which is wanted to ample
the survey and designing clear and comprehensible questions for the candidates.
Also, Oppenheim (1992: 47) claims that in each study aspect should be examined
previously in order to make sure that it matches the researcher‘s. Brown and Rodgers
(2002) support Oppenheim and assert, "That experimental education is a vital
component of a reliable education". In addition Dornyei (2002) points to the
significance of experimental education and state that removing this stage of any
study may affect the validity of the outcomes.
Based on the views expressed previously by different academics, the researcher
piloted the education with some people. They gave useful feedback to recover the
survey. For instance, a participant recommended adding "do you have experience
with the LPS". Taking their feedback into consideration, the researcher edited some
of the options as well. Also after consulting with the research supervisor, question
number eight which deals with the factors that stimulate the implementation of the
last planner factors has been added in addition to a case study. The required time to
fill the survey was from 12-18 minutes whereas for the interviews the period was
diverse between 17-32.
3.6.2 Interviews
It had been noted that the interviewee was trying to give an academic speech instead
of answering the questions specifically. The respondent was trying to modify

37
answers whereas the content was neglected. So the researcher changed the strategy,
instead of interviewing in English the interviews were conducted in 'Kurdish' to
avoid embarrassing those who do not know English and make the interviewees feel
more confident and realize that the content of their answers is important not the
academic words that they use.
The interviews were approximately about 25 minutes extended. The talks were
arranged in various places; the participants' home and their workplaces. Additionally,
the first question for all the interviewees was 'Do you mind if your answers are used
for research purpose anonymously?' and all the interviewees gave their approval.
Moreover, it is worthy to mention that in spite of using the same questionnaire, the
talks were semi-structured because sometimes both the researcher and the evaluator
were going into more detail. As Berg (1989) asserts, when the interviewees were
given choice to answer, they give more accurate answers. All the talks were detailed
and then analyzed by the researcher.
3.6.3 Case study
Case study is a useful tool to study a topic in further detail. As Zainal (2007:5)
suggests, "Case studies are well-thought-out useful in the study as they enable
researchers to inspect data at the micro level". The case study in this research will be
presented according to the research supervisor's suggestion in order to enrich the
research and study the subject in further detail and within a specific context. This
case study is the researcher's personal experience of LC using the LPS in a building
project in the NI during doing a research as a final requirement of postgraduate
study. The researcher executed his knowledge about LC using LPS in that project
38
because of his admiration of this system and being aware of its advantages. This
experience's results and outcomes will be analyzed in chapter four and the schedule
will be presented in appendix.
3.6.4 Content of the Questionnaire
The questionnaire was designed by using Google forms. Also most of the closed end
questions were designed with four points rating scales. It was believed that a good-
looking survey may encourage the contributors to response all the queries luckily.
Based on this idea and the investigation inquiries, the questionnaires' items were
gathered:
The participants' general information was the first section of the
questionnaire. For instance, gender, age, their job position, the organization
they work for and the length of their experience in construction industry.
However NI is a developing country and there are few construction
companies operating in the sector, but the participants fulfilled the conditions
required for the survey.
The second section was about LC and the LPS to find out if the participants
have information about implementation of this method because it is a new
method especially in the NI. In this section the participants were asked to stop
completing the questionnaire if they are unfamiliar with this method.
The third part was structured to investigate the causes of waste and the ways
to reduce it in addition to implementation of LC and the LPS.
All the items were grouped as it was mentioned before and every group was followed
by some sub-divided questions. Most of the questions had four thinkable answers
which are reached from No effect, Low effect, Medium effect (Mid effect), and
39
Large effect; strongly disagree, disagree, agree, and strongly agree. Also some
questions are multiple choice questions with different options.
Finally, the questionnaire has structured to cover only relevant questions to the
content of the study.
3.7 Data Collection and limitations
A challenging process of this research cause of various places where the participants
live or work in, and lots of them were exciting with their job. 23 of them had filled
out the hard copy of the survey and they were agreed the casual to ask for
clarification of any confusion while 37 nominees received it via email. The overview
section was including the academic's email and telephone number so the respondents
could communicate if they confronted with any difficulties concerning thoughtful the
content of the questions. From those 37 surveys and after one week days only 29
finished forms were returned back. Two of them were detached because one of the
respondents left two of the inquiries unrequited and the other one left the information
blank.
3.8 Data analysis
After collecting all the accomplished surveys, the outcomes were computed and
analyzed by means of using Excel software. In addition to the questionnaires'
analysis, the interviews were analyzed and explained by the researchers in data
analysis chapter respectively.
3.9 Summary of the Chapter
This part acquired the exploration questions and speculations, the candidates and the
sample size, and the system which is used in this survey study, for example, survey,
contextual investigation and meeting. Furthermore, steering the study was another

40
subject which has been introduced. Moreover, this section secured the information
gathering methodology and examination. The following part will display the usage of
this procedure in an observational study in the NI and its discoveries notwithstanding
their connection with the hypothetical segment of the exploration.
41
Chapter 4
RESULT AND DISCUSSION
Depending on the case study, questionnaires and the interviews, this chapter presents
the findings of the study. Following a case study to implement LPS by the researcher
50 candidates completed the questionnaire and five of those participants participated
in the interviews which one of them was the group interview. According to the
questionnaire's format the results are divided into three categories. It was decided to
go through each question separately because it was noticeable this may contribute in
better understanding of the participants' viewpoint and knowledge about LC using
the LPS.
1. The first classification is general information about the participants.
2. The second type deals with the outcomes of the participants'
knowledge about LC using the LPS.
3. The third category deals with the results of the causes of waste, the
ways to reduce it and the effects of the LPS in reducing waste.
4.1 Section One: Practical Study Findings and Discussion
4.1.1 The case study
4.1.1.1 The Project
The LPS was implemented in a governmental construction project. The project is
(Raniyah 132/33/11 KV Substation building) located on the Kurdistan Region of
Iraq, having a projected contract value of 543,145.76 US Dollars. The opportunity of
the project complex construction of 2 multi-story building with 200 m² garden and a
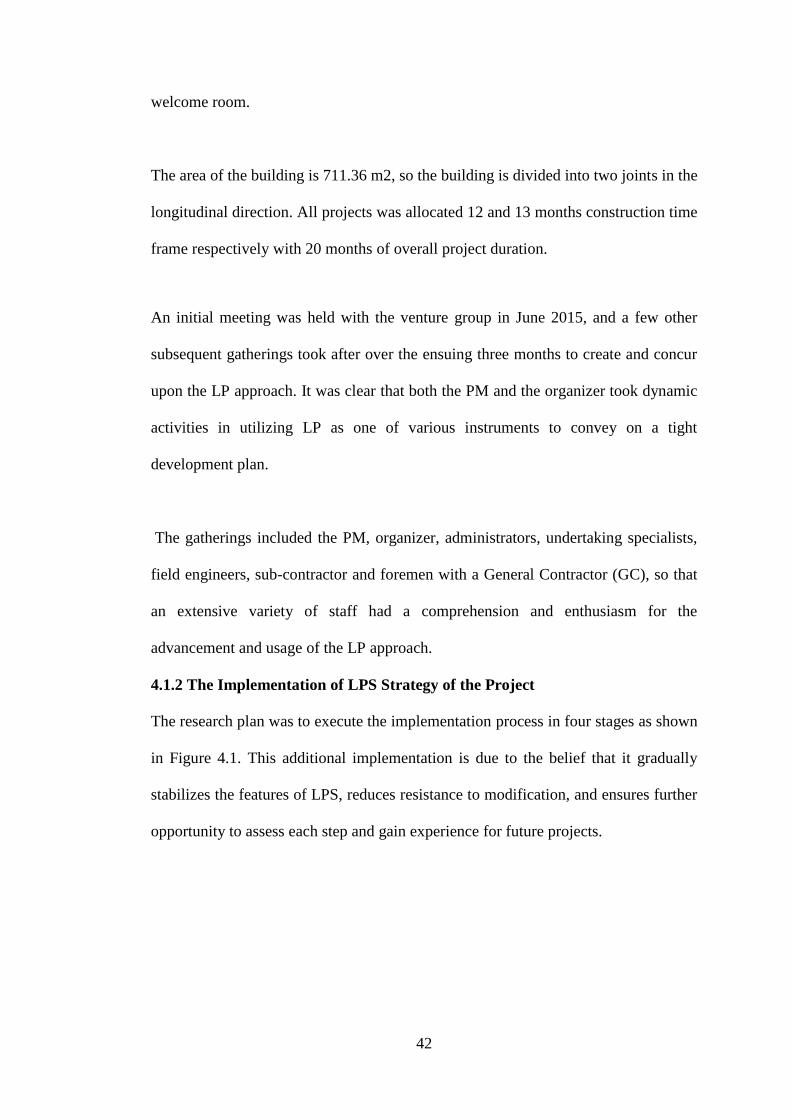
42
welcome room.
The area of the building is 711.36 m2, so the building is divided into two joints in the
longitudinal direction. All projects was allocated 12 and 13 months construction time
frame respectively with 20 months of overall project duration.
An initial meeting was held with the venture group in June 2015, and a few other
subsequent gatherings took after over the ensuing three months to create and concur
upon the LP approach. It was clear that both the PM and the organizer took dynamic
activities in utilizing LP as one of various instruments to convey on a tight
development plan.
The gatherings included the PM, organizer, administrators, undertaking specialists,
field engineers, sub-contractor and foremen with a General Contractor (GC), so that
an extensive variety of staff had a comprehension and enthusiasm for the
advancement and usage of the LP approach.
4.1.2 The Implementation of LPS Strategy of the Project
The research plan was to execute the implementation process in four stages as shown
in Figure 4.1. This additional implementation is due to the belief that it gradually
stabilizes the features of LPS, reduces resistance to modification, and ensures further
opportunity to assess each step and gain experience for future projects.
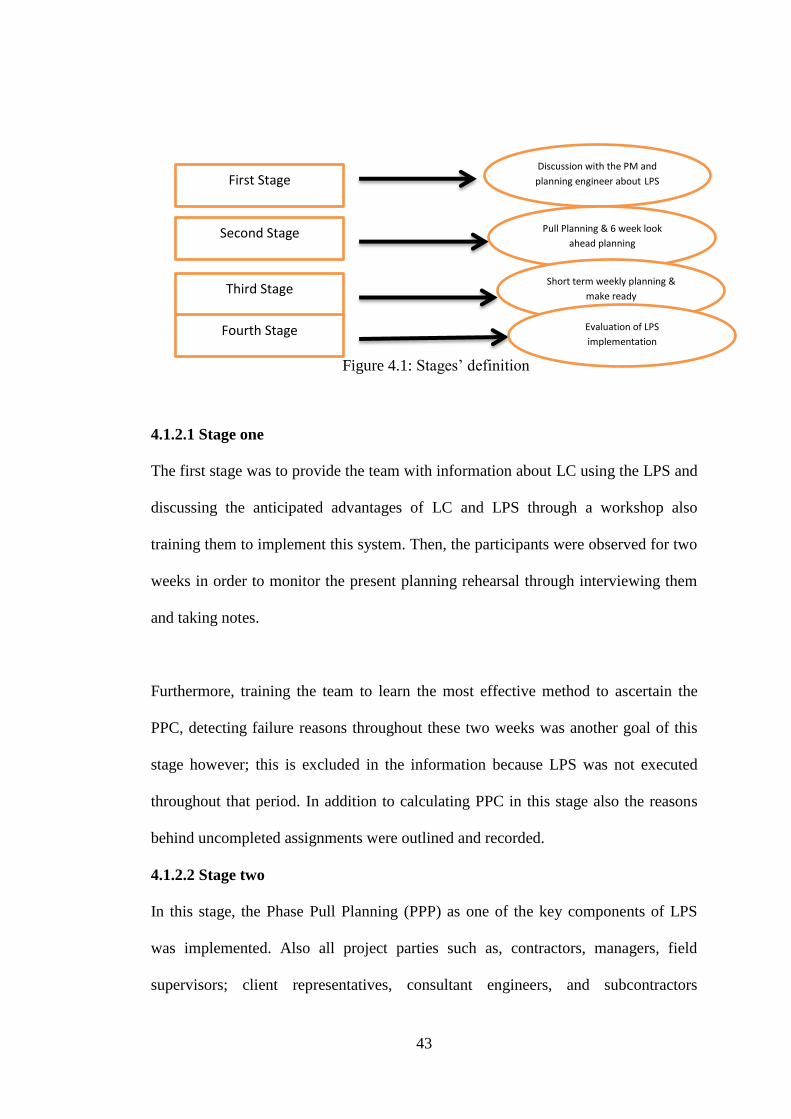
43
Figure 4.1: Stages‘ definition
4.1.2.1 Stage one
The first stage was to provide the team with information about LC using the LPS and
discussing the anticipated advantages of LC and LPS through a workshop also
training them to implement this system. Then, the participants were observed for two
weeks in order to monitor the present planning rehearsal through interviewing them
and taking notes.
Furthermore, training the team to learn the most effective method to ascertain the
PPC, detecting failure reasons throughout these two weeks was another goal of this
stage however; this is excluded in the information because LPS was not executed
throughout that period. In addition to calculating PPC in this stage also the reasons
behind uncompleted assignments were outlined and recorded.
4.1.2.2 Stage two
In this stage, the Phase Pull Planning (PPP) as one of the key components of LPS
was implemented. Also all project parties such as, contractors, managers, field
supervisors; client representatives, consultant engineers, and subcontractors
First Stage Discussion with the PM and
planning engineer about LPS
Second Stage Pull Planning & 6 week look
ahead planning
Third Stage Short term weekly planning &
make ready
Fourth Stage Evaluation of LPS
implementation

44
participated in two weekly meetings.
In addition to implementation of the WWP and Make Ready, another crucial
component of LPS, LAP was applied as well. In the case study project, LAP
planning was a unified six-week window. It was removed from the Master Plan (MP)
of a project and then synchronized in the LP. Likewise, for the phase planning
sessions were held in order to deliver certain objectives and afterward worked
reverse from the objective accomplishment date to accomplish the intended signs.
Respectively the sessions were respectively devoted to certain categories of
activities.
Based on the durations calculated previously for each item, the project plan was
preparing by using MS Project & Primavera. And also the proceedings of activities
were based on our engineering experience.
LP prepared major milestones for diverse activities and then the participants worked
backward to attain target achievement date of these goals. The procedure was
performed through posting activities on the wall, later changed to detailed Gantt
chart by the company planner using MS Project and Primavera P6 for the building
construction of the project as shown in Figure 4.2 and Figure 4.3.
Figure 4.2: PPC by MS project

45
Figure 4.3: Primavera & PPC
All main subcontractors; i.e., mechanics, electricians, plumbers, architectures, and
fire bridges attended these sessions which were planned two months earlier than the
actual origination of project. Also key workforces such as, owner, designer and
general contractor participated these meetings, too and were informed with a review
of the procedure. The subcontractors' responsibility for pulling out period and
accurate sequencing of construction activities were distinguished through color
coded system. Figure 4.4 and Figure 4.5 are the photographs taken during PPS
sessions held at the contractors‘ office.
Figure 4.4: Coordination of Construction Sequence on Billboard

46
Figure 4.5: Outcome of PPP Meeting
4.1.2.3 Stage three
Third stage was the longest stage. Applying LPS on location was aided by the
researcher and it was proofed that PPC and explanations behind uncompleted tasks
can be founded and noted on a week after week premise for twelve weeks dated. It
was an effort to assist the group to see how the LPS added to the developed the
proses of planning. In this stage, the emphasis chiefly was on fleeting arranging and
Make Ready and LAP increased little consideration.
Weekly meetings in this stag had their importance and participation of all plan
gatherings (subcontractors, constructors' side, and customer legislatures). This stage,
PPC and details behind uncompleted responsibilities were composed at the end of
seasonal and start of fall period in the NI. At his period of the year, the maximum
fever is generally noted, and in 2015 in the day time it reached 112 Fahrenheit
degrees.
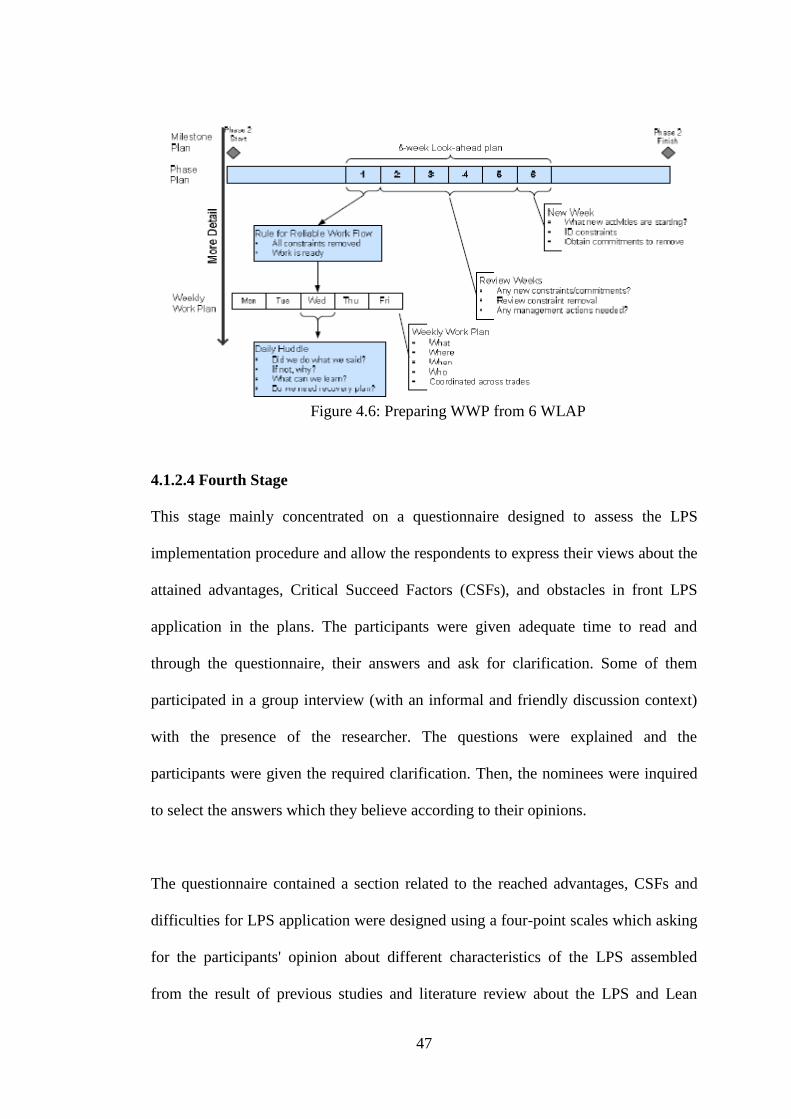
47
Figure 4.6: Preparing WWP from 6 WLAP
4.1.2.4 Fourth Stage
This stage mainly concentrated on a questionnaire designed to assess the LPS
implementation procedure and allow the respondents to express their views about the
attained advantages, Critical Succeed Factors (CSFs), and obstacles in front LPS
application in the plans. The participants were given adequate time to read and
through the questionnaire, their answers and ask for clarification. Some of them
participated in a group interview (with an informal and friendly discussion context)
with the presence of the researcher. The questions were explained and the
participants were given the required clarification. Then, the nominees were inquired
to select the answers which they believe according to their opinions.
The questionnaire contained a section related to the reached advantages, CSFs and
difficulties for LPS application were designed using a four-point scales which asking
for the participants' opinion about different characteristics of the LPS assembled
from the result of previous studies and literature review about the LPS and Lean
48
Construction in chapter two in addition to, the notes taken during the researcher's
involvement in the implementation the method. See Appendix - A for the survey
questionnaire.
4.1.3 Weekly Percent Plan Complete (PPC)
In the first week the project's PPC gradually rose from 60%, peaked at 88% in the
fourth week, and after 12 weeks it reached 83%. The project's average PPC was 73%
compared to 62%.
Ballard (2000) defines PPC as, a degree of workflow dependability and it is
measured by separating the amount of completed near-term assignments completed
by the overall number of assignments designed for the plan period.
Required data for PPC control are ―in the sum of assigned tasks and the number of
completed tasks‖. They are acquirable from the project foremen and engineers
without any extra time, effort or additional monitoring such as resource consumption
which is necessary for this measurement.
The researcher played as a facilitator during implementing LPS over thirteen weeks
period at a building project, in addition to collecting data for PPC ratio's peer review.
The collected weekly data from the field was analyzed and computed in three
different PPC ratios. Each of these ratios shows a different layer of contractor's
weekly plans reliability compared to the 6WLAP and the standard schedule or PPS.
The following steps are the detailed process used to gather and analyze the data,
which were achieved during the weekly sessions with the subcontractors:
49
1. Study the model schedule and excerpt the activities that should be executed
during the following weeks. The SHOULD list of work assignments was
generated in this step.
2. Study the monthly schedule and excerpt the activities that should be
performed during the following weeks and taking the resource and space
availability into consideration. This step produced the ADJUSTED SHOULD
list of the assignments.
3. This step represents the WILL list. It is planned to study the project
supervisor's intend to improve the work list assignments for the following
weeks taking other factors into consideration such as, the quantity of
resources and space availability, in addition to shop drawings status.
4. Monitor the definite implementation of work items covered in the WILL list.
5. Discussion among the project superintendent and engineers about the work
completed during the week generated in the WILL list for the succeeding
week (step 3). The below items were reviewed in the weekly sessions:
a) Include the Percent Complete (PCT) of each activity that the
contractor worked on during the week has just ended of the WILL
assignments.
b) WILL activities within a PCT more than 50% in PPC calculation are
given 1 as a value while the activities with less than 50% are given 0.
This random evaluation represents a key departure from LPS
definition (a value of 1 for 100% PCT and otherwise 0),
c) Evaluate and plan the PPC ratios for the ended week based on the
definitions of Table 4.2.
d) The activities that assigned a value of 0. I.e. uncompleted WILL
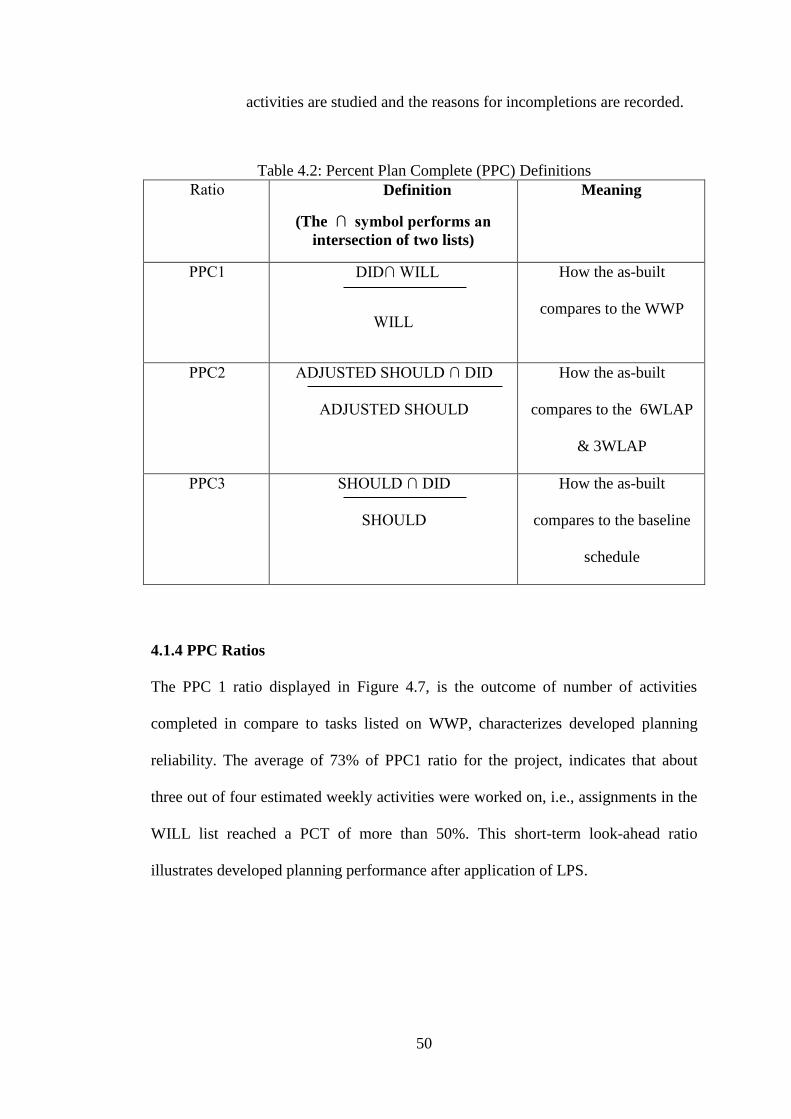
50
activities are studied and the reasons for incompletions are recorded.
Table 4.2: Percent Plan Complete (PPC) Definitions
oitaR Definition
(The ∩ symbol performs an
intersection of two lists)
Meaning
CCPP DID ∩ LIWW
LIWW
How the as-built
compares to the WWP
CCPP DID ∩ DDUJTS D TSUJWD
DDUJTS D TSUJWD
How the as-built
compares to the 6WLAP
& 3WLAP
CCPP DID ∩ TSUJWD
TSUJWD
How the as-built
compares to the baseline
schedule
4.1.4 PPC Ratios
The PPC 1 ratio displayed in Figure 4.7, is the outcome of number of activities
completed in compare to tasks listed on WWP, characterizes developed planning
reliability. The average of 73% of PPC1 ratio for the project, indicates that about
three out of four estimated weekly activities were worked on, i.e., assignments in the
WILL list reached a PCT of more than 50%. This short-term look-ahead ratio
illustrates developed planning performance after application of LPS.
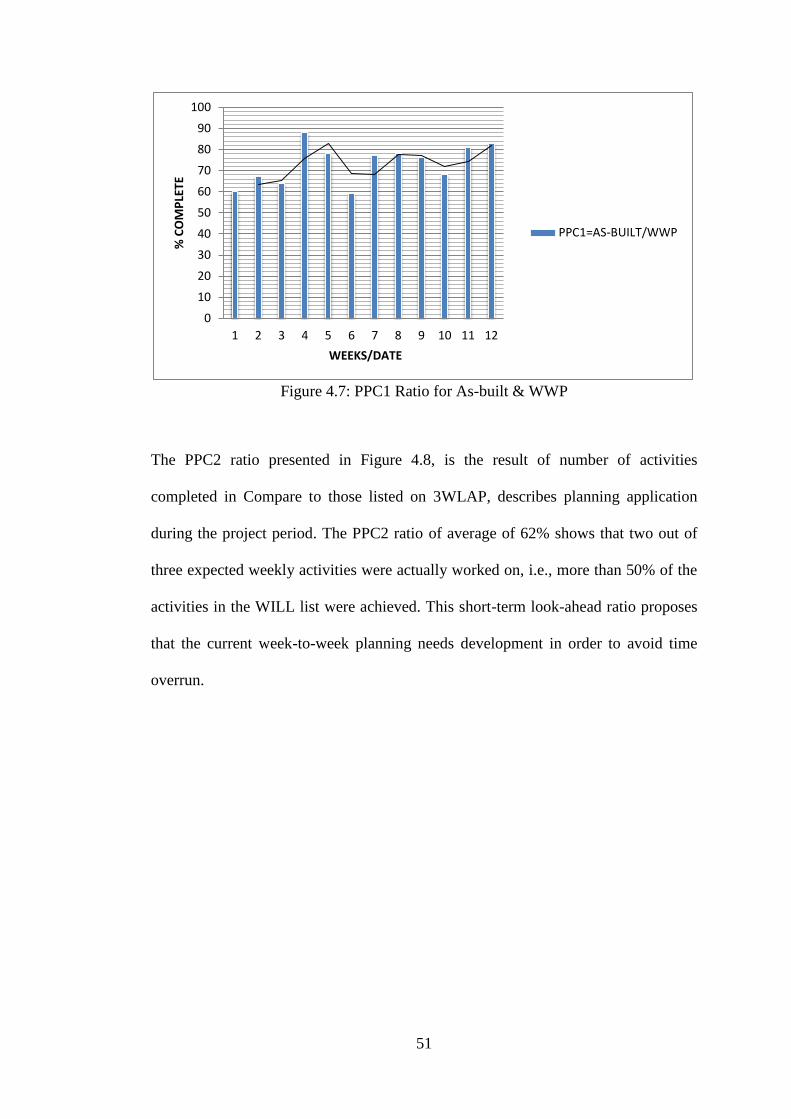
51
Figure 4.7: PPC1 Ratio for As-built & WWP
The PPC2 ratio presented in Figure 4.8, is the result of number of activities
completed in Compare to those listed on 3WLAP, describes planning application
during the project period. The PPC2 ratio of average of 62% shows that two out of
three expected weekly activities were actually worked on, i.e., more than 50% of the
activities in the WILL list were achieved. This short-term look-ahead ratio proposes
that the current week-to-week planning needs development in order to avoid time
overrun.
0
10
20
30
40
50
60
70
80
90
100
1 2 3 4 5 6 7 8 9 10 11 12
% C
OM
PLE
TE
WEEKS/DATE
PPC1=AS-BUILT/WWP

52
Figure 4.8: PPC2 Ratio for As-built & 3WLAP
The PPC 3 ratio presented in Figure 4.9 is the result of number of activities
completed in compare to the list of activities on Baseline Schedule (BS),
demonstrates planning performance of the project's master schedule. The PPC3 ratio
of 50% average indicates that one out of two expected weekly activities in the WILL
list were worked on and achieved a PCT. This short-term look-ahead ratio
recommends that the present master schedule requires a lot of developments to attain
satisfactory results.
Figure 4.9: PPC3 Ratio for As-built & BS
0
10
20
30
40
50
60
70
80
1 2 3 4 5 6 7 8 9 10 11 12
% C
OM
PLE
TE
WEEKS/DATE
PPC2=AS-BUILT/3WLAP
0
10
20
30
40
50
60
70
1 2 3 4 5 6 7 8 9 10 11 12
% C
OM
PLE
TE
WEEKS/DATE
PPC3=AS-BUILT/BS
53
4.1.5 Reasons for Incomplete Assignments
Figure 4.10 demonstrates the numerous behind uncompleted activities expressed for
the benefit of the undertaking. Pre-required work was the key factor for deficient
assignments in the task. This perhaps, because of the components of the level that the
undertaking had achieved as most assignments; including building activities were
completely depending on finished auxiliary assignments. For the purpose of
comparison, reasons for incompleteness were combined in the same figure.
Labor supply was the first significant reason for incomplete assignments of the same
project. The project appeared to struggle to keep pace with the arranged plans such
as; weekly plans and LAP because of insufficient available workforce to encounter
the plan's requirements. Many of the subcontractors appear to need surpassed their
abilities to provide labor supply and this is because of the market's popularity for
gifted labor recently, as the nation is going through extraordinary development blast
and billions dollar ventures have been continuing and numerous more are in the
arranging stage by both the state and private segments.
Another primary explanation behind the project incompleteness was the materials
accessibility, which arose du to a few elements. Firstly, the endorsement process
which was essential by the customer was timewasting and brought about deferrals.
Besides, delay in delivering materials by the suppliers or sometimes delivering
wrong materials. In this case deliveries were made but with wrong materials and this
occur mostly due to supplier's confusion because of existing many types of blocks
such as; standard, cement or ponza and many block sizes being used. Also in some
other cases, precisely during the last stage some of the mechanical materials supplies
54
were simply delayed.
Figure 4.10: Reasons for uncompleted tasks over the entire Period of the Project
The third reason was identified with endorsement, since the endorsement framework
by the customer itself brought about deferrals because of organization and the use of
research material as an exclusive mean of communication in material purchase
agreement. Additionally, there was an issue with delay in starting activities due to
late submitted requests to be decided on them.
The fourth reason was changing needs, which generally showed up in the design
assignments that were not really succession subordinate. Nevertheless, in a few
circumstances it was important to change need due to works appropriation among the
zones, disarray in assets conveyance, accessibility of experts, for example,
constructors and woodworkers, furthermore there might have been different reasons.
The fifth huge reason was equipment delay and submitting late of requirements as
they were similarly occurred five times over the whole time of LPS execution.
05
10152025303540
Reasons for incomplete assignments
Reasons for incomplete assignments
55
Factors affecting waste and implementing LPS in the NI, this might relate to the
political and cultural issues. Similarly, the results provided evidences of advantages
of planning process. At the end of the empirical study, the researcher concluded to
provide the following framework as it is seen in Figure 4.11.
Figure 4.11: Suggested framework for implementing the LPS in construction.

56
4.1.6 Summary of the case study
LPS was implemented on a building in four stages (i) LPS training, (ii) PPS sessions,
(iii) Development of 6 WLAP and WWP, (iv) PPC calculation and (v) LPS
implementation evaluation process supported by interviews and questionnaire.
57
4.2 Section Two: The Questionnaire and Interview
4.2.1 General information
This section includes some information about the nominees so as to make
unquestionable that they meet the requirements of the study.
4.2.1.1 Gender
This questionnaire was given to both males and females since gender has not gained
interest of this study. Since female engineers are very few in NI, 9 female (18%) and
41 males (82%) completed the questionnaire as shown in the Figure 4.12.
Figure 4.12: The participant‘s gender
4.2.1.2 Age
This was not the concern of the research but this inquiry was requested to be certain
that all the participants are in the right age and meet the requirements. 8% were 18-
24, 52% were 25-34, 30% were 35-44 years old and 10% chose 45 or more as shown
in the Figure 4.13.
0%
20%
40%
60%
80%
100%
Males Females
Series1 82% 18%
The participants' gender
58
Figure 4.13: The participants' age.
4.2.1.3 Work Places of Participants?
Regarding the third question, 56% of the participants said that they work in private
sector while the other 44% of them work in state organizations, such as, educational
institutes and state ministries and their project departments shown in Figure 4.14.
Figure 4.14: The participants' workplace.
4.2.1.4 Education Level of Participants?
12% of the participants had PhD, 24% had MSc, 40% had BSc, and 24% of them
chose others because some of them had no qualification or had different qualification
0%
20%
40%
60%
Theparticipan
ts' age
18 - 24 25 - 34 35 - 44 44+
Series1 8% 52% 30% 10%
The participants' age
0%
10%
20%
30%
40%
50%
60%
Private Sector State Organizations
Series1 56% 44%
The participants' workplace
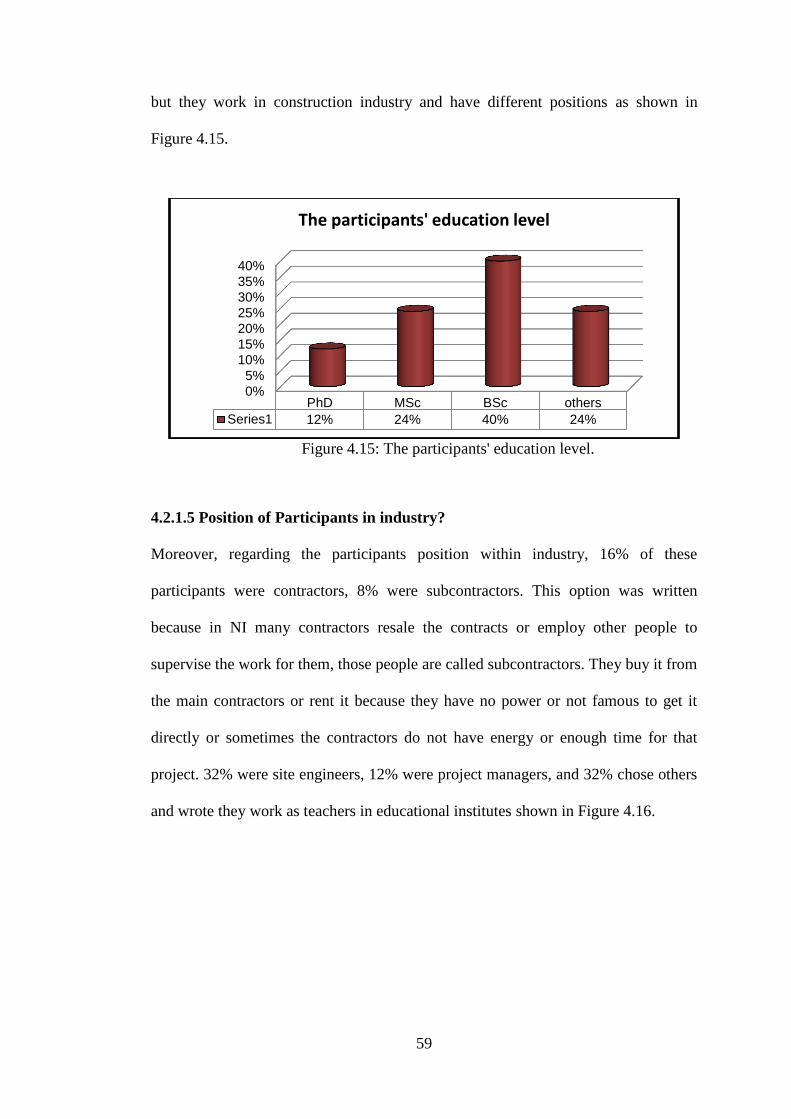
59
but they work in construction industry and have different positions as shown in
Figure 4.15.
Figure 4.15: The participants' education level.
4.2.1.5 Position of Participants in industry?
Moreover, regarding the participants position within industry, 16% of these
participants were contractors, 8% were subcontractors. This option was written
because in NI many contractors resale the contracts or employ other people to
supervise the work for them, those people are called subcontractors. They buy it from
the main contractors or rent it because they have no power or not famous to get it
directly or sometimes the contractors do not have energy or enough time for that
project. 32% were site engineers, 12% were project managers, and 32% chose others
and wrote they work as teachers in educational institutes shown in Figure 4.16.
0%
5%
10%
15%
20%
25%
30%
35%
40%
PhD MSc BSc others
Series1 12% 24% 40% 24%
The participants' education level
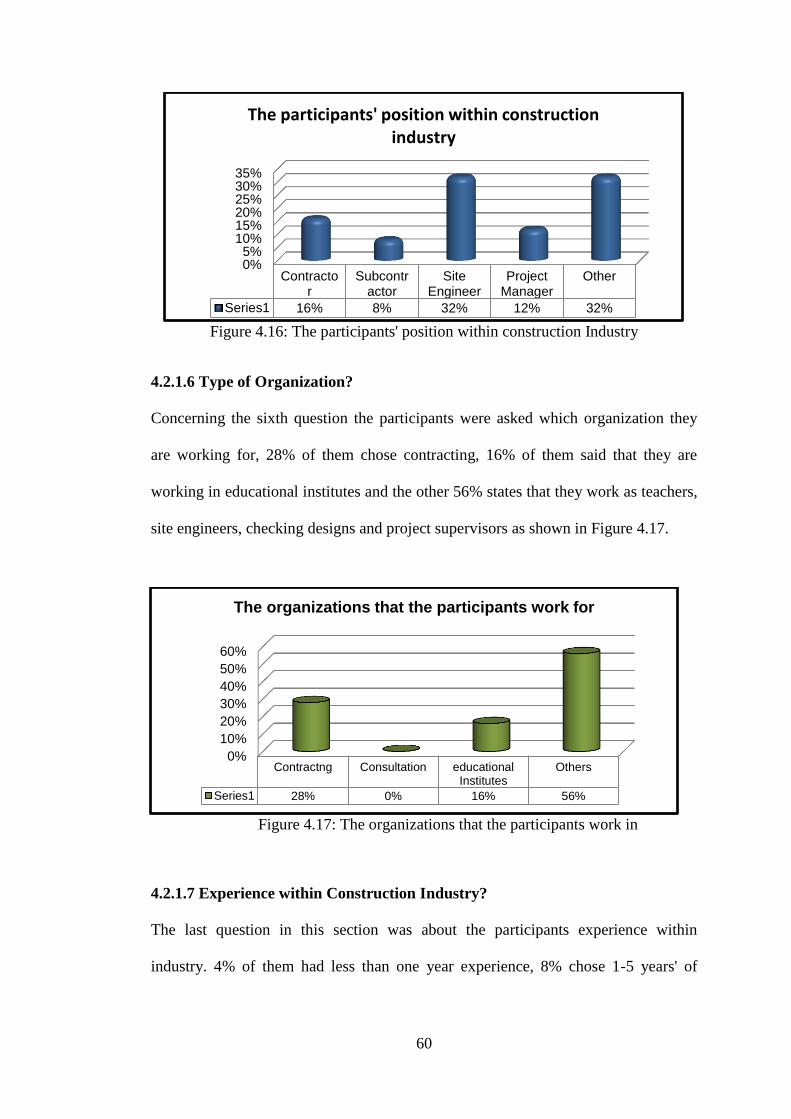
60
Figure 4.16: The participants' position within construction Industry
4.2.1.6 Type of Organization?
Concerning the sixth question the participants were asked which organization they
are working for, 28% of them chose contracting, 16% of them said that they are
working in educational institutes and the other 56% states that they work as teachers,
site engineers, checking designs and project supervisors as shown in Figure 4.17.
Figure 4.17: The organizations that the participants work in
4.2.1.7 Experience within Construction Industry?
The last question in this section was about the participants experience within
industry. 4% of them had less than one year experience, 8% chose 1-5 years' of
0%5%
10%15%20%25%30%35%
Contractor
Subcontractor
SiteEngineer
ProjectManager
Other
Series1 16% 8% 32% 12% 32%
The participants' position within construction industry
0%
10%
20%
30%
40%
50%
60%
Contractng Consultation educationalInstitutes
Others
Series1 28% 0% 16% 56%
The organizations that the participants work for
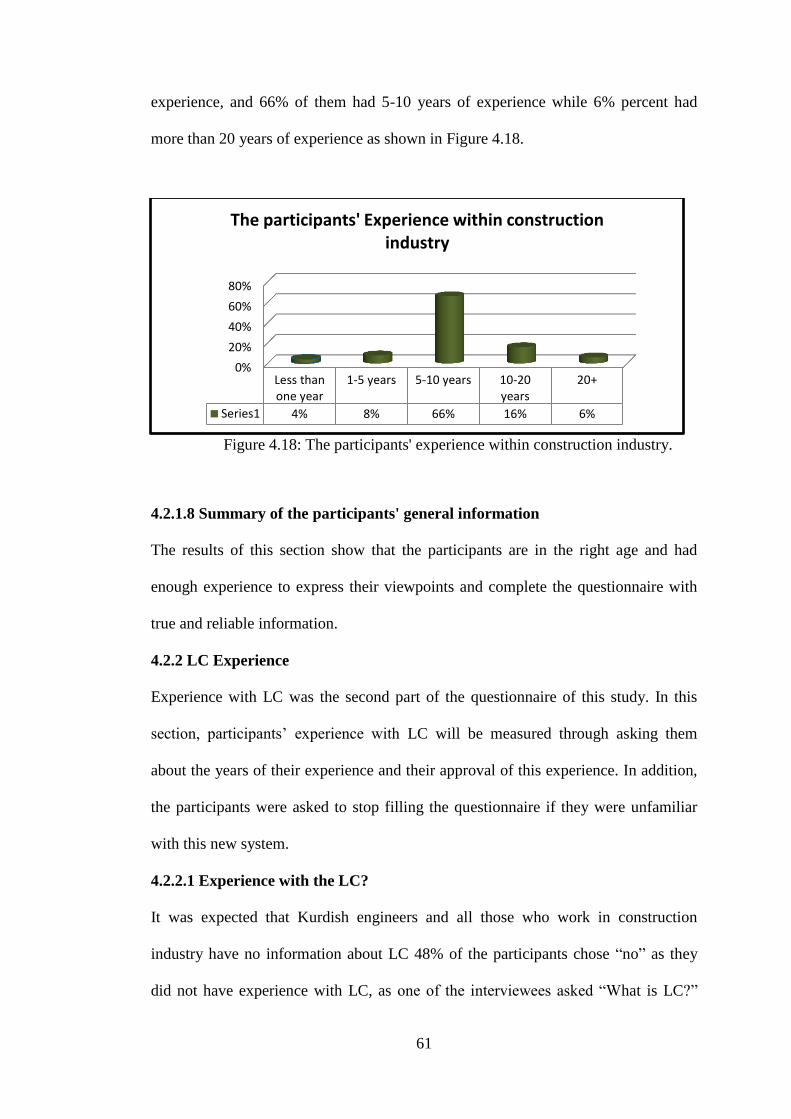
61
experience, and 66% of them had 5-10 years of experience while 6% percent had
more than 20 years of experience as shown in Figure 4.18.
Figure 4.18: The participants' experience within construction industry.
4.2.1.8 Summary of the participants' general information
The results of this section show that the participants are in the right age and had
enough experience to express their viewpoints and complete the questionnaire with
true and reliable information.
4.2.2 LC Experience
Experience with LC was the second part of the questionnaire of this study. In this
section, participants‘ experience with LC will be measured through asking them
about the years of their experience and their approval of this experience. In addition,
the participants were asked to stop filling the questionnaire if they were unfamiliar
with this new system.
4.2.2.1 Experience with the LC?
It was expected that Kurdish engineers and all those who work in construction
industry have no information about LC 48% of the participants chose ―no‖ as they
did not have experience with LC, as one of the interviewees asked ―What is LC?‖
0%
20%
40%
60%
80%
Less thanone year
1-5 years 5-10 years 10-20years
20+
Series1 4% 8% 66% 16% 6%
The participants' Experience within construction industry
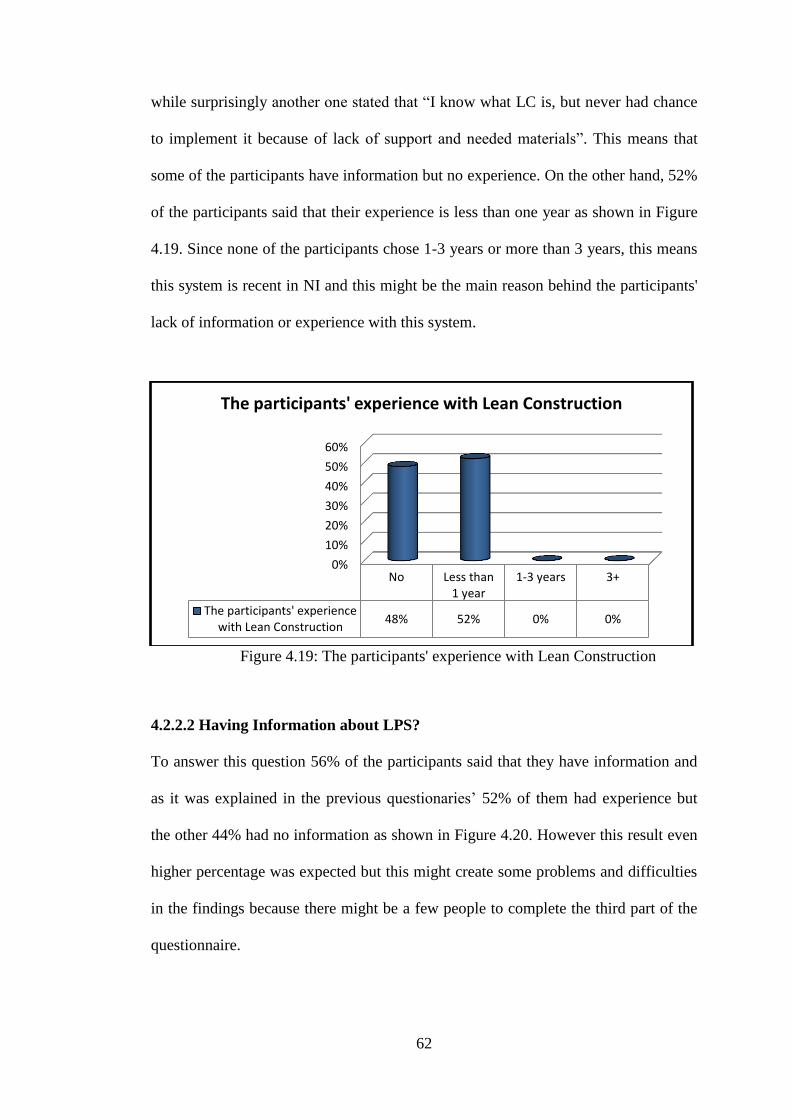
62
while surprisingly another one stated that ―I know what LC is, but never had chance
to implement it because of lack of support and needed materials‖. This means that
some of the participants have information but no experience. On the other hand, 52%
of the participants said that their experience is less than one year as shown in Figure
4.19. Since none of the participants chose 1-3 years or more than 3 years, this means
this system is recent in NI and this might be the main reason behind the participants'
lack of information or experience with this system.
Figure 4.19: The participants' experience with Lean Construction
4.2.2.2 Having Information about LPS?
To answer this question 56% of the participants said that they have information and
as it was explained in the previous questionaries‘ 52% of them had experience but
the other 44% had no information as shown in Figure 4.20. However this result even
higher percentage was expected but this might create some problems and difficulties
in the findings because there might be a few people to complete the third part of the
questionnaire.
0%
10%
20%
30%
40%
50%
60%
No Less than1 year
1-3 years 3+
The participants' experiencewith Lean Construction
48% 52% 0% 0%
The participants' experience with Lean Construction

63
Figure 4.20: The Percentage of those participants who have information about the
LLP
4.2.2.3 The Results Achieved, Satisfactory or Not?
Regarding this question the participants were asked to rate their satisfaction with LC
using the LPS. The options for this question were 1 (the least Satisfactory), 2
(satisfactory), 3 (more satisfactory) and 4 (the most satisfactory). Although all those
28 participants who continued completing the questionnaire after the second question
in this section were satisfied with the results, their fulfillment was not high as 71.4%
chose the least satisfactory and 28.5% chose satisfactory whereas no one chose more
satisfactory or the most satisfactory as shown in Figure 4.21. Moreover, one of the
interviewees claimed that his experience was not very satisfactory because he had
faced many difficulties. This might be applicable for other participants as well.
0%
10%
20%
30%
40%
50%
60%
Yes No
Number of the participantswho have information about
LPS56% 44%
Number of the participants who have information about LPS

64
Figure 4.21: The results satisfactions rate
4.2.2.4 Summary of the Participants' Experience.
The results showed that the participants' experience with Lean construction is low.
However the results revealed that about half of the participants do not have
experience with LC using the LPS and some of the participants had information
about LC using LPS but not all of them had experience with its implementation.
Moreover, those who had information, their information or their experience was
limited which was not enough to satisfy them due to the reason that this system is
new and its execution might confront with many difficulties. In general the results
demonstrate that there is a link between the results and the researcher's hypothesis
that all the participants may not have information.
4.2.3 LC using the LPS and Other Factors in Solving Construction Problems
This unit of the survey was depend on two of the investigation inquiries in order to
discovery the causes of waste in construction industry in NI and the factors that
contribute in reducing waste according to the participants' point of view.
Additionally, this section deals with the complications and supports in executing this
system. Furthermore, this section tried to find to what extend the participants suggest
the implementation of this system in NI. In addition, it attempts to indicate the
0.00%
10.00%
20.00%
30.00%
40.00%
50.00%
60.00%
70.00%
80.00%
the leastsatisfactory
satisfactory moresatisfactory
the mostsatisfactory
The results' satisfication rate 71.40% 28.50% 0% 0%
The results' satisfication rate
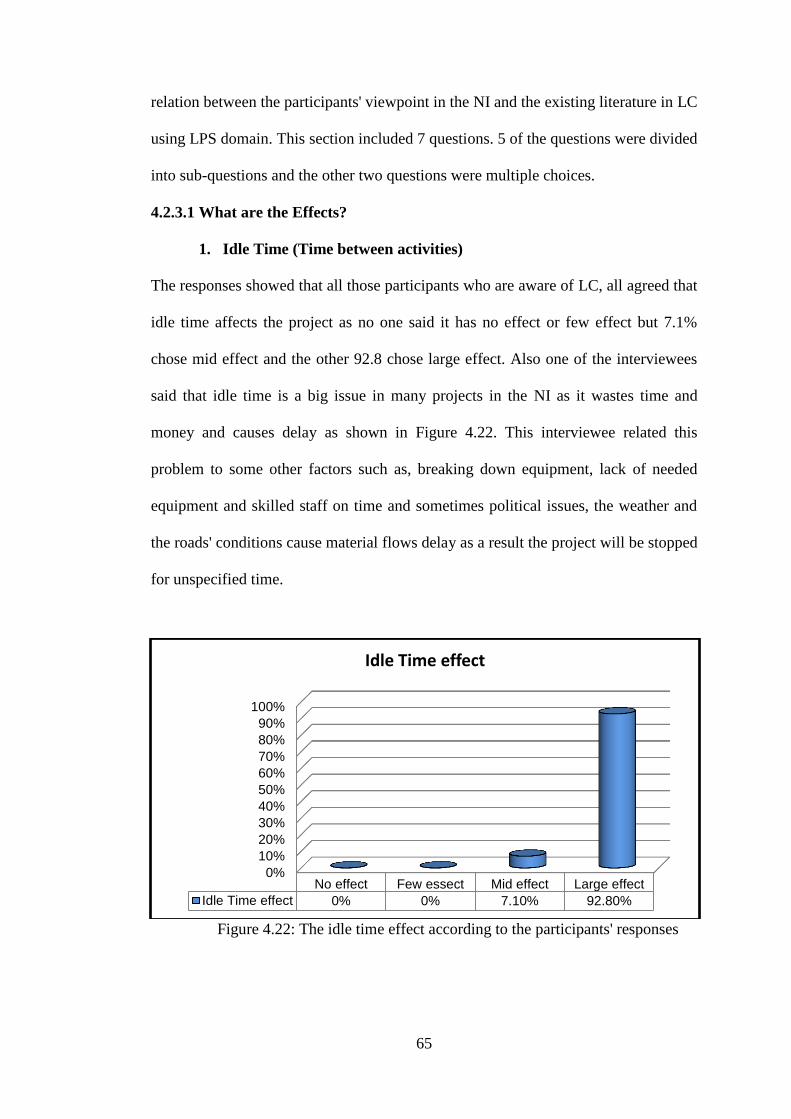
65
relation between the participants' viewpoint in the NI and the existing literature in LC
using LPS domain. This section included 7 questions. 5 of the questions were divided
into sub-questions and the other two questions were multiple choices.
4.2.3.1 What are the Effects?
1. Idle Time (Time between activities)
The responses showed that all those participants who are aware of LC, all agreed that
idle time affects the project as no one said it has no effect or few effect but 7.1%
chose mid effect and the other 92.8 chose large effect. Also one of the interviewees
said that idle time is a big issue in many projects in the NI as it wastes time and
money and causes delay as shown in Figure 4.22. This interviewee related this
problem to some other factors such as, breaking down equipment, lack of needed
equipment and skilled staff on time and sometimes political issues, the weather and
the roads' conditions cause material flows delay as a result the project will be stopped
for unspecified time.
Figure 4.22: The idle time effect according to the participants' responses
0%
10%
20%
30%
40%
50%
60%
70%
80%
90%
100%
No effect Few essect Mid effect Large effect
Idle Time effect 0% 0% 7.10% 92.80%
Idle Time effect
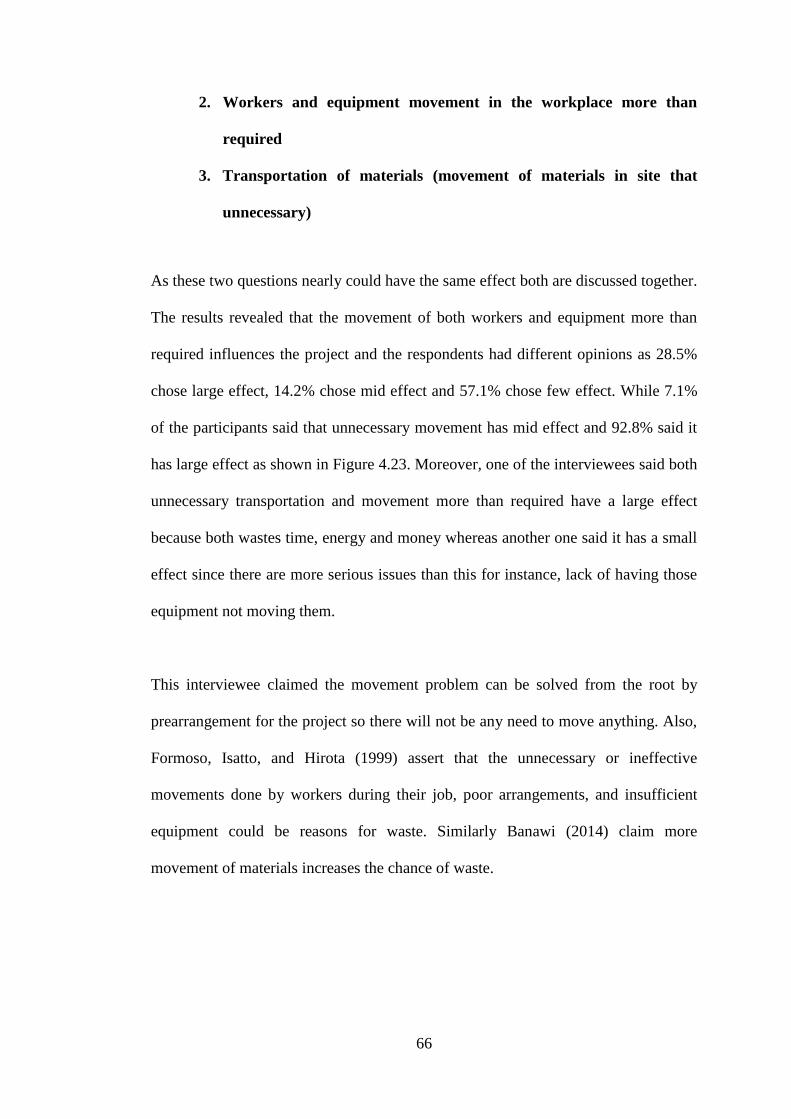
66
2. Workers and equipment movement in the workplace more than
required
3. Transportation of materials (movement of materials in site that
unnecessary)
As these two questions nearly could have the same effect both are discussed together.
The results revealed that the movement of both workers and equipment more than
required influences the project and the respondents had different opinions as 28.5%
chose large effect, 14.2% chose mid effect and 57.1% chose few effect. While 7.1%
of the participants said that unnecessary movement has mid effect and 92.8% said it
has large effect as shown in Figure 4.23. Moreover, one of the interviewees said both
unnecessary transportation and movement more than required have a large effect
because both wastes time, energy and money whereas another one said it has a small
effect since there are more serious issues than this for instance, lack of having those
equipment not moving them.
This interviewee claimed the movement problem can be solved from the root by
prearrangement for the project so there will not be any need to move anything. Also,
Formoso, Isatto, and Hirota (1999) assert that the unnecessary or ineffective
movements done by workers during their job, poor arrangements, and insufficient
equipment could be reasons for waste. Similarly Banawi (2014) claim more
movement of materials increases the chance of waste.
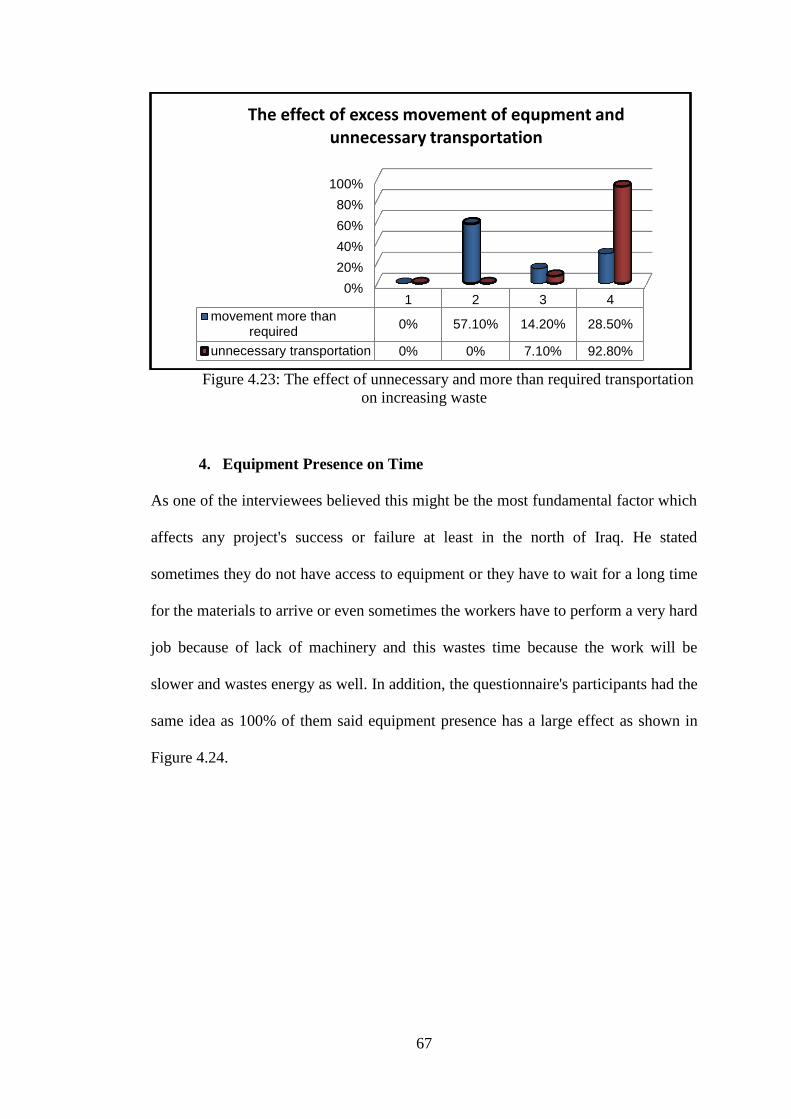
67
Figure 4.23: The effect of unnecessary and more than required transportation
on increasing waste
4. Equipment Presence on Time
As one of the interviewees believed this might be the most fundamental factor which
affects any project's success or failure at least in the north of Iraq. He stated
sometimes they do not have access to equipment or they have to wait for a long time
for the materials to arrive or even sometimes the workers have to perform a very hard
job because of lack of machinery and this wastes time because the work will be
slower and wastes energy as well. In addition, the questionnaire's participants had the
same idea as 100% of them said equipment presence has a large effect as shown in
Figure 4.24.
0%
20%
40%
60%
80%
100%
1 2 3 4
movement more thanrequired
0% 57.10% 14.20% 28.50%
unnecessary transportation 0% 0% 7.10% 92.80%
The effect of excess movement of equpment and unnecessary transportation
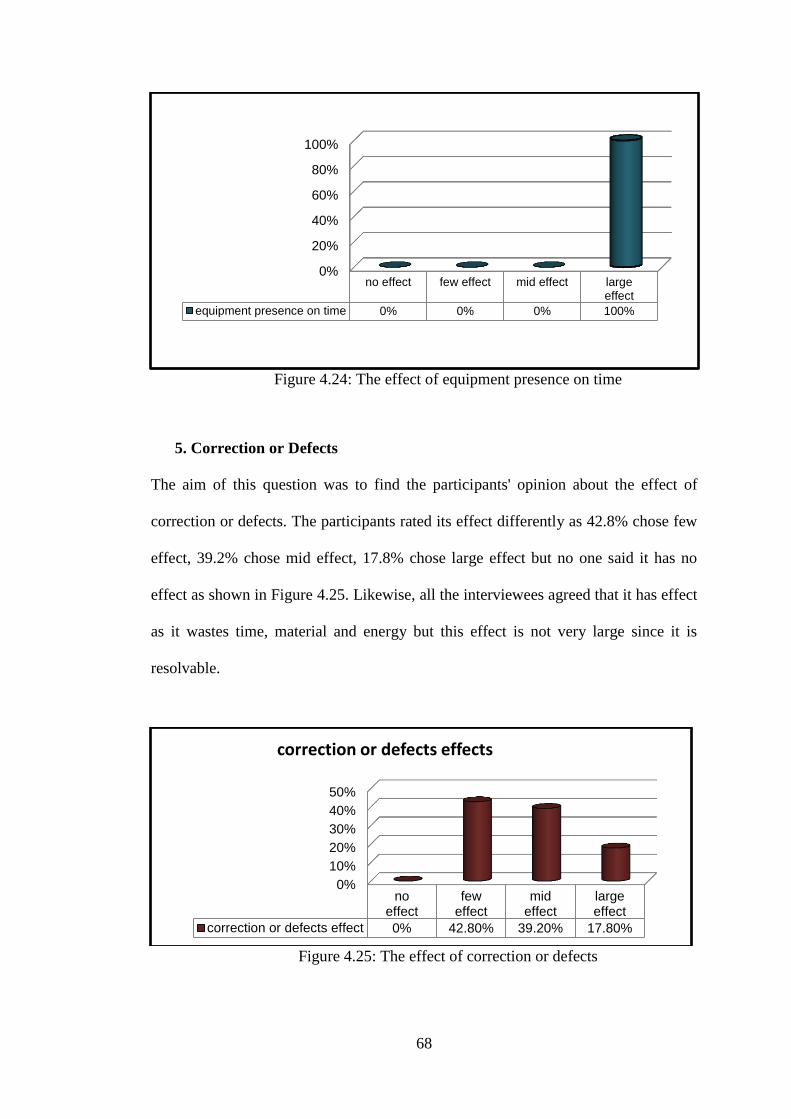
68
Figure 4.24: The effect of equipment presence on time
5. Correction or Defects
The aim of this question was to find the participants' opinion about the effect of
correction or defects. The participants rated its effect differently as 42.8% chose few
effect, 39.2% chose mid effect, 17.8% chose large effect but no one said it has no
effect as shown in Figure 4.25. Likewise, all the interviewees agreed that it has effect
as it wastes time, material and energy but this effect is not very large since it is
resolvable.
Figure 4.25: The effect of correction or defects
0%
20%
40%
60%
80%
100%
no effect few effect mid effect largeeffect
equipment presence on time 0% 0% 0% 100%
0%
10%
20%
30%
40%
50%
noeffect
feweffect
mideffect
largeeffect
correction or defects effect 0% 42.80% 39.20% 17.80%
correction or defects effects
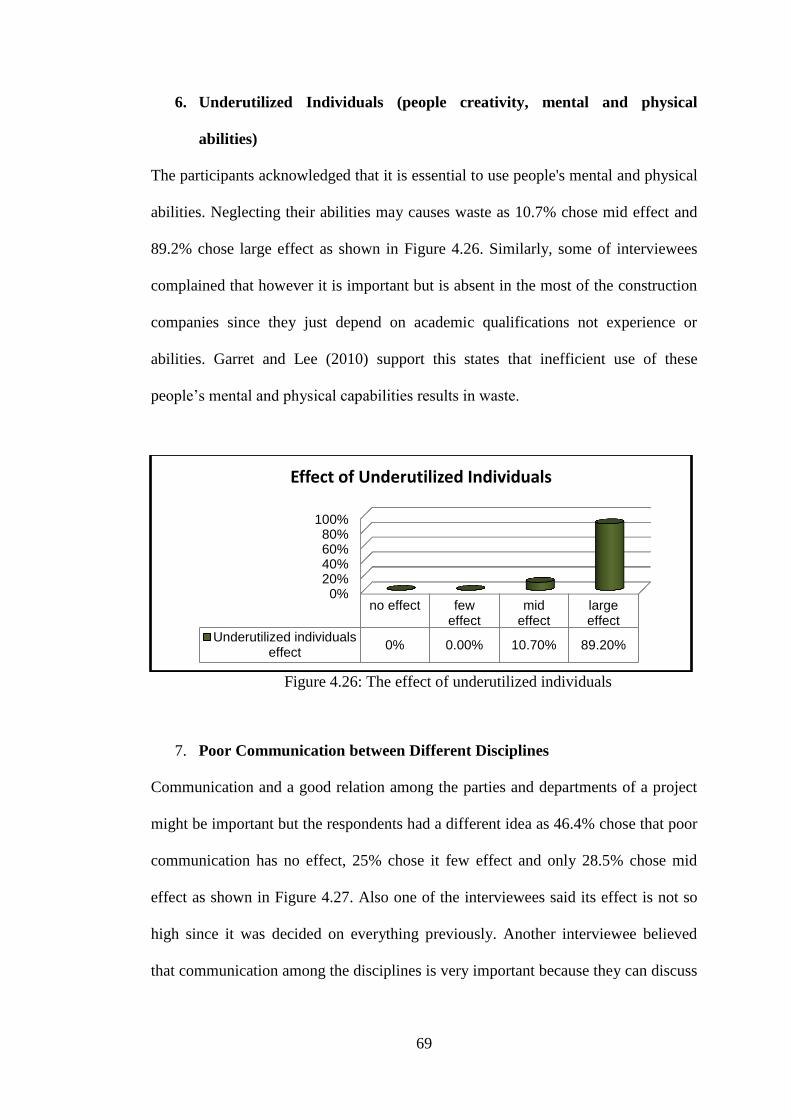
69
6. Underutilized Individuals (people creativity, mental and physical
abilities)
The participants acknowledged that it is essential to use people's mental and physical
abilities. Neglecting their abilities may causes waste as 10.7% chose mid effect and
89.2% chose large effect as shown in Figure 4.26. Similarly, some of interviewees
complained that however it is important but is absent in the most of the construction
companies since they just depend on academic qualifications not experience or
abilities. Garret and Lee (2010) support this states that inefficient use of these
people‘s mental and physical capabilities results in waste.
Figure 4.26: The effect of underutilized individuals
7. Poor Communication between Different Disciplines
Communication and a good relation among the parties and departments of a project
might be important but the respondents had a different idea as 46.4% chose that poor
communication has no effect, 25% chose it few effect and only 28.5% chose mid
effect as shown in Figure 4.27. Also one of the interviewees said its effect is not so
high since it was decided on everything previously. Another interviewee believed
that communication among the disciplines is very important because they can discuss
0%20%40%60%80%
100%
no effect feweffect
mideffect
largeeffect
Underutilized individualseffect
0% 0.00% 10.70% 89.20%
Effect of Underutilized Individuals
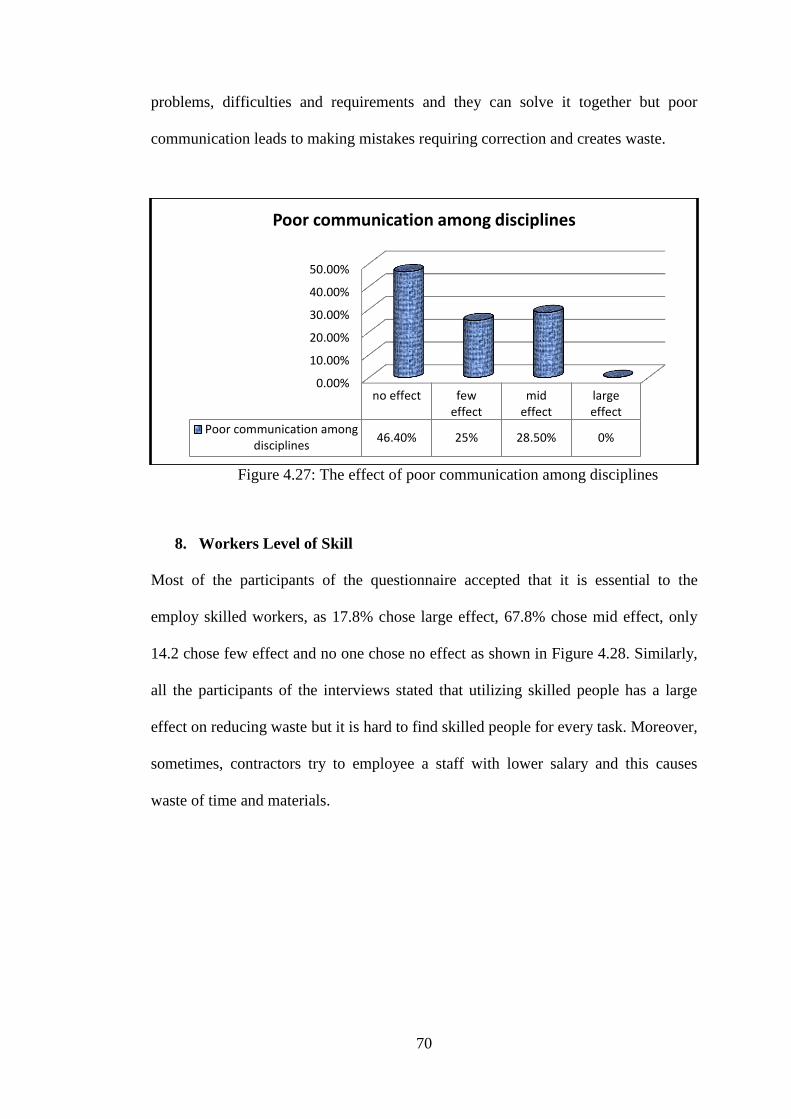
70
problems, difficulties and requirements and they can solve it together but poor
communication leads to making mistakes requiring correction and creates waste.
Figure 4.27: The effect of poor communication among disciplines
8. Workers Level of Skill
Most of the participants of the questionnaire accepted that it is essential to the
employ skilled workers, as 17.8% chose large effect, 67.8% chose mid effect, only
14.2 chose few effect and no one chose no effect as shown in Figure 4.28. Similarly,
all the participants of the interviews stated that utilizing skilled people has a large
effect on reducing waste but it is hard to find skilled people for every task. Moreover,
sometimes, contractors try to employee a staff with lower salary and this causes
waste of time and materials.
0.00%
10.00%
20.00%
30.00%
40.00%
50.00%
no effect feweffect
mideffect
largeeffect
Poor communication amongdisciplines
46.40% 25% 28.50% 0%
Poor communication among disciplines
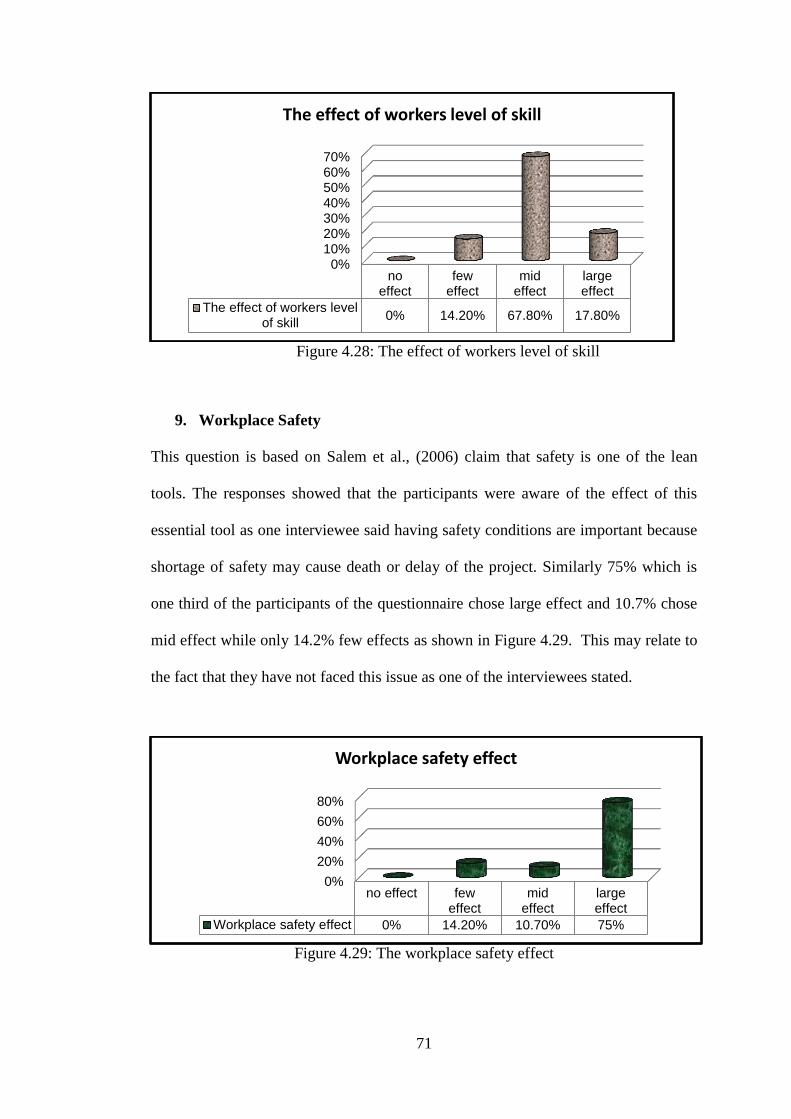
71
Figure 4.28: The effect of workers level of skill
9. Workplace Safety
This question is based on Salem et al., (2006) claim that safety is one of the lean
tools. The responses showed that the participants were aware of the effect of this
essential tool as one interviewee said having safety conditions are important because
shortage of safety may cause death or delay of the project. Similarly 75% which is
one third of the participants of the questionnaire chose large effect and 10.7% chose
mid effect while only 14.2% few effects as shown in Figure 4.29. This may relate to
the fact that they have not faced this issue as one of the interviewees stated.
Figure 4.29: The workplace safety effect
0%10%20%30%40%50%60%70%
noeffect
feweffect
mideffect
largeeffect
The effect of workers levelof skill
0% 14.20% 67.80% 17.80%
The effect of workers level of skill
0%
20%
40%
60%
80%
no effect feweffect
mideffect
largeeffect
Workplace safety effect 0% 14.20% 10.70% 75%
Workplace safety effect

72
10. Poor Management
Ballard (1994) believes that management focuses on control, which avoids bad
changes and waste. Likewise, the participants claimed that management is important
all of them (100%) believed that poor management has a large effect and the
interviewees stated that it is essential to have a good manager and management skills
to avoid wasting time, material, energy, abilities and other resources as shown in
Figure 4.30.
Figure 4.30: The effect of poor management
4.2.3.2 Arrangement in reducing waste in construction industry
1. Government
This question attempts to find out to what extent the government has impact on
reducing waste in construction industry. The participants did not choose high effect
as one interviewee said mostly the companies is responsible of the projects not
government. Only 17.8% chose mid effect but 71.4% chose low effect and 10.7%
chose no effect as shown in Figure 4.31.
0%
10%
20%
30%
40%
50%
60%
70%
80%
90%
100%
no effect few effect mid effect large effect
Poor management effect 0% 0.00% 0.00% 100%
Poor management effect
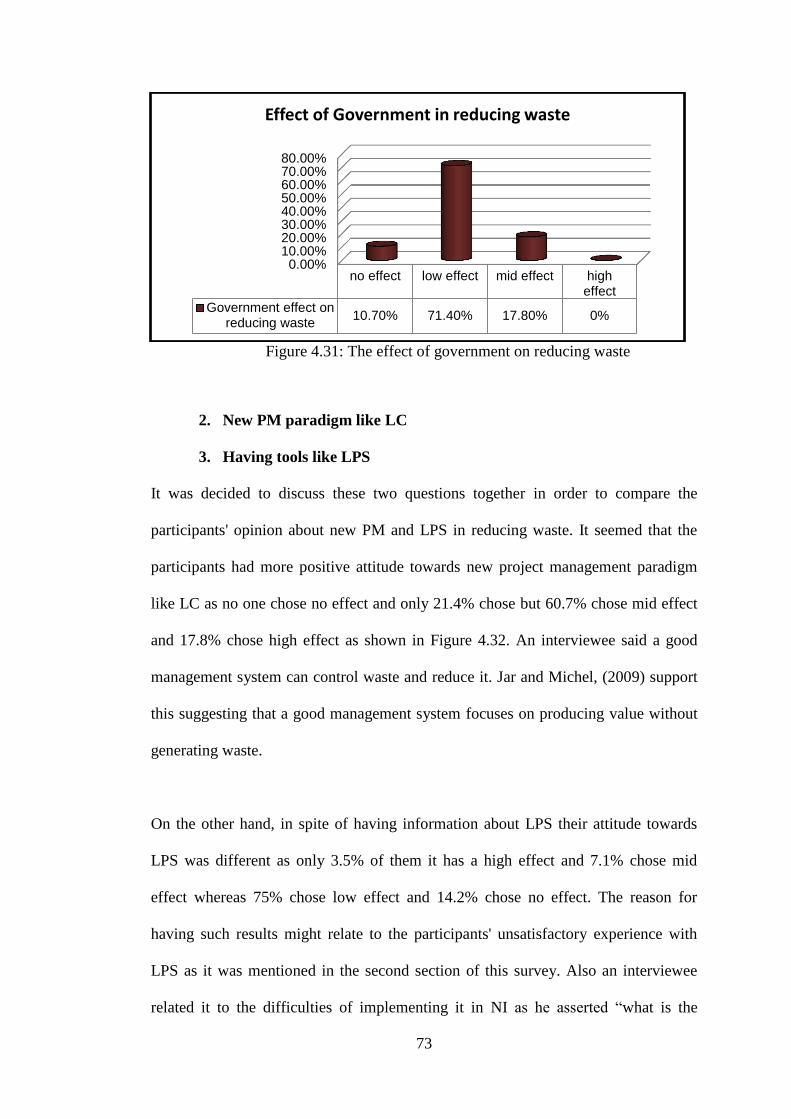
73
Figure 4.31: The effect of government on reducing waste
2. New PM paradigm like LC
3. Having tools like LPS
It was decided to discuss these two questions together in order to compare the
participants' opinion about new PM and LPS in reducing waste. It seemed that the
participants had more positive attitude towards new project management paradigm
like LC as no one chose no effect and only 21.4% chose but 60.7% chose mid effect
and 17.8% chose high effect as shown in Figure 4.32. An interviewee said a good
management system can control waste and reduce it. Jar and Michel, (2009) support
this suggesting that a good management system focuses on producing value without
generating waste.
On the other hand, in spite of having information about LPS their attitude towards
LPS was different as only 3.5% of them it has a high effect and 7.1% chose mid
effect whereas 75% chose low effect and 14.2% chose no effect. The reason for
having such results might relate to the participants' unsatisfactory experience with
LPS as it was mentioned in the second section of this survey. Also an interviewee
related it to the difficulties of implementing it in NI as he asserted ―what is the
0.00%10.00%20.00%30.00%40.00%50.00%60.00%70.00%80.00%
no effect low effect mid effect higheffect
Government effect onreducing waste
10.70% 71.40% 17.80% 0%
Effect of Government in reducing waste
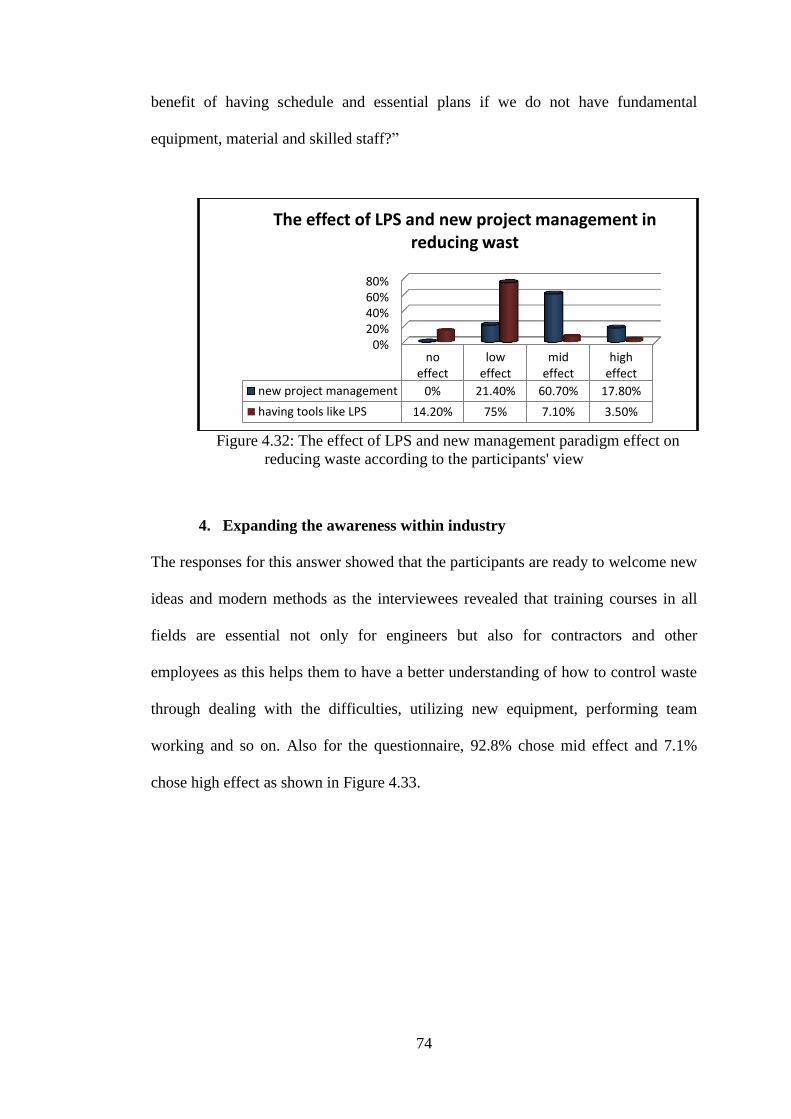
74
benefit of having schedule and essential plans if we do not have fundamental
equipment, material and skilled staff?‖
Figure 4.32: The effect of LPS and new management paradigm effect on
reducing waste according to the participants' view
4. Expanding the awareness within industry
The responses for this answer showed that the participants are ready to welcome new
ideas and modern methods as the interviewees revealed that training courses in all
fields are essential not only for engineers but also for contractors and other
employees as this helps them to have a better understanding of how to control waste
through dealing with the difficulties, utilizing new equipment, performing team
working and so on. Also for the questionnaire, 92.8% chose mid effect and 7.1%
chose high effect as shown in Figure 4.33.
0%20%40%60%80%
noeffect
loweffect
mideffect
higheffect
new project management 0% 21.40% 60.70% 17.80%
having tools like LPS 14.20% 75% 7.10% 3.50%
The effect of LPS and new project management in reducing wast

75
Figure 4.33: The effect of expanding awareness within industry on
diminishing waste
5. Ideas sharing between employees
The answers of this question showed that sharing ideas has not such a big impact
reducing waste as 71.4% chose no effect and 3.5 chose low effect as shown in Figure
4.34. One of the interviewees claimed that most of the employees are inexperienced
and their ideas might be unhelpful also everything has been decided on previously
and the employees are not in a position to interfere. On the contrary, another
interviewee who was an experienced engineer asserted that he had benefited from
peers and other employees' ideas and feedbacks even in a lower rank. Additionally,
10.7% chose mid effect and the other 14.2% chose high effect. Also Ballard (2000)
and Howell (1999) claim that consultation with the project performance team can
improve the work planning.
0%
20%
40%
60%
80%
100%
no effect loweffect
mideffect
higheffect
expanding mindfulness 0% 0% 92.80% 7.10%
the effect of expanding awareness on reducing wast
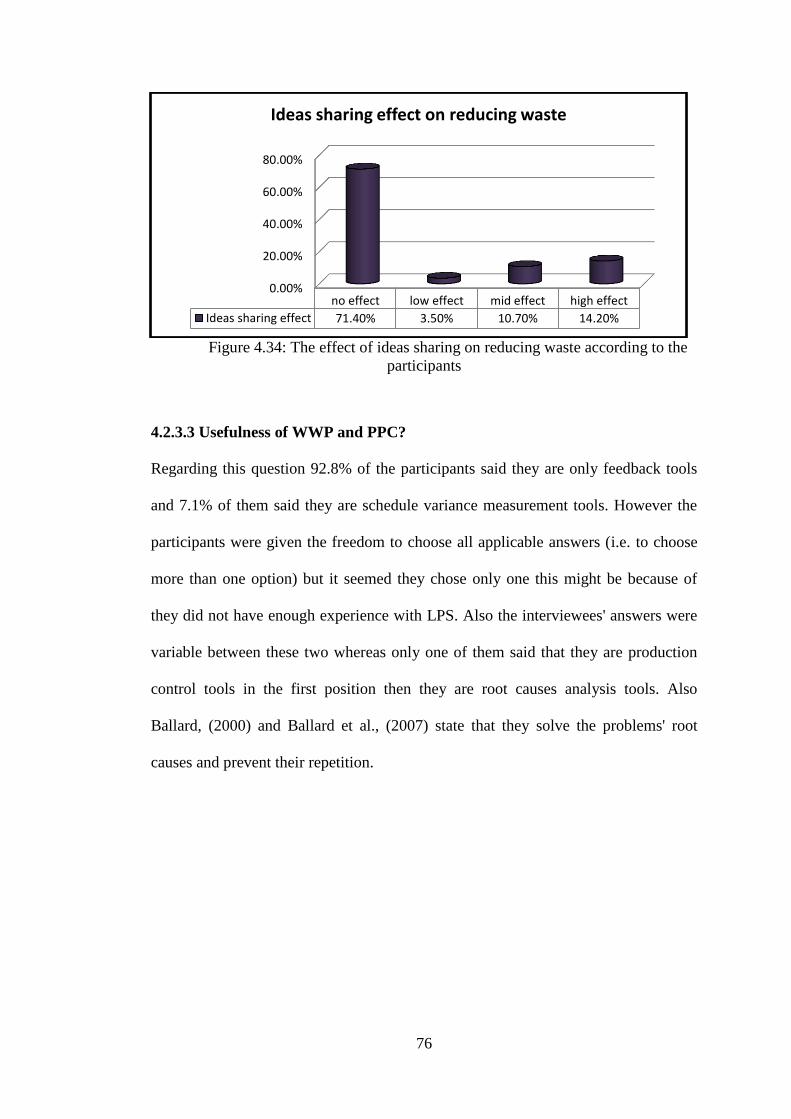
76
Figure 4.34: The effect of ideas sharing on reducing waste according to the
participants
4.2.3.3 Usefulness of WWP and PPC?
Regarding this question 92.8% of the participants said they are only feedback tools
and 7.1% of them said they are schedule variance measurement tools. However the
participants were given the freedom to choose all applicable answers (i.e. to choose
more than one option) but it seemed they chose only one this might be because of
they did not have enough experience with LPS. Also the interviewees' answers were
variable between these two whereas only one of them said that they are production
control tools in the first position then they are root causes analysis tools. Also
Ballard, (2000) and Ballard et al., (2007) state that they solve the problems' root
causes and prevent their repetition.
0.00%
20.00%
40.00%
60.00%
80.00%
no effect low effect mid effect high effect
Ideas sharing effect 71.40% 3.50% 10.70% 14.20%
Ideas sharing effect on reducing waste
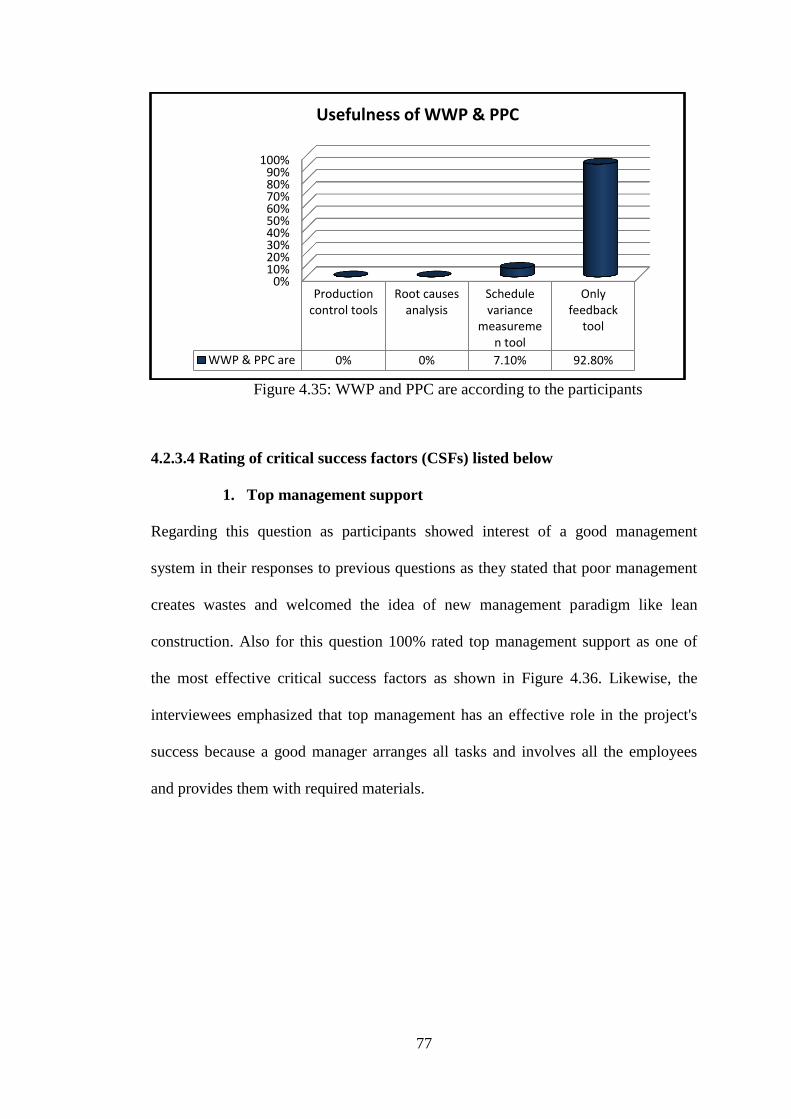
77
Figure 4.35: WWP and PPC are according to the participants
4.2.3.4 Rating of critical success factors (CSFs) listed below
1. Top management support
Regarding this question as participants showed interest of a good management
system in their responses to previous questions as they stated that poor management
creates wastes and welcomed the idea of new management paradigm like lean
construction. Also for this question 100% rated top management support as one of
the most effective critical success factors as shown in Figure 4.36. Likewise, the
interviewees emphasized that top management has an effective role in the project's
success because a good manager arranges all tasks and involves all the employees
and provides them with required materials.
0%10%20%30%40%50%60%70%80%90%
100%
Productioncontrol tools
Root causesanalysis
Schedulevariance
measuremen tool
Onlyfeedback
tool
WWP & PPC are 0% 0% 7.10% 92.80%
Usefulness of WWP & PPC

78
Figure 4.36: Top management support's effect as one of the CSFs
2. Contractual commitment
The responses for this factor were 14.2% stated that it is an effective factor, 21.4%
said it is more effective, and the other 64.2% chose it as the most effective factor as
shown in Figure 4.37. Also the interviewees believed that it is vital for the
supervising engineer to be presence at site in order to perform the job in a better
manner, any inadequacy will be solved on time and there is no need for correction of
defects in the final stages.
Figure 4.37: The participants' view about contractual commitments
0%
20%
40%
60%
80%
100%
the leasteffective
effective moreeffective
the mosteffective
top management support 0% 0% 0% 100%
top management support as CSF
0%
10%
20%
30%
40%
50%
60%
70%
the leasteffective
effective moreeffective
the mosteffective
contractual commitment 0% 14.20% 21.40% 64.20%
contractual commitment

79
3. Involvement of all participants
This factor seems to be very effective CSF for the projects' achievement as an
interviewee said every employee and all who are connected with the project to be
involved, in order to every task to be completed on time under the manager and the
supervisor's supervision and meet the requirements. Also 71.4% chose it is more
effective factor and 28.5% chose the most effect factor as shown in Figure 4.38.
Also according to AIACC (2014) continuous involvement of owner, main designers
and constructors from the beginning until the end is very important for the projects'
accomplishment. Likewise, involvement of all parties might cause that different tasks
to be executed at the same time as Diekmann et al., (2004) claim coordination and
assembling the activities to flow in parallel order instead of consecutive order is
critical to save time and budget.
Figure 4.38: The effectiveness of all the project participants' involvement
0.00%
10.00%
20.00%
30.00%
40.00%
50.00%
60.00%
70.00%
80.00%
the leasteffective
effective moreeffective
the mosteffective
involvement of allparticipants
0.00% 0.00% 71.40% 28.50%
involvement of all participants
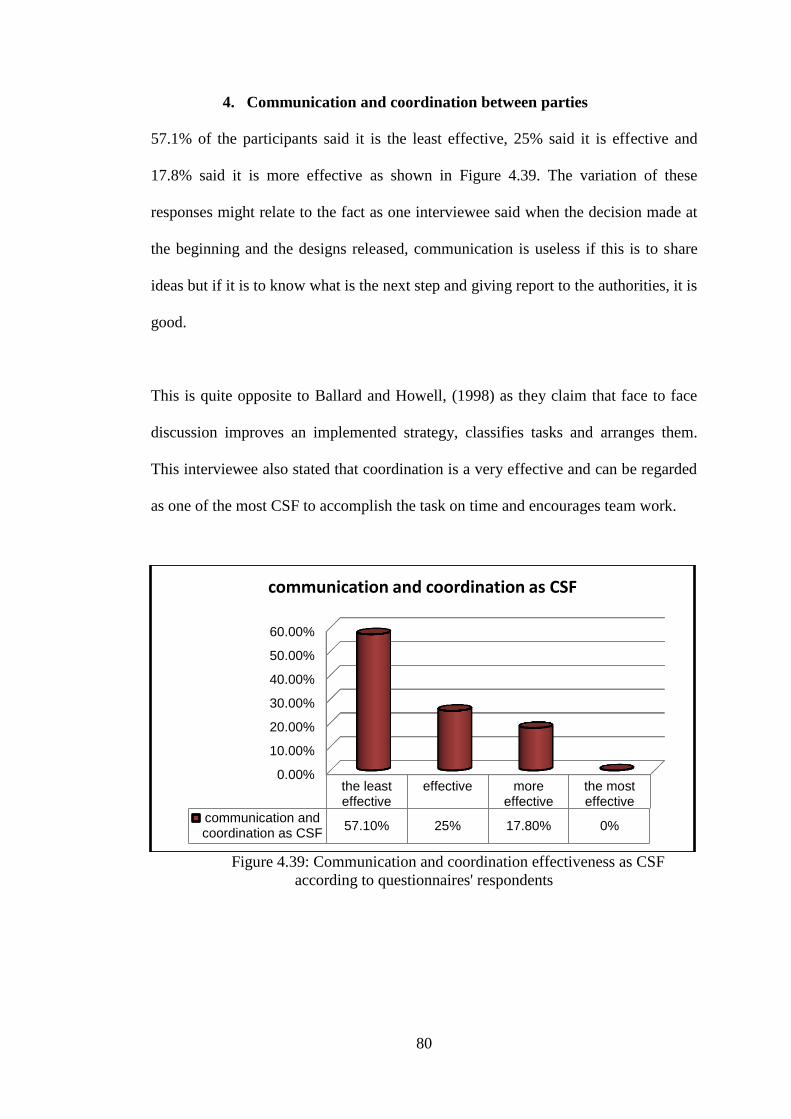
80
4. Communication and coordination between parties
57.1% of the participants said it is the least effective, 25% said it is effective and
17.8% said it is more effective as shown in Figure 4.39. The variation of these
responses might relate to the fact as one interviewee said when the decision made at
the beginning and the designs released, communication is useless if this is to share
ideas but if it is to know what is the next step and giving report to the authorities, it is
good.
This is quite opposite to Ballard and Howell, (1998) as they claim that face to face
discussion improves an implemented strategy, classifies tasks and arranges them.
This interviewee also stated that coordination is a very effective and can be regarded
as one of the most CSF to accomplish the task on time and encourages team work.
Figure 4.39: Communication and coordination effectiveness as CSF
according to questionnaires' respondents
0.00%
10.00%
20.00%
30.00%
40.00%
50.00%
60.00%
the leasteffective
effective moreeffective
the mosteffective
communication andcoordination as CSF
57.10% 25% 17.80% 0%
communication and coordination as CSF
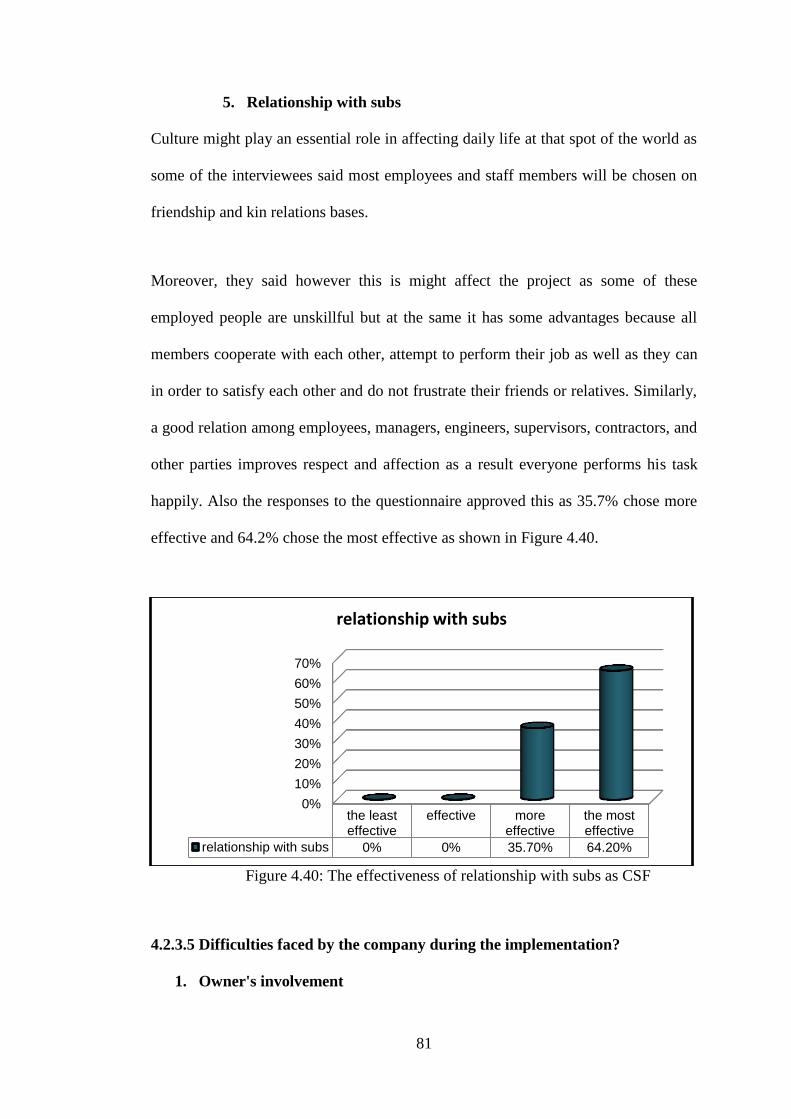
81
5. Relationship with subs
Culture might play an essential role in affecting daily life at that spot of the world as
some of the interviewees said most employees and staff members will be chosen on
friendship and kin relations bases.
Moreover, they said however this is might affect the project as some of these
employed people are unskillful but at the same it has some advantages because all
members cooperate with each other, attempt to perform their job as well as they can
in order to satisfy each other and do not frustrate their friends or relatives. Similarly,
a good relation among employees, managers, engineers, supervisors, contractors, and
other parties improves respect and affection as a result everyone performs his task
happily. Also the responses to the questionnaire approved this as 35.7% chose more
effective and 64.2% chose the most effective as shown in Figure 4.40.
Figure 4.40: The effectiveness of relationship with subs as CSF
4.2.3.5 Difficulties faced by the company during the implementation?
1. Owner's involvement
0%
10%
20%
30%
40%
50%
60%
70%
the leasteffective
effective moreeffective
the mosteffective
relationship with subs 0% 0% 35.70% 64.20%
relationship with subs

82
2. Designer/ Engineer's involvement
The answers for these two questions were various as half of the participants said that
owner's involvement has low effect, 14.2% said it has mid effect and 35.7% said it
has high effect on creating difficulties for the company whereas 60.7% of the
participants said that the engineer's involvement has no effect on creating difficulties
and 32.1% said it has low effect as shown in Figure 4.41. All interviewees related
these variations to the involvement of owner creates difficulties, as the owner may
have different enquires from what have done, but all were agreed that in spite of
creating difficulties and causing delay, it is good at the same time as all corrections
will be done in early stages since if they were left to the final phases, they might
require further effort, work, time and money. Diekmann et al, (2004) suggest that the
customer's requirements should be determined and analyzed in each production
stage. Similarly, the participants asserted that the involvement of the designer or the
engineer in all phases is essential to make sure that every task will be executed
properly and on time.
Figure 4.41: The effect of the owner and the engineer's involvement on
creating difficulties.
0.00%10.00%20.00%30.00%40.00%50.00%60.00%70.00%
no effect loweffect
mideffect
higheffect
engineer's involvement 60.70% 32.10% 0% 0%
Owner's involvement 0% 50% 14.20% 35.70%
The effect of the engineer and the owner's involvement on creating diffuclties
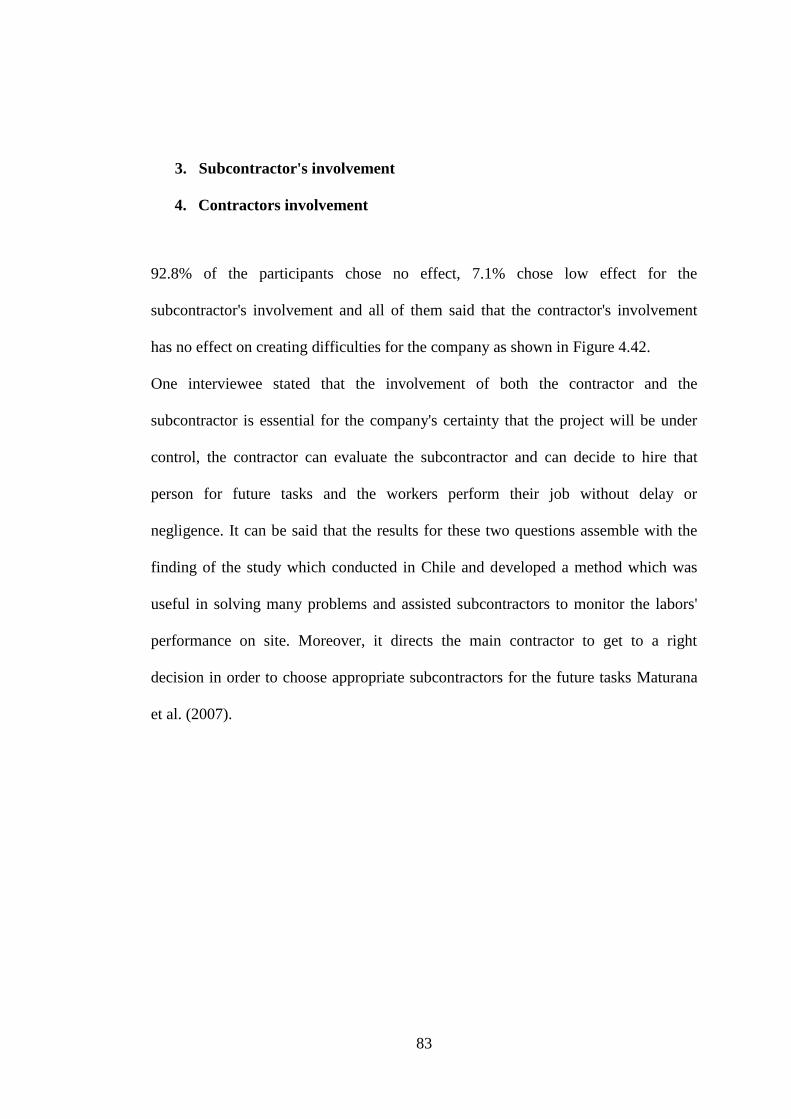
83
3. Subcontractor's involvement
4. Contractors involvement
92.8% of the participants chose no effect, 7.1% chose low effect for the
subcontractor's involvement and all of them said that the contractor's involvement
has no effect on creating difficulties for the company as shown in Figure 4.42.
One interviewee stated that the involvement of both the contractor and the
subcontractor is essential for the company's certainty that the project will be under
control, the contractor can evaluate the subcontractor and can decide to hire that
person for future tasks and the workers perform their job without delay or
negligence. It can be said that the results for these two questions assemble with the
finding of the study which conducted in Chile and developed a method which was
useful in solving many problems and assisted subcontractors to monitor the labors'
performance on site. Moreover, it directs the main contractor to get to a right
decision in order to choose appropriate subcontractors for the future tasks Maturana
et al. (2007).

84
Figure 4.42: The effect of contractor and subcontractor's involvement on
creating difficulties
5. Educate participants with LPS
All the interviewees are interested of the idea of educating the participants with LPS
and said it has no impact on creating difficulties but at the same time some of them
were concerned about other obstacles in front of implementing this system as they
stated 'educating people with new methods is essential but in the NI it is more
important to attempt to provide modern machinery, material and improving the road
condition because having information, plan, design and skilled staff are useless
without having required material'.
Likewise, 78.5% of the survey's participants chose it has no effect on making
difficulties for the companies and 21.4% chose it has low effect as shown in
Fig.4.43.
0.00%
20.00%
40.00%
60.00%
80.00%
100.00%
no effect loweffect
mideffect
higheffect
subcontractor'sinvolvement
92.80% 7.10% 0% 0%
contractor's involvement 100% 0% 0% 0%
The effect of controctor and subcontractor's involvement
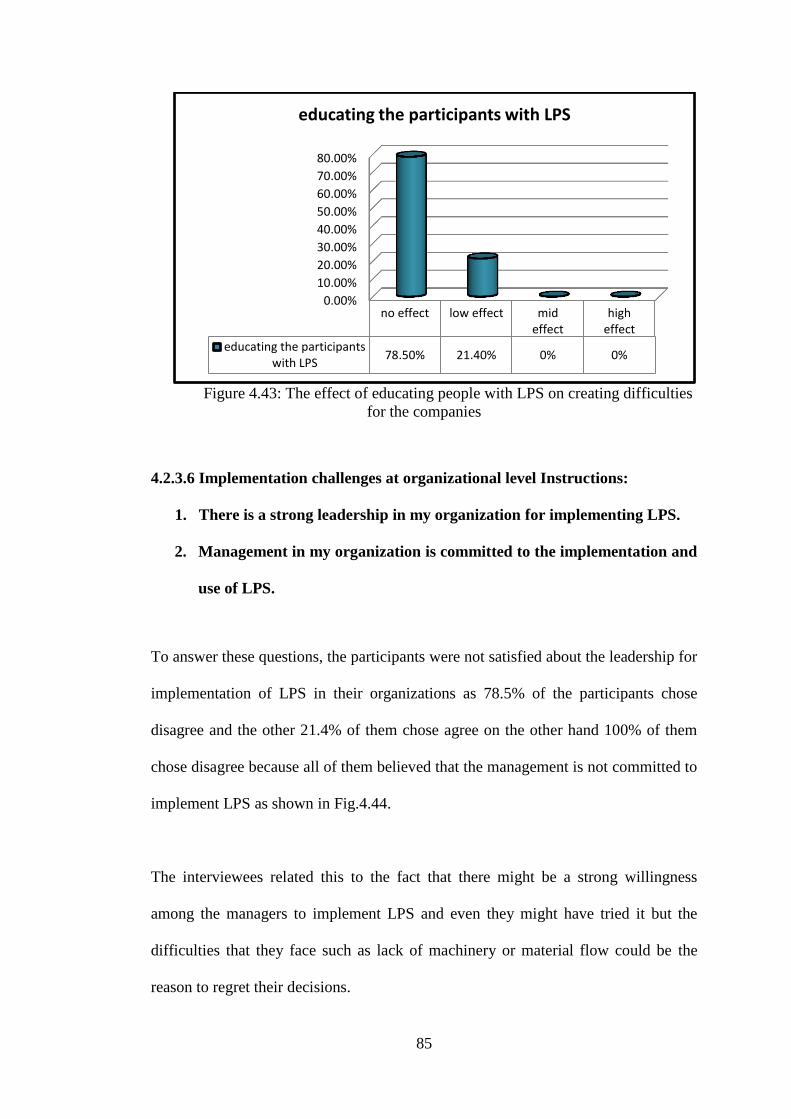
85
Figure 4.43: The effect of educating people with LPS on creating difficulties
for the companies
4.2.3.6 Implementation challenges at organizational level Instructions:
1. There is a strong leadership in my organization for implementing LPS.
2. Management in my organization is committed to the implementation and
use of LPS.
To answer these questions, the participants were not satisfied about the leadership for
implementation of LPS in their organizations as 78.5% of the participants chose
disagree and the other 21.4% of them chose agree on the other hand 100% of them
chose disagree because all of them believed that the management is not committed to
implement LPS as shown in Fig.4.44.
The interviewees related this to the fact that there might be a strong willingness
among the managers to implement LPS and even they might have tried it but the
difficulties that they face such as lack of machinery or material flow could be the
reason to regret their decisions.
0.00%
10.00%
20.00%
30.00%
40.00%
50.00%
60.00%
70.00%
80.00%
no effect low effect mideffect
higheffect
educating the participantswith LPS
78.50% 21.40% 0% 0%
educating the participants with LPS

86
Figure 4.44: The participants' view about the leadership for implementing LPS and
management committing to implement LPS.
3. In my organization people are reluctant to implement and use LPS for
planning and control purposes.
4. In my organization people are unwilling to change, when new systems
are introduced.
The responses showed that engineers, contractors and constructors are willing to
change but they are hesitant as 17.8% were strongly agreed, 71.4 were agreed that
people are reluctant to implement LPS and only 10.1% disagreed as an interviewee
claimed that not all people are reluctant as some loves trying new methods but the
organizations do not support them even they prevent them as shown in Figure 4.45.
Also 71.4% of those participants disagreed that they are unwilling to change when
new systems are introduced and the other 14.2% of them agreed and the interviewees
admitted that most of the people who work in construction industry have a great
tendency to change and apply new methods but they are hesitant as access to
0%10%20%30%40%50%60%70%80%90%
100%
stronglydisagree
disagree agree stronglyagree
leadership willingness forimplimenting LPS
0% 78.50% 21.40% 0%
management commited toimplimentation of LPS
0% 100% 0% 0%
the leadership willingness for LPS and management committing to impliment LPS
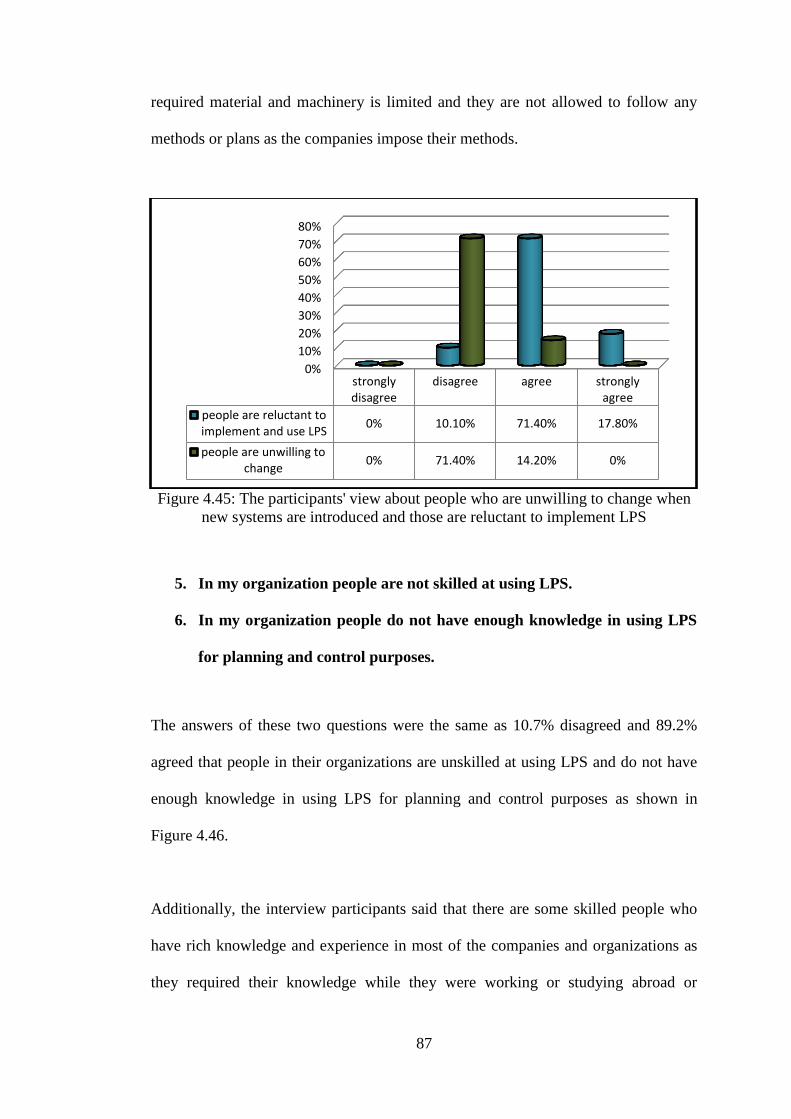
87
required material and machinery is limited and they are not allowed to follow any
methods or plans as the companies impose their methods.
Figure 4.45: The participants' view about people who are unwilling to change when
new systems are introduced and those are reluctant to implement LPS
5. In my organization people are not skilled at using LPS.
6. In my organization people do not have enough knowledge in using LPS
for planning and control purposes.
The answers of these two questions were the same as 10.7% disagreed and 89.2%
agreed that people in their organizations are unskilled at using LPS and do not have
enough knowledge in using LPS for planning and control purposes as shown in
Figure 4.46.
Additionally, the interview participants said that there are some skilled people who
have rich knowledge and experience in most of the companies and organizations as
they required their knowledge while they were working or studying abroad or
0%
10%
20%
30%
40%
50%
60%
70%
80%
stronglydisagree
disagree agree stronglyagree
people are reluctant toimplement and use LPS
0% 10.10% 71.40% 17.80%
people are unwilling tochange
0% 71.40% 14.20% 0%
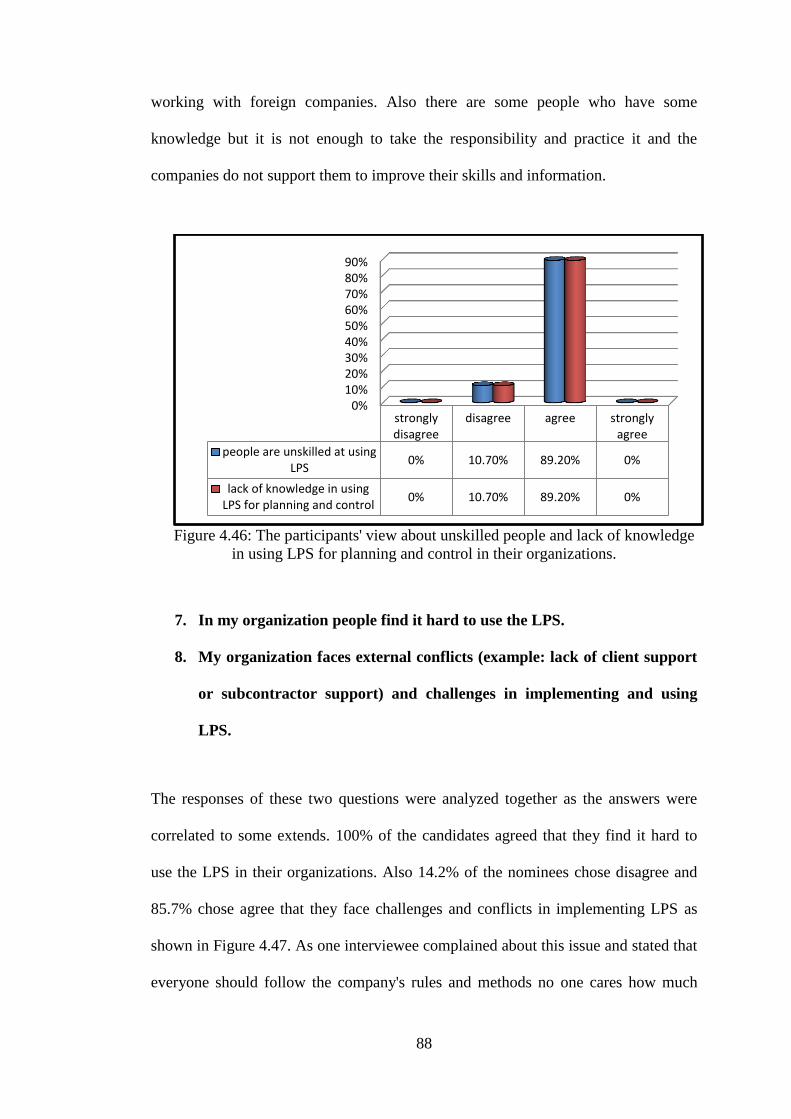
88
working with foreign companies. Also there are some people who have some
knowledge but it is not enough to take the responsibility and practice it and the
companies do not support them to improve their skills and information.
Figure 4.46: The participants' view about unskilled people and lack of knowledge
in using LPS for planning and control in their organizations.
7. In my organization people find it hard to use the LPS.
8. My organization faces external conflicts (example: lack of client support
or subcontractor support) and challenges in implementing and using
LPS.
The responses of these two questions were analyzed together as the answers were
correlated to some extends. 100% of the candidates agreed that they find it hard to
use the LPS in their organizations. Also 14.2% of the nominees chose disagree and
85.7% chose agree that they face challenges and conflicts in implementing LPS as
shown in Figure 4.47. As one interviewee complained about this issue and stated that
everyone should follow the company's rules and methods no one cares how much
0%10%20%30%40%50%60%70%80%90%
stronglydisagree
disagree agree stronglyagree
people are unskilled at usingLPS
0% 10.70% 89.20% 0%
lack of knowledge in usingLPS for planning and control
0% 10.70% 89.20% 0%

89
you know but they want you to do your job.
Another candidate said everyone wants a perfect job but they do not allow the staff
members to express their ideas or support them. In addition another interviewee
claimed that sometimes the responsible person or the client do not care about how
the staff perform the job the most important thing is the job to be perfect at the end
but at the same time they are uncooperative and do not provide the machinery or the
required material on time. According to the above responses it can be said that still
the traditional methods are followed in the NI as they focus on the result more than
the process.
Figure 4.47: Candidates' opinion about the hardness of implementing LPS and
external challenges in implementing it.
9. In my organization people find it difficult to collaborate with the teams
from other organizations during the WWP meetings
Regarding this question the participants had more negative responses as most of
0%10%20%30%40%50%60%70%80%90%
100%
stronglydisagree
disagree agree stronglyagree
it is hard to use the LPS. 0% 0% 100% 0%
organization faces challengesin implementing LPS
0% 14.20% 85.70% 0%

90
them agreed that they find it difficult to collaborate with the teams from other
organizations so 92.8% chose agree and 7.1 chose disagree as shown in Figure 4.48.
One of the interviewees said it is difficult to help each other and share ideas because
there is no formal weekly work plan meeting so the team leaders and members see
each other from time to time or during their working hours discus their thoughts
while the other interviewees admitted that no one desires to help the others, everyone
wants to keep the best ideas as a secret and perform the best job to be famous and
attain the next project or get a better job with a better payment with the well-known
companies in the country.
Figure 4.48: The participants' view about the teams and the team members‘
collaboration
4.2.3.7 Implementation of LPS in the Future Projects?
All the participants who completed the survey until the end had information about
LPS only 7.1% of them had no experience as it was mentioned in section two of this
questionnaire. Almost all of them interested of implementing this method in the
future as only 4% of them said, 21 said maybe as one interviewee said "I am not sure
0%10%20%30%40%50%60%70%80%90%
100%
stronglydisagree
disagree agree stronglyagree
people find it difficult tocollaborate
0% 7.10% 92.80% 0%
people find it difficult to collaborate

91
about its success because it might take a long time for the employees and the
companies to get used to it". The other 75% said this method should be implemented
in the future projects as shown in Figure 4.49.
Figure 4.49: The participants' opinion regarding the implementation of LPS in the
future
4.2.3.8 Summary of the results regarding LC using the LPS and other factors in
solving construction problems
To sum up, it was found that the section revealed that in spite of the participants'
limited experience about LC and LPS still they were aware of waste causes,
solutions, CSF difficulties confronting the projects and implementation of new ideas.
Additionally the participants would like to implement new methods and improve
their knowledge but they face many difficulties.
4.4 Summary of the chapter
In this chapter the outcomes and the findings of the practical study of this
investigation were calculated and debated. Also the case study which was conducted
by the researcher was illustrated. This case study was in four stages; (i) LPS training,
Yes 75%
May be 21%
No 4%
Implementation of LPS in the future projects
92
(ii) PPS sessions, (iii) Development of 6 WLAP and WWP, and (iv) LPS
implementation assessment process supported by interviews and questionnaire. The
results exposed the existence of a connection among the findings of some of the
researchers were lead in various spots of the world and the NI. Moreover, to some
extent the theories were encountered over the defendants' responses. For instance, the
respondents' information about LC using the LPS was very restricted and they are
interested of learning it and implementing it in the future projects. Furthermore, the
nominees revealed that many other factors affecting waste and implementing LPS in
the NI. This might relate to the political and cultural issues. Similarly, the results
provided evidences of advantages of planning process.
4.5 Implementing of Lean Construction
Application of Lean saves time and money and decreases the negative environmental
effect and it is required for both today and future needs as it. Despite the hardness of
implementation, it is supposed to be mandatory in the future. Owners and contracting
firms are the most influential sectors on embracing of Lean while design
establishments, consultants, educational institutes, professional bodies and
governments come in the second place. The following are the basic step which is
involved in the development of a model to be implementable in NI. The Flow chart
of Last planner system is shown in the figure 4.50.
The LPS was only implemented half-way through the projects. The research plan
was to undertake the implementation process in four phases with an evaluation being
made at the end of each phase. This incremental implementation is believed to
gradually stabilize the elements of LPS, minimize resistance to change, and have the
additional advantage of providing an opportunity to evaluate each phase and take the
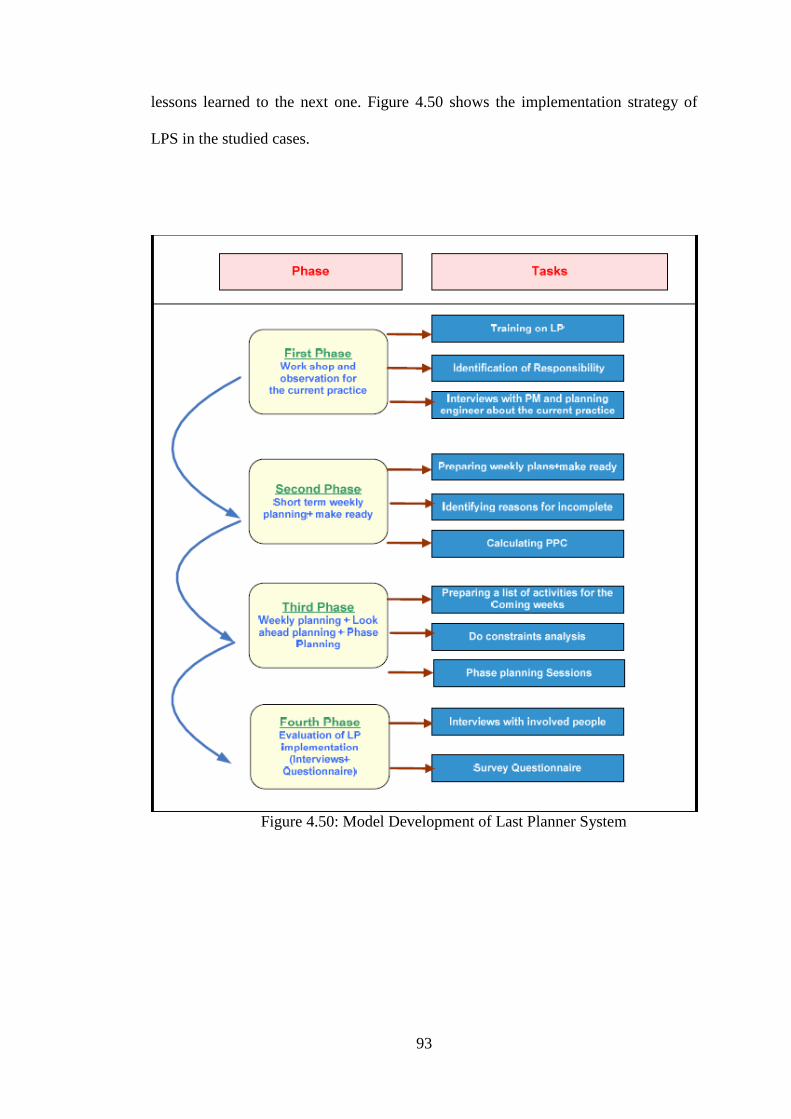
93
lessons learned to the next one. Figure 4.50 shows the implementation strategy of
LPS in the studied cases.
Figure 4.50: Model Development of Last Planner System
94
Chapter 5
CONCLUSION AND RECOMMENDATION
5.1 CONCLUSION
The purpose of this research was to investigate the economic and environmental
benefits of implementing of LC using LPS as a tool in the construction industry as
well as the challenges facing its implementation and recommendation that observed
during this research.
The objective of this study was to implement and evaluate the LPS on a given
project. This study has provided new insights with respect to the issues surrounding
the implementation of a new concept on an ongoing project and the issues related to
implementing the LPS. The following conclusions can be derived from this thesis:
1. The LPS technique proved that it could enhance planning aspects of
construction management practice and bring numerous advantages.
Comparison between PPC ratios computed indicated the successful
implementation of the LPS in the project. Moreover the successful
implementation of the LPS was supported by the fact that the project
management team was able to recover construction activities for structure.
2. Half of the survey participants admitted that the LPS increase workload
sometimes. However, the LPS were a new concept for majority of the
respondents.
3. Although, there were some obstacles preventing the achievement of full
95
potentials of LPS, the implementation process in the project was successful,
as confirmed by the results and outcomes of the survey questionnaire.
4. Survey results identified level of involvement from subcontracting firms as
one of the main barriers hindering the LPS implementation. Majority of
general contractor‘s and owner‘s representatives proposed getting contractual
commitment from the subcontractors.
5.2 Challenges
It seems that there is a shortage in Lean professionals, plus a lack of legal framework
and contract system that enable collaboration between all parties. The awareness of
Lean is still not common within the industry. In addition to the huge initial
investment in IT infrastructure required for implementing LPS.
5.3 Suggestions
Awareness should be increased among the industry professionals specially owners
and contracting firms about the importance of embracing new concepts within the
industry to minimize the negative environmental impacts and maximize the
economic benefits.
In order to enable collaboration between all parties, a new form of legal framework
and contracts should be developed. Educational institutes should provide programs
about new construction management concepts that help to prepare a new generation
of professionals who are ready to implement these concepts on the ground.
5.4 Recommendations for further research
This study recognizes that further research is required in order to better identify the
benefits and challenges of implementing Lean concepts. The following areas are
recommended for more research:
1. Investigation of Lean challenges in each country aside.
96
2. Further researches should be required to investigate in depth the role of
educational institutes and professional bodies in preparing Lean
professionals.
3. Research needed to be carried out on projects owners (real-estate developers,
investors and governments) the results may be helpful in identifying the key
challenges against Lean implementations.
4. Development of a training program, which will train the future last planners
(schedulers, superintendents and foremen) and communicate the goals to all
parties in the construction project. Traditionally, the project participants resist
the change process unless they believe it is both useful and possible,
demonstrated through a proper training program.
5. Customize the existing valuable steps of LPS according to the future
projects/organizations and eliminate wasteful steps.
6. Future studies on LPS can incorporate project control system such as earned
value method along with weekly work plans to improve decision making
process at operational level.
7. A similar study can be tested for different construction projects, i.e.,
infrastructure, communications, heavy engineering, transportation, civil,
healthcare, government, etc.
97
REFERENCES
Adamu, S., & Hamid, R. A. (2012). Lean Construction Techniques Implementation
in Nigeria Construction Industry. Canadian Journal on Environmental,
Construction and Civil Engineering Vol. 3, No. 4, May.
Arayici, Y., & Aouad, G. (2010). Building information modeling (BIM) for
construction lifecycle management. In S. G. Doyle (Ed.), Construction and
Building: Design, Materials, and Techniques (pp. 99-118). NY, USA: Nova
Science Publishers.
Azhar, S. (2011, July). Building Information Modeling (BIM): Trends, Benefits,
Risks, and Challenges for the AEC Industry. Leadership and Management in
Engineering (11), 241-252.
Ballard, G. (2008). The Lean Project Delivery System: An Update. Lean
Construction Journal, 1-19.
Ballard, G., & Howell, G. A. (2003). Lean project management. Building Research
& Information, 31(2).
Ballard, G., Harper, N., & Zabelle, T. (2003). Learning to see work flow: an application
of lean concepts to precast concrete fabrication. Engineering, Construction and
Architectural Management Volume 10. Number 1.
Banawi, A., & Bilec, M. M. (2014, February 17). A framework to improve

98
construction processes: Integrating Lean, Green and Six Sigma. International
Journal of Construction Management, 14(1), 54-55.
doi:10.1080/15623599.2013.875266
Cooperative Research Centre (CRC) for Construction Innovation. (2007). Adopting
BIM for facilities management: Solutions for managing the Sydney Opera
House. Cooperative Research Centre for Construction Innovation. Retrieved
fromhttp://www.constructioninnovation.info/images/CRC_Dig_Model_Book
_20070402_v2.pdf
Dave, B., Boddy, S., & Koskela, L. (2011). Challenges and opportunities in
implementing lean and bim on an infrastructure project. Highways Agency
UK.Retrievedfromhttp://assets.highways.gov.uk/specialistinformation/knowl
edge-compendium/2011-13
Dave, B., Koskela, L., Kiviniemi, A., Owen, R., & Tzortzopoulos, P. (2013).
Implementing Lean in construction: Lean construction and BIM. CIRIA,
C725. London: CIRIA.
Alsehaimi A., & Koskela L. (2008a). What can be learned from studies on delay in
construction, proceedings of the 16th
IGLC conference, July 2008,
Manchester, UK?
Alsehaimi A., & Koskela L. (2008b). Minimizing the causes of delay via
implementing Lean Construction, Proceeding of CIB Dubai Conference,
November 2008, Dubai, UAE.
99
Ballard, G. (1994). "The Last Planner". Spring Conference of the Northern
California Construction Institute, Monterey, CA, April 22-24.
Ballard, G. (1997). Look ahead Planning: The Missing Link in Production Control,
Proc. 5th Annual Conf. Int’l. Group for Lean Constr., IGLC 5, July, Gold
Coast, Australia, 13-26.
Ballard, G. (2000). “The last planner system of production control.” Ph.D.
dissertation, Univ. of Birmingham, Birmingham, U.K
Ballard, G., & Howell, G. (1998). Shielding Production: An Essential Step in
Production Control, Journal of Construction Engineering and Management,
ASCE, 124 (1), 11-17.
Ballard, G., & Howell, G. (2004). An Update on Last Planner, Proc. 11th Annual
Conf. Intl. Group for Lean Construction, Blacksburg, Virginia, USA, 13.
Bell, J. (2002). Questionnaires. In Coleman, M. (Ed.). Research Methods in
Educational Leadership and Management. London: Paul Chapman, 151-
171.
Berg, L. (1989). Qualitative Research Methods for the Social Sciences. London:
Allyn and Bacon.
Brown, D., & Rodgers, S. (2002). Doing Second Language Research. Oxford:
Oxford University Press.
100
Burns, A. (1999). Collaborative Action Research for English Language Teachers.
Cambridge: Cambridge University Press.
Cohen, L., Manion, L., & Morrison, K. (2000). Research Methods in Education.
(5th Ed.). New York: Routledge.
Dornyei, Z. (2002). Questionnaires in Second Language Research: Construction,
Administration and Processing. Mahwah, NJ: Lawrence Erlbaum
Associates.
Dornyei, Z. (2003) Attitudes, Orientation and Motivations in Language Learning:
Advances in Theory Research and Applications. Language Learning, 53 (1),
3-32.
Hedrick, T. E., Bickman, L., & Rog, D. J. (1993). Applied Research Design: A
Practical Guide. Applied Social Research Methods Series. Vol.32. London:
Sage.
Dick, B. (2002) Action Research: Action and Research, available at
http://www.scu.edu.au/schools/gcm/ar/arp/aandr.html, accessed on
08/12/2011.
Forbes, L.H., Ahmed, S.M., & Barcala, M. (2004) ―Adapting Lean Construction
Theory for Practical Application in Developing Countries.‖ Technical
Report No.22, College of Engineering, Florida International University,
Miami, FL.

101
Garza, J. M. D. L., & Leong, M. (2000). "Last planner technique: A case study."
Construction Congress VI: Building together for a Better Tomorrow in an
Increasingly Complex World, February 20, 2000 - February 22, American
Society of Civil Engineers, Orlando, FL, United states, 680-689.
Gummesson, E. (2000), Qualitative Methods in Management Research, 2nd
edition. Thousand Oaks, CA: Sage Publications.
Hamzeh, F. R., Ballard, G., & Tommelein, I.D. (2008). Improving Construction
Workflow- The Connective Role of Lookahead Planning, Proceedings of
the 16th Annual Conference of the International Group for Lean
Construction, IGLC 16, 16-18 July, Manchester, UK, 635-646.
Howell, G. (1999). What is Lean Construction-1999, Proceedings of 6th
IGLC
Conference, California, and Berkeley?
Diekmann, J. E., Krewedl, M., Balonick, J., Stewart, T., & Won, S. (2004).
Application of Lean Manufacturing Principles to Construction. Austin,
Texas: The Construction Industry Institute, the University of Texas at Austin.
Fontanini, P. S., & Picche, F. A. (2004). Value Stream Macro Mapping-A Case Study of
Aluminum Windows for Construction Supply Chain. 12th Conference of the
International Group for Lean Construction (IGLC 12).
Forbes, L. H., & Ahmed, S. M. (2011). Modern construction: lean project delivery
and integrated practices. USA: CRC Press, Taylor & Francis Group.
102
Formoso, C. T., Isatto, E. L., & Hirota, a. E. (1999). Method for Waste Control in the
Building Industry. IGLC-7 (pp. 325-334). University of California, Berkeley,
CA, USA: IGLC.
Garrett, D. F., & Lee, J. (2010, Dec 04). Lean Construction Submittal Process—A
Case Study. Quality Engineering, 23(1), pp. 84-93.
Gilligan, B., & Kunz, J. (2007). VDC Use in 2007: Significant Value, Dramatic
Growth, and Apparent Business Opportunity. Stanford University. Center for
Integrated Facility Engineering. Retrieved from
http://cife.stanford.edu/sites/default/files/TR171.pdf
Hoffman, A., & Henn, R. (2008). Overcoming the social and psychological barriers
to green building. Organ. Environ. 21(4), 390–419.
Howell, G. A. (1999). What Is Lean Construction? Seventh Conference of the
International Group for Lean Construction (pp. 1-10). Berkeley, California,
USA: The International Group for Lean Construction.
Integrated project delivery: an updated working definition. (2014, 7 15). The
American Institute of Architects, California Council. Retrieved from
http://www.aiacc.org/wp-content/uploads/2014/07/AIACC_IPD.pdf
Jr., J. A., & Michel, J. F. (2009). Lean project delivery: A winning strategy for
construction and real estate development. Grant Thornton LLP. Retrieved
from:http://www.grantthornton.com/staticfiles/GTCom/files/Industries/Const

103
ructionRealEstateAndHospitality/BB_stand%20alone%20article_FINAL.pdf
Keys, A., Baldwin, A. N., & Austin, S. A. (2000). Designing to encourage waste
minimization in the construction industry. CIBSE National Conference,
CIBSE2000. Dublin.
Kim, J.-J., & Rigdon, B. (1998, December). Introduction to Sustainable Design.
National Pollution Prevention Center for Higher Education. Retrieved from
http://www.umich.edu/~nppcpub/resources/compendia/ARCHpdfs/ARCHdes
Intro.pdf

104
APPENDIXES
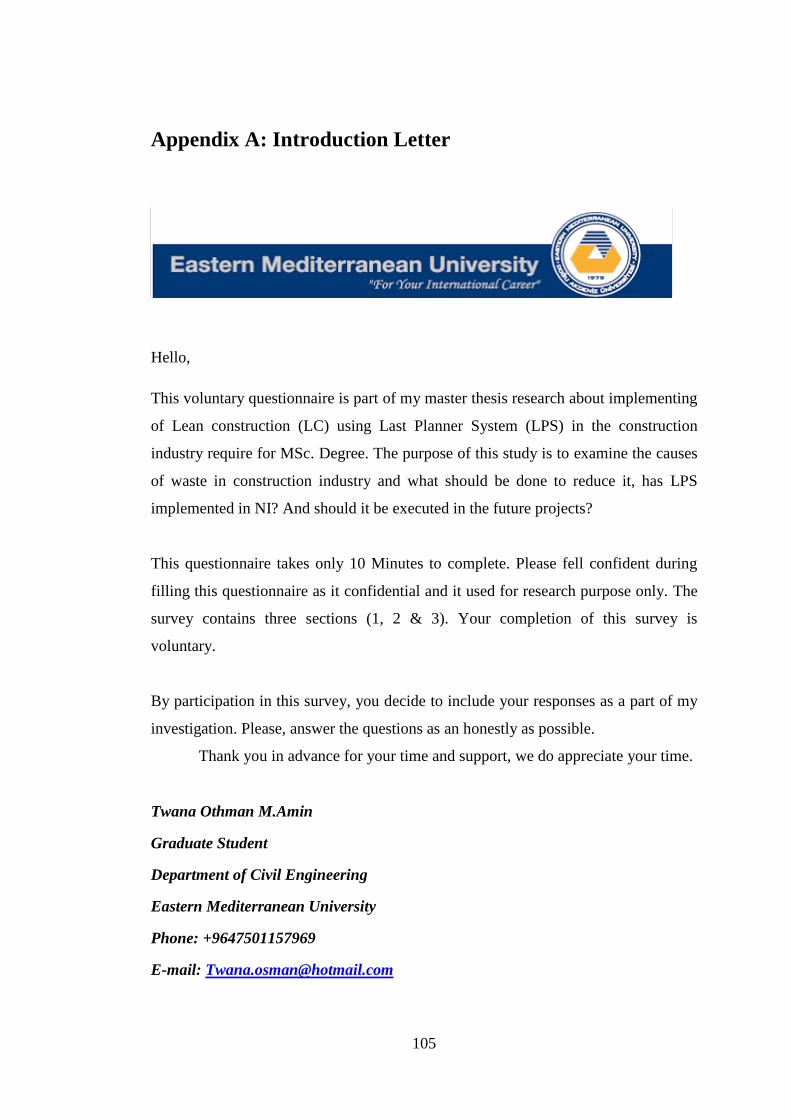
105
Appendix A: Introduction Letter
Hello,
This voluntary questionnaire is part of my master thesis research about implementing
of Lean construction (LC) using Last Planner System (LPS) in the construction
industry require for MSc. Degree. The purpose of this study is to examine the causes
of waste in construction industry and what should be done to reduce it, has LPS
implemented in NI? And should it be executed in the future projects?
This questionnaire takes only 10 Minutes to complete. Please fell confident during
filling this questionnaire as it confidential and it used for research purpose only. The
survey contains three sections (1, 2 & 3). Your completion of this survey is
voluntary.
By participation in this survey, you decide to include your responses as a part of my
investigation. Please, answer the questions as an honestly as possible.
Thank you in advance for your time and support, we do appreciate your time.
Twana Othman M.Amin
Graduate Student
Department of Civil Engineering
Eastern Mediterranean University
Phone: +9647501157969
E-mail: [email protected]
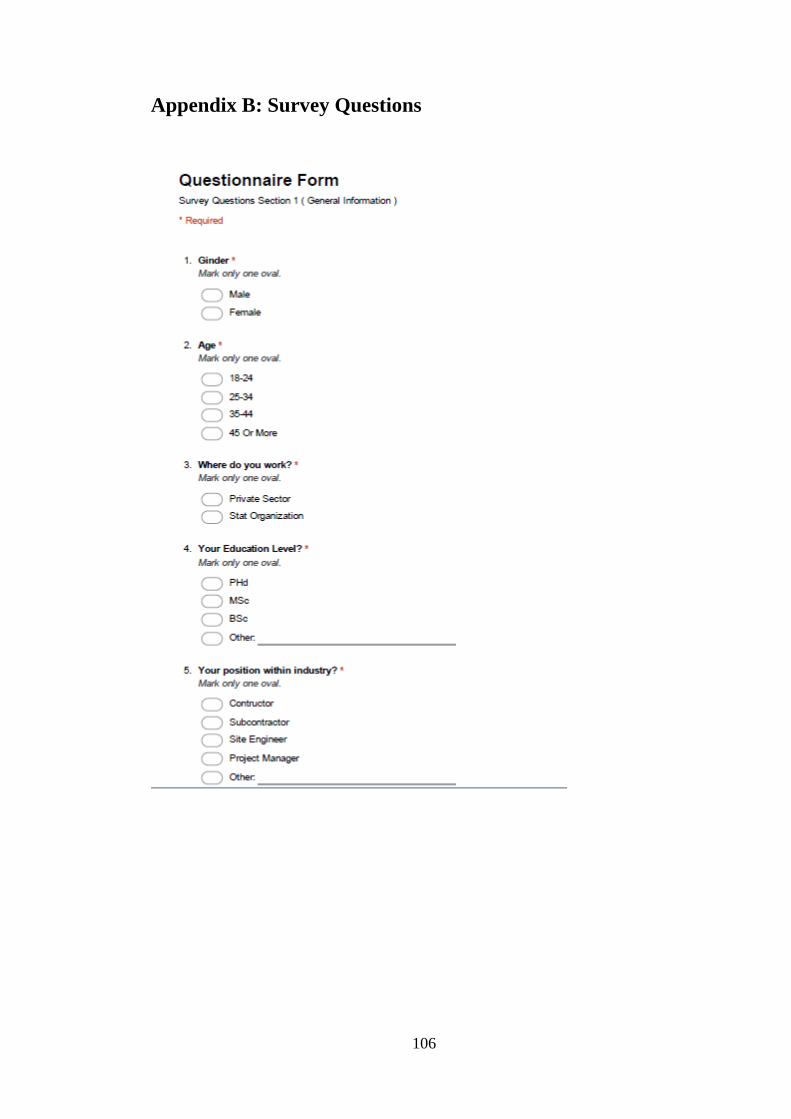
106
Appendix B: Survey Questions

107
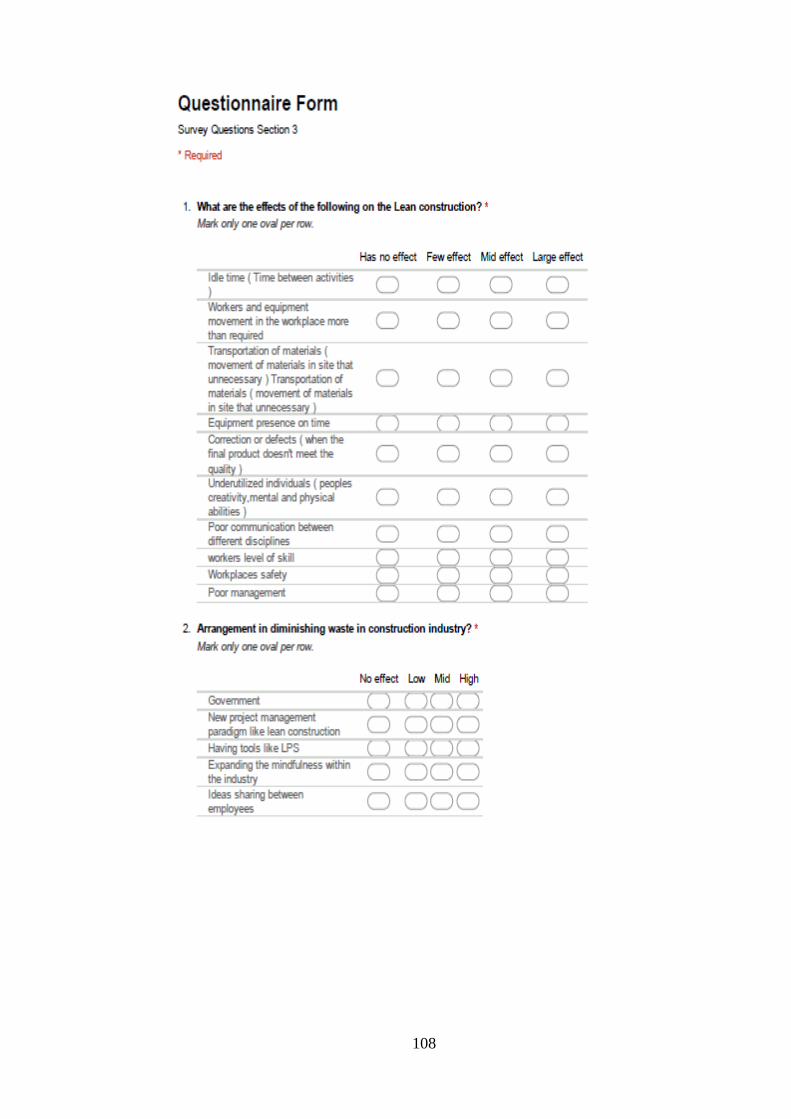
108
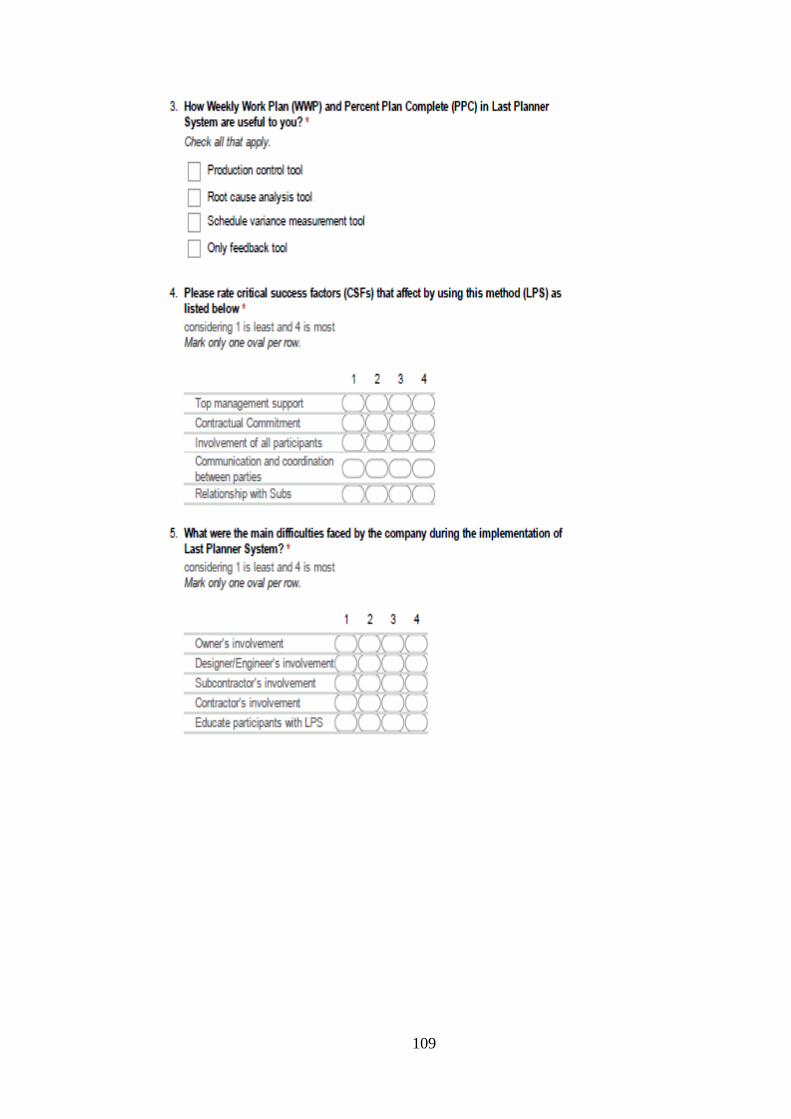
109

110