implementing should-be costing - procureforce.co · implementing should-be costing ... a recording...
TRANSCRIPT

Implementing Should-Be Costing September 14, 2016

2
Attendees will be in listen only mode
A recording of this presentation and the slides will be available on the APD Website
Webinar attendees who complete the webinar feedback survey will receive the slides by email
Welcome to the Webinar

3
We make purchasing a competitive advantage
We lever a network of >10,000
supply chain professionals,
and have both onshore and
offshore delivery capabilities
Our solutions are empowered
by a purpose built, proprietary
technology platform
We have a database of >1,000
cost elements based of >850
cost blueprints.
All of our solutions are provided on a modular, as-a-service, basis.
People Tools &
Technology Intelligence

4
Today’s Presenter:
Jeoff Burris Principal, Advanced Purchasing Dynamics
▸ >20 years manufacturing purchasing experience
▸ Founded APD in 2004
▸ Helps clients make their investment in purchasing a competitive advantage

5
Today’s Presenter:
Steve Haburne Business Solutions Specialist, Advanced Purchasing Dynamics
▸ Project Management Leadership for Consulting and ProcureForce Implementation
▸ 3 years with APD’s ProcureForce Technology Platform
▸ Helps clients make their investment in purchasing a competitive advantage

On Demand Webinars and White Papers
Visit the APD Knowledge Center
http://www.apurchasingd.com/knowledge-center/

7
Webinar: October 19 – 10:00 EST
Adding Value on
New Programs
58% of the CEO’s we surveyed questioned the value
their purchasing organizations drop to the bottom
line. An often cited statistic is that 70-80% of a
products cost structure is determined during the time it
is being developed.
This webinar will identify the practices leading
purchasing organizations employ to add value during
the design phase and how APD’s ProcureForce
software supports those practices.

8
Webinar: October 26 – 10:00 EST
Recruiting – and Retaining – Purchasing Superheroes The market for purchasing talent is very hot. Join us to learn what it takes to land highly sought after purchasing professionals, and what you can do to retain your top performers. We’ll share insights from our recent survey of nearly 200 purchasing professionals, as well as strategies we’ve seen work in this highly competitive marketplace.

9
Purpose
Identify the savings potential of should be
costing tools.
Overview the steps companies are taking
to implement cost tools.
Demonstrate how ProcureForce helps
them achieve the savings.

10
Agenda
APD Intro
Introduction to the cost and collaboration curve
Attribute models
Optimizing detailed cost breakdowns
Statistical should be models
Wrap up
11
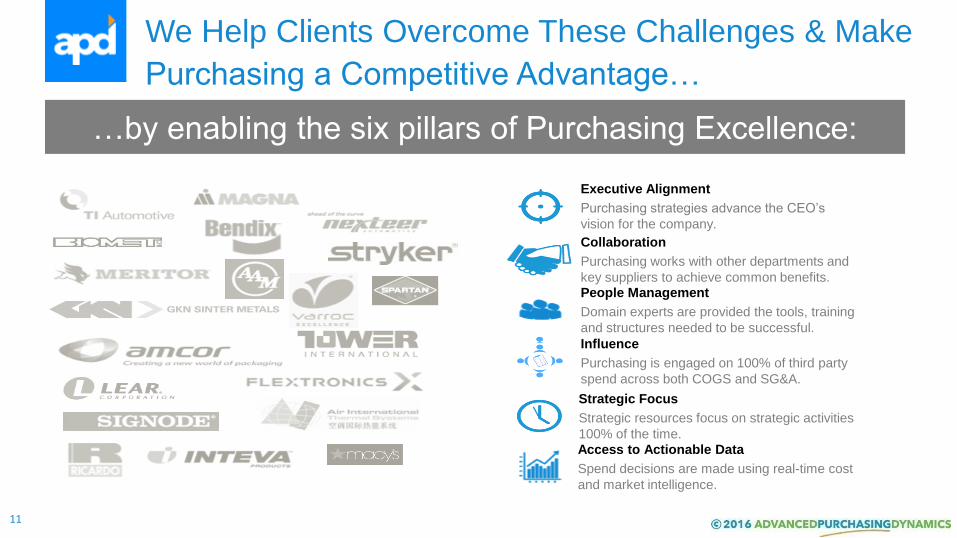
…by enabling the six pillars of Purchasing Excellence:
We Help Clients Overcome These Challenges & Make
Purchasing a Competitive Advantage…
Executive Alignment
Purchasing strategies advance the CEO’s
vision for the company.
Collaboration
Purchasing works with other departments and
key suppliers to achieve common benefits. People Management
Domain experts are provided the tools, training
and structures needed to be successful.
Strategic Focus
Strategic resources focus on strategic activities
100% of the time.
Influence
Purchasing is engaged on 100% of third party
spend across both COGS and SG&A.
Access to Actionable Data
Spend decisions are made using real-time cost
and market intelligence.

12
Introducing APD
We have 12 years of experience in empowering Purchasing
teams to focus on what they do best.
People
Supply strategies should be built
and implemented by domain
experts who spend 100% of their
time on value added activities
Intelligence Tools & Tech
Sourcing and pricing decisions
should be made based on a
detailed understanding of cost
drivers and market intelligence
Customized solutions; There is no one size fits all approach.
The execution of market leading
supply strategies should be
expedited by the use of built-for-
purpose technology and
processes
➤ Find purchasing professionals
(direct hire or contract)
➤ Low cost purchasing support
services Center of Excellence
➤ Buyer skill development
training
➤ Open-book cost models
➤ Real-time analysis of supplier
price quotes
➤ Identification of capable
suppliers
➤ Benchmark cost models
➤ Cloud based, SaaS tool for
Sourcing with Should Be
Costing
➤ Library of over 850 cost
models to determine “should-
cost” pricing
➤ Sourcing blueprints that cover
all major spend areas

13
USA
Leadership, Program
Management and
Governance
India
Purchasing Support &
Analytics Center of
Excellence
Plymouth, MI
Chennai, India
Delivered by a Distributed Global Model
APD’s leadership team has over 10 years of experience in delivering
purchasing support and analytics services from Chennai.

14
“we spend so much time on administrative tasks that my team cannot
focus on the value added work they need to perform to succeed”
We Frequently Hear these Challenges from
Purchasing Leaders
“we collect so much data from our suppliers, but we do not
have a good way of turning that into actionable intelligence”
“we do not have a strong understanding of what products or
services should cost, and so we rely on the market or our
suppliers to tell us” Purchasing Leader

15
Multiple Tool Approach
2-5 %
3-6 %
3-7 %
Price Focused
Knowledge Based
Collaborative
GOAL

16
Difficulty and Benefit of Moving up the Curve
Easy with High Return
Easy with Low Return
Difficult with High Return
Difficult with Low Return

17
Single Tool Approach to Pricing

18
Multiple Tool Approach

19
Where are your commodities now?

20
Results of survey
Used on 80-100% of spend
Used on 60-79% of spend
Used on 40-59% of spend
Used on 20-39% of spend
Used on 1-19% of spend
Not Used
Piece Price is the only Tool Used
11% 22% 11%
Detailed Cost Breakdowns
44% 11% 11% 22%
Cost Models Using
Information from Detailed Cost Breakdowns
11% 11% 33%
Regression Models
11% 33%
E-auctions 11% 22%
Cost Estimates Developed By a Cost Estimating Group of Person
11% 11% 22%

21
How APD Customers Have Progressed
Value
Alignment
Open Book - through market testing
new or existing components
Knowledge Based Quote Model - through market testing new or existing components
Attribute Based Quote Model development through market
testing or analysis of existing pricing
Variance Analysis of existing quote history
Cost Breakdown improvement

22
ProcureForce is a technology platform
that optimizes the way manufacturers
deliver savings and manage direct
material purchases.
ProcureForce.co
ProcureForce
23
ProcureForce
Commodity specific cost
breakdowns
Aggregated data
Should be cost model
development
Buyer efficiency
24
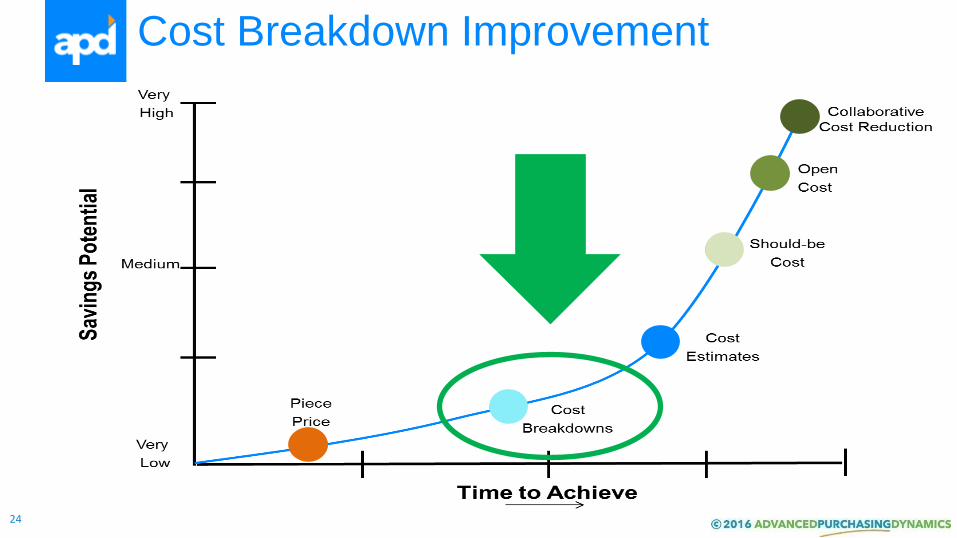
Cost Breakdown Improvement

25
The Case for Cost Breakdowns
Provides buyers and managers with actionable data to
improve purchased material cost.
Provides information required to understand global
sourcing opportunities.
Improves negotiation results regardless of the negotiating
model.
Can form the basis for more collaborative supplier
relationships based upon cost models and tools to reduce
waste and cost.

26
Benefits to Buyers
Data driven approach, used consistently makes issue resolution easier.
Can change the tenor of negotiations from positional (win/lose) to less stressful, more collaborative, partnership based.
Increases buyers knowledge of operations as well as cost accounting thus providing more ability for lateral and promotional organization moves.

27
Benefits to Suppliers
More objective and equitable quoting process.
Provide supplier feedback on cost competitiveness.
Ensures pricing is tied to cost.
Common understanding of cost structure provides supplier and customer with the basis for a collaborative relationship.
28
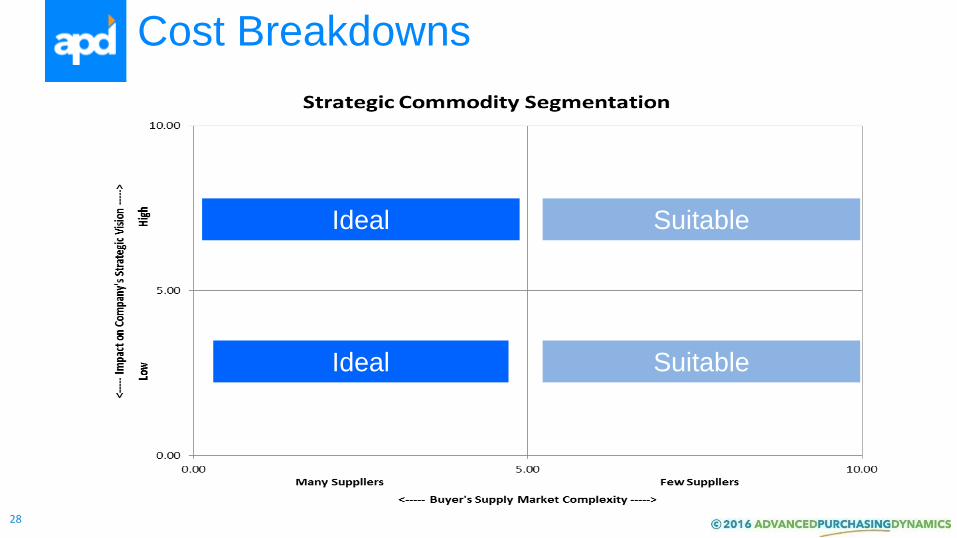
Cost Breakdowns
Ideal
Suitable Ideal
Suitable
29
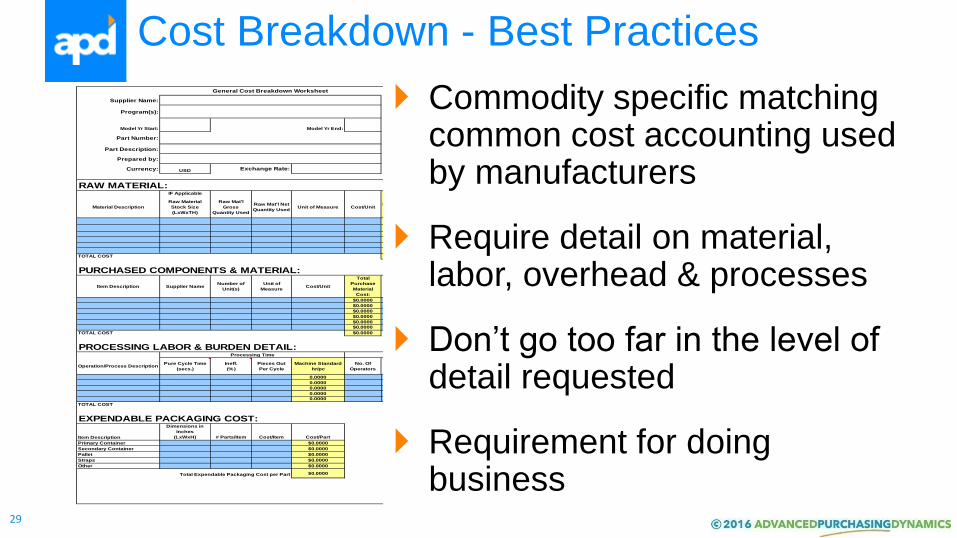
Cost Breakdown - Best Practices
Supplier Name: Date: Annual Volume Quoted:
Program(s): PCRN #Supplier Mfg. Location:
Model Yr Start: Model Yr End:RFQ
Supplier Shipping Location:
Part Number: REV LEVELCustomer Ship To Location:
Part Description: Tooling Capacity:
Prepared by:
Currency: USD
RAW MATERIAL:IF Applicable
Material Description
Raw Material
Stock Size
(LxWxTH)
Raw Mat'l
Gross
Quantity Used
Raw Mat'l Net
Quantity UsedUnit of Measure Cost/Unit
Gross Raw
Material Cost
Total
$
Scrap Weight
Scrap
Resale
Cost/Unit
Eng. Scrap
Credit
$
Raw Material
Cost:
Process Scrap
%
Process Scrap
$
Raw Mat'l
SG&A
Markup %
Raw Mat'l
Profit Markup
%
Markup Total
$
Total Raw
Material Cost:
$0.0000 0.00 $0.0000 $0.0000 $0.0000 $0.0000 $0.0000
$0.0000 0.00 $0.0000 $0.0000 $0.0000 $0.0000 $0.0000
$0.0000 0.00 $0.0000 $0.0000 $0.0000 $0.0000 $0.0000
$0.0000 0.00 $0.0000 $0.0000 $0.0000 $0.0000 $0.0000
$0.0000 0.00 $0.0000 $0.0000 $0.0000 $0.0000 $0.0000
$0.0000 0.00 $0.0000 $0.0000 $0.0000 $0.0000 $0.0000
TOTAL COST $0.0000 $0.0000 $0.0000 $0.0000 $0.0000 $0.0000
PURCHASED COMPONENTS & MATERIAL:
Item Description Supplier NameNumber of
Unit(s)
Unit of
MeasureCost/Unit
Total
Purchase
Material
Cost:
Process
Scrap %
Process
Scrap $
Purch.
Comp.
SG&A
Markup %
Purch. Comp.
Profit Markup
%
Markup Total
$
Total
Purchase
Material Cost
$0.0000 $0.0000 $0.0000 $0.0000
$0.0000 $0.0000 $0.0000 $0.0000
$0.0000 $0.0000 $0.0000 $0.0000
$0.0000 $0.0000 $0.0000 $0.0000
$0.0000 $0.0000 $0.0000 $0.0000
$0.0000 $0.0000 $0.0000 $0.0000
TOTAL COST $0.0000 $0.0000 $0.0000 $0.0000
PROCESSING LABOR & BURDEN DETAIL:
Operation/Process DescriptionPure Cycle Time
(secs.)
Ineff.
(%)
Pieces Out
Per Cycle
Machine Standard
hr/pc
No. Of
Operators
Direct Labor
Rate
($/hr)
Labor Fringe
Rate
($/hr)
Labor Cost
($)
Equipment
TypeBurden Rate
Burden/Overh
ead Cost
Total Labor &
Burden Cost
Process
Scrap %
Process
Scrap $
Processing
SG&A
Markup %
Processing
Profit Markup
%
Markup Total
$
Total
Processing
Cost
0.0000 $0.0000 $0.0000 $0.0000 $0.0000 $0.0000 $0.0000
0.0000 $0.0000 $0.0000 $0.0000 $0.0000 $0.0000 $0.0000
0.0000 $0.0000 $0.0000 $0.0000 $0.0000 $0.0000 $0.0000
0.0000 $0.0000 $0.0000 $0.0000 $0.0000 $0.0000 $0.0000
0.0000 $0.0000 $0.0000 $0.0000 $0.0000 $0.0000 $0.0000
TOTAL COST $0.0000 $0.0000 $0.0000 $0.0000 $0.0000 $0.0000
Item Description
Dimensions in
Inches
(LxWxH) # Parts/Item Cost/Item Cost/Part $0.0000
Primary Container $0.0000 $0.0000
Secondary Container $0.0000 $0.0000
Pallet $0.0000 % of TMC #DIV/0! $0.0000
Straps $0.0000 $0.0000
Other $0.0000 $0.0000
Total Expendable Packaging Cost per Part $0.0000 $0.0000
$0.0000
EXPENDABLE PACKAGING COST: FREIGHT COST: PRICE SUMMARY:
General Cost Breakdown Worksheet
Note: YELLOW CELLS are
automatically calculated: BLUE
CELLS are inputted by supplierExchange Rate:
Processing Time Direct Labor Cost Manufacturing Burden/Overhead Cost
Terms Quoted
(Input Ex-Works or
Delivered) Ex-Works Total Raw Mat'l and Purch. Component Cost
Title Transfer Point Total Labor & Burden Processing Costs
Grand Total Proposed Piece Price w/Freight
Supplier Mfg. Location Total Manufacturing Cost (TMC)
Mfg. Location Total SG&A and Profit Cost
Freight Cost per Part Packaging Cost
Freight
Grand Total Proposed Piece Price w/o Freight
0.0% 0.0% 0.0% 0.0% 0.0% 0.0%0.0%
10.0%
20.0%
30.0%
40.0%
50.0%
60.0%
70.0%
80.0%
90.0%
100.0%
Raw Mat'l Purchase Mat'l Labor & Burden SG&A & Profit Packaging Freight
% o
f To
tal P
ropo
sed
Pie
ce P
rice
Category
% Breakout Comparison to Grand Total Proposed Piece Price
Commodity specific matching common cost accounting used by manufacturers
Require detail on material, labor, overhead & processes
Don’t go too far in the level of detail requested
Requirement for doing business
30
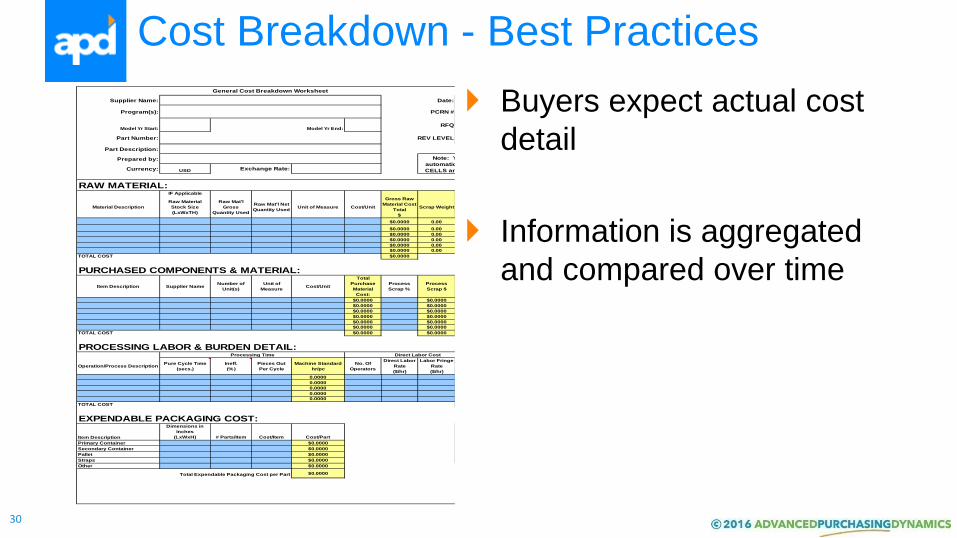
Cost Breakdown - Best Practices
Supplier Name: Date: Annual Volume Quoted:
Program(s): PCRN #Supplier Mfg. Location:
Model Yr Start: Model Yr End:RFQ
Supplier Shipping Location:
Part Number: REV LEVELCustomer Ship To Location:
Part Description: Tooling Capacity:
Prepared by:
Currency: USD
RAW MATERIAL:IF Applicable
Material Description
Raw Material
Stock Size
(LxWxTH)
Raw Mat'l
Gross
Quantity Used
Raw Mat'l Net
Quantity UsedUnit of Measure Cost/Unit
Gross Raw
Material Cost
Total
$
Scrap Weight
Scrap
Resale
Cost/Unit
Eng. Scrap
Credit
$
Raw Material
Cost:
Process Scrap
%
Process Scrap
$
Raw Mat'l
SG&A
Markup %
Raw Mat'l
Profit Markup
%
Markup Total
$
Total Raw
Material Cost:
$0.0000 0.00 $0.0000 $0.0000 $0.0000 $0.0000 $0.0000
$0.0000 0.00 $0.0000 $0.0000 $0.0000 $0.0000 $0.0000
$0.0000 0.00 $0.0000 $0.0000 $0.0000 $0.0000 $0.0000
$0.0000 0.00 $0.0000 $0.0000 $0.0000 $0.0000 $0.0000
$0.0000 0.00 $0.0000 $0.0000 $0.0000 $0.0000 $0.0000
$0.0000 0.00 $0.0000 $0.0000 $0.0000 $0.0000 $0.0000
TOTAL COST $0.0000 $0.0000 $0.0000 $0.0000 $0.0000 $0.0000
PURCHASED COMPONENTS & MATERIAL:
Item Description Supplier NameNumber of
Unit(s)
Unit of
MeasureCost/Unit
Total
Purchase
Material
Cost:
Process
Scrap %
Process
Scrap $
Purch.
Comp.
SG&A
Markup %
Purch. Comp.
Profit Markup
%
Markup Total
$
Total
Purchase
Material Cost
$0.0000 $0.0000 $0.0000 $0.0000
$0.0000 $0.0000 $0.0000 $0.0000
$0.0000 $0.0000 $0.0000 $0.0000
$0.0000 $0.0000 $0.0000 $0.0000
$0.0000 $0.0000 $0.0000 $0.0000
$0.0000 $0.0000 $0.0000 $0.0000
TOTAL COST $0.0000 $0.0000 $0.0000 $0.0000
PROCESSING LABOR & BURDEN DETAIL:
Operation/Process DescriptionPure Cycle Time
(secs.)
Ineff.
(%)
Pieces Out
Per Cycle
Machine Standard
hr/pc
No. Of
Operators
Direct Labor
Rate
($/hr)
Labor Fringe
Rate
($/hr)
Labor Cost
($)
Equipment
TypeBurden Rate
Burden/Overh
ead Cost
Total Labor &
Burden Cost
Process
Scrap %
Process
Scrap $
Processing
SG&A
Markup %
Processing
Profit Markup
%
Markup Total
$
Total
Processing
Cost
0.0000 $0.0000 $0.0000 $0.0000 $0.0000 $0.0000 $0.0000
0.0000 $0.0000 $0.0000 $0.0000 $0.0000 $0.0000 $0.0000
0.0000 $0.0000 $0.0000 $0.0000 $0.0000 $0.0000 $0.0000
0.0000 $0.0000 $0.0000 $0.0000 $0.0000 $0.0000 $0.0000
0.0000 $0.0000 $0.0000 $0.0000 $0.0000 $0.0000 $0.0000
TOTAL COST $0.0000 $0.0000 $0.0000 $0.0000 $0.0000 $0.0000
Item Description
Dimensions in
Inches
(LxWxH) # Parts/Item Cost/Item Cost/Part $0.0000
Primary Container $0.0000 $0.0000
Secondary Container $0.0000 $0.0000
Pallet $0.0000 % of TMC #DIV/0! $0.0000
Straps $0.0000 $0.0000
Other $0.0000 $0.0000
Total Expendable Packaging Cost per Part $0.0000 $0.0000
$0.0000
EXPENDABLE PACKAGING COST: FREIGHT COST: PRICE SUMMARY:
General Cost Breakdown Worksheet
Note: YELLOW CELLS are
automatically calculated: BLUE
CELLS are inputted by supplierExchange Rate:
Processing Time Direct Labor Cost Manufacturing Burden/Overhead Cost
Terms Quoted
(Input Ex-Works or
Delivered) Ex-Works Total Raw Mat'l and Purch. Component Cost
Title Transfer Point Total Labor & Burden Processing Costs
Grand Total Proposed Piece Price w/Freight
Supplier Mfg. Location Total Manufacturing Cost (TMC)
Mfg. Location Total SG&A and Profit Cost
Freight Cost per Part Packaging Cost
Freight
Grand Total Proposed Piece Price w/o Freight
0.0% 0.0% 0.0% 0.0% 0.0% 0.0%0.0%
10.0%
20.0%
30.0%
40.0%
50.0%
60.0%
70.0%
80.0%
90.0%
100.0%
Raw Mat'l Purchase Mat'l Labor & Burden SG&A & Profit Packaging Freight
% o
f To
tal P
ropo
sed
Pie
ce P
rice
Category
% Breakout Comparison to Grand Total Proposed Piece Price
Buyers expect actual cost
detail
Information is aggregated
and compared over time
31
Variance Analysis
Analysis of multiple detailed cost
breakdowns
Identify savings opportunities

32
Step 1
Extract & consolidate the cost elements from quotation history.
Step 2
Identify the cost variances across material, labor, burden, cycle time, SG&A and packaging.
Step 3
Identify areas for investigation.
Part NumberAnnual
Volume
Supplier
Pricing
Variance as a
Service
Per Piece
Difference% Opportunity
Annual
Opportunity
Part 1 330,810 $1.3676 $1.0767 ($0.2909) -27.02% $96,226
Part 2 307,000 $1.3841 $1.3304 ($0.0538) -4.04% $16,506
Part 3 237,000 $1.1758 $1.1758 $0.0000 0.00% $0
Part 4 156,600 $1.3230 $1.0489 ($0.2740) -26.12% $42,914
Part 5 116,000 $1.1693 $0.9422 ($0.2271) -24.11% $26,349
Part 6 107,000 $1.2599 $1.0271 ($0.2328) -22.66% $24,906
Part 7 175,000 $1.2731 $1.0546 ($0.2185) -20.72% $38,239
$1,856,427 $1,611,287 ($245,140) -13% $245,140Totals
Variance as a Service
$0.00
$0.20
$0.40
$0.60
$0.80
$1.00
$1.20
$1.40
Part 1 Part 2 Part 3 Part 4 Part 5 Part 6 Part 7
Supplier Quote vs. Variance as a Service Price
Supplier Pricing
Variance as aService
Variance Analysis
ProcureForce Demo
34
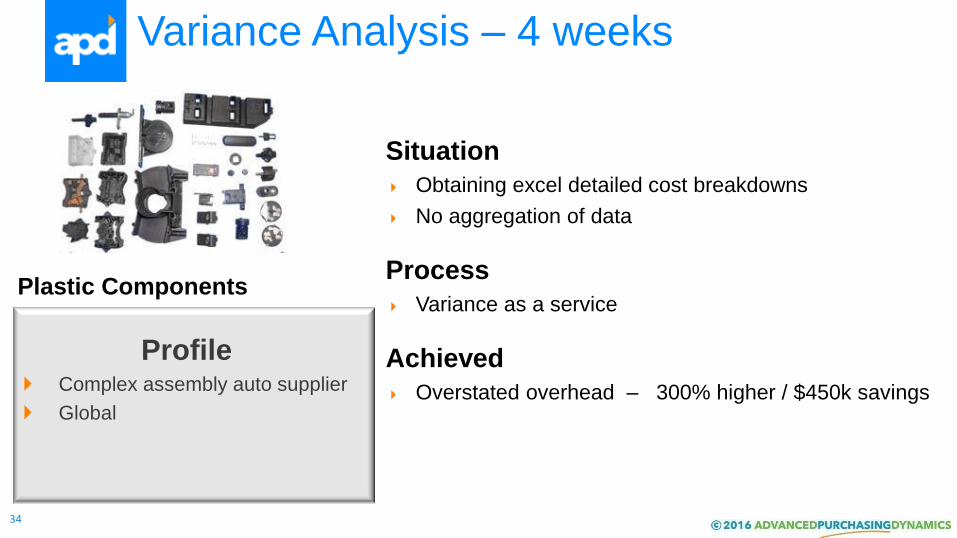
Profile Complex assembly auto supplier
Global
Variance Analysis – 4 weeks
Situation
Obtaining excel detailed cost breakdowns
No aggregation of data
Process
Variance as a service
Achieved
Overstated overhead – 300% higher / $450k savings
Plastic Components

35
Profile Interior Systems Automotive
Supplier
Global
Variance Analysis & Benchmarking – 12 weeks
Situation
Obtaining excel detailed cost breakdowns
No aggregation of data
Process
Variance as a service combined with benchmarking
Achieved
Identified $4.1 mil of savings on $34 mil of spend
Same purchased component 40% higher price -- $294 k savings
Complex Assemblies
36
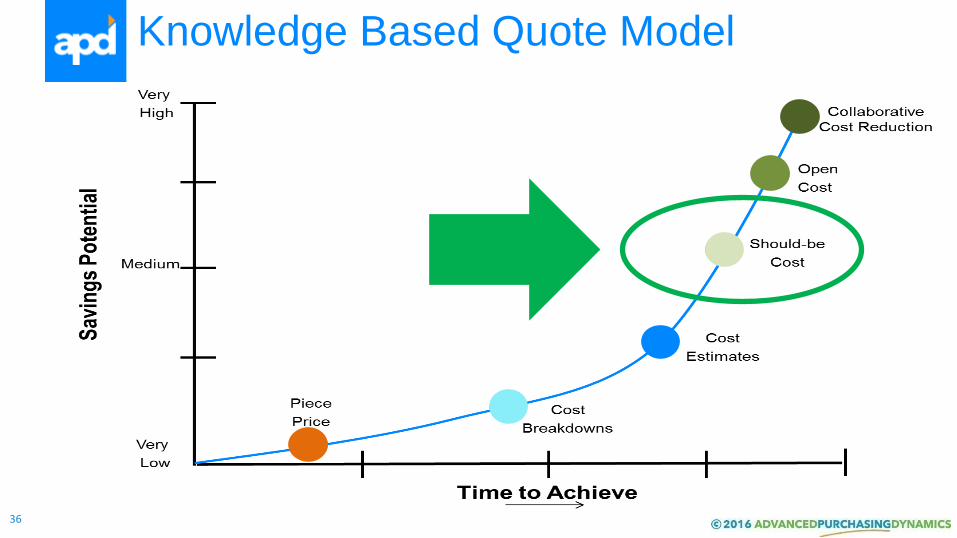
Knowledge Based Quote Model

37
Knowledge Based Quote Model
Statistic based developed using data
gathered through knowledge based quote
activity with a high degree of accuracy and
competitive pressure.

38
Would it be beneficial to know?
That a suppliers labor rate is in the top 10% in competitiveness?
The likelihood that a supplier in Mexico would have an overhead rate of $100?
What quote should be if all the cost drivers are of average value?
What quote should be if all cost drivers were in the top 25%?

39
Statistical Analysis
Statistical Analysis provides us with the ability to analyze cost data from a large number of detailed cost breakdowns to: Determine the relative competitiveness of
suppliers cost structures.
Provide credible feedback to suppliers on their cost competitiveness.
Develop knowledge based cost models.

40
Ideal
Suitable Ideal
Suitable
Knowledge Based Quote Model

41
Building a Statistical Model
Step 1
Extract & consolidate the cost elements from quotation history.
Step 2
Create a statistical model.
Step 3
Compare supplier quotes to the model.

ProcureForce Demo

43
Profile Complex assembly powertrain
manufacturer
Refocusing business to core
and non-core processes
From No Price to Statistical Model – 22 Weeks
Situation
PM production viewed as non-strategic
100 components to source
No supply Base
No history of detailed cost breakdowns.
Limited review of cost competiveness on 30% of spend
Process
Utilized multi round market test in awardable lots
Engaged 22 suppliers in first round
Achieved
Achieved $182k/10% reduction
Identified low cost supply base
Developed statistical model for US
Powdered Metal Components

44
Profile Specialty vehicle OEM
Highly customized
From Price to Statistical Model – 14 Weeks
Situation
12 suppliers – US and Mexico
Short lead times on 30% of spend leaving no time for competitive sourcing
No history of detailed cost breakdowns
Process
Utilized multi round market test of 10% of total spend
Achieved
$220k/16% savings
Obtained and verified detailed cost breakdowns
Identified 4 low cost producers
Developed statistical models for Mexico and US
Wire Harnesses

45
Attribute Cost Models
46
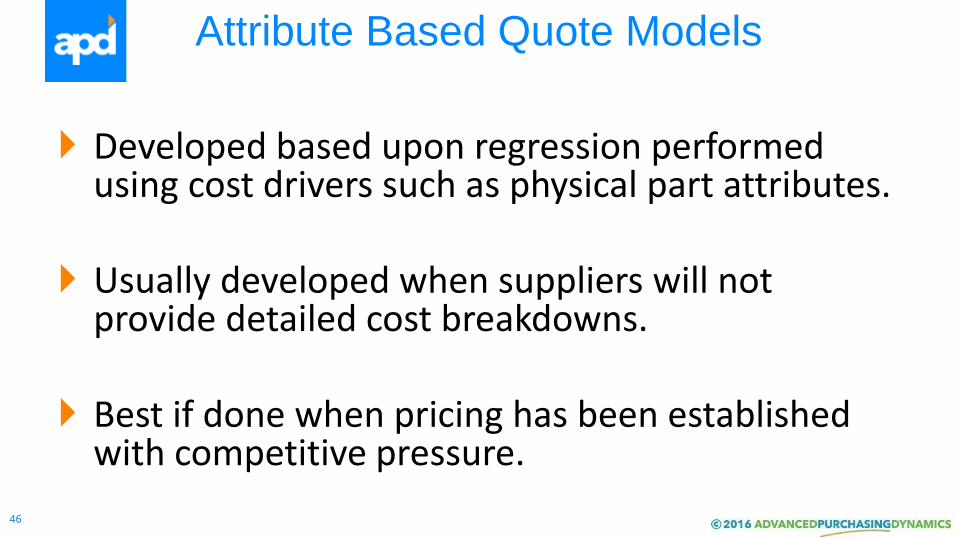
Attribute Based Quote Models
Developed based upon regression performed using cost drivers such as physical part attributes.
Usually developed when suppliers will not provide detailed cost breakdowns.
Best if done when pricing has been established with competitive pressure.

47
Attribute Based Quote Models
Does not require supplier participation.
Easy to develop.
Less accurate – used mostly to identify “outliers” for investigation.
Used for Bearings, Seals, Motors…..
Easily combined with a benchmarking center

48
Attribute Models
Suitable
Ideal
Suitable
Suitable

49
Building a Regression Model
Step 1
Brainstorm Possible Cost Drivers
Step 2
Collect Data
Step 3
Use Excel to run Regression Analysis and Generate Regression Model
SUMMARY OUTPUT
Regression Statistics
Multiple R 0.998329266
R Square 0.996661324
Adjusted R Square 0.995910121
Standard Error 0.157570411
Observations 50
ANOVA
df SS MS F Significance F
Regression 9 296.4712646 32.94125163 1326.755088 1.30381E-46
Residual 40 0.993137375 0.024828434
Total 49 297.464402
Coefficients Standard Error t Stat P-value Lower 95% Upper 95% Lower 95.0% Upper 95.0%
Intercept 0.667731785 0.101002613 6.611034742 6.55205E-08 0.463597889 0.871865681 0.463597889 0.871865681
Length of Tube (ft) 0.210507973 0.038580536 5.45632578 2.74035E-06 0.132533801 0.288482144 0.132533801 0.288482144
Diameter of Tube (in) 0.401705199 0.087802546 4.575097391 4.53525E-05 0.224249634 0.579160764 0.224249634 0.579160764
# of Bends 0.133159068 0.034831856 3.822910476 0.000451453 0.062761261 0.203556875 0.062761261 0.203556875
Part Weight (grams) 0.019965735 0.007787591 2.563788456 0.014216609 0.004226427 0.035705043 0.004226427 0.035705043
mm of MIG 0.097684007 0.038584272 2.531705335 0.015382746 0.019702285 0.175665729 0.019702285 0.175665729
# of Attachments -0.16129352 0.079039874 -2.04066017 0.047922823 -0.321039068 -0.00154798 -0.321039068 -0.001547978
Type of Tube (Fuel/Water) -0.01499527 0.047278441 -0.31716931 0.752764762 -0.110548565 0.080558024 -0.110548565 0.080558024
# of Critical Characteristics -0.01801595 0.017651663 -1.02063773 0.313559654 -0.053691296 0.017659389 -0.053691296 0.017659389
Contains Fixed Label 0.028842843 0.04916095 0.586702306 0.560700514 -0.070515143 0.128200829 -0.070515143 0.128200829
R Square is called the coefficient of determination. It compares estimated and actual y-values, and ranges in value
from 0 to 1. If it is 1, there is a perfect correlation in the sample — there is no difference between the estimated y-
value and the actual y-value. At the other end if it is 0 there is no correlation between the estimated y-value and
actual y-value.
In the example here the Piece Price is a function of Length of Tube, Diameter of Tube, # of Bends, Part Weight, mm of
MIG, # of attachments, Type of Tube, # of Critical Characteristics and Fixed Label, with an R Square value of = .9966. It
can be interpreted as "99.66% of the total variation of piece price is explained by Length of Tube, Diameter of Tube, #
of Bends, Part Weight, mm of MIG, # of attachments, Type of Tube, # of Critical Characteristics and Fixed Label, and
the remaining 0.34% is accounted for by something other than these attributes.
Formula = Intercept + (Length of Tube coefficient * ft of Tube) + (Diameter of Tube coefficient * diameter of tube) + (# of Bends coefficient * # of Bends) + (Part Weight coefficient *
part weight) + (mm of MIG coefficient * mm of MIG) + (# of Attachments coefficient * # of Attachments) + (Type of Tube coefficient * Type of Tube) + (# of Critical Characteristics
coefficient * # of Critical Characteristics) + (Contains Fixed Label coefficient * Contains Fixed Label) = Estimated output value (y)

ProcureForce Demo

51
Profile Complex assembly auto supplier
Regional buyer in global
company
Regression Analysis – 2 weeks
Situation
Obtaining excel detailed cost breakdowns
No aggregation of data
Process
Buyer performed multi-variable regression
Identified outliers
Review historical cost breakdowns on outliers and conforming
Achieved
$275k savings
Purchased Components

52
Open Book

53
Open Book Cost Models
Developed on a supplier by supplier basis based upon manufacturing cost studies on supplier shop floor – Each stamping supplier would have a unique cost model.

54
Open Book Cost Models
Highly credible and accurate
Time intensive to develop
Requires detailed supplier participation
Used for Stampings, injection molding, fabrication, fasteners

55
Open Book Costing
Suitable
Suitable Ideal

56
Profile Specialty vehicle OEM
Invested in metal fabrication
when key supplier went out of
business
From Limited Cost to Open Book – 20 Weeks
Situation
CEO questioned competitiveness of in-house mfg
12 fabrication suppliers
Limited detail on cost breakdowns
Process
Utilized multi round market test verified with open book costing of most cost competitive suppliers (6)
Utilized Strategic Sourcing Process
Achieved
Savings of $1.4 mils / 12%
Established cost models to use with all fabrication suppliers to manage ongoing pricing for new and revised parts
Reduced supply base from 12 to 4-5 BIC suppliers while closing internal manufacturing
Metal Fabrications

57
Multiple Tool Approach
2-5 %
3-6 %
3-7 %
Price Focused
Knowledge Based
Collaborative
GOAL
58
Collaboration is Key
Open and honest dialogue about costs
Collaboration to reduce costs

59
Available in the APD
Knowledge Center
Cost Models White Paper:

60
How APD Customers Have Progressed
Value
Alignment
Open Book - through market testing
new or existing components
Knowledge Based Quote Model - through market testing new or existing components
Attribute Based Quote Model development through market
testing or analysis of existing pricing
Variance Analysis of existing quote history
Cost Breakdown improvement

61
Summary
Significant savings opportunities and buyer workload reduction exist using cost knowledge and collaboration.
Using the right approach results can be achieved in weeks.
62
Next Steps
Thank you for your time.
To continue the conversation, your key APD points of contact are:
Mike Wynn
Sr. Director
Advanced Purchasing Dynamics
+1 734 927 0836 ext.106 | [email protected]
Jeoff Burris
Principal
Advanced Purchasing Dynamics
+1 734 748 0542| [email protected]