implications of measured commercial building loads on geothermal...
TRANSCRIPT

Implications of MeasuredImplications of MeasuredCommercial Building Loads onCommercial Building Loads onGeothermal System SizingGeothermal System Sizing
ASHRAE Annual MeetingASHRAE Annual Meeting
June 23, 1999June 23, 1999
Hugh I Henderson,Hugh I Henderson, Jr Jr. P.E.. P.E.
CDH Energy Corp.CDH Energy Corp.
CazenoviaCazenovia, NY, NY
www.cdhenergy.com
OverviewOverview
• Purpose & Objectives– quantify loads and load diversity in Geothermal
applications
• Describe test sites, data collection, andanalysis methods
• Compare measured loads from each site
• Implications for geothermal loop sizing

ObjectivesObjectives
•• Analyze measured heating and cooling loadAnalyze measured heating and cooling loaddata from several commercial buildings to:data from several commercial buildings to:–– determine peak loads and load diversitydetermine peak loads and load diversity
–– determine full load cooling and heating hoursdetermine full load cooling and heating hours
•• Compare load characteristics of variousCompare load characteristics of variousbuilding applicationsbuilding applications
•• Show the implications of measured loads onShow the implications of measured loads ongeothermal loop sizinggeothermal loop sizing
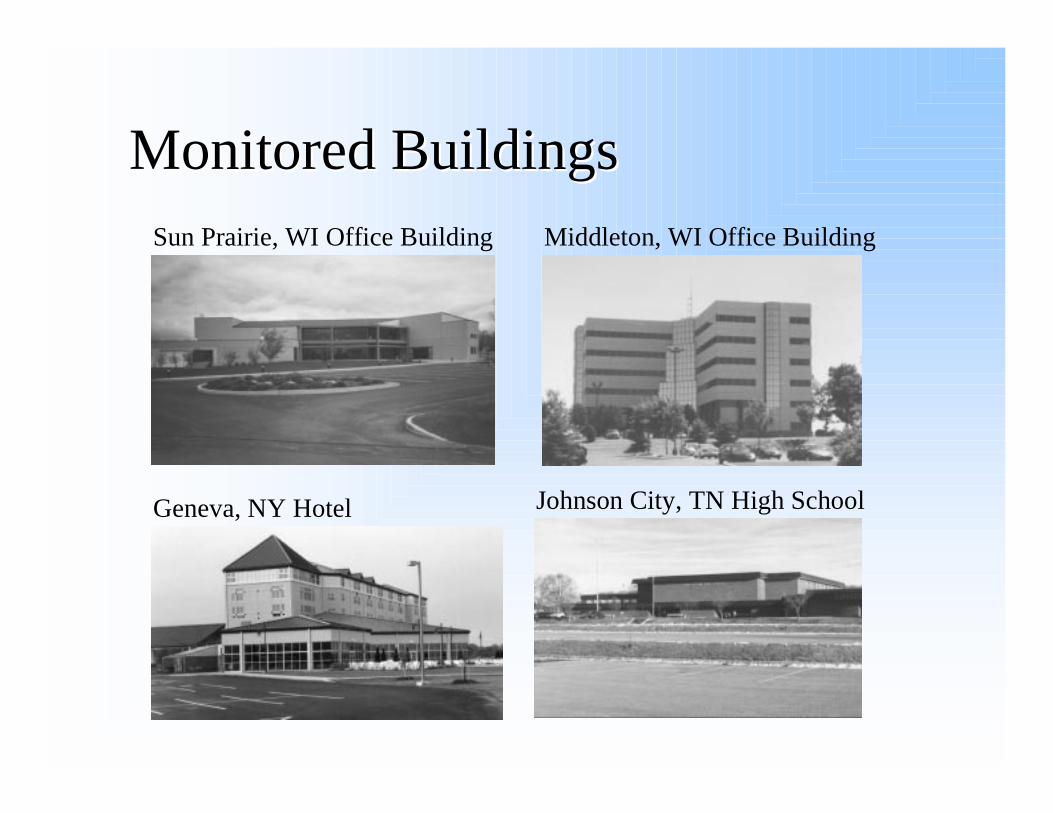
Monitored BuildingsMonitored BuildingsSun Prairie, WI Office Building Middleton, WI Office Building
Geneva, NY Hotel Johnson City, TN High School

Buildings CharacteristicsBuildings Characteristics Sun Prairie Office
Building Middleton OfficeBuilding
Geneva Hotel Johnson City HighSchool
Building Building Description: two-story office seven-story office 149 room hotel high school Building Size: 27,000 ft2 76,000 ft2
(86% w/ WLHPs) 100,000 ft2 161,600 ft2
Installed Capacity: 69 tons 146 tons 284 tons 400 tons Floor Area per ton: 391 ft2/ton 448 ft2/ton 352 ft2/ton 400 ft2/ton Construction Date 1990 1990 1997 1995 (renovation) Heat Pumps
No. of Heat Pumps: 30 54 198 118 Average EER(ARI 320)
11.4 Btu/Wh 11.4 Btu/h 14.8 Btu/Wh 14.5 Btu/Wh
Loop Pumps Number and Size: (2) 5 HP pumps (2) 15 HP pumps (3) 50 HP pumps (2) 40 HP pumps Flow Rate: 200 gpm
(2.9 gpm/ton) 475 gpm(3.3 gpm/ton)
810 gpm(2.5 gpm/ton)
1,200 gpm (3 gpm/ton)
Norm. Pump Power 0.072 HP/ton 0.010 HP/ton 0.31 HP/ton 0.20 hp/ton Pump Control Constant Speed Constant Speed Variable Speed Dual Two-Speed
(staged: ½, 1, 2 ) Ground Loop Ground Loop na na 198 pilings, 85 ft deep
(33,660 ft) 120 bores, 138 ft deep(33,120 ft)
320 Bores, 150 ft deep(96,000 ft)
Norm. Loop Size na na 103 ft of bore/ton 120 ft of bore/ton Cooling Tower
Type fluid cooler fluid cooler na na Cooling Fan: 20 HP fan, 2-speed 20 HP fan, 2-speed na na Design Capacity: 1.0 million Btu/h 1.4 million Btu/h na na Boiler Input 500,000 Btu/h 962,000 Btu/h na na

Monitored Data CollectedMonitored Data Collected• Hotel (NY)
– measured loop heat rejection/extraction… flow-delta-T (5-min data)
• Offices (WI)– measured total HP power (kWh) & loop
temperatures (15-min data)
• High School (TN)– measured loop heat rejection/extraction… flow
delta-T (60-min data)
– measured heating/cooling status of each heatpump

Office MethodologyOffice Methodology
• Used measured loop loading & assumedCOPs to calculate heating and cooling loads
where: COPc,h(T) = HP efficiency as a function of loop supply temperature T
)(]_[ TCOPkWmeasuredQ hheating ⋅=
)(]_[ TCOPkWmeasuredQ ccooling ⋅=
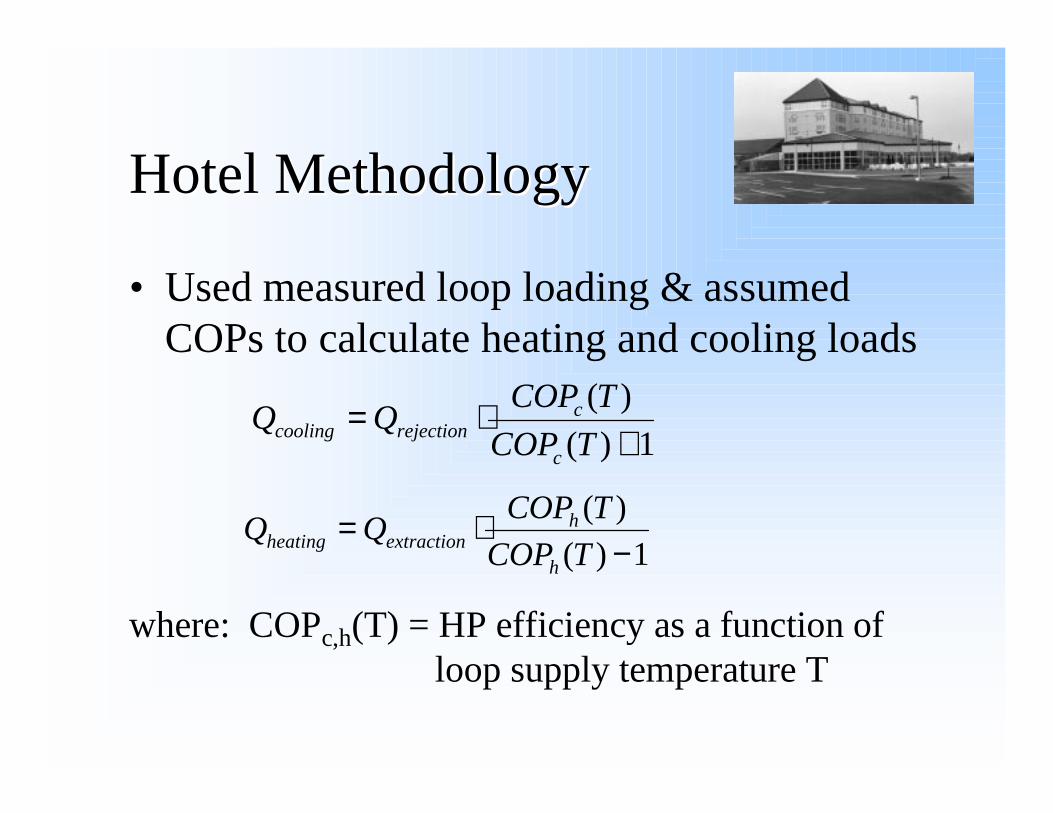
Hotel MethodologyHotel Methodology
• Used measured loop loading & assumedCOPs to calculate heating and cooling loads
where: COPc,h(T) = HP efficiency as a function of loop supply temperature T
1)(
)(
+⋅=
TCOP
TCOPQQ
c
crejectioncooling
1)(
)(
−⋅=
TCOP
TCOPQQ
h
hextractionheating
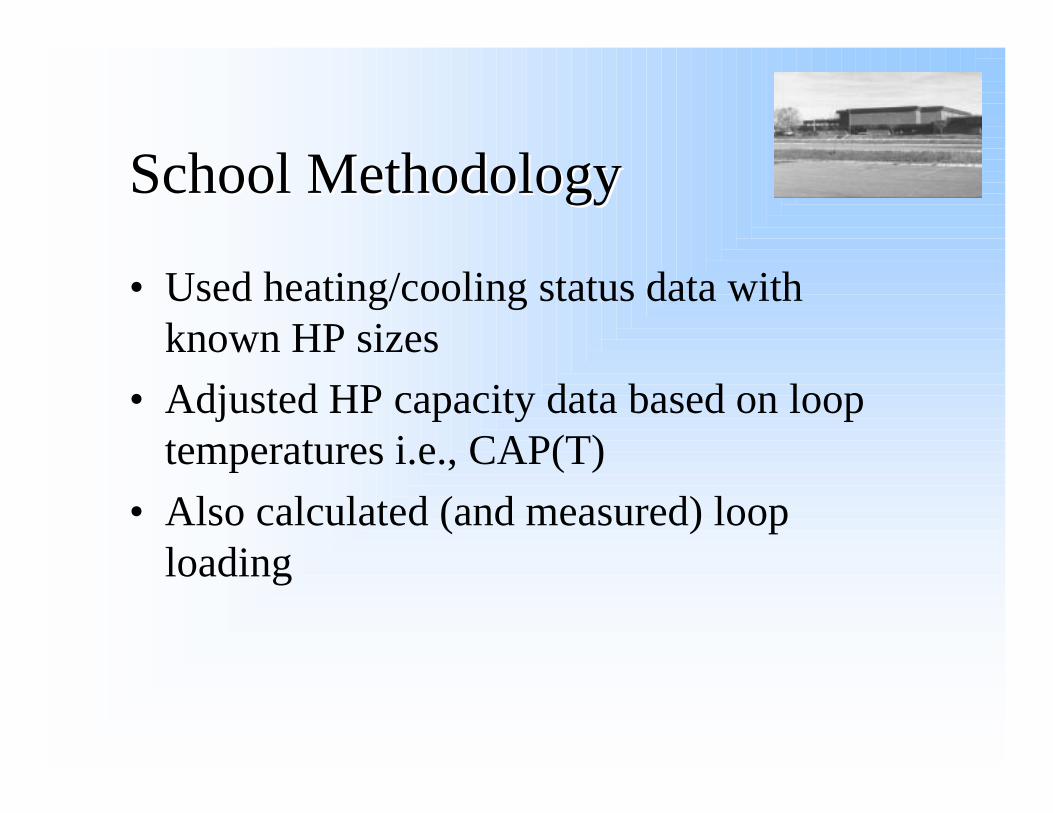
School MethodologySchool Methodology
• Used heating/cooling status data withknown HP sizes
• Adjusted HP capacity data based on looptemperatures i.e., CAP(T)
• Also calculated (and measured) looploading

Sun Prairie Office (69 tons)Sun Prairie Office (69 tons)
0 5 10 15 20 25 30 35 40 45 50C oo ling & Hea ting Load (1 ton b ins )
0
200
400
600
800
Hou
rs
Hea ting
C oo ling
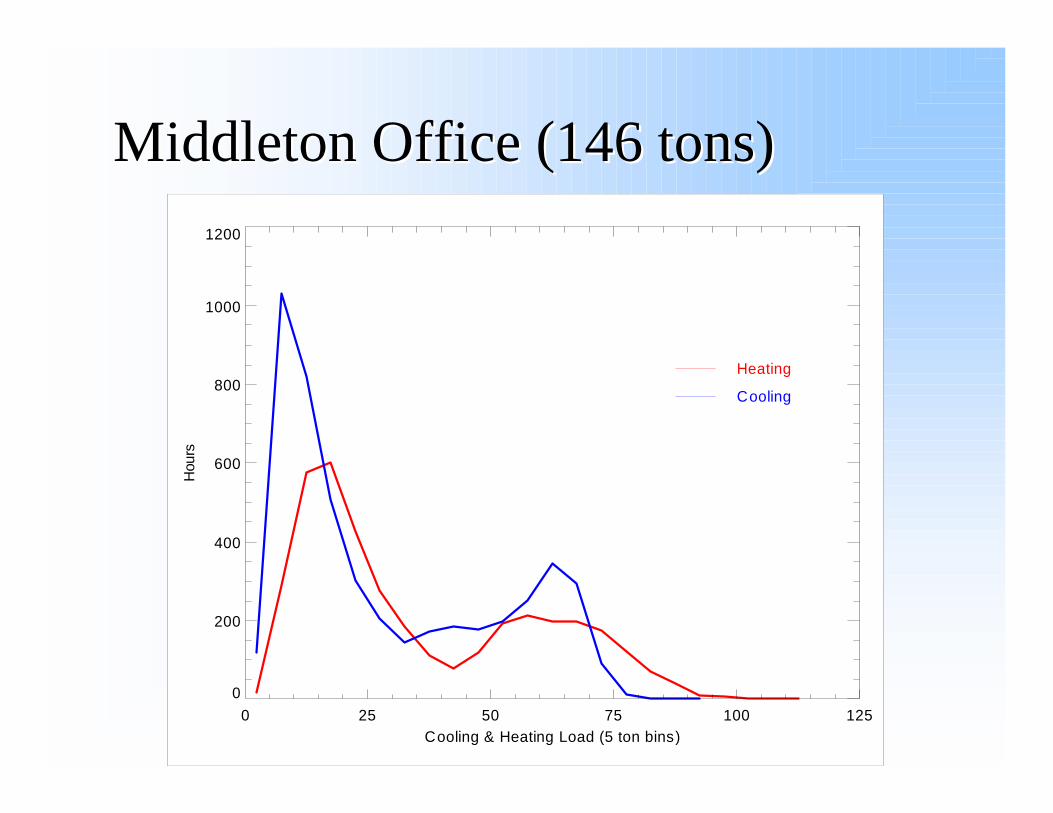
MiddletonMiddleton Office (146 tons) Office (146 tons)
0 25 50 75 100 125Cooling & Heating Load (5 ton bins)
0
200
400
600
800
1000
1200
Hou
rs
Heating
Cooling
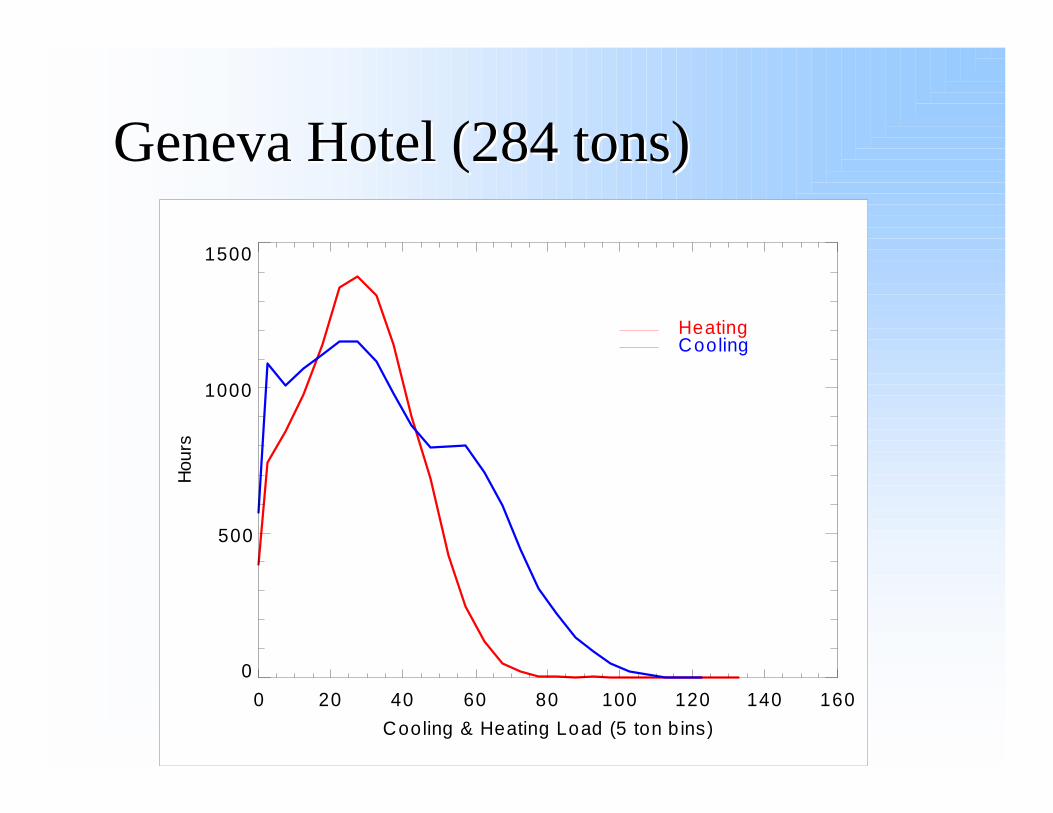
Geneva Hotel (284 tons)Geneva Hotel (284 tons)
0 20 40 60 80 100 120 140 160
Cooling & Heating Load (5 ton b ins)
0
500
1000
1500
Hou
rs
HeatingCooling
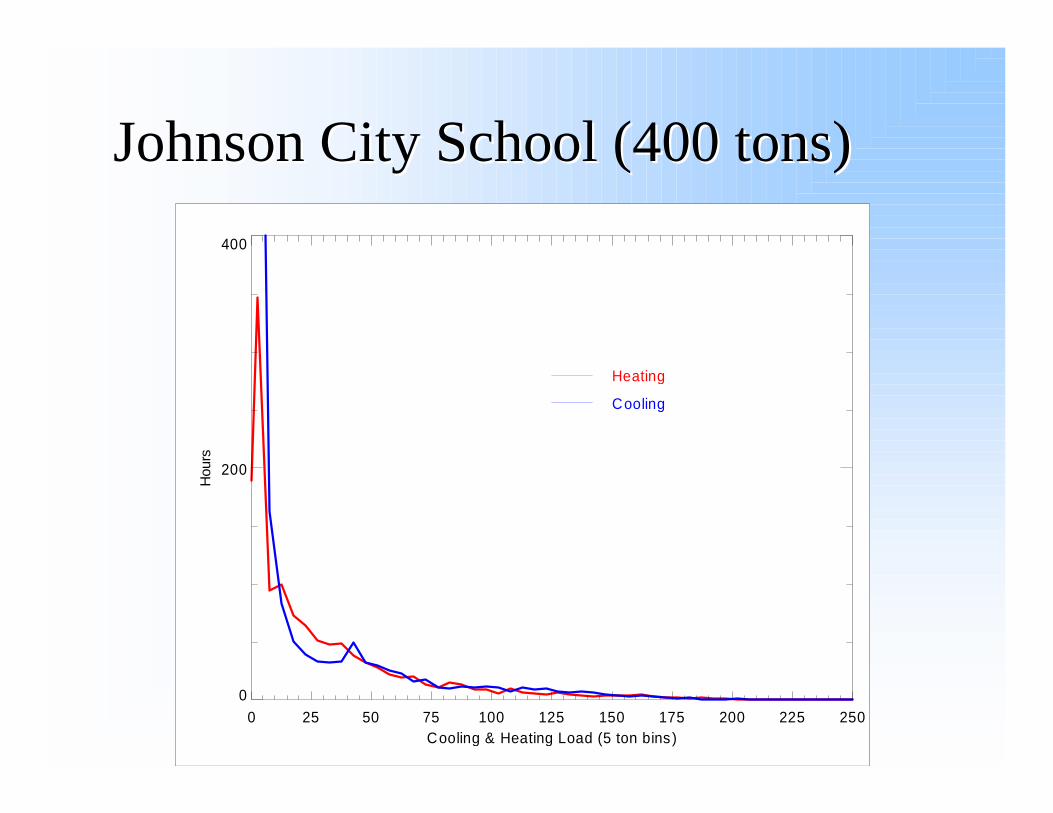
Johnson City School (400 tons)Johnson City School (400 tons)
0 25 50 75 100 125 150 175 200 225 250Cooling & Heating Load (5 ton bins )
0
200
400
Hou
rs
Heating
Cooling

Cooling Load DiversityCooling Load Diversity
Hours at or Above Each Loading Level - Cooling
Percent of InstalledCOOLINGCapacity
Sun PrairieOffice
MiddletonOffice
Geneva Hotel High School
0% 4,635 4,857 4,840 6,5665% 4,137 4,348 3,841 2,007
10% 2,595 2,943 2,767 1,44615% 1,768 2,230 1,795 89420% 1,201 1,899 1,032 61925% 781 1,674 393 44130% 462 1,413 101 28535% 215 1,147 12 15240% 79 833 - 7445% 25 350 - 2850% 2 30 - 1755% - 1 - 460% - - - 1
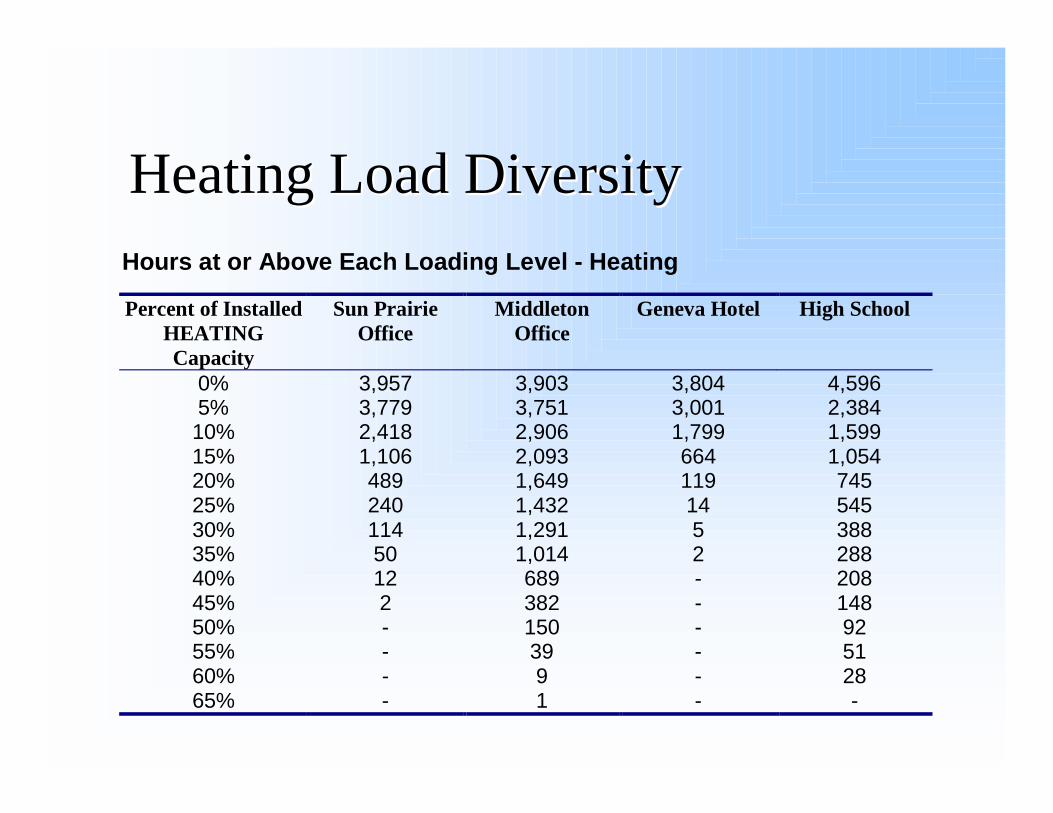
Heating Load DiversityHeating Load DiversityHours at or Above Each Loading Level - Heating
Percent of InstalledHEATINGCapacity
Sun PrairieOffice
MiddletonOffice
Geneva Hotel High School
0% 3,957 3,903 3,804 4,5965% 3,779 3,751 3,001 2,38410% 2,418 2,906 1,799 1,59915% 1,106 2,093 664 1,05420% 489 1,649 119 74525% 240 1,432 14 54530% 114 1,291 5 38835% 50 1,014 2 28840% 12 689 - 20845% 2 382 - 14850% - 150 - 9255% - 39 - 5160% - 9 - 2865% - 1 - -

Heating/Cooling Load SummaryHeating/Cooling Load Summary
Sun PrairieOffice
MiddletonOffice
Geneva Hotel Johnson CityHigh School
Peak Hourly / 4-hrCooling Loads:
34 / 32 tons 82 / 74 tons 106 / 101 tons 234 / 219 tons
% of InstalledCooling Capacity
49% / 47% 57% / 50% 37% / 35% 58% / 55%
Equivalent FullLoad Hours –Cooling
679 hours 965 hours 613 hours 466 hours
Equivalent FullLoad Hours –Heating
504 hours 869 hours 372 hours 318 hours
NormalizedCooling Loads
1.7 ton-h/ft2-yr 2.2 ton-h/ft2-yr 1.7 ton-h/ft2-yr 1.2 ton-h/ft2-yr

Are Full Load Hours the RightAre Full Load Hours the Right“Rule of Thumb” ?“Rule of Thumb” ?
200
300
400
500
600
700
800
900
1000
300 350 400 450 500
HP Siz ing (sq ft /ton)
Co
ol F
ull
Lo
ad
Ho
urs
TN School
W I OfficeNY Hotel
W I Office
PA O ffice
• Full loadhours(FLH)depend onsizing
• Norm.coolingloads aremoreconsistent
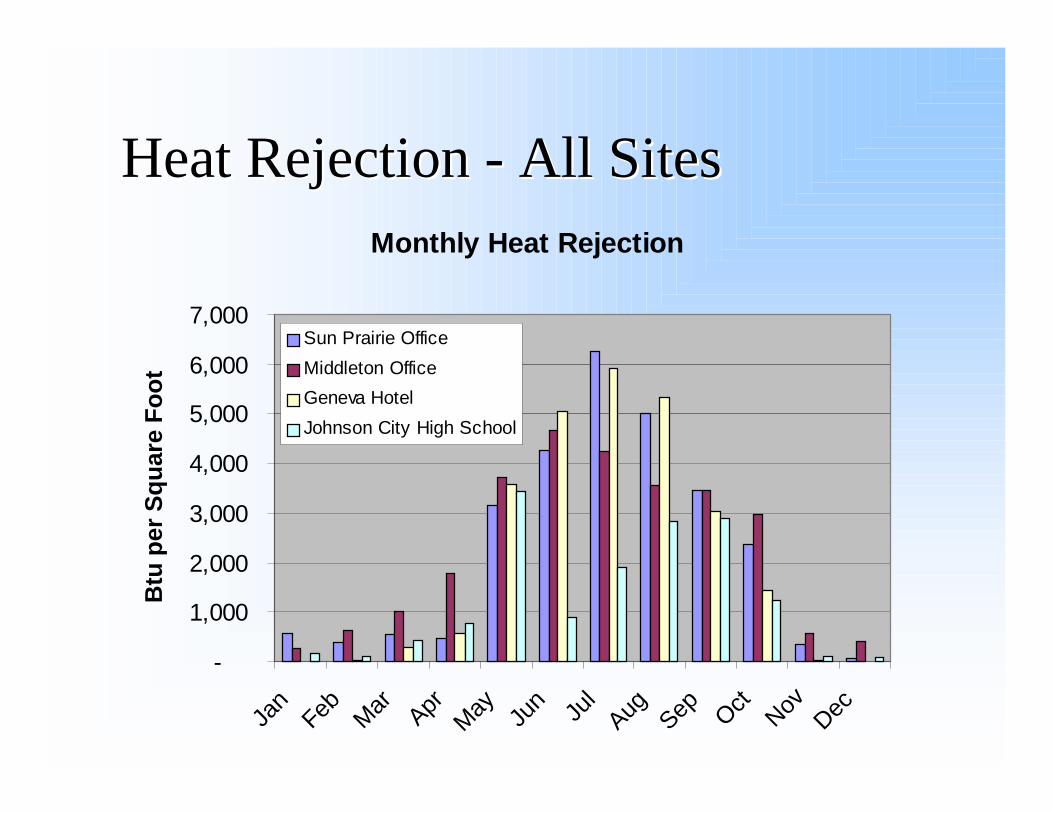
Heat Rejection - All SitesHeat Rejection - All SitesMonthly Heat Rejection
-
1,000
2,000
3,000
4,000
5,000
6,000
7,000
Jan
Feb Mar Apr
May Ju
n Jul
Aug Sep OctNovDec
Btu
per
Squ
are
Foo
t
Sun Prairie Office
Middleton Office
Geneva Hotel
Johnson City High School

Heat Extraction - All SitesHeat Extraction - All SitesMonthly Heat Extraction
-
500
1,000
1,500
2,000
2,500
3,000
Jan Feb Mar Apr May Jun Jul Aug Sep Oct Nov Dec
Btu
per
Squ
are
Foo
t
Sun Prairie Office
Middleton Off ice
Geneva Hotel
Johnson City High School

Loop Load SummaryLoop Load SummarySun Prairie
OfficeMiddleton
OfficeGenevaHotel
Johnson CityHigh School
Peak Hourly / 4-hrHeat Rejection(Btu/h-ft2)
22.2 / 20.5 42.5 / 29.9 15.6 / 14.8 22.5 / 20.6
Peak Hourly / 4-hrHeat Extraction(Btu/h-ft2)
6.2 / 4.7 23.4 / 12.2 8.7 / 7.1 13.3 / 11.1
Normalized AnnualHeat Rejection(MBtu/yr-ft2)
26.8 27.3 25.2 14.8
Normalized AnnualHeat Extraction(MBtu/yr-ft2)
3.3 7.5 8.9 8.8
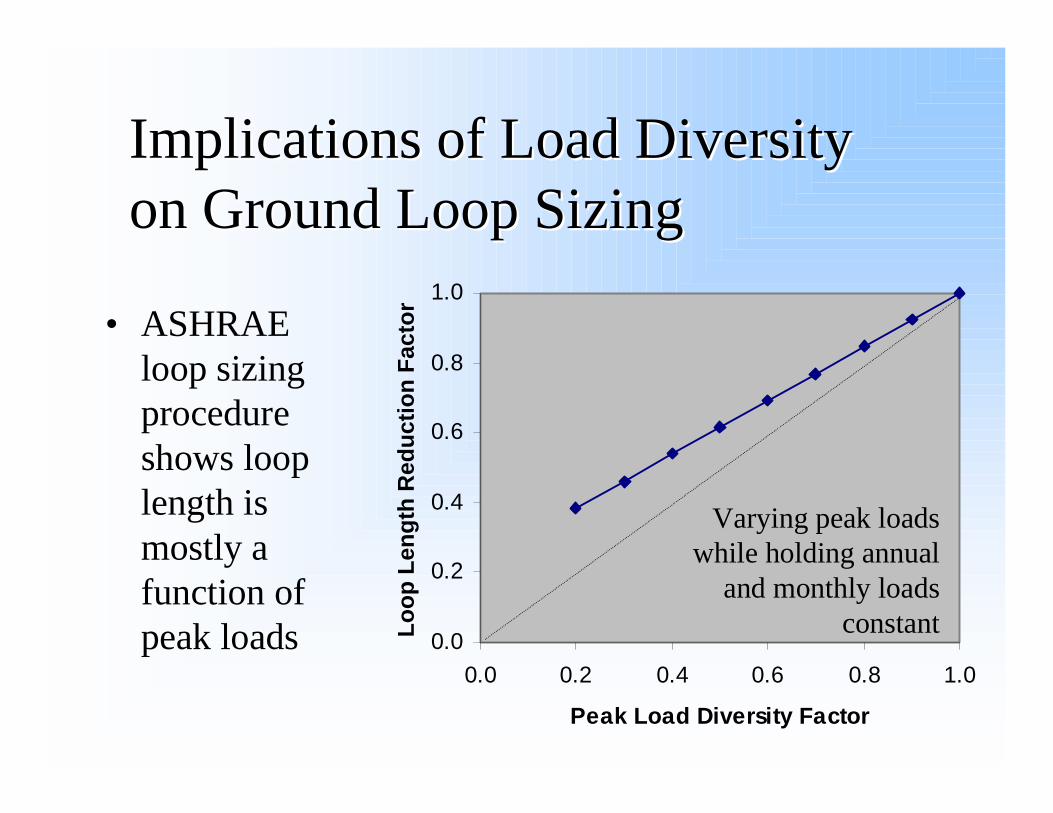
Implications of Load DiversityImplications of Load Diversityon Ground Loop Sizingon Ground Loop Sizing
0.0
0.2
0.4
0.6
0.8
1.0
0.0 0.2 0.4 0.6 0.8 1.0
Peak Load Diversity Factor
Loop
Len
gth
Red
uctio
n F
acto
r• ASHRAEloop sizingprocedureshows looplength ismostly afunction ofpeak loads
Varying peak loadswhile holding annual
and monthly loadsconstant
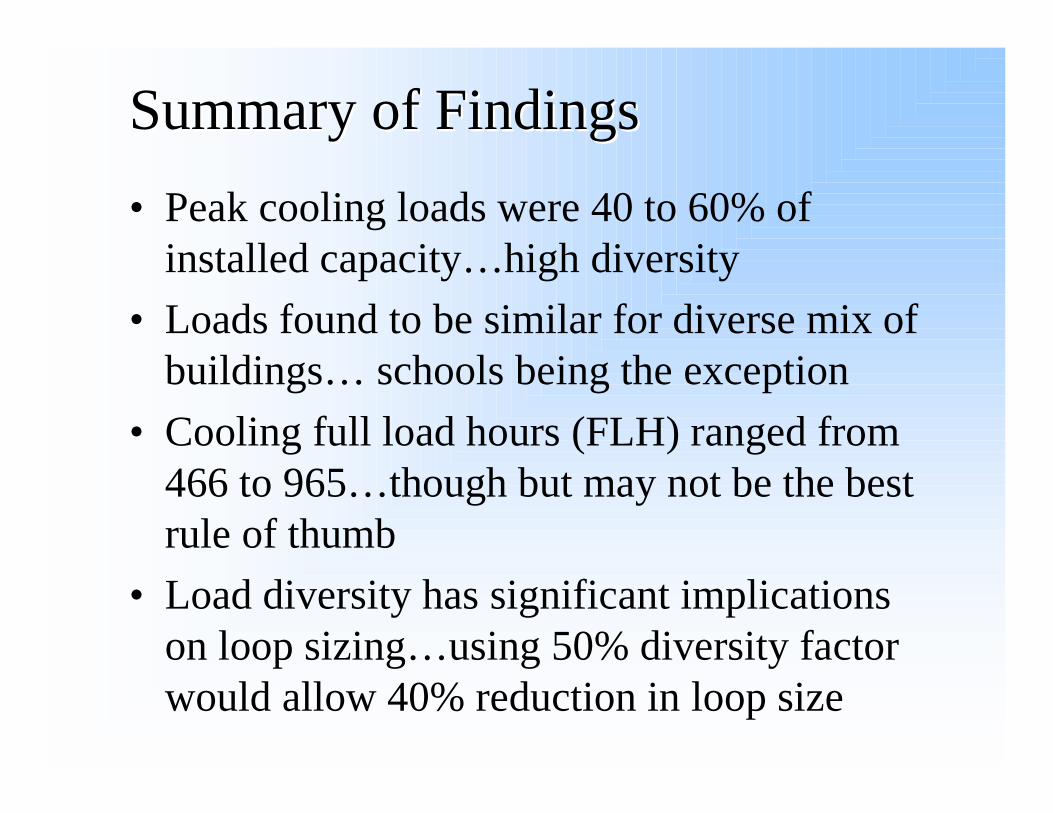
Summary of FindingsSummary of Findings
• Peak cooling loads were 40 to 60% ofinstalled capacity…high diversity
• Loads found to be similar for diverse mix ofbuildings… schools being the exception
• Cooling full load hours (FLH) ranged from466 to 965…though but may not be the bestrule of thumb
• Load diversity has significant implicationson loop sizing…using 50% diversity factorwould allow 40% reduction in loop size