measured performance and design guidelines for large commercial hvac systems
TRANSCRIPT
Measured Performance and Design Guidelines for Large Commercial HVAC Systems
Erik Kolderup, Eley Associates Mark Hydeman, Taylor Engineering
Michael Baker, SBW Consulting R. Lynn Qualmann, SBW Consulting
ABSTRACT
This paper describes a publicly funded research project to determine the impact of design decisions on the performance of large commercial HVAC systems (NBI, 2001). This project is part of a larger research effort with another team looking at packaged equipment performance. The focus of this research is the air-side design and performance of built-up variable-air volume (VAV) systems with chilled water cooling. The performance of central chilled water and hot water systems is already covered by existing research (CoolTools, 1999). The ultimate goal of this project is to develop design guidelines. The intent is to provide guidance to designers in areas beyond the scope of present tools or guidelines.
Long-term system performance measurements from several recently constructed buildings are being used to characterize actual field performance of air-side systems. The real performance of components such as fans, cooling coils, VAV boxes, reheat coils, and ductwork will be measured, with that data being used to calibrate simulation models. The guidelines will be based on evaluation of design alternatives tested with these simulation models and tested, where feasible, in the actual buildings.
This paper describes the design issues to be analyzed and the process by which they will be assessed through measurement and simulation. We will also present some preliminary conclusions of our work. The design issues addressed by our research include:
Fan selection Cooling coil selection Coil bypass dampers Duct sizing guidelines Duct system effects Supply air set point optimization and reset VAV box selection Supply pressure reset controls, and Reheat design (source and control).
Introduction
HVAC (heating, ventilation and air conditioning) systems in large commercial buildings are generally custom assemblies, consisting of a number of standard and custom components designed to the building’s need. The finished product’s energy efficiency depends in part on the design process; how well engineers integrate these components into an efficient system. Equally important are the changes to that system design that occur during
Commercial Buildings: Technologies, Design, Performance Analysis, and Building Industry Trends - 3.181
the construction, startup, maintenance and retrofit phases of the project but these are covered by other research and are beyond the scope of this project. The purpose of this research is to identify areas where standard design practice could be improved through optimization of component selection and controls. Furthermore we plan to demonstrate how that optimization would have impacted the energy usage of real buildings in California based on measured system performance and calibrated simulations of alternative designs. The focus of this research is the air-side design of built-up variable-air-volume systems. Other concurrent and existing research is covering the performance, optimization and design of small packaged HVAC systems (NBI 2001) and chilled water plants (CoolTools™ 1999).
Much current research into HVAC systems for large buildings focuses on the important topic of commissioning to ensure that the design intent is properly implemented. Some of the issues discovered during commissioning are a result of construction or operation problems. But the most intractable problems are design issues related to poor integration of the system’s components.
These central systems can be much more efficient than collections of packaged equipment, but it has long been recognized that they often operate inefficiently. Designers face a systems integration problem: even with the most efficient components, if the components are not optimally matched, or if they are not controlled properly, then the overall system can be very inefficient, or not fully efficient.
This three-year project consists of field studies of HVAC systems in large commercial buildings to quantify problems with component/system selection as well as building controls and operation that cause energy inefficiencies. This detailed information will feed our research on new integrated design solutions and will be used to determine savings potentials. The design guidelines resulting from this study will be produced in 2003.
Areas for Investigation
The research team in conjunction with their technical advisory group identified a number of items to study on the design of air-side systems. These areas were selected due both to their anticipated importance on the energy usage of these systems and prevalence of less than optimal design practices. The preliminary list of measures included the following:
Fan selection Cooling coil sizing Coil bypass dampers Duct design and system effects VAV terminal unit sizing Reheat control Supply design air temperature selection Supply air temperature control, and Supply air pressure control.
Duct leakage was left out, as this is the purview of a concurrent research project at Lawrence Berkeley National Lab. During the investigation of the selected monitoring sites, two additional measures were identified:
3.182
Demand ventilation control. Means for fan isolation.
Each of these topics are described below:
Fan Selection and Isolation
Most designers select a fan type based on the design conditions of flow and pressure, the turndown required, the acoustical criteria, and in some cases the spatial constraints. Once they find a fan that fits their needs they move on to the next problem. Within a manufacturer’s line there are often alternatives both in the size of a given fan and in the type. Larger fans of the same type are typically more efficient but may have limitations in turndown depending on the form of volume control. Larger fans are also typically less of an acoustical problem as they rotate at a slower speed for the same design duty. For each of the buildings that we are monitoring (more details later) we will look at the impact of fan selection on system energy usage while noting the spatial constraints and acoustical impacts of alternative fan selection. Each fan investigated will be run across the same measured building flow and static pressure profile.
An interesting secondary result of this study will be the ability to compare a fan’s performance on a real dynamically varying system to that of a calibrated model of the fan on a flow and pressure profile that is developed in a calibrated model using a commercial simulation program. As shown below in Figure 5 the dynamics of real VAV systems are far from the simplified system load curves produced by many simulation programs. The system curve exponent varies as a function of the air turbulence and the system curve shape varies dynamically in response to the action of VAV terminal units both near and far from the fan.
Another issue for study and guidance is the means to isolate fans that are configured to run in parallel. At several of our pilot sites, barometric backdraft dampers have been placed either directly on the inlet or discharge of fans. At these locations the dampers will have high static pressure losses due both to the high airflow velocities (2,000 to 3,000 fpm) and the system effects imparted by flow modifications so close to the fans. We intend to investigate the impact of this form of isolation and compare it to alternatives like inlet cones for plenum fans, oversized backdraft dampers and sliding gates.
Cooling Coil Selection
Similar to fans, cooling coils are typically selected to meet the design conditions within a few rough constraints: a limit on the number of rows (typically six), a limitation on the fins per inch (12 or 14), a maximum face velocity (550 fpm to prevent moisture carryover) and perhaps a specific circuiting arrangement (full, to prevent delta-T degradation). In general these rules of thumb are targeted to provide the least expensive coil that will meet the design load while providing that the coil can be cleaned and have a reasonable air-side pressure drop. This study will look at the performance of oversized cooling coils on the fan and pump energy. As the coil size increases for a given air- and water-side flows, both the air-side and water-side pressure drop decreases (due to reductions in the number of rows, the fin spacing and perhaps the requirement for enhanced water-side
Commercial Buildings: Technologies, Design, Performance Analysis, and Building Industry Trends - 3.183

surfaces. Not only are larger coils more energy efficient, they are also easier to clean and less subject to fouling.
Cooling Coil Bypass Dampers
This measure will look at the impact of putting bypass dampers around the cooling coil to reduce the pressure drop across the coil section during operation of the air-side economizer. Air-side economizers are extremely effective in most California climates; outside air can meet all cooling demands for a significant number of hours each year. Often with large built up coils there is a piping chase between coil banks that can be utilized at low cost to provide this bypass.
Duct System Effects
Quite often in commercial duct systems a significant portion (10%-20%) of the pressure drop is due to “system effects” that are caused by uneven flow distribution entering a duct fitting or fan. These effects are most often caused by sequences of duct fittings in close proximity to one another. SMACNA and ASHRAE in their duct sizing tables detail the pressure characteristics of duct fittings as a function of flow for fittings with evenly distributed flow. Both SMACNA and ASHRAE have provided tables of anticipated pressure characteristics of two fittings in close proximity for a limited number of arrangements. Often these effects can be mitigated through the use of rounded fittings and turning vanes. The goals of this research are two-fold: 1) to document the measured impact of specific fitting arrangements that are encountered in our sites; 2) to identify and evaluate fan energy that could be have been reduced through alternate fittings or arrangements.
Duct Sizing Guidelines
Duct system sizing is a balance between first cost and energy cost. Small ducts on the index run (i.e. duct run with the greatest pressure loss) will increase the system fan energy. On the non-critical runs duct sizing is only a balance between first cost and acoustical criteria. The guideline will provide guidance on duct sizing based on a life-cycle cost analysis. This will be based on experience and not necessarily be informed by field measurements.
Outside Air Control
Without provision for minimum air-volume control, the minimum outdoor air supply in variable-air-volume systems will vary linearly from design outdoor airflow at design system airflow down to zero outdoor air at zero system airflow. There are numerous methods to assure minimum outdoor airflow throughout the range of supply. This guideline will address design alternatives to help ensure that outside air ventilation airflow is accurately controlled. These alternatives include dedicated ventilation air dampers, control of flow through air-flow monitoring stations, dedicated outside air fan, or other means. The guidelines with synthesize materials already in literature (such as Felker 2002) and review the performance of the provision for minimum outdoor air reset on the five monitored sites.
3.184
Duct Leakage/Sealing
Duct leakage has a potentially significant energy impact on both fan energy and primary heating and cooling. This guideline will provide air distribution sealing recommendations based largely on other PIER research findings and simulated impacts.
VAV Box Sizing and Control
Terminal unit sizing has a large impact both on fan energy, primary cooling energy and reheat. All boxes have a minimum turndown to which they can control. Depending on the controls the minimum varies between 30% to 40% of the nominal box airflow. An oversized box might not be able to stably operate below 50% of the design airflow. This guideline will discuss variable minimum zone airflow set point control, which can mitigate much of the penalty due to oversizing.
Fan-Powered Box Applications
The small fans in fan-powered boxes are notoriously inefficient (efficiencies between 10% and 20% are not uncommon). This is particularly a problem with series style boxes where the inefficient fan is operating at all normally occupied times. This guideline will recommend appropriate use of fan-powered boxes including applications like conference rooms and lobbies.
Reheat Control and Source
Hot water reheat systems with gas boilers offer lower energy costs (theoretically) than electric reheat systems, but hot water systems are typically more expensive. We will be looking at the real costs of hot-water reheat including the stand-by and distribution losses. With the new high efficiency envelopes required by Title 24 coupled with the mild California Climates it may be time to review the restriction on electric resistance heat for zonal reheat in multiple zone systems. In addition to lowering installed costs, electric resistance reheat reduces the risk of water leakage over tenant space and greatly reduces the construction materials (copper and steel).
Supply Air Temperature Control
Sub-optimal supply air temperature control results in increased overall energy consumption (sum of fan energy, chiller energy, pump energy and reheat energy). Under given conditions, a low set point causes excess cooling and reheat energy while a high set point leads to greater airflow and excess fan energy. The guideline will describe supply air temperature control methods that work best in California and describe when they are appropriate (based on cooling load profiles, minimum ventilation rates, chilled water plant efficiency, air distribution system efficiency, climate).
Commercial Buildings: Technologies, Design, Performance Analysis, and Building Industry Trends - 3.185
Supply Pressure Control
VAV supply duct air pressure is typically controlled to a specific set point that ensures that the zone farthest from the fan receives adequate airflow. Quite often, especially during periods of low cooling loads, lower pressure would satisfy zone air flow requirements. Therefore, fan pressure is higher than necessary for much of the time and fan energy is wasted. This guideline will recommend control algorithms and design features required for supply air pressure reset.
Demand Controlled Ventilation
During low occupancy periods the amount of outside air introduced to the building can be reduced and still meet codes. Currently Title 24 has a requirement for demand controlled ventilation on densely occupied spaces served by large units. This requirement is being revised for single zone units as part of the 2005 Standards. There is little or no guidance in the literature on how to control demand ventilation on multiple zone HVAC systems. This guideline will discuss the benefits and disadvantages to demand controlled ventilation and investigate the control of multiple zone systems. One of our proposed sites, a law school, offers the opportunity to install zone based CO2 sensors to investigate strategies to sequence the reset of zone and OSA dampers.
Night Time Purge
Daytime cooling loads might be reduced if the fans are operated at night to cool the building with outside air. This guideline will present benefits and disadvantages to night purge controls and discuss optimal control algorithms.
Internal Heat Gain
Overestimates of zone cooling loads can lead to system inefficiencies caused by VAV box oversizing (discussed earlier) and possibly reduced cooling plant efficiency when operating at partial load. This guideline will provide case study information from monitored sites comparing actual operating conditions to those assumed during design.
Telephone and On-Site Surveys
Telephone and site surveys that took place in 2001 provide some findings regarding the population of buildings that would be covered by these guidelines (Eley Associates 2001).
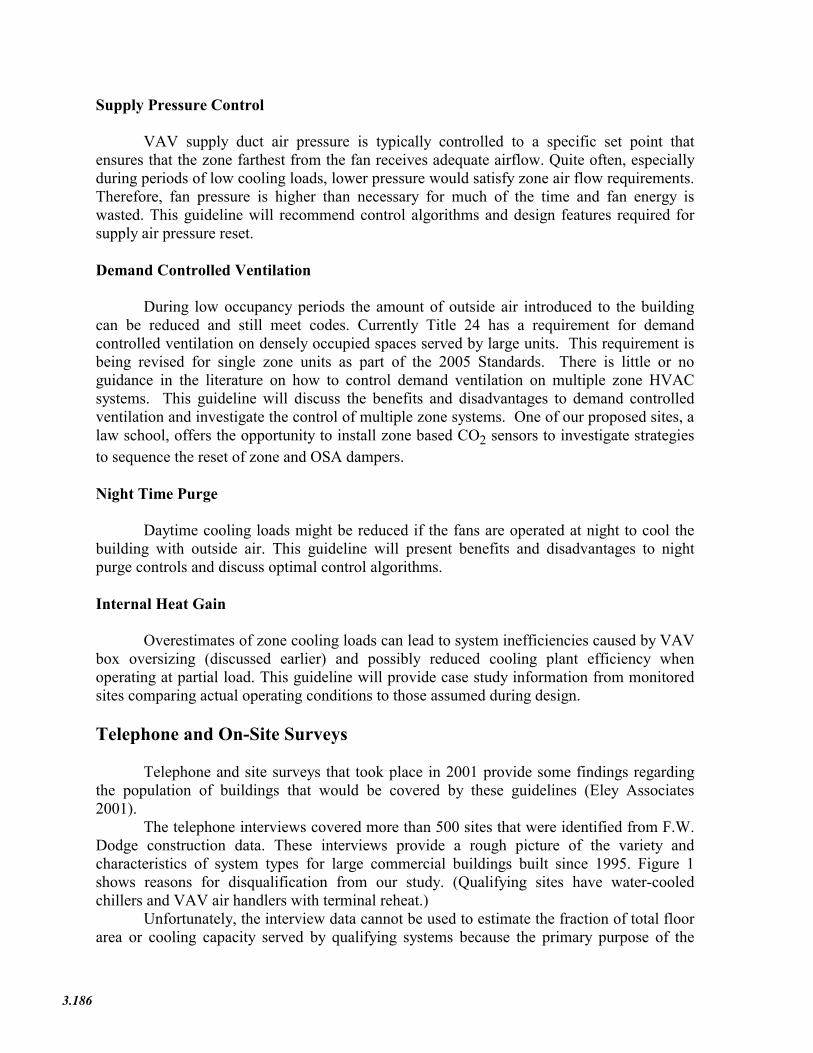
The telephone interviews covered more than 500 sites that were identified from F.W. Dodge construction data. These interviews provide a rough picture of the variety and characteristics of system types for large commercial buildings built since 1995. Figure 1 shows reasons for disqualification from our study. (Qualifying sites have water-cooled chillers and VAV air handlers with terminal reheat.)
Unfortunately, the interview data cannot be used to estimate the fraction of total floor area or cooling capacity served by qualifying systems because the primary purpose of the
3.186
interviews was to identify qualifying sites. Therefore, interviews were terminated when it was determined that the system type did not match criteria for the study. What the interview results do show is that the majority of the surveyed buildings have packaged direct expansion cooling systems (54% of site). Roughly 18% of the sites have some sort of chilled water system and 8% of the total sample of sites meet all selection criteria. Figure 1 shows a further breakdown of why sites were disqualified from our study.
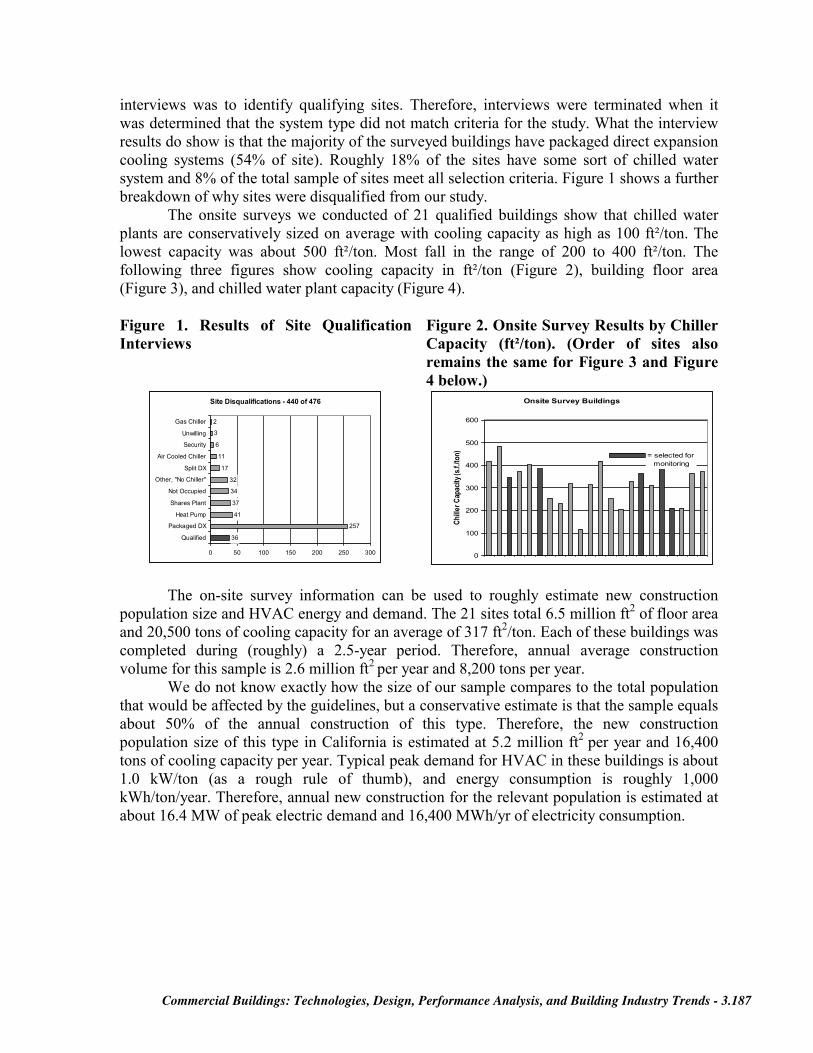
The onsite surveys we conducted of 21 qualified buildings show that chilled water plants are conservatively sized on average with cooling capacity as high as 100 ft²/ton. The lowest capacity was about 500 ft²/ton. Most fall in the range of 200 to 400 ft²/ton. The following three figures show cooling capacity in ft²/ton (Figure 2), building floor area (Figure 3), and chilled water plant capacity (Figure 4).
Figure 1. Results of Site Qualification Interviews
Figure 2. Onsite Survey Results by Chiller Capacity (ft²/ton). (Order of sites also remains the same for Figure 3 and Figure 4 below.)
Site Disqualifications - 440 of 476
36
257
41
37
34
32
17
11
6
3
2
0 50 100 150 200 250 300
Qualified
Packaged DX
Heat Pump
Shares Plant
Not Occupied
Other, "No Chiller"
Split DX
Air Cooled Chiller
Security
Unwilling
Gas Chiller
Onsite Survey Buildings
0
100
200
300
400
500
600
Chille
r Cap
acity
(s.f.
/ton) = selected for
monitoring
The on-site survey information can be used to roughly estimate new construction population size and HVAC energy and demand. The 21 sites total 6.5 million ft2 of floor area and 20,500 tons of cooling capacity for an average of 317 ft2/ton. Each of these buildings was completed during (roughly) a 2.5-year period. Therefore, annual average construction volume for this sample is 2.6 million ft2 per year and 8,200 tons per year.
We do not know exactly how the size of our sample compares to the total population that would be affected by the guidelines, but a conservative estimate is that the sample equals about 50% of the annual construction of this type. Therefore, the new construction population size of this type in California is estimated at 5.2 million ft2 per year and 16,400 tons of cooling capacity per year. Typical peak demand for HVAC in these buildings is about 1.0 kW/ton (as a rough rule of thumb), and energy consumption is roughly 1,000 kWh/ton/year. Therefore, annual new construction for the relevant population is estimated at about 16.4 MW of peak electric demand and 16,400 MWh/yr of electricity consumption.
Commercial Buildings: Technologies, Design, Performance Analysis, and Building Industry Trends - 3.187
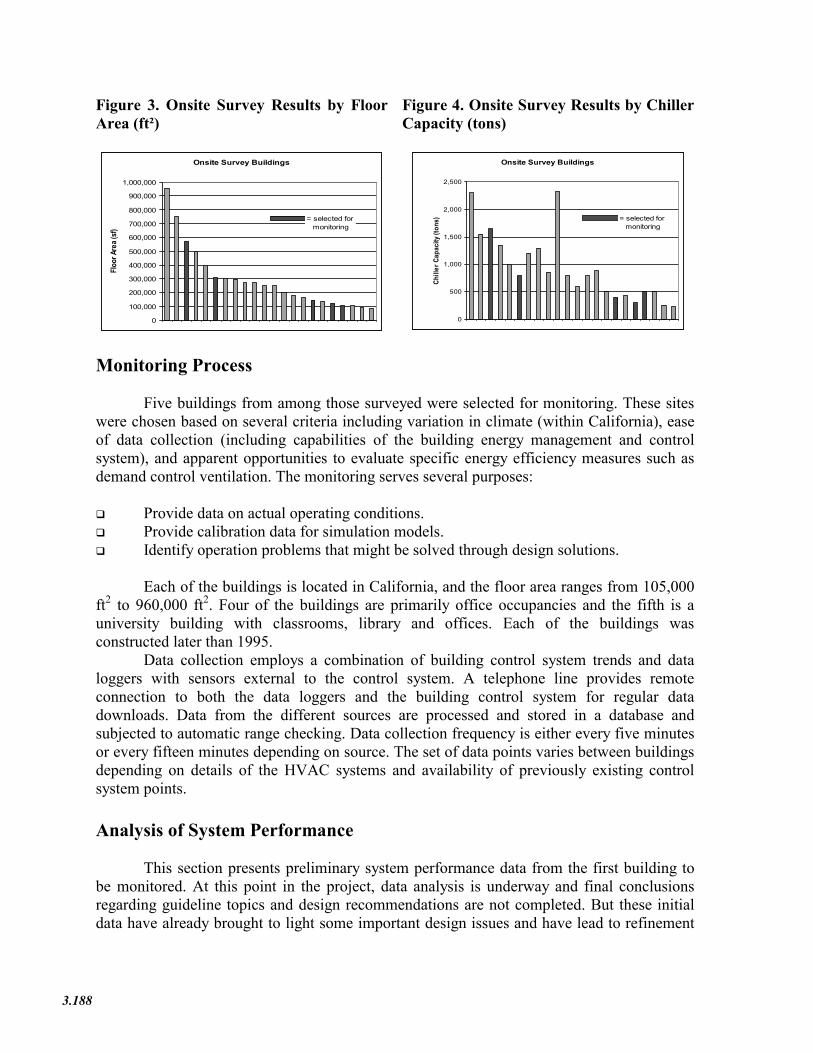
Figure 3. Onsite Survey Results by Floor Area (ft²)
Figure 4. Onsite Survey Results by Chiller Capacity (tons)
Onsite Survey Buildings
0
100,000
200,000
300,000
400,000
500,000
600,000
700,000
800,000
900,000
1,000,000
Floo
r Are
a (sf)
= selected for monitoring
Onsite Survey Buildings
0
500
1,000
1,500
2,000
2,500
Chill
er C
apac
ity (t
ons) = selected for
monitoring
Monitoring Process
Five buildings from among those surveyed were selected for monitoring. These sites were chosen based on several criteria including variation in climate (within California), ease of data collection (including capabilities of the building energy management and control system), and apparent opportunities to evaluate specific energy efficiency measures such as demand control ventilation. The monitoring serves several purposes:
Provide data on actual operating conditions. Provide calibration data for simulation models. Identify operation problems that might be solved through design solutions.
Each of the buildings is located in California, and the floor area ranges from 105,000 ft2 to 960,000 ft2. Four of the buildings are primarily office occupancies and the fifth is a university building with classrooms, library and offices. Each of the buildings was constructed later than 1995.
Data collection employs a combination of building control system trends and data loggers with sensors external to the control system. A telephone line provides remote connection to both the data loggers and the building control system for regular data downloads. Data from the different sources are processed and stored in a database and subjected to automatic range checking. Data collection frequency is either every five minutes or every fifteen minutes depending on source. The set of data points varies between buildings depending on details of the HVAC systems and availability of previously existing control system points.
Analysis of System Performance
This section presents preliminary system performance data from the first building to be monitored. At this point in the project, data analysis is underway and final conclusions regarding guideline topics and design recommendations are not completed. But these initial data have already brought to light some important design issues and have lead to refinement
3.188
of the list of guideline topics discussed earlier. This first building has the following characteristics:
Occupancy type: Office, with data center. Location: San Jose, CA. Floor area: 105,000 ft2.Number of stories: Three. Occupancy date: Oct. 1999. Number of air handlers: One. Chilled water plant: Two, water-cooled 250-ton chillers.
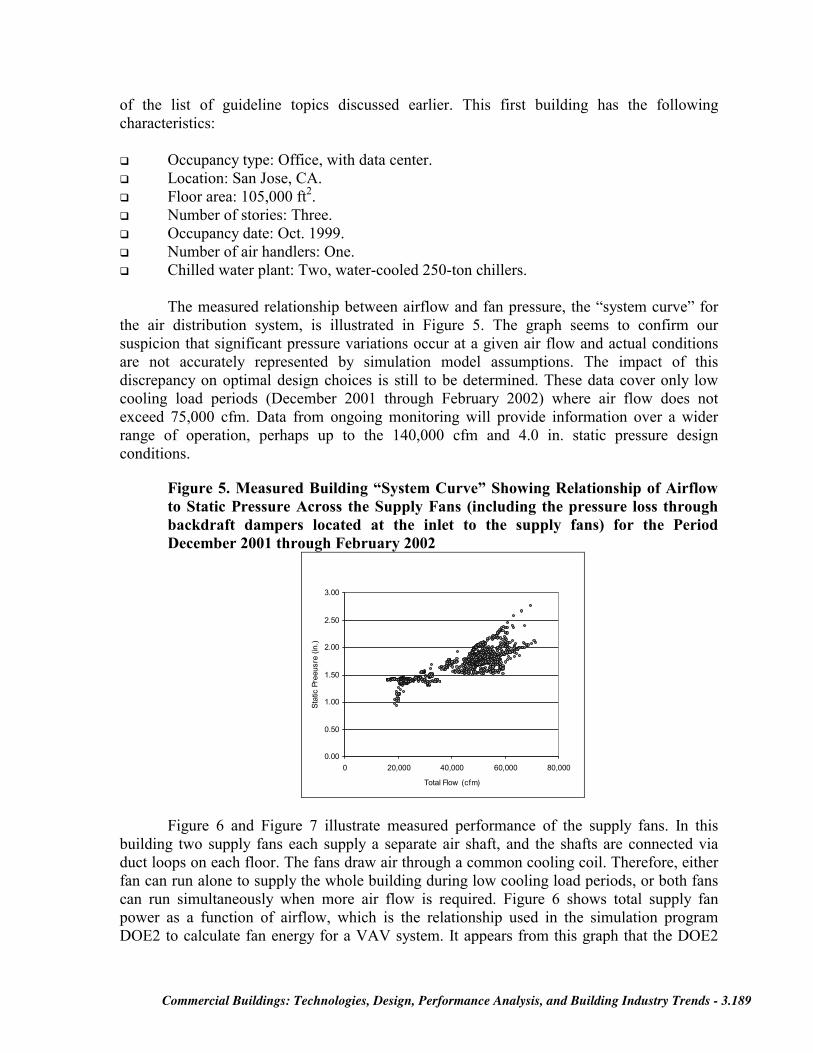
The measured relationship between airflow and fan pressure, the “system curve” for the air distribution system, is illustrated in Figure 5. The graph seems to confirm our suspicion that significant pressure variations occur at a given air flow and actual conditions are not accurately represented by simulation model assumptions. The impact of this discrepancy on optimal design choices is still to be determined. These data cover only low cooling load periods (December 2001 through February 2002) where air flow does not exceed 75,000 cfm. Data from ongoing monitoring will provide information over a wider range of operation, perhaps up to the 140,000 cfm and 4.0 in. static pressure design conditions.
Figure 5. Measured Building “System Curve” Showing Relationship of Airflow to Static Pressure Across the Supply Fans (including the pressure loss through backdraft dampers located at the inlet to the supply fans) for the Period December 2001 through February 2002
0.00
0.50
1.00
1.50
2.00
2.50
3.00
0 20,000 40,000 60,000 80,000
Total Flow (cfm)
Stat
ic P
reeu
sre
(in.)
Figure 6 and Figure 7 illustrate measured performance of the supply fans. In this building two supply fans each supply a separate air shaft, and the shafts are connected via duct loops on each floor. The fans draw air through a common cooling coil. Therefore, either fan can run alone to supply the whole building during low cooling load periods, or both fans can run simultaneously when more air flow is required. Figure 6 shows total supply fan power as a function of airflow, which is the relationship used in the simulation program DOE2 to calculate fan energy for a VAV system. It appears from this graph that the DOE2
Commercial Buildings: Technologies, Design, Performance Analysis, and Building Industry Trends - 3.189
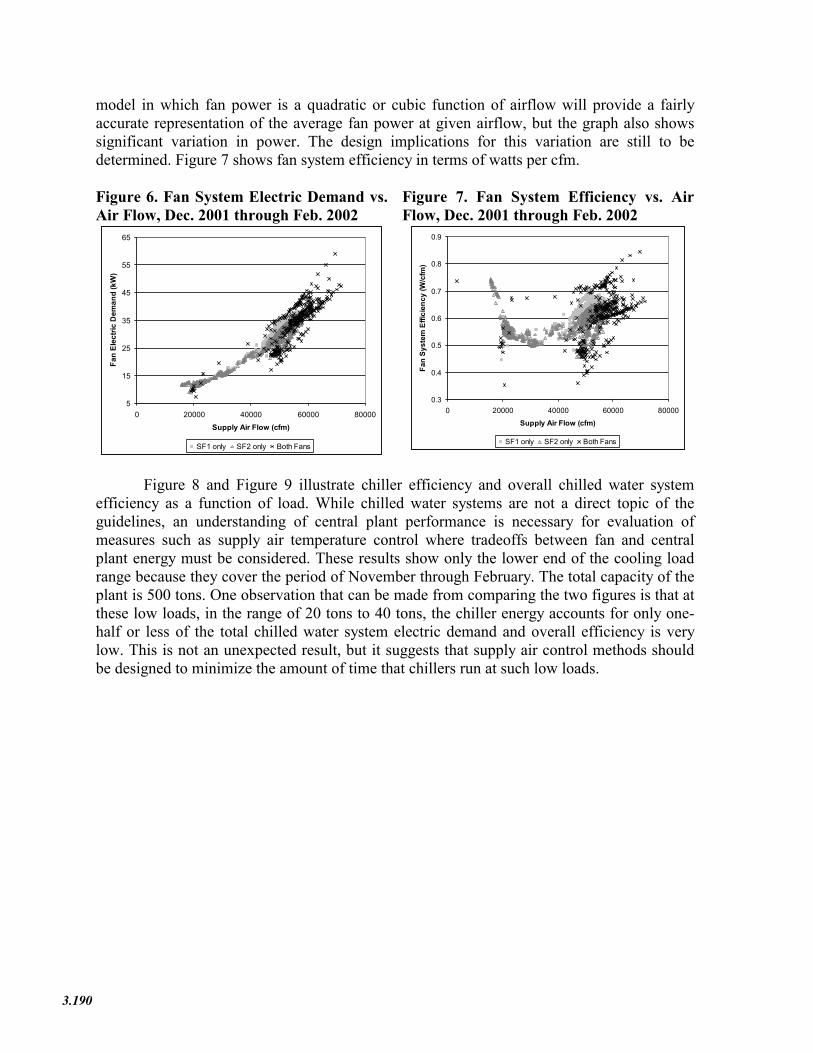
model in which fan power is a quadratic or cubic function of airflow will provide a fairly accurate representation of the average fan power at given airflow, but the graph also shows significant variation in power. The design implications for this variation are still to be determined. Figure 7 shows fan system efficiency in terms of watts per cfm.
Figure 6. Fan System Electric Demand vs. Air Flow, Dec. 2001 through Feb. 2002
Figure 7. Fan System Efficiency vs. Air Flow, Dec. 2001 through Feb. 2002
5
15
25
35
45
55
65
0 20000 40000 60000 80000Supply Air Flow (cfm)
Fan
Elec
tric
Dem
and
(kW
)
SF1 only SF2 only Both Fans
0.3
0.4
0.5
0.6
0.7
0.8
0.9
0 20000 40000 60000 80000Supply Air Flow (cfm)
Fan
Syst
em E
ffici
ency
(W/c
fm)
SF1 only SF2 only Both Fans
Figure 8 and Figure 9 illustrate chiller efficiency and overall chilled water system efficiency as a function of load. While chilled water systems are not a direct topic of the guidelines, an understanding of central plant performance is necessary for evaluation of measures such as supply air temperature control where tradeoffs between fan and central plant energy must be considered. These results show only the lower end of the cooling load range because they cover the period of November through February. The total capacity of the plant is 500 tons. One observation that can be made from comparing the two figures is that at these low loads, in the range of 20 tons to 40 tons, the chiller energy accounts for only one-half or less of the total chilled water system electric demand and overall efficiency is very low. This is not an unexpected result, but it suggests that supply air control methods should be designed to minimize the amount of time that chillers run at such low loads.
3.190
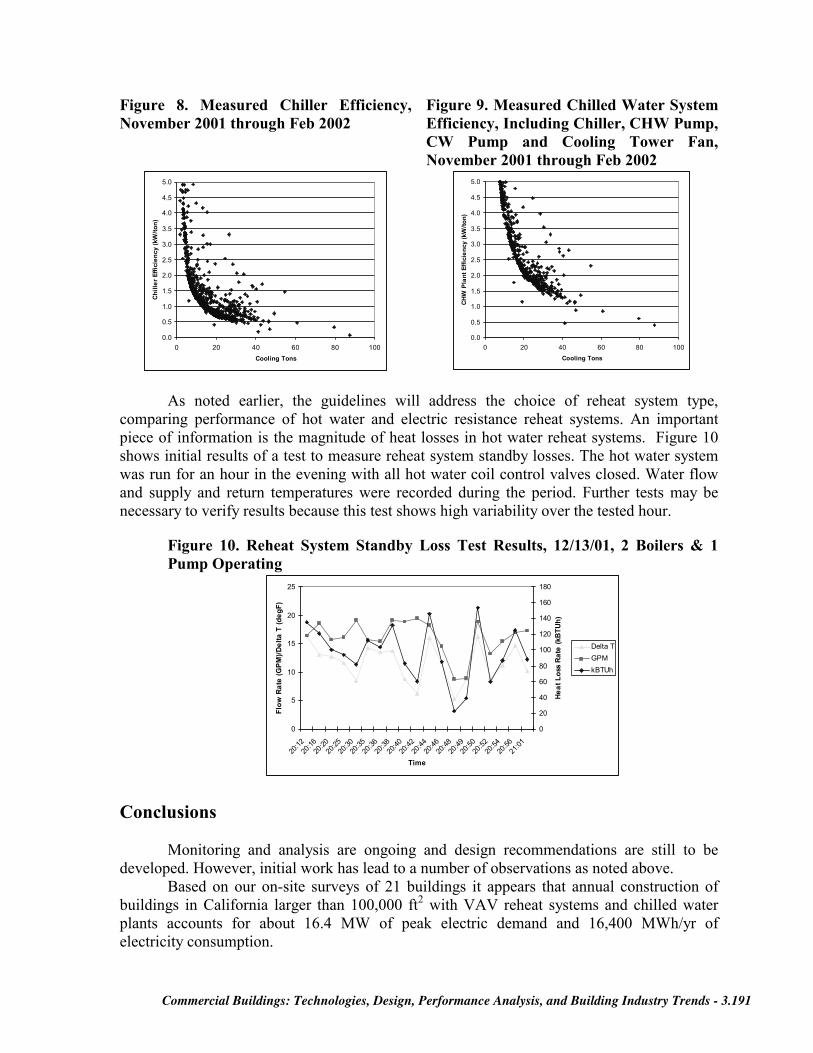
Figure 8. Measured Chiller Efficiency, November 2001 through Feb 2002
Figure 9. Measured Chilled Water System Efficiency, Including Chiller, CHW Pump, CW Pump and Cooling Tower Fan, November 2001 through Feb 2002
0.0
0.5
1.0
1.5
2.0
2.5
3.0
3.5
4.0
4.5
5.0
0 20 40 60 80 100Cooling Tons
Chill
er E
ffici
ency
(kW
/ton)
0.0
0.5
1.0
1.5
2.0
2.5
3.0
3.5
4.0
4.5
5.0
0 20 40 60 80 100Cooling Tons
CHW
Pla
nt E
ffici
ency
(kW
/ton)
As noted earlier, the guidelines will address the choice of reheat system type, comparing performance of hot water and electric resistance reheat systems. An important piece of information is the magnitude of heat losses in hot water reheat systems. Figure 10 shows initial results of a test to measure reheat system standby losses. The hot water system was run for an hour in the evening with all hot water coil control valves closed. Water flow and supply and return temperatures were recorded during the period. Further tests may be necessary to verify results because this test shows high variability over the tested hour.
Figure 10. Reheat System Standby Loss Test Results, 12/13/01, 2 Boilers & 1 Pump Operating
0
5
10
15
20
25
20:12
20:16
20:20
20:25
20:30
20:35
20:36
20:38
20:40
20:42
20:44
20:46
20:48
20:49
20:50
20:52
20:54
20:56
21:01
Time
Flow
Rat
e (G
PM)/D
elta
T (d
egF)
0
20
40
60
80
100
120
140
160
180
Heat
Los
s Ra
te (k
BTUh
)
Delta TGPMkBTUh
Conclusions
Monitoring and analysis are ongoing and design recommendations are still to be developed. However, initial work has lead to a number of observations as noted above.
Based on our on-site surveys of 21 buildings it appears that annual construction of buildings in California larger than 100,000 ft2 with VAV reheat systems and chilled water plants accounts for about 16.4 MW of peak electric demand and 16,400 MWh/yr of electricity consumption.
Commercial Buildings: Technologies, Design, Performance Analysis, and Building Industry Trends - 3.191

The building air distribution “system curve”, i.e. pressure across the fan as a function of airflow, is not a neat curve as assumed in simulations. There should be opportunities for savings through alternative fan selections and static pressure reset.
An important design issue identified during analysis of monitored fan system data is the use of backdraft dampers at the inlet or discharge side of supply fans that are arranged in parallel. Air velocity, and therefore pressure loss, is relatively high at these locations and can be a significant energy waste.
Our first attempt at measuring reheat system standby losses show highly varying losses over several hours of operation, and further investigation will likely be necessary.
Acknowledgements
Funding for this work was provided by the California Energy Commission through their Public Interest Energy Research (PIER) program, with Don Aumann as contract manager. This work is one of six research elements being managed by the New Buildings Institute with Cathy Higgins as Program Director.
References
Eley Associates. 2001. Screening Interview Summary Report. Report to New Buildings Institute. August 10. http://www.newbuildings.org/pier/.
Eley Associates. 2001. Onsite Inspection Summary Report. Report to New Buildings Institute, August 10. http://www.newbuildings.org/pier/.
Felker, Larry. 2002. “Minimum Outside Air Damper Control”. ASHRAE Journal 44 (4): 30-36.
New Buildings Institute. 2001. 2001 Annual Report, Integrated Energy Systems, Productivity & Building Science Program, (A project of the State of California PIER Program), Element 3 – Integrated Design of Large Commercial HVAC Systems, Final Report.July 27. http://www.newbuildings.org/pier/.
New Buildings Institute. 2001. 2001 Annual Report, Integrated Energy Systems, Productivity & Building Science Program, (A project of the State of California PIER Program), Element 4 – Integrated Design of Small Commercial HVAC Systems, Final Report.July 27. http://www.newbuildings.org/pier/.
Pacific Gas & Electric. 1999. CoolToolsTM. http://www.hvacexchange.com/cooltools/.
3.192