importancia de la actuación docente frente a la política6888778… · el papel de los centros y...
TRANSCRIPT


Importancia de la actuación docente frente a la políticaeducativa regional en la explicación del rendimiento en PISA
The importance of teaching practices in relation to regionaleducational policies in explaining PISA achievement
DOI: 10.4438/1988-592X-RE-2017-378-361
Javier Gil-FloresSoledad García-GómezUniversidad de Sevilla
ResumenEntre los factores que explican el rendimiento en PISA, destaca el papel de
las variables que informan sobre el contexto social, económico y cultural. Estetipo de variables no son directamente moldeables, y escapan a las posibilidadesde intervención de los agentes educativos. Controlado el efecto del contextosocioeconómico, en este trabajo consideramos variables relativas a las políticaseducativas regionales, la cultura institucional de los centros y el desempeñodocente, con el fin de analizar su relación con los resultados obtenidos en PISA.Para ello, llevamos a cabo un análisis secundario a partir de datoscorrespondientes a 976 centros educativos de las 17 regiones españolasparticipantes en PISA-2015, junto con datos relativos a escolarización,financiación y recursos disponibles a nivel autonómico. Mediante análisis linealjerárquico, construimos sucesivos modelos de regresión multinivel para valorarel papel de los centros y las políticas regionales en la explicación de lacompetencia científica alcanzada en los centros. Los resultados obtenidos, en loque respecta a las políticas educativas, destacan el efecto positivo de la ratioalumnos-profesor y el negativo del número de ordenadores por aula, medidos anivel regional. En cuanto al papel de los centros, se han encontrado efectossignificativos para el clima escolar y la actuación del profesorado. En particular,las conductas negativas del alumnado y el trato irrespetuoso al alumno sevinculan a menores niveles de competencia. En cambio, un buen control de laclase, el ejercicio de una enseñanza dirigida por el profesor o la adaptación de
Revista de Educación, 378. Octubre-Diciembre 2017, pp. 52-77Recibido: 17-03-2017 Aceptado: 02-06-2017
52

la enseñanza a las necesidades del alumnado se asocian a una mayorcompetencia. Se registran niveles bajos de competencia científica cuando estánpresentes la retroalimentación y el apoyo al alumno. A partir de estos hallazgosse formulan propuestas orientadas a la intervención en los centros y a la revisiónde las políticas educativas.
Palabras clave: educación secundaria, rendimiento, política educativa, centroseducativos, actuaciones docentes.
AbstractAmong the variables that explain schools and students' performances as
measured in PISA stand out those that provide information about the social,economic and cultural context. These factors are non-malleable and are notwithin educational agents' reach. So that, once the effect of the socioeconomiccontext on assessment was controlled, we focused the study on the role thatvariables related to educational regional policy, to schools' institutional cultureand to the teaching practices play on schools performance in PISA. For thispurpose we carried out a secondary analysis with data of 976 secondary schoolsdistributed along the 17 regions of Spain participating in PISA-2015 assessmentcycle, and also with data about public/private enrolment, educational spendingand available resources of the regional systems. We have built successivemultilevel regression models -through a hierarchical linear analysis- in order toknow the role of schools and educational policy of all the Spanish regions onthe explanation of schools' scientific competence. Findings focused oneducational policy variables show that student-teacher ratio and the quantity ofcomputers by classroom do matter on achievement. About the incidence on theperformance of schools’ variables we found out that the school climate and theteaching practices have significant effects on outcomes. Students’ disruptivebehaviour and teachers’ disrespectful interaction with pupils are both variablesrelated to a lower level of competence. Nevertheless, efficacy in the classroommanagement, a direct teaching approach and the adaptation of the teachingactivities to students’ needs are variables related to a higher level of competence.Students’ support and feedback exists when a low-level of scientific competenceis founded. Finally, some proposals have emerged from these findings in orderto do better at schools and to redirect educational policy.
Keywords: secondary education, achievement, educational policy, schools,teaching practices.
Gil-Flores, J., García-Gómez, S. ImpORtAncIA DE lA ActUAcIón DOcEntE FREntE A lA pOlítIcA EDUcAtIvA REGIOnAl En lA EXplIcAcIón
DEl REnDImIEntO En pISA
Revista de Educación, 378. Octubre-Diciembre 2017, pp. 52-77Recibido: 17-03-2017 Aceptado: 02-06-2017
53

Introducción
Durante las últimas décadas se han venido desarrollando evaluacionesinternacionales del rendimiento a gran escala, con participación de uncreciente número de países. En particular, la publicación de informestrianuales correspondientes a la evaluación PISA, que cuenta ya con seisediciones, genera numerosos artículos científicos a nivel internacional ynacional (Luzón y Torres, 2013). Tanto desde el ámbito pedagógico comodesde el económico, se ha analizado la relación entre los resultados de estasevaluaciones y determinadas características de los sistemas educativos(Cordero, Crespo y Pedraja, 2013; González, Caso, Díaz y López, 2012; Nietoy Recamán, 2012), y se ha reflexionado sobre sus implicaciones en el ámbitode las políticas educativas (Ferrer, 2012; Pedró, 2012). Los datos de lassucesivas ediciones de PISA permiten hacer estudios comparados que aportanuna visión evolutiva del rendimiento del alumnado y de los propios sistemaseducativos (Carabaña, 2008; De-Jorge, 2016; Lenkeit y Caro, 2014). Además,en algunos países se han realizado estudios que indagan en las diferenciasinterregionales, tratando de explicar las diferencias observadas a partir derasgos propios de las regiones. En el caso de Italia, Bratti, Checchi y Filippin(2007) encontraron que las principales diferencias interregionales radican ensus recursos y en las características de los mercados laborales. En cambio, alanalizar las diferencias entre regiones portuguesas, Coutinho y Reis (2012)hallaron un papel limitado para los factores puramente regionales,concediendo mayor relevancia a las características individuales, familiares yescolares.
España ha contado con datos desagregados a nivel regional en variasediciones. A partir de aquellos se han llevado a cabo trabajos paraexplicar las diferencias en el rendimiento del alumnado español,analizando aspectos de las políticas educativas propias de cada región(Foces, 2015; García y Robles, 2013; Gil, 2014). En PISA 2015 se disponepor primera vez de resultados para la totalidad de las regionesautonómicas españolas. En términos generales, los estudios realizadosconstatan una correlación positiva entre el rendimiento del alumnado ylas variables que reflejan el desarrollo social y económico de los distintospaíses o regiones como, por ejemplo, el nivel socioeconómico y cultural,el PIB per cápita, la tasa de paro o la tasa de riesgo de pobreza (Ferrer,Valiente y Castel, 2010; Mancebón y Pérez, 2010). Medido para cadaalumno o agregado a nivel de centros o regiones, el índice de estatussocioeconómico y cultural (ESCS) construido en PISA es la variable que
Gil-Flores, J., García-Gómez, S. ImpORtAncIA DE lA ActUAcIón DOcEntE FREntE A lA pOlítIcA EDUcAtIvA REGIOnAl En lA EXplIcAcIón
DEl REnDImIEntO En pISA
Revista de Educación, 378. Octubre-Diciembre 2017, pp. 52-77Recibido: 17-03-2017 Aceptado: 02-06-2017
54

mejor explica las diferencias de rendimiento (Calero y Escardíbul, 2007;Elosua, 2013). Dada la naturaleza de este tipo de variables, los agenteseducativos carecen de margen de actuación sobre ellas. Por este motivo,nuestro interés se centra en analizar el papel de las políticas educativasregionales y de las instituciones escolares en la explicación de lasdiferencias de rendimiento, ámbitos donde es posible la intervención conel objetivo de lograr mejoras en el aprendizaje del alumnado.
En relación con las políticas educativas, la literatura científica reflejael papel de determinadas variables en la explicación del rendimiento,como por ejemplo: gasto educativo (Calero y Escardíbul, 2014),escolarización en centros públicos o privados (Duncan y Sandy, 2007),recursos disponibles en los centros (De-Jorge, 2016), o cantidad yutilización de recursos informáticos (Spiezia, 2010). En general, se asumeque mayor financiación se traduce en más posibilidades de acceso a laescolarización y más recursos personales y/o materiales; se vincula así elrendimiento académico con las inversiones que se realizan en el sistemaeducativo. Calero y Escardíbul (2014) analizaron los efectos del gastoeducativo en el rendimiento y encontraron que esta relación se debilita apartir de ciertos niveles de gasto. En cuanto a la financiación pública decentros de titularidad privada, aquellos países donde se apoyaeconómicamente a los centros privados tienden a lograr mejoresresultados de aprendizaje (OECD, 2012). No obstante, las diferencias derendimiento en PISA a favor de los centros privados han sido atribuidasal efecto del desigual nivel socioeconómico (Calero y Escardíbul, 2007;Ferrer et ál., 2010). En estrecha relación con la financiación, se haexplorado la conexión entre disponibilidad de recursos materiales yrendimiento educativo, encontrando una relación positiva (Haegeland,Raaum y Salvanes, 2012; Murillo y Román, 2011). En lo que respecta arecursos TIC, el efecto positivo del uso de ordenadores sobre elrendimiento educativo no está claramente demostrado (Claro, 2010;Mediavilla y Escardíbul, 2015). También se han explorado los efectossobre el aprendizaje para variables como el tamaño de los grupos de clasey la ratio alumnos-profesor. Blatchford, Bassett y Brown (2011) concluyenque los grupos más pequeños facilitan el aprendizaje de todo elalumnado. Sin embargo, a nivel de sistemas educativos, Van Damme, Liu,Vanhee y Pustjens (2010) constataron que la modificación del tamaño delas clases apenas explica los cambios observados en las puntuacionesmedias obtenidas dentro de un país en sucesivas ediciones deevaluaciones a gran escala.
Gil-Flores, J., García-Gómez, S. ImpORtAncIA DE lA ActUAcIón DOcEntE FREntE A lA pOlítIcA EDUcAtIvA REGIOnAl En lA EXplIcAcIón
DEl REnDImIEntO En pISA
Revista de Educación, 378. Octubre-Diciembre 2017, pp. 52-77Recibido: 17-03-2017 Aceptado: 02-06-2017
55

En lo que respecta al papel de los centros en la explicación delrendimiento del alumnado, la investigación se ha centrado en diferentesaspectos de la cultura institucional. Ésta puede llegar a facilitar uobstaculizar los procesos de innovación y mejora en los centroseducativos, repercutiendo en la eficacia de los procesos de enseñanza-aprendizaje en las aulas. Un elemento clave de la cultura y la organizaciónescolar son los equipos directivos, cuyo liderazgo pedagógico debe incidiren las actuaciones del profesorado en pro de la motivación, la implicacióny los logros académicos del alumnado (Day, Gu y Sammons, 2016;Hallinger y Heck, 2010; Murillo y Hernández-Castilla, 2015). Esteliderazgo también se refleja en la preocupación por la calidad. En estesentido, las prácticas evaluadoras en el seno de las institucioneseducativas constituyen una evidencia del interés por la mejora de losresultados académicos, e implican tanto a los equipos directivos como alprofesorado (Bolívar, 2006). Otra variable con una clara y reconocidainfluencia en el rendimiento es la implicación de las familias. En generalse sostiene que su participación tiene efectos positivos sobre los logrosacadémicos (Collet-Sabé, Besalú, Feu y Tort, 2014).
Junto a la cultura institucional, debe considerarse la actuación docenteen las aulas. El desempeño del profesorado juega un papel relevante alexplicar el aprendizaje del alumnado (Clavel, Crespo y Méndez, 2016;Freiberg, 2013). Los trabajos ya clásicos de autores como Doyle (1980)pusieron el énfasis en el profesorado y su gestión de los procesos deenseñanza-aprendizaje en las aulas, destacando la importancia de establecerun orden, clima y ambiente de clases adecuados. Gaskins, Herres y Kobak(2012) y Krüger, Formichella y Lecuona (2015) sostienen que la únicavariable a nivel escolar con incidencia significativa en el rendimiento es elclima de clase. También se han explorado los efectos que tienen sobre losaprendizajes las prácticas educativas inclusivas o las metodologíasinnovadoras. Según Bietenbeck (2014), los enfoques de enseñanza másactivos tienen efectos más positivos que los tradicionales, destacando elvalor del seguimiento de las tareas desarrolladas por el alumnado. Tantoel seguimiento como el apoyo y la retroalimentación tienen consecuenciaspositivas en el rendimiento (Harks, Rakoczy, Hattie, Besser y Klieme, 2014).Especialmente relevantes son la relación personal y los aspectosemocionales (López-González y Oriol, 2016; Reyes, Brackett, Rivers, Whitey Salovey, 2012), siendo crucial el papel de la competencia social yemocional del profesorado de cara a regular las relaciones con el alumnadoy favorecer su rendimiento (Jennings y Greenberg, 2009; Kunter,Klusmann, Baumert, Richter, Voss y Hachfeld, 2013).
Gil-Flores, J., García-Gómez, S. ImpORtAncIA DE lA ActUAcIón DOcEntE FREntE A lA pOlítIcA EDUcAtIvA REGIOnAl En lA EXplIcAcIón
DEl REnDImIEntO En pISA
Revista de Educación, 378. Octubre-Diciembre 2017, pp. 52-77Recibido: 17-03-2017 Aceptado: 02-06-2017
56

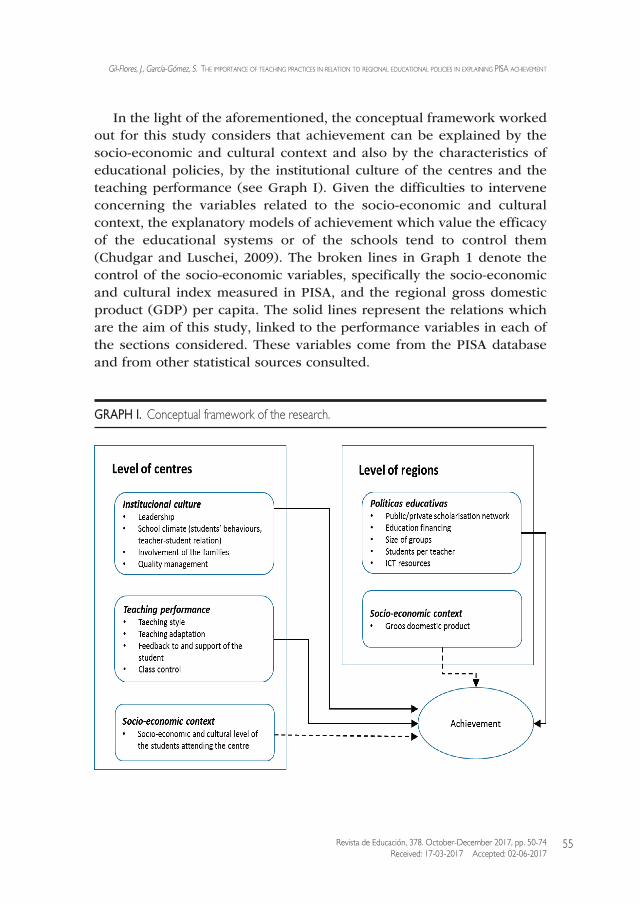
A la luz de la exposición desarrollada en párrafos anteriores, el marcoconceptual elaborado para este estudio considera que el rendimientopuede ser explicado por el contexto socioeconómico y cultural, y tambiénpor características de las políticas educativas, de la cultura institucionalde los centros y del desempeño docente (ver gráfico I). Dadas lasdificultades para intervenir sobre las variables relativas al contextosocioeconómico y cultural, los modelos explicativos del rendimiento quevaloran la eficacia de los sistemas educativos o de las escuelas suelencontrolarlas (Chudgar y Luschei, 2009). Las líneas discontinuas en elgráfico I denotan el control de las variables socioeconómicas,concretamente el índice de nivel socioeconómico y cultural medido enPISA, y el producto interior bruto (PIB) per cápita regional. Las líneassólidas representan las relaciones que son objeto de estudio, vinculandoal rendimiento variables en cada uno de los apartados considerados. Estasvariables proceden de la base de datos de PISA y de otras fuentesestadísticas consultadas.
GRÁFICO I. marco conceptual de la investigación.
Gil-Flores, J., García-Gómez, S. ImpORtAncIA DE lA ActUAcIón DOcEntE FREntE A lA pOlítIcA EDUcAtIvA REGIOnAl En lA EXplIcAcIón
DEl REnDImIEntO En pISA
Revista de Educación, 378. Octubre-Diciembre 2017, pp. 52-77Recibido: 17-03-2017 Aceptado: 02-06-2017
57

Partiendo de este marco conceptual, el objetivo es conocer el papelque desempeñan las políticas educativas regionales y los centros escolaresen la explicación del rendimiento. La identificación de factores queexpliquen las diferencias de rendimiento observadas constituye la basesobre la que fundamentar recomendaciones para la actuación docente, lagestión de los centros y/o las políticas autonómicas. Concretamente,pretendemos responder a las siguientes cuestiones:
n Controlando el efecto del contexto socioeconómico, ¿existe relaciónentre el rendimiento en PISA y las políticas educativas regionalesen materia de escolarización, financiación y recursos?
n Controlando el efecto del contexto socioeconómico y de las políticaseducativas regionales, ¿está relacionado el rendimiento con la culturainstitucional de los centros y la actuación docente desarrollada enlas aulas?
Método
Hemos desarrollado un análisis secundario sobre datos relativos a 976centros educativos españoles participantes en PISA-2015. Los datos paralos centros analizados proceden de cuestionarios de contexto respondidospor sus directores y por 32.330 estudiantes de quince años (50.6%alumnos, 49.4% alumnas) que cursan estudios en ellos. Contemplamosademás datos referidos al contexto económico y a los sistemas educativosregionales, extraídos de diversos informes estadísticos (Instituto Nacionalde Estadística, 2016; MECD, 2016, 2017).
Variables
a) Variable dependiente
Consideramos como variable dependiente la puntuación en competenciacientífica, ámbito donde profundiza la última evaluación PISA. Estacompetencia se mide en PISA mediante pruebas estandarizadas,generando puntuaciones individuales mediante modelos de la Teoría deRespuesta al Ítem (TRI). Tales puntuaciones se expresan en una escala
Gil-Flores, J., García-Gómez, S. ImpORtAncIA DE lA ActUAcIón DOcEntE FREntE A lA pOlítIcA EDUcAtIvA REGIOnAl En lA EXplIcAcIón
DEl REnDImIEntO En pISA
Revista de Educación, 378. Octubre-Diciembre 2017, pp. 52-77Recibido: 17-03-2017 Aceptado: 02-06-2017
58

de desviación típica 100 y media 500, coincidiendo ese valor con la mediade rendimiento para todo el alumnado de países de la OCDE en laprimera edición de PISA. Como es habitual en evaluaciones a gran escala,se utiliza la metodología de valores plausibles (Wu, 2005) para determinarel nivel de competencia atribuido a un estudiante. Hemos tomado los 10valores plausibles extraídos en PISA para cada individuo como punto departida en la estimación del rendimiento medio en ciencias alcanzado porcada centro educativo. Para obtener el valor atribuido al centro, utilizamosel programa IDB Analyzer proporcionado por el Data Processing and
Research Center de la IEA (International Association for the Evaluation
of Educational Achievement). Este software está dirigido específicamenteal análisis estadístico de datos procedentes de estudios internacionales agran escala. Permite el trabajo con valores plausibles, teniendo en cuentalos pesos muestrales correspondientes a cada individuo y aplicando elmétodo de réplicas repetidas balanceadas.
b) Variables explicativas a nivel de centros
Entre las variables explicativas a nivel de centros incluimos algunosíndices disponibles en la base de datos PISA-2015, derivados de loscuestionarios de contexto respondidos por el alumnado o la dirección.Tales índices resumen las respuestas a conjuntos de ítems utilizandoprocedimientos diversos. Los detalles sobre la construcción de estosíndices, así como los ítems utilizados, pueden consultarse en el informetécnico elaborado para PISA-2015 (OECD, 2017). Otras variables han sidoconstruidas expresamente para el presente análisis, como señalaremos alpresentarlas.
La primera variable es el índice de nivel socioeconómico y cultural
(ESCS). Es un índice construido para cada estudiante a partir del nivel deestudios de los padres, su ocupación profesional y las posesiones en elhogar (número de libros, ordenador, conexión a Internet, etc.). El valoratribuido al centro se ha obtenido promediando los correspondientes acada uno de sus alumnos. Junto a este índice, se han utilizado otros quecorresponden a variables relativas a la cultura institucional de los centros:
n Liderazgo educativo. Es el índice LEAD contenido en la base dedatos de PISA. Informa sobre la fortaleza del liderazgo ejercido por
Gil-Flores, J., García-Gómez, S. ImpORtAncIA DE lA ActUAcIón DOcEntE FREntE A lA pOlítIcA EDUcAtIvA REGIOnAl En lA EXplIcAcIón
DEl REnDImIEntO En pISA
Revista de Educación, 378. Octubre-Diciembre 2017, pp. 52-77Recibido: 17-03-2017 Aceptado: 02-06-2017
59

la dirección del centro. Se construye a partir de las respuestas a 13ítems. Los directores indicaron la frecuencia con que ciertasactuaciones vinculadas al liderazgo se habían producido en el últimoaño, utilizando una escala de 6 niveles, desde “no ocurrió” hasta“más de 1 vez a la semana”.
n Conductas negativas del alumnado. Índice STUBEHA en PISA.Basado en 5 ítems que recogen las percepciones de los directoressobre la medida en que determinadas conductas del alumnado delcentro obstaculizan los procesos de aprendizaje. La escala derespuesta incluía 4 modalidades, desde “nada” hasta “mucho”.
n Respeto al alumnado. Construido para el presente estudio medianteanálisis de componentes principales para datos categóricos(CATPCA) a partir de los ítems ST039Q04NA, ST039Q05NA yST039Q06NA respondidos por los estudiantes en relación con eltrato que reciben de sus profesores. Las respuestas se apoyan enuna escala de 4 niveles, desde “nunca o casi nunca” hasta “una omás veces a la semana”. El valor para cada centro se obtuvopromediando los atribuidos a su alumnado.
n Implicación de las familias. Índice SCHEFFPAR en PISA, que indicasi se hacen esfuerzos para implicar a padres y madres en lasactividades del centro, de acuerdo con las respuestas de losdirectores a 4 ítems. El índice expresa el porcentaje de afirmacionesque son aplicables al centro.
n Mejora de la calidad. Índice construido para el presente estudio,que informa sobre el número de medidas adoptadas para asegurary aumentar la calidad del centro desde la perspectiva de losdirectores (ítems SC037Q01TA, SC037Q02TA, SC037Q04TA,SC037Q05TA y SC037Q07TA).
Otro grupo de variables explicativas medidas a nivel de centros hacereferencia a los procesos de enseñanza-aprendizaje, centrándose en eldesempeño docente en las clases de ciencias. Corresponden a índicesdisponibles en la base de datos de PISA, generados a partir de loscuestionarios del alumnado. En ellos se preguntaba por la frecuencia conque ocurren determinadas situaciones, proporcionando una escala derespuesta con 4 modalidades, que iban desde “nunca o casi nunca” hasta
Gil-Flores, J., García-Gómez, S. ImpORtAncIA DE lA ActUAcIón DOcEntE FREntE A lA pOlítIcA EDUcAtIvA REGIOnAl En lA EXplIcAcIón
DEl REnDImIEntO En pISA
Revista de Educación, 378. Octubre-Diciembre 2017, pp. 52-77Recibido: 17-03-2017 Aceptado: 02-06-2017
60

“en todas o en casi todas las clases”. Los valores de centro se obtuvieronpromediando las puntuaciones correspondientes a su alumnado. Estasvariables son las siguientes:
n Estilo docente directivo (TDTEACH). Construido a partir de lasrespuestas de los estudiantes a 4 ítems, que reflejan en qué medidael profesorado establece la dinámica de las clases.
n Metodología investigativa (IBTEACH). Se apoya en 9 ítems quehacen referencia a un estilo de enseñanza basado en lainvestigación.
n Adaptación de la enseñanza (ADINST). Se genera a partir de 3 ítemsque reflejan cómo el profesor adapta los procesos de enseñanza alas características del alumnado.
n Retroalimentación al alumnado (PERFEED). Basado en 5 ítemsreferidos a la información que reciben sobre su aprendizaje.
n Apoyo al alumnado (TEACHSUP). Elaborado a partir de 5 ítemsrelativos al apoyo que brinda el profesor para facilitar el aprendizaje.
Se ha considerado una variable adicional sobre la enseñanzadesarrollada en el centro, que hemos construido mediante análisisCATPCA a partir de las respuestas al cuestionario de estudiantes:
n Control de la clase. Informa sobre el modo en que el profesorgestiona la clase creando condiciones adecuadas para el aprendizaje.Utilizamos en su construcción 5 ítems (ST097Q01TA a ST097Q05TA)que reflejan situaciones negativas en las aulas. Los estudiantesexpresaron la frecuencia con que se daban estas situaciones, deacuerdo con una escala de 4 niveles que iban desde “en todas lasclases” hasta “nunca o casi nunca”.
Todos estos índices se expresan como puntuaciones estandarizadas,con la excepción del índice implicación de las familias, que se expresaen forma de porcentaje, y el índice mejora de la calidad, con valoresentre 0 y 5. Los estadísticos descriptivos para el conjunto de variables enlos centros de la muestra estudiada se recogen en la tabla I.
Gil-Flores, J., García-Gómez, S. ImpORtAncIA DE lA ActUAcIón DOcEntE FREntE A lA pOlítIcA EDUcAtIvA REGIOnAl En lA EXplIcAcIón
DEl REnDImIEntO En pISA
Revista de Educación, 378. Octubre-Diciembre 2017, pp. 52-77Recibido: 17-03-2017 Aceptado: 02-06-2017
61

TABLA I. Estadísticos descriptivos para las variables medidas a nivel de centros.
c) Variables explicativas a nivel regional
Las variables independientes medidas a nivel regional correspondena información externa a la evaluación PISA. Son las siguientes:
n PIB per cápita. Producto interior bruto regional por habitante,expresado en euros.
n Alumnado en centros públicos. Porcentaje de alumnado deEducación Secundaria Obligatoria (ESO) escolarizado en centros detitularidad pública.
n Gasto en educación por alumno. Indicador de financiación de laeducación en los sistemas educativos regionales, definido como elgasto público por alumno en enseñanza no universitaria.
n Tamaño de los grupos. Número medio de alumnos por grupoeducativo en ESO.
n Ratio alumnos-profesor. Número medio de alumnos por profesor enenseñanzas no universitarias.
Gil-Flores, J., García-Gómez, S. ImpORtAncIA DE lA ActUAcIón DOcEntE FREntE A lA pOlítIcA EDUcAtIvA REGIOnAl En lA EXplIcAcIón
DEl REnDImIEntO En pISA
Revista de Educación, 378. Octubre-Diciembre 2017, pp. 52-77Recibido: 17-03-2017 Aceptado: 02-06-2017
62
Variables MediaDesviación
típica
ESCS -,50 ,62
Liderazgo educativo -,22 ,83
Conductas negativas del alumnado -,19 1,08
Respeto al alumnado ,00 ,26
Implicación de las familias 91,77 15,01
Mejora de la calidad 4,19 1,02
Estilo docente directivo ,02 ,30
Metodología investigativa -,31 ,37
Adaptación de la enseñanza ,14 ,33
Retroalimentación al alumnado ,11 ,34
Apoyo al alumnado ,04 ,37
Control de la clase ,00 ,37

n Ordenadores por grupo. Número medio de ordenadores por unidado grupo en centros de educación primaria y educación secundaria,destinados a la docencia con alumnos.
Los datos del PIB per cápita corresponden a 2015 y se han obtenidode la Contabilidad Regional de España (Instituto Nacional de Estadística,2016). Los datos de alumnado en centros públicos, gasto en educaciónpor alumno, ratio alumnos-profesor y ordenadores por grupo procedende Las cifras de la educación en España (MECD, 2017) y correspondenal curso 2014-2015. El tamaño de los grupos se extrajo del Sistema Estatal
de Indicadores de la Educación (MECD, 2016). Los valores para estasvariables en las 17 regiones autonómicas se muestran en la tabla II.
TABLA II. valores para las variables medidas a nivel regional
Análisis de datos
Disponemos de variables medidas para los centros y variables quecaracterizan a los sistemas educativos regionales. Dado que los centros
Gil-Flores, J., García-Gómez, S. ImpORtAncIA DE lA ActUAcIón DOcEntE FREntE A lA pOlítIcA EDUcAtIvA REGIOnAl En lA EXplIcAcIón
DEl REnDImIEntO En pISA
Revista de Educación, 378. Octubre-Diciembre 2017, pp. 52-77Recibido: 17-03-2017 Aceptado: 02-06-2017
63
Comunidad AutónomaPIB per cápita
(€ )
Alumnadoen centros
públicos (%)
Gasto eneducación por
alumno(€ )
Tamaño de losgrupos (nºalumnos)
Ratio alumnos-profesor
Ordenadorespor grupo
Andalucía 17263 75,2 4042 26,1 13,1 9,3
Aragón 25552 65,8 4707 23,6 12,1 6,7
Asturias 20675 66,3 5530 22,5 10,9 7,7
Baleares 24394 60,8 4808 25,8 11,7 10,9
Canarias 19900 75,8 4539 24,3 13,7 5,1
Cantabria 20847 66,3 5623 23,7 11,2 6,4
Castilla-La Mancha 18354 80,1 4295 24,5 12,4 6,1
Castilla y León 21922 64,0 5109 23,4 11,3 4,8
Cataluña 27663 62,0 4198 27,8 13,2 5,8
Extremadura 16166 76,7 5276 21,4 11,3 9,5
Galicia 20431 70,3 5404 20,4 10,5 7,2
La Rioja 25507 61,4 4827 23,5 12,3 6,0
Madrid 31812 52,0 3857 26,4 14,1 3,7
Murcia 18929 69,8 4352 24,9 12,5 3,3
Navarra 28682 60,2 5692 24,1 11,3 3,9
País Vasco 30459 46,4 6448 21,6 12,1 11,5
Com. Valenciana 20586 63,8 4449 25,7 12,9 3,9

se encuentran anidados en regiones, ciertas características de los centrospertenecientes a una misma región no son independientes entre sí, puesestarían condicionadas por una misma política educativa desarrollada enel contexto regional. Consecuentemente, recurrimos a modelos multinivel,considerando en un mismo análisis variables medidas a nivel de centros(primer nivel) y de regiones (segundo nivel). En respuesta a losinterrogantes planteados en este trabajo, hemos desarrollado un procesode modelado contrastando sucesivos modelos de regresión multinivel. Enprimer lugar, se contrasta el modelo nulo o incondicional (modelo 0) paracomprobar la existencia de diferencias significativas entre regiones yvalorar la pertinencia del enfoque multinivel. Los modelos siguientesañaden de manera sucesiva variables relativas al contexto socioeconómico(modelo 1), a las políticas educativas regionales (modelo 2), así como ala cultura institucional de los centros y al desempeño del profesorado enlas aulas (modelo 3).
El modelo multinivel nulo incluye un solo factor de efectos aleatorios.Queda formulado según la ecuación (1):
(1)
donde Yij
es la puntuación media en competencia científica para el centroi en la región j. Esta puntuación resulta de sumar a la media global decompetencia en el conjunto de centros (g
00), la variación aleatoria de las
medias regionales respecto a la media global (u0j) y la variación aleatoria
de los centros respecto a la media de su región (eij).
A partir de este modelo nulo se han ido construyendo los restantesmodelos. En ellos se han incorporado nuevas variables, manteniendo lasque presentaron efectos significativos en el modelo inmediato anterior.El modelo final, por tanto, incluye variables explicativas a nivel de centrosy regiones. Siendo M y N el número de variables en ambos niveles, estemodelo queda expresado por la ecuación (2):
(2)
donde la parte fija del modelo la integran g00
(efecto de la media global),g
p0(efectos principales para cada una de las variables de centro) y g
0q
(efectos principales para las variables regionales). En este modelo, Xpij
Gil-Flores, J., García-Gómez, S. ImpORtAncIA DE lA ActUAcIón DOcEntE FREntE A lA pOlítIcA EDUcAtIvA REGIOnAl En lA EXplIcAcIón
DEl REnDImIEntO En pISA
Revista de Educación, 378. Octubre-Diciembre 2017, pp. 52-77Recibido: 17-03-2017 Aceptado: 02-06-2017
64

representa el valor de la p-ésima variable en el centro i de la región j,mientras que Z
qjes el valor de la q-ésima variable en la región j. En los
modelos construidos, se asume la independencia entre los errores u0j
ye
ij, cuyas distribuciones tienden a modelos normales N (0, s2
u0) y N (0,s2
e).
Resultados
En la tabla III mostramos los resultados de la regresión multinivel.Partimos del modelo nulo de un factor de efectos aleatorios, tomandocomo factor la región y sin incluir ninguna variable explicativa. Lavariación de las puntuaciones en competencia científica entre regiones(u
0j=187,32; p<0,001) y la variación entre centros dentro de cada región
(eij=1012,74; p<0,01) resultan significativas. Tomando como referencia el
total de la variación observada en el rendimiento de los centros españolesen ciencias (e
ij+u
0j=1200,06), las diferencias entre centros dentro de una
misma región (eij) representan un 84,39%, mientras que el 15,61%
corresponde a las diferencias registradas entre sistemas educativosregionales (u
0j). La existencia de una varianza significativa dentro de las
regiones y entre regiones aconseja proseguir el modelado multinivel,incluyendo variables en el análisis que contribuyan a explicar lavariabilidad observada en ambos niveles.
Gil-Flores, J., García-Gómez, S. ImpORtAncIA DE lA ActUAcIón DOcEntE FREntE A lA pOlítIcA EDUcAtIvA REGIOnAl En lA EXplIcAcIón
DEl REnDImIEntO En pISA
Revista de Educación, 378. Octubre-Diciembre 2017, pp. 52-77Recibido: 17-03-2017 Aceptado: 02-06-2017
65

TABLA III. parámetros y errores típicos para los modelos de regresión multinivel sobre lacompetencia científica media en los centros
* p< ,05: ** p<,01; ***p<,00
Construimos el modelo 1 con el fin de controlar las variables PIB ynivel socioeconómico y cultural, medidas respectivamente para regionesy centros. Los resultados obtenidos muestran efectos significativos delESCS (p<,001). En presencia de este, el efecto del PIB per cápita regionalno resulta significativo, por lo que esta variable ha sido removida enmodelos posteriores. De acuerdo con el efecto estimado para el ESCS,
Gil-Flores, J., García-Gómez, S. ImpORtAncIA DE lA ActUAcIón DOcEntE FREntE A lA pOlítIcA EDUcAtIvA REGIOnAl En lA EXplIcAcIón
DEl REnDImIEntO En pISA
Revista de Educación, 378. Octubre-Diciembre 2017, pp. 52-77Recibido: 17-03-2017 Aceptado: 02-06-2017
66
Modelo 0 Modelo 1 Modelo 2 Modelo 3
Efectos fijos
? Intercepción 495,31 (3,48)*** 514,54 (13,36)*** 778,36 (10,78)*** 656,16 (42,09)***
Contexto socioeconómico
? PIB per cápita 0,01 (0,00) - -
? ESCS 37,85 (1,21)*** 37,94 (1,21)*** 31,31 (1,38)***
Políticas educativas regionales
? Alumnado en centros públicos -0,39 (0,24) -
? Gasto en educación por alumno -0,01 (0,01)* -,01 (0,00)
? Tamaño de los grupos -0,91 (1,41)
? Ratio alumnos-profesor -10,85 (2,51)*** -8,29 (2,33)**
? Ordenadores por grupo -2,36 (0,66)** -2,45 (0,71)**
Cultura institucional del centro
? Liderazgo educativo -1,10 (0,87)
? Conductas negativas del alumnado -3,31 (0,72)***
? Respeto al alumnado -9,14 (2,95)**
? Implicación de las familias 0,09 (0,05)
? Mejora de la calidad -1,00 (0,71)
Desempeño docente
? Estilo docente directivo 15,87 (3,54)***
? Metodología investigativa -2,11 (2,48)
? Adaptación de la enseñanza 10,16 (3,80)**
? Retroalimentación al alumnado -19,32 (2,89)***
? Apoyo al alumnado -8,83 (3,48)*
? Control de la clase 13,14 (2,06)***
Efectos aleatorios
eij (varianza intra-regiones) 1012, 74 (46,25)*** 505,15 (23,08)*** 505,27 (23,09)*** 392,63 (18,91)***
u0j (varianza inter-regiones) 187,24 (72,66)** 105,02 (41,14)* 26,53 (15,36) 33,82 (16,53)*
cuando su valor aumenta en una unidad la competencia científica mediaen el centro se eleva en 37,85 puntos. La varianza no explicada entreregiones (u
0j) se reduce desde el valor 187,32 registrado en el modelo
nulo hasta el valor 105,02, mientras que la varianza dentro de las regiones(e
ij) pasa de 1012,74 a 505,15. En consecuencia, el porcentaje de varianza
explicada en ambos niveles por las variables del contexto socioeconómicoasciende al 45,94% y 50,12% respectivamente. Estas cifras muestran elimportante papel del ESCS en la explicación de las diferencias observadasentre centros y entre regiones. Dado que nuestro interés se centra en laexplicación del rendimiento a partir de factores moldeables de laspolíticas educativas, la cultura institucional de los centros y lasactuaciones del profesorado, es conveniente controlar el efecto delcontexto socioeconómico en modelos sucesivos.
Manteniendo el ESCS como parte fija, las variables relativas a lossistemas educativos regionales fueron añadidas al modelo 2. En estemodelo, el gasto en educación (p<,05), los ordenadores por grupo (p<,01)y la ratio alumnos-profesor (p<,001) presentan efectos significativos. Paraesta última variable, a cada incremento de una unidad en la ratiocorresponde un descenso de 9,08 puntos en la competencia científicalograda en los centros. La varianza residual inter-regiones es u
0j=26,53,
lo que representa una reducción del 85,83% de la varianza inicialconstatada con el modelo nulo. Es decir, la inclusión de las variablesregionales incrementa de manera considerable el porcentaje de varianzainter-regiones explicada con el modelo 1.
Finalmente, el modelo 3 añade las variables medidas a nivel de centros.En presencia de estas variables, el efecto asociado al gasto en educacióndeja de ser significativo (p>,05). Las variables que miden aspectos de lacultura institucional de los centros han resultado, en general, menosrelevantes que las referidas al desempeño docente. Entre las primeras,únicamente han resultado significativos los efectos de las conductasnegativas del alumnado (p<,001) y de la relación irrespetuosa del profesorcon los alumnos (p<,01), ambas vinculadas al clima escolar. El incrementounitario en estas variables supone una reducción de la competenciacientífica de 3,31 y 9,14 puntos respectivamente. Mayor importancia tienenlas prácticas docentes; un buen control de la clase (p<,001), el ejercicio deuna enseñanza dirigida por el profesor (p<,001) y la adaptación de laenseñanza a las necesidades del alumnado (p<,01) elevansignificativamente la competencia científica media en el centro.
Gil-Flores, J., García-Gómez, S. ImpORtAncIA DE lA ActUAcIón DOcEntE FREntE A lA pOlítIcA EDUcAtIvA REGIOnAl En lA EXplIcAcIón
DEl REnDImIEntO En pISA
Revista de Educación, 378. Octubre-Diciembre 2017, pp. 52-77Recibido: 17-03-2017 Aceptado: 02-06-2017
67

Concretamente, la competencia científica se eleva 15,87 puntos con elincremento unitario del índice de estilo docente directivo, 13,14 puntos conel mismo incremento en el control de la clase, y 10,16 puntos en el casodel índice de enseñanza adaptativa. En cambio, determinadas actuacionescomo la retroalimentación (p<,001) y el apoyo al alumno (p<,05), serelacionan negativamente con el nivel de competencia. Cada unidad de másen estas variables se corresponde con descensos en la competenciacientífica de 19,32 y 8,83 puntos respectivamente. La introducción devariables de centro en el modelo hace descender la varianza residual intra-regiones, que se sitúa en e
ij=392,63. Este valor representa una reducción
del 61,23% respecto al modelo nulo, mejorando el porcentaje logrado conlas variables de control (50,12% en el modelo 1).
El ajuste del modelo final construido puede valorarse a partir deldescenso en la desvianza (estadístico de ajuste utilizado para lacomparación de modelos lineales jerárquicos). La desvianza del modelofinal (-2LL=7838,31) es inferior a la registrada para los restantes modelos(comprendidas entre -2LL=9560,11 en el modelo nulo y -2LL=8861,93 enel modelo 2). La diferencia de desvianzas entre dos modelos se distribuyesegún chi-cuadrado con tantos grados de libertad como el número deparámetros de efectos fijos que añade un modelo en relación al otro. Enconsecuencia, el ajuste del modelo final ha mejorado significativamente(p<,001) respecto a todos los modelos previos.
Discusión y conclusiones
Nuestro estudio confirma la vinculación entre el rendimiento y el contextosocioeconómico y cultural. El índice ESCS ha resultado ser una variablede máxima relevancia en la explicación de los resultados obtenidos enPISA-2015, como ya se concluyó en trabajos anteriores que consideraronel ESCS a nivel regional (Elosua, 2013; Ferrer et ál., 2010; Gil, 2014) o decentros (Calero y Escardíbul, 2007). Ello corrobora la pertinencia delcontrol de esta variable en los modelos explicativos construidos para darrespuesta a los objetivos de este trabajo.
En respuesta al primer objetivo, constatamos la relación delrendimiento en PISA con variables relativas a las políticas educativasregionales. La literatura previa ha insistido en la financiación de laeducación como uno de los aspectos que explican las diferencias entre
Gil-Flores, J., García-Gómez, S. ImpORtAncIA DE lA ActUAcIón DOcEntE FREntE A lA pOlítIcA EDUcAtIvA REGIOnAl En lA EXplIcAcIón
DEl REnDImIEntO En pISA
Revista de Educación, 378. Octubre-Diciembre 2017, pp. 52-77Recibido: 17-03-2017 Aceptado: 02-06-2017
68

países o regiones (Duru-Bellat y Suchaut, 2005). Aunque en nuestroanálisis el gasto público por alumno ha sido también un factor relevante,más importante ha resultado el efecto de variables vinculadas a ladotación de recursos tanto personales como materiales. Es decir, frenteal montante presupuestario destinado a educación, mayor incidencia tieneel modo en que esa financiación se distribuye, generando mayoresrecursos en el sistema educativo. La relación entre rendimiento ydisponibilidad de recursos TIC, operativizada en este trabajo comonúmero de ordenadores por aula, es de signo negativo. Ello reflejaría lapoca eficacia de los esfuerzos de las Administraciones educativas poratajar los problemas de bajo rendimiento mediante políticas destinadas aincrementar este tipo de recursos en los centros educativos. Al revisar laspolíticas autonómicas para la introducción de las TIC, Meneses,Fàbregues, Jacovkis y Rodríguez-Gómez (2014) evidencian que elaumento de recursos TIC no siempre ha ido acompañado de la suficienteformación del profesorado para su utilización. Este hecho condiciona laeficacia de tales políticas, y debería ser considerado de manera especiala la hora de dotar de recursos TIC a los centros.
En nuestro análisis, la ratio alumnos-profesor ha sido la variable demayor peso en la explicación de las diferencias de rendimiento entreregiones, por lo que parece recomendable reducir el tamaño de losgrupos y priorizar la dotación de profesorado (Grau, Pina y Sáncho,2011). La escolarización en centros de titularidad pública o privada, unavez controlado el contexto socioeconómico, no explica las diferencias derendimiento entre las regiones. Este resultado es consistente con losobtenidos en estudios que también analizaron este factor comparando elrendimiento de las regiones españolas (Ferrer et ál., 2010) o el dediferentes países (De-Jorge y Santín, 2010).
Respondiendo al segundo objetivo del estudio, hemos analizado larelación entre variables de centro y el rendimiento. Constatamos unmayor efecto del desempeño del profesorado que de la culturainstitucional. Trabajos anteriores habían señalado la necesidad de centrarlos esfuerzos en la intervención con el alumnado, dada la poca relevanciade otras variables de centro en la explicación del rendimiento (Corderoet ál., 2009). En esa misma línea, Heargraves y Fullan (2014) destacan elpapel del centro y los procesos que tienen lugar en el aula de cara alograr resultados de aprendizaje satisfactorios. De acuerdo con nuestrosresultados, el clima de clase, el estilo docente directivo, el orden y control
Gil-Flores, J., García-Gómez, S. ImpORtAncIA DE lA ActUAcIón DOcEntE FREntE A lA pOlítIcA EDUcAtIvA REGIOnAl En lA EXplIcAcIón
DEl REnDImIEntO En pISA
Revista de Educación, 378. Octubre-Diciembre 2017, pp. 52-77Recibido: 17-03-2017 Aceptado: 02-06-2017
69

de la clase, el respeto profesor-alumno y la adaptación de la enseñanza alas necesidades del alumnado se relacionan significativamente con lacompetencia científica media en el centro. Resultados coincidentes conlos de trabajos anteriores donde se consideraron variables similares(Clavel et ál., 2016; Krüger et ál., 2015; López, Ascorra, Bilbao, Oyanedel,Moya y Morales, 2012). Los efectos negativos para la retroalimentación yel apoyo al alumnado podrían explicarse por una intensificación de estetipo de actuaciones en los centros con niveles más bajos de rendimiento.
Respecto a la cultura institucional, aspectos tales como el liderazgoeducativo, la implicación de las familias y las medidas en pro de lacalidad educativa no son relevantes para explicar las diferencias derendimiento. En cambio, sí resultan significativas las conductas negativasdel alumnado, en consonancia con los estudios que subrayan lasrepercusiones negativas de los comportamientos disruptivos entérminos de aprendizaje (Torregrosa, Inglés, García-Fernández, Gázquez,Díaz-Herrero y Bermejo, 2012). En este sentido sería convenientepromover medidas orientadas hacia el alumnado con mayor desafecciónescolar: potenciar la orientación personal y académica, impulsar lastutorías grupales, emplear metodologías de enseñanza participativas odiversificar actividades de ocio.
Como señalábamos al establecer el marco conceptual de este estudio,las variables del contexto socioeconómico no son moldeables por losagentes educativos. Sin embargo, existe un claro margen para laintervención si atendemos a las restantes. Nuestros hallazgos señalan alos centros educativos y a la actuación del profesorado como losprincipales ámbitos para la implementación de medidas dirigidas apotenciar los aprendizajes. Más allá de reclamar un incremento del gastoeducativo, la dotación de más recursos tecnológicos, la defensa de la redpública frente a la privada o viceversa, creemos necesario poner el puntode mira específicamente en los centros. Estos precisan contar con unascondiciones idóneas para desarrollar los procesos de enseñanza-aprendizaje, que pasan –entre otras medidas- por contar con una dotaciónde profesorado estable y ajustada al volumen de alumnado. El papelfundamental de la actuación docente en la explicación del rendimientoaconseja la adopción de medidas dirigidas a facilitar el trabajo delprofesorado en el aula, proporcionando los apoyos necesarios y elreconocimiento de su labor. La estabilidad de las plantillas docentes seríaotro reto en esta misma línea.
Gil-Flores, J., García-Gómez, S. ImpORtAncIA DE lA ActUAcIón DOcEntE FREntE A lA pOlítIcA EDUcAtIvA REGIOnAl En lA EXplIcAcIón
DEl REnDImIEntO En pISA
Revista de Educación, 378. Octubre-Diciembre 2017, pp. 52-77Recibido: 17-03-2017 Aceptado: 02-06-2017
70

Finalmente, destacamos algunas fortalezas y debilidades de nuestroestudio. Al tratarse de un análisis secundario sobre datos de PISA, hemoscontado con una amplia muestra de centros y con variables medidas demanera rigurosa. A diferencia de otros trabajos que se limitan a explotarlos datos disponibles en PISA, hemos integrado en el análisis informaciónprocedente de fuentes externas. La principal limitación es inherente a lametodología utilizada. Los modelos construidos identifican variablesrelevantes en la explicación del rendimiento, pero no permiten establecerrelaciones causa-efecto, que generarían mayor confianza en la eficacia deuna posible intervención sobre las variables independientes cuyos efectoshan resultado relevantes. Teniendo en cuenta que las diferencias derendimiento entre centros siguen siendo significativas en el modelo finalconstruido, futuros trabajos habrían de analizar la incorporación denuevas variables que reduzcan la varianza residual y continúen avanzandoen la explicación del rendimiento registrado en los centros educativosespañoles. Dando continuidad al presente estudio, una interesante líneade investigación podría centrarse en el papel que desempeña la actuacióndocente. En particular, se habría de profundizar en el papel de variablesno abordadas en evaluaciones internacionales, como es el caso de lacompetencia emocional del profesorado, en sintonía con los trabajos deKunter et ál. 2013). Desde el punto de vista metodológico, futurasinvestigaciones podrían abordarse bajo enfoques mixtos, facilitandomediante perspectivas cualitativas una mayor comprensión de lasdiferencias de rendimiento interregionales e intercentros constatadas enlos análisis cuantitativos realizados a partir de evaluaciones como PISA.
Referencias bibliográficas
Bietenbeck, J. (2014). Teaching practices and cognitive skills. Labour
Economics, vol. 30, C, 143-153.Blatchford, P., Bassett, P., & Brown, P. (2011). Examining the effect of
class size on classroom engagement and teacher-pupil interaction:Differences in relation to pupil prior attainment and primary vs.secondary schools. Learning and Instruction, nº 21, 715-730.
Gil-Flores, J., García-Gómez, S. ImpORtAncIA DE lA ActUAcIón DOcEntE FREntE A lA pOlítIcA EDUcAtIvA REGIOnAl En lA EXplIcAcIón
DEl REnDImIEntO En pISA
Revista de Educación, 378. Octubre-Diciembre 2017, pp. 52-77Recibido: 17-03-2017 Aceptado: 02-06-2017
71

Bolívar, A. (2006). Evaluación institucional: entre el rendimiento decuentas y la mejora interna. Gestão em Ação, vol. 9, nº 1, 7-36.
Bratti, M; Checci, D. y Filippin, I. (2007). Territorial Differences in ItalianStudents’ Mathematical Competencies: Evidence from PISA 2003.Discussion Paper No. 2603. Institute for the Study of Labor.ftp://repec.iza.org/SSRN/pdf/dp2603.pdf
Calero, J. y Escardíbul, J.O. (2007). Evaluación de servicios educativos: elrendimiento de centros públicos y privados en PISA 2003. Hacienda
Pública Española, vol. 183, nº 4, 33-66.Calero, J. y Escardíbul, J.O. (2014). Recursos escolares y resultados de la
educación. Madrid: Fundación Europea Sociedad y Educación.Calero, J., Choi, A., y Waisgrais, S. (2010). Determinantes del riesgo de
fracaso escolar en España: una aproximación a través de un análisislogístico multinivel aplicado a PISA-2006. Revista de Educación, nºextraordinario, 225-256.
Carabaña, J. (2008). Las diferencias entre países y regiones en las pruebas
PISA. Colegio Libre de Eméritos: Madrid.Chudgar, A. & Luschei, T.F. (2009). National income, income inequality,
and the importance of schools: A hierarchical cross-nationalcomparison. American Educational Research Journal, nº 46, 626–658.doi: 10.3102/0002831209340043
Claro, M. (2010). Impacto de las TIC en los aprendizajes de los estudiantes.
Estado del arte. Documento de trabajo. Santiago de Chile: ComisiónEconómica para América Latina y el Caribe (CEPAL).
Clavel, J., Crespo, F.J.G. & Méndez, I. (2016). Are teacher characteristics
and teaching practices associated with student performance? PolicyBrief, 11. Amsterdam (The Netherlands): IEA.
Collet-Sabé, J.; Besalú, X.; Feu, J. y Tort, A. (2014). Escuelas, familias yresultados académicos. Un nuevo modelo de análisis de las relacionesentre docentes y progenitores para el éxito del todo el alumnado.Profesorado. Revista de Currículum y Formación del Profesorado, vol.18, nº 2, 7-33.
Cordero, J.M., Crespo, E. y Pedraja, F. (2013). Rendimiento educativo ydeterminantes según PISA: una revisión de la literatura en España.Revista de Educación, nº 362, 273-297.
Coutinho, M. y Reis, H.J. (2012). What accounts for Portuguese regional
differences in students’ performance? Evidence from OECD PISA.Economic Bulletin. Banco de Portugal. Consultado enhttp://ideas.repec.org/a/ptu/bdpart/b201216.html
Gil-Flores, J., García-Gómez, S. ImpORtAncIA DE lA ActUAcIón DOcEntE FREntE A lA pOlítIcA EDUcAtIvA REGIOnAl En lA EXplIcAcIón
DEl REnDImIEntO En pISA
Revista de Educación, 378. Octubre-Diciembre 2017, pp. 52-77Recibido: 17-03-2017 Aceptado: 02-06-2017
72

Day, Ch., Gu, Q. & Sammons, P. (2016) The impact of leadership onstudent outcomes: how successful school leaders use transformationaland instructional strategies to make a difference. Educational
Administration Quarterly, vol. 52, nº 2, 221-258.De-Jorge, J. (2016). Factores explicativos del rendimiento escolar en
Latinoamérica con datos PISA 2009. Revista de Métodos Cuantitativos
para la Economía y la Empresa, nº 22, 216-229.De-Jorge, J. y Santín, D. (2010). Los Determinantes de la eficiencia
educativa en la Unión Europea. Hacienda Pública Española/Revista
de Economía Pública, 193, 131-156.Doyle, W. (1980). Classroom Management. Indianapolis: Kappa Delta Pi.Duncan, K.C., & Sandy, J. (2007). Explaining the performance gap
between public and private school students. Eastern Economic
Journal, vol. 33, nº2, 177-191.Duru-Bellat, M., & Suchaut, B. (2005). Organisation and context, efficiency
and equity of educational systems: What PISA tells us. European
Educational Research Journal, nº 4, 181-194. doi:10.2304/eerj.2005.4.3.3
Elosua, P. (2013). Diferencias individuales y autonómicas en el estatussocioeconómico y cultural como predictores en PISA 2009. Revista de
Educación, nº 361, 646-664.Ferrer, F. (2012). PISA: Aportaciones e incidencia sobre las políticas
educativas nacionales. Revista Española de Educación Comparada, nº19, 11-16.
Ferrer, F., Valiente, O. y Castel, J.L. (2010). Los resultados PISA-2006 desdela perspectiva de las desigualdades educativas: la comparación entreComunidades Autónomas en España. Revista Española de Pedagogía,nº 245, 23-48.
Foces, J.A. (2015). PISA, IDE e IPE: Evidencia empírica de lasdesigualdades educativas entre las regiones españolas. Revista de
Psicología y Educación, vol. 10, nº 1, 173-192.Freiberg, H.J. (2013). Classroom management and student achievement.
En J. Hattie y E.M. Anderman (Eds.), International guide to student
achievement (pp. 228-230). New York: Routledge. García, J.I. y Robles, J.A. (2013). Diferencias regionales en el rendimiento
educativo: ¿qué ha cambiado entre 2009 y 2012? En PISA 2012.
Informe español (pp. 98-125). Versión preliminar. Madrid: Ministeriode Educación, Cultura y Deporte.
Gil-Flores, J., García-Gómez, S. ImpORtAncIA DE lA ActUAcIón DOcEntE FREntE A lA pOlítIcA EDUcAtIvA REGIOnAl En lA EXplIcAcIón
DEl REnDImIEntO En pISA
Revista de Educación, 378. Octubre-Diciembre 2017, pp. 52-77Recibido: 17-03-2017 Aceptado: 02-06-2017
73

Gaskins, C.S., Herres, J., & Kobak, R. (2012). Classroom order and studentlearning in late elementary school: A multilevel transactional model ofachievement trajectories. Journal of Applied Developmental Psychology,nº 33, 227-235. doi: 10.1016/j.appdev.2012.06.002
Gil, J. (2014). Factores asociados a la brecha regional del rendimientoespañol en la evaluación PISA. Revista de Investigación Educativa, vol.52, nº 2, 393-410.
González, C., Caso, J., Díaz, K. y López, M. (2012). Rendimiento académicoy factores asociados. Aportaciones de algunas evaluaciones a granescala. Bordón, vol. 64, nº 2, 51-68.
Grau, R., Pina, T. y Sáncho, C. (2011). Posibles causas del fracaso escolary el retorno al sistema educativo. Hekademos. Revista Educativa
Digital, nº 9, 1-22. Gumus, S. y Atalmis, E.H. (2012). Achievement Gaps Between Different
School Types and Regions in Turkey: Have They Changed Over Time?Mevlana International Journal of Education, 2 (2), 50-66.
Haegeland, T., Raaum, O., & Salvanes, K.G. (2012). Pennies from heaven?Using exogenous tax variation to identify effects of school resourceson pupil achievement. Economics of Education Review, 31(5), 601-614.
Hallinger, P. & Heck, R.H. (2010) Collaborative leadership and schoolimprovement: understanding the impact on school capacity andstudent learning. School Leadership and Management, vol. 30, nº 20,95-110. doi: 10.1080/13632431003663214
Hargreaves, A. y Fullan, M. (2014). Capital profesional. Transformar la
enseñanza en cada escuela. Madrid: Ediciones Morata.Harks, B., Rakoczy, K., Hattie, J., Besser, M. & Klieme, E. (2014). The
effects of feedback on achievement, interest and self-evaluation: therole of feedback’s perceived usefulness, Educational Psychology, vol.34, nº 3, 269-290. doi: 10.1080/01443410.2013.785384
Instituto Nacional de Estadística (2016). Contabilidad regional de España.
Serie 2000-2015. Consultada en http://www.ine.es/jaxi/menu.do;jsessionid=038E2EF952AA657A136739FCA517F649.jaxi03?type=pcaxis&path=%2Ft35%2Fp010&file=inebase&L=0
Jennings, P.A. & Greenberg, M.T. (2009). The Prosocial Classroom: TeacherSocial and Emotional Competence in Relation to Student andClassroom Outcomes. Review of Educational Research, vol. 79, nº 1,491–525. doi: 10.3102/0034654308325693
Gil-Flores, J., García-Gómez, S. ImpORtAncIA DE lA ActUAcIón DOcEntE FREntE A lA pOlítIcA EDUcAtIvA REGIOnAl En lA EXplIcAcIón
DEl REnDImIEntO En pISA
Revista de Educación, 378. Octubre-Diciembre 2017, pp. 52-77Recibido: 17-03-2017 Aceptado: 02-06-2017
74

Krüger, N., Formichella, M.M. y Lekuona, A. (2015). Más allá de los logroscognitivos: la actitud hacia la escuela y sus determinantes en Españasegún PISA. Revista de Educación, nº 367, 10-35. doi: 10.4438/1988-592X-RE-2015-367-281
Kunter, M., Klusmann, U., Baumert, J., Richter, D., Voss, T. & Hachfeld, A.(2013). Professional Competence of Teachers: Effects on InstructionalQuality and Student Development. Journal of Educational Psychology,vol. 105, nº 3, 805–820. doi: 10.1037/a0032583
Lenkeit, J. & Caro, D.H. (2014). Performance status and change –measuring education system effectiveness with data from PISA2000–2009. Educational Research and Evaluation, vol. 20, nº 2, 146-174.
López, V., Ascorra, P., Bilbao, M.A., Oyanedel, J.C., Moya, I. y Morales, M.(2012). El Ambiente Escolar incide en los Resultados PISA 2009:
Resultados de un estudio de diseño mixto. Valparaíso (Chile): Fondode Investigación y Desarrollo En Educación. Ministerio de Educación.
López-González, L. y Oriol, X. (2016). La relación entre competenciaemocional, clima de aula y rendimiento académico en estudiantes desecundaria. Cultura y Educación, vol. 28, nº 1, 142-156.
Luzón, A. y Torres, M. (2013). La presencia de PISA en la literaturacientífica y su tratamiento en la prensa diaria internacional.Profesorado. Revista de Currículum y Formación del Profesorado, vol.17, nº 2, 193-224.
Mancebón, M.J. y Pérez, D. (2010). Una valoración del grado desegregación socioeconómica existente en el sistema educativo español.Un análisis por comunidades autónomas a partir de PISA 2006.Regional and Sectoral Economic Studies, vol. 10, nº 3, 129-148.
MECD (2016). Sistema Estatal de Indicadores de la Educación 2016.Consultado en http://www.mecd.gob.es/inee/sistema-indicadores.html
MECD (2017). Las cifras de la educación en España. Curso 2014-2015
(Edición 2017). Consultado en http://www.mecd.gob.es/servicios-al-ciudadano-mecd/estadisticas/educacion/indicadores-publicaciones-sintesis/cifras-educacion-espana/2014-15.html
Mediavilla, M. y Escardíbul, J.O. (2015). ¿Son las TIC un factor clave en laadquisición de competencias? Un análisis con evaluaciones porordenador. Hacienda Pública Española, nº 212, 67-96.
Gil-Flores, J., García-Gómez, S. ImpORtAncIA DE lA ActUAcIón DOcEntE FREntE A lA pOlítIcA EDUcAtIvA REGIOnAl En lA EXplIcAcIón
DEl REnDImIEntO En pISA
Revista de Educación, 378. Octubre-Diciembre 2017, pp. 52-77Recibido: 17-03-2017 Aceptado: 02-06-2017
75

Meneses, J., Fàbregues, S., Jacovkis, J., y Rodríguez-Gómez, D. (2014). Laintroducción de las TIC en el sistema educativo español (2000-2010):un análisis comparado de las políticas autonómicas desde unaperspectiva multinivel. Estudios Sobre Educación, vol. 27, 63-90.
Murillo, F.J. & Román, M. (2011). School Infrastructure and Resources DoMatter: Analysis of the Incidence of School Resources on thePerformance of Latin American Students. School Effectiveness and
School Improvement, vol. 22, nº 1, 29-50.Murillo, F.J. y Hernández-Castilla, R. (2015). Liderazgo para el aprendizaje:
¿Qué tareas de los directores y directoras escolares son las que másinciden en el aprendizaje de los estudiantes? RELIEVE, vol. 21, nº 1,art. 1. doi: 10.7203/relieve.21.1.5015
Nieto, S. y Recamán, A. (2012). Hacia una mayor comprensión global delrendimiento académico a través de las pruebas PISA: contraste de treshipótesis a partir de unos datos empíricos. Educación XX1, vol. 15, nº1, 157-178.
OECD (2012). Public and Private Schools: How Management and
Funding Relate to their Socio-economic Profile. OECD Publishing. doi:10.1787/9789264175006-en
OECD (2017). PISA 2015 Technical report. Consultado enhttp://www.oecd.org/pisa/data/2015-technical-report/
Pedró, F. (2012). Deconstruyendo los puentes de PISA: del análisis deresultados a la prescripción política. Revista Española de Educación
Comparada, nº 19, 139-172.Reyes, M.R., Brackett, M.A., Rivers, S.E., White, M.,
& Salovey, P. (2012). Classroom emotional climate, studentengagement, and academic achievement. Journal of Educational
Psychology, nº 104, 700–712. doi:10.1037/a0027268Spiezia, V. (2010). Does computer use increase educational achievements?
Student-level evidence from PISA. OECD Journal: Economic Studies,v. 2010.
Torregrosa, M.S., Inglés, C.J., García-Fernández, J.M., Gázquez, J.J., Díaz-Herrero, A. y Bermejo, R.M. (2012). Conducta agresiva entre iguales yrendimiento académico en adolescentes españoles. Behavioral
Psychology / Psicología Conductual, vol. 20, nº 2, 2012, 263-280.Van Damme, J., Liu, H., Vanhee, L., & Pustjens, H. (2010). Longitudinal
studies at the country level as a new approach to educationaleffectiveness: Explaining change in reading achievement (PIRLS) by
Gil-Flores, J., García-Gómez, S. ImpORtAncIA DE lA ActUAcIón DOcEntE FREntE A lA pOlítIcA EDUcAtIvA REGIOnAl En lA EXplIcAcIón
DEl REnDImIEntO En pISA
Revista de Educación, 378. Octubre-Diciembre 2017, pp. 52-77Recibido: 17-03-2017 Aceptado: 02-06-2017
76

change in age, socio-economic status and class size. Effective
Education, vol.2, 53–84. doi: 10.1080/19415531003616888Van Ewijk, R. & Sleegers, P. (2010). The effect of peer socioeconomic
status on student achievement: a meta-analysis. Educational Research
Review, vol. 5, nº 2, 134-150.Wu, M. (2005). The role of plausible values in large-scale surveys. Studies
in Educational Evaluation, vol. 31, nº 2-3, 114-128.
Información de contacto: Javier Gil Flores. Universidad de Sevilla, Facultad deCiencias de la Educación. Departamento de Métodos de Investigación yDiagnóstico en Educación. Calle Pirotecnia, s/n, 41013, Sevilla. E-mail:[email protected]
Gil-Flores, J., García-Gómez, S. ImpORtAncIA DE lA ActUAcIón DOcEntE FREntE A lA pOlítIcA EDUcAtIvA REGIOnAl En lA EXplIcAcIón
DEl REnDImIEntO En pISA
Revista de Educación, 378. Octubre-Diciembre 2017, pp. 52-77Recibido: 17-03-2017 Aceptado: 02-06-2017
77

The importance of teaching practices in relation to regionaleducational policies in explaining PISA achievement
Importancia de la actuación docente frente a la políticaeducativa regional en la explicación del rendimiento en PISA
DOI: 10.4438/1988-592X-RE-2017-378-361
Javier Gil-FloresSoledad García-GómezUniversidad de Sevilla
AbstractAmong the variables that explain schools and students' performances as
measured in PISA stand out those that provide information about the social,economic and cultural context. These factors are non-malleable and are not withinthe educational agents' reach. So that, once the effect of the socio-economiccontext on assessment was controlled, we focused the study on the role thatvariables related to regional educational policy, to schools' institutional cultureand to the teaching practices play in schools performance in PISA. For thispurpose we carried out a secondary analysis with data from 976 secondaryschools distributed throughout the 17 regions of Spain participating in the PISA-2015 assessment cycle, and also with data about public/private enrolment,educational spending and available resources of the regional systems. We havebuilt successive multilevel regression models -through a hierarchical linearanalysis- in order to know the role of schools and educational policy of all theSpanish regions in the explanation of schools' scientific competence. The findingsfocused on educational policy variables show that the student-teacher ratio andthe quantity of computers per classroom do matter regarding achievement. Aboutthe influence on the performance of schools’ variables, we found that the schoolclimate and the teaching practices have significant effects on outcomes. Students’disruptive behaviour and teachers’ disrespectful interaction with pupils are bothvariables related to a lower level of competence. Nevertheless, efficacy in the
Revista de Educación, 378. October-December 2017, pp. 50-74
Received: 17-03-2017 Accepted: 02-06-201750

classroom management, a direct teaching approach and the adaptation of theteaching activities to students’ needs are variables related to a higher level ofcompetence. Students’ support and feedback exists when a low-level of scientificcompetence is found. Finally, some proposals have emerged from these findingsin order to do better in schools and to redirect educational policy.
Keywords: secondary education, achievement, educational policy, schools,teaching practices.
ResumenEntre los factores que explican el rendimiento en PISA, destaca el papel de
las variables que informan sobre el contexto social, económico y cultural. Estetipo de variables no son directamente moldeables, y escapan a las posibilidadesde intervención de los agentes educativos. Controlado el efecto del contextosocioeconómico, en este trabajo consideramos variables relativas a las políticaseducativas regionales, la cultura institucional de los centros y el desempeñodocente, con el fin de analizar su relación con los resultados obtenidos en PISA.Para ello, llevamos a cabo un análisis secundario a partir de datoscorrespondientes a 976 centros educativos de las 17 regiones españolasparticipantes en PISA-2015, junto con datos relativos a escolarización,financiación y recursos disponibles a nivel autonómico. Mediante análisis linealjerárquico, construimos sucesivos modelos de regresión multinivel para valorarel papel de los centros y las políticas regionales en la explicación de lacompetencia científica alcanzada en los centros. Los resultados obtenidos, en loque respecta a las políticas educativas, destacan el efecto positivo de la ratioalumnos-profesor y el negativo del número de ordenadores por aula, medidos anivel regional. En cuanto al papel de los centros, se han encontrado efectossignificativos para el clima escolar y la actuación del profesorado. En particular,las conductas negativas del alumnado y el trato irrespetuoso al alumno sevinculan a menores niveles de competencia. En cambio, un buen control de laclase, el ejercicio de una enseñanza dirigida por el profesor o la adaptación dela enseñanza a las necesidades del alumnado se asocian a una mayorcompetencia. Se registran niveles bajos de competencia científica cuando estánpresentes la retroalimentación y el apoyo al alumno. A partir de estos hallazgosse formulan propuestas orientadas a la intervención en los centros y a la revisiónde las políticas educativas.
Palabras clave: educación secundaria, rendimiento, política educativa, centroseducativos, actuaciones docentes.
Gil-Flores, J., García-Gómez, S. ThE ImpORTAncE OF TEAchInG pRAcTIcES In RElATIOn TO REGIOnAl EDUcATIOnAl pOlIcIES In EXplAInInG pISA AchIEvEmEnT
Revista de Educación, 378. October-December 2017, pp. 50-74
Received: 17-03-2017 Accepted: 02-06-201751
Introducción
During the last decades international performance evaluations have been
carried out on a large scale with the participation of a growing number
of countries. In particular, the publishing of three-year reports
corresponding to the PISA report, which has now had six editions, has
generated numerous scientific articles at a national and international level
(Luzón and Torres, 2013). The relation between the results of these
evaluations and specific characteristics of educational systems has been
analysed in both the pedagogical and the economic fields (Cordero,
Crespo and Pedraja, 2013; González, Caso, Díaz and López, 2012; Nieto
and Recamán, 2012), and there have been reflections on its implications
in the area of educational policies (Ferrer, 2012; Pedró, 2012). The data
of the successive editions of PISA have enabled comparative studies to
be done which have contributed an evolutionary view of students’
achievements and of the educational systems themselves (Carabaña, 2008;
De-Jorge, 2016; Lenkeit and Caro, 2014). Moreover, in some countries
studies have been carried out which investigate the inter-regional
differences, trying to explain those differences observed from the regions’
own features. In the case of Italy, Bratti, Checchi and Filippin (2007)
found that the main inter-regional differences lie in their resources and
in the characteristics of the labour markets. On the other hand, when
analysing the differences between Portuguese regions, Coutinho and Reis
(2012) found a limited role for the purely regional factors, conceding a
greater relevance to the individual, family and school characteristics.
Spain has had disaggregated data at a regional level in various editions.
Works have been done from them to explain the differences in the
performance of Spanish students, analysing aspects of each region’s own
educational policies (Foces, 2015; García and Robles, 2013; Gil, 2014). In
PISA 2015 we had results for the first time for all the Spanish autonomous
regions. In general terms, the studies carried out have a positive
correlation between the students’ achievements and the variables which
reflect the social and economic development of the different countries or
regions, such as, for example, the socio-economic and cultural level, the
GDP per capita, the unemployment rate and the poverty risk rate (Ferrer,
Valiente and Castel, 2010; Mancebón and Pérez, 2010). Measured by each
student or aggregated at the level of centres or regions, the socio-
economic and cultural status (ESCS) constructed in PISA is the variable
Gil-Flores, J., García-Gómez, S. ThE ImpORTAncE OF TEAchInG pRAcTIcES In RElATIOn TO REGIOnAl EDUcATIOnAl pOlIcIES In EXplAInInG pISA AchIEvEmEnT
Revista de Educación, 378. October-December 2017, pp. 50-74
Received: 17-03-2017 Accepted: 02-06-201752

which best explains the differences of performance (Calero and
Escardíbul, 2007; Elosua, 2013). Given the nature of this kind of variables,
the educational agents lack a margin of action concerning them. For this
reason, our interest is centred on analysing the role of regional
educational policies and of school institutions in explaining the
differences of achievement, areas where intervention is possible, with the
aim of achieving improvements in students’ learning.
In relation with educational policies, the scientific literature reflects
the role of specific variables in explaining achievement, such as for
example: educational expenditure (Calero and Escardíbul, 2014),
scholarisation in state or private centres (Duncan and Sandy, 2007),
resources available in the centres (De-Jorge, 2016), or the quantity and
use of computer resources (Spiezia, 2010). In general, it is assumed that
greater financing is translated into more possibilities of access to
scholarisation and more personal and/or material resources. There is thus
a link between academic achievement and the investments which are
carried out in the educational system. Calero and Escardíbul (2014)
analysed the effects of educational expenditure and found that this
relation is weakened from certain levels of expenditure. As to the public
financing of privately-owned centres, those countries which economically
support private centres tend to achieve better learning results (OECD,
2012). Nevertheless, the differences of achievement in PISA in favour of
private centres have been attributed to the effect of unequal socio-
economic levels (Calero and Escardíbul, 2007; Ferrer et al., 2010). Closely
related with financing, the connection between the availability of material
resources and educational performance has been explored, finding a
positive relation (Haegeland, Raaum and Salvanes, 2012; Murillo and
Román, 2011). Regarding ICT resources, the positive effect of the use of
computers on educational performance has not been clearly demonstrated
(Claro, 2010; Mediavilla and Escardíbul, 2015). The effects on learning
for variables such as the size of the classes and the student-teacher ratio
have also been explored. Blatchford, Bassett and Brown (2011) conclude
that smaller groups facilitate learning for all the students. However, at
the educational systems level, Van Damme, Liu, Vanhee and Pustjens
(2010) noted that the modification of the size of the classes hardly
explains the changes observed in the average marks obtained within a
country in successive editions of large scale evaluations.
Gil-Flores, J., García-Gómez, S. ThE ImpORTAncE OF TEAchInG pRAcTIcES In RElATIOn TO REGIOnAl EDUcATIOnAl pOlIcIES In EXplAInInG pISA AchIEvEmEnT
Revista de Educación, 378. October-December 2017, pp. 50-74
Received: 17-03-2017 Accepted: 02-06-201753

Regarding the role of the centres in explaining the students’achievement, research has centred on different aspects of institutionalculture. This can facilitate or hinder innovation and improvementprocesses, impacting on the efficiency of the teaching-learning processesin classrooms. A key element of school culture and organisation are themanagement teams, whose pedagogical leadership must influence theactions of the teachers for motivation, implication and the students’academic achievements (Day, Gu and Sammons, 2016; Hallinger andHeck, 2010; Murillo and Hernández-Castilla, 2015). This leadership is alsoreflected in the concern for quality. In this vein, evaluating practices atthe heart of educational institutions are evidence of the interest inimproving academic results and involve both the management and theteaching teams (Bolívar, 2006). Another variable with a clear andrecognised influence on achievement is the involvement of the families.In general, it is sustained that their participation has positive effects onacademic achievements (Collet-Sabé, Besalú, Feu and Tort, 2014).
Along with institutional culture, teaching action in the classrooms mustbe considered. The performance of the teachers plays a relevant role inexplaining the students’ learning (Clavel, Crespo and Méndez, 2016;Freiberg, 2013; Stronge, Ward and Grant, 2011). The by now classic worksof authors such as Doyle (1980) placed an emphasis on the teachers andtheir management of the teaching-learning processes in classrooms,highlighting the importance of establishing an appropriate order, climateand atmosphere in classrooms. Gaskins, Herres and Kobak (2012) andKrüger, Formichella and Lecuona (2015) uphold that the sole variable atthe school level with a significant influence on achievement is theclassroom climate. There has also been an exploration of the effects onlearning of inclusive educational practices or innovative methodologies.According to Bietenbeck (2014), the approaches of more active teachinghave more positive effects than traditional ones, highlighting the value offollowing up the students’ tasks. Both the follow-up and the feedbackhave positive consequences for achievement (Harks, Rakoczy, Hattie,Besser and Klieme, 2014). Especially relevant are the personal relationand the emotional aspects (López-González and Oriol, 2016; Reyes,Brackett, Rivers, White and Salovey, 2012), the role of the social andemotional competence of the teachers being crucial to regulate therelations with the students and favour their achievement ( Jennings andGreenberg, 2009; Kunter, Klusmann, Baumert, Richter, Voss and Hachfeld,2013).
Gil-Flores, J., García-Gómez, S. ThE ImpORTAncE OF TEAchInG pRAcTIcES In RElATIOn TO REGIOnAl EDUcATIOnAl pOlIcIES In EXplAInInG pISA AchIEvEmEnT
Revista de Educación, 378. October-December 2017, pp. 50-74
Received: 17-03-2017 Accepted: 02-06-201754
In the light of the aforementioned, the conceptual framework worked
out for this study considers that achievement can be explained by the
socio-economic and cultural context and also by the characteristics of
educational policies, by the institutional culture of the centres and the
teaching performance (see Graph I). Given the difficulties to intervene
concerning the variables related to the socio-economic and cultural
context, the explanatory models of achievement which value the efficacy
of the educational systems or of the schools tend to control them
(Chudgar and Luschei, 2009). The broken lines in Graph 1 denote the
control of the socio-economic variables, specifically the socio-economic
and cultural index measured in PISA, and the regional gross domestic
product (GDP) per capita. The solid lines represent the relations which
are the aim of this study, linked to the performance variables in each of
the sections considered. These variables come from the PISA database
and from other statistical sources consulted.
GRAPH I. conceptual framework of the research.
Gil-Flores, J., García-Gómez, S. ThE ImpORTAncE OF TEAchInG pRAcTIcES In RElATIOn TO REGIOnAl EDUcATIOnAl pOlIcIES In EXplAInInG pISA AchIEvEmEnT
Revista de Educación, 378. October-December 2017, pp. 50-74
Received: 17-03-2017 Accepted: 02-06-201755

Setting out from this conceptual framework, the aim is to know the
role which educational policies and school centres play in explaining
achievement. The identification of factors which explicate the
achievement differences observed is the basis upon which to found
recommendations for teaching action, the management of the centres
and/or regional policies. Specifically, we mean to reply to the following
questions:
n Controlling the effect of the socio-economic context, is there a
relation between achievement in PISA and regional educational
policies in matters of scholarisation, financing and resources?
n Controlling the effect of the socio-economic context and regional
educational policies, is achievement related with the institutional
culture of the centres and the teaching action carried out in the
classrooms?
Method
We have developed a secondary analysis of the data related to 976
Spanish educational centres participating in PISA-2015. The data for the
centres analysed come from context questionnaires answered by their
managers and by 32,330 15-year-old students (50.6% boys, 49.4% girls)
who studied there. We also consider the data referring to the economic
context and the regional educational systems, extracted from different
statistics reports (Instituto Nacional de Estadística, 2016; MECD, 2016,
2017).
Variables
a) Dependent variable
We consider as a dependent variable the score in scientific competence,
an area the last PISA evaluation goes deeply into. This competence is
measured in PISA via standardised tests, generating individual scores
through models of Item Response Theory (IRT). These scores are
expressed in a scale of standard deviation 100 and mean 500, this value
Gil-Flores, J., García-Gómez, S. ThE ImpORTAncE OF TEAchInG pRAcTIcES In RElATIOn TO REGIOnAl EDUcATIOnAl pOlIcIES In EXplAInInG pISA AchIEvEmEnT
Revista de Educación, 378. October-December 2017, pp. 50-74
Received: 17-03-2017 Accepted: 02-06-201756

coinciding with the average achievement for all the students of OECD
countries in the first edition of PISA. As is usual in large-scale evaluations,
the method of plausible values is used (Wu, 2005) to determine the level
of competence attributed to a student. We have taken the 10 plausible
values extracted in PISA for each individual as a starting-out point in the
estimation of the average achievement in sciences attained by each
educational centre. To obtain the value attributed to the centre, we use
the IDB Analyzer programme provided by the Data Processing and
Research Center of the IEA (International Association for the Evaluation
of Educational Achievement). This software is specifically aimed at the
statistical analysis of data from large-scale international studies. It enables
work with plausible values, taking into account the sample weights
corresponding to each individual and applying the method of balanced
repeated replications.
b) Centre-level explanatory variables
Among the centre-level explanatory variables we include some indices
available in the PISA-2015 database, derived from the context
questionnaires answered by the students or the management. These
indices summarise the answers to sets of items using diverse procedures.
The details on the building of these indices, as well as the items used,
can be consulted in the technical report worked out for PISA-2015
(OECD, 2017). Other variables have been constructed specifically for this
analysis, as we will point out when presenting them.
The first variable is the socio-economic and cultural index (ESCS). This
is an index built for each student from the parents’ studies, their
professional jobs and the possessions in the home (number of books,
computer, Internet connection, etc.). The value attributed to the centre
has been obtained averaging those corresponding to each of its students.
Along with this index, we have used others which are the variables
related with the centres’ institutional culture:
n Educational leadership. This is the LEAD index contained in the
PISA database. It informs about the strength of leadership carried
out by the centre’s management. It is constructed from the answers
to 13 items. The managers indicated the frequency with which
Gil-Flores, J., García-Gómez, S. ThE ImpORTAncE OF TEAchInG pRAcTIcES In RElATIOn TO REGIOnAl EDUcATIOnAl pOlIcIES In EXplAInInG pISA AchIEvEmEnT
Revista de Educación, 378. October-December 2017, pp. 50-74
Received: 17-03-2017 Accepted: 02-06-201757
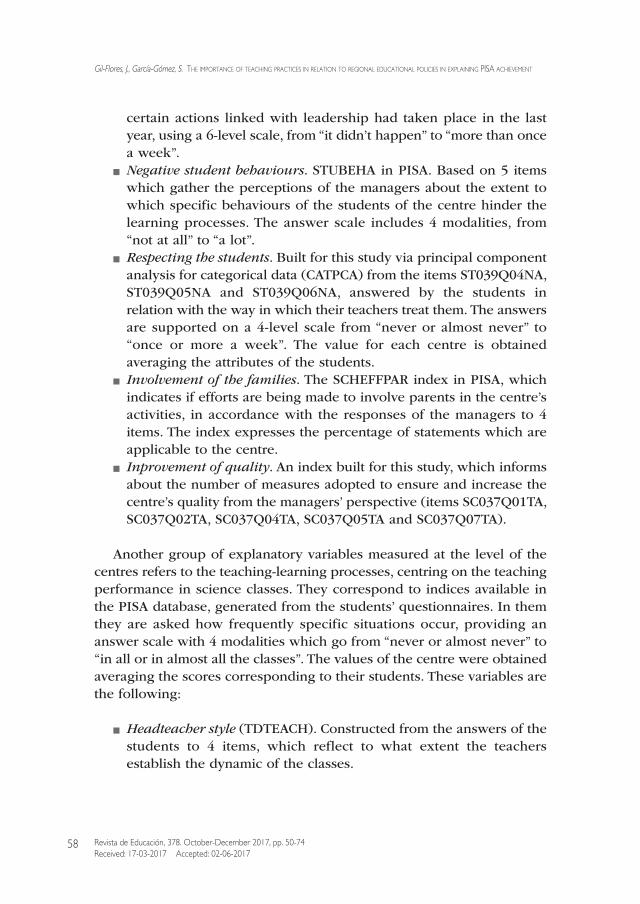
certain actions linked with leadership had taken place in the last
year, using a 6-level scale, from “it didn’t happen” to “more than once
a week”. n Negative student behaviours. STUBEHA in PISA. Based on 5 items
which gather the perceptions of the managers about the extent to
which specific behaviours of the students of the centre hinder the
learning processes. The answer scale includes 4 modalities, from
“not at all” to “a lot”. n Respecting the students. Built for this study via principal component
analysis for categorical data (CATPCA) from the items ST039Q04NA,
ST039Q05NA and ST039Q06NA, answered by the students in
relation with the way in which their teachers treat them. The answers
are supported on a 4-level scale from “never or almost never” to
“once or more a week”. The value for each centre is obtained
averaging the attributes of the students.n Involvement of the families. The SCHEFFPAR index in PISA, which
indicates if efforts are being made to involve parents in the centre’s
activities, in accordance with the responses of the managers to 4
items. The index expresses the percentage of statements which are
applicable to the centre. n Inprovement of quality. An index built for this study, which informs
about the number of measures adopted to ensure and increase the
centre’s quality from the managers’ perspective (items SC037Q01TA,
SC037Q02TA, SC037Q04TA, SC037Q05TA and SC037Q07TA).
Another group of explanatory variables measured at the level of the
centres refers to the teaching-learning processes, centring on the teaching
performance in science classes. They correspond to indices available in
the PISA database, generated from the students’ questionnaires. In them
they are asked how frequently specific situations occur, providing an
answer scale with 4 modalities which go from “never or almost never” to
“in all or in almost all the classes”. The values of the centre were obtained
averaging the scores corresponding to their students. These variables are
the following:
n Headteacher style (TDTEACH). Constructed from the answers of the
students to 4 items, which reflect to what extent the teachers
establish the dynamic of the classes.
Gil-Flores, J., García-Gómez, S. ThE ImpORTAncE OF TEAchInG pRAcTIcES In RElATIOn TO REGIOnAl EDUcATIOnAl pOlIcIES In EXplAInInG pISA AchIEvEmEnT
Revista de Educación, 378. October-December 2017, pp. 50-74
Received: 17-03-2017 Accepted: 02-06-201758

n Research methodology (IBTEACH). Supported by 9 items which refer
to a research-based teaching style.n Adaptation of the teaching (ADINST). Generated from 3 items which
reflect how the teacher adapts the teaching processes to the
students’ characteristics. n Feedback to the students (PERFEED). Based on 5 items referring to
the information which they receive about their learning.n Support of the students (TEACHSUP). Worked out from 5 items
relative to the support which the teacher gives to facilitate learning.
We have considered an additional variable on the teaching developed
in the centre which we have built via CATPCA analysis from the answers
to the students’ questionnaire:
n Class control. Report on the way in which the teachers manage the
class, creating appropriate conditions for learning. To construct it
we use 5 items (ST097Q01TA to ST097Q05TA) which reflect
negative situations in the classrooms. The students express the
frequency with which these situations occur, in accordance with a
scale of 4 levels which go from “in all the classes” to “never or
almost never”.
All these indices are expressed as standardised scores, with the
exception of the index involvement of the families, which is expressed as
a percentage, and the index improvement of quality, which has values
between 0 and 5. The descriptive statistics for the set of variables in the
centres of the sample are presented in Table I.
Gil-Flores, J., García-Gómez, S. ThE ImpORTAncE OF TEAchInG pRAcTIcES In RElATIOn TO REGIOnAl EDUcATIOnAl pOlIcIES In EXplAInInG pISA AchIEvEmEnT
Revista de Educación, 378. October-December 2017, pp. 50-74
Received: 17-03-2017 Accepted: 02-06-201759

TABLE I. Descriptive statistics for the variables measured at the level of centres.
c) Explanatory variables at the regional level
The independent variables measured at the regional level correspond to
information external to the PISA evaluation. They are the following:
n GDP per capita. Regional gross domestic product per inhabitant,
expressed in euros.
n Students in public centres. Percentage of Compulsory Secondary
Education (CSE) students enrolled in school in publicly-owned
centres.
n Spending on education per student. Indicator of financing of
education in the regional educational systems, defined as the public
spending per student in non-university teaching.
n Size of groups. Average number of students per educational group
in CSE.
n Student-teacher ratio. Average number of students per teacher in
non-university teaching.
Gil-Flores, J., García-Gómez, S. ThE ImpORTAncE OF TEAchInG pRAcTIcES In RElATIOn TO REGIOnAl EDUcATIOnAl pOlIcIES In EXplAInInG pISA AchIEvEmEnT
Revista de Educación, 378. October-December 2017, pp. 50-74
Received: 17-03-2017 Accepted: 02-06-201760
Variables MeanStandard
deviation
ESCS -.50 .62
Educational leadership -.22 .83
Negative behaviours of the students -.19 1.08
Respect of the students .00 .26
Involvement of the families 91.77 15.01
Improvement of quality 4.19 1.02
Headteacher style .02 .30
Rsearch methodology -.31 .37
Adaptation to the teaching .14 .33
Feedback to the studensts .11 .34
Support of the students .04 .37
Class control .00 .37

n Computers per group. Number of computers per unit or group in
primary and secondary education centres, allocated to teaching with
students.
The GDP per capita data correspond to 2015 and have been obtained
from the Spanish Regional Accounting (Instituto Nacional de Estadística,
2016). The data of the students in public centres, spending on education
per student, student-teacher ratio and computers per group come from
Figures in education in Spain (MECD, 2017) and correspond to the
academic year 2014-2015. The size of the groups is extracted from the
State System of Education Indicators (MECD, 2016). The values for these
variables in the 17 autonomous regions are shown in Table II.
TABLE II. Values for variables measured at the regional level
Gil-Flores, J., García-Gómez, S. ThE ImpORTAncE OF TEAchInG pRAcTIcES In RElATIOn TO REGIOnAl EDUcATIOnAl pOlIcIES In EXplAInInG pISA AchIEvEmEnT
Revista de Educación, 378. October-December 2017, pp. 50-74
Received: 17-03-2017 Accepted: 02-06-201761
Autonomous RegionGDP per
capita(€)
Students in
publiccentres (%)
Expenditureon education
per student(€)
Size of the
groups (nºstudents)
Student-
teacher ratio
Computers
per group
Andalusía 17263 75.2 4042 26.1 13.1 9.3
Aragón 25552 65.8 4707 23.6 12.1 6.7
Asturias 20675 66.3 5530 22.5 10.9 7.7
Balearic Islands 24394 60.8 4808 25.8 11.7 10.9
Canary Islands 19900 75.8 4539 24.3 13.7 5.1
Cantabria 20847 66.3 5623 23.7 11.2 6.4
Castile-La Mancha 18354 80.1 4295 24.5 12.4 6.1
Castile & León 21922 64.0 5109 23.4 11.3 4.8
Catalonia 27663 62.0 4198 27.8 13.2 5.8
Extremadura 16166 76.7 5276 21.4 11.3 9.5
Galicia 20431 70.3 5404 20.4 10.5 7.2
La Rioja 25507 61.4 4827 23.5 12.3 6.0
Madrid 31812 52.0 3857 26.4 14.1 3.7
Murcia 18929 69.8 4352 24.9 12.5 3.3
Navarre 28682 60.2 5692 24.1 11.3 3.9
Basque Country 30459 46.4 6448 21.6 12.1 11.5
Valencian Com. 20586 63.8 4449 25.7 12.9 3.9

Data analysis
We have variables measured by the centres and variables which
characterise the regional educational systems. Given that the centres are
within regions, certain characteristics of the centres belonging to the same
region are not independent of each other, as they are conditioned by the
same educational policy developed in the regional context. Consequently,
we turn to multilevel models, considering in the same analysis variables
measured at the level of centres (first level) and regions (second level).
In response to the questions proposed in this work, we have developed
a modelling process verifying successive models of multilevel regression.
Firstly, we verify the null or unconditional model (Model 0) to check the
existence of significant differences between regions and value belonging
to the multilevel approach. The following models successively add
variables related to the socio-economic context (Model 1), to the regional
educational policies (Model 2), as well as to the institutional culture of
the centres and to the performance of the teachers in the classrooms
(Model 3).
The null multilevel model includes a sole factor of random effects. It
is formulated according to the formula (1):
(1)
where Yij
is the average score in scientific competence for centre i in
region j. This score is the result of adding the global mean of competence
in the set of centres (g00
), the random variation of the regional averages
with respect to the global average (u0j), and the random variation of the
centres with respect to the average of their region (eij).
From this null model we have constructed the remaining models. We
have incorporated new variables in them, maintaining those which have
negative effects on the immediately preceding model. The final model,
therefore, includes explanatory variables at the level of centres and
regions. M and N being the number of variables in both levels, this model
is expressed by equation (2):
(2)
Gil-Flores, J., García-Gómez, S. ThE ImpORTAncE OF TEAchInG pRAcTIcES In RElATIOn TO REGIOnAl EDUcATIOnAl pOlIcIES In EXplAInInG pISA AchIEvEmEnT
Revista de Educación, 378. October-December 2017, pp. 50-74
Received: 17-03-2017 Accepted: 02-06-201762

Gil-Flores, J., García-Gómez, S. ThE ImpORTAncE OF TEAchInG pRAcTIcES In RElATIOn TO REGIOnAl EDUcATIOnAl pOlIcIES In EXplAInInG pISA AchIEvEmEnT
Revista de Educación, 378. October-December 2017, pp. 50-74
Received: 17-03-2017 Accepted: 02-06-201763
Where the fixed part of the model is made up of g00
(effect of the
global mean), gp0
(main effects for each of the centre’s variables) and g0q
(main effects for the regional variables). In this model, Xpij
represents the
value of the pth variable in the centre i of region j, while Zqj
is the value
of the qth variable in region j. In the models built, we assume an
independence between the errors u0j
and eij, whose distributions tend to
normal models N (0, s2u0) and N (0, s2
e).
Results
In Table III we show the results of the multilevel regression. We set out
from the null model of a factor of random effects, taking the region as
the factor and without including any explanatory variable. The variation
of the scores in scientific competence between regions (u0j=187.32;
p<0.001) and the variation between centres within each region
(eij=1012.74; p<0.01) are significant. Taking as a reference the total of the
variation observed in the performance of the Spanish centres in sciences
(eij+u
0j=1200.06), the differences between centres within the same region
(eij) are 84.39%, while 15.61% correspond to the differences registered
between regional educational systems (u0j). The existence of a significant
variance within the regions and between regions recommends pursuing
the multilevel model, including variables in the analysis which contribute
to explaining the variability observed in both levels.

TABLE III. parameters and typical errors for the multilevel regression models concerning
scientific competences measured in the centres
* p< .05: ** p<.01; ***p<.00
We construct Model 1 with the aim of controlling the GDP variables
and the socio-economic and cultural level, measured respectively for the
regions and the centres. The results obtained show significant effects of
the ESCS (p<.001). In the presence of this, the effect of the regional GDP
per capita is not significant, so this variable has been removed in later
models. In accordance with the estimated effect for the ESCS, when its
Gil-Flores, J., García-Gómez, S. ThE ImpORTAncE OF TEAchInG pRAcTIcES In RElATIOn TO REGIOnAl EDUcATIOnAl pOlIcIES In EXplAInInG pISA AchIEvEmEnT
Revista de Educación, 378. October-December 2017, pp. 50-74
Received: 17-03-2017 Accepted: 02-06-201764
Model 0 Model 1 Model 2 Model 3
Fixed effects
· Interception 495.31 (3.48)*** 514.54 (13.36)*** 778.36 (10.78)*** 656.16 (42.09)***
Socio-economic context
· GDP per capita 0.01 (0.00) - -
· ESCS 37.85 (1.21)*** 37.94 (1.21)*** 31.31 (1.38)***
Regional educational policies
· Students in the public centres -0.39 (0.24) -
· Expenditure on education per student -0.01 (0.01)* -.01 (0.00)
· Size of the groups -0.91 (1.41)
· Student-teacher ratio -10.85 (2.51)*** -8.29 (2.33)**
· Computers per group -2.36 (0.66)** -2.45 (0.71)**
Institutional culture of the centre
· Educational leadership -1.10 (0.87)
· Negative behaviours of the students -3.31 (0.72)***
· Respect of the students -9.14 (2.95)**
· Involvement of the families 0.09 (0.05)
· Improvement of quality -1.00 (0.71)
Teaching performance
· Headteacher style 15.87 (3.54)***
· Research methodology -2.11 (2.48)
· Adaptation of the teaching 10.16 (3.80)**
· Feedback to the students -19.32 (2.89)***
· Support of the students -8.83 (3.48)*
· Class control 13.14 (2.06)***
Random effects
eij (intra-region variance) 1012. 74 (46.25)*** 505.15 (23.08)*** 505.27 (23.09)*** 392.63 (18.91)***
u0j (inter-region variance) 187.24 (72.66)** 105.02 (41.14)* 26.53 (15.36) 33.82 (16.53)*

value increases in a unit the average scientific competence in the centre
is raised by 37.85 points. The non-explained variance between regions
(u0j) is reduced from the value 187.32 registered in the null model to the
value 105.02, while the intra-region variance (eij) goes from 1012.74 to
505.15. As a consequence, the percentage of variance explained in both
levels by the variables of the socio-economic context is 45.94% and
50.12%, respectively. These figures show the important role of the ESCS
in explaining the differences observed between centres and between
regions. Given that our interest is centred on explaining achievement
from malleable factors of educational policies, the institutional culture of
the centres and the performance of the teachers, it is appropriate to
control the effect of the socio-economic context in successive models.
Maintaining the ESCS as the fixed part, the variables related with the
regional educational systems were added to Model 2. In this model, the
spending on education (p<.05), the computers per group (p<.01) and the
student-teacher ratio (p<.001) have significant effects. For this last
variable, each increase of a unit in the ratio corresponds to a drop of 9.08
points in the scientific competence attained in the centres. The inter-
region residual variance is u0j=26.53. This represents a reduction of
85.83% of the initial variance noted in the mull model. That is to say, the
including of the regional variables considerably increases the percentage
of inter-region variance explained in Model 1.
Finally, Model 3 adds the variables measured at the centre-level. In
the presence of these variables, the effect associated with spending on
education ceases to be significant (p>.05). The variables which measure
aspects of the centres’ institutional culture have generally turned out to
be less relevant than those which refer to the teaching performance.
Among the former, only the effects of the negative behaviours of the
students (p<.001) and the disrespectful relation of the teacher with the
students (p<.01), both linked to the school climate, have been significant.
The unitary increase in these variables means a reduction of scientific
competence of 3.31 and 9.14 points, respectively. Teaching practices have
a greater importance. A good control of the class (p<.001), teaching
directed by the teacher (p<.001) and the adaptation of the teaching to
the students’ needs (p<.01) significantly raise the average scientific
competence in the centre. Specifically, the scientific competence is raised
15.87 points with the unitary increase of the index of headteacher style,
13.14 points with the same increase in the control of the class, and 10.16
Gil-Flores, J., García-Gómez, S. ThE ImpORTAncE OF TEAchInG pRAcTIcES In RElATIOn TO REGIOnAl EDUcATIOnAl pOlIcIES In EXplAInInG pISA AchIEvEmEnT
Revista de Educación, 378. October-December 2017, pp. 50-74
Received: 17-03-2017 Accepted: 02-06-201765

points in the case of the index of adaptive teaching. On the other hand,
specific actions such as the feedback to (p<.001) and support of the
student (p<.05), are negatively related with the level of competence. Each
unit more in these variables corresponds with decreases in the scientific
competence of 19.32 and 8.83 points, respectively. Introducing variables
of the centre in the model makes the intra-region residual variance drop
to eij=392.63. This value represents a reduction of 61.23% with respect to
the null model, improving the percentage attained with the control
variables (50.12% in Model 1).
The fit of the final model constructed can be valued from the decrease
in the deviance (the fit statistic used for comparing hierarchical linear
models). The deviance of the final model (-2LL=7838.31) is less than that
registered for the remaining models (between -2LL=9560.11 in the null
model and -2LL=8861.93 in Model 2). The difference of deviances between
the two models is distributed according to the chi-squared in so many
degrees of freedom as the number of parameters of fixed effects which
one model adds in relation to another. As a consequence, the final model’s
fit has significantly improved (p<.001) with respect to all the previous
models.
Discussion and conclusions
Our study confirms the link between performance and the socio-
economic and cultural context. The ESCS index is a variable of maximum
relevance in the explaining of the results obtained in PISA-2015, as was
concluded in previous works which considered the ESCS at the regional
level (Elosua, 2013; Ferrer et al., 2010; Gil, 2014), or at the level of centres
(Calero and Escardíbul, 2007). This corroborates the suitability of the
control of this variable in the explanatory models constructed to answer
the aims of this work.
In answer to the first aim, we note the relation of performance in PISA
with variables connected with regional educational policies. The previous
literature has insisted on the financing of education as one of the aspects
which explain the differences between countries or regions (Duru-Bellat
and Suchaut, 2005). Although in our analysis public spending per student
has been a relevant factor, the effect of variables linked with the provision
of both personal and material resources has been more important. That
Gil-Flores, J., García-Gómez, S. ThE ImpORTAncE OF TEAchInG pRAcTIcES In RElATIOn TO REGIOnAl EDUcATIOnAl pOlIcIES In EXplAInInG pISA AchIEvEmEnT
Revista de Educación, 378. October-December 2017, pp. 50-74
Received: 17-03-2017 Accepted: 02-06-201766

is to say, compared to the budget amount allocated to education, a greater
influence is the way in which this financing is distributed, generating
greater resources in the educational system. The relation between
achievement and the availability of ICT resources, operationalised in this
work as the number of computers per classroom has a negative sign. This
would reflect the scant efficacy of the efforts of the educational
Authorities to tackle the problems of low achievement via policies aimed
at increasing this type of resources in educational centres. When
reviewing the autonomous policies for introducing ICT, Meneses,
Fàbregues, Jacovkis and Rodríguez-Gómez (2014) highlight that the
increase of ICT resources has not always been accompanied by a
sufficient training of the teachers for their use, and this should be
especially considered when providing the centres with ICT resources.
In our analysis, the student-teacher ratio has been the variable of
greatest weight in explaining the differences of achievement between
regions, which is why it seems reasonable to reduce the size of the groups
and prioritise the provision of teachers (Grau, Pina and Sáncho, 2011).
The scholaraisation in centres of public or private ownership, once the
socio-economic context has been controlled, does not explain the
differences between regions. This result is consistent with those obtained
in studies which also analyse this factor, comparing the achievement of
the Spanish regions (Ferrer et al., 2010) or that of different countries (De-
Jorge and Santín, 2010).
Answering the second aim of the study, we have analysed the relation
between the variables of the centre and achievement. We note a greater
effect of the performance of the teachers than of the institutional culture.
Previous works had pointed out the need to centre efforts on intervening
with the students, given the slight relevance of other centre variables in
explaining achievement (Cordero et al., 2009). In this same line,
Heargraves and Fullan (2014) highlight the role of the centre and the
processes which take place in the classroom to achieve satisfactory
learning results. According to our results, the class climate, the
headteacher style, the order and control of the class, teacher-student
respect and the adapting of the teaching to the needs of the students are
significantly related with the centre’s average scientific competence.
These results coincide with those of previous works where similar
variables were considered (Clavel et al., 2016; Krüger et al., 2015; López,
Ascorra, Bilbao, Oyanedel, Moya and Morales, 2012). The negative effects
Gil-Flores, J., García-Gómez, S. ThE ImpORTAncE OF TEAchInG pRAcTIcES In RElATIOn TO REGIOnAl EDUcATIOnAl pOlIcIES In EXplAInInG pISA AchIEvEmEnT
Revista de Educación, 378. October-December 2017, pp. 50-74
Received: 17-03-2017 Accepted: 02-06-201767

of feedback to and support of the students could be explained by an
intensification of this kind of actions in the centres with lower
achievement levels.
With respect to institutional culture, aspects such as educational
leadership, the involvement of the families and measures in favour of
educational quality are not relevant to explain the differences of
achievement. On the other hand, negative behaviours of the students are
significant, in accordance with the studies which underline the negative
repercussions of disruptive behaviours in terms of learning (Torregrosa,
Inglés, García-Fernández, Gázquez, Díaz-Herrero and Bermejo, 2012). In
this sense, it would be desirable to foster measures oriented towards the
students who have a greater school disaffection: to boost personal and
academic orientation, to drive group tutorials, to employ participative
teaching methodologies and to diversify leisure activities.
As we indicated when establishing the conceptual framework of this
study, the variables of the socio-economic context are not malleable by
the educational agents. However, there is a clear margin for intervention
if we pay attention to the remaining variables. Our findings point to the
educational centres and the performance of the teachers as the main areas
for the implementation of measures aimed at boosting learning. Beyond
claiming an increase in educational spending, the provision of more
technological resources, the defence of the public network compared to
the private network or vice versa, we believe that it is necessary to
specifically spotlight the centres. These require having suitable conditions
to develop the teaching-learning processes which, among other measures,
means having a stable provision of teachers adjusted to the volume of
students. The fundamental role of the teaching performance in explaining
achievement recommends the adopting of measures aimed at facilitating
the work of the teachers in the classroom, providing the necessary
support and the recognition of their work. The stability of the teaching
workforce would be another challenge in this same line.
Finally, we highlight some strengths and weaknesses of our study. As
it is a question of a secondary analysis of PISA data, we have had a broad,
rigorously measured sample of centres and variables. Unlike other works
which have been limited to exploiting the data available in PISA, we have
integrated into the analysis information from external sources. The main
limitation is inherent to the methodology used. The models constructed
identify relevant variables in the explanation of the achievement but do
Gil-Flores, J., García-Gómez, S. ThE ImpORTAncE OF TEAchInG pRAcTIcES In RElATIOn TO REGIOnAl EDUcATIOnAl pOlIcIES In EXplAInInG pISA AchIEvEmEnT
Revista de Educación, 378. October-December 2017, pp. 50-74
Received: 17-03-2017 Accepted: 02-06-201768

not enable the establishing of cause-effect relations which would generate
greater confidence in the efficacy of a possible intervention on the
independent variables whose effects have been relevant. Taking into
account that the differences of achievement between centres continues
being significant in the final model constructed, future works would have
to analyse the incorporation of new variables which would reduce the
residual variance and carry on advancing in the explanation of the
achievement registered in the Spanish educational centres. Continuing
this study, an interesting line of research could be to centre on the role
of the teaching performance. In particular, it would have to go more
deeply into the role of variables not dealt with in international
evaluations, such as is the case of the teachers’ emotional competence,
in tune with the works of Kunter et al. (2013). From the methodological
point of view, future research could tackle mixed approaches, facilitating
via qualitative perspectives a greater comprehension of the differences
of inter-regional and inter-centre achievement noted in the quantitative
analyses carried out from evaluations such as that of PISA.
References
Bietenbeck, J. (2014). Teaching practices and cognitive skills. Labour
Economics, vol. 30, C, 143-153.
Blatchford, P., Bassett, P., & Brown, P. (2011). Examining the effect of
class size on classroom engagement and teacher-pupil interaction:
Differences in relation to pupil prior attainment and primary vs.
secondary schools. Learning and Instruction, nº 21, 715-730.
Bolívar, A. (2006). Evaluación institucional: entre el rendimiento de
cuentas y la mejora interna. Gestão em Ação, vol. 9, nº 1, 7-36.
Bratti, M., Checci, D., & Filippin, I. (2007). Territorial Differences in Italian
Students’ Mathematical Competencies: Evidence from PISA 2003.
Discussion Paper No. 2603. Institute for the Study of Labor.
ftp://repec.iza.org/SSRN/pdf/dp2603.pdf
Calero, J. & Escardíbul, J.O. (2007). Evaluación de servicios educativos:
el rendimiento de centros públicos y privados en PISA 2003. Hacienda
Pública Española, vol. 183, nº 4, 33-66.
Calero, J. & Escardíbul, J.O. (2014). Recursos escolares y resultados de la
educación. Madrid: Fundación Europea Sociedad y Educación.
Gil-Flores, J., García-Gómez, S. ThE ImpORTAncE OF TEAchInG pRAcTIcES In RElATIOn TO REGIOnAl EDUcATIOnAl pOlIcIES In EXplAInInG pISA AchIEvEmEnT
Revista de Educación, 378. October-December 2017, pp. 50-74
Received: 17-03-2017 Accepted: 02-06-201769

Calero, J., Choi, A., & Waisgrais, S. (2010). Determinantes del riesgo de
fracaso escolar en España: una aproximación a través de un análisis
logístico multinivel aplicado a PISA-2006. Revista de Educación, nº
extraordinario, 225-256.
Carabaña, J. (2008). Las diferencias entre países y regiones en las pruebas
PISA. Colegio Libre de Eméritos: Madrid.
Chudgar, A. & Luschei, T.F. (2009). National income, income inequality,
and the importance of schools: A hierarchical cross-national
comparison. American Educational Research Journal, nº 46, 626–658.
doi: 10.3102/0002831209340043
Claro, M. (2010). Impacto de las TIC en los aprendizajes de los estudiantes.
Estado del arte. Documento de trabajo. Santiago de Chile: Comisión
Económica para América Latina y el Caribe (CEPAL).
Clavel, J., Crespo, F.J.G. & Méndez, I. (2016). Are teacher characteristics
and teaching practices associated with student performance? Policy
Brief, 11. Amsterdam (The Netherlands): IEA.
Collet-Sabé, J., Besalú, X., Feu, J., &Tort, A. (2014). Escuelas, familias y
resultados académicos. Un nuevo modelo de análisis de las relaciones
entre docentes y progenitores para el éxito del todo el alumnado.
Profesorado. Revista de Currículum y Formación del Profesorado, vol.
18, nº 2, 7-33.
Cordero, J.M., Crespo, E. & Pedraja, F. (2013). Rendimiento educativo y
determinantes según PISA: una revisión de la literatura en España.
Revista de Educación, nº 362, 273-297.
Coutinho, M. & Reis, H.J. (2012). What accounts for Portuguese regional
differences in students’ performance? Evidence from OECD PISA.
Economic Bulletin. Banco de Portugal. Accessed at
http://ideas.repec.org/a/ptu/bdpart/b201216.html
Day, C., Gu, Q. & Sammons, P. (2016) The impact of leadership on student
outcomes: how successful school leaders use transformational and
instructional strategies to make a difference. Educational
Administration Quarterly, vol. 52, nº 2, 221-258.
De-Jorge, J. (2016). Factores explicativos del rendimiento escolar en
Latinoamérica con datos PISA 2009. Revista de Métodos Cuantitativos
para la Economía y la Empresa, nº 22, 216-229.
De-Jorge, J. & Santín, D. (2010). Los Determinantes de la eficiencia
educativa en la Unión Europea. Hacienda Pública Española/Revista
de Economía Pública, 193, 131-156.
Gil-Flores, J., García-Gómez, S. ThE ImpORTAncE OF TEAchInG pRAcTIcES In RElATIOn TO REGIOnAl EDUcATIOnAl pOlIcIES In EXplAInInG pISA AchIEvEmEnT
Revista de Educación, 378. October-December 2017, pp. 50-74
Received: 17-03-2017 Accepted: 02-06-201770
Doyle, W. (1980). Classroom Management. Indianapolis: Kappa Delta Pi.
Duncan, K.C. & Sandy, J. (2007). Explaining the performance gap
between public and private school students. Eastern Economic
Journal, vol. 33, nº2, 177-191.
Duru-Bellat, M. & Suchaut, B. (2005). Organisation and context, efficiency
and equity of educational systems: What PISA tells us. European
Educational Research Journal, nº 4, 181-194. doi: 10.2304/
eerj.2005.4.3.3
Elosua, P. (2013). Diferencias individuales y autonómicas en el estatus
socioeconómico y cultural como predictores en PISA 2009. Revista de
Educación, nº 361, 646-664.
Ferrer, F. (2012). PISA: Aportaciones e incidencia sobre las políticas
educativas nacionales. Revista Española de Educación Comparada, nº
19, 11-16.
Ferrer, F., Valiente, O., & Castel, J.L. (2010). Los resultados PISA-2006
desde la perspectiva de las desigualdades educativas: la comparación
entre Comunidades Autónomas en España. Revista Española de
Pedagogía, nº 245, 23-48.
Foces, J.A. (2015). PISA, IDE e IPE: Evidencia empírica de las
desigualdades educativas entre las regiones españolas. Revista de
Psicología y Educación, vol. 10, nº 1, 173-192.
Freiberg, H.J. (2013). Classroom management and student achievement.
In J. Hattie and E.M. Anderman (Eds.), International guide to student
achievement (pp. 228-230). New York: Routledge.
García, J.I. & Robles, J.A. (2013). Diferencias regionales en el rendimiento
educativo: ¿qué ha cambiado entre 2009 y 2012? In PISA 2012. Informe
español (pp. 98-125). Versión preliminar. Madrid: Ministerio de
Educación, Cultura y Deporte.
Gaskins, C.S., Herres, J., & Kobak, R. (2012). Classroom order and student
learning in late elementary school: A multilevel transactional model of
achievement trajectories. Journal of Applied Developmental Psychology,
nº 33, 227-235. doi: 10.1016/j.appdev.2012.06.002
Gil, J. (2014). Factores asociados a la brecha regional del rendimiento
español en la evaluación PISA. Revista de Investigación Educativa, vol.
52, nº 2, 393-410.
González, C., Caso, J., Díaz, K., & López, M. (2012). Rendimiento
académico y factores asociados. Aportaciones de algunas evaluaciones
a gran escala. Bordón, vol. 64, nº 2, 51-68.
Gil-Flores, J., García-Gómez, S. ThE ImpORTAncE OF TEAchInG pRAcTIcES In RElATIOn TO REGIOnAl EDUcATIOnAl pOlIcIES In EXplAInInG pISA AchIEvEmEnT
Revista de Educación, 378. October-December 2017, pp. 50-74
Received: 17-03-2017 Accepted: 02-06-201771

Grau, R., Pina, T., & Sáncho, C. (2011). Posibles causas del fracaso escolar
y el retorno al sistema educativo. Hekademos. Revista Educativa
Digital, nº 9, 1-22.
Gumus, S. & Atalmis, E.H. (2012). Achievement Gaps Between Different
School Types and Regions in Turkey: Have They Changed Over Time?
Mevlana International Journal of Education, 2 (2), 50-66.
Haegeland, T., Raaum, O., & Salvanes, K.G. (2012). Pennies from heaven?
Using exogenous tax variation to identify effects of school resources
on pupil achievement. Economics of Education Review, 31(5), 601-614.
Hallinger, P. & Heck, R.H. (2010) Collaborative leadership and school
improvement: understanding the impact on school capacity and
student learning. School Leadership and Management, vol. 30, nº 20,
95-110. doi: 10.1080/13632431003663214
Hargreaves, A. & Fullan, M. (2014). Capital profesional. Transformar la
enseñanza en cada escuela. Madrid: Ediciones Morata.
Harks, B., Rakoczy, K., Hattie, J., Besser, M., & Klieme, E. (2014). The
effects of feedback on achievement, interest and self-evaluation: the
role of feedback’s perceived usefulness, Educational Psychology, vol.
34, nº 3, 269-290. doi: 10.1080/01443410.2013.785384
Instituto Nacional de Estadística (2016). Contabilidad regional de España.
Serie 2000-2015. Consultada en http://www.ine.es/jaxi/menu.do;
jsessionid=038E2EF952AA657A136739FCA517F649.jaxi03?type=pcaxis
&path=%2Ft35%2Fp010&file=inebase&L=0
Jennings, P.A. & Greenberg, M.T. (2009). The Prosocial Classroom: Teacher
Social and Emotional Competence in Relation to Student and
Classroom Outcomes. Review of Educational Research, vol. 79, nº 1,
491–525. doi: 10.3102/0034654308325693
Krüger, N., Formichella, M.M., & Lekuona, A. (2015). Más allá de los logros
cognitivos: la actitud hacia la escuela y sus determinantes en España
según PISA. Revista de Educación, nº 367, 10-35. doi: 10.4438/1988-
592X-RE-2015-367-281
Kunter, M., Klusmann, U., Baumert, J., Richter, D., Voss, T. & Hachfeld, A.
(2013). Professional Competence of Teachers: Effects on Instructional
Quality and Student Development. Journal of Educational Psychology,
vol. 105, nº 3, 805–820. doi: 10.1037/a0032583
Lenkeit, J. & Caro, D.H. (2014). Performance status and change –
measuring education system effectiveness with data from PISA
2000–2009. Educational Research and Evaluation, vol. 20, nº 2, 146-
Gil-Flores, J., García-Gómez, S. ThE ImpORTAncE OF TEAchInG pRAcTIcES In RElATIOn TO REGIOnAl EDUcATIOnAl pOlIcIES In EXplAInInG pISA AchIEvEmEnT
Revista de Educación, 378. October-December 2017, pp. 50-74
Received: 17-03-2017 Accepted: 02-06-201772

174.
López, V., Ascorra, P., Bilbao, M.A., Oyanedel, J.C., Moya, I., & Morales,
M. (2012). El Ambiente Escolar incide en los Resultados PISA 2009:
Resultados de un estudio de diseño mixto. Valparaíso (Chile): Fondo
de Investigación y Desarrollo En Educación. Ministerio de Educación.
López-González, L. & Oriol, X. (2016). La relación entre competencia
emocional, clima de aula y rendimiento académico en estudiantes de
secundaria. Cultura y Educación, vol. 28, nº 1, 142-156.
Luzón, A. & Torres, M. (2013). La presencia de PISA en la literatura
científica y su tratamiento en la prensa diaria internacional.
Profesorado. Revista de Currículum y Formación del Profesorado, vol.
17, nº 2, 193-224.
Mancebón, M.J. & Pérez, D. (2010). Una valoración del grado de
segregación socioeconómica existente en el sistema educativo español.
Un análisis por comunidades autónomas a partir de PISA 2006.
Regional and Sectoral Economic Studies, vol. 10, nº 3, 129-148.
MECD (2016). Sistema Estatal de Indicadores de la Educación 2016.
Accessed at http://www.mecd.gob.es/inee/sistema-indicadores.html
MECD (2017). Las cifras de la educación en España. Curso 2014-2015
(Edición 2017). Accessed at http://www.mecd.gob.es/servicios-al-
ciudadano-mecd/estadisticas/educacion/indicadores-publicaciones-sint
esis/cifras-educacion-espana/2014-15.html
Mediavilla, M. & Escardíbul, J.O. (2015). ¿Son las TIC un factor clave en
la adquisición de competencias? Un análisis con evaluaciones por
ordenador. Hacienda Pública Española, nº 212, 67-96.
Meneses, J., Fàbregues, S., Jacovkis, J., & Rodríguez-Gómez, D. (2014).
La introducción de las TIC en el sistema educativo español (2000-
2010): un análisis comparado de las políticas autonómicas desde una
perspectiva multinivel. Estudios Sobre Educación, vol. 27, 63-90.
Murillo, F.J. & Román, M. (2011). School Infrastructure and Resources Do
Matter: Analysis of the Incidence of School Resources on the
Performance of Latin American Students. School Effectiveness and
School Improvement, vol. 22, nº 1, 29-50.
Murillo, F.J. & Hernández-Castilla, R. (2015). Liderazgo para el
aprendizaje: ¿Qué tareas de los directores y directoras escolares son
las que más inciden en el aprendizaje de los estudiantes? RELIEVE,
vol. 21, nº 1, art. 1. doi: 10.7203/relieve.21.1.5015
Nieto, S. & Recamán, A. (2012). Hacia una mayor comprensión global del
Gil-Flores, J., García-Gómez, S. ThE ImpORTAncE OF TEAchInG pRAcTIcES In RElATIOn TO REGIOnAl EDUcATIOnAl pOlIcIES In EXplAInInG pISA AchIEvEmEnT
Revista de Educación, 378. October-December 2017, pp. 50-74
Received: 17-03-2017 Accepted: 02-06-201773

74 Revista de Educación, 378. October-December 2017, pp. 50-74
Received: 17-03-2017 Accepted: 02-06-2017
Gil-Flores, J., García-Gómez, S. ThE ImpORTAncE OF TEAchInG pRAcTIcES In RElATIOn TO REGIOnAl EDUcATIOnAl pOlIcIES In EXplAInInG pISA AchIEvEmEnT
rendimiento académico a través de las pruebas PISA: contraste de tres
hipótesis a partir de unos datos empíricos. Educación XX1, vol. 15, nº
1, 157-178.
OECD (2012). Public and Private Schools: How Management and
Funding Relate to their Socio-economic Profile. OECD Publishing. doi:
10.1787/9789264175006-en
OECD (2017). PISA 2015 Technical report. Accessed at
http://www.oecd.org/pisa/data/2015-technical-report/
Pedró, F. (2012). Deconstruyendo los puentes de PISA: del análisis de
resultados a la prescripción política. Revista Española de Educación
Comparada, nº 19, 139-172.
Reyes, M.R., Brackett, M.A., Rivers, S.E., White, M.,
& Salovey, P. (2012). Classroom emotional climate, student
engagement, and academic achievement. Journal of Educational
Psychology, nº 104, 700–712. doi:10.1037/a0027268
Spiezia, V. (2010). Does computer use increase educational achievements?
Student-level evidence from PISA. OECD Journal: Economic Studies,
v. 2010.
Torregrosa, M.S., Inglés, C.J., García-Fernández, J.M., Gázquez, J.J., Díaz-
Herrero, A., & Bermejo, R.M. (2012). Conducta agresiva entre iguales
y rendimiento académico en adolescentes españoles. Behavioral
Psychology / Psicología Conductual, vol. 20, nº 2, 2012, 263-280.
Van Damme, J., Liu, H., Vanhee, L., & Pustjens, H. (2010). Longitudinal
studies at the country level as a new approach to educational
effectiveness: Explaining change in reading achievement (PIRLS) by
change in age, socio-economic status and class size. Effective
Education, vol.2, 53–84. doi: 10.1080/19415531003616888
Van Ewijk, R. & Sleegers, P. (2010). The effect of peer socioeconomic
status on student achievement: a meta-analysis. Educational Research
Review, vol. 5, nº 2, 134-150.
Wu, M. (2005). The role of plausible values in large-scale surveys. Studies
in Educational Evaluation, vol. 31, nº 2-3, 114-128.
Información de contacto: Javier Gil Flores. Universidad de Sevilla, Facultad de
Ciencias de la Educación. Departamento de Métodos de Investigación y
Diagnóstico en Educación. Calle Pirotecnia, s/n, 41013, Sevilla. E-mail: