improved resilience and climate governance in angola’s cuvelai basin, 01/2015
TRANSCRIPT

A DEVELOPMENT WORKSHOP ANGOLA (DW) E SUAS INTERVENÇÕES NO SECTOR TERRA & PLANIFICAÇÃO URBANA
Presentation for USAID Evaluation TeamOndjiva, January 26, 2015
Eye Kutoloka Project
“Improved Resilience and Climate Governance in Angola’s Cuvelai
Basin”Project Duration: August 1, 2013 to July 31, 2015

Content of the Presentation
1. Introduction1. Development of current activities2. Project’s key issue3. Project objective4. Project approach5. Project integration and local ownership
2. Main activities1. Flood early warning system2. Mapping and GIS3. Vulnerability survey4. Pilot activities
3. Planned activities until end of project

I. Introduction

1.1. Development of the Current Project
• The 2008 floods in the Cuvelai were widely publicized.• This called attention to the Cuvelai Basin as an area prone
to natural disasters.• DW implemented a baseline on hydrology and
demography of the basin / book published in 2011.

1.2. Project’s Key Issue
The current project was developed to expand this knowledge base and implement a set of specific activities.
The key issue to be addressed by this project is: To reinforce the capacity of local authorities and
communities to develop more resilience to climate related disasters by which the Cuvelai Basin has been affected in different ways for centuries, and the nature and characteristics of which are influenced by cyclical and long term climate changes, effecting an ever increasing and economically vulnerable population.

1.3. Project Objective
Increase communities’ climate change resilience in Cuvelai Basin (Cunene province) through capacity strengthening activities in four target municipalities (Cuanhama, Ombadja, Namacunde, and Cuvelai).

1.4. Project Expected Results
Result 1: Strengthened community capacity for preparedness for climate response.
Result 2: Strengthened capacity of local hydro-meteorological services and local civil protection authorities to monitor extreme weather and climate change in the Cuvelai Basin.
Result 3: Improved local government services and response climate disaster

1.4. Project Approach
Key Areas of Intervention:1. Development of an flood early warning system based on
hydrometric stations, installed in strategic localities across the basin.
2. Mapping of people, services and flooding to analyse and understand the spatial dimensions of vulnerability
3. Implementation of a household survey to document and understand social, economic and livelihood aspects of vulnerability and to identify key interventions that would increase resilience.
4. To pilot key interventions that strengthen people’s resilience, promoting the best ones through advocacy at provincial and municipal government level by targeting policy, program design and budgeting processes.

1.5. Project Integration and Local Ownership
Institutional integration and local ownership - partnership with Civil Protection of Cunene Province
• Civil Protection and the project team work as an integrated unit, jointly define work plans, implement & assess activities, and work with government authorities at the provincial and municipal levels.
• Civil Protections institutional knowledge goes into project planning and activities.
• Partnership has worked exceptionally well, much due to Civil Protection’s leadership.
• Among other outcomes, the partnership facilitated full support of the project by provincial government and municipal administrations.

1.5. Project Integration and Local Ownership (cont.)
Creating capacity for project sustainabilityFrom the beginning, civil protection and project staff agreed on
the importance for civil protection staff to acquire all necessary skills to give continuation to the processes initiated by this project. Some of the most important areas for reinforcing capacities are:
• Better understanding of the people’s vulnerability and ways to reinforce resilience in the face of climate variations and changes
• Spatial understanding of vulnerability in the basin• Provision of and training in the use of tools and such as GPS,
GIS, and production of maps• Management of the hydrometric stations, analysis of flood
data and dissemination of information

2. Main Activities

2.1. Flood Early Warning System
A network of hydrometric stations for flood early warning exists on Namibian side of the Cuvelai Basin.
2013: Project Team and Civil Protection meet Namibian Authorities from Water Affairs in Oshakati, received information on how the network functions, and visited the hydrometric stations in the field.
April 2014: Project organized a coordination meeting for the development of the Angolan flood early warning system. Participants: Civil Protection Provincial
Government National Institute of
Hydrological Resources
Representatives of Water Affairs in Namibia

2.1. Flood Early Warning System (cont.)
Outcomes of the meeting: Decision about make and
model of hydrometric stations to be acquired (the same as in Namibia to facilitate integrated system for the whole basin).
Localization of stations. Responsibilities of different
institutions in Namibia and Angola.

2.1. Flood Early Warning System (cont.)
Sensor for measuring water level at bottom of pipe.
Transmission system on top of pipe.
Sms where telephone network existent.
Satellite connection in localities without telephone network.
Risk of vandalism: minimized by type of installation.
The Hydrometric Stations

2.1. Flood Early Warning System (cont.)
Equipment provided & installed by: Aqua Services Namibia
Site visit conducted by Engineer of Aqua Services Installation drawings provided Equipment worth USD 75.000 purchased and stored
at Civil Protection (4 stations) Significant delays of product delivery will not allow
installing the system in this rain season. System will be installed in June/July 2015 and tested
in 2015/16 rain season.
Installing the Hydrometric Stations
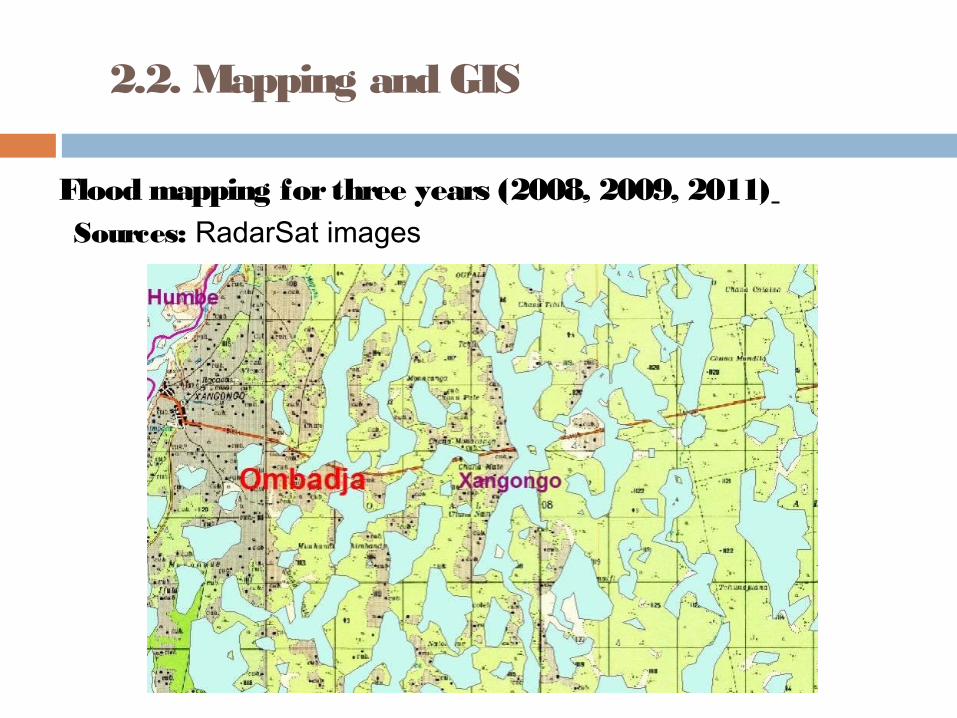
2.2. Mapping and GIS
Flood mapping for three years (2008, 2009, 2011) Sources: RadarSat images

2.2. Mapping and GIS (cont.)
Source: Quickbird downloaded & georeferenced, putting them together as 2-metre pixel resolution tiles for the whole area / total of 78.600 houses mapped
Mapping of all households in the Cuvelai Basin (urban and rural)

2.2. Mapping and GIS (cont.)
Population density mapping based on house count
Red: high pop. density
Green: low pop. density

2.2. Mapping and GIS (cont.)
Flood risk analysis: overlay of flood & house count layers
4300 houses were directly affected by flood waters during this period.
Many affected houses in Ondjiva now protected by flood dams.

2.2. Mapping and GIS (cont.)
Mapping of Services (education, health, police, water sources)
Outcome: Set of maps produced for the four municipalities:
Services Access to
Water Distribution of
people Flooding VulnerabilityDecember 2014: meetings and presentations in all Municipalities (with
Administrators and key sectors)
2.2. Mapping and GIS (cont.)
GIS at Civil Protection
GIS training for Civil Protection Staff in May 2014 Manage information produced by the Project. Produce maps for Civil Protection’s work.
Civil Protection Incident Database Recording all Civil Protection incidents in a GIS database. Data recorded with handheld GPS.
Ongoing technical assistance through on-the-job training by the project.

2.3. Vulnerability Survey
Main objective of the survey: to better understand the characteristics of people’s vulnerability in the face of climate related disasters. Sampling:
25 blocks with 30 houses each.
Total of 750 households interviewed.
Blocks evenly spread across natural & demographic landscape of the basin.

2.3. Vulnerability Survey (cont.)
30 houses in each block selected randomly Attribution of coordinates to selected houses Preliminary report / edited booklet until end of February
2015 / used for advocacy

2.3. Vulnerability Survey (cont.)
Average of 10 people per rural home / 50.3% less than 15 years old.
92% of sources of water are considered not safe for human consumption (traditional wells, surface water).
67% report that flooding had occurred in their area. Only 50 households reacted to the flooding in some way (such as moving to another home) / 61 reported of people having drowned in neighbourhood / 230 households report children having missed school because of flooding.
36 household reported of people having died because of the drought / 537 households report livestock deaths / 130 households report children having missed school because of drought.
Insect pests mentioned by 359 households / bird pests on crops 73.

2.3. Vulnerability Survey (cont.)
33% of all households have no income, other 67% mostly with intermittent small incomes from retail sales of goods
Dominant crops: Millet, Sorghum, Maize, Beans Livestock: 65% of households report having cattle /
60% goats / 86% chicken. Food storage: under normal conditions, last for 12
months. Following the 2013 drought: most homes estimated stocks to last less than 6 months.
2.3. Vulnerability Survey (cont.)
Some first conclusions: People are extremely poor and vulnerable. Drought has more devastating impact on the population than
floods, especially by reducing agricultural output, making access to water very difficult and affecting livelihoods over an extended period of time.
Levels of resilience are very low, food stocks quickly exhausted and cash incomes very limited.
Key issues to increase resilience:1. Facilitate access to incomes that reduce dependence on
subsistence food sources and increase mobility and access to services
2. Allowing better agricultural output in years of drought3. Increase access to water in years of drought4. Improve food storage to protect limited and very valuable
resources (food)

2.4. Pilot Activities
Pilot activities are being implemented in three sectors:1. Drought resistant seed: Short stem varieties of pearl
millet and cowpeas that are being used in Namibia Dis tributio n d o ne in No ve m be r & De c e m be r 2 0 1 4
2. Access to clean water: hand dug well protected with concrete rings. Allows to dig deeper, so wells have water even in very dry years
Te s ts to be d o ne in June /July whe n g ro und wa te r le ve l is re c e d ing .
3. Improved food storage: testing of plastic food storage containers as used in Namibia; rain and humidity does not affected stored food.
Dis tributio n to be d o ne in Ma rch 2 0 1 5

2.4. Pilot Activities (cont.)
Distribution of drought resistant seed in Mukundas 4kg of short stem millet (Okashana) (covers 1ha) / 1kg of short
stem cowpeas (Nakare) / not mixing with indigenous seeds Objective: selected Mukundas initiate production of drought
resistant seeds / multiplication seeds for next planting season A brochure written in the local language was given together with
the seeds.

2.4. Pilot Activities (cont.)
Expected outcomes of pilot activities: Having identified and successfully tested innovative,
appropriate and effective approaches to increase the resilience of people living in the Angolan Cuvelai Basin.
Having disseminated the results and done advocacy of these approaches with appropriate government institutions:
For provincial government development programs Municipal Administration planning and budgeting processes

3. Planned Activities

3.1. Planned Activities until End of Project
Monitoring the outcomes of seed distribution in the 24 mukundas.
Delivery of plastic storage bins to the 24 mukundas. Installation of 4 hydrometric stations (June/July when shanas
are dry). Train Civil Protection and Water Affairs staff on managing
hydrometric stations, collecting and disseminating data Investigate improved well designs and install two improved
wells (June/July) when the shallow aquifers have dropped. Compile, print and distribute booklet on vulnerability and to
use it for advocacy purposes Ongoing support to municipal administrations to provide (a)
reliable mapped information, (b) encouragement to use mapped information for advocacy and planning.

Obrigado!