improvement of energy efficiency in sugar …
TRANSCRIPT

0
IMPROVEMENT OF ENERGY EFFICIENCY IN SUGAR PROCESSING
AT
LANKA SUGAR INDUSTRIES LIMITED, PELWATTE,
SRI LANKA
By
N.M.Lasantha
KTH Supervisor
Professor Andrew Martin
Local Supervisor
Mr.Ruchira Abeyweera
2018
Master of Science in Engineering Thesis
Department of Energy Technology
Royal Institute of Technology, KTH
Stockholm, Sweden

1
IMPROVEMENT OF ENERGY EFFICIENCY IN SUGAR PROCESSING
AT
LANKA SUGAR INDUSTRIES LIMITED, PELWATTE,
SRI LANKA
A dissertation submitted to the
Department of Energy Technology, Royal Institute of Technology,
Sweden for the partial fulfillment of the requirement for the
Degree of Master of Science in Engineering
By
N.M.Lasantha
KTH Registration No: 780406A518
KTH Supervisor
Professor Andrew Martin
Local Supervisor
Mr.Ruchira Abeyweera

2
Declaration
The work submitted in this thesis is the result of my own investigation, except where otherwise stated.
It has not been accepted for any other degree and not being concurrently submitted for any other degree.
N.M.Lasantha
Date: 2018
We/I endorse declaration by the candidate.
Professor Andrew Martin (KTH)
Mr.Ruchira Abeyweera

3
Master of Science Thesis EGI 2009:
IMPROVEMENT OF ENERGY EFFICIENCY IN SUGAR PROCESSING
AT
LANKA SUGAR INDUSTRIES LIMITED, PELWATTE, SRI LANKA
N.M Lasantha
Approved
Examiner
Professor Andrew Martin
Supervisor
Mr. Ruchira Abeyweera
Commissioner Contact person

4
Abstract
One of the drawbacks of the process house in a sugar factory is the potential for exhaust steam pressure drop during operation, leading to temporary loss of production and concomitant energy waste. Identified exhaust steam demand for existing exhaust steam distribution system is larger than exhaust steam generation, therefore there is potential to minimize or avoid such issues. This investigation examines process house steam systems via in-field measurements at a sugar factory located in Sri Lanka. Five options for modifying the exhaust steam distribution network were considered, with the most favorable one implemented in year 2013.
Considering operational data this year as compared with the previous year, measures to improve steam utilization yielded a 3.5% increase in crushing rate and nearly eliminated mill stoppage due to juice accumulation all while maintaining steam parameters at nominal levels.
FÖRBÄTTRING AV ENERGIANVÄNDING INOM SOCKERPRODUKTIONEN VID LANKA SUGAR INDUSTRIES LIMITED, PELWATTE, SRI LANKA
Sammanfattning
En begränsning hos processerna inom en sockerfabrik gäller tryckförluster i utsläppsångan, som kan leda till tillfälliga produktionsförluster och energislöseri. Den identifierade efterfrågan av utsläppsångan gällande det befintliga ångdistributionssystemet är högre än den tillförd ångan, därför finns det potential för att minimera eller undvika sådana situationer. Denna undersökning analyserar processångan genom mätningar hos en fabrik i Sri Lanka. Fem alternativ för modifiering av ångsystemet undersöktes och den lämpligast genomfördes under 2013. Jämfört med presentanda från året innan ledde dessa åtgärder till en ökning av 3,5% i produktivitet med bibehållen ångdata.

5
ACKNOWLEDGMENTS
I would like to express my thanks to Professor Torsten H. Fransson, KTH Department of Energy Technology, for expanding the Distance Sustainable Energy Engineering Program to Sri Lanka and making it functional to the world of sustainable energy engineering. I would like to extend my thank to professor N. R. Athayake, previous dean of the Open University of Sri Lanka for taking opportunity to give the facility to conduct the Distance Sustainable Energy Engineering Program in Sri Lanka.
I would like to thank to coordinator of Sustainable Energy Engineering Program at OUSL, Mr. Ruchira Abeyweera for giving more help us to continue this program, and supervision and the guidelines given in completing the project as my project supervisor at OUSL. I would like thank for all staff members who is given support for us to continuous this program.
I would like to thank for Dr. N S Senanayake for him sense understanding, supervision and the guidelines given in completing the project.
I would like to thank for Mr Eng. WR. Demel for giving support to completing the project. I would like to thank for my project supervisor at KTH, Dr. Sad Jarall for him sense understanding, supervision and guidelines given in completing the project.
I would like to thank Professor Andrew Martin for kindly accepted to grade my thesis and give instruction to complete thesis.
I have to mention about my wife, elder daughter, younger daughter, mother and father for given support to continuous this program.
I would like to thank to previous chief operation engineer, present factory manager Mr. Eng. E. P. Suranga, who granted the opportunity to take leaves for examination and presentation for this program. I would like to thank to Former factory manager Palitha Prematunga and present engineering manager Mr. Eng. Sisiwath also.
I should mention about my working place Lanka Sugar Company Limited, Pelwatte. I got more experience related to energy engineering field as well as Mechanical engineering. I will never forget this great opportunity in my life time.
I should thank to my friend who is Mr. Eng. Ghanapriya Mahendra for giving massage about Sustainable energy engineering program. Otherwise I could not continuous this program.
I should thank for my friend Mr. Eng. Hemakumara and Mr. Eng. Wasantha for cover up my duties during examination period and presentation period.
Finally, I would like to thank many individual friends and colleagues who have not been mentioned here personally in making this education success. I could not have to complete successfully without their support.

6
NOMENCLATURE
List of Abbreviations
A Heating surface area
BJ Brix of juice
BS Brix of syrup
BV Average Brix of juice leaving the vessel
BXI Outlet juice brix of each body
C Specific evaporation coefficient for evaporator real temperature drop
CP Specific evaporation coefficient
DP True temperature difference
E Weight of juice to be evaporated per cent cane
ET Total quantity of water evaporated per metric ton of Cane quintuple effect
J Weight of juice obtain per cent cane
KTH Kungliga Teknika Hogskoolan (Royal Institute of Technology)
L Latent heat of steam
M Quantity of juice to be heated
P1 Vapour bleeding from 1st vessel
P2 Vapour bleeding from 2nd vessel
P3 Vapour bleeding from 3rd vessel
P4 Vapour bleeding from 4th vessel
P5 Vapour bleeding from 5th vessel
Q The quantity of direct or enhance steam consumed by the evaporator
QP Quantity of vapour generation
R The quantity of direct or enhance steam usage for pans and juice heaters
S Specific heat of juice
SP Heating surface area
SW Weight of thick syrup per cent cane
T Log means temperature difference

7
TS Saturation temperature of heating stream
U Heat transfer coefficient
V Velocity of juice in tube
X The quantity of vapour passing from the last effect to the condenser

8
Units
0C Degree Celsius
Ton Metric tons
K Kelvin
Meters
s Second
H Hours
% Percentage
kJ/kg Kilojoules per kilogram
kJ/kgK Kilojoules per kilogram Kelvin
Ton/h Tones per hour
Kg/m2h Kilogram per square meter hour

9
TABLE OF CONTENTS
1 INTRODUCTION .............................................................................. 13
2 OBJECTIVES ................................................................................... 14
2 METHODOLOGY ............................................................................. 15
3 LITERATURE REVIEW .................................................................... 16
3.1 Sugar production and cogeneration in Southeast Asia .............................................. 16
3.2 Steam economy and cogeneration in cane sugar factories ....................................... 18
3.2.1 Conventional raw sugar factory base on the Monymusk factory in Jamica ......... (case 1) ............................................................................................................. 19
3.2.2 Conventional sugar factory with condensate heat recovery for juice heating (case 2) ............................................................................................................. 20
3.2.3 Quadruple effect falling film evaporator with condensate heat recovery for juice heating (case 3) .............................................................................................................. 21
3.2.4 Quadruple effect falling film evaporator with condensate juice heating and continuous vacuum pans (case 4) .................................................................................. 22
3.3 Improving energy efficiency in sugar mills ................................................................. 24
3.3.1 Making use of lower grade vapours for heating purposes ................................ 24
3.3.2 Improving Boiler Efficiency ............................................................................... 25
3.3.3 Replacement of steam driven mill drives with electric DC motor ...................... 26
4 SUGAR MANUFACTURING PROCESS IN LANKA SUGAR INDUSRTIES LIMITED, PELWATTE..................................................... 27
4.1 Description of sugar factory under study ................................................................... 27
4.1.1 Cane Preparation .............................................................................................. 30
4.1.2 Extraction .......................................................................................................... 30
4.1.3 Clarification of juice ........................................................................................... 31
4.1.4 Evaporation ....................................................................................................... 31
4.1.5 Crystallization-Pan Boiling ................................................................................ 33
4.1.6 Centrifuging ...................................................................................................... 33
4.1.7 Sugar drying and storage ................................................................................. 35
5 ENERGY CONSERVATION AND UTILIZATION............................. 36
5.1 Estimation of total exhaust steam generation ............................................................ 38
5.2 Estimation of pressure drop in evaporators and exhaust steam requirement for evaporators and heater ......................................................................................................... 38
5.3 Estimation of quantity of vapor or exhaust steam requirement for juice heating ....... 39
5.4 Estimation of individual evaporation in each vessel ................................................... 40

10
5.5 Estimation of juice brix from each vessel ................................................................... 40
5.6 Estimate of the specific evaporation rate according to Dessin formula in each vessel40
5.7 Estimate of heating surface area of individual evaporator vessel .............................. 40
5.8 Estimate of Total exhaust steam requirement ........................................................... 40
5.9 Results from EES ....................................................................................................... 41
5.9.1 Option No 01 of the exhaust steam distribution network .................................. 41
5.9.2 Option no 02 of the exhaust steam distribution network ................................... 42
5.9.3 Option No 03 of the exhaust steam distribution ................................................ 42
5.9.4 Option No 03 of the exhaust steam distribution ................................................ 43
5.9.5 Option No 05 of the exhaust steam distribution ................................................ 43
5.9.6 Summary of all the option of exhaust steam distribution network ..................... 44
5.9.7 Summary of exhaust steam requirement and generation ................................. 44
5.10 Calculation of exhaust steam reduction ..................................................................... 45
6 SUMMARY OF OPERATIONAL DATA ........................................... 46
6.1 Summary of operational data on year 2012 ............................................................... 46
6.2 Summary of operational data on year 2013 ............................................................... 47
6.3 Analyzing of operational data ..................................................................................... 48
6.3.1 Average value of operational data in year 2012 and year 2013 ....................... 48
7 DISCUSSION AND CONCLUSION ................................................. 51
8 REFERENCES ................................................................................. 53
9 APPENDIX ....................................................................................... 56
9.1 EES Calculation ......................................................................................................... 56

11
LIST OF FIGURES
Figure 3-1 Sugar manufacturing process with co-generation plant [12] ................................. 16 Figure 3-2 Conventional factory based on the Monymusk factory in Jamica [5] .................... 19 Figure 3-3 Conventional Factory with condensate heat recovery [5] ..................................... 20 Figure 3-4 Quadruple effect falling film evaporators with condensate heat recovery for juice heating [5] ............................................................................................................................... 22 Figure 3-5 Quadruple effect falling film evaporators with condensate juice heating and continuous pans [5] ................................................................................................................ 23 Figure 3-6 Evaporators [4] ...................................................................................................... 24 Figure 4-1 Sugar manufacturing process flow chart ............................................................... 29 Figure 4-2 Evaporators ........................................................................................................... 31 Figure 4-3 Crystallization-Pan Boiling .................................................................................... 33 Figure 4-4 Boiling Scheme ..................................................................................................... 34 Figure 5-1 Process house steam balance in sugar factory .................................................... 37 Figure 8-1 Average crushing rate in year 2012 and 2013 ...................................................... 48 Figure 8-2 Average steam flow rate in year 2012 and 2013 .................................................. 49 Figure 8-3 Average boiler pressure in year 2012 and 2013 ................................................... 49 Figure 8-4 Average exhaust steam pressure in year 2012 and 2013 .................................... 50 Figure 8-5 Average mill stoppage due to juice accumulation in year 2012 and 2013 ............ 50
12
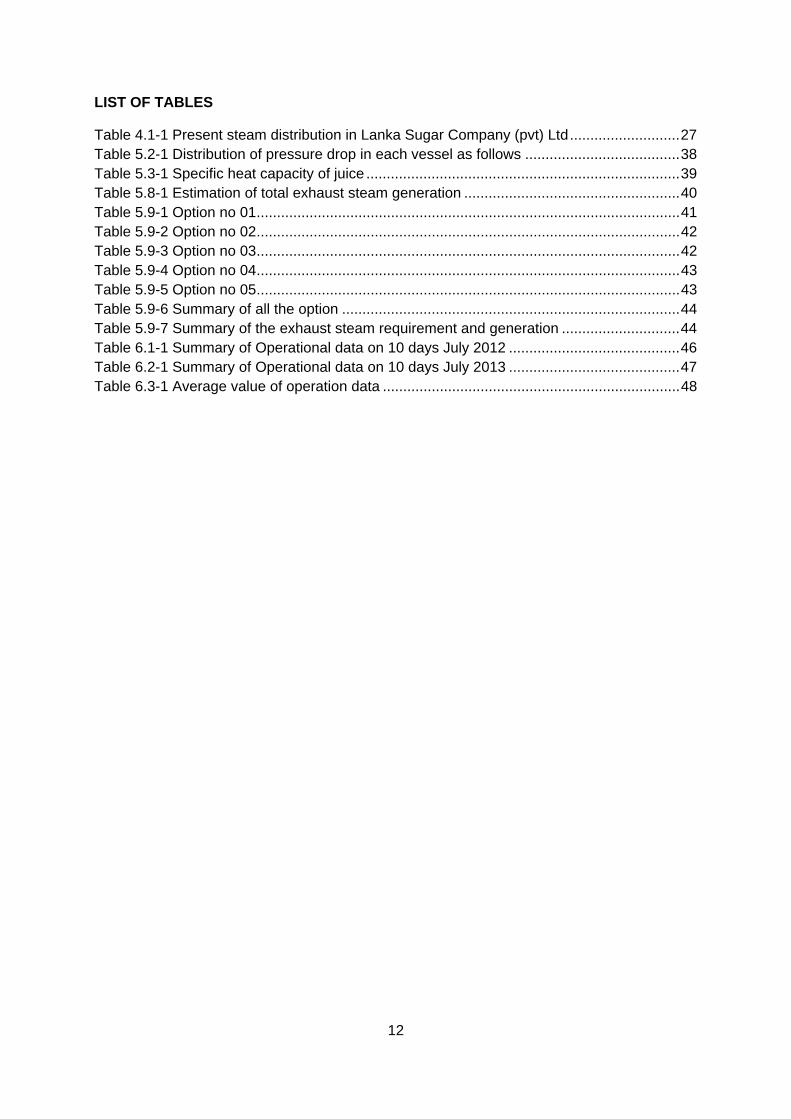
LIST OF TABLES
Table 4.1-1 Present steam distribution in Lanka Sugar Company (pvt) Ltd ........................... 27 Table 5.2-1 Distribution of pressure drop in each vessel as follows ...................................... 38 Table 5.3-1 Specific heat capacity of juice ............................................................................. 39 Table 5.8-1 Estimation of total exhaust steam generation ..................................................... 40 Table 5.9-1 Option no 01 ........................................................................................................ 41 Table 5.9-2 Option no 02 ........................................................................................................ 42 Table 5.9-3 Option no 03 ........................................................................................................ 42 Table 5.9-4 Option no 04 ........................................................................................................ 43 Table 5.9-5 Option no 05 ........................................................................................................ 43 Table 5.9-6 Summary of all the option ................................................................................... 44 Table 5.9-7 Summary of the exhaust steam requirement and generation ............................. 44 Table 6.1-1 Summary of Operational data on 10 days July 2012 .......................................... 46 Table 6.2-1 Summary of Operational data on 10 days July 2013 .......................................... 47 Table 6.3-1 Average value of operation data ......................................................................... 48

13
1 INTRODUCTION
Sugar cane is a type of grass with large stems. It is similar to bamboo cane. It is harvested yearly when it has matured with height around 3m.It has a 70-75% of moisture content,15.4% of total sugar content and 12.2 % of fiber content [21].
Around 70% of the global sugar supply is derived from sugar cane. The remaining 30% is derived from sugar beet. Sugar cane is grown in more than 100 countries worldwide. Considering sugar producers in 2014, Brazil is the world’s leading sugar producer with 25% of global sugar production and 50% of world sugar exports. India is the second leading sugar producer and leading sugar consumer. The countries among EU-28 are the third leading sugar producer and second leading consumer. Thailand is third largest sugar producer. China is fourth largest sugar producer and third largest sugar consumer [21].
The sugar requirement of Sri Lanka is estimated around 650000Ton per annum and 94% of the sugar requirement is imported. Around Rs.55 million in foreign exchange is expended for imported sugar. The sugar requirement is expected to increase over the next 10 to 15 years with increase in population and income. The demand may be approached 1 million Ton per annum of sugar by year 2020 [22]. There are three sugar factories available in Sri Lankan. Lanka Sugar Company Ltd, Pelwatte; Lanka Sugar Company Ltd Sevanagala are controlled by The Sri Lanka Government. Gal-Oya Plantations (Pvt) Limited has 51% of share for Sri Lankan Government and 49% of share for Brown and Company PLC and Lanka ORIX Leasing Company PLC [23].
Lanka Sugar Company Ltd, Pelwatte is located in Buttala in Sri Lanka. The main product of the company is commercial sugar, and alcohol is produced as a by-product. Daily sugar cane consumption is around 3600 metric tons .During the financial year 2012 the company crushed 450000 metric tons of sugar cane. The total sugar production is around 40000 metric tons per year. Approximately 8.5 tons of sugar was produced from 100tons of sugar cane and this value is called “rendement” in the sugar industry.
Sugar plant energy demand for electrical, mechanical and process heat is met by a steam power plant. This plant has two boilers, two power turbines and five turbines solely used to supply mechanical power for running the machinery. Boiler pressure is 28bar and exhaust steam coming out of all the turbines is used to meet the process heat demand. It has been observed that exhaust steam pressure often drops from the normal operating pressure of 1.5bar due to high demand of process heat during production process. In this situation extra heat demand is supplied by direct feeding of super-heated steam to the process house. This in turn unfavorably affects the turbines leading to the stoppages of plant.
In order to ensure continuous operation of the plant it is necessary either to prevent direct supply of super-heated steam extracted from the boiler or maintain steady process heat demand. In view of maintaining process heat demand at a low value, rearranging the steam distribution network within the process house is supposed to be a more practicable solution.
Therefore, the main focus of this study was to analyze the steam distribution network of the process house, and to design and implement an alternative method of steam distribution network so that heat supplied to the process house is optimally utilized.

14
2 OBJECTIVES
The main objectives of the study were as given below.
1. Analyze the process house steam balance in the sugar factory 2. Identify the causes that impact on the energy efficiency in the process house in sugar
processing and establish corrective measures especially in the steam distribution network.
3. Implement corrective measures and evaluate the performance

15
2 METHODOLOGY
In this study, the main consideration was to analyze the energy utilization in the process house in the sugar factory and to redesign the process heat supply chain for optimal use of available process heat. The following methodology was used to achieve the intended objectives of the study.
Investigation of relevant literature related to the energy balancing of sugar factories together with related theoretical aspects in energy usage in sugar processing.
Analysis of different arrangements of major processing steps where steam is used as process heat.
Selection of the layout of steam flow that allows maximum usage of process heat available in the process steam supplied to the process house.
Implement the most suitable option. Collection and analysis of operational data with the implementation of the proposed
system. Based on data, estimation of exhaust steam savings. Evaluation of the feasibility of the new system for long term operation of the plant.

16
3 LITERATURE REVIEW
3.1 Sugar production and cogeneration in Southeast Asia
In early days, most of the sugar factories were designed purposely with lower efficiency cogeneration systems in order to eliminate all the bagasse produced in the plant, as there was no possibility to sell excess electricity to the grid or sell the bagasse for other manufacturing process like paper, plywood etc. In the last 15 years, due to technological developments it has been possible to sell excess electricity to national grid [12].
The sugar mills use very low pressure cycle for cogeneration plant in Southeast Asia and they are inefficient. When considering some of the sugar mills every tone of sugar milling up to 40kWh electricity and up to 600kg of steam are consumed and 30kWh of electricity is produced. With cogeneration technologies up to 110-125kWh of electricity could be produced from one tone of sugar cane [12].
Figure 3-1 Sugar manufacturing process with co-generation plant [12]
One of the sugar milling groups in Thailand started to employ the first modern sugar cogeneration plant with 67bar steam cycle in 2004. There are two 41MW identical Cogeneration Plants in the sugar mill. Now, high pressure steam power plant of up to 110bar has come into the industry [12].
Multi fuel boilers are used in new cogeneration plants due to unavailability of bagasse during off season in the sugar industries. Wood waste, rice husk, sugar cane trash, cassava wastes etc. are widely used along with the bagasse as fuels for boilers. The most common technologies such as traveling gate system, vibrating gate systems are also used [12].

17
Table 3-1 shows the variation of steam production, power production and bagasse requirement with steam pressure and steam temperature in each bagasse fired steam power plant. Power generation per Ton of bagasse was increasing with increase working pressure and temperature in each steam cycle. Bagasse requirement per one megawatt hour power production was decreased with increasing working pressure and temperature of steam cycle [12].
Table 3.1 Power generation, steam production and bagasse requirement with boiler pressure and variation
Power generation and steam production from bagasse Steam Steam
production(Ton) for Ton of bagasse
Power generation (KW) for Ton of bagasse
Bagasse required (Ton/MWh)
Sugar Mill No
Pressure (bar)
Temperature (°C)
1 21 340 2.50 227.3 4.5
2 32 380 2.43 286.0 3.5
3 42 400 2.40 313.0 3.2
4 45 440 2.33 328.0 3.0
5 67 480 2.27 378.0 2.6
6 87 510 2.24 401.0 2.5
7 110 535 2.21 427.0 2.3

18
3.2 Steam economy and cogeneration in cane sugar factories
According to Ogden et al. [5] most cane sugar factories had been designed with the following conditions in early days:
Sugar as the primary product Energy self–sufficient Medium pressure (15 bar – 20 bar) Small steam turbines Generated all the electricity and steam requirement for the factory Boiler has been designed to somewhat inefficient. Because prevent the excess
bagasse accumulate problem and disposal problem.
When growing number of sugar factories are manufacturing one or more by products from sugar cane like molasses and electricity, electricity is supplied to main grid from excess power from sugar factory. Alcohol is generated by using molasses [5].
A certain amount of energy was required to manufacture by product of sugar cane. Therefore energy efficiency of sugar factory can become much more important. Some implication of energy efficiency improvements were discussed for raw sugar factory with cogeneration system. Two type of bagasse fired cogeneration system were discussed [5].
High pressure condensing extraction steam turbine system Steam injected gas turbine run on gasified bagasse.
The following sections provide an overview of four major sugar mill configurations found worldwide, presented in order of increasing heat recovery complexity.

19
3.2.1 CONVENTIONAL RAW SUGAR FACTORY BASE ON THE MONYMUSK FACTORY IN JAMICA (CASE 1)
Figure 3-2 shows the conventional raw sugar factory base on the Monymusk factory in Jamica. It is produced 157 Ton of mixed juiced per hour in the sugar mill and mixed juice temperature is 34 oC. It is produced 13.7 bar pressure and 250 oC temperature superheated steam in the boiler section. Turbo alternator is consumed 34.3 Ton/h and mill turbine is consumed 36.5 Ton/h of superheated steam. There is 4.2 Ton/h of steam loss from steam turbines and 1.9 Ton/h of steam loss from lines [5].
In this factory, exhaust steam is consumed 0.7 Ton/h for deaerator, 56.4 Ton/h for evaporator no 01 and 17 Ton/h for vacuum pan. Evaporator no 1 is generated 32.5 Ton/h of first vapour and it is consumed 27.2Ton/h for evaporator no 02, 5.3 Ton/h for heater no 03, 17 Ton/h for vacuum pan and 4 Ton/h for clear juice heater. Evaporator no 02 is generated 28.6Ton/h second vapour and it is consumed 6 Ton/h for juice heater no 02 and 22.6 Ton/h for evaporator no 03. Evaporator no 03 is generated 24.1 Ton/h of third vapour and it is consumed 8.8 Ton/h for heater no1 and 15.3 Ton/h for evaporator no 04.Finaly forth vapour is condensed by condenser and make syrup at brix 62 [5].
Figure 3-2 Conventional factory based on the Monymusk factory in Jamica [5]

20
3.2.2 CONVENTIONAL SUGAR FACTORY WITH CONDENSATE HEAT RECOVERY FOR JUICE HEATING (CASE 2)
Process steam requirement is calculated by using heat recovery from the condensate. Reduction of the overall heat demand is 405 kg/tc to 350 kg/tc. The heating surface area requirement is 979m2 for plate – and – gasket heat exchanger. Entrap electricity pretention is 600kw due to condensate heat recovery. The low pressure steam demand can be reduced by 4 to 12% [5].
Figure 3-3 shows that conventional sugar factory with condensate heat recovery for juice heating. In the sugar mill, 157 Ton/h of mixed juiced is produced with 34 oC temperature. In the boiler, 62.8 Ton/h of super-heated steam is produced with 13.7 bar pressure and 250 oC temperature. Turbo alternator, 34.3 Ton/h is consumed and mill turbine 36.5 Ton/h is consumed superheated steam. There is 4.2 Ton/h of steam loss from steam turbines and 1.9 Ton/h of steam loss from pipe lines [5].
In this factory, exhaust steam is used 0.7 Ton/h for deaerator, 56.4 Ton/h for evaporator no 01 and 17 Ton/h for vacuum pan. First vapour 45.9Ton/h is generated in evaporator no 1 and it is used 25Ton/h for evaporator no 02, 17 Ton/h for vacuum pan and 4 Ton/h for clear juice heater. Second vapour 24.3 Ton/h is is generated by evaporator no 02 and it is used for evaporator no 03. Third vapour 24.1 Ton/h is generated by evaporator no 03 and it is used for evaporator no 04. Fourth vapour is generated by evaporator no 04.Finaly forth vapour is condensed by condenser and deliver syrup at brix 62 from evaporator no 04. There is a possibility to heat mixed juice by using first vapour. Mixed juice temperature is increased 34 oC to 94 oC by absorbing heat from total condensate of evaporators and vacuum pan and condensate temperature is decreased 100 oC to 40 oC [5].
Figure 3-3 Conventional Factory with condensate heat recovery [5]

21
3.2.3 QUADRUPLE EFFECT FALLING FILM EVAPORATOR WITH CONDENSATE HEAT RECOVERY FOR JUICE HEATING (CASE 3)
Considering this case, Quadrupled effect falling film evaporator is installed. The juice heating is done by condensate. Reduction of medium pressure steam requirement is 313kg/Ton of sugar cane, 23% of steam can be saved by this arrangement. Saving amount of steam is large due to under pressure of the 1st two effects. Vapor is bled from 2nd effect rather than 1st effect. Vapor blending is not required for juice heaters. The area of evaporator and juice heater are 4800m2 and 970 m2. In this arrangement pay bare time is 7.2 years [5].
Figure 3-4 shows that quadruple effect falling film evaporator with condensate heat recovery for juice heating. In the sugar mill, 157 Ton/h of mixed juiced is produced with 34 oC temperature. In the boiler, 54.8 Ton/h of super-heated steam is produced with 13.7 bar pressure and 250 oC temperature. Usage of superheated steam for turbo alternator is 14.7 Ton/h and mill turbine is 40.7 Ton/h. There is 3.3 Ton/h of steam loss from steam turbines and 1.6 Ton/h of steam loss from pipe lines [5].
In this factory, exhaust steam is used 0.7 Ton/h for deaerator, 50.7 Ton/h for evaporator no 01.First vapour 40.1Ton/h is generated in evaporator no 1 and it is used for evaporator no 02. Second vapour 41.3 Ton/h is generated by evaporator no 02 and 15.4Ton/h is used for evaporator no 03 and 24 Ton/h is used for vacuum pan and 4 Ton/h is used for clear juice heater .Third vapour 17.0 Ton/h is generated by evaporator no 03 and it is used for evaporator no 04. Fourth vapour 20.4Ton/h is generated by evaporator no 04.Finaly forth vapour is condensed by condenser and deliver syrup from evaporator no 04. Mixed juice temperature is increased 34 oC to 102 oC by absorbing heat from total condensate of evaporators and vacuum pan and condensate temperature is decreased 116 oC to 40 oC [5].

22
Figure 3-4 Quadruple effect falling film evaporators with condensate heat recovery for juice heating [5]
3.2.4 QUADRUPLE EFFECT FALLING FILM EVAPORATOR WITH CONDENSATE JUICE HEATING AND CONTINUOUS VACUUM PANS (CASE 4)
In this arrangement quadruple effect falling film evaporator, condensate juice heater and continuous vacuum pan could be installed. The total area is 4800m2 in the evaporator and total area of primary mixed juice condensate heater is 378m2. Total reduction of steam requirement is 258kg/Ton of sugar cane, and 36% saving. The export electricity is increased 12% as compared with case 01. Payback time of this design is mention as around 5.5 years [5].
Figure 3-5 shows that quadruple effect falling film evaporator with condensate juice heating and continuous pans. In the sugar mill, 157 Ton/h of mixed juiced is produced with 34 oC temperature. In the boiler, 45.1 Ton/h of super-heated steam is produced with 13.7 bar pressure and 250 oC temperature. Usage of superheated steam for turbo alternator is 5.1 Ton/h and mill turbine is 40.7 Ton/h. There is 2.6 Ton/h of steam loss from steam turbines and 1.2 Ton/h of steam loss from pipe lines [5].

23
In this factory, exhaust steam is used 0.7 Ton/h for deaerator, 40.5 Ton/h for evaporator no 01.First vapour 33.1Ton/h is generated in evaporator no 1 and it is used for evaporator no 02. Second vapour 34.3 Ton/h is generated by evaporator no 02 and it is used for evaporator no 03.Therd vapour 36.2 Ton/h is generated by evaporator no 03 and 17 Ton/h is used for vacuum pan, 4 Ton/h is used for clear juice heater, 3.7 Ton/h is used for mixed juice heaters and 10.7 Ton/h is used for evaporator no 4. Fourth vapour 10.3 Ton/h is generated by evaporator no 04 and it is used for evaporator no5 .Finally fifth vapour is condensed by evaporator no 5 and it is condensed in condenser and deliver syrup from evaporator no 05. Mixed juice temperature is increased 34 oC to 90 oC by absorbing heat from total condensate of evaporators and vacuum pan and condensate temperature is decreased 117 oC to 40 oC [5].
Figure 3-5 Quadruple effect falling film evaporators with condensate juice heating and continuous pans [5]

24
3.3 Improving energy efficiency in sugar mills
The traditional factory is designed to balance fuel, minimize the supplementary coal and avoid generating excess bagasse. Active and efficient in-house energy management is a good way of improving energy efficiency in very low cost.
Following are the some of the practices help to achieve target.
Establishment of in-house energy management committees or group
Data collection for processes
Improved maintain ace practices
Review of operational efficiency
The following are some of process component improve energy efficiency [4].
3.3.1 MAKING USE OF LOWER GRADE VAPOURS FOR HEATING PURPOSES
Steam consumption within the mill processes can be reduced by using low grade vapour for heating purposes. The number of effect can be increased by increasing number of evaporator effect. The greater will be the steam economy. Quintuple effect evaporator is used in the present day mills [4].
Juice heaters and vacuum pans are heated by vapour bleeding from evaporators. Efforts have been taken to reduce steam consumption in the modem sugar mills. Steam or vapour demand is reduced by increasing the energy efficiency of the process. The efficiency can be improved by doing optimal design of the evaporator configuration. Maximum efficiency can be achieved zero vapour in the condenser and this achievement can be done by over concentrating the juice by heating to low grade vapour [4].
Figure 3-6 Evaporators [4]

25
The temperature and pressure should be increased to improve the steam condition. The more energy can be supplied to grid by improving the efficiency of the system. The tons of steam per tons of bagasse can be increased by increasing steam temperature more power can be produced for export [4].
Steam condition is needed to increased temperature 445 0C and pressure 4500kPa which are still maximum design condition in South Africa sugar factory. Mauritius and other countries are already in used high pressure and temperature in sugar plant. The high boiler pressure and temperature increased the efficiency of steam cycle. The different operating condition indicating that as the amount of steam produced per ton of bagasse increases and the amount of electrical power generated increases per ton of bagasse [4].
The crystallization pan is one of the most important areas to consider steam consumption in the sugar mills. More electricity can be produced to export by using low grad steam to operate crystallizer pans. Two processes of milling and diffusion can be used to juice extraction. These processes will be defending on various consideration of the particular factory. But experience shows that diffusion is significantly better. High pressure steam is required for mill extraction to full fill the power requirement for mill drivers. Advantages of diffusion extraction are process steam efficient; low maintain ace costs and mechanical reliability. The energy efficiency is improved by mud recycle, because evaporation load is reduced and heat losses are eliminated from mud filter [4].
After introduce mud recycle and diffuser make additional steam available and less exhaust steam required for sugar process .Continuous pans are characterized by constant boiling point and constant heating surface to volume ratio. But in the batch pan boiling temperature increases with rise in material level in the pan. As well as ratio of the heating surface and volume reduces the material level rises in the batch pans. The continuous fan is more economical because pan heated by low grad vapours .Automation is easy in continuous fan. And boiling tine can be reduced by automation [4].
3.3.2 IMPROVING BOILER EFFICIENCY
The boiler efficiency can be increased by efficient heat recovery and excess air control in the boiler. Boiler efficiency can be increased by adding heat recovery equipment like economizer and more surface area in the air heater. Every 10 0C of final gas temperature is reduced 1% of steam per tons of bagasse in the boiler. Due to modern improvement of the boiler achieved complete combustion with 27% excess air,4% oxygen level maintain in the flue gas.85% of efficiency in low calorific value on bagasse of 50% moisture. The net calorific value of bagasse depends on the moisture content of bagasse. The net calorific value of bagasse is 7670 kJ/kg at around 48% moisture [4].

26
3.3.3 REPLACEMENT OF STEAM DRIVEN MILL DRIVES WITH ELECTRIC DC MOTOR
Conventional sugar factory use single stage impulse type steam turbines to drive mills. These steam turbines efficiency around 25-30%.It is very low compare with modern multistage power turbine. These turbines are replaced by high efficient electrical DC motor. Power turbines are replaced by 65-70% efficient multistage steam turbine to generate electrical power. Additional electricity is supplied to main grid and earns extra revenue for sugar plant [4].

27
4 SUGAR MANUFACTURING PROCESS IN LANKA SUGAR INDUSRTIES LIMITED, PELWATTE
4.1 Description of sugar factory under study
Lanka Sugar Company (pvt) Ltd is located in Buttala in Monaragala District in the Uva province of Sri Lanka, about 225km from Colombo. It was incorporated on 1981 as Pelwatte Sugar Company Ltd. Raw material of sugar factory is sugar cane and the main product of the company is commercial sugar, and alcohol is produced as a by-product. Daily sugar cane consumption is around 3600 metric tons .During the financial year the company crushed 450000 metric tons of sugar cane. The total sugar production is around 40000 metric tons per year. Approximately 8.5 tons of sugar was produced from 100tons of sugar cane and this value is called “rendement” in the sugar industry
In the sugar factory, two numbers of supper heated water tube boilers are available with 45Ton/h of design capacity per one boiler, 28bar of working pressure and 3800 C of working temperatures. Shredder is use to fiberized the sugar cane and it is run by a steam turbine and its mechanical output is 430kW. Sugar factory is self-sufficient with electricity; it is generated around 3.2MW electricity power by 1.6MW capacity two numbers of steam turbine. Sugar Mills are powered by 4 numbers of steam turbines. Four numbers of mills tandem use to extract juice from sugar cane. Capacity of each steam turbine is 430kW.Feed water pump is also powered by steam turbine during operation of the boilers.
Exhaust steam is generated with 1.5bar pressure from the mill turbines, the shredder turbine, the feed water turbine and power turbine. This is not enough to full fill the heating requirement in the process house. Therefore supplementary low pressure steam required to generate from the superheated steam directly obtained from the boilers and mixed with hot water. Therefore, the heating system should be optimized to improve the sugar making process.
Table 4.1-1 Present steam distribution in Lanka Sugar Company (pvt) Ltd
Therefore, this project focused on the analysis of energy utilization of sugar plant and the performance of the co-generation system, and thereby improving the overall plant efficiency.
Description Steam amount(Ton/h)
Distillery 8
Power Turbine 45
Mill Turbine 18
Shredder Turbine 4.5
Steam Losses(3% of total) 2.3
Total Steam generation from Boiler 77.8
Total exhaust steam generation 65.5

28
Flow diagram and outline of manufacturing process of the plant studied are given in Figure 4-1.
The present system of sugar manufacture can be divided into following stages.
1. Cane preparation 2. Extraction 3. Clarification of juice 4. Evaporation 5. Crystallization-Pan Boiling 6. Centrifuge 7. Storage

29
Figure 4-1 Sugar manufacturing process flow chart

30
4.1.1 CANE PREPARATION
There are two feeder tables and two unsolders available in the sugar feeding system in Lanka Sugar Industries Limited, Pelwtta, Sri Lanka. The sugar cane is loaded into both feeder tables by both unsolder and a ramp. Sugar cane in the cane carrier is very tangled. It should be cut, volume reduced and open up the sugar rich juice cells. This process is called preparation of the cane and is done by two sets of rotating knives and one set of rotating hammers. Preparation of sugar cane is critical for successful sugar extraction during the sugar milling.
4.1.2 EXTRACTION
Sugar cane received at the factory is weighed and fed into auxiliary cane carrier by two unloading machines and two feeder tables. The cane is prepared for crushing during its travel to mill.
The preparation device consists of a kicker in each feeder table, two cutters and a shredder. First cutter consists of 32 numbers of knives and second cutter consists of 64 numbers of knives. The both cutter knives rotate at 750rpm for cutting the crane traveling on the carrier.
The cut cane is delivered to the shredder for final preparation before the mill. The quality of cane prepared has a very significant effect to the mill capacity and maximum extraction. The mill plant consists of three rollers which are hydraulically loaded and each of one has a guide roller. The prepared cane passes through these mills with repeated application of high pressure. The processed sugar cane is discharged from the last mill and sent to the boiler to be used as a fuel. Mixed juice is collected in sand extractor to separate sand and juice. This sand free juice is then pumped to the process house for sugar making process.
Hot water is used in the mill to increase the extraction of sugar. Hot water is spread over the blanket of cane before the last mill. The diluted juice from this mill is spread on the blanket to the just out of 2nd mill. Juice from 3rd mill is spread on the blanket to the just out of 1st mill. Hence, the hot water system gives a counter current process of milling to improve the extraction of sugar.
Average amount of extraction is around 92%. The bagasse from last mill contains on average 34% fiber, 2.5% sugar and 50% moisture. The bagasse is discharged to boiler furnace for burning. Heat is utilized to generate superheated steam at 28 bar pressure and 380 0C temperatures. The super-heated steam is used for generation of electric power, drive mill turbine and shredder turbine. The exhaust steam from turbines is utilized for process heating and evaporation.

31
4.1.3 CLARIFICATION OF JUICE
Juice extracted from 1st mill is called 1st expressed juice. And juice extracted from 2nd mill is called 2nd expressed juice. Both of juices are combined and go through the rotary screen filter to separate bagasse particles. This clear juice is collected in the sand extractor to separate sand. This clear juice is called mixed juice. The mixed juice is a sugar solution; it consists of 85 percent water, 12 percent sucrose and 3 percent non-sugar. Its pH range is from 4.7 to 5.7. In this pH, the juice is prone to microbial and chemical inversion. Therefore, the process should be done as soon as possible to prevent the loss of crystal liable sugar.
Large amount of sucrose lost in final molasses due to low purity of juice. The impurities can be removed by clarification treatment.
Lime is applied to neutralize the juice. Flocculants is added before the clarifier to settle down mud in the clarifier. Off flow juice from clarifier is called clear juice or clarifier juice. Mud is extracted from bottom of the trace in clarifier. Mud mixed with bagacillo and sends to vacuum filters to separate mud and juice. This separated juice send to mixed juice tank and filter mud is send to sugar cane field use as fertilizer.
4.1.4 EVAPORATION
Figure 4-2 [9] is shown that evaporators system. The clear juice or clarifier juice contains water and sucrose together. The clear juice is about 100 percent on cane with 12 percent brix. The clear juice is pumped to the first evaporator through pre-heater. The function of the pre-heater is to raise the temperature of clear juice to boiling point temperature in first vessel.
Figure 4-2 Evaporators

32
The evaporation carried out in quintuple effect evaporators with single vapor cells. The all sells are vertical tube evaporator based on Rillieux’s principles. The exhaust steam is admitted in the calandria of the first vessel. Its latent heat is absorbed to the juice inside the vertical tube and gets condensed. The condensates are continuously removed and fresh exhaust steam intake continuously. The juice intake tube is already at boiling point, absorbs the latent heat from exhaust steam and evaporates water in the juice. The vapor thus liberated by the boiling juice passes through pipe into calandria of next vessel and juice is evaporated to the second time. The process is repeated in subsequent vessel generally. The vapor space of quintuple effect is connected to the multi jet condenser. The vapor are condensed mix with cold water. The non-condensable gasses are removed under vacuum the calandria to save condensers.
The condensate of the first calandria is free from the sugar traces and has higher temperature. It is sent to the boiler feed water tank through the pump. And the condensate of the second calandria is also low in sugar traces. Therefore it is also send to the boiler feed water tank. But regularly check for sugar traces of the condensate by laboratory. The condensate 2nd, 3rd, 4th and 5th calandria are removed by pump through equalizing system. These calandria works under vacuum. The 3rd, 4th 5th condensates are used for mills and sugar making process. The high density syrup is being accumulated in the last vessel. It is evacuated under vacuum by a pump. And it is sent to the storage tank.

33
4.1.5 CRYSTALLIZATION-PAN BOILING
Figure 4-3 [9] is shown that crystallization-pan boiling system. The syrup is subjected to boiling in the vacuum pans. Its concentration leads to the super saturation and formation of sugar crystals. A three stage boiling scheme is available in pan station and it is fully automated.
Massecuite A, B, C are after boiling in the pans treated in the crystallizers.
Figure 4-3 Crystallization-Pan Boiling
4.1.6 CENTRIFUGING
The curing of A, B, C Massecuite is done in centrifugal machine to separate molasses from sugar crystal. The curing of A Massecuite is done in vertical batch type machines with automated. The sugar in the basket is washed with hot water and steam. During this continuous operation, A Massecuite is separated into A sugar and A molasses. A sugar is called the commercial sugar.

34
Figure 4-4 Boiling Scheme

35
B Massecuite is cured in vertical continuous low grad centrifugal machine. B Massecuite is separated into B sugar and B molasses.
C Massecuite is also cured in continuous centrifugal machines. C Massecuite is separated in to C sugar and C molasses. C molasses is called final molasses. C sugar is melt and used for A and B boiling. B sugar is melt and used for A boiling.
4.1.7 SUGAR DRYING AND STORAGE
Sugar drying is done by continuous type horizontal drier. Its air is heated by exhaust steam.
The sugar packed in 50kg a twill gunny bags. The sugar packing is done semi-automated machine.

36
5 ENERGY CONSERVATION AND UTILIZATION
Lanka sugar company (pvt) ltd, Pelwatte represents one of the most important economic sectors in Sri Lanka and ethanol is produced for local markets. Thermal and electrical energy are produced by using sugar cane bagasse as a fuel in cogeneration plant for the own factory consumption. This sugar factory is self-sufficient in thermal, mechanical and electrical energy during the crushing season. The steam power plant is operating at 28bar pressure, 380 0C temperatures, 90Ton per hour with super-heated steam. In this section to be estimated exhaust steam generation in the sugar factory and exhaust steam requirement for each options.

37
Figure 5-1 Process house steam balance in sugar factory

38
5.1 Estimation of total exhaust steam generation
ANALYSIS OF STEAM DISTRIBUTION IN EVAPORATORS AND HEATERS
Firstly amount of water to be evaporated from the juice in evaporators are estimated as follows.
EMJ100
1B
B………………………………5
M 150 , B 12 % ,B 65 % , J 95 %
E 116.19Tonh
5.2 Estimation of pressure drop in evaporators and exhaust steam requirement for evaporators and heater
Exhaustpressure 2.5 ,Lastbodypressure 0.23
Therefore
Totalpressuredrop 2.5 0.23 2.27bar
Therefore
pressuredropineachvessel2.275
bar 0.454 bar
Table 5.2-1 Distribution of pressure drop in each vessel as follows
Description ExhaustSteam
Vapor 1st 2nd 3rd 4th 5th
Pressure 2.5 2.046 1.592 1.138 0.684 0.23
Temperature 127.41 120.93 113.15 103.26 89.32 63.11
Boiling point elevation - 0.38 0.63 0.91 1.33 2.45
Boiling Point Temperature in juice - 118.98 109.63 98.355 80.045 62.45

39
The 1st vapor is used for pan boiling and steam requirement for pan floor is say approximately 23 per cent cane.
Therefore 1st vapor requirement for pan,P
P23100
∗ 150Tnh
34.5Tnh
5.3 Estimation of quantity of vapor or exhaust steam requirement for juice heating
Table 5.3-1 Specific heat capacity of juice
Temperature Brix % Purity % Specific Heat Capacity(kJ/kgK) 30 12 78 3.90 40 12 78 3.91 50 12 78 3.92 62.5 12 78 3.94 75 12 78 3.94 90 12 78 3.95 105 12 78 3.97
Considering option no 04
3rd body vapors are used for primary heating from 30C to 50C
Q150 ∗ 3.91 ∗ 50 30
2260.1L5.19tonse/h
1st body vapors are used for secondary heating from 50C to 75C
Q150 ∗ 3.93 ∗ 75 50
2229.156.691
1st body vapors are used for final heating from 75C to 105C
Q∗ . ∗
.8.07tonse/h

40
5.4 Estimation of individual evaporation in each vessel
E 64.26Tnh, E 15.46
Tnh, E 15.46
Tnh, E 10.27
Tnh, E 10.27Tn/h
5.5 Estimation of juice brix from each vessel
Inlet juice Brix to 1st body is B
Outlet juice Brix of each body is BX
BX 22.59, BX 28.20, BX 37.54, BX 47.59,BX 65
5.6 Estimate of the specific evaporation rate according to Dessin formula in each vessel
C 6.073kgm h
, C 4.819kgm h
, C 3.692kgm h
, C 2.495kgm h
, C 1.08kg/m h
5.7 Estimate of heating surface area of individual evaporator vessel
S 1328m ,S 352.2m ,S 392.6m ,S 226.5m ,S 583.7m
5.8 Estimate of Total exhaust steam requirement
Totalexhauststeamrequirement E 64.72Tn/h
Total exhaust steam generation was equal to steam consumption of turbines and it can be calculated as follows
Table 5.8-1 Estimation of total exhaust steam generation
Turbine Exhaust steam generation per one(Ton/h)
Number of turbine Total Steam Generation per each type of turbine(Ton)
Power Turbine 22.5 2 45
Mill Turbine 4.5 4 18
Shredder Turbine 4.5 1 4.5
Total exhaust steam generation
67.5
41
Assume 3% loss of the exhaust steam from turbine station to process from drain traps and use for exhaust steam for sugar driers, centrifugal machines and heat massecuite lines.
Totalexhauststeamgeneration 67.5 ∗97100
65.475Ton/h
5.9 Results from EES
In following tables are shown that total exhaust steam requirement for each option and way of exhaust steam and vapour usage.
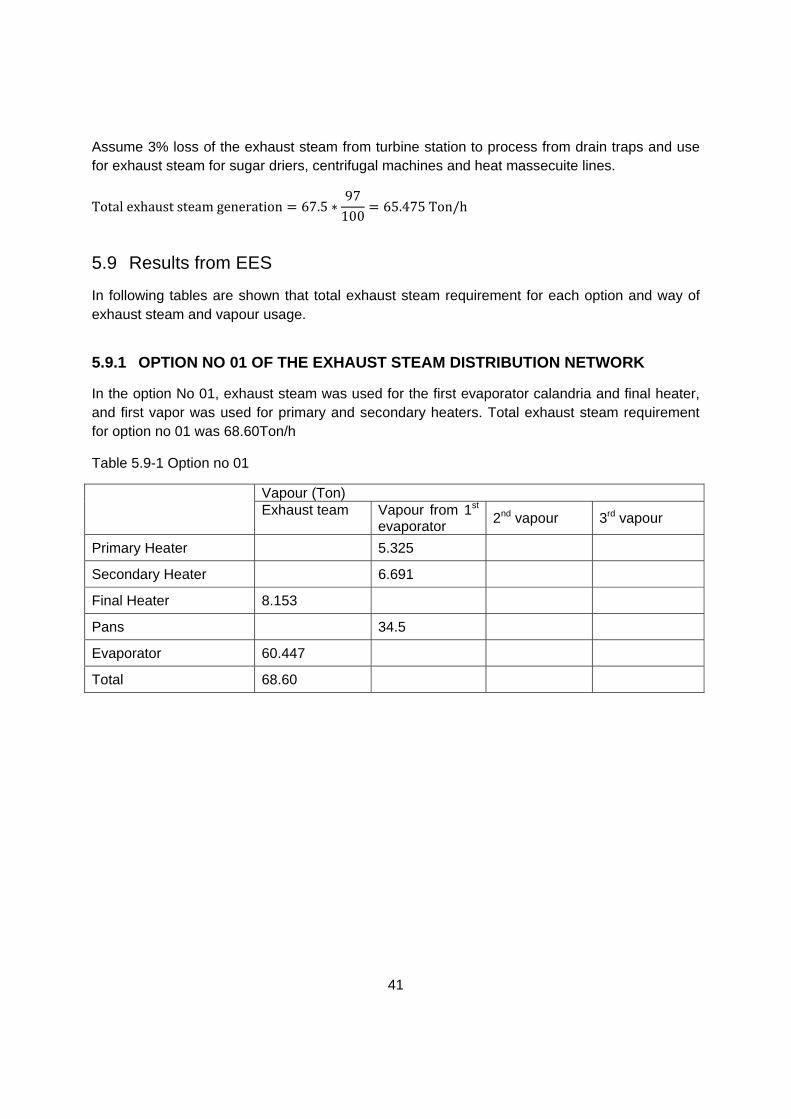
5.9.1 OPTION NO 01 OF THE EXHAUST STEAM DISTRIBUTION NETWORK
In the option No 01, exhaust steam was used for the first evaporator calandria and final heater, and first vapor was used for primary and secondary heaters. Total exhaust steam requirement for option no 01 was 68.60Ton/h
Table 5.9-1 Option no 01
Vapour (Ton) Exhaust team
Vapour from 1st evaporator
2nd vapour 3rd vapour
Primary Heater 5.325
Secondary Heater 6.691
Final Heater 8.153
Pans 34.5
Evaporator 60.447
Total 68.60

42
5.9.2 OPTION NO 02 OF THE EXHAUST STEAM DISTRIBUTION NETWORK
In the option no 02, exhaust steam was used for the first evaporator calandria and final juice heater, first vapour used for pan boilers, secondary juice heaters, and primary juice heater. Total exhaust steam requirement for option no 02 was 67.50Ton/h
Table 5.9-2 Option no 02
Exhaust steam(Ton) 1st vapour(Ton)
2nd vapour(Ton) 3rd vapour (Ton)
Primary Heater 5.262
Secondary Heater 6.691
Final Heater 8.153
Pans 34.5
Evaporator 59.347
Total 67.50
5.9.3 OPTION NO 03 OF THE EXHAUST STEAM DISTRIBUTION
In the option no 03, exhaust steam used only for first evaporator calandria. First vapor used for secondary juice heater and final juice heater. Second vapor used for primary juice heater. Total exhaust steam requirement for this option was 65.8Ton/h.
Table 5.9-3 Option no 03
Exhaust steam(Ton)
1st vapour(Ton)
2nd vapour(Ton)
3rd vapour (Ton)
Primary Heater 5.262
Secondary Heater 6.691
Final Heater 8.07
Pans 34.5
Evaporator 65.8
Total 65.8

43
5.9.4 OPTION NO 03 OF THE EXHAUST STEAM DISTRIBUTION
In the option no 03 exhaust steam used for evaporator calandria. First vapor used for pan boilers, final juice heater and secondary juice heater. Third vapor is used for primary juice heater. Total exhaust steam requirement for this option was 64.72Ton/h.
Table 5.9-4 Option no 04
Exhaust steam(Ton) 1st vapour(Ton)
2nd vapour(Ton) 3rd vapour (Ton)
Primary Heater 5.19 Secondary Heater
6.691
Final Heater 8.07 Pans 34.5
Evaporator 64.72 Total 64.72
5.9.5 OPTION NO 05 OF THE EXHAUST STEAM DISTRIBUTION
In the option no o5 exhaust steam used for first evaporator calandria. First vapor use for the pan boilers and final juice heater. Second vapor was used for secondary juice heater. Third vapor used for primary juice heater. Total exhaust steam consumption was 63,34Ton/h.
Table 5.9-5 Option no 05
Exhaust steam(Ton)
1st vapour(Ton)
2nd vapour(Ton) 3rd vapour (Ton)
Primary Heater 5.1
Secondary Heater
6.611
Final Heater 8.07
Pans 34.5 Evaporator 63.34
Total 63.34

44
5.9.6 SUMMARY OF ALL THE OPTION OF EXHAUST STEAM DISTRIBUTION NETWORK
Following table included the summary of the exhaust steam requirement for each option of exhaust steam distribution network.
Table 5.9-6 Summary of all the option
Option No
Exhaust Steam
1st Vapor 2nd vapor 3rd vapor Exhaust steam Requirement(Ton/h)
01 Secondary Heater Final Heater
Primary Heater
- - 68.60
02 Final Heater
Primary Heater Secondary Heater
- - 67.50
03 Final Heater Secondary Heater
Primary Heater
- 65.80
04 - Secondary Heater Final Heater
Primary Heater
- 64.72
05 - Final Heater Secondary Heater
Primary Heater
63.34
5.9.7 SUMMARY OF EXHAUST STEAM REQUIREMENT AND GENERATION
In this table included required exhaust steam amount of each option of the exhaust steam distribution network and amount of exhaust steam generation.
Table 5.9-7 Summary of the exhaust steam requirement and generation
Option Number Total Exhaust steam Required(Ton/h)
Total Exhaust steam generate(Ton/h)
01 68.60
65.475
02 67.50
03 65.80
04 64.72
05 63.34

45
5.10 Calculation of exhaust steam reduction
Assume crushing rate is 150Tn/h. Select option is option no 05.
Whenconsideringcurshingrateof150Ton/h
ExhaustteamrequirementforPresantmethod 68.60Ton/h
Exhauststeamrequirementforproposedmethod 63.34Ton/h
Thereforeexhauststeamreductionduetonewmethod 68.60 63.34 X100/68.60
Thereforeexhauststeamreductionduetoimplementmethod 7.67%

46
6 SUMMARY OF OPERATIONAL DATA
6.1 Summary of operational data on year 2012
Following table shows that summery of operational data on 10 days July 2012.It is included summary of average crushing rate, boiler steam pressure, exhaust steam pressure, vapour pressure, syrup brix and mill stoppages due to juice accumulation and other.
Table 6.1-1 Summary of Operational data on 10 days July 2012
Day
Cru
shin
g ra
te(T
on/h
)
Ste
am
F
low
ra
te(T
on/h
)
Steam Pressure (bar)
Vapour Pressure (bar)
Syr
up B
rix
Mill stoppages (Minute)
Boi
ler
Exh
aus t
Firs
t
Sec
ond
Thi
rd
Juic
e
acc
umul
atio
n
Oth
er
1 135.2 67.3 28.0 1.4 0.9 0.4 -0.1 63.1 1.5 4.0
2 120.2 64.8 28.0 1.4 0.9 0.4 -0.1 63.5 3.1 2.4
3 124.5 63.9 27.6 1.4 0.9 0.4 -0.1 60.3 3.0 6.0
4 130.6 66.4 27.5 1.4 0.8 0.4 -0.1 59.3 2.8 3.3
5 130.6 66.1 27.7 1.4 0.8 0.4 -0.1 62.3 3.1 5.0
6 126.7 67.3 27.5 1.4 0.9 0.4 -0.1 64.0 4.3 6.2
7 122.1 68.7 27.7 1.4 0.9 0.4 -0.1 60.5 2.9 9.0
8 129.8 67.5 27.6 1.4 0.8 0.4 -0.1 61.6 4.2 2.0
9 128.9 68.0 27.7 1.4 0.9 0.4 -0.1 62.6 3.1 3.3
10 132.9 66.2 27.6 1.4 0.9 0.4 -0.1 60.0 2.1 3.2
Average 127.6 66.7 27.7 1.4 0.9 0.4 -0.1 61.9 3.1 4.6

47
6.2 Summary of operational data on year 2013
Following table shows that summery of operational data on 10 days July 2013.It is included summary of avarage crushing rate, boiler steam pressure, exhaust steam pressure, vapour pressure, syrup brix and mill stoppages due to juice accumulation and other.
Table 6.2-1 Summary of Operational data on 10 days July 2013
Hour
Cru
shin
g r
ate
(Ton
/h)
Ste
am
F
low
ra
te(T
on/h
)
Steam Pressure (bar)
Vapor Pressure (bar)
Syr
up B
rix
Mill stoppages (Minute)
Boi
ler
Exh
aust
Firs
t
Sec
ond
Thi
rd
Juic
e ac
cum
ulat
ion
Oth
er
1 132.3 66.2 28.0 1.5 0.9 0.4 -0.1 64.4 0.3 7.3
2 121.2 63.5 28.0 1.5 0.9 0.4 -0.1 64.4 0.2 10.2
3 124.3 63.0 28.0 1.5 0.9 0.4 -0.1 61.0 0.2 8.3
4 131.2 166.4 28.0 1.5 0.9 0.4 -0.1 59.5 0.2 4.8
5 124.0 65.6 27.9 1.4 0.9 0.4 -0.1 64.6 0.2 9.1
6 131.6 67.0 27.5 1.4 0.9 0.4 -0.1 64.0 0.0 6.5
7 133.6 68.0 27.7 1.4 0.9 0.4 -0.1 60.3 0.0 5.9
8 145.7 67.0 28.0 1.5 0.9 0.4 -0.1 62.2 0.0 1.9
9 144.3 67.6 27.3 1.4 0.9 0.4 -0.1 59.7 0.0 2.8
10 136.6 66.3 26.8 1.5 0.9 0.4 -0.1 63.6 0.0 5.2
Average 132.0 77.1 27.8 1.5 0.9 0.4 -0.1 62.2 0.1 6.3

48
6.3 Analyzing of operational data
6.3.1 AVERAGE VALUE OF OPERATIONAL DATA IN YEAR 2012 AND YEAR 2013
Following table shows that average operational data in year 2012 and year 2013.Compare with operational data in both years, exhaust steam pressure is maintained 1.5bar in year 2013 and mill stoppages is reduced in year 2013.
Table 6.3-1 Average value of operation data
Year
Cru
shin
g ra
te(T
on
/h)
Ste
am
Flo
w
rate
(Ton
/h)
Steam Pressure (bar)
Vapor Pressure (bar)
Syr
up B
rix
Mill stoppages (Minute)
Boi
ler
Exh
aust
Fir
st
Sec
ond
Thi
rd
Juic
e ac
cum
ula
tion O
ther
2013 132.0 66.0 27.8 1.5 0.9 0.4 -0.1 62.2 0.1 6.3
2012 127.6 66.7 27.7 1.4 0.9 0.4 -0.1 61.9 3.1 4.6
6.3.1.1 Average crushing rate in year 2012 and 2013
Figure 8-1 Average crushing rate in year 2012 and 2013
Figure 8-1 shows that average crushing rate was increased by 3.45 % in year 2013 compare with the year 2012.
0
20
40
60
80
100
120
140
year 2012 Year 2013
Average Crushing Rate(Ton/h)
Average CrushingRate(Ton/h)

49
6.3.1.2 Average steam flow rate in year 2012 and 2013
Figure 8-2 Average steam flow rate in year 2012 and 2013
Figure 8-2 shows that average steam flow rate was reduced slightly (1.05 %) in year 2013 compare with the year 2012.
6.3.1.3 Average boiler pressure in year 2012 and 2103
Figure 8-3 Average boiler pressure in year 2012 and 2013
Figure 8-2 shows that average boiler pressure was largely kept constant (0.36 % increase) in year 2013 compare with the year 2012.
0
20
40
60
80
year 2012 Year 2013
Average Steam Flow Rate (Ton/h)
Average Steam Flow Rate(Ton/h)
0
5
10
15
20
25
30
year 2012 Year 2013
Average Boiler Presure (bar)
Average BoilerPresure (bar)

50
6.3.1.4 Average exhaust steam pressure in year 2012 and 2013
Figure 8-4 Average exhaust steam pressure in year 2012 and 2013
Figure 8-2 shows that average exhaust steam pressure was increased 1.05 % in year 2013 compare with the year 2012.
6.3.1.5 Average mill stoppage due to juice accumulation in 2012 and 2013
Figure 8-5 Average mill stoppage due to juice accumulation in year 2012 and 2013
Figure 8-2 shows that average mill stoppage due to juice accumulation was nearly eliminated in year 2013 compare with the year 2012.
0,0
0,2
0,4
0,6
0,8
1,0
1,2
1,4
1,6
year 2012 Year 2013
Average Exhaust Steam Presure (bar)
Average Exhaust SteamPresure (bar)
0,00,20,40,60,81,01,21,41,61,82,0
year 2012 Year 2013
Average Mill Stopage Due to Juice Accumulation (Minute)
Average Mill Stopage Due toJuice Accumulation (Minute)

51
7 DISCUSSION AND CONCLUSION
Considering option no 01, Option no 02 and Option no 03 exhaust steam generation is less than exhaust steam requirement for the process house heating. Therefore these arrangements are not success.
Considering options no 04 and options no 05, exhaust steam generation is higher than requirement. Therefore both of these two options could be taken as success.
If exhaust steam pressure cannot be maintained 1.5bar, sugar making process will be delayed and sugar losses will be increased. Therefore energy balance in process house is very important.
When considering existing steam distribution network in the process house, exhaust steam was used for final heater and first vapor was used for the primary heater and secondary heater. Exhaust steam requirement for the process heating was 68.60Ton/h and exhaust steam generation by turbines was 65.48Ton/h. Therefore, 3.12Ton/h of excess exhaust steam was required to fulfill the heating requirement. This rest of exhaust steam should be generated from live steam by the de-superheated station.
When considering above all the option of steam distribution network, most suitable option was option no 05 compare with exhaust steam generation and exhaust steam requirement.
In the existing exhaust steam distribution network, there was possibility to take first vapor to both secondary and final heater. But there was no possibility to deliver second vapor to secondary heater and third vapor to the primary heater.
When selecting option no 05, two vapour lines should be newly fabricated from secondary vapor from evaporator no 02 to secondary heaters and third vapour from evaporator no 3 to primary heater.
Compared with both option 04 and option 05, most effective one was option no 05.Therefore finally, option no 5 was proposed to improve energy efficiency of the steam distribution network in the process house. When introducing this system, 7.67% exhaust steam usage can be reduced compare with present steam distribution network.
During shut down period in November 2012 to February 2013, fabricated new vapor line from 3rd evaporator to primary heater and 2nd evaporator to the secondary heater. In this system first vapor is used for final heater, 2nd vapor used for the secondary heater and 3rd vapor used for primary heater.
Performance was checked during operation in 2013 by using operation parameter of the sugar factory. Considering analyze operation data in year 2013 compare with the year 2012 average crushing rate was increased 3.45 %, average steam flow rate was reduced 1.05 % average boiler pressure was increased 0.36 %, average exhaust steam pressure was increased 1.05 %, number of mill stoppages due to juice accumulation was reduced by around half.

52
According to the operational parameters, absolute exhaust steam pressure was constant of 1.5 bars in average values. Final syrup brix is also maintained in required range of the brix. Boiler pressure was also maintained in constant level of 28bar.Vapour pressures of each evaporator are maintained in required level.
When considering operational parameters, this project is success. Therefore sugar factory can run efficiently without juice accumulation in the process house and maximum sugar can be absorbed in the process house during operation in the future.

53
8 REFERENCES
[1] Mangle Sing (1998) “Training Manual for Sugar Mills”
Somaiya Publications Pvt. LTD, MUMBAI, Delhi.
[2 ] E.HUGOT (1972) HANDBOOK OF SUGAR ENGINEERING (2nd completely rev.ed) G.H.JENKINS and M.Sc.App (Translated French to English) ELSEVIER SCIENTIFIC PUBLISHING COMPANY, AMSTERDAM, QXPORD, NEW YORK
[3] Joan M.Ogdgen, Simon Hochreb and Michael Hylton “Steam economy and cogeneration in cane sugar factories” Retrieved (20.12.2012) from https://www.google.lk/url?sa=t&rct=j&q=&esrc=s&source=web&cd=1&cad=rja&uact=8&ved=0ahUKEwi7nbDmq8PRAhVMQo8KHQv_CJoQFggYMAA&url=http%3A%2F%2Facee.princeton.edu%2Fwp-content%2Fuploads%2F2016%2F10%2FInternational-Sugar-Journal.pdf&usg=AFQjCNGhguzo2-KiSLdnCWABf_Db4SNUdQ&sig2=fhVqWFgtOLPu13AwLupWQA&bvm=bv.144224172,d.c2I
[4] Charles Mbohwa (2013)
“Energy Management in South African Sugar Industry” Proceeding of the World Congress on Engineering 2013 Vol Ι, WCE 2013, July 3-5, 2013, London, UK.
[5] Joan M.Ogden, Simone Hochgreb and Michael Hylton
“Steam economy and cogeneration in cane sugar factories”
[6] S.P.Nangare (Assistant Professor) and R.S.Kulkarni (Associate Professor) “THEORETICAL ANALYSIS OF ENERGY UTILIZATION MESURES THROUGH ENERGY AUDIT SUGAR INDUSTRY POWER PLANT” Department of Mechanical Engineering, Sanjeevan Engineering and Technology Institute, Panhala, 416201, India Retrieved (08.12.2012) from http:www.technicaljournalsonline.com/ijaers/VOL%20I/IJAERS%20VOL%20I%20ISSUE%20III%20APRIL%20JUNE%202012/150.pdf
[7] Jean-Luc Magalthaes
“Comparative analysis of sugar processing technology for environmental impact and efficiency” Five Cail, 22 rue du Carrousel-BP 10374, 59669 Villeneuve d, Ascq, France. Tel:+33(0)320 889 639 Email:[email protected] www.fivesgroup.com Retrieved (08.12.2012) from https://www.google.lk/url?sa=t&rct=j&q=&esrc=s&source=web&cd=2&cad=rja&uact=8&ved=0ahUKEwjN6Kvd1L_RAhWJrI8KHZl-BjYQ

54
[8] THE SUGAR ENGINEERS “Sugar Factory Definitions” Retrieved (25.12.2012) from http://www.sugartech.co.za/definitions/
[9] How Sugar is made an Introduction. Retrieved (20.12.2012) from http://www.sucrose.com
[10] Andrew R.Trenka HIGH EFFICIENT ELECTRICITY PRODUCTION IN THE SUGAR INDUSTRY OF THE FUTURE: THE PACIFIC INTERNATIONAL CENTER FOR HIGH TECHNOLOGY RESEARCH PROJECT (>6MWe)” Pacific International Center for High Technology Research 2800 Woodlawn Drive, Honolulu, Hawaii 96822 Retrieved (20.12.2012) from https://web.anl.gov/PCS/acsfuel/.../Files/40_3_CHICAGO_08-95_0662.pd
[11] Production Process
Retrieved (25.12.2012) from http://lankasugar.lk/pelwatte/index.php/product-process-main Pelwatte Sugar Industries PLC (n.d) In Wikipedia Retrieved (25.12.2012) from https://en.wikipedia.org/wiki/Pelwatte_Sugar_Industries_PLC
[12] Cogeneration from sugar cane
Retrieved (25.12.2012) from http://www.rcogenasia.com/
[13] Upananda Mohotti “Sugar production” Retrieved (25.12.2015) from http://www.sugarproductionsrilanka.blogspot.com
[14] The Sugar Engineers (Wayne Jayes)
“Enthalpy of factory sugar solutions” 5 Acacia, Crescent, Westbrook, Tongaat 4399, KZN, South Africa. Retrieved (27.12.2012) from http://www.sugartech.com/enthalpy/index.php
[15] W E G JAYES
“OPTIMUM DISTRIBUTION OF HEATING SURFACE IN A MULTIPLE EFFECT EVAPORATOR TRAIN” Booker Tate Limited, Masters Court, Church Road, Thames, OX9 3FA, England. E-mail:[email protected] Retrieved (27.12.2012) from http://citeseerx.ist.psu.edu/viewdoc/download?doi=10.1.1.381.4865&rep=rep1&type=pdf
[16] RUDUCTION OF VNASSE VOLUME BY THE EVAPORATORATION PROCESS
21st Brazilian Congress of Mechanical Engineering October 24-28, 2011, Natal, RN, Brazil
Retrieved (27.12.2012) from http://www.abcm.org.br/app/webroot/anais/cobem/2011/PDF/139902.pdf
[17] Bellows pressure sensors working principle
Retrieved (01.05.2016) from http://instrumentationtools.com/bellows-pressure-sensors-working-principle-animation/

55
[18] Bimetallic Thermometers Retrieved (01.05.2012) from http://automationwiki.com/index.php/Bimetallic_Thermometers
[19] Academic writing: Writing a list of references.
Retrieved (04.12.2016) from http://www.uefap.com/writing/referenc/reffram.htm
[20] “International Sugar Organization” Retrieved (18.0.2018) from https://www.isosugar.org/sugarsector/sugar
[21] Eyerusalem Brirru
Supervisors Professor Andrew Martin and Asst.Professor Catharina Erlich “Sugar Cane Industry Overview and Energy Efficiency Considerations” Literature Survey document (Report no 01/2016) Uplated March 2016 KTH School of Industrial Engineering and Management Department of Energy Technology Division of Heat and Power Technology SE-100 44 STOCKHOLM Retrieved (18.03.2018) from https://www.diva-portal.org/smash/get/diva2:905929/FULLTEXT02.pdf
[22] Introduction of Sugar Industry in Sri Lanka Retrieved (25.12.2012) from http://www.lankasugar.lk/index.php/sugar-introduction [23] Gal-Oya Plantation (Pvt) Limited Retrieved (18.03.2018) from http://www.galoya.lk/our_company.html

56
9 APPENDIX
9.1 EES Calculation
Figure 5 1 Diagram window of EES program
57
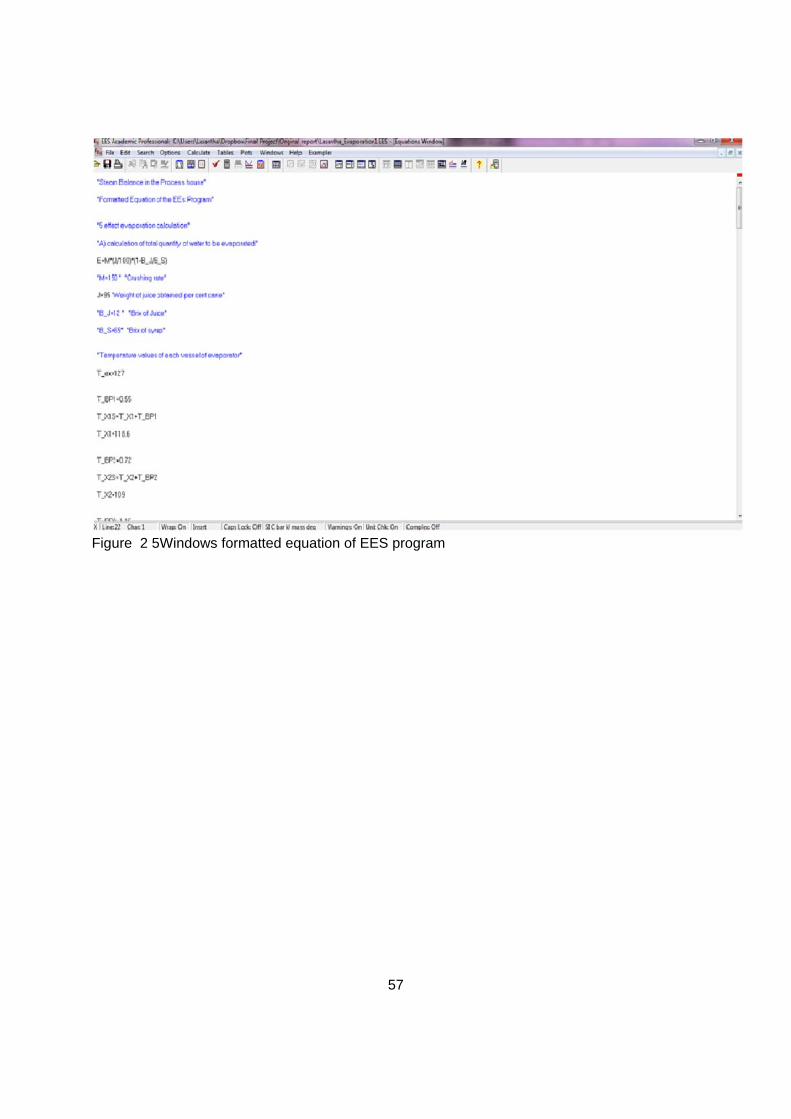
Figure 5 2 Windows formatted equation of EES program

58
Figure 5 3 Equation of EES program