improving assessment tools for california’s episodic streams · why we care non-perennial streams...
TRANSCRIPT
C H R I S S O L E K( E R I C S T E I N )
B I O L O G Y D E P T .
S O U T H E R N C A L I F O R N I A C O A S T A L W A T E R R E S E A R C H
P R O J E C T
Improving Assessment Tools for California’s Episodic
Streams1
CA Aquatic Bioassessment Workgroup, October 29, 2013

Long periods of boredom, brief moments of terrorErich Maria Remarque, All Quiet on the Western Front
2

TheIssue
~ 66% of CA’s streams characterized as non-perennial (intermittent, ephemeral)
Lots of stream-based monitoring, but most programs exclude non-perennial streams
Lack of appropriate maps, assessment tools, and indicators
Provides incomplete picture of overall watershed health
3
WhyWeCare
Non-perennial streams collectively drain large areas of land Important interface between land-use activities and
downstream impacts
Development in upstream non-perennial streams can have significant impacts in downstream perennial streams Implications for water quality, sediment, nutrients
Often support rich biotic communities in channel and surrounding riparian zone
Jurisdictional waterbodies (WoState, WoUS)

5
Typical flow duration
Long‐termGoal
???
PerennialEphemeral (episodic)Intermittent
~12 mos. 10 mos. 8 mos. 6 mos. 4 mos. 2 mo. < week
long-term non-perennial
short-term non-perennial

CurrentProject
Develop framework for a rapid assessment method for dryland ephemeral (episodic) channels Conceptual model of form and function Classification system (are multiple tools needed?)
Criteria for reference site identification
Recommend appropriate intensive indicators to validate rapid assessment method
6

ChallengesandConsiderations
Highly variable systems over space and time (episodic)
Difficult to discern “impacts” from patterns of natural disturbance
Subtle field indicators
“Biological” assessment tools & indicators may not be appropriate
7

ProjectConstructs
Use of CA Rapid Assessment Method (CRAM) as conceptual foundation for RAM Universal attributes of condition Many existing metrics also apply to episodic channels
Use of SWAMP reference site criteria
Adjust scale and indicators where necessary based on function of episodic channels
8
Strive for consistency with existing State program
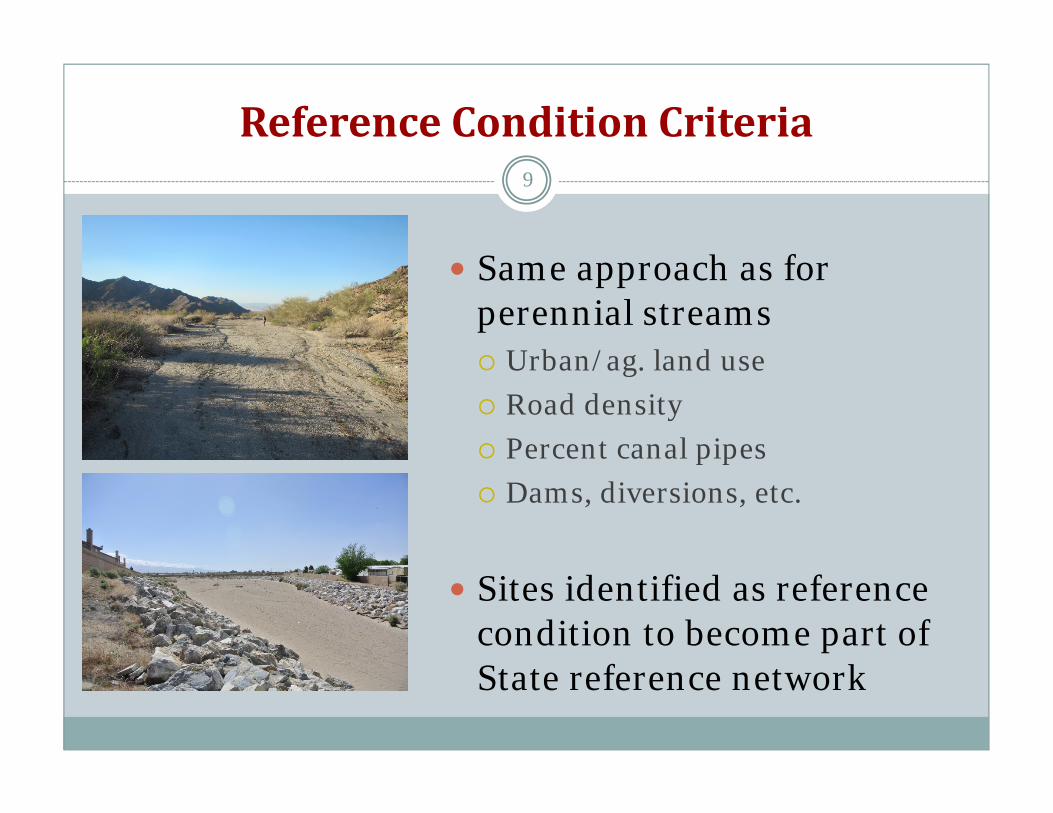
ReferenceConditionCriteria9
Same approach as for perennial streams Urban/ag. land use Road density Percent canal pipes Dams, diversions, etc.
Sites identified as reference condition to become part of State reference network

CRAMFramework
CRAM is comprised of four attributes
Each attribute is represented by 2-3 metrics, some of which have sub-metrics.
Landscape Context
Hydrology Physical Structure
Biotic Structure
= Overall (Index) Score
Wetland Condition

ClassificationofEpisodicChannels11
ValleyClass RelativePosition Substrate
ConfinedSource BedrockErosional Bedrockwithalluvium
ConfinedtoUnconfined
Erosional Incisedalluvium(arroyo)
Unconfined DepositionalSandbed (desertwash)Piedmontheadwater
(alluvialfan)

DefiningtheAssessmentArea(AA)
Traditional concepts may not always apply “Bankfull” channel Limits of riparian vegetation providing allochthonous input
Larger Assessment Areas (AAs) required for low gradient channels Account for larger floodplain areas
12

Example:DefiningtheAA13

MetricDevelopment14
ATTRIBUTES
BufferandLandscapeContext
Hydrology
Structure
Physical
PlantCommunity
METRICSStreamCorridorContinuityBuffer:PercentofAssessment Area withBufferAverageBufferWidthBufferCondition
WaterSourceChannelStabilityHydrologicConnectivityStructuralPatchRichnessTopographicComplexityNumberofPlantLayersPresentNumberofCo‐dominantPlantSpeciesPercentCo‐dominantPlant Species thatareInvasiveHorizontalInterspersionVerticalStructure
ATTRIBUTES METRICS
BufferandLandscapeContext
StreamCorridorContinuityBuffer:PercentofAssessment Area withBufferAverageBufferWidthBufferCondition
HydrologyWaterSourceChannelStabilityHydrologicConnectivity
Structure
Physical StructuralPatchRichnessTopographicComplexity
PlantCommunity
NumberofPlantLayersPresentNumberofCo‐dominantPlantSpeciesPercentCo‐dominantPlant Species thatareInvasiveHorizontalInterspersionVerticalStructure

ConsiderationsforPhysicalIndicators15
Episodic channels tend to be in dynamic flux, with indicators of aggradation and degradation co-occurring
Equilibrium indicators rarely achieved or differ from perennial streams
Reference condition sites for low gradient, depositional areas naturally tend toward aggradation

PhysicalPatchTypes16
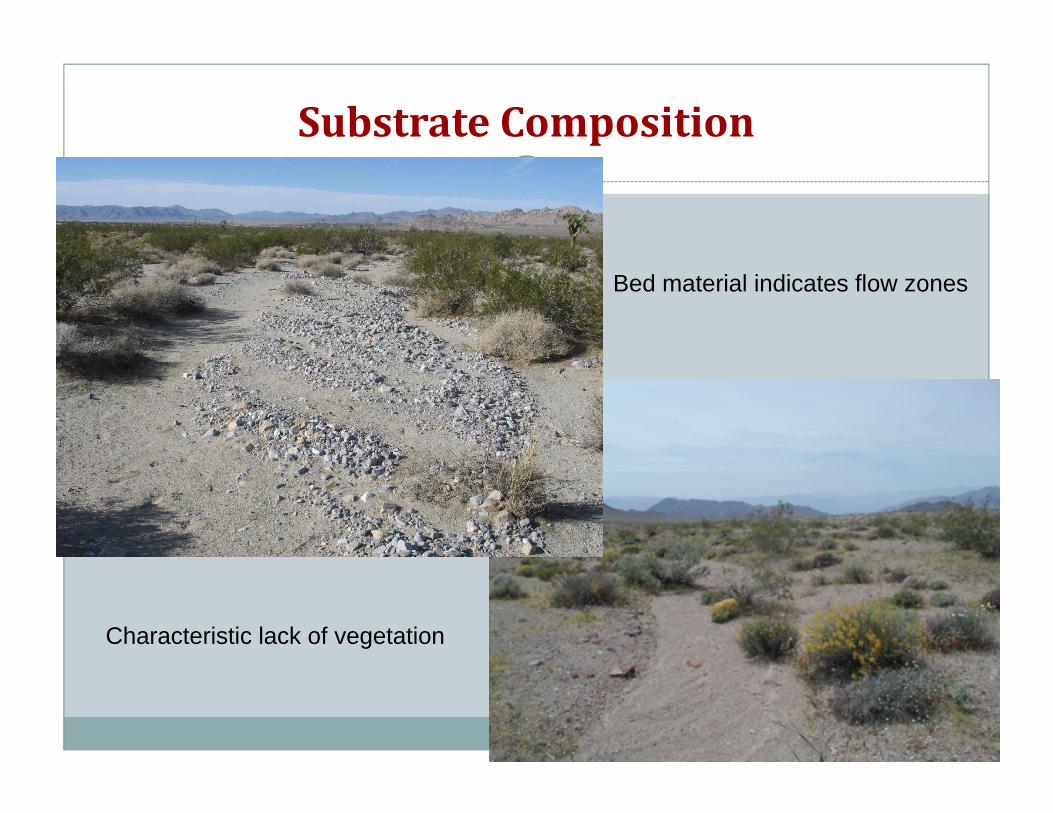
SubstrateComposition17
Bed material indicates flow zones
Characteristic lack of vegetation

InterspersionandComplexity18

DeviationfromReference19
Degraded transitions/connections between channel and floodplain

ConsiderationsforBiologicalIndicators
Important to consider vegetation composition and density across entire floodplain, including upper terraces.
Vegetation often comprised of upland species with few riparian components (xeroriparian)
S
20
tand age distribution is a function of time since last episodic event

PlantIndicators
Plant densities and distribution/position across the floodplain
Structural complexity of floodplain plant communities
Diversity of non-invasive plants
21
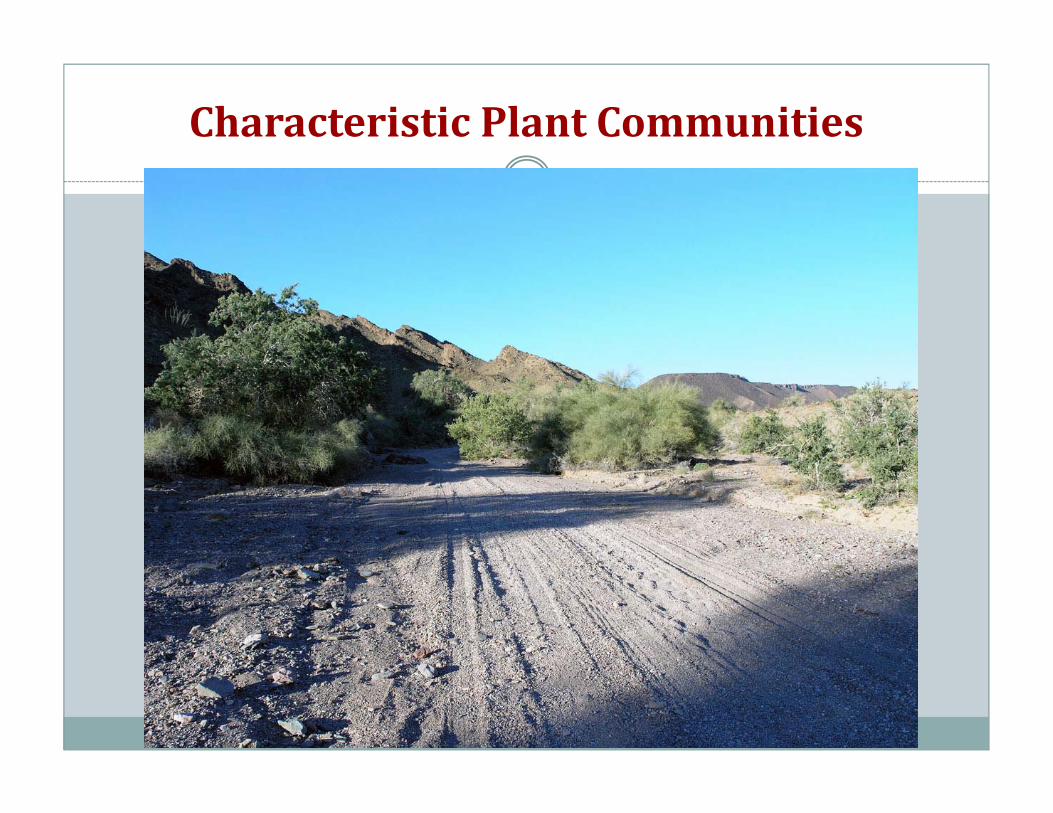
CharacteristicPlantCommunities22

WhatHappensNext
Conceptual component complete
Field testing currently ongoing through early spring 2014
Indicators refined based on data
Data analysis will be used to define metric scaling
Draft module available by late 2014
Peer review via field testing by users
23

PotentialIntensiveIndicators
Surrogate measures of faunal use Reptile/mammal/arthropod burrow counts
Intensive measures of vegetation
Terrestrial arthropod community Ground-dwelling beetles, ants
Soil microbial community
24

THANKYOU
Chris [email protected]‐755‐324425
Folks whose content I pilferedBob Lichvar - ACOEKris Vyverberg - CDFWBarry Hecht – Balance HydrologicsMatt Kondolf – UC Berkely

26

ExpectationsVaryasaFunctionofTime
Alluvial fan
Arroyo
Episodic Flow Channel

Channel“stability”metricworksheet28
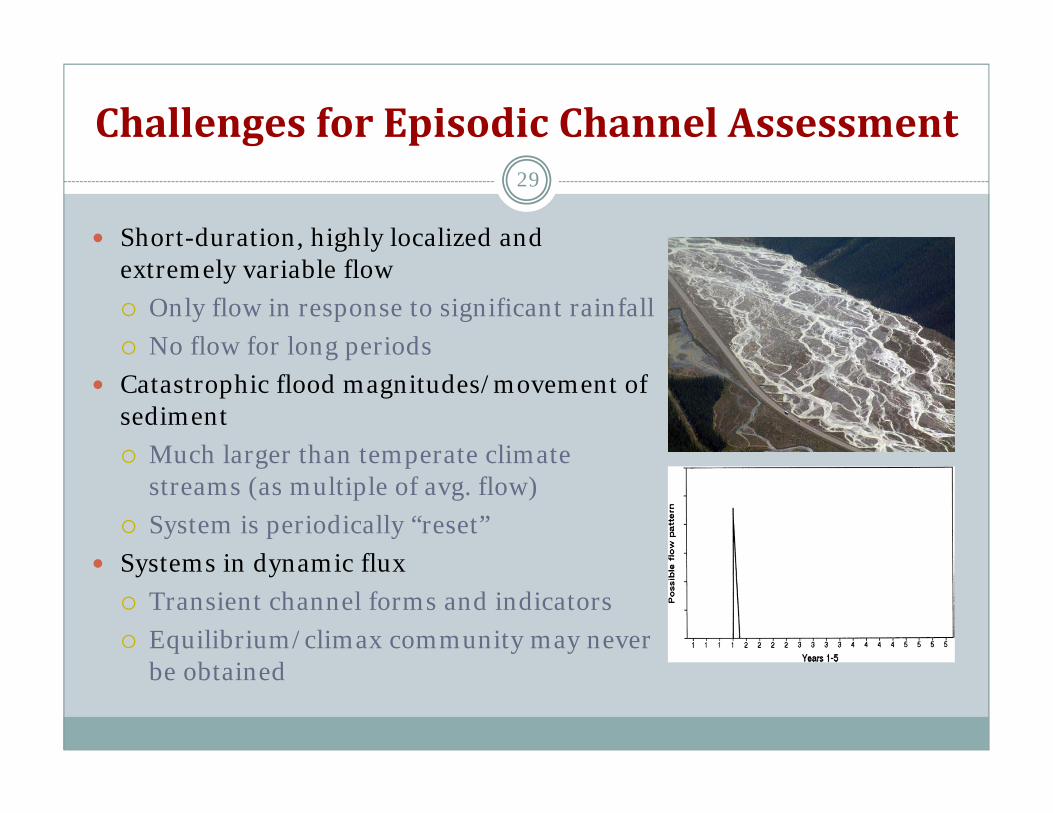
ChallengesforEpisodicChannelAssessment
Short-duration, highly localized and extremely variable flow Only flow in response to significant rainfall No flow for long periods
Catastrophic flood magnitudes/movement of sediment Much larger than temperate climate
streams (as multiple of avg. flow) System is periodically “reset”
Systems in dynamic flux Transient channel forms and indicators Equilibrium/climax community may never
be obtained
29

GeneralProjectConceptsII
Biological communities of these systems reflect that surface water occurs at low frequency, typically does not persist, and substrates are often dry (i.e. not saturated)
Episodic events = substantial changes in planform, morphology, and biotic communities brief periods of substantial instability/change followed by long periods of
quiescence scale of change proportional to size of stream and its position in the
watershed
Following an episode, systems undergo recovery periods where physical and biotic features re-stabilize until next event
30

ConsiderationsforMetric/IndicatorDevelopment31
Conducting baseline evaluations on ranges of values for key indicators of interest (field) Consider overall planform structure vs. floodplain/in-channel
features
Identify the semi-stable field indicators or macro-structures Less variable over time
Identify indicators of repeating patterns of flow or sediment movement Prevalence of indicators across active floodplain
Focus on features that provide requisite faunal habitat Diversity of substrate types and physical features

GeneralApproach
1. Define subclasses of episodic streams Classification system
2. Define criteria for reference site identification
3. Define Assessment Area (AA)
4. Develop candidate metrics and indicators
5. Test metric/indicator performance along a gradient of condition
6. Produce draft RAM
7. Recommend intensive (L3) indicators for RAM validation
32

Sketch the AASubject to field verification
Length = 10x mean BF Width within limits of 100m and 200m
Width includes portion of riparian area that directly provides allochthanous matter
AA is the channel, its floodplain, and essential riparian area
100m

BufferMetricExample
Function of buffer and way it is measured in CRAM does not differ conceptually differ between perennial and episodic channel types
34

ScoringExample35
METRICS DeepCanyon CoyoteCreek
StreamCorridorContinuity A ABuffer:PercentofAssessment Area withBuffer A AAverageBufferWidth A ABufferCondition A A
WaterSource A AChannelStability C CHydrologicConnectivity B CStructuralPatchRichness B CTopographicComplexity B BNumberofPlantLayersPresent B BNumberofCo‐dominantPlantSpecies D CPercentCo‐dominantPlant Species thatareInvasive A AHorizontalInterspersion C CVerticalStructure D D

Single-thread Discontinuous Compound (braided)
Form Affects Function Tools