improving decision making and managing...
TRANSCRIPT
2BUSINESS INTELLIGENCE IN THE ENTERPRISE
We’ve already introduced you to the different types of systems used for sup-porting management decision making. At the foundation of all of these deci-sion support systems are business intelligence and business analytics infra-structure that supplies the data and the analytic tools for supporting decisionmaking. In this section, we want to answer the following questions:
• What are business intelligence (BI) and business analytics (BA)
• Who makes business intelligence and business analytics hardware andsoftware?
• Who are the users of business intelligence?
• What kinds of analytical tools come with a BI/BA suite?
• How do managers use these tools?
• What are some examples of firms who have used these tools?
• What management strategies are used for developing BI/BA capabilities?
WHAT IS BUSINESS INTELLIGENCE? When we think of humans as intelligent beings we often refer to their abilityto take in data from their environment, understand the meaning and signifi-cance of the information, and then act appropriately. Can the same be said ofbusiness firms? The answer appears to be a qualified “yes.” All organizations,including business firms, do indeed take in information from their environ-ments, attempt to understand the meaning of the information, and thenattempt to act on the information. Just like human beings, some business firmsdo this well, and others poorly.
“Business intelligence” is a term used by hardware and software vendors andinformation technology consultants to describe the infrastructure forwarehousing, integrating, reporting, and analyzing data that comes from thebusiness environment. The foundation infrastructure collects, stores, cleans,and makes relevant information available to managers. Think databases, datawarehouses, and data marts. “Business analytics” is also a vendor-defined termthat focuses more on tools and techniques for analyzing and understandingdata. Think online analytical processing (OLAP), statistics, models, and datamining.
So, stripped to its essentials, business intelligence and analytics are aboutintegrating all the information streams produced by a firm into a single, coher-ent enterprise-wide set of data, and then, using modeling, statistical analysis
C h a p t e r 1 0I m p r o v i n g D e c i s i o n M a k i n g a n d M a n a g i n gK n o w l e d g e
1
LEARNING TRACK 4: BUSINESS INTELLIGENCE
tools (like normal distributions, correlation and regression analysis, Chi squareanalysis, forecasting, and cluster analysis), and data mining tools (patterndiscovery and machine learning), to make sense out of all these data somanagers can make better decisions and better plans, or at least know quicklywhen their firms are failing to meet planned targets.
One company that uses business intelligence is Hallmark Cards. Thecompany uses SAS Analytics software to improve its understanding of buyingpatterns that could lead to increased sales at more than 3,000 Hallmark GoldCrown stores in the United Sates. Hallmark wanted to strengthen its relation-ship with frequent buyers. Using data mining and predictive modeling, thecompany determined how to market to various consumer segments duringholidays and special occasions as well as adjust promotions on the fly.Hallmark is able to determine which customer segments are most influencedby direct mail, which should be approached through e-mail, and what specif-ic messages to send each group. Business intelligence has helped boostHallmark sales to its loyalty program members by 5 to 10 percent.
Bus ine s s In te l l i gence Vendo r sIt is important to remember that business intelligence and analytics are productsdefined by technology vendors and consulting firms. They consist of hardwareand software suites sold primarily by large system vendors to very large Fortune500 firms. The largest five providers of these products are SAP, Oracle, IBM, SASInstitute, and Microsoft (see Table 10-1). Microsoft’s products are aimed at smallto medium size firms, and they are based on desktop tools familiar to employees(such as Excel spreadsheet software), Microsoft Sharepoint collaboration tools,and Microsoft SQL Server database software. The size of the American BI and BAmarketplace in 2010 is estimated to be $10.5 billion and growing at over 20%annually (Gartner, 2010). This makes business intelligence and business analyt-ics one of the fastest-growing and largest segments in the U.S. software market.
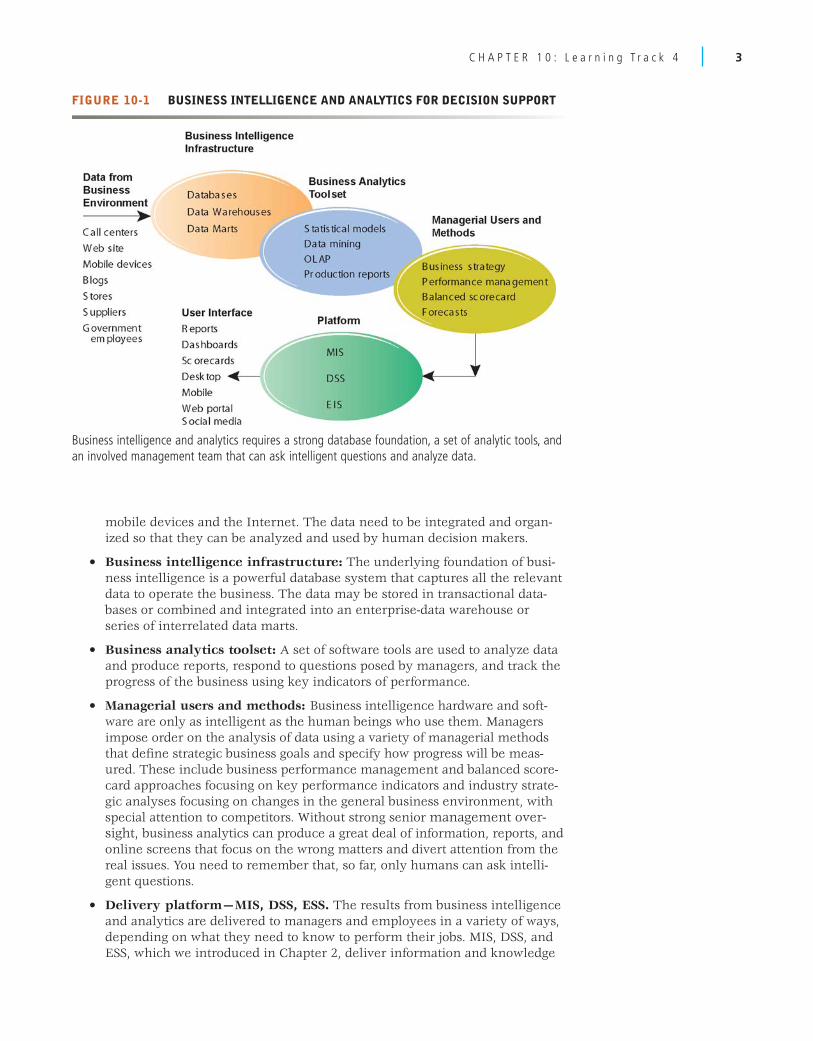
THE BUSINESS INTELLIGENCE ENVIRONMENTFigure 10-1 gives an overview of a business intelligence environment, high-lighting the kinds of hardware, software, and management capabilities that themajor vendors offer and that firms develop over time. There are six elementsin this business intelligence environment:
• Data from the business environment: Businesses must deal with bothstructured and unstructured data from many different sources, including
2 C H A P T E R 1 0 : L e a r n i n g T r a c k 4
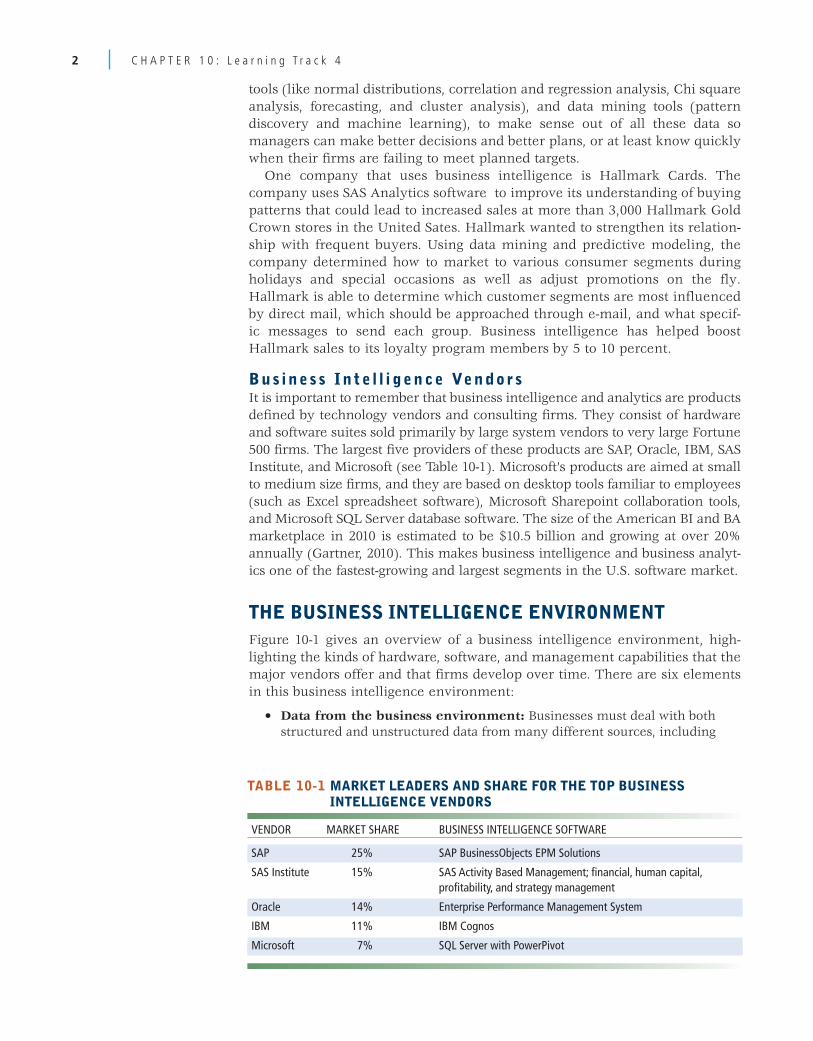
TABLE 10-1 MARKET LEADERS AND SHARE FOR THE TOP BUSINESSINTELLIGENCE VENDORS
VENDOR MARKET SHARE BUSINESS INTELLIGENCE SOFTWARE
SAP 25% SAP BusinessObjects EPM Solutions
SAS Institute 15% SAS Activity Based Management; financial, human capital,profitability, and strategy management
Oracle 14% Enterprise Performance Management System
IBM 11% IBM Cognos
Microsoft 7% SQL Server with PowerPivot
C H A P T E R 1 0 : L e a r n i n g T r a c k 4 3
mobile devices and the Internet. The data need to be integrated and organ-ized so that they can be analyzed and used by human decision makers.
• Business intelligence infrastructure: The underlying foundation of busi-ness intelligence is a powerful database system that captures all the relevantdata to operate the business. The data may be stored in transactional data-bases or combined and integrated into an enterprise-data warehouse orseries of interrelated data marts.
• Business analytics toolset: A set of software tools are used to analyze dataand produce reports, respond to questions posed by managers, and track theprogress of the business using key indicators of performance.
• Managerial users and methods: Business intelligence hardware and soft-ware are only as intelligent as the human beings who use them. Managersimpose order on the analysis of data using a variety of managerial methodsthat define strategic business goals and specify how progress will be meas-ured. These include business performance management and balanced score-card approaches focusing on key performance indicators and industry strate-gic analyses focusing on changes in the general business environment, withspecial attention to competitors. Without strong senior management over-sight, business analytics can produce a great deal of information, reports, andonline screens that focus on the wrong matters and divert attention from thereal issues. You need to remember that, so far, only humans can ask intelli-gent questions.
• Delivery platform—MIS, DSS, ESS. The results from business intelligenceand analytics are delivered to managers and employees in a variety of ways,depending on what they need to know to perform their jobs. MIS, DSS, andESS, which we introduced in Chapter 2, deliver information and knowledge
FIGURE 10-1 BUSINESS INTELLIGENCE AND ANALYTICS FOR DECISION SUPPORT
Business intelligence and analytics requires a strong database foundation, a set of analytic tools, andan involved management team that can ask intelligent questions and analyze data.
to different people and levels in the firm—operational employees, middlemanagers, and senior executives. In the past, these systems could not sharedata and operated as independent systems. Today, one suite of hardware andsoftware tools in the form of a business intelligence and analytics package isable to integrate all this information and bring it to managers’ desktop ormobile platforms.
• User interface: Business people are no longer tied to their desks and desk-tops. They often learn quicker from a visual representation of data than froma dry report with columns and rows of information. Today’s business analyt-ics software suites emphasize visual techniques such as dashboards andscorecards. They also are able to deliver reports on Blackberrys, iPhones, andother mobile handhelds as well as on the firm’s Web portal. BA software isadding capabilities to post information on Twitter, Facebook, or internal socialmedia to support decision making in an online group setting rather than in aface-to-face meeting.
BUSINESS INTELLIGENCE AND ANALYTICSCAPABILITIESBusiness intelligence and analytics promise to deliver correct, nearly real-timeinformation to decision makers, and the analytic tools help them quicklyunderstand the information and take action. There are 5 analytic functionali-ties that BI systems deliver to achieve these ends:
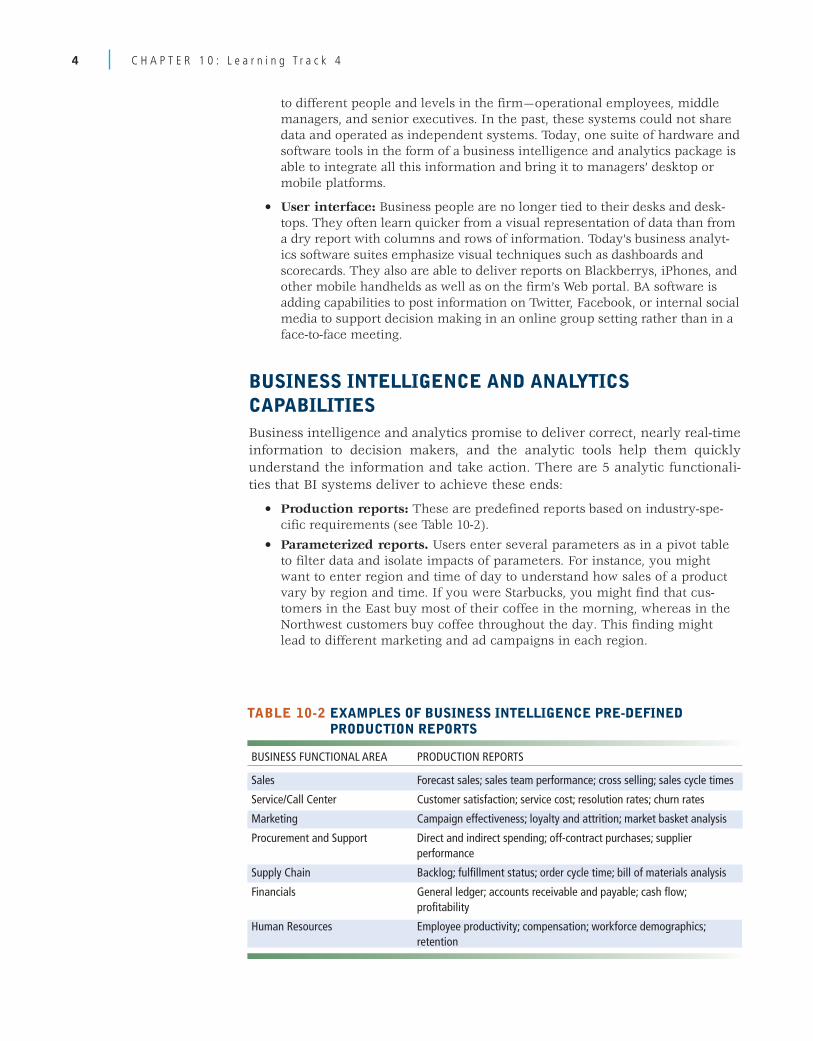
• Production reports: These are predefined reports based on industry-spe-cific requirements (see Table 10-2).
• Parameterized reports. Users enter several parameters as in a pivot tableto filter data and isolate impacts of parameters. For instance, you mightwant to enter region and time of day to understand how sales of a productvary by region and time. If you were Starbucks, you might find that cus-tomers in the East buy most of their coffee in the morning, whereas in theNorthwest customers buy coffee throughout the day. This finding mightlead to different marketing and ad campaigns in each region.
4 C H A P T E R 1 0 : L e a r n i n g T r a c k 4
TABLE 10-2 EXAMPLES OF BUSINESS INTELLIGENCE PRE-DEFINEDPRODUCTION REPORTS
BUSINESS FUNCTIONAL AREA PRODUCTION REPORTS
Sales Forecast sales; sales team performance; cross selling; sales cycle times
Service/Call Center Customer satisfaction; service cost; resolution rates; churn rates
Marketing Campaign effectiveness; loyalty and attrition; market basket analysis
Procurement and Support Direct and indirect spending; off-contract purchases; supplierperformance
Supply Chain Backlog; fulfillment status; order cycle time; bill of materials analysis
Financials General ledger; accounts receivable and payable; cash flow;profitability
Human Resources Employee productivity; compensation; workforce demographics;retention
C H A P T E R 1 0 : L e a r n i n g T r a c k 4 5
• Dashboards/scorecards: These are visual tools for presenting performancedata defined by users
• Ad hoc query/search/report creation: These allow users to create theirown reports based on queries and searches
• Drill down: This is the ability to move from a high-level summary to amore detailed view
• Forecasts, scenarios, models: These include the ability to perform linearforecasting, what-if scenario analysis, and analyze data using standard statis-tical tools.
Who Uses Bus ine s s In te l l i gence and Bus ine s sAna l y t i c s ?
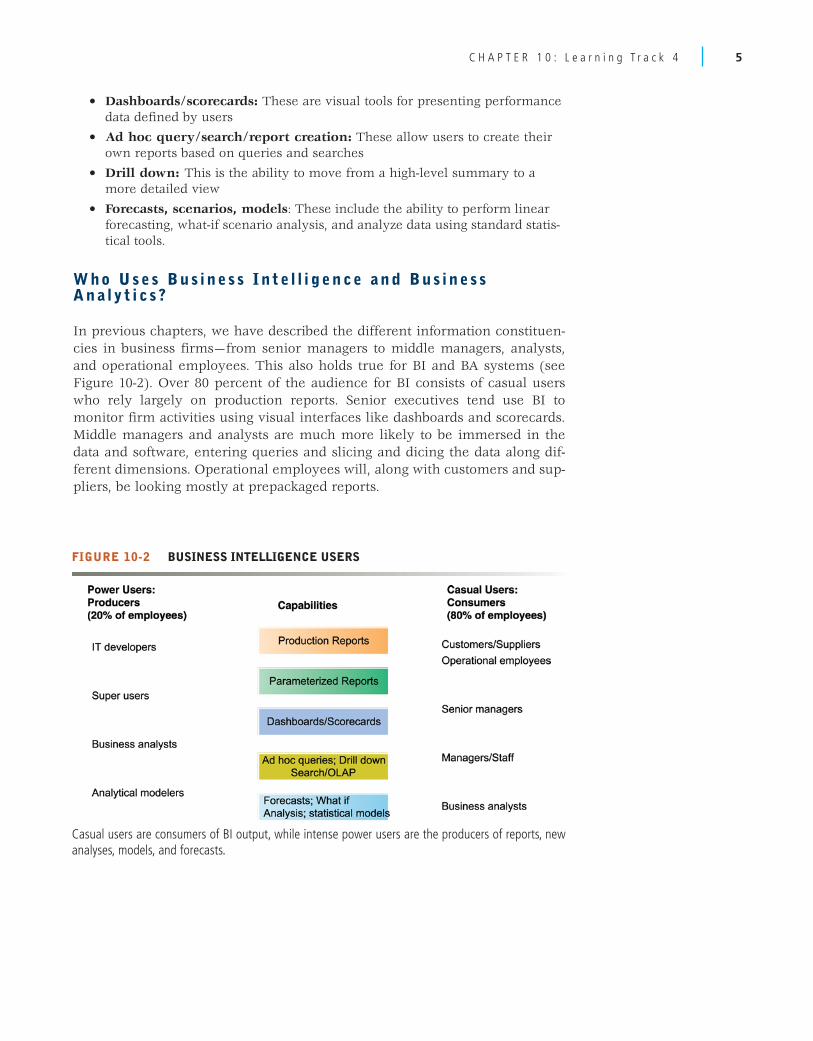
In previous chapters, we have described the different information constituen-cies in business firms—from senior managers to middle managers, analysts,and operational employees. This also holds true for BI and BA systems (seeFigure 10-2). Over 80 percent of the audience for BI consists of casual userswho rely largely on production reports. Senior executives tend use BI tomonitor firm activities using visual interfaces like dashboards and scorecards.Middle managers and analysts are much more likely to be immersed in thedata and software, entering queries and slicing and dicing the data along dif-ferent dimensions. Operational employees will, along with customers and sup-pliers, be looking mostly at prepackaged reports.
FIGURE 10-2 BUSINESS INTELLIGENCE USERS
Casual users are consumers of BI output, while intense power users are the producers of reports, newanalyses, models, and forecasts.
Examp le s o f Bus ine s s In te l l i gence App l i c a t i on sThe most widely used output of a BI suite of tools are pre-packaged productionreports. Table 10-2 illustrates some common pre-defined reports from Oracle’sBI suite of tools.
Pred i c t i v e Ana l y t i c sPredictive analytics are being built into mainstream applications for everydaydecision making by all types of employees, especially in finance and market-ing. For example, Capital One conducts more than 30,000 experiments eachyear using different interest rates, incentives, direct mail packaging, and othervariables to identify the best potential customers for targeting its credit cardoffers. These people are most likely to sign up for credit cards and to pay backCapital One for the balances they ring up in their credit card accounts.Predictive analytics have also worked especially well in the credit card indus-try to identify customers who are at risk for leaving.
Dealer Services, which offers inventory financing for used-car dealers, istrying to use predictive analytics to screen potential customers. Thousands ofused-car dealers, who were formerly franchisees for General Motors andChrysler, are seeking financing from companies such as Dealer Services so thatthey can go into business on their own. Using WebFOCUS software fromInformation Builders, the company is building a model that will predict thebest loan prospects and eliminate up to 10 of the 15 hours required to review afinancing application. The model reviews data including dealer size and type,number of locations, payment patterns, histories of bounced checks, andinventory practices and is revalidated and updated as conditions change.
FedEx is using SAS Institute’s Enterprise Miner and predictive analytic toolsto develop models that predict how customers will respond to price changesand new services, which customers are most at risk of switching to competi-tors, and how much revenue will be generated by new storefront or drop-boxlocations. The accuracy rate of the predictive analysis system ranges from 65to 90 percent. FedEx is now starting to use predictive analytics in call centersto help customer service representatives identify customers with the highestlevels of dissatisfaction and take the necessary steps to make them happy.
Data V i sua l i z a t i on and Geog raph i c In fo rmat i onSys temsBy presenting data in visual form, data visualization tools help users seepatterns and relationships in large amounts of data that would be difficult todiscern if the data were presented as traditional lists of text. For example,managers and employees of Day & Zimmermann, an industrial, defense, andworkforce solutions provider, have detailed, real-time visibility into thecompany’s inventory of contractors and workers through a set of dashboardspopulated with real-time data from a SAP ERP Human Capital Managementsystem. The dashboards make it much easier to understand the organiza-tion’s staffing levels than static paper reports. The real-time data indicateexactly what type of worker is available in what location and when a projectis due to be completed. If a project is ahead of schedule, information from thedashboards helps decision makers rapidly determine when and where toreassign its workers.
6 C H A P T E R 1 0 : L e a r n i n g T r a c k 4
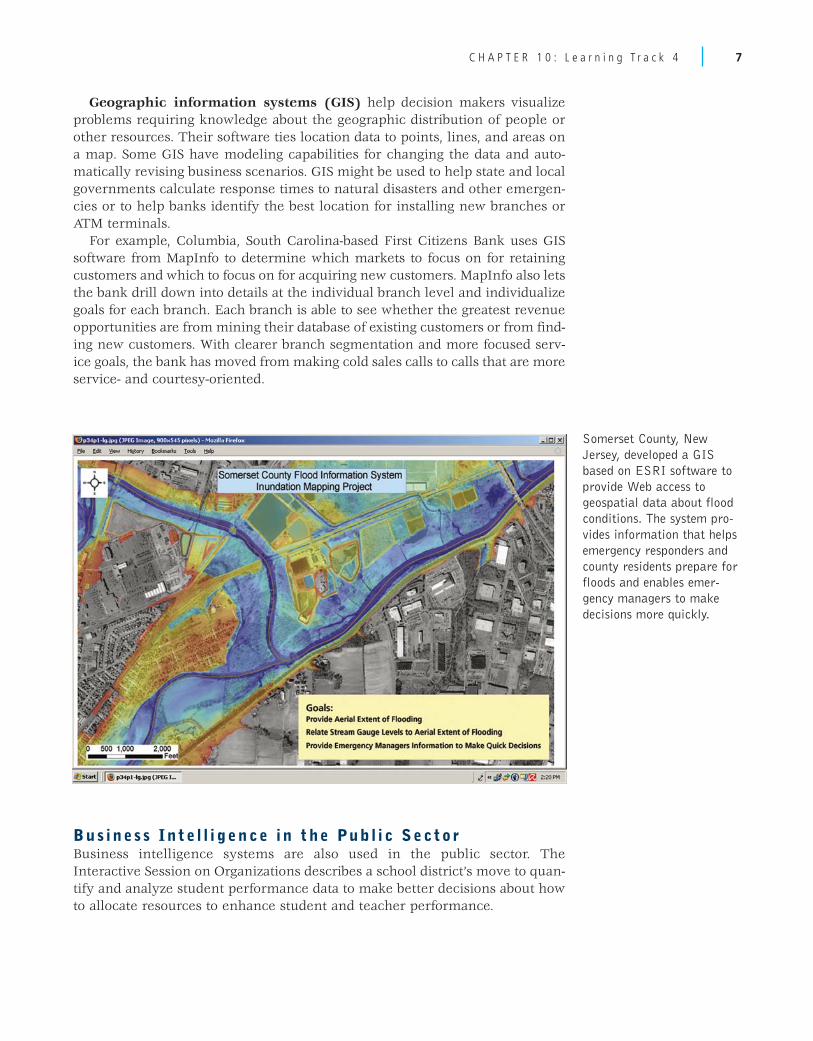
Geographic information systems (GIS) help decision makers visualizeproblems requiring knowledge about the geographic distribution of people orother resources. Their software ties location data to points, lines, and areas ona map. Some GIS have modeling capabilities for changing the data and auto-matically revising business scenarios. GIS might be used to help state and localgovernments calculate response times to natural disasters and other emergen-cies or to help banks identify the best location for installing new branches orATM terminals.
For example, Columbia, South Carolina-based First Citizens Bank uses GISsoftware from MapInfo to determine which markets to focus on for retainingcustomers and which to focus on for acquiring new customers. MapInfo also letsthe bank drill down into details at the individual branch level and individualizegoals for each branch. Each branch is able to see whether the greatest revenueopportunities are from mining their database of existing customers or from find-ing new customers. With clearer branch segmentation and more focused serv-ice goals, the bank has moved from making cold sales calls to calls that are moreservice- and courtesy-oriented.
C H A P T E R 1 0 : L e a r n i n g T r a c k 4 7
Somerset County, New
Jersey, developed a GIS
based on ESRI software to
provide Web access to
geospatial data about flood
conditions. The system pro-
vides information that helps
emergency responders and
county residents prepare for
floods and enables emer-
gency managers to make
decisions more quickly.
Bus ine s s In te l l i gence i n the Pub l i c Sec to rBusiness intelligence systems are also used in the public sector. TheInteractive Session on Organizations describes a school district’s move to quan-tify and analyze student performance data to make better decisions about howto allocate resources to enhance student and teacher performance.
MANAGEMENT STRATEGIES FOR DEVELOPING BI ANDBA CAPABILITIES There are two different strategies for adopting BI and BA capabilities for theorganization: one-stop integrated solutions versus multiple best-of-breed ven-dor solutions. The hardware firms (IBM, HP, and now Oracle, which owns SunMicrosystems) want to sell your firm integrated hardware/software solutionsthat tend to run only on their hardware (the totally integrated solution). It’scalled “one stop shopping.” The software firms (SAP, SAS, and Microsoft)encourage firms to adopt the “best of breed” software and that runs on anymachine they want. In this strategy, you adopt the best database and datawarehouse solution, and select the best business intelligence and analyticspackage from whatever vendor you believe is best.
The first solution carries the risk that a single vendor provides your firm’stotal hardware and software solution, making your firm dependent on its pric-ing power. It also offers the advantage of dealing with a single vendor who candeliver on a global scale. The second solution offers greater flexibility and inde-pendence, but with the risk of potential difficulties integrating the software tothe hardware platform, as well as to other software. Vendors always claim theirsoftware is “compatible” with other software, but the reality is that it can bevery difficult to integrate software from different vendors. Microsoft in partic-ular emphasizes building on its desktop interface and operating system(Windows), which are familiar to many users, and developing server applica-tions that run on Microsoft local area networks. But data from hardware andsoftware produced by different vendors will have to flow seamlessly intoMicrosoft workstations to make this strategy work. This may not be adequatefor Fortune 500 firms needing a global networking solution.
Regardless of which strategy your firm adopts, all BI and BA systems lockthe firm into a set of vendors and switching is very costly. Once you train thou-sands of employees across the world on using a particular set of tools, it isextremely difficult to switch. When you adopt these systems, you are inessence taking in a new partner.
The marketplace is very competitive and given to hyperbole. One BI ven-dor claims “[Our tools] bring together a portfolio of services, software, hard-ware and partner technologies to create business intelligence solutions. Byconnecting intelligence across your company, you gain a competitive advan-tage for creating new business opportunities.” As a manager, you will have tocritically evaluate such claims, understand exactly how these systems couldimprove your business, and determine whether the expenditures are worththe benefits.
1 BUSINESS INTELLIGENCE CONSTITUENCIES
There are many different constituencies that make up a modern business firm.Earlier in this text and in this chapter we identified three levels of manage-ment: lower supervisory (operational) management, middle management, andsenior management (vice president and above, including executive or “C level”management, e.g. chief executive officer, chief financial officers, and chief
8 C H A P T E R 1 0 : L e a r n i n g T r a c k 4
C H A P T E R 1 0 : L e a r n i n g T r a c k 4 9
operational officer.) Each of these management groups has different responsi-bilities and different needs for information and business intelligence, withdecisions becoming less structured among higher levels of management.
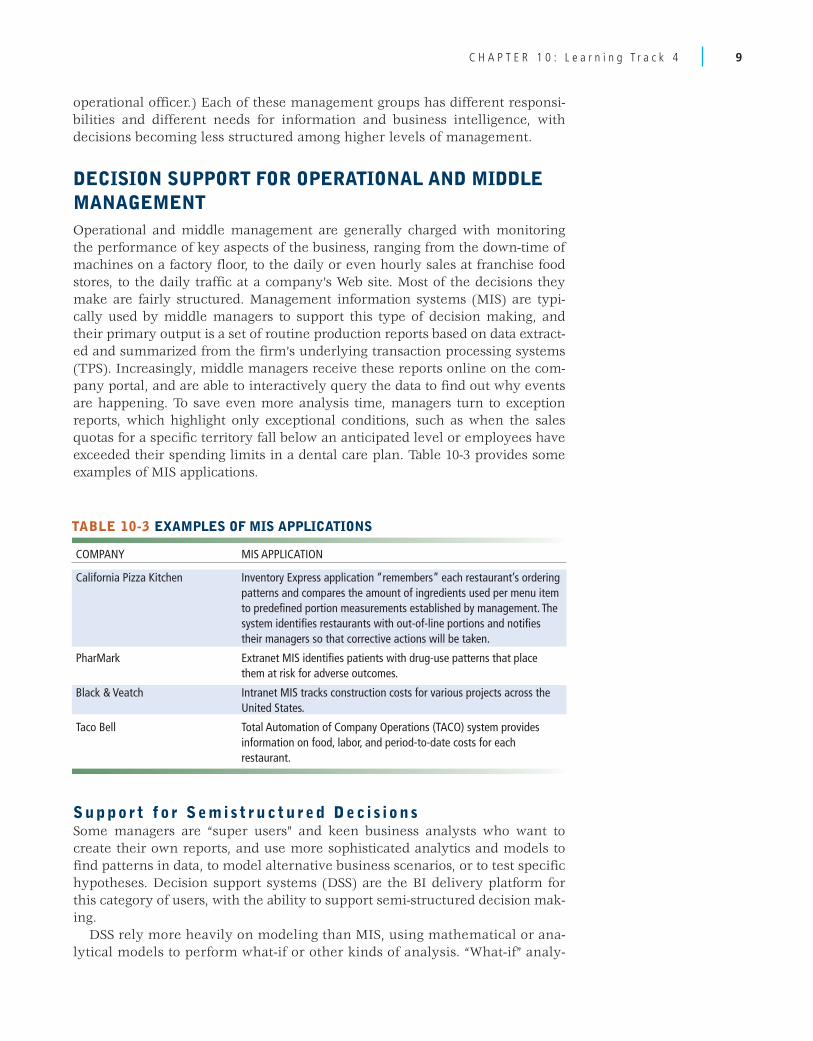
DECISION SUPPORT FOR OPERATIONAL AND MIDDLEMANAGEMENTOperational and middle management are generally charged with monitoringthe performance of key aspects of the business, ranging from the down-time ofmachines on a factory floor, to the daily or even hourly sales at franchise foodstores, to the daily traffic at a company’s Web site. Most of the decisions theymake are fairly structured. Management information systems (MIS) are typi-cally used by middle managers to support this type of decision making, andtheir primary output is a set of routine production reports based on data extract-ed and summarized from the firm’s underlying transaction processing systems(TPS). Increasingly, middle managers receive these reports online on the com-pany portal, and are able to interactively query the data to find out why eventsare happening. To save even more analysis time, managers turn to exceptionreports, which highlight only exceptional conditions, such as when the salesquotas for a specific territory fall below an anticipated level or employees haveexceeded their spending limits in a dental care plan. Table 10-3 provides someexamples of MIS applications.
TABLE 10-3 EXAMPLES OF MIS APPLICATIONS
COMPANY MIS APPLICATION
California Pizza Kitchen Inventory Express application “remembers” each restaurant’s orderingpatterns and compares the amount of ingredients used per menu itemto predefined portion measurements established by management. Thesystem identifies restaurants with out-of-line portions and notifiestheir managers so that corrective actions will be taken.
PharMark Extranet MIS identifies patients with drug-use patterns that placethem at risk for adverse outcomes.
Black & Veatch Intranet MIS tracks construction costs for various projects across theUnited States.
Taco Bell Total Automation of Company Operations (TACO) system providesinformation on food, labor, and period-to-date costs for eachrestaurant.
Suppor t f o r Semi s t ruc tu red Dec i s i on sSome managers are “super users” and keen business analysts who want tocreate their own reports, and use more sophisticated analytics and models tofind patterns in data, to model alternative business scenarios, or to test specifichypotheses. Decision support systems (DSS) are the BI delivery platform forthis category of users, with the ability to support semi-structured decision mak-ing.
DSS rely more heavily on modeling than MIS, using mathematical or ana-lytical models to perform what-if or other kinds of analysis. “What-if” analy-
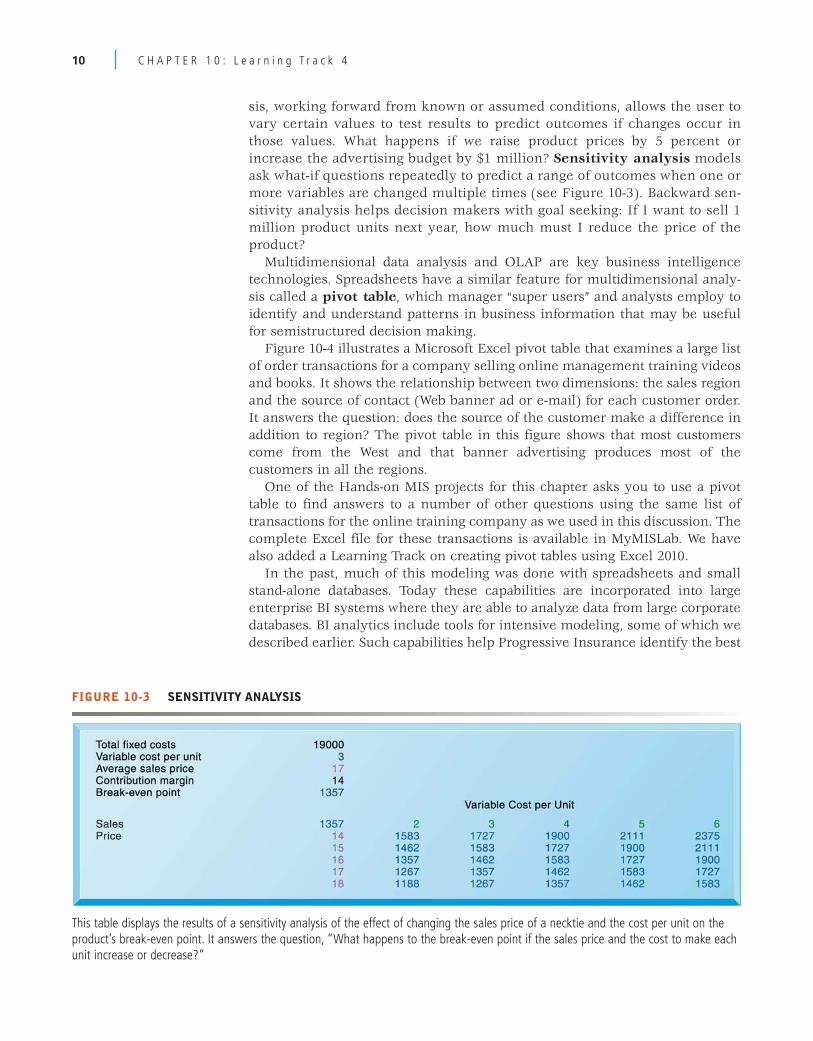
sis, working forward from known or assumed conditions, allows the user tovary certain values to test results to predict outcomes if changes occur inthose values. What happens if we raise product prices by 5 percent orincrease the advertising budget by $1 million? Sensitivity analysis modelsask what-if questions repeatedly to predict a range of outcomes when one ormore variables are changed multiple times (see Figure 10-3). Backward sen-sitivity analysis helps decision makers with goal seeking: If I want to sell 1million product units next year, how much must I reduce the price of theproduct?
Multidimensional data analysis and OLAP are key business intelligencetechnologies. Spreadsheets have a similar feature for multidimensional analy-sis called a pivot table, which manager “super users” and analysts employ toidentify and understand patterns in business information that may be usefulfor semistructured decision making.
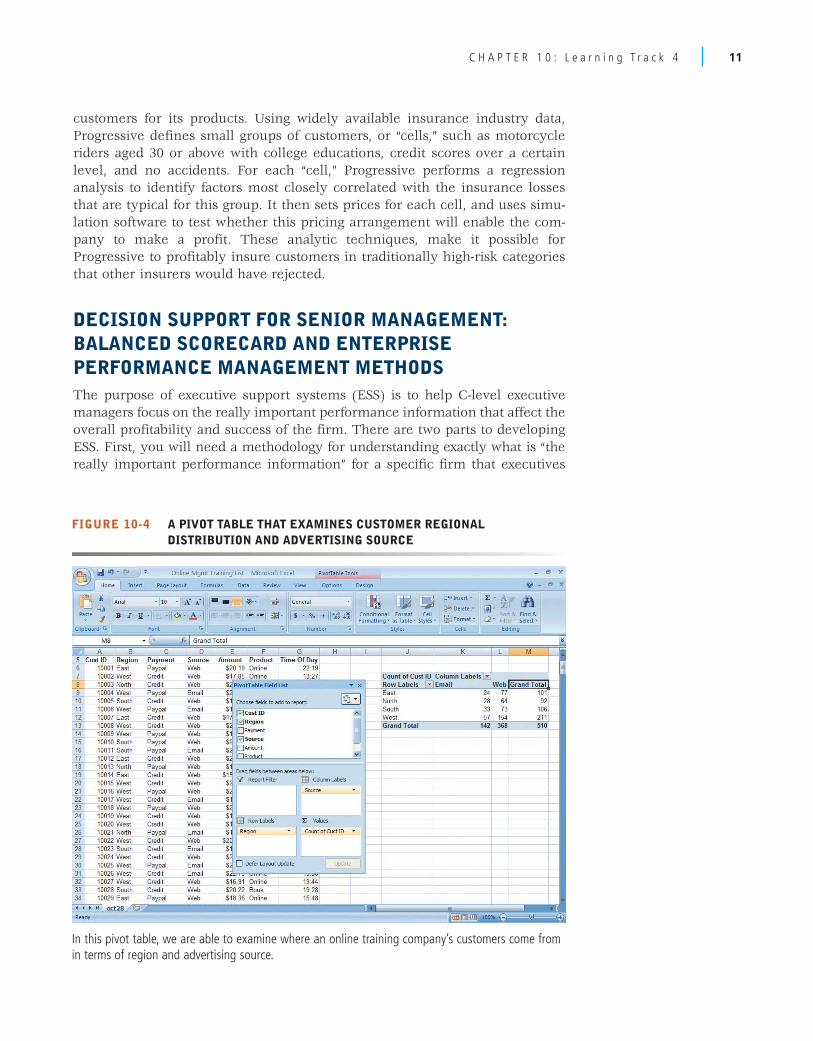
Figure 10-4 illustrates a Microsoft Excel pivot table that examines a large listof order transactions for a company selling online management training videosand books. It shows the relationship between two dimensions: the sales regionand the source of contact (Web banner ad or e-mail) for each customer order.It answers the question: does the source of the customer make a difference inaddition to region? The pivot table in this figure shows that most customerscome from the West and that banner advertising produces most of thecustomers in all the regions.
One of the Hands-on MIS projects for this chapter asks you to use a pivottable to find answers to a number of other questions using the same list oftransactions for the online training company as we used in this discussion. Thecomplete Excel file for these transactions is available in MyMISLab. We havealso added a Learning Track on creating pivot tables using Excel 2010.
In the past, much of this modeling was done with spreadsheets and smallstand-alone databases. Today these capabilities are incorporated into largeenterprise BI systems where they are able to analyze data from large corporatedatabases. BI analytics include tools for intensive modeling, some of which wedescribed earlier. Such capabilities help Progressive Insurance identify the best
FIGURE 10-3 SENSITIVITY ANALYSIS
This table displays the results of a sensitivity analysis of the effect of changing the sales price of a necktie and the cost per unit on theproduct’s break-even point. It answers the question, “What happens to the break-even point if the sales price and the cost to make eachunit increase or decrease?”
10 C H A P T E R 1 0 : L e a r n i n g T r a c k 4
C H A P T E R 1 0 : L e a r n i n g T r a c k 4 11
FIGURE 10-4 A PIVOT TABLE THAT EXAMINES CUSTOMER REGIONALDISTRIBUTION AND ADVERTISING SOURCE
In this pivot table, we are able to examine where an online training company’s customers come fromin terms of region and advertising source.
customers for its products. Using widely available insurance industry data,Progressive defines small groups of customers, or “cells,” such as motorcycleriders aged 30 or above with college educations, credit scores over a certainlevel, and no accidents. For each “cell,” Progressive performs a regressionanalysis to identify factors most closely correlated with the insurance lossesthat are typical for this group. It then sets prices for each cell, and uses simu-lation software to test whether this pricing arrangement will enable the com-pany to make a profit. These analytic techniques, make it possible forProgressive to profitably insure customers in traditionally high-risk categoriesthat other insurers would have rejected.
DECISION SUPPORT FOR SENIOR MANAGEMENT: BALANCED SCORECARD AND ENTERPRISEPERFORMANCE MANAGEMENT METHODSThe purpose of executive support systems (ESS) is to help C-level executivemanagers focus on the really important performance information that affect theoverall profitability and success of the firm. There are two parts to developingESS. First, you will need a methodology for understanding exactly what is “thereally important performance information” for a specific firm that executives

need, and second, you will need to develop systems capable of delivering thisinformation to the right people in a timely fashion.
Currently, the leading methodology for understanding the really importantinformation needed by a firm’s executives is called the balanced scorecardmethod (Kaplan and Norton, 2004; Kaplan and Norton, 1992). The balancedscore card is a framework for operationalizing a firm’s strategic plan by focus-ing on measurable outcomes on four dimensions of firm performance: finan-cial, business process, customer, and learning and growth (Figure 10-5).Performance on each dimension is measured using key performance indi-cators (KPIs), which are the measures proposed by senior management forunderstanding how well the firm is performing along any given dimension. Forinstance, one key indicator of how well an online retail firm is meeting its cus-tomer performance objectives is the average length of time required to delivera package to a consumer. If your firm is a bank, one KPI of business processperformance is the length of time required to perform a basic function likecreating a new customer account.
The balanced scorecard framework is thought to be “balanced” because itcauses managers to focus on more than just financial performance. In thisview, financial performance is past history—the result of past actions—andmanagers should focus on the things they are able to influence today, such asbusiness process efficiency, customer satisfaction, and employee training.Once a scorecard is developed by consultants and senior executives, the nextstep is automating a flow of information to executives and other managers foreach of the key performance indicators. There are literally hundreds of con-
FIGURE 10-5 THE BALANCED SCORECARD FRAMEWORK
In the balanced scorecard framework, the firm’s strategic objectives are operationalized along fourdimensions: financial, business process, customer, and learning and growth. Each dimension is meas-ured using several KPIs.
12 C H A P T E R 1 0 : L e a r n i n g T r a c k 4

sulting and software firms that offer these capabilities, which are describedbelow. Once these systems are implemented, they are often referred to as ESS.
Another closely related popular management methodology is businessperformance management (BPM). Originally defined by an industry group in2004 (led by the same companies that sell enterprise and database systems likeOracle, SAP, and IBM), BPM attempts to systematically translate a firm’s strate-gies (e.g., differentiation, low-cost producer, market share growth, and scope ofoperation) into operational targets. Once the strategies and targets are identified,a set of KPIs are developed that measure progress towards the targets. The firm’sperformance is then measured with information drawn from the firm’s enter-prise database systems. BPM uses the same ideas as balanced scorecard but witha stronger strategy flavor (BPM Working Group, 2004).
Corporate data for contemporary ESS are supplied by the firm’s existingenterprise applications (enterprise resource planning, supply chain manage-ment, and customer relationship management). ESS also provide access tonews services, financial market databases, economic information, andwhatever other external data senior executives require. ESS also have signifi-cant drill-down capabilities if managers need more detailed views of data.
Well-designed ESS enhance management effectiveness by helping seniorexecutives monitor organizational performance, track activities of competitors,recognize changing market conditions, and identify problems and opportuni-ties. Immediate access to data increases executives’ ability to monitor activitiesof lower units reporting to them. That very monitoring ability enables decisionmaking to be decentralized and to take place at lower operating levels, increas-ing management’s span of control.
Contemporary business intelligence and analytics technology has enableda whole new style and culture of management called “information drivenmanagement” or “management by facts.” Here, information is captured atthe factory floor (or sales floor) level, and immediately entered into enter-prise systems and databases, and then to corporate headquarters executivedashboards for analysis—not in a matter of months, days, weeks, but inhours and seconds. It’s real time management. You can see real-time man-agement at work in hundreds of corporations in 2010, and many more arebuilding this new decision support environment.
GROUP DECISION-SUPPORT SYSTEMS (GDSS) The DSS we have just described focus primarily on individual decision making.However, so much work is accomplished in groups within firms that a specialcategory of systems called group decision-support systems (GDSS) hasbeen developed to support group and organizational decision making.
A GDSS is an interactive computer-based system for facilitating the solutionof unstructured problems by a set of decision makers working together as agroup in the same location or in different locations. Collaboration systems andWeb-based tools for videoconferencing and electronic meetings describedearlier in this text support some group decision processes, but their focus isprimarily on communication. GDSS, however, provide tools and technologiesgeared explicitly toward group decision making.
GDSS-guided meetings take place in conference rooms with special hard-ware and software tools to facilitate group decision making. The hardware
C H A P T E R 1 0 : L e a r n i n g T r a c k 4 13
includes computer and networking equipment, overhead projectors, and dis-play screens. Special electronic meeting software collects, documents, ranks,edits, and stores the ideas offered in a decision-making meeting. The moreelaborate GDSS use a professional facilitator and support staff. The facilitatorselects the software tools and helps organize and run the meeting.
A sophisticated GDSS provides each attendee with a dedicated desktopcomputer under that person’s individual control. No one will be able to seewhat individuals do on their computers until those participants are ready toshare information. Their input is transmitted over a network to a central serv-er that stores information generated by the meeting and makes it available toall on the meeting network. Data can also be projected on a large screen in themeeting room.
GDSS make it possible to increase meeting size while at the same timeincreasing productivity because individuals contribute simultaneously ratherthan one at a time. A GDSS promotes a collaborative atmosphere by guaran-teeing contributors’ anonymity so that attendees focus on evaluating the ideasthemselves without fear of personally being criticized or of having their ideasrejected based on the contributor. GDSS software tools follow structured meth-ods for organizing and evaluating ideas and for preserving the results of meet-ings, enabling nonattendees to locate needed information after the meeting.GDSS effectiveness depends on the nature of the problem and the group andon how well a meeting is planned and conducted.
14 C H A P T E R 1 0 : L e a r n i n g T r a c k 4