improving drug quality monitoring in ghana by ion-pair...
TRANSCRIPT

* To whom correspondence be made:E-mail: [email protected]
Improving Drug Quality Monitoring in Ghana by Ion-pair Complexes:The Case of Ciprofloxacin Hydrochloride and Bromophenol Blue
S. Asare-Nkansah1*, S. Oppong Bekoe1, K. Frimpong-Manso Opuni2 andJ. K Kwakye1
1Department of Pharmaceutical Chemistry, Faculty of Pharmacy and Pharmaceutical SciencesKwame Nkrumah University of Science and Technology, Kumasi, Ghana
2Laboratory Services Division, Food and Drugs Board, Accra, Ghana
ABSTRACT: Purpose: The mechanics of ion-pair complex formation between 1-cyclopropyl- 6-fluoro- 4-oxo- 7-piperazin- 1-yl- quinoline- 3-carboxylic acid monohydrochloride (CPF) and 4,4'-(1,1-dioxido-3H-2,1-benzoxathiole-3,3-diyl)bis(2,6-dibromophenol) (BPB) and its application in Ghana for quality control of somemedicinal agents have been examined. Method: CPF was allowed to react with BPB in aqueous acetate bufferof pH 2.8 at room temperature (29±1 °C), extracting the ion-pair complex into CHCl3 and determining theabsorbance at 420nm. The optical characteristics, conditional stability constant and free energy of formationof the complex were also evaluated, finally applying the method to the assay of six brands of CPF tablets.Results: Effective linear dynamic range according to the Ringbom’s plot was 5.0–27.5 µgmL-1. Molar absorptivity,Sandell’s sensitivity index and degree of dissociation of the complex were 1.06x10⁴ Lmol-1cm-1, 0.036 µgcm-2
and 0.163 respectively. The logarithmic conditional stability constants and Gibb’s function determined by thecontinuous variations and mole ratio methods were respectively 5.95±0.110;-34,401.00Jmol-1 and 5.76±0.214;-33,326.83Jmol-1. Conclusion: The CPF tablets were successfully assayed and the method showed a great dealof precision and accuracy making its application suitable for regular quality monitoring of CPF and its congenersin Ghana.Keywords: Ion-pair, ciprofloxacin, bromophenol blue, drug quality, counterfeit, fluoroquinolone
INTRODUCTION
The burden of counterfeit, substandard, oradulterated medicines has been an issue of graveconcern world-wide. In recent years, manycountries, irrespective of their development, havebeen challenged by episodes of economically-motivated adulteration. Melamine, diethyleneglycol, and over-sulfated chondroitin sulfate havecreated morbidity and mortality within countriesand across regions of the globe [1]. It has beenreported that about 15% of all drugs in circulationare likely to be substandard or counterfeit, withthe clinical and financial burdens falling mostheavily on developing countries [2] because ofweak regulatory systems, poorly staffed andequipped national drug control laboratories andpoor enforcement due to corruption or lack ofpolitical will [1]. Medicines can also be
substandard because of heat and humiditycommon to many developing countries. Drugquality can reduce during manufacture, storage,and distribution as a result of high temperaturesand humidity. A study reported in 1997 indicatedone-third of chloroquine-containing andantibacterial medicines collected in Nigeria andThailand as below compendia standards as a resultof degradation and poor manufacturing [3].
Notwithstanding the above, rising cost of drugsgenerally creates a corresponding increase inincentive to produce counterfeit drugs because ofprofit margin. Production cost of counterfeits canbe very low because cheap substitutes or none atall, are used. Neither huge infrastructures norfacilities are needed; and there are no expensesincurred for quality assurance or meeting GoodManufacturing Practice requirements [4].Economically constrained patients seeking relieffrom diverse ailments and diseases may prefercheaper options to probably more expensive and

quality medicines prescribed by health careproviders. However, use of poor quality drugsbears serious health implications such astreatment failure, adverse reactions [5, 6], drugresistance [7], increased morbidity, and mortality.[8, 9]. Poor quality medicines can also erode publicconfidence in a country’s health programme andwaste scarce resources [10, 11]. It thereforebecomes necessary in the interest of consumers/patients, prescribers, pharmaceutical companiesand governments to safeguard the quality ofmedicines by having available and affordabletechniques for quality monitoring. The benefits arethat patients will receive cure and value for money;prescribers will earn the trust of patients;pharmaceutical companies will have a reputationbecause consumers have confidence in theirproducts leading to more profits and governmentswill have the health of the public protected,preventing increased public expenditure [12] incontrolling the menaces of unwholesomemedicines.
Ciprofloxacin hydrochloride (CPF) is themonohydrochloride monohydrate salt of 1-cyclopropyl- 6-fluoro- 4-oxo- 7-piperazin- 1-yl-quinoline- 3-carboxylic acid. It is a broad-spectrumantimicrobial agent belonging to thefluoroquinolone group, showing good activityagainst both gram-negative and gram-positivebacteria by inhibition of their DNA gyrase [13].Its clinical applications in Ghana includetreatment of typhoid fever, urinary tract, pelvic,bone and joint infections. A recent survey of 50pharmacies in Kumasi (the Ashanti regionalcapital and 2nd largest city in Ghana) by theauthors indicated 16 different brands of CPFtablets. Usually, influx of diverse and multi-sourcepharmaceutical products generates quality issues.Poor quality antimicrobial agents can be a majorthreat to the economy of Ghana because ofdevelopment of drug resistance with attendanthealth implications. Therefore, monitoring anti-infectives to preserve their therapeutic values,especially, in situations where cross resistance ispossible as is the case of the fluoroquinolones [14]is a relevant strategy. Newman et al., 2006,reported in their study ‘resistance to antimicrobialdrugs in Ghana’ that prevalence of resistance tociprofloxacin is about 10% [15]. However,Nankanishi and co-workers, had earlier reportedincreasing bacterial resistance to thefluoroquinolones [14] and a later study in
Bangladesh in 2001 by other researchers involvinga sample of 15 brands of ciprofloxacin collectedfor assay by HPLC and bioassay corroborated thefindings of Nankanishi et al. In the latter report,seven out of the 15 brands of medicines assayedhad active ingredient less than the USPspecification [16] and this is one of the main factorsof drug resistance development.
Current pharmacopoeia assay method (BritishPharmacopoeia (BP) and United StatesPharmacopoeia (USP)) for CPF is HighPerformance Liquid Chromatography (HPLC).Despite its usefulness in drug analyses, thetechnique is resource intensive in terms ofequipment, operation, accessories andconsumables including energy. Inexpensive butcomparable assay technique(s) will thereforeenhance the capacity of industry, regulators(national and quality control laboratories) andresearchers in emerging economies such as Ghana,to effectively control the quality of drugs,especially, agents for infectious and non-infectiousdiseases.
Our study therefore seeks to invigorate theapplication of extractive spectrophotometricmethods in Ghana for monitoring the content ofactive ingredients in pre- and post-marketingpharmaceutical products that are suitable for acid-dye ion-pair complex formation reactions. Ion-paircomplexes have been widely studied and utilizedin the assay of diverse pharmaceuticals in the bulkand formulations [17, 18, 19]. However, it isdifficult to find reports on specific application ofCPF:BPB ion-pair complex in the assay of CPFand its formulations. Unsuccessful attempt wasmade at getting the report of Sedai and Nihai inthis respect [20]. Consequently, the study took intoaccount the optimization of reaction conditions anddevelopment of an assay procedure for theapplication of the proposed method to CPFcontaining pharmaceutical agents.
THEORY
Fluoroquinolones ionize in acidic solution with thesecondary piperazinyl nitrogen bearing a positivecharge. 4,4'-(1,1-dioxido-3H-2,1-benzoxathiole-3,3-diyl)bis(2,6-dibromophenol) commonly calledbromophenol blue is a sulphonphthalein dyeusually used as an acid- base indicator whoseuseful range lies between pH 3.0 and 4.6. As ananionic dye, BPB in an aqueous buffered acidic

medium forms an ion-pair complex with CPFwhich can be extracted into a suitable organicsolvent such as trichloromethane (chloroform) ordichloromethane (methylene chloride) in order toseparate the ion-pair complex from the excess aciddye. The extracted chromogene can then bedetermined spectrophotometrically at thewavelength of maximum absorption. If theconcentration of dye is constant and in sufficientexcess to make dissociation negligible, theequilibrium concentration of the complex willessentially be proportional to the concentration ofCPF in the reaction. The pH of the aqueoussolution, when necessary, can be modified to keepthe analyte and acid dye in ionised forms. Neutralelectrolytes such as KCl, K2SO4 and NH4NO3 arecommonly used when needed to control the ionicstrength of the reaction to keep the dissociation ofthe ion-pair complex to the minimum. Theextensive conjugation in the structure of thecomplex as proposed in Figure 1 makes absorptionin the visible range of the electromagneticspectrum possible, giving the procedure theadvantage of avoiding irrelevant absorption fromother excipients and unwanted contents.
chloroform and glacial acetic acid weremanufactured by BDH, UK, while anhydroussodium acetate, bromophenol blue powder andperchloric acid were from Sigma-Aldrich, USA.They were all of analytical grade obtained fromthe Department of Pharmaceutical Chemistry,Kwame Nkrumah University of Science andTechnology, Kumasi, Ghana. The distilled waterused was doubly distilled. Ciprofloxacinhydrochloride pure powder (Pharmaceuticalgrade) was obtained from a local pharmaceuticalmanufacturing company and was manufacturedby Zhejiang Create Bio Chemical Co. Ltd., China.This pure powder was calibrated againstCiprofloxacin Hydrochloride USP which is areference standard and was obtained from theFood and Drugs Board, Ghana. Commerciallyavailable ciprofloxacin hydrochloride tabletsbought from pharmacies in Kumasi, Ghana forapplication of the method were; Ciprolet (DrReddy’s Laboratory, India), Cipflox (ErnestChemist Ltd., Ghana), Quintor (TorrentPharmaceuticals Ltd., India), Ciprinol (KRKA,Slovenia), Ciprokam (XL Laboratory Ltd, India)and Ciprofloxacin (Phyto-Riker PharmaceuticalsLtd., Ghana). Common laboratory glasswareincluding 50mL separatory funnels was used.Where necessary, filtration was done using theWhatman’s No. 1 filter paper. All measurementof weights was done with Libror (AEG-220)Analytical Electronic Balance. Other equipmentinclude Stuart Scientific (SF1) Flask Shaker,Buchi (B-480) Water Bath and Kent (EIL 7020)pH meter. Absorbance of solutions was measuredwith Cecil (CE 7200) Double Beam UV-VisibleSpectrophotometer with 1 cm matched glasscuvettes.
Preparation of Standard Solutions
The CPF, BPB and anhydrous sodium ethanoate(sodium acetate) powders were dried in an ovenat 100 °C for 4hrs and kept in a dessicator beforepreparing solutions. A stock CPF solution ofconcentration 1mgmL-1 was prepared in distilledwater by weighing an amount of powder equivalentto 100mg of ciprofloxacin into a 100mL volumetricflask. About 30mL of distilled water was initiallyadded, content shaken till all powder dissolved andsolution made up to 100mL with distilled water.A 100µgmL-1 CPF solution was further preparedby dilution from the stock with distilled water. Sixacetate buffer solutions of different pH ranging
Figure 1: Proposed Reaction Scheme for CPF:BPB ion PairComplex
EXPERIMENTALS
Materials, Reagents and Apparatus
Following are details of materials, reagents andapparatus utilised in the study. Ethanol (96%),
between 2.0 and 5.0 were prepared following themethod of the British Pharmacopoeia, 2007[21].A 500µgmL-1 solution of BPB was also preparedby dissolving a quantity of crystalline BPB powderequivalent to 50.0 mg of BPB in 20mL of ethanol(96%v/v). The alcoholic solution was quantitativelytransferred into a 100mL volumetric flask andmade up to the mark with distilled water. Further1 in 100 dilution of the stock was made to obtainthe 500µgmL-1 solution. All solutions wereproperly labeled and kept in a cool dry place awayfrom light.
Recommended General Method
Into a separatory funnel was measured 2mL of100µgmL-1 CPF, acetate buffer of pH 2.8 and 3mL 500µgmL-1 BPB solutions. The total volumewas adjusted to 10mL with doubly distilled water,mixing well and allowing the reaction toequilibrate for 10min at room temperature of29±1°C. Two 5mL portions of CHCl3 weresuccessively added to the content of the separatoryfunnel, shaking for about 2min each time andallowing the flask to stand for clear separation ofthe organic and aqueous layers. The yellowishchloroformic layer containing the ion-pair complexwas separated, pooled together and dried overanhydrous sodium tetraoxosulphate(vi) crystals.The absorbance of the chloroformic solution wasdetermined at 420nm against a reagent blankafter checking the absorbance and wavelengthscales of the spectrophotometer.
Application of Method to CommerciallyAvailable Tablet Samples
Twenty tablets of each brand (6) were weighedtogether and the average weight of a tablet foreach brand calculated. The set of twenty for eachbrand was then powdered in a porcelain mortarand a quantity of powdered tablets equivalent to100mg CPF transferred into a 100mL volumetricflask. About 30mL of distilled water wastransferred into the flask and the content wasshaken for 15min in a flask shaker at moderatespeed. The flask was made up to volume withdistilled water with intermittent manual shaking.The solution was filtered with Whatman.s no.1filter paper, discarding the first few milliliters offiltrate. Each brand was assayed with solutionsrespectively containing 75, 100 and 125µg (7.5-12.5µgmL-1) of CPF. The rest of the procedure wasthe same as already described under general
procedure, making triplicate determinations foreach analytical solution.
STATISTICAL ANALYSES
Graph Pad Prism Version 5.0 was used for thedescriptive statistics and the analysis of variancewhile Microsoft Excel 2007 was used for graphsand regression analyses.
RESULTS AND DISCUSSION
Preliminary Assessment of ExperimentalSamples and Investigation of Ion-pair ReactionConditions
Preliminary Assessment of Samples
The identity, strength, and stability ofpharmaceutical formulations are usually theelements assessed in controlling the quality ofdrugs using specific monograph requirements ofpharmacopoeias. Chemical samples therefore usedin designing assay methods for activepharmaceutical ingredients are evaluated forcompliance with specific pharmacopoeia standardsin order to make valid the analytical proceduredeveloped. In view of this, the pure CPF powder,commercial tablets and BPB were characterizedaccording to the specifications of BP 2007. Therespective identities were thus confirmed aspositive. To further rule out the possibility offormulation factors affecting the performance ofthe proposed procedure when it is applied to theassay of the tablets, uniformity of weight testaccording to BP 2007 was carried out on eachbrand of tablets. The variations in a randomsample of 20 tablets for each brand were withinpharmacopoeia limits. The average weight of atablet for each brand determined from theuniformity of weight test was used with the labeledcontent to define equivalent quantities ofpowdered CPF tablets to be taken for assay bythe proposed method.
Investigation of Reaction Conditions
The UV-visible characteristics of CPF, BPB, CHCl3and CHCl3 that has been used to extract BPB wereobtained to define baselines for the methoddevelopment process. Advantage was taken ofprevious studies involving other fluoroquinolonessuch as ofloxacin, lomefloxacin hydrochloride andenoxacin [19, 22] to determine the basic conditionsfor the formation of the CPF:BPB ion-pair complex.

An ion pair reaction was established by taking1mL of the 100µgmL-1 CPF solution into a 50mLseparatory funnel, adding 1mL of acetate bufferof pH 3.5 and 4mL of 0.50mg/mL BPB solution.The content of the flask was shaken for about fiveminutes and 4mL of distilled water added to bringthe total volume to 10mL. The aqueous solutionwas then extracted with 10mL of CHCl3, dryingthe organic layer over anhydrous sodiumtetraoxosulphate (vi) crystals and determining theUV-vis characteristics several times againstreagent blanks. Wavelength of maximumabsorption (»max ) of the extractive was 420±1.08nm(n = 6). The procedure was repeated two moretimes with 2 and 4 mL respectively of the 100µg/mL CPF solution, keeping the volumes of BPB andacetate buffer constant and making the volumeup to 10mL with distilled water. This was done toexamine the effect of increasing concentration ofanalyte on the consistency of the »max of theextractive. All the values obtained were within95% confidence interval (418.53-420.80nm),indicating how constant the »max can be in replicatedeterminations.
Optimisation of Reaction Conditions
Optimized reaction conditions were obtained byvarying one parameter at a time while keepingothers constant and monitoring the effect on theabsorbance of the extractive. The parametersoptimized were reaction time, critical pH of acetatebuffer, volume of acetate buffer, order of additionof reactants and reagents, shaking time, reactionstoichiometry and stability of extractive inchloroform. Appropriate volumes of distilled waterwere added in each case to keep the reactionmixture at a total volume of 10mL. Critical valuesof test parameters were graphically determined.
Reaction Time
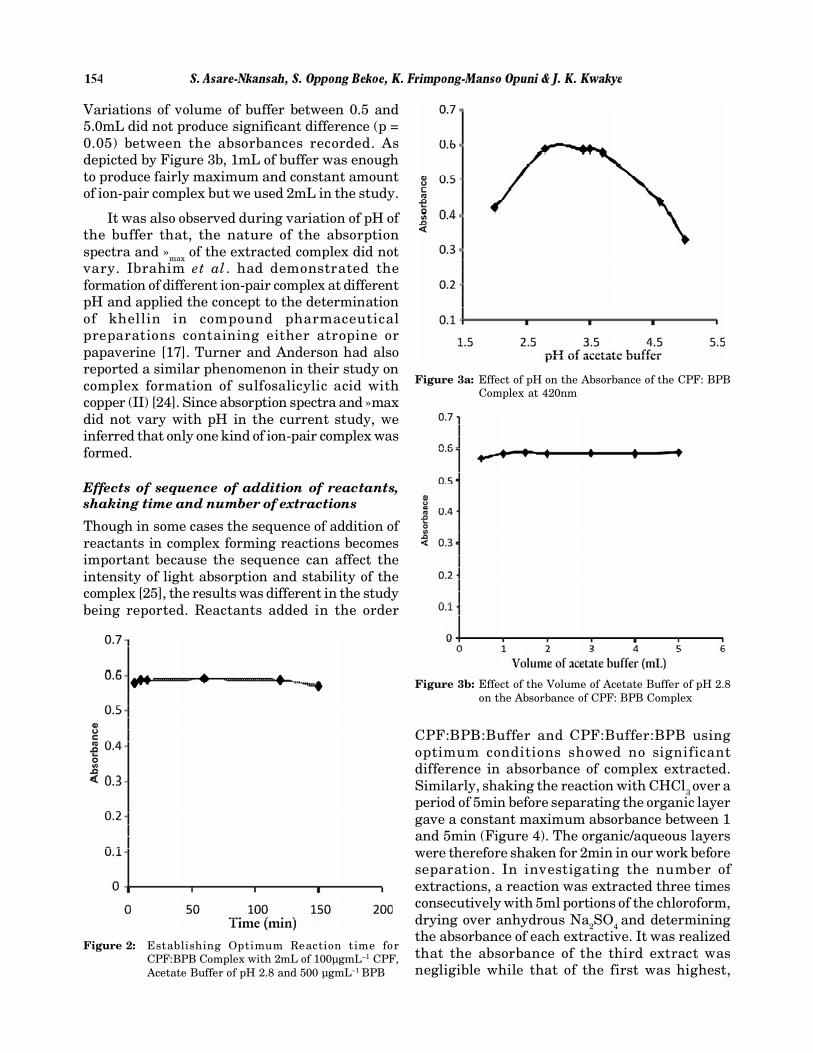
Figure 2 illustrates the effect of equilibration timeon the formation of the CPF: BPB ion-pair complex.Different sets of reaction monitored over 150minrevealed that ion-pairs were formed before 5minof equilibration, peaking off by 10min. Timerequired for maximum reaction was monitored byconstant maximum absorbance of the extractivein CHCl3. The graph indicates maximum reactionalmost to have taken place by 5min. Extraction ofthe complex into the organic solvent couldtherefore be done after 5min but the reaction timeallowed for the study was 10min. The relatively
short reaction time was good for the procedurebecause in most quality control applications, shortsample work-up times are preferable for efficiency.Even though absorbance of complex appearedfairly constant between 10 and 150min of reaction,a slight decrease in absorbance was observedbetween 120 and 150min of reaction. This wasprobably due to the dissociation of the complexwithin the reaction mixture. This postulate waslater supported by the ion-pair complex stabilitystudies where the complex was found stable inCHCl3 at room temperature even at 48hrs afterextraction. This observation therefore makes theextractive nature of the procedure useful,especially in situations where large numbers ofanalytical samples have to be analysed and samplestorage cannot be avoided.
Effect of pH and Volume of Acetate Buffer onFormation of Ion-pair Complex
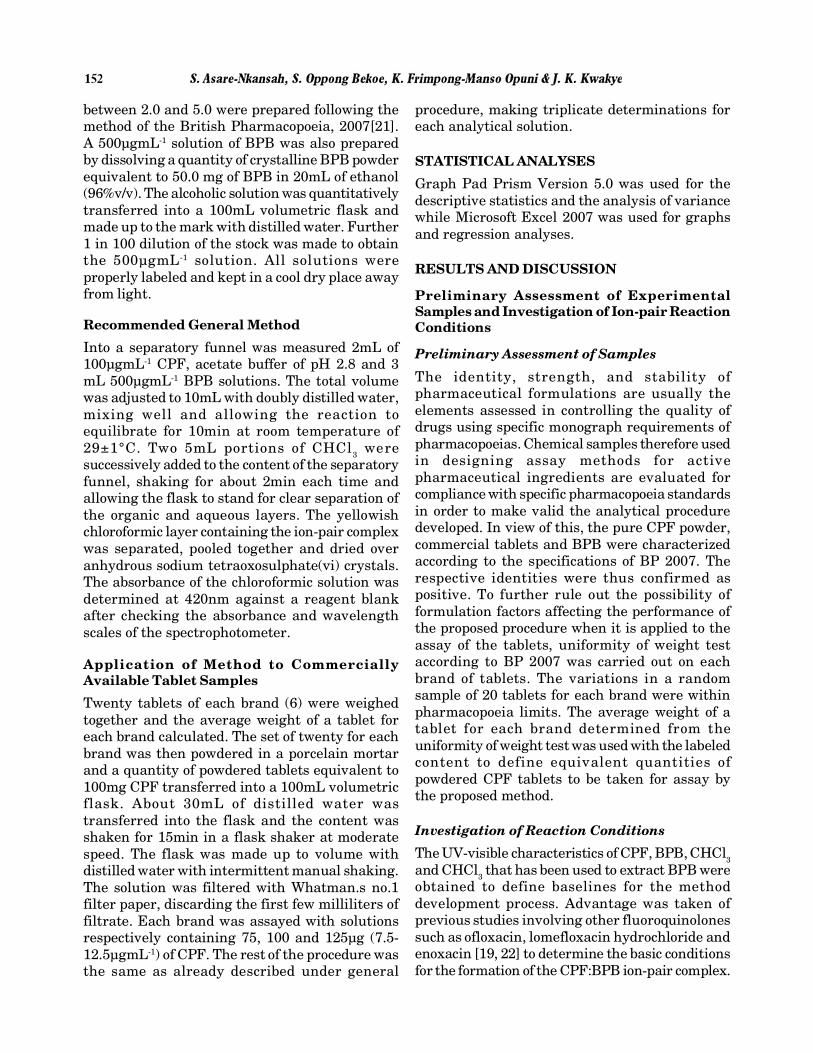
Optimum pH of buffer was studied by adding toreaction mixture same volume of acetate buffer ofdifferent pH (2.0-5.0) at room temperature. Theother components were 2mL and 4mL of CPF andBPB solutions respectively, making up to volumewith doubly distilled water. Allowing a reactiontime of 10min, the absorbance of each chloroformicextract was obtained in replicates against reagentblanks. Figure 3a indicates that a maximum andrelatively constant absorbance of ion-pair complexwas obtained between pH 2.8 and 4.0 suggestingan evidence of moderate acidity as a requirementfor the maximum formation of CPF:BPB complex.Related studies have reported similar observationsusing sulphonphthalein dyes and buffers such asacetate, potassium hydrogen phthalate andMcIlvaine [17, 19, 22]. Reaction environmentscontaining buffers of pH less than 2.8 and greaterthan 4.0 as shown in Figure 3a probably did notsupport formation of maximum ion-pairs becausethe reaction environment failed to keep both theanionic dye and counter-ion fully in ionized forms.This assumption was supported by the fact thatmodern spectroscopic methods have proven ion-pair formation as involving electrostatic,hydrophobic and charge transfer interactions [23].Therefore, a reaction environment that is unableto maintain maximum ionized species fails toprovide maximum complex formation. In thatrespect, an optimum pH of 2.8 was used for thiswork but any other pH between 2.8 and 4.0 couldprovide similar results as the current study.
Variations of volume of buffer between 0.5 and5.0mL did not produce significant difference (p =0.05) between the absorbances recorded. Asdepicted by Figure 3b, 1mL of buffer was enoughto produce fairly maximum and constant amountof ion-pair complex but we used 2mL in the study.
It was also observed during variation of pH ofthe buffer that, the nature of the absorptionspectra and »max of the extracted complex did notvary. Ibrahim et al. had demonstrated theformation of different ion-pair complex at differentpH and applied the concept to the determinationof khellin in compound pharmaceuticalpreparations containing either atropine orpapaverine [17]. Turner and Anderson had alsoreported a similar phenomenon in their study oncomplex formation of sulfosalicylic acid withcopper (II) [24]. Since absorption spectra and »maxdid not vary with pH in the current study, weinferred that only one kind of ion-pair complex wasformed.
Effects of sequence of addition of reactants,shaking time and number of extractions
Though in some cases the sequence of addition ofreactants in complex forming reactions becomesimportant because the sequence can affect theintensity of light absorption and stability of thecomplex [25], the results was different in the studybeing reported. Reactants added in the order
CPF:BPB:Buffer and CPF:Buffer:BPB usingoptimum conditions showed no significantdifference in absorbance of complex extracted.Similarly, shaking the reaction with CHCl3 over aperiod of 5min before separating the organic layergave a constant maximum absorbance between 1and 5min (Figure 4). The organic/aqueous layerswere therefore shaken for 2min in our work beforeseparation. In investigating the number ofextractions, a reaction was extracted three timesconsecutively with 5ml portions of the chloroform,drying over anhydrous Na2SO4 and determiningthe absorbance of each extractive. It was realizedthat the absorbance of the third extract wasnegligible while that of the first was highest,
Figure 2: Establishing Optimum Reaction time forCPF:BPB Complex with 2mL of 100µgmL–1 CPF,Acetate Buffer of pH 2.8 and 500 µgmL–1 BPB
Figure 3a: Effect of pH on the Absorbance of the CPF: BPBComplex at 420nm
Figure 3b: Effect of the Volume of Acetate Buffer of pH 2.8on the Absorbance of CPF: BPB Complex

pooling over 90% of the three extractions. Sincethe second extract gave absorbance values thatcould not be neglected, two 5mL aliquotextractions was adopted and applied.
change in absorbance of the chloroformicextractive suggested the formation of the ion-paircomplex. Looking at Figure 5b, beyond theequivalence point, further increase inconcentration of BPB did not yield significantincrease in absorbance of the extractives.Obradovic et al. had explained that a continualincrease of absorbance beyond the equivalencepoint in Yoe and Jones’ method indicates theformation of a complex with low stability [28].Since Figure 5b virtually leveled off after theequivalence point, it was inferred that theCPF:BPB complex was not weak in stability. Thisposition was later supported by the calculation ofthe logarithmic stability constants from theHarvey and Manning method [29] using the dataof continuous variations and the molarratio methods. For the continuous variationsmethod, the mathematical relationship used was;Kf = (A/Am)/[(1-A/Am)]n+1Cm(n)n where A and Am arerespectively the observed maximum absorbanceand the absorbance value when all the drugpresent in the reaction is associated. Cm is themolar concentration of CPF at the maximumabsorbance and n is the number of moles of BPBrequired to form complex with 1 mol of CPF. Withthe mole ratio method; Kf = (1-±)/(±2C) where C isthe concentration of the complex usually definedby that of the limiting reagent and ± is the degreeof dissociation given by; ± = (Am-A)/Am. Am is theabsorbance of the complex when excess BPB ispresent and A is the absorbance of the complex atthe equivalence point. Logarithmic valuesobtained for both methods were respectively5.95±0.110 and 5.76±0.214 (n=3) at 29±1 °C. Thefree energies of formation calculated by �H =RTInK using dissociation constants from both thecontinuous variations and mole ratio approacheswere -34,401.00 Jmol-1(-8217.11 Calmol-1) and -33,326.83Jmol-1(-7960.54Calmol-1) respectively.These values suggested that the CPF:BPB complexhad reasonable stability. The degree of dissociation(±) of the complex was found as 0.163.
In determining the optimum volume of BPBrequired for maximum complex formation, 2mLof 100µgmL-1CPF was used. Volumes of BPBranging between 0.1-5.0mL (500µgmL-1) wereindividually used and their respective effect onabsorbance of the complex monitored. Figure 5cshowed that an approximate volume of 1mL gavean absorbance beyond which further increase involume of BPB did not yield proportional increase
Figure 4: Effect of Shaking Time on the Efficiency ofExtraction of CPF: BPB Complex into CHCl3
Stoichiometry of Ion-pair Reaction, StabilityConstant of Complex and Determination ofOptimum Volume of BPB (500µgmL-1)
The stoichiometry of the reaction was determinedby Job’s method of continuous variations [26] andYoe and Jones’ mole ratio method [27]. Using Job’smethod, equimolar solutions (2.718x10⁻⁴ M) of CPFand BPB were prepared and mixed in the volumeratios 1:9 to 9:1. Total volume of CPF/BPB was5mL but in each case, acetate buffer and distilledwater were added to the separatory funnel to bringthe total volume to 10mL, following optimumreaction conditions. From Figure 5a, it is realizedthat maximum absorbance of the extractedcomplex occurred at a mole fraction of 0.5indicating the stoichiometric ratio of the complexas 1:1. With the mole ratio method, a series ofreactions containing a constant concentration ofCPF (5.44x10⁻⁴ M) and varying concentrations ofBPB (7.46x10⁻⁶-3.73x10⁻⁴M) were prepared andanalysed under optimal conditions. Figure 5bdescribes the profile of ion-pair associate formationwith the varying BPB concentrations. It is clearfrom the graph that the mole ratio of reactantsthat gave a constant maximum absorbance ofextracted ion-pair associates was 1:1. Earlierstudies involving other fluoroquinolones hadreported same ion-pair composition [19, 22]. Inboth methods, the fact that change inconcentration of one of the reactants resulted in
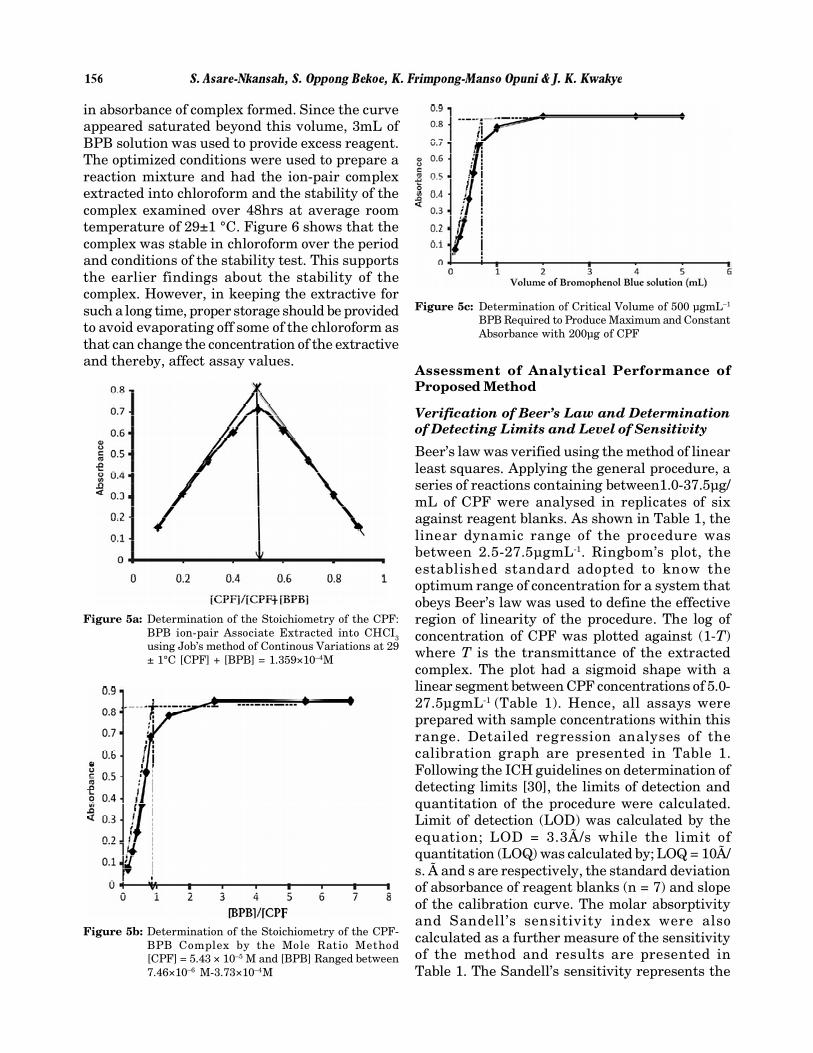
in absorbance of complex formed. Since the curveappeared saturated beyond this volume, 3mL ofBPB solution was used to provide excess reagent.The optimized conditions were used to prepare areaction mixture and had the ion-pair complexextracted into chloroform and the stability of thecomplex examined over 48hrs at average roomtemperature of 29±1 °C. Figure 6 shows that thecomplex was stable in chloroform over the periodand conditions of the stability test. This supportsthe earlier findings about the stability of thecomplex. However, in keeping the extractive forsuch a long time, proper storage should be providedto avoid evaporating off some of the chloroform asthat can change the concentration of the extractiveand thereby, affect assay values.
Assessment of Analytical Performance ofProposed Method
Verification of Beer’s Law and Determinationof Detecting Limits and Level of Sensitivity
Beer’s law was verified using the method of linearleast squares. Applying the general procedure, aseries of reactions containing between1.0-37.5µg/mL of CPF were analysed in replicates of sixagainst reagent blanks. As shown in Table 1, thelinear dynamic range of the procedure wasbetween 2.5-27.5µgmL-1. Ringbom’s plot, theestablished standard adopted to know theoptimum range of concentration for a system thatobeys Beer’s law was used to define the effectiveregion of linearity of the procedure. The log ofconcentration of CPF was plotted against (1-T)where T is the transmittance of the extractedcomplex. The plot had a sigmoid shape with alinear segment between CPF concentrations of 5.0-27.5µgmL-1 (Table 1). Hence, all assays wereprepared with sample concentrations within thisrange. Detailed regression analyses of thecalibration graph are presented in Table 1.Following the ICH guidelines on determination ofdetecting limits [30], the limits of detection andquantitation of the procedure were calculated.Limit of detection (LOD) was calculated by theequation; LOD = 3.3Ã/s while the limit ofquantitation (LOQ) was calculated by; LOQ = 10Ã/s. Ã and s are respectively, the standard deviationof absorbance of reagent blanks (n = 7) and slopeof the calibration curve. The molar absorptivityand Sandell’s sensitivity index were alsocalculated as a further measure of the sensitivityof the method and results are presented inTable 1. The Sandell’s sensitivity represents the
Figure 5a: Determination of the Stoichiometry of the CPF:BPB ion-pair Associate Extracted into CHCI3using Job’s method of Continous Variations at 29± 1°C [CPF] + [BPB] = 1.359×10⁻⁴M
Figure 5b: Determination of the Stoichiometry of the CPF-BPB Complex by the Mole Ratio Method[CPF] = 5.43 × 10⁻⁵ M and [BPB] Ranged between7.46×10–6 M-3.73×10⁻⁴M
Figure 5c: Determination of Critical Volume of 500 µgmL–1
BPB Required to Produce Maximum and ConstantAbsorbance with 200µg of CPF

number of micrograms of the analyte per mL of asolution having an absorbance of 0.001 for apathlength of 1cm (0.001/A(1%, 1cm). Consideringall the evaluations of sensitivity, it can be realizedfrom Table 1 that the method was sensitive andsound for its purpose. It may be possible to adoptit for determining some fluoroquinolones inbiological fluids such as serum and urine.
Table 1Optical Characteristics, Detecting Limits andLinear Regression Data for Proposed Method
Parameter Value
Wavelength of maximum absorption (nm) 420
Beer’s Law range (µgmL-1) 2.5-27.5
Ringbom limits (µgmL-1) 5.0-27.5
Molar absorptivity (Lmol-1cm-1) 1.06x10⁴
Sandell’s Sensitivity Index(µgcm-2) 0.036
LOD (µgmL-1) 0.383
LOQ (µgmL-1) 1.16
Slope±sd 0.028±0.0002
Intercept±sd 0.021±0.0034
R2 0.9996
described was followed, determining theabsorbance of each different concentration thriceand calculating the respective recoveries. Thesame procedure was repeated on two other days.From Table 2, the relative standard deviation forthe six determinations in each of the threeoccasions was between 0.357-0.554%, indicatinga good measure of intra-day precision orrepeatability of the procedure. The standard errorof the mean and confidence interval at 95%presented in Table 3 also indicate good intra-dayprecision. Using one-way analysis of variance,Bartlett’s test for equal variances and Bonferroni’sMultiple Comparison Test, there was nosignificant difference among the recovery dataobtained over the three different occasions of assay.This implies that analyses done with the procedureon different occasions under similar conditions canhave comparable results in terms of accuracy andinter-day precision The average recovery of theproposed method over the three days was101.4±0.44 (n=18), further demonstrating theaccuracy of the method. It also meant thatcomponents of the tablet matrix added by standardaddition did not have observable interference withformation of the CPF:BPB complex.
Application of Method to CommerciallyAvailable CPF Tablets
The method has successfully been applied to theassay of six brands of CPF tablets. From Table 4,the percentage content of each brand fell withinthe monograph specification of the BritishPharmacopoeia (95.0-105.0%w/w). Even thoughthe HPLC method recommended by the BP wasnot applied to the samples, the accuracy of themethod was validated by the recovery studies [30].The HPLC facility was not readily available at thetime of the study and the lack of access was a majorreason behind the study design. The method hashowever proven to be simple, cost effective anduser-friendly. This is because the process does notrequire laborious sample preparations but usessimple laboratory reagents, glass ware andequipment and yet as sensitive as alreadydescribed by the detection limits, molarabsorptivity and the Sandell’s sensitivity index.It does not require too much skill to apply butproduces accurate results that can be replicated.In addition, either silica or glass cuvettes can beused for absorbance measurements, providingfurther flexibility in its application.
Figure 6: Stability of CPF: BPB Complex in CHCl3 over aPeriod of 48hrs
Recovery Studies, Intra- and Inter-dayVariations
Before the assay of the CPF tablets, the accuracy,repeatability and intermediate precision of theproposed method were evaluated. Recovery studieswere done by the standard addition method. Toeach of a series of solutions already containing100µg of CPF from a preanalysed tablet matrix,was added between 25.0-275.0µg of pure CPF insolution. The general procedure as already

Table 2Recovery Studies, Intra-day and Inter-day Variations of Proposed Method
Sample Sample *Total Found(µg) *Recovery (%)Taken (µg) Added
(µg) Day 1 Day 2 Day 3 Day 1 Day 2 Day 3
100.0 25.0 125.16 125.47 125.43 100.64 101.88 101.72100.0 50.0 150.82 150.30 150.27 101.64 100.60 100.54100.0 75.0 176.18 176.71 176.07 101.57 102.23 101.43100.0 100.0 201.24 201.41 201.34 101.24 101.41 101.34100.0 125.0 226.82 227.31 226.79 101.46 101.85 101.43100.0 150.0 252.06 252.24 252.05 101.37 101.49 101.37
Mean 101.32 101.58 101.31RSD 0.357 0.554 0.393SEM 0.148 0.230 0.163CI (p =0.05) 100.94- 100.99- 100.89-
101.70 102.17 101.72
*Each value is the mean of three replicate determinations
Table 3Statistical Evaluation of Intra- and Inter-day Variations using One-way Analysis of Variance,
Bartlett’s Test for Equal Variances and Bonferroni’s Multiple Comparison Test
Parameter Statistical value& inference
One-way analysis of varianceP value 0.5159P value summary nsAre means signif. different? (P < 0.05) NoNumber of groups 3F 0.6920R squared 0.08447Bartlett’s test for equal variancesBartlett’s statistic (corrected) 1.037P value 0.5955P value summary nsDo the variances differ signif. (P < 0.05) NoBonferroni’s Multiple Comparison Significant? P <Test Mean Diff. t 0.05? SummaryDay 1 vs Day2 -0.2567 0.9887 No nsDay 1 vs Day 3 0.01500 0.05778 No nsDay2 vs Day 3 0.2717 1.046 No ns
In spite of likely different excipients used bydiverse manufacturers, assay results did notappear to have had interference from theexcipients, probably because absorbance in longerwavelengths usually filters off backgroundirrelevant absorption that could have taken placeat shorter wavelengths. The pH dependency of thecomplex also makes the procedure useful in multi-component applications as well as differentiatinganalyte from any excipients with unrelatedphysicochemical properties.
The demonstration of mechanics of theCPF:BPB ion-pair complex and success of itsapplication to assay CPF tablets suggest that thetechnique can be useful in low technicallyresourced environments for quality monitoringof CPF and its analogues. The technique can alsobe extended to cover all such medicinal agentswith the chemical moiety to pair withsulponphthalein dyes under the necessaryconditions.

CONCLUSION
Ion-pair complex formation and extractivespectrophotometry is a useful, cheaper andaccurate analytical alternative for monitoring thequality of susceptible drug candidates in the pureand formulations in places where recommendedmethods with highly sophisticated and capitalintensive equipment cannot be afforded. In thisregard, CPF and its congeners on the Ghanaianmarket can be regularly assessed to removesubstandard products to avoid treatment failuresand development of resistance and cross resistanceto chemotherapeutic agents.
AcknowledgementThe University of Michigan African Presidential ScholarsProgram (UMAPS) through the African Studies Center is dulyacknowledged for the sponsorship to come to Michigan to usethe library resources of the University to prepare this article.
References[1] White Paper, USP’s Role in Assuring Global Access to
Quality Medicines. Council of the Convention Section onGlobal Public Health, September 23, 2009.
[2] Behrens R. H., Awad A. I., Taylor R. B., Substandardand Counterfeit Drugs in Developing Countries. TropicalDoct., 32, 2002, 1-2.
[3] Shakoor O., Taylor R. B., Behrens R. H., Assessment ofthe Incidence of Substandard Drugs in DevelopingCountries. Tropical Medicine and International Health,2, 1997, 839–845.
[4] Primo-Carpenter J., A Review of Drug Quality in Asiawith Focus on Anti-Infectives. United StatesPharmacopoeia Drug Quality and Information Program,February 2004. Available onwww.usp.org/pdf/EN/dqi/aneReview.pdf (Acccesed on 2010-06-14).
[5] Pecoul B., Chirac P., Trouiller P., et al., Access to EssentialDrugs in Poor Countries: A Lost Battle? JAMA, 281, 1999,361-7.
[6] Management Sciences for Health, Managing drug Supply:The Selection, Procurement, and use of Pharmaceuticals,2nd edition, West Hartford, Connecticut: Kumarian Press,Inc, 1997: 272-87.
[7] Taylor R. B., Shakoor O., Behrens R. H., Drug Quality, aContributor to Drug Resistance. Lancet, 356, 1995, 122.
[8] Alubo S. O., Death for Sale: A Study of Drug Poisoning inNigeria. Soc Sci Med., 97, 1995, 103.
Table 4Assay of Ciprofloxacin Hydrochloride Tablets with Proposed Method
Brand Quantity Taken Mean Quantity Mean % Overall Mean %(µg) Found (µg)(n=3) content (n=3) content for Brand
CIPLOX 75.0 77.02 102.69 102.7±1.12
100.0 101.56 101.56
150.0 155.70 103.80
CIPROLET 75.0 75.11 100.15 101.8±1.44
100.0 102.67 102.67
150.0 153.92 102.61
QUINTOR 75.0 73.90 98.53 99.6±1.002
100.0 99.65 99.65
150.0 150.79 100.53
CIPRINOL 75.0 73.90 98.53 98.4±1.09
100.0 97.31 97.31
150.0 149.22 99.48
CIPROKAM 75.0 73.10 97.46 99.6±4.02
100.0 97.11 97.11
150.0 156.36 104.24
CIPROFLOXACIN 75.0 74.24 98.99 102.3±2.95
100.0 103.12 103.12
150.0 157.06 104.71

�����������������������������������������������������������������������������������������������������������������������������������������������������������������������������������������������������������������