improving regional air quality model results at the city scale : results from the ec4macs project...
Post on 21-Dec-2015
217 views
TRANSCRIPT
Improving regional air quality model results at the city scale : results from the EC4MACS project
INERIS : Bertrand Bessagnet, Etienne Terrenoire, Augustin Colette, Laurent Létinois, Laure Malherbe , Laurence Rouïl, Frédéric Tognet, Anthony Ung
RSE/INERIS : Guido Pirovano
DCO - 08/09/2004 - titre - 2
CityDelta background
EC4MACS « urban modelling » component : better account for the urban dimension in the integrated assessment modelling
What? : concentration increment (or decrement) due to the city itself Why? : to correct coarse resolution model used in integrated assessment
How? :
• Can be defined as δ=Chigh- Clow
• In the former CityDelta exercice : with a set of CTM results over 7 cities in Europe that lead to a single formula for all European cities
• CHIMERE high resolution (7 km) simulation over a large part of Europe [ECMWF data + WRF ; EMEP emissions]

DCO - 08/09/2004 - titre - 3
Improving emissions
« residential emissions » (SNAP2) reallocated with population density (+ wood burning share urban vs rural with french data)
« Crops » landuse proxy for Agricultural sector « built-up » landuse proxy for the other anthropogenic sectors « roadmap » proxy for road traffic emissions (in progress)
PPM2.5 emission beforePPM2.5 emission after

DCO - 08/09/2004 - titre - 4
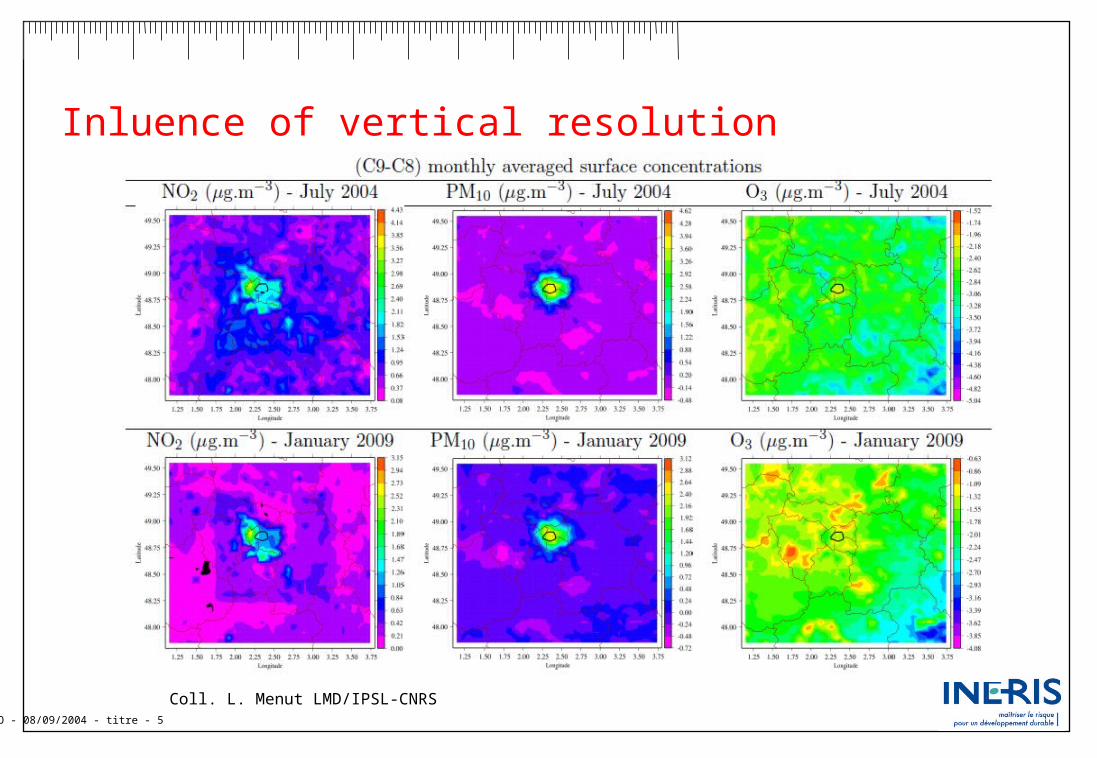
Inluence of vertical resolution
Three simulations performed with CHIMERE over the Paris area• C8 : Reference run with 8 levels (first at 40 m) up to 500
Hpa
• C20 : Simulation with 20 levels (first at 40 m) up to 500 Hpa
• C9 : Simulation with 9 levels (first at 10 m) up to 500 Hpa
DCO - 08/09/2004 - titre - 5
Inluence of vertical resolution
Coll. L. Menut LMD/IPSL-CNRS

DCO - 08/09/2004 - titre - 6
Improving horizontal resolution – why 7 km resolution?
For secondary pollutants like O3, 12 km seems an optimal resolution (Valari and Menut , 2008)
From the POMI exercize , no gain from 6km to 3 km (even for PM)
Computing time…(increase of grid cell number and decrease of time step)

DCO - 08/09/2004 - titre - 7
The simulation domains A high resolution run is performed
over the grey domain (7 km)
A high resolution run is performed over the grey domain
For each small cell (i,j) :
the high res. conc :
the coarse res. Conc. :
the averaged concentration :
(i,j)
COARSE (50 km)
NEST (7km) 300 x 400 grid points!
DELTA assumed to be :

DCO - 08/09/2004 - titre - 8
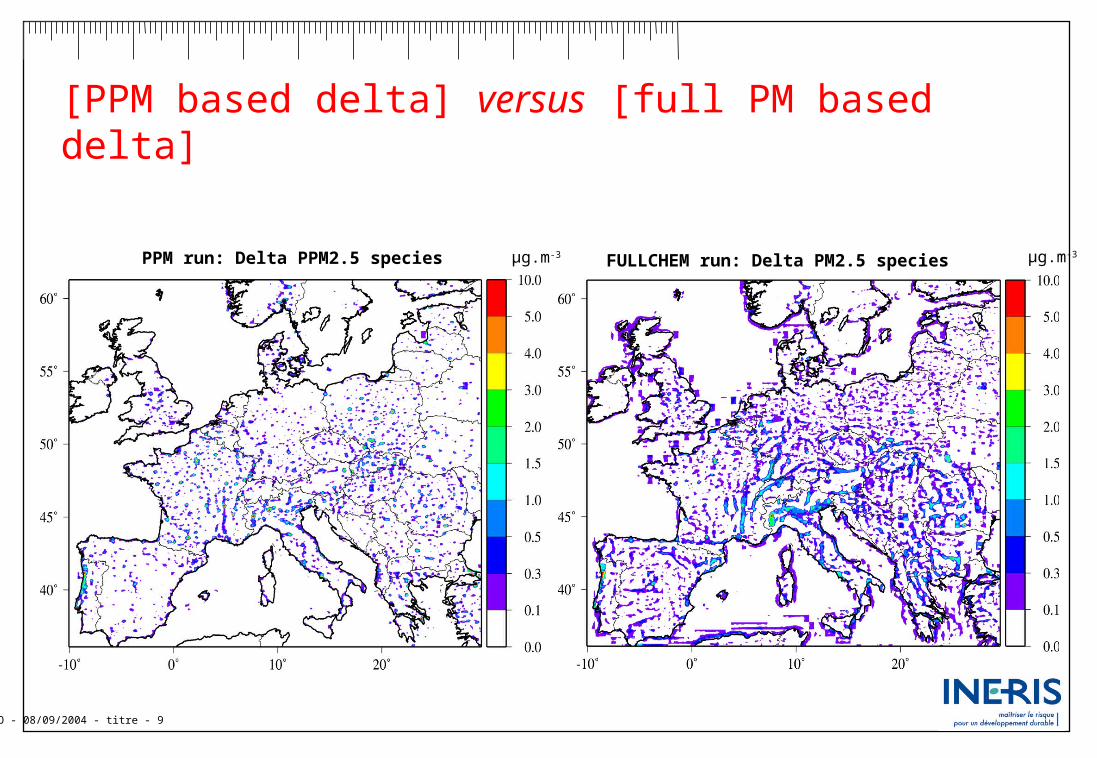
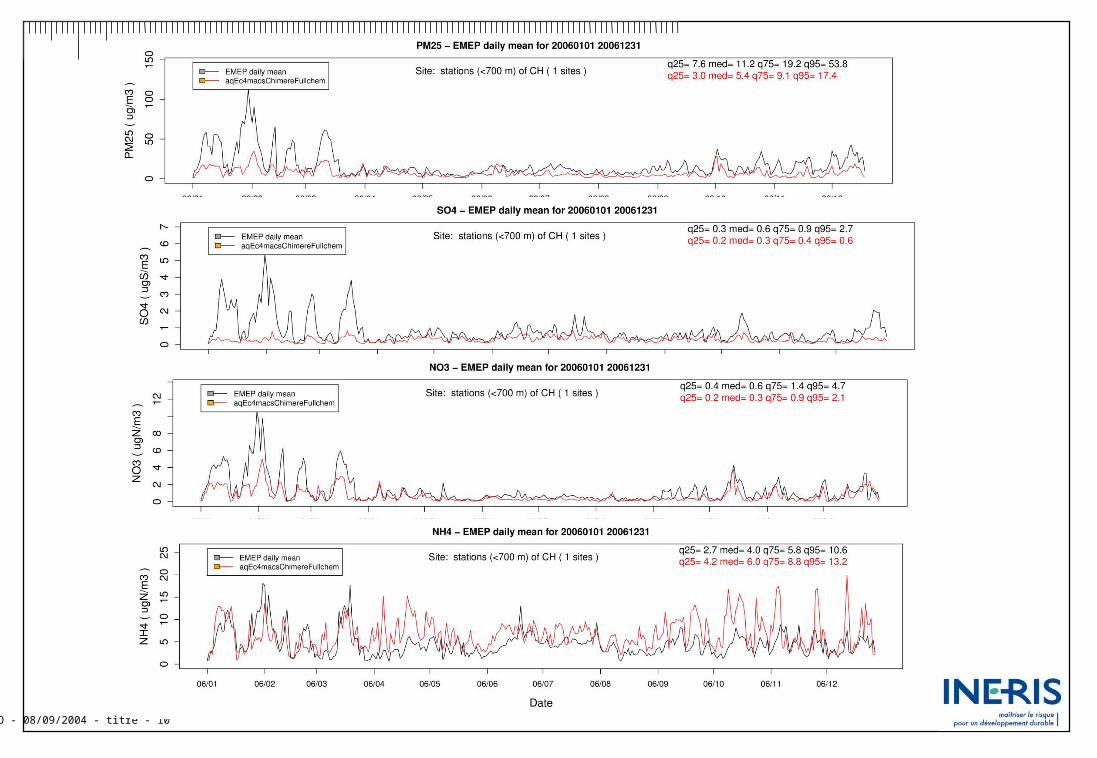
Simulation results Two simulations performed for the year 2006 :
• A simulation with only primary particulate matter and low level sources (SNAP 2, 7 and partly 3) PPM run
• A full chemistry run
Delta PPM2.5 species
2006
µg.m-3
1 2 3 4 5 6 7 8 9 10 11 120
1
2
3
4
5
6
Wien
Month
DCO - 08/09/2004 - titre - 9
[PPM based delta] versus [full PM based delta]
PPM run: Delta PPM2.5 species FULLCHEM run: Delta PM2.5 species µg.m-3 µg.m-3
DCO - 08/09/2004 - titre - 10
DCO - 08/09/2004 - titre - 11
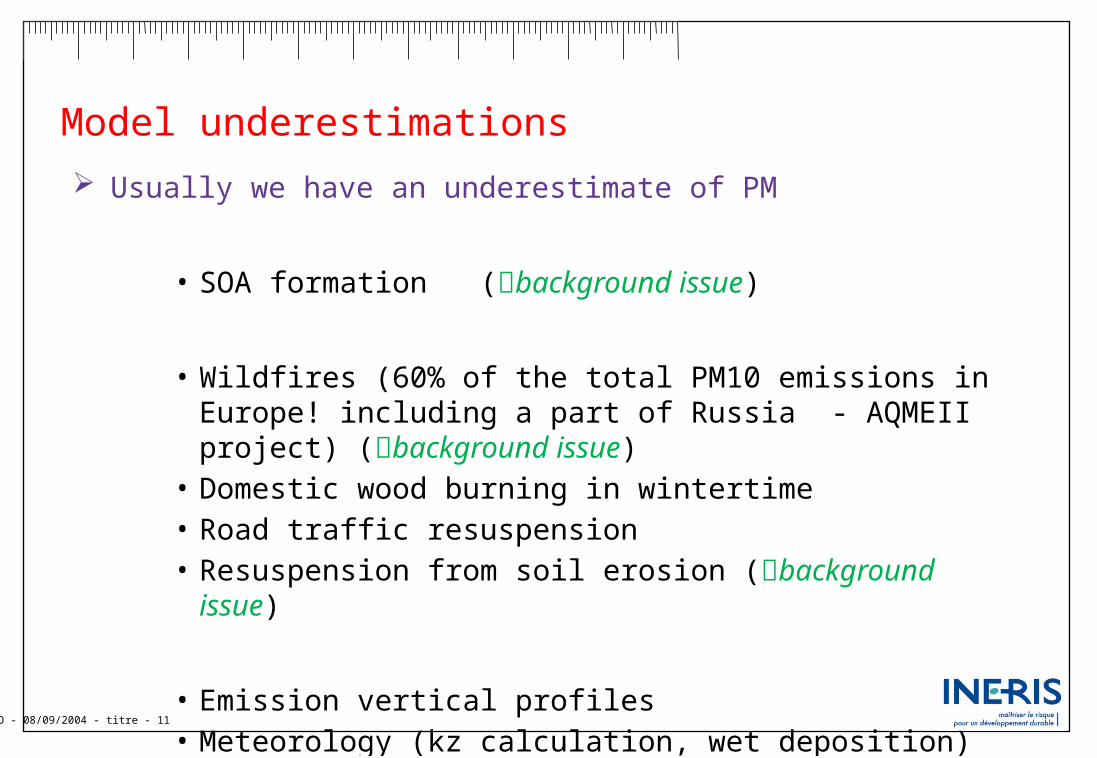
Model underestimations
Usually we have an underestimate of PM
• SOA formation (background issue)
• Wildfires (60% of the total PM10 emissions in Europe! including a part of Russia - AQMEII project) (background issue)
• Domestic wood burning in wintertime • Road traffic resuspension• Resuspension from soil erosion (background issue)
• Emission vertical profiles• Meteorology (kz calculation, wet deposition)

DCO - 08/09/2004 - titre - 12
PM2.5 Jan 2006 – using EMEP vertical profile for SNAP 2 emissions
DCO - 08/09/2004 - titre - 13
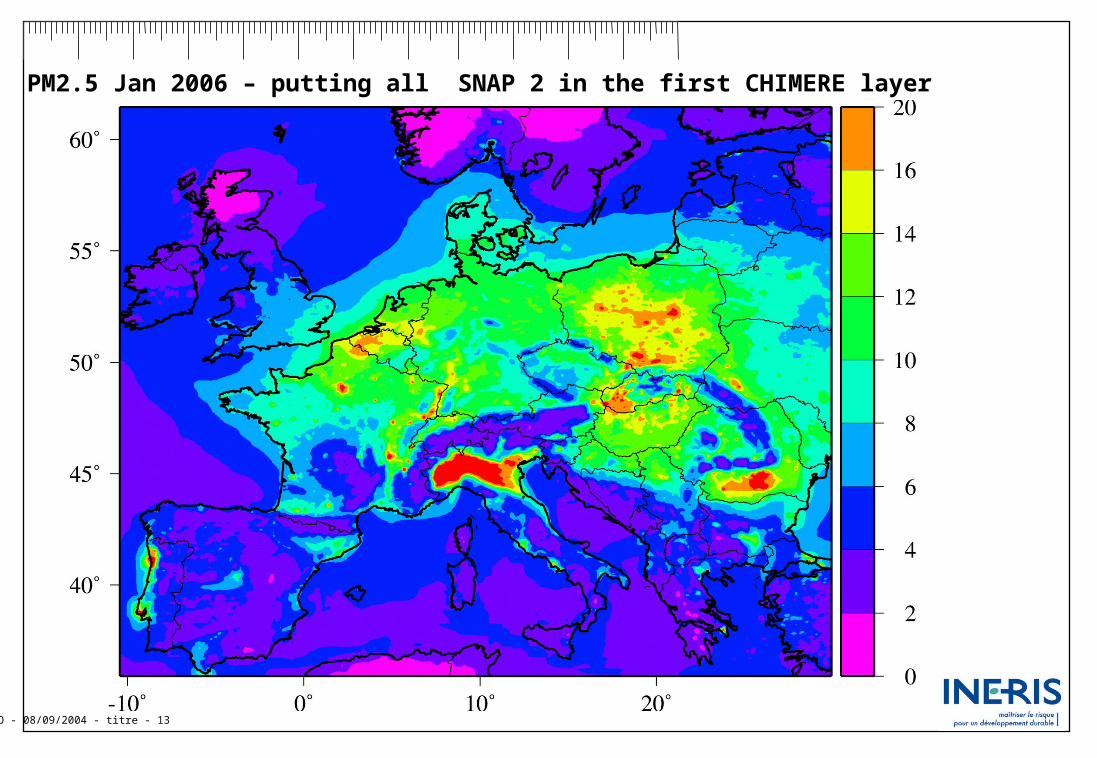
PM2.5 Jan 2006 – putting all SNAP 2 in the first CHIMERE layer

DCO - 08/09/2004 - titre - 14
Impact of emision injection heights of city deltas

DCO - 08/09/2004 - titre - 15
Conclusion
Downscaling method of EMEP emission dataset improved for our high resolution
High resolution run was performed over Europe to compute citydeltas
Improvment of CHIMERE runs at all resolutions (high and low)
Define a strategy to use « deltas » in integrated assessment model

DCO - 08/09/2004 - titre - 16
Extra slides

DCO - 08/09/2004 - titre - 17
About validation…
Pratically, it is not possible to validate a « delta »
δ=Chigh- Clow ; Chigh and Clow are comparable with measurements, but δ ??
What is the order of magnitude of PM2.5 deltas? With measurements in 2009, we roughly estimate the delta =1.6 µg.m-3 versus 0.94 µg.m-3 found in our work (for 2006).
Validation on PM2.5 for the “full chemistry run”
City

DCO - 08/09/2004 - titre - 18
Box model approximation
Reminder : a coefficient K is defined by city as δ=K.Q
Possible implementation of a box model by city to introduce a sensitivity to meteorological parameter
Box model increment :
Xcity= diameter of the city (m)
Xbckg= charateristic length of the background (m) (EMEP grid compliant)
Scity= surface of the city (m²)
Sbckg= surface of the low resolution cell (m2)
Q= city emissions (kg/s)
h= ABL height
U= Wind speed at 10m (m/s)

DCO - 08/09/2004 - titre - 19
CityDelta background – are observations useful to compute the citydelta?
Main goal is to correct a coarse EMEP simulation
• We can consider : δideal=Creal – Clow then, δideal corrects the model behavior and the lack of sources (using optimal interpolation methods)
• Then , δideal= δknown physics and emissions + δmissing sources & processes
• And , δideal=K.Q + δmissing sources & processes
• We must correct only what we know, implementing observations in the methodology introduces a bias difficult to handle in GAINS calculations
Computed in this work
What to do with this term? Nothing!

DCO - 08/09/2004 - titre - 20

DCO - 08/09/2004 - titre - 21
Background O3 (AVERAGE)
Background O3 (low resol)
ppb

DCO - 08/09/2004 - titre - 22
AQMEII project
Area Point Fire TotalCO 33 250 900 5 656 101 39 982 886 (50.7%) 78 889 887
NOx 12 192 815 4 537 769 1 233 454 (6.9%) 17 964 038
NMVOC 10 682 173 1 323 089 552 780 (4.4%) 12 558 042
SO2 4 329 097 9 565 896 170 122 (1.2%) 14 065 115
PM10 2 578 181 1 109 540 5 396 873 (59.4%) 9 084 594
NH3 5 115 214 130 631 595 396 (10.2%) 5 841 241
Domain-wide yearly emissions [tons/y]