improving the effectiveness of nighttime temporary traffic control
TRANSCRIPT
CIVIL ENGINEERING STUDIES Illinois Center for Transportation Series No. 13-032
UILU-ENG-2013-2033 ISSN: 0197-9191
IMPROVING THE EFFECTIVENESS OF NIGHTTIME TEMPORARY TRAFFIC
CONTROL WARNING DEVICES, VOLUME 2: EVALUATION OF NIGHTTIME MOBILE
WARNING LIGHTS
Prepared By Douglas A. Steele
Jessica Marcon Zabecki Laura Zimmerman
Applied Research Associates, Inc.
Research Report No. FHWA-ICT-13-032
A report of the findings of ICT-R27-108
Improving the Effectiveness of Nighttime Temporary Traffic Control Warning Devices
Illinois Center for Transportation
November 2013

Technical Report Documentation Page 1. Report No. FHWA-ICT-13-032
2. Government Accession No.
3. Recipient's Catalog No. N/A
4. Title and Subtitle Improving the Effectiveness of Nighttime Temporary Traffic Control Warning Devices, Volume 2: Evaluation of Nighttime Mobile Warning Lights
5. Report Date November 2013
6. Performing Organization Code
7. Author(s) Douglas A. Steele, Jessica Marcon Zabecki, and Laura Zimmerman
8. Performing Organization Report No. ICT-13-032 UILU-ENG-2013-2033
9. Performing Organization Name and Address Applied Research Associates, Inc. 100 Trade Centre Drive, Suite 200 Champaign, IL 61820
10. Work Unit No. (TRAIS) 11. Contract or Grant No. R27-108
12. Sponsoring Agency Name and Address Illinois Department of Transportation Bureau of Materials and Physical Research 120 E. Ash St. Springfield, IL 62704
13. Type of Report and Period Covered 14. Sponsoring Agency Code
15. Supplementary Notes 16. Abstract Vehicle-mounted warning lights for nighttime mobile highway operations provide critical protection to workers and the driving public. Alerting the traveling public of the approaching work activity and providing guidance is vital to maintaining safety and mobility. Previous research conducted for IDOT on mobile lane closures (Steele and Vavrik 2009) identified driver confusion as a concern to the safety of nighttime highway operations. Users are subject to warning lights from multiple agencies with varying characteristics and configurations, but we know little about driver comprehension of these signals and their influence on driver behavior. Applied Research Associates, Inc. (ARA) studied the effectiveness of warning lights on nighttime highway operations, including mobile lane closures, incident responses, and police activities, by reviewing pertinent literature, performing observational and experimental field studies, and conducting driver surveys and focus groups of driver perceptions and behavior in response to nighttime mobile operations. We used a cognitive model of driver mental processes to analyze this information and better understand the interaction between warning lights and driver perception and behavior, and to identify and evaluate potential improvements to current practice. The research showed that drivers view current vehicle-mounted warning lights as highly visible, attention-getting, and effective at conveying the message caution/alert. However, intense lights can cause discomfort glare and multiple light sets on individual vehicles, or multiple vehicles at a location, can be distracting, annoying, or anxiety-inducing. Complex visual scenes can confuse drivers and take longer to process cognitively, leading to slower reaction times. Often, information provided by flashing arrows, signs, and changeable message signs can be interfered with by other warning lights on the same vehicle. Suggestions for improvement from the focus groups centered primarily on reducing the number of flashing lights, or synchronizing their flashing, on individual vehicles, reducing the intensity of specific lights, sequential flashing of arrows between multiple trucks in a convoy, and incorporating directional motion in light bars. Researchers were not able to test some of the ideas due to limitations of current device technology; however, field experiments on several suggested concepts showed the potential to improve driver perception, comprehension, and behavior by modifying the number, intensity, and synchronization of lights on individual vehicles, as well as between vehicles. 17. Key Words Highway work zones, nighttime channelization devices, warning lights, drums, barricades, traffic control standards
18. Distribution Statement No restrictions. This document is available to the public through the National Technical Information Service, Springfield, Virginia 22161
19. Security Classif. (of this report) Unclassified
20. Security Classif. (of this page) Unclassified
21. No. of Pages 64 plus appendix
22. Price
Form DOT F 1700.7 (8-72) Reproduction of completed page authorized

i
ACKNOWLEDGMENTS
This publication is based on the results of ICT-R27-108, Improving the Effectiveness of Nighttime Temporary Traffic Control Warning Devices: Evaluation of Nighttime Mobile Warning Lights. ICT-R27-108 was conducted in cooperation with the Illinois Center for Transportation; the Illinois Department of Transportation (IDOT), Division of Highways; and the U.S. Department of Transportation, Federal Highway Administration (FHWA).
Applied Research Associates, Inc. (ARA) appreciates the contributions of the Technical Review Panel (TRP). The members were as follows:
· Tim Kell, IDOT (Chair) · Kyle Armstrong, IDOT · Matt Mueller, IDOT · Irene Soria, IDOT · Jeffrey Abel, IDOT · Hal Wakefield, FHWA · Dean Mentjes, FHWA · Michael Zadel, Illinois Tollway · Steven Musser, Illinois Tollway · Brad Sprague, Illinois State Police · Mark Karczewski, Illinois State Police · Steve Lynch, CH2M Hill The research team also extends special appreciation to Herb Jung, IDOT, and Mark
Seppelt, IDOT, for their input and assistance during the data collection phase. ARA also recognizes the Illinois Tollway and the Illinois State Police for providing resources for the field tests.

ii
DISCLAIMER
The contents of this report reflect the view of the authors, who are responsible for the facts and the accuracy of the data presented herein. The contents do not necessarily reflect the official views or policies of the Illinois Center for Transportation, the Illinois Department of Transportation, or the Federal Highway Administration. This report does not constitute a standard, specification, or regulation.

iii
EXECUTIVE SUMMARY
Applied Research Associates, Inc. (ARA) studied the effectiveness of warning lights on nighttime highway operations, including mobile lane closures, incident responses, and police activities, by reviewing pertinent literature, performing observational and experimental field studies, and conducting driver surveys and focus groups of driver perceptions and behavior in response to nighttime mobile operations. We used a cognitive model of driver mental processes to analyze this information and better understand the interaction between warning lights and driver perception and behavior, and to identify and evaluate potential improvements to current practice. The research showed that drivers view current vehicle-mounted warning lights as highly visible, attention-getting, and effective at conveying the message caution/alert. However, intense lights can cause discomfort glare and multiple light sets on individual vehicles, or multiple vehicles at a location, can be distracting, annoying, or anxiety-inducing. Complex visual scenes can confuse drivers and take longer to process cognitively, leading to slower reaction times. Often, information provided by flashing arrows, signs, and changeable message signs can be interfered with by other warning lights on the same vehicle. Suggestions for improvement from the focus groups centered primarily on reducing the number of flashing lights, or synchronizing their flashing, on individual vehicles, reducing the intensity of specific lights, sequential flashing of arrows between multiple trucks in a convoy, and incorporating directional motion in light bars. Researchers were not able to test some of the ideas due to limitations of current device technology; however, field experiments on several suggested concepts showed the potential to improve driver perception, comprehension, and behavior by modifying the number, intensity, and synchronization of lights on individual vehicles, as well as between vehicles.

iv
CONTENTS
CHAPTER 1 INTRODUCTION ........................................................................................... 1 1.1 BACKGROUND .............................................................................................................. 1 1.2 PROJECT OBJECTIVE AND SCOPE .................................................................................. 1 1.3 RESEARCH APPROACH .................................................................................................. 1
CHAPTER 2 PERTINENT LITERATURE REVIEW ........................................................... 3 2.1 STANDARDS AND SPECIFICATIONS .................................................................................. 3
2.1.1 IDOT .................................................................................................................... 3 2.1.2 Illinois Tollway ...................................................................................................... 4
2.1.3 MUTCD .................................................................................................................... 5 2.2 APPLICABLE RESEARCH PERFORMED BY OTHERS........................................................... 5
2.2.1 NCHRP Report 337—Service Vehicle Lighting and Traffic Control Systems for Short-Term and Moving Operations .............................................................................. 5 2.2.2 Highway Construction, Maintenance, and Service Equipment Warning Lights and Pavement Data Collection System Safety ..................................................................... 6 2.2.3 FHWA Traffic Control Handbook for Mobile Operations at Night .......................... 7 2.2.4 Public Opinion and Understanding of Advance Warning Arrow Displays Used in Short-Term, Mobile, and Moving Work Zones ............................................................... 7 2.2.5 NCHRP Report 624—Selection and Application of Warning Lights on Roadway Operations Equipment .................................................................................................. 8 2.2.6 Effects of Warning Lamp Color and Intensity on Driver Vision .............................. 9 2.2.7 Risk Reduction in Emergency Response ............................................................ 10
CHAPTER 3 COGNITIVE FRAMEWORK .........................................................................12
CHAPTER 4 FIELD OBSERVATIONAL STUDIES ...........................................................14 4.1 METHODOLOGY .......................................................................................................... 14 4.2 RESULTS .................................................................................................................... 14
4.2.1 Ashkum—Mobile Lane Closure .......................................................................... 14 4.2.2 Des Plaines Oasis—Mobile Lane Closure .......................................................... 17 4.2.3 Des Plaines Oasis—Incident Response ............................................................. 21
CHAPTER 5 DRIVER SURVEYS .....................................................................................26 5.1 METHODOLOGY .......................................................................................................... 26 5.2 RESULTS—MOBILE LANE CLOSURE ............................................................................. 27
5.2.1 Participant Characteristics .................................................................................. 27 5.2.2 Memory Recall of Distinguishing Characteristics and Cues ................................ 27 5.2.3 Driver Comprehension of the Mobile Operation Type ......................................... 27 5.2.4 What Actions to Take and Why? ........................................................................ 28
v
5.3 RESULTS—INCIDENT RESPONSE ................................................................................. 28 5.3.1 Participant Characteristics .................................................................................. 28 5.3.2 Memory Recall of Distinguishing Characteristics and Cues ................................ 28 5.3.3 Driver Comprehension of the Mobile Operation Type ......................................... 29 5.3.4 What Actions to Take and Why? ........................................................................ 29
CHAPTER 6 FOCUS GROUPS ........................................................................................30 6.1 PARTICIPANT CHARACTERISTICS ................................................................................. 30 6.2 MEETING AGENDA ...................................................................................................... 32 6.3 GROUP DISCUSSION: GENERAL WORK ZONE TOPICS .................................................... 33 6.4 SPECIFIC WORK ZONE VIDEOS .................................................................................... 33
6.4.1 IDOT Truck with Arrow Board and Strobes On and Off ...................................... 34 6.4.2 Mobile Lane Closure of a Single Left Lane ......................................................... 36 6.4.3 Incident Response on Shoulder.......................................................................... 36 6.4.4 Illinois Tollway HELP Truck ................................................................................ 36 6.4.5 State Police with Standard and Directional Light Bars ........................................ 37
6.5 QUESTIONNAIRE ......................................................................................................... 37 6.5.1 General Topic Responses .................................................................................. 37 6.5.2 Responses to Specific Work Zones .................................................................... 41
CHAPTER 7 FIELD EXPERIMENTAL STUDIES ..............................................................45 7.1 METHODOLOGY .......................................................................................................... 45 7.2 MOBILE LANE CLOSURE—WITH AND WITHOUT STROBE LIGHTS .................................... 45
7.2.1 Methodology....................................................................................................... 45
7.2.2 RESULTS 47 7.3 STATE POLICE—RANDOM AND DIRECTIONAL FLASH PATTERNS ...................................... 49
7.3.1 Methodology....................................................................................................... 49 7.3.1 Results ............................................................................................................... 50
7.4 STATE POLICE—NORMAL AND DIMMED LIGHT INTENSITY .............................................. 52 7.4.1 Methodology....................................................................................................... 52 7.4.1 Results ............................................................................................................... 53
CHAPTER 8 FINDINGS AND CONCLUSIONS ................................................................57 8.1 FINDINGS ................................................................................................................... 57
8.1.1 Observational Field Studies ................................................................................ 57 8.1.2 Oasis Driver Surveys .......................................................................................... 57 8.1.3 Focus Groups ..................................................................................................... 58 8.1.4 Experimental Field Studies ................................................................................. 60
8.2 CONCLUSIONS ............................................................................................................ 61
REFERENCES ....................................................................................................................64

vi
APPENDIX A COGNITIVE PROCESSES LITERATURE REVIEW .................................. A-1 A.1 ATTENTION ................................................................................................................ A-1
A.1.1 What Visual Features of Objects Capture Drivers’ Attention? ........................... A-2 A.2 PERCEPTION ............................................................................................................. A-3
A.2.1 Why Are Work Crews at Risk from Drivers During Night Work? ........................ A-3 A.3 MEMORY ................................................................................................................... A-4
A.3.1 Memory Can Actually Interact in Ways That Inhibit Perception ......................... A-5 A.3.2 How Does Cognitive Load Influence Driver Performance? ................................ A-5
APPENDIX REFERENCES ............................................................................................... A-6

1
CHAPTER 1 INTRODUCTION
1.1 BACKGROUND The lighting of nighttime temporary traffic control (TTC) work zones provides critical
protection to highway workers and the driving public. Whether the work zone consists of a stationary setup or a mobile operation, informing the traveling public about the nature of the approaching work area and providing guidance on how to respond appropriately is vital to maintaining safety and mobility. Previous research conducted for the Illinois Department of Transportation (IDOT) on mobile lane closures (Steele and Vavrik 2009) identified driver confusion when passing through work zones at night. While current standards and procedures make nighttime work zones highly visible, we know little about driver comprehension of these signals and the guidance such signals provide. Ultimately, a combination of both factors (warning and guidance) influences driver response.
Agency needs define the specific configuration or use of nighttime warning devices; however, a lack of consistency or even coordination across various agencies might confuse motorists, especially at night. Highway users are subjected to warning lights from multiple sources, including construction work zones, mobile lane closures, emergency responders, and state police. In addition, the devices, characteristics, and configurations of warning lights vary, including flashing/rotating lights of various colors (amber, blue, and red), light bars, arrow boards, delineators (drums and barricades), and portable changeable message signs (PCMSs).
1.2 PROJECT OBJECTIVE AND SCOPE This project studied driver perception and behavior in nighttime mobile highway
operations scenarios, including mobile lane closures (i.e., maintenance, not construction), incident responses, and police activities. In these scenarios, vehicle-mounted warning lights alerted motorists and protected agency personnel and equipment. The objectives of the study were to identify any shortcomings of current practice, such as driver confusion, and to recommend improvements in the warning and guidance provided by vehicle-mounted warning lights. The study focused mainly on IDOT and Illinois State Police (ISP) operations; however, the principles apply to other nighttime mobile highway operations such as first responders, as well.
1.3 RESEARCH APPROACH Applied Research Associates, Inc. (ARA) studied the effectiveness of nighttime
mobile warning lights by reviewing pertinent literature, performing observational field studies, conducting driver surveys, mediating focus groups to solicit driver input, and performing experimental field studies of possible improvements. We applied a cognitive model of driver mental processes to this information to determine the influence of vehicle-mounted warning lights on driver perception and behavioral responses. The detailed scope of work included:
· Kickoff and Quarterly Panel Meetings: ARA participated in regular panel meetings to discuss the project scope and objectives, to plan the next project phases, and to present current results and findings.
· Literature Review: We reviewed pertinent literature regarding federal and state highway standards, applicable research performed by others, and relevant cognitive processes, such as perception and memory.

2
· Field Observational Studies: ARA, IDOT, and the Illinois Tollway coordinated observational studies at two sites to study driver behavior around mobile operations, to collect visual aids for the focus groups, and to conduct driver surveys at nearby rest areas and oases.
· Focus Groups: ARA conducted focus groups to gain insight into what drivers perceive and comprehend, and how they respond, when driving around nighttime mobile highway operations. Four focus groups were conducted at two locations to capture input from a diverse range of drivers in both urban and rural areas.
· Field Experimental Studies: Based on information gained through previous phases of this project, ARA conducted field experimental studies with the Illinois Tollway and ISP to test several alternatives to improve driver behavior around mobile operations. We studied a mobile lane closure operation at the Illinois Tollway site and an ISP vehicle stop on I-57 near Ashkum.
· Data Analysis and Findings: Following the completion of all data collection phases, ARA analyzed the data from the observational studies, focus groups, experimental studies, and pertinent literature review to apply to a cognitive model developed as an evaluation framework for this project.
· Recommendations and Report: ARA’s findings and recommendations regarding the effectiveness of vehicle-mounted warning lights on nighttime highway operations are summarized in this report.
Figure 1.1 How well do drivers perceive and respond to vehicle-mounted warning lights
used for nighttime mobile highway operations?

3
CHAPTER 2 PERTINENT LITERATURE REVIEW
ARA performed a literature review of highway standards, specifications, and applicable research to gain insight into current lighting practices for nighttime mobile operations and the experience of other agencies.
2.1 STANDARDS AND SPECIFICATIONS
2.1.1 IDOT The IDOT Work Site Protection Manual (IDOT October 2010) presents guidelines for
using strobe lights, warning signs, message boards, flashing arrow boards, and protective clothing for daytime and nighttime operations. With respect to strobe lights, the manual specifies:
When vehicles are located within 15 feet of the pavement edge, mounted strobe lights will be utilized. This requirement includes all vehicles parked on the shoulder. Revolving lights are adequate for tractors, while non-truck mounted equipment is exempt, i.e., air compressors, asphalt kettles, etc.
Please note: Revolving lights on existing vehicles may be utilized until the light wears out or the vehicle is replaced.
Illinois law allows the use of amber/white lights by IDOT personnel, but only when engaged in work operations.
Currently, revolving flasher and strobe lights on IDOT vehicles are being phased out
in favor of LED-based beacons and light bars. The Work Site Protection Manual does not provide detailed light requirements, such as intensity, flash rate, or flash pattern. IDOT specifies these requirements during new vehicle purchases, and the vehicles come equipped with the warning lights from the manufacturer. Typically, IDOT maintenance trucks used for traffic protection are equipped with flashing lights mounted in the rear of the truck bed near the vehicle’s taillights and a roof-mounted light bar. Depending on the operation, the vehicle may be equipped with a flashing arrow board or a truck-mounted attenuator containing a flashing arrow board. IDOT vehicles also use reflective tape to mark portions of the vehicle outline.
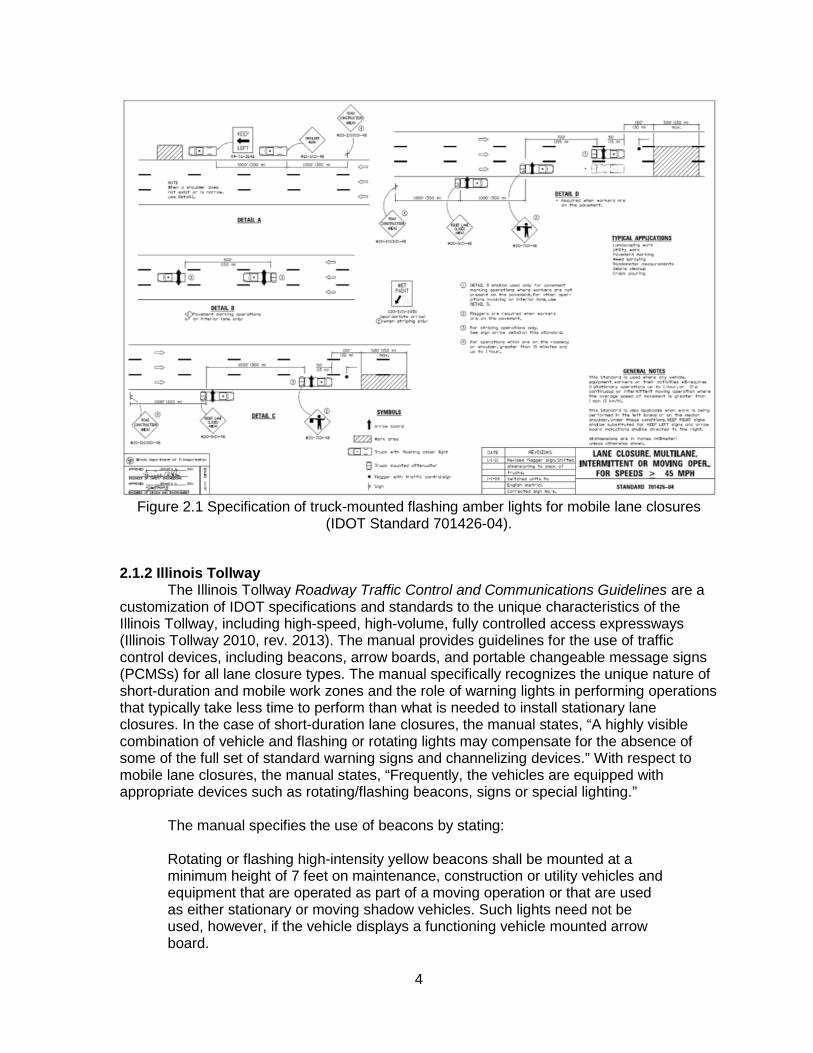
The IDOT Standard Specifications for Road and Bridge Construction (IDOT 2012) do not address the issue of vehicle-mounted warning lights, but their use is specified in applicable standards such as IDOT Highway Standard 701426 (IDOT 2013) for intermittent and moving lane closure operations, as shown in Figure 2.1.
4
Figure 2.1 Specification of truck-mounted flashing amber lights for mobile lane closures
(IDOT Standard 701426-04).
2.1.2 Illinois Tollway The Illinois Tollway Roadway Traffic Control and Communications Guidelines are a
customization of IDOT specifications and standards to the unique characteristics of the Illinois Tollway, including high-speed, high-volume, fully controlled access expressways (Illinois Tollway 2010, rev. 2013). The manual provides guidelines for the use of traffic control devices, including beacons, arrow boards, and portable changeable message signs (PCMSs) for all lane closure types. The manual specifically recognizes the unique nature of short-duration and mobile work zones and the role of warning lights in performing operations that typically take less time to perform than what is needed to install stationary lane closures. In the case of short-duration lane closures, the manual states, “A highly visible combination of vehicle and flashing or rotating lights may compensate for the absence of some of the full set of standard warning signs and channelizing devices.” With respect to mobile lane closures, the manual states, “Frequently, the vehicles are equipped with appropriate devices such as rotating/flashing beacons, signs or special lighting.”
The manual specifies the use of beacons by stating: Rotating or flashing high-intensity yellow beacons shall be mounted at a minimum height of 7 feet on maintenance, construction or utility vehicles and equipment that are operated as part of a moving operation or that are used as either stationary or moving shadow vehicles. Such lights need not be used, however, if the vehicle displays a functioning vehicle mounted arrow board.

5
2.1.3 MUTCD Part 6 of the Manual on Uniform Traffic Control Devices (MUTCD) (FHWA 2009)
establishes federal standards for the use of traffic control devices as part of temporary traffic control, including short-duration and mobile operations. The manual defines vehicle-mounted warning lights as “high-intensity rotating, flashing, oscillating, or strobe lights” and specifies their use for mobile and short-duration operations when the mobility of the work zone is important. These vehicles may be augmented with signs or arrow boards. With respect to mobile lane closures, the manual says:
Mobile operations shall have appropriate devices on the equipment (that is, high-intensity rotating, flashing, oscillating, or strobe lights, signs, or special lighting), or shall use a separate vehicle with appropriate warning devices.
Part 6 of the MUTCD also discusses the use of vehicle-mounted warning lights for
incident response operations such as minor, intermediate, and major traffic accidents. It says:
The use of emergency-vehicle lighting (such as high-intensity rotating, flashing, oscillating, or strobe lights) is essential, especially in the initial stages of a traffic incident, for the safety of emergency responders and persons involved in the traffic incident, as well as road users approaching the traffic incident.
The manual recognizes limitations in warning lights in providing traffic control, and
possible negative effects of too many warning lights at an incident: Emergency-vehicle lighting, however, provides warning only and provides no effective traffic control. The use of too many lights at an incident scene can be distracting and can create confusion for approaching road users, especially at night.
The manual suggests that emergency-vehicle lighting can be reduced at a scene
once good traffic control has been established, especially for major incidents that may involve multiple emergency vehicles:
If good traffic control is established through placement of advance warning signs and traffic control devices to divert or detour traffic, then public safety agencies can perform their tasks on scene with minimal emergency-vehicle lighting.
2.2 APPLICABLE RESEARCH PERFORMED BY OTHERS
2.2.1 NCHRP Report 337—Service Vehicle Lighting and Traffic Control Systems for Short-Term and Moving Operations
This study, performed by Hanscom and Pain (1990), was a forerunner into vehicle-mounted warning light research. Although lighting technology has changed drastically, many of its findings still apply. The researchers carried out closed-field testing on strobe, rotating, flashing, arrow board, and light bar vehicle lighting systems to study driver ability to judge distance and closing rate to different lights and light characteristics. Variables included light

6
intensity, flash rate, number of lights, mounting position, service vehicle speed, approach vehicle speed, and day versus night. They found that, generally, the more slowly the lead vehicle traveled, the less accurate the driver’s estimation of vehicle speed and closing rate. Subjects usually thought the vehicle was going faster than the actual speed, resulting in an error in the direction of increased hazard. Light characteristics, including flash rate, mounting position, number of lights, and intensity did not have an effect on the results. Arrows and flashing lights (as opposed to rotating lights) were the most successful in reducing perceptual inaccuracies. The results indicated that the longer “on” times of the flashing lights enabled drivers to more accurately estimate distance from the service vehicle and the driver’s closing rates. Strobe lights with a very short, high-intensity “on” time produced the greatest inaccuracies.
The researchers conducted operational field tests in three states to confirm the results of their closed-field tests, looking at lane-change distance of drivers upstream of moving and stationary vehicles. In the case of moving vehicles, the yellow light bar was most effective in producing the greatest upstream lane-change distances. Interestingly, in the case of short-term, stationary operations, the combination of two rotating beacons and one flashing light was notably superior to all other combinations. The yellow light bar produced favorable results in terms of mean upstream lane-change distance, but it also produced critically close lane-change distances, indicating that some drivers did not recognize the service vehicle as being stationary, not moving. The authors hypothesized that drivers may have associated the light bar with tow vehicles, assuming the vehicles were in motion and not stopped. The researchers pointed out that this highlights the dual purpose of lights—conspicuity and information transfer. Whereas detection or perception of a warning light is primarily physiological, information transfer is primarily cognitive. Drivers convert sensory information (e.g., flashing lights) to something meaningful through pattern recognition based on previous experiences. This process is highly dependent on driver expectations and the context in which the information is received.
2.2.2 Highway Construction, Maintenance, and Service Equipment Warning Lights and Pavement Data Collection System Safety
The Texas A&M Transportation Institute (TTI) performed research for the Texas Department of Transportation (TxDOT) to improve the state’s vehicle and equipment warning light policy and to improve the safety of the data collection activities (Ullman, Ragsdale, and Chaudhary 1998). At the time of the study, the current TxDOT policy was to allow blue lights to be used on highway maintenance vehicles in limited applications, along with the amber lights used for all DOT vehicles. Researchers performed a survey of nationwide practice, a motorist survey of their perceptions and interpretations of various light colors and configurations, and field tests to measure driver actions in response to various lighting scenarios.
The study determined that the majority of states allow amber lights only for DOT vehicles, although a few states permit red and/or blue to be used in conjunction with the amber lights. Driver surveys within Texas showed that most motorists associated yellow lights with highway construction and maintenance vehicles, as well as with tow trucks. Motorists associated blue, red, and white colors with emergency vehicles, and motorists indicated that they placed a higher level of hazard and would adjust their driving behavior accordingly in the case of blue, red, and white lights. Field studies found that when encountering a combination of yellow and blue lights motorists reduced speed 5 to 6 mph more than when encountering yellow lights only. Somewhat surprisingly, researchers did not observe speed reductions for the yellow-blue-red light combination. The yellow-blue-red combination did result in increased brake use, relative to the yellow-only lights. The yellow and blue combination also resulted in increased brake use, although not as dramatic as the

7
yellow-blue-red combination. Lane-choice performance measures were inconclusive with respect to light combination.
The study concluded that yellow lights alone may not sufficiently convey the level of hazard associated with certain DOT operations, such as activities that place workers out in traffic without the provision of advance warning signing or positive protection. Based on the study results, researchers recommended continuation of the DOT policy to allow use of blue lights in conjunction with yellow lights on DOT vehicles in particularly hazardous situations, despite the concerns of law enforcement that this policy degrades the effectiveness of the blue and red lights used for and typically associated with police vehicles.
2.2.3 FHWA Traffic Control Handbook for Mobile Operations at Night The FHWA Traffic Control Handbook for Mobile Operations at Night (Bryden 2003) is
a synthesis of practices for performing nighttime mobile operations based on a review of work zone manuals from a selection of state and local highway agencies, discussion with highway officials, and field observations of a select number of nighttime highway mobile work zone operations. It groups traffic control devices used at night into eight categories, including warning lights and work vehicle markings, arrow panels, and changeable message signs (CMSs). The handbook recognizes that these devices function to “regulate, warn, or guide” traffic in nighttime work zones.
With respect to warning lights, the manual states that it is “essential” that work vehicles be equipped with highly visible warning lights and that although a wide range of lights are available, there are no generally accepted guidelines to dictate the optimum choice of warning lights or a given situation. The handbook states that “flashing/rotating incandescent lights are believed superior to strobe lights in terms of driver depth perception and closing rates” and that large trucks should be equipped with two lights visible to approaching drivers to improve driver comprehension of distance and closing rates. The handbook recommends using retroreflective markings to supplement the warning lights and that the markings should outline the perimeter of the vehicle on all sides.
The manual “strongly recommends” the use of 4- by 8-ft arrow panels to compensate for the absence of other warning devices because they are very effective in alerting drivers that a lane is closed. It also states that CMSs are very effective in alerting drivers to mobile operations, especially when used to provide advance warning upstream of the work operation. It suggests limiting the message to two phases. Finally, the handbook states that high-visibility apparel is essential to reduce the risk of workers being struck by vehicles traveling through the work zone, or by work vehicles or equipment. For nighttime work, workers must use reflective clothing conforming to American National Standards Institute (ANSI) Class 3 standards.
2.2.4 Public Opinion and Understanding of Advance Warning Arrow Displays Used in Short-Term, Mobile, and Moving Work Zones
The University of Kansas (Schrock, See, and Mulinazzi 2008) conducted research into driver comprehension of arrow boards used for short-term and mobile work zones. The results of a broad-scale driver survey showed that 78% of participants preferred sequential over flashing displays. Participants generally considered panel displays that included motion (e.g., sequential arrows and sequential chevrons) as implying a more important situation and preferred their use over flashing versions. This finding reveals that sequential (or directional) motion may present advantages for improving driver comprehension and behavior over flashing motions when incorporated into other lighting scenarios, such as light bars.
8
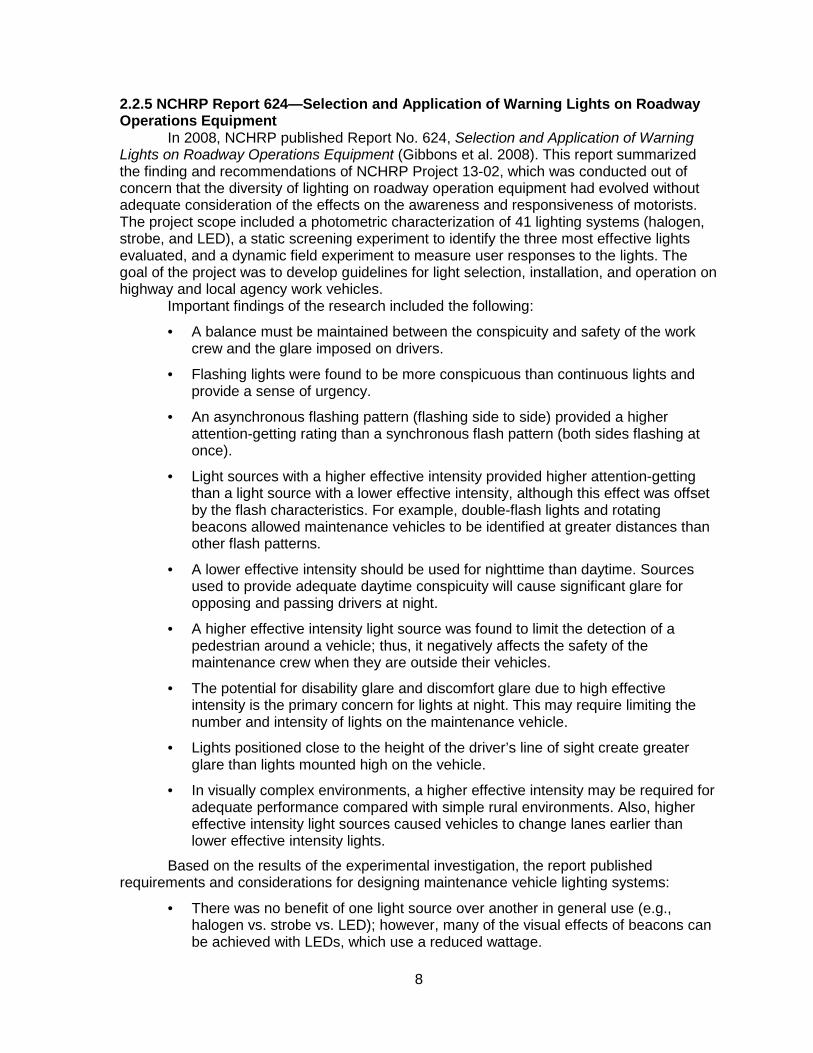
2.2.5 NCHRP Report 624—Selection and Application of Warning Lights on Roadway Operations Equipment
In 2008, NCHRP published Report No. 624, Selection and Application of Warning Lights on Roadway Operations Equipment (Gibbons et al. 2008). This report summarized the finding and recommendations of NCHRP Project 13-02, which was conducted out of concern that the diversity of lighting on roadway operation equipment had evolved without adequate consideration of the effects on the awareness and responsiveness of motorists. The project scope included a photometric characterization of 41 lighting systems (halogen, strobe, and LED), a static screening experiment to identify the three most effective lights evaluated, and a dynamic field experiment to measure user responses to the lights. The goal of the project was to develop guidelines for light selection, installation, and operation on highway and local agency work vehicles.
Important findings of the research included the following:
· A balance must be maintained between the conspicuity and safety of the work crew and the glare imposed on drivers.
· Flashing lights were found to be more conspicuous than continuous lights and provide a sense of urgency.
· An asynchronous flashing pattern (flashing side to side) provided a higher attention-getting rating than a synchronous flash pattern (both sides flashing at once).
· Light sources with a higher effective intensity provided higher attention-getting than a light source with a lower effective intensity, although this effect was offset by the flash characteristics. For example, double-flash lights and rotating beacons allowed maintenance vehicles to be identified at greater distances than other flash patterns.
· A lower effective intensity should be used for nighttime than daytime. Sources used to provide adequate daytime conspicuity will cause significant glare for opposing and passing drivers at night.
· A higher effective intensity light source was found to limit the detection of a pedestrian around a vehicle; thus, it negatively affects the safety of the maintenance crew when they are outside their vehicles.
· The potential for disability glare and discomfort glare due to high effective intensity is the primary concern for lights at night. This may require limiting the number and intensity of lights on the maintenance vehicle.
· Lights positioned close to the height of the driver’s line of sight create greater glare than lights mounted high on the vehicle.
· In visually complex environments, a higher effective intensity may be required for adequate performance compared with simple rural environments. Also, higher effective intensity light sources caused vehicles to change lanes earlier than lower effective intensity lights.
Based on the results of the experimental investigation, the report published requirements and considerations for designing maintenance vehicle lighting systems:
· There was no benefit of one light source over another in general use (e.g., halogen vs. strobe vs. LED); however, many of the visual effects of beacons can be achieved with LEDs, which use a reduced wattage.

9
· Only amber and white lighting should be used in maintenance vehicles, with amber being the predominant color.
· Flashing lights with an asynchronous pattern should be used and slower flash rates (e.g., 1 Hz) are better than faster flash rates (e.g., 4 Hz) due to their longer flash duration. Double flash patterns and rotating beacons improve vehicle identification.
· Lights should be placed on the vehicle so that their backing is a consistent color that provides contrast to the light and prevents the sky from being the backdrop of the light.
· Lights should be positioned high on the vehicle (above driver eye height) and along the vehicle edges to outline the vehicle at night.
· Retroreflective tape should be used as a supplement to lighting systems and should outline the vehicle shape.
· The effective intensity of the warning light system is limited at a minimum in terms of the vehicle conspicuity and at a maximum by the glare apparent to other drivers. (The report provided minimum and maximum effective intensity requirements for nighttime use based on the Form Factor method of determining effective intensity. For daytime use, only a minimum requirement is specified.)
The authors concluded their report by stating that the study did not include advanced lighting systems, such as flashing bars and directional apparent motion systems, and that future research should consider these alternatives.
2.2.6 Effects of Warning Lamp Color and Intensity on Driver Vision The University of Michigan Transportation Research Institute (UMTRI) performed
research on different light colors and intensities during day and night conditions on participants’ ability to detect flashing lights and pedestrians for emergency vehicle operations (Flannagan, Blower, and Devonshire 2008). The purpose of the study was to understand the overall effects of lamps on safety, including the intended effects (e.g., conspicuity) and the unintended effects (e.g., glare and driver distraction). The researchers performed field testing at a closed facility that consisted of two parked simulated emergency vehicles and one parked vehicle with the study participant. Participants performed three tasks under day and night conditions, and at low and high intensities:
· Lamp search—indicate as quickly as possible whether a flashing lamp was located on the left or right emergency vehicle.
· Pedestrian responder search—indicate as quickly as possible whether a pedestrian responder wearing turnout gear was present near the right or left simulated emergency vehicle.
· Conspicuity rating—provide a rating of the subjective conspicuity of the warning lamps.
The results showed major differences between day and night conditions. Searching for lamps was easier during the night, and searching for pedestrians was easier during the day. Over the range of intensities used, lamp search during the day improved with higher intensities, while lamp search at night was uniformly very good for all intensities and did not improve with higher intensities. Lamp intensities had little effect on the pedestrian search during the day or night. Conspicuity ratings varied by color and day vs. night. Interestingly,
10
blue lamps received high conspicuity ratings at night (as expected), but during the day as well, contradicting conventional knowledge of the function of the cone and rod photoreceptors in the eyes.
The authors made three recommendations, based on their findings:
· Use different intensity levels for day and night.
· Make more use of blue overall, day and night.
· Use color coding to indicate whether or not vehicles are blocking the path of traffic.
2.2.7 Risk Reduction in Emergency Response Federal Signal Corporation (FSC) presents a seminar on risk reduction in emergency
response that covers many topics applicable to this research (Bader 2012). The seminar includes an overview of the history of emergency lighting technologies, including incandescent, halogen, strobe, and LED light sources. Incandescent lights use a filament in a gas-filled bulb and were the earliest light source used on emergency vehicles, beginning in the 1950s. Halogen lamps use a filament inside a bulb filled with a different gas and eventually replaced incandescent lights. Both light types commonly used a mechanical rotator to create 360-degree lighting. Strobe light technology using a high-intensity discharge, short-duration pulse entered the emergency lighting market in the 1970s and could also be configured in a directional or 360-degree view. Currently, LED technology is becoming the light source of choice due to its flexibility in light colors, patterns, light quality, and low power consumption. LEDs originally came configured in banks of 3, 6, or 9 LEDs with a colored filter and a Fresnel lens to help disperse the light and improve off-axis performance. Current LED designs incorporate a reflector to increase LED brightness with a fewer number of lights. Both LED designs were used mainly in directional applications, but the reflector approach has currently been integrated with a rotating reflector that can produce a 360-degree field of view, similar to the original rotating beacon design.
The FSC seminar presents the organizations that publish standards governing the emergency lighting industry, including the Society of Automotive Engineering (SAE), the National Institute of Justice (NIJ), and the National Fire Protection Association (NFPA). These standards are typically applied to law enforcement, fire, and ambulance vehicles. The most pertinent standards to today’s emergency lights are:
· SAE J595—Directional Flashing Optical Warning Devices
· SAE J845—Optical Warning Devices
· SAE J1318—Gaseous Discharge Warning Lamps
· SAE J1889—LED Lighting Devices
· SAE J2498—Minimum Performance of the Warning Light System
The standards define three photometric class ratings, based on the intended function of the lighting system. They are:
· Class 1—Authorized emergency vehicles responding to emergency situations
· Class 2—Authorized maintenance or service vehicles to warn of traffic hazards
· Class 3—Vehicles authorized to display an optical warning device for identification only

11
As lighting technology evolves, so are the standards. In the future, the industry expects SAE J595 to become the universal standard for all directional devices (halogen, strobe, and LED) and SAE J845 to become the universal standard for all omnidirectional devices.

12
CHAPTER 3 COGNITIVE FRAMEWORK ARA has significant experience in studying human cognitive processes over a broad
range of knowledge domains. We use field experiments and driver focus groups to study the mental processes that motorists experience while driving through highway work zones at night. A detailed description and literature review of the pertinent cognitive functions—including attention, perception, and memory—are presented in Appendix A. Using this cognitive approach, we understand not only what motorists do but also why they do it. By knowing what factors attract drivers’ attention and influence their decision making and behavior, we can better predict the effect of changes made to their environment, such as using traffic drums without lights. The following sections summarize the key cognitive functions pertaining to nighttime driving. 3.1 ATTENTION
Attention is the “gatekeeper” of our consciousness that lets relevant information in and keeps irrelevant information out (Wolfe 2000). The human body passively gathers stimuli from the surrounding environment through sensory functions, such as visual images detected by our eyes. Our sensory memory processes this information and collects more information than what we can attend to. This process filters out nonessential information, allowing for sustained mental focus on an object, item, or activity as we attend to important stimuli. Attention plays an important role in driving safety and behavior, such as the detection of an orange “road construction ahead” sign, a flashing light, or workers along the highway. Factors that are known to increase attention-getting include color, contrast, flash rate (for example, flashing or steady-burn), and luminance.
3.2 PERCEPTION
Perception is our ability to receive information from our senses and interpret this information. In the case of this research, we are largely interested in visual perception at night, such as the detection and interpretation of reflective signs, lights, pavement markings, the roadway surface, and other vehicles. At night, the lack of visual cues diminishes several important driving functions, including the ability to judge driving speeds and distance from other objects. Likewise, a visually cluttered environment, such as a work zone with hundreds of temporary traffic control devices, can increase reaction times as drivers struggle to separate nonessential visual information from important cues. This task is especially troublesome for older drivers. Our expectations about events and our environment also have a large effect on perception. Things that are familiar to or expected by us are easier to perceive than those that are unexpected or new. In other words, it is more difficult and takes longer to perceive situations that are unexpected, such as a new highway construction zone or an emergency vehicle that was not there the day before. 3.3 MEMORY
Memory is the process by which we encode, store, and retrieve information, and applies to the sensory, short-term, and long-term memory stores. To reach short-term memory, we must attend to information that reaches the sensory memory. In short-term memory, we store information briefly before we encode it to long-term memory or discard it. Memory is an important component to the performance of higher-order cognitive processes such as reasoning, problem solving, and decision making. Many driving situations rely on experiences stored in long-term memory. Common and repeated experiences form mental representations of events that we store in our memory (called schemas), which help us quickly recognize new information. For example, when we perceive a flashing arrow at the

13
start of a work zone, drivers understand that they should change to the other lane, or that the color orange is associated with construction and they should proceed with caution.
We can think of the information available at each step in these cognitive processes as a funnel, wherein each subsequent step in the process contains a subset of the previous process. In other words, we cannot attend to all the information that we sense, we cannot perceive all information we attend to, and we cannot remember all information that we perceive. Figure 3.1 provides an illustration.
Figure 3.1 Visualization of the reduction of information occurring at each step in the cognitive process.
14
CHAPTER 4 FIELD OBSERVATIONAL STUDIES
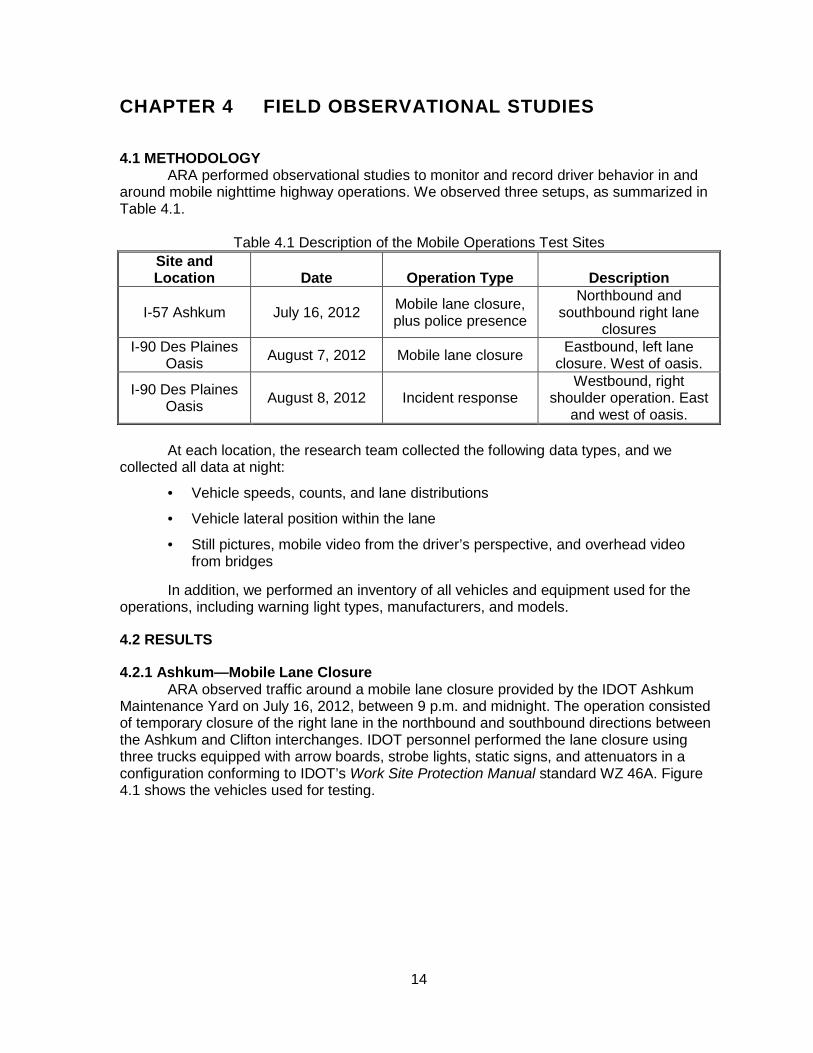
4.1 METHODOLOGY ARA performed observational studies to monitor and record driver behavior in and
around mobile nighttime highway operations. We observed three setups, as summarized in Table 4.1.
Table 4.1 Description of the Mobile Operations Test Sites
Site and Location Date Operation Type Description
I-57 Ashkum July 16, 2012 Mobile lane closure, plus police presence
Northbound and southbound right lane
closures I-90 Des Plaines
Oasis August 7, 2012 Mobile lane closure Eastbound, left lane closure. West of oasis.
I-90 Des Plaines Oasis August 8, 2012 Incident response
Westbound, right shoulder operation. East
and west of oasis. At each location, the research team collected the following data types, and we
collected all data at night:
· Vehicle speeds, counts, and lane distributions
· Vehicle lateral position within the lane
· Still pictures, mobile video from the driver’s perspective, and overhead video from bridges
In addition, we performed an inventory of all vehicles and equipment used for the operations, including warning light types, manufacturers, and models.
4.2 RESULTS
4.2.1 Ashkum—Mobile Lane Closure ARA observed traffic around a mobile lane closure provided by the IDOT Ashkum
Maintenance Yard on July 16, 2012, between 9 p.m. and midnight. The operation consisted of temporary closure of the right lane in the northbound and southbound directions between the Ashkum and Clifton interchanges. IDOT personnel performed the lane closure using three trucks equipped with arrow boards, strobe lights, static signs, and attenuators in a configuration conforming to IDOT’s Work Site Protection Manual standard WZ 46A. Figure 4.1 shows the vehicles used for testing.

15
Figure 4.1 Vehicles used for mobile lane closure testing at the Ashkum site.
ARA measured vehicle speeds from a covert overhead location at multiple points
along the mobile lane closure operation, with and without police presence. We also measured baseline vehicle speeds with traffic control trucks present, as well as police presence on the right shoulder with no mobile lane closure. Our main objective was to characterize the speed profile of traffic passing a mobile lane closure for a rural, nighttime interstate and to generate visual aids for use in the focus groups. The research team recorded speeds at the following locations and under the following conditions:
· No temporary traffic control (TTC).
· Truck 3—The first truck encountered by traffic, which was positioned fully on the right shoulder and equipped with a Right Lane Closed Ahead sign.
· Truck 2—The second truck in the convoy, which straddled the shoulder-to-lane joint and displayed a merging lane sign. Located 1,000 ft past Truck 3.
· Truck 1—The lead truck in the convoy, which was located fully in the right lane. The truck had no static sign and was located 1,000 ft past Truck 2.

16
· Police with traffic control—An ISP vehicle with a roof-mounted light bar. When used with the mobile lane closure, it was located approximately 100 ft past the lead truck and on the shoulder, with its lights in a random pattern.
· Police only—The same police vehicle and lights as above, but it was positioned on the right shoulder with no lane closure or maintenance trucks present.
Figure 4.2 displays the vehicle speed results.
Figure 4.2 Speed profile for different locations along the mobile lane closure, including with
police presence, at the Ashkum site. The data showed that traffic speeds decreased steadily along the 2,000-ft length of
the operation. In the case of the southbound lanes, traffic speeds decreased from 66.7 mph when no traffic control was present to 57.4 mph at the first truck encountered by traffic, a reduction of 9.3 mph. Vehicle speeds reduced another 8.0 mph from Truck 3 to Truck 1. The presence of the ISP vehicle in front of the lead truck produced a 3.3-mph speed reduction, lowering traffic speeds to 46.1 mph, well below the 65-mph posted speed limit. With no lane closure and just the police on the shoulder, speeds reduced 8.8 mph. It should be noted that by state law the legal speed limit is not reduced by the presence of a mobile lane closure and that none of the vehicles in this operation displayed a “reduce speed” message.
Speed reductions in the northbound direction were greater than in the southbound. From Truck 3 to Truck 1, speeds decreased from 68.2 to 52.3 mph in the northbound lanes, a 15.9-mph speed reduction. The greater reduction may have been due to the roadway geometry, which presented a right hand curve just beyond the lead truck and may have created driver uncertainty.
60.3
52.355.7
49.446.1
57.957.4
66.768.2
0
10
20
30
40
50
60
70
80
Truck 3 Truck 2 Truck 1 No TTC Truck 3 Truck 2 Truck 1 T1 withPolice
PoliceOnly
Measured speed location
Spee
d, m
ph
Northbound Southbound
Posted speed limit

17
4.2.2 Des Plaines Oasis—Mobile Lane Closure ARA studied traffic patterns around a mobile lane closure provided by the Illinois
Tollway on I-90 just west of the Des Plaines Oasis on August 7, 2012. The Tollway’s M-7 Maintenance Yard provided the vehicles and personnel to close the leftmost of three eastbound lanes from 11 p.m. to 3 a.m., using a four-truck convoy (plus advance warning vehicle) in accordance with the Illinois Tollway standard for a mobile lane closure of a single left lane (standard Plate 9L). Traffic was heavy at the start of testing and decreased significantly after 1 a.m. Figure 4.3 shows the vehicles and equipment used for testing.
Figure 4.3 Vehicles and equipment used for the mobile lane closure on I-90 near the
Des Plaines Oasis.

18
Figure 4.4 presents the speed data for this section measured with and without the mobile lane closure in the left lane. ARA collected speed data from an overhead bridge, and the data shown represent the center of three lanes in the eastbound traffic direction between 11:00 and 11:30 p.m. on a weekday night. The results show that the mean speed decreased 8.8 mph at the lead traffic control trucks (i.e., truck 1) with the mobile closure in place.
Figure 4.4 Speed data for the mobile lane closure on I-90 near the Des Plaines Oasis.
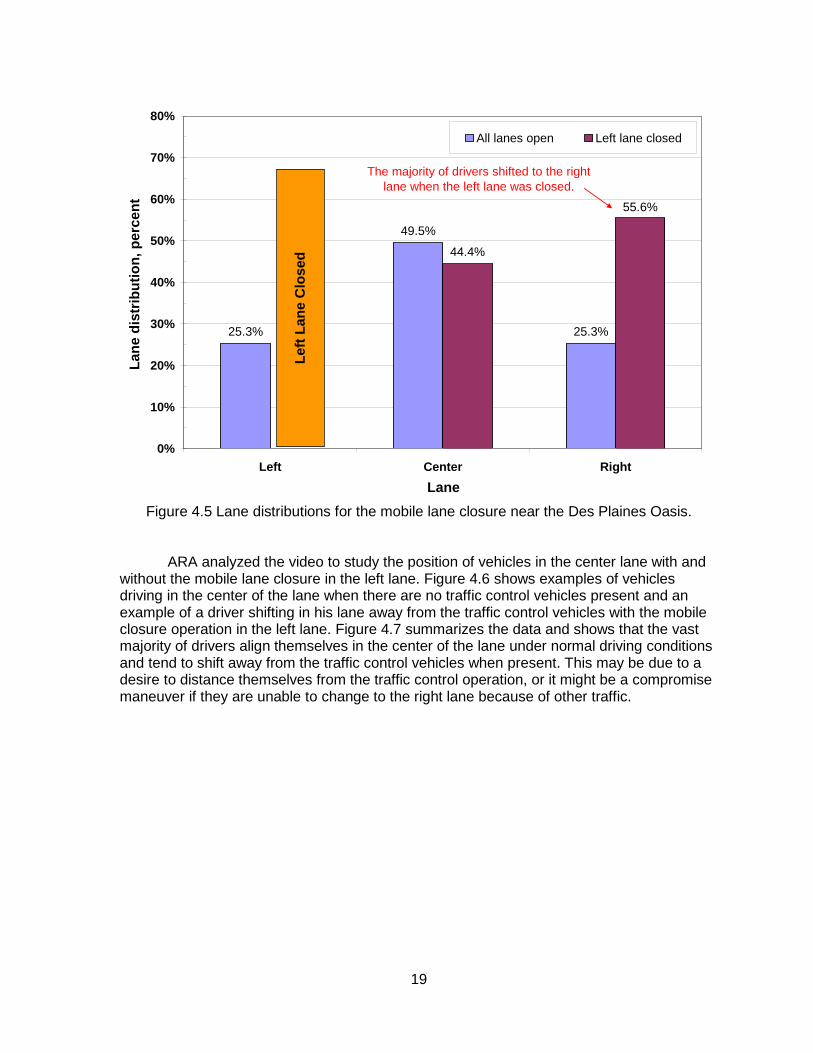
The research team analyzed the collected video to determine vehicle lane
distributions with and without the mobile closure. Figure 4.5 summarizes the results and indicates that with all lanes opens approximately half of the vehicles used the center lane, with the remaining half evenly distributed between the left and right lanes. With the mobile operation closing the left lane, the majority of vehicles shifted to the right lane (the lane farthest from the closure). In fact, with the left lane closed there was a small overshift to the right lane, meaning that its total increased by more than just the amount due to the lane reduction, while the percentage of vehicles in the center lane decreased correspondingly. Two possible reasons for the overshift may be that drivers interpret the multiple arrow boards on the traffic control trucks as instructions to move as far to the right as possible or that drivers prefer distancing themselves from the moving operation as much as possible.
0
10
20
30
40
50
60
70
80
0 20 40 60 80 100 120 140 160 180 200Vehicle no.
Spee
d, m
ph
All Lanes Open Left Lane Closed
Mean = 64.9 mphMean = 56.1 mph
Speeds reduced by 8.8 mph with the mobile lane closure.
19
Figure 4.5 Lane distributions for the mobile lane closure near the Des Plaines Oasis.
ARA analyzed the video to study the position of vehicles in the center lane with and
without the mobile lane closure in the left lane. Figure 4.6 shows examples of vehicles driving in the center of the lane when there are no traffic control vehicles present and an example of a driver shifting in his lane away from the traffic control vehicles with the mobile closure operation in the left lane. Figure 4.7 summarizes the data and shows that the vast majority of drivers align themselves in the center of the lane under normal driving conditions and tend to shift away from the traffic control vehicles when present. This may be due to a desire to distance themselves from the traffic control operation, or it might be a compromise maneuver if they are unable to change to the right lane because of other traffic.
25.3%
49.5%
25.3%
44.4%
55.6%
0%
10%
20%
30%
40%
50%
60%
70%
80%
Left Center RightLane
Lane
dis
trib
utio
n, p
erce
ntAll lanes open Left lane closed
Left
Lane
Clo
sed
The majority of drivers shifted to the right lane when the left lane was closed.

20
Figure 4.6 Lateral lane positions for the mobile lane closure near the Des Plaines Oasis.
Vehicles driving in the center of the lane with all lanes open (top) and a vehicle in the center lane shifting away from the traffic control operation (bottom).

21
Figure 4.7 Lateral lane positions with and without the mobile lane closure.
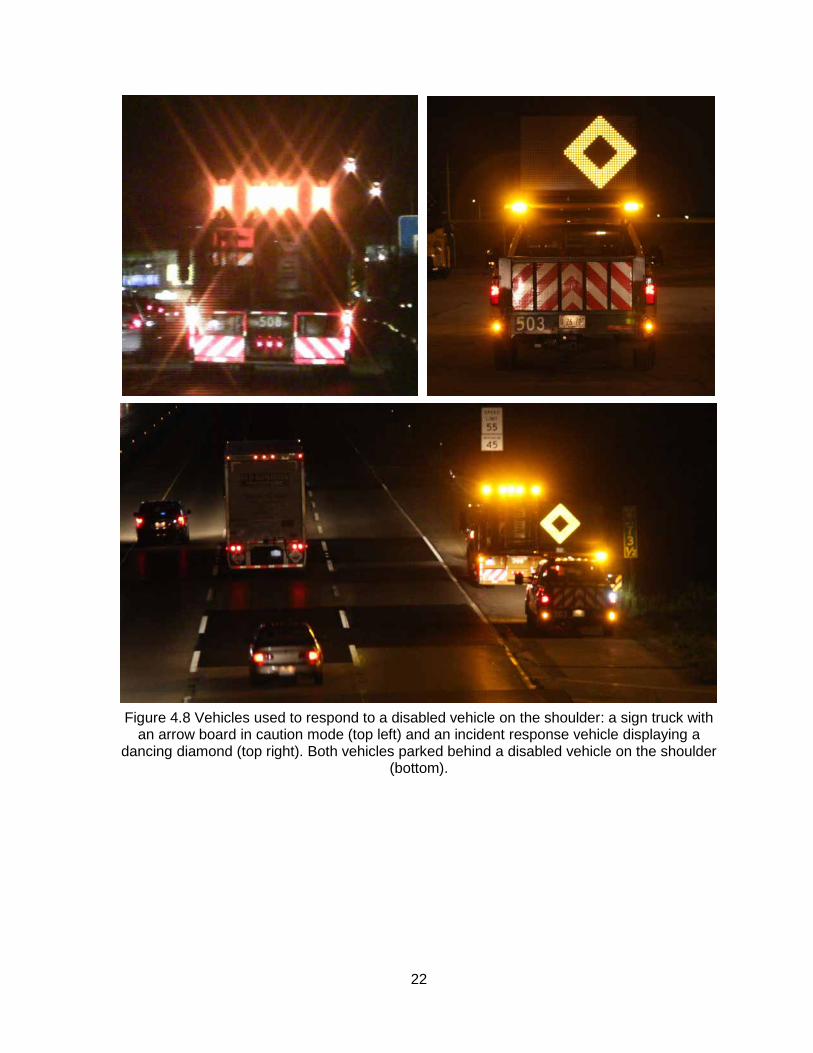
4.2.3 Des Plaines Oasis—Incident Response ARA and the Illinois Tollway simulated an incident response consisting of a disabled
vehicle on the right shoulder being attended to by vehicles equipped with strobe lights, an arrow board, and a light panel displaying a dancing diamond, as shown in Figure 4.8. We performed testing on August 8, 2012, at two locations in the westbound traffic direction of I-90—one east of the Des Plaines Oasis and one west of the oasis. In both cases, a small SUV representing a disabled vehicle with its hazard lights on was placed on the right shoulder next to three open traffic lanes, with the incident response trucks located 50 ft behind and on the shoulder.
The research team collected traffic speed data with and without the shoulder incident at the site west of the oasis, and approaching and passing the shoulder incident at the location east of the oasis. We collected data between 11:15 p.m. and 1:15 a.m. Traffic volumes ranged from approximately 2,200 to 550 vehicles per hour for the three-lane roadway at the sites east and west of the oasis, respectively. In all cases, traffic operated under free-flow conditions. The results in Figure 4.9 showed that vehicles reduced their speed by 1 to 2 mph when passing the shoulder incident. Likewise, the mean speeds exceeded the 55-mph posted speed limit in all cases.
10.3%
1.7%2.1%
62.9%
87.9%
35.1%
0%
20%
40%
60%
80%
100%
Left side Center Right sideLateral lane position
Vehi
cles
, per
cent
All lanes open
Left lane closed
Drivers shifted away from the closed lane.
Left
Lane
Clo
sed
22
Figure 4.8 Vehicles used to respond to a disabled vehicle on the shoulder: a sign truck with
an arrow board in caution mode (top left) and an incident response vehicle displaying a dancing diamond (top right). Both vehicles parked behind a disabled vehicle on the shoulder
(bottom).

23
Figure 4.9 Mean speeds around the shoulder incident at two locations near the Des Plaines
Oasis—westbound.
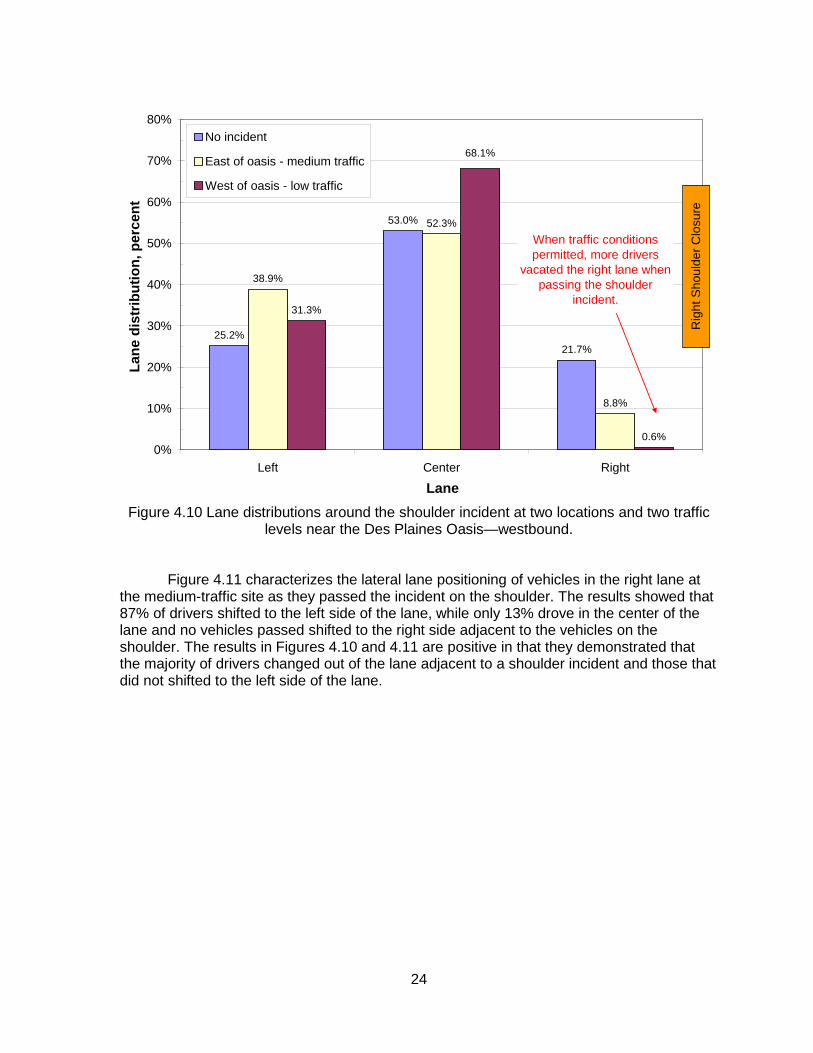
Figure 4.10 presents the lane distribution data for vehicles operating near the
shoulder incident at two locations—east and west of the oasis. We tested the location east of the oasis earlier in the night, when traffic volumes were still heavy enough that it was not always possible for vehicles to change lanes. Traffic volumes were low enough at the second test site that there was no barrier to changing lanes. Traffic in the right lane decreased by 12.9 and 21.1 percentage points at the sites with medium and low traffic, respectively.
60.558.6
63.059.9
0
10
20
30
40
50
60
70
80
No Incident Approaching Incident Passing Incident
Condition
Spee
d, m
phEast of Oasis West of Oasis Speeds decreased 1.9 to 3.1 mph when passing
the shoulder operation.
Posted speed limit
24
Figure 4.10 Lane distributions around the shoulder incident at two locations and two traffic
levels near the Des Plaines Oasis—westbound.
Figure 4.11 characterizes the lateral lane positioning of vehicles in the right lane at
the medium-traffic site as they passed the incident on the shoulder. The results showed that 87% of drivers shifted to the left side of the lane, while only 13% drove in the center of the lane and no vehicles passed shifted to the right side adjacent to the vehicles on the shoulder. The results in Figures 4.10 and 4.11 are positive in that they demonstrated that the majority of drivers changed out of the lane adjacent to a shoulder incident and those that did not shifted to the left side of the lane.
25.2%
53.0%
21.7%
38.9%
52.3%
8.8%
31.3%
0.6%
68.1%
0%
10%
20%
30%
40%
50%
60%
70%
80%
Left Center Right
Lane
Lane
dis
trib
utio
n, p
erce
ntNo incident
East of oasis - medium traffic
West of oasis - low traffic
Rig
ht S
houl
der C
losu
re
When traffic conditions permitted, more drivers
vacated the right lane when passing the shoulder
incident.

25
Figure 4.11 Lateral position in the right lane adjacent the closed right shoulder east of the
Des Plaines Oasis—westbound.
13.0% 13.0%8.7%
78.3%
87.0%
0.0%0%
20%
40%
60%
80%
100%
Left side Center Right sideLateral lane position
Perc
ent
No incident
Right shoulder closed
Rig
ht S
houl
der C
losu
re
Drivers in the right lane shifted away from the
shoulder incident

26
CHAPTER 5 DRIVER SURVEYS
5.1 METHODOLOGY ARA performed driver surveys at the Des Plaines Oasis during the mobile lane
closure and incident response observational studies conducted on I-90 on August 7 and 8, 2012. The purpose of the driver surveys was to determine the cues that drivers perceive, attend to, and use to make driving decisions in work zones. We located the observational study sites just upstream of the oasis entrance ramps, such that drivers entering the oasis would have recently passed through the study areas. We conducted surveys on two nights, the first night for the mobile lane closure of a single left lane and the second night for the incident response on the shoulder. ARA surveyed motorists entering the oasis between 11 p.m. and 1 a.m., and the survey consisted of the following eight questions:
1. Just before pulling into the oasis, did you pass a work activity taking place in the traffic lane (yes or no)?
2. What do you remember about it? a. Do you recall approximately how many vehicles were involved in the
activity? b. The approximate length the activity covered? c. Its distinguishing characteristics?
3. How would you classify the activity (e.g., highway construction, road maintenance, utility work, accident response, police activity)?
4. What led you to believe this? Anything specific? 5. Did you expect a driving delay when you saw this? If so, how much? 6. Please describe your driving actions from the time you first recognized the
activity until the time you passed it. 7. What prompted you to take these actions? 8. Is there anything else you would like to share about this topic?
In addition, surveyors recorded basic demographic information, such as the participant’s approximate age (> 65 and < 65), gender, and whether the participant was the driver or a passenger in the vehicle. The surveys took about 5 to 10 min to complete, and participants received the equivalent of a free cup of coffee (in the form of coins for the oasis concessions) as an incentive to participate. Overall, the surveys received positive support from the drivers, with the majority of drivers entering the oasis areas agreeing to participate.
Figure 5.1 ARA performed driver surveys at the Des Plaines Oasis during the observational
studies to identify the cues that drivers perceive and use to make driving decisions.

27
5.2 RESULTS—MOBILE LANE CLOSURE
5.2.1 Participant Characteristics Eight participants completed the survey during the night of the mobile lane closure.
Our survey location on the Oasis’ east side and the time (data collected after 9:30pm) both contributed to the low sample size. Few people appeared to travel east (towards Chicago) at night. While this sample limits the conclusions we might make, our findings are generally consistent with the data collected from a larger sample described in Section 5.3 collected on the Oasis’ west side. The sample characteristics were as follows:
· Age—100% under 65 years · Gender—89% male, 11% female · Driver or passenger—100% drivers
All participants responded yes to the first question, which asked whether they had noticed the work activity prior to entering the oasis.
5.2.2 Memory Recall of Distinguishing Characteristics and Cues The survey began by asking the participants what they remembered about the work
zone they had just passed through and was followed up with a question about its distinguishing characteristics. The purpose of these questions was to identify which work zone characteristics and cues caught their attention and were memorable. The questions were free-response and produced specific cues, such as “flashing lights,” “four or five cars on the left,” and “people working,” as well as responses that demonstrated cognitive operations to interpret the cues, such as “left lane closed” and “using trucks as lane blocker.” Overall, 13 comments were made regarding distinguishing cues and characteristics, distributed as follows:
· Lights (all types)—38.5%
· Cognitive operations—30.8%
· Vehicles—23.1%
· People—7.7%
Interestingly, none of the respondents specifically mentioned the arrow boards mounted on the four traffic control trucks or the changeable message board mounted on the advance warning vehicle. This may be due to the respondents categorizing the flashing arrows and message under the umbrella of their “flashing lights” responses, or it may indicate that they did not focus directly on the arrows when passing the mobile operation.
5.2.3 Driver Comprehension of the Mobile Operation Type ARA asked questions 3 and 4 to assess whether drivers are able to identify the types
of mobile operations they encounter at night, and if so, what cues they use to make this identification. Seven out of eight participants (88%) correctly responded that this was a roadway maintenance operation, while one respondent believed it was utility work. When asked what led them to this decision, the responses fell into the following three categories:
· Visual cues (e.g., signs, cones, trucks)—33.3%
· Cognitive operations (e.g., closed lane, on the shoulder)—33.3%
· Absence of cues (e.g., no construction vehicles and equipment)—33.3%

28
Examples of visual cues used to identify the operation included “all the cones out” and “big sign.” The absence of cues, such as construction vehicles and equipment, helped drivers determine that this was a maintenance operation instead of a road construction site.
5.2.4 What Actions to Take and Why? Questions 6 and 7 assessed what actions drivers would take when encountering this
type of work zone on the highway at night and what cues or cognitive operations would prompt them to take these actions. Participants provided ten comments describing the actions they would take, consisting of schematic type responses, such as “slow down and “change lanes,” as well as idiosyncratic responses specific to this situation, including “wondered what is the speed limit” and “where are the trucks?.” Overall, 80% of the responses were schematic and 20% were idiosyncratic.
The research team coded the reasons for taking these actions as either internal to the driver, such as “I’m a truck driver, so I’m safety conscious” and “wanted to be safe” or external to the driver, including “traffic slowed down,” “lights,” and “signs.” Overall, 75% of the responses were external, while 25% were internal explanations.
5.3 RESULTS—INCIDENT RESPONSE
5.3.1 Participant Characteristics Twenty-four participants completed the survey the night of the incident response to a
disabled vehicle on the shoulder. The sample characteristics were as follows:
· Age—96% under 65 years; 4% over 65 years
· Gender—75% male; 25% female
· Driver or passenger— 79% drivers; 21% passengers
Only 14 of the 24 (58.3%) participants responded yes to the first question, which asked whether they had noticed the incident on the shoulder prior to entering the oasis, so the results are based on their responses. It should be noted that for the first half of the test period the only traffic control vehicle present on the shoulder was a flatbed sign truck with strobe lights and an arrow board in caution mode. During the second half of testing, a second vehicle was placed on the shoulder just upstream of the sign truck, equipped with strobe lights and a light panel displaying a dancing diamond. While 8 of 13 (61.5%) participants in the first group did not recall seeing the shoulder incident, only 2 of 9 (22.2%) in the second group did not see it. This finding may indicate that the second truck with the dancing diamond display was more effective at attention-getting than the truck with flashing lights only, perhaps due to its uniqueness or increased visibility.
5.3.2 Memory Recall of Distinguishing Characteristics and Cues The survey began by asking the participants what they remembered about the
shoulder incident and was followed up with a question about its distinguishing characteristics. The purpose of the questions was to identify which incident response characteristics and cues caught their attention and were memorable. The questions were free-response and produced specific cues, such as “flashing lights,” “two trucks,” and “road crew,” as well as responses that demonstrated cognitive operations to interpret the cues, such as “had to get over a lane” and “things tell you to get over.” Overall, 33 comments were made regarding distinguishing cues and characteristics, distributed as follows:
· Lights (all types)—33.3%
· Vehicles—27.3%

29
· Cognitive operations—15.2%
· People—3.0%
· Other visual cues (e.g., dancing diamond, arrow, sign, and so on)—21.2%
5.3.3 Driver Comprehension of the Mobile Operation Type ARA asked questions 3 and 4 to assess whether drivers are able to identify the types
of mobile operations they encounter at night, and if so, what cues they use to make this identification. Seven out of fourteen participants (50%) correctly responded that this was an incident response (e.g., an accident, a car needing help, or a stranded motorist). The remaining participants believed it was roadway maintenance or utility work. When asked what led them to this decision, the seven participants who correctly identified it as an incident response all made reference to the car, the truck (or trucks), and the positioning of the trucks behind the car. Example responses were, “broken down car in front of service vehicle,” “tow truck pulled behind,” and “two trucks, one car.”
5.3.4 What Actions to Take and Why? Questions 6 and 7 assessed what actions drivers would take when encountering this
type of activity on the highway at night and what cues or cognitive operations would prompt them to take these actions. Participants provided 16 comments describing the actions they would have taken, consisting of schematic type responses, such as “slowed down” and “increased distance from car in front,” as well as idiosyncratic responses specific to this situation, including “get out of near lane to give them space” and “merged over one lane and went back over once car passed.” Overall, 31% of the responses were schematic and 69% were idiosyncratic.
The research team coded the reasons for taking these actions as either internal, such as “I always do it” and “knew construction workers and they complained about people getting too close,” or external, including “lights” and “anytime I see someone on the side of the road I get over a lane.” Overall, 62% of the responses were external, while 38% were internal explanations.

30
CHAPTER 6 FOCUS GROUPS
ARA organized a series of focus groups to understand nighttime drivers’ decision-making requirements, traffic control device preferences, and challenges associated with nighttime work zone driving. In general, focus groups provide the opportunity to investigate in more depth specific topics of interest, such as themes presented by the driver surveys. Specifically, we sought to do the following:
· Identify the cues drivers use to perceive and comprehend nighttime mobile operations
· Identify the traffic control indicators and warnings that drivers best respond to and the behaviors that result from these indicators and warnings
· Identify any uncertainties drivers have in nighttime work zones and suggestions for improvement
We conducted four focus groups at two sites, Champaign and Downers Grove, Illinois. Champaign is in central Illinois, a largely agricultural area; and was selected to represent drivers accustomed to driving on rural highways. Downers Grove is located in the western suburbs of Chicago, and was selected because drivers in this area are experienced with driving on urban freeways and interstates. ARA recruited focus group participants through several means, including word of mouth, posting of flyers, and radio announcements for the Champaign focus group and advertising on Craigslist and posting flyers in Illinois Tollway oases for the Downers Grove group. In both cases, we prescreened potential applicants using a survey posted on SurveyMonkey; and we selected participants who met the following criteria:
· Possessed a valid driver’s license
· Indicated that they drove sometimes, often, or all the time on highways at night
· Were available the time and date of one of the sessions
The research team selected participants to represent a range of age and driving experience, and we selected about equal numbers of female and male drivers. We compensated the participants $50 each at the end of their session, which lasted 2 hours.
6.1 PARTICIPANT CHARACTERISTICS The research team selected 20 participants for the Champaign focus group, of which
19 attended. We selected 20 attendees for the Downers Grove session, of which 14 attended. We also asked participants for information about their age and driving experience. Strong correlation exists between the two variables, as expected. Figures 6.1 and 6.2 show the participants’ gender and age distributions in the four sessions. All participants reported that they were typical drivers, or those who drove for work, school, or other personal-related reasons and reported having significant nighttime highway driving experience, as shown in Figure 6.3.

31
Figure 6.1 Gender distribution of participants.
Figure 6.2 Age distribution of participants.
0
1
2
3
4
5
6
7
Champaign AM Champaign PM Downers Grove AM Downers Grove PM
Session
Num
ber o
f Par
ticip
ants
Female Male
0
1
2
3
4
5
6
16 to 24 25 to 34 35 to 44 45 to 54 55 to 64 65 +
Age Group, years
Num
ber o
f Par
ticip
ants
Champaign Downers Grove

32
Figure 6.3 Nighttime highway driving experience of participants.
6.2 MEETING AGENDA The focus groups contained three main parts:
· A group discussion regarding general nighttime work zone driving experiences
· A group discussion regarding specific driver perceptions and behaviors in nighttime work zones
· A detailed questionnaire covering general and specific topics related to nighttime mobile operations
The session began with a welcome from Doug Steele, followed by an introduction of the project background by Jess Marcon. After this, the focus group leader, Laura Zimmerman, introduced the focus group goals and objectives.
Zimmerman then led the two group discussions, each one lasting about an hour. First, we discussed drivers’ general mental models of nighttime work zones, using uncaptioned pictures of actual field setups as visual aids. Second, we used videos of actual nighttime work zones to discuss specific scenarios. Finally, each participant completed a detailed questionnaire to allow quantifying of driver perceptions and behaviors in nighttime work zones. The entire focus group session lasted 2 hours.
0
10
20
30
40
50
60
Sometimes Often All the Time
Frequency of Nightime Highway Driving
Parti
cipa
nt P
erce
ntag
eChampaign Downers Grove

33
6.3 GROUP DISCUSSION: GENERAL WORK ZONE TOPICS We broadly defined nighttime work zones and showed participants photographs that
represented these scenarios. Figure 6.4 shows sample photos of nighttime work zones used to stimulate discussion. We did not present all examples of nighttime work activity; rather, we presented representative examples that might prompt participants to think about the variety of scenarios they may have experienced.
To address drivers’ mental models and prompt discussion, our focus group leader asked some of the following questions:
· Think back to driving through a highway work zone at night. Tell me about it.
· Describe some of those things you remember (for example, lights, barrels, and so on).
· Do you remember changing your driving behavior?
· To navigate safely through the work zone, what are the critical pieces of information you need to know?
Based on participants’ answers, the leader asked follow-up questions to uncover how drivers’ understanding and models influence their perception of and behavior around nighttime work zones. This procedure allowed us to elicit information about their expectations and past behavior without prompting them to discuss specific elements. We used this format so that our interests in specific nighttime work activity configurations would not influence participants’ memories and participants could respond freely with the elements in work zones that they believed affected their behavior.
Much of the discussion touched on general work zone themes (such as detours, length of delays, and activity type), which were not immediately relevant to the vehicle-mounted warning lights research. However, several applicable topics surfaced in the discussion.
Participants in all focus groups discussed warning lights (described as flashing lights, lights, and strobe lights) during the mental models portion. They reported that lights prompted certain expectations about the work effort and their resulting behaviors. Participants reported that they often expected to see workers when lights are present, they expect a work effort or zone, and they reported slowing down in response. While all groups reported that written guidance (e.g., signage and other) is critical to managing their expectations in a work zone, the Champaign morning and Downers Grove afternoon focus group participants indicated they desired lighting paired with signs to increase the situation’s clarity. For instance, some participants indicated, “lights are confusing unless there is a sign,” while others reported that pairing lights and signs prior to the work activity would improve interpretation.
The Downers Grove afternoon participants also reported on the intensity of work zone lighting. They believed intense flashing lights are helpful to alert drivers to activity at a distance, but once at the activity, the lights are distracting and may make drivers “feel uneasy” and briefly lose their vision. Participants reported new light bars (e.g., on state police vehicles) are “severely intense” and contribute to these reported problems.
6.4 SPECIFIC WORK ZONE VIDEOS After a brief break, the leader transitioned into a discussion about specific nighttime
work activities and presented a series of work zone videos, including five videos depicting light configurations relevant to mobile operations. After presenting each video, the leader asked some of the following questions to prompt discussion:
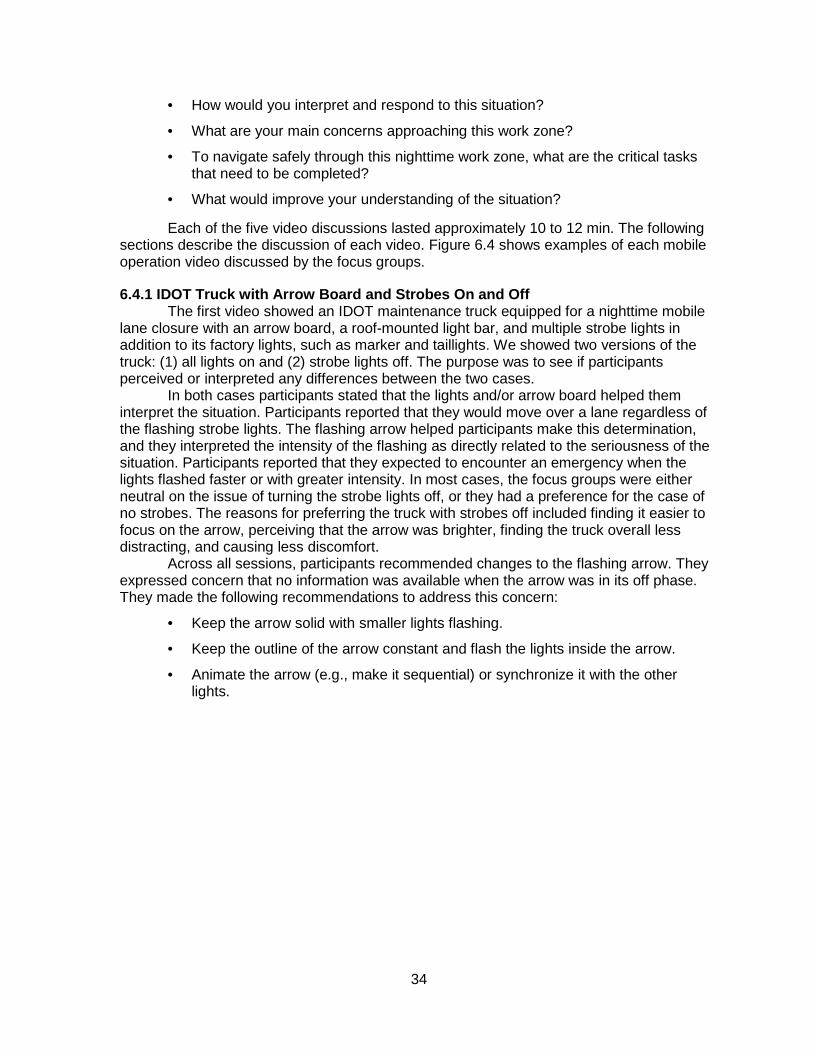
34
· How would you interpret and respond to this situation?
· What are your main concerns approaching this work zone?
· To navigate safely through this nighttime work zone, what are the critical tasks that need to be completed?
· What would improve your understanding of the situation?
Each of the five video discussions lasted approximately 10 to 12 min. The following sections describe the discussion of each video. Figure 6.4 shows examples of each mobile operation video discussed by the focus groups.
6.4.1 IDOT Truck with Arrow Board and Strobes On and Off The first video showed an IDOT maintenance truck equipped for a nighttime mobile
lane closure with an arrow board, a roof-mounted light bar, and multiple strobe lights in addition to its factory lights, such as marker and taillights. We showed two versions of the truck: (1) all lights on and (2) strobe lights off. The purpose was to see if participants perceived or interpreted any differences between the two cases.
In both cases participants stated that the lights and/or arrow board helped them interpret the situation. Participants reported that they would move over a lane regardless of the flashing strobe lights. The flashing arrow helped participants make this determination, and they interpreted the intensity of the flashing as directly related to the seriousness of the situation. Participants reported that they expected to encounter an emergency when the lights flashed faster or with greater intensity. In most cases, the focus groups were either neutral on the issue of turning the strobe lights off, or they had a preference for the case of no strobes. The reasons for preferring the truck with strobes off included finding it easier to focus on the arrow, perceiving that the arrow was brighter, finding the truck overall less distracting, and causing less discomfort.
Across all sessions, participants recommended changes to the flashing arrow. They expressed concern that no information was available when the arrow was in its off phase. They made the following recommendations to address this concern:
· Keep the arrow solid with smaller lights flashing.
· Keep the outline of the arrow constant and flash the lights inside the arrow.
· Animate the arrow (e.g., make it sequential) or synchronize it with the other lights.

35
Figure 6.4 Examples of videos shown in the focus groups. IDOT maintenance truck with arrow board and strobe lights (top left), Illinois Tollway HELP truck (top right), incident
response truck on shoulder (middle left), mobile lane closure of a single left lane (middle right), and Illinois State Police with standard and directional light bars (bottom).

36
6.4.2 Mobile Lane Closure of a Single Left Lane This video showed a mobile lane closure on a multi-lane expressway using a four-
truck convoy, plus an advance warning truck, to close the lane. Each of the four trucks was equipped with an arrow board and multiple strobe lights. Participants reported mixed interpretation of this scenario. Some participants were confident that they knew to respond by changing lanes, but others were unsure about the nature of the work activity. Participants across all groups were unsure about how they should respond to the activity. All groups interpreted the scenario as a work activity and found the flashing lights intense, but reported that they captured attention.
To improve drivers’ situation assessments and reduce the potential for difficulty with the flashing lights, participants made the following recommendations:
· Rather than allow the arrow to flash randomly, synchronize the arrows between trucks to create a domino effect (i.e., sequential flashing).
· Use written text on static signs or Changeable Message Signs to indicate which lane drivers should drive in.
· Use a solid arrow rather than a blinking arrow.
· Transition flashing lights to solid lights once drivers are within the lane closure to reduce the distracting effects of flashing lights.
· Alternate the flashing arrows and other flashing lights so that they do not flash at the same time.
6.4.3 Incident Response on Shoulder The incident response video consisted of two traffic control vehicles behind a
disabled vehicle on the right shoulder of a multi-lane expressway at night. The lead truck was equipped with strobe lights and an arrow board operating in caution mode; the second truck contained strobe lights and a light panel with a dancing diamond display.
The dancing diamond sign dominated the participants’ discussion of this scenario. All groups had difficulty interpreting the large diamond, which alternated from left to right at a rate of about 2 sec per cycle. Some associated the diamond with a car pool lane, railroad crossing, or school zone. While they believed the board captured their attention, many expressed concern that they did not know what actions to take in response to the signals. The additional lights and strobes did not assist with participants’ interpretation of the situation.
This is an example of a situation where lights require additional guidance and written instructions would assist interpretation. Most groups suggested using the word “caution” instead of the diamonds because drivers would not need to decode the word’s meaning. In spite of their confusion over the meaning of the diamonds, the majority of participants agreed that it did not alter the actions they would take compared with the case of strobe lights only—meaning that they would slow down and change lanes away from the shoulder. Reasons for changing lanes included Illinois’ Move Over law, providing courtesy to or out of concern for the workers, and protecting themselves from an uncertain situation. One participant suggested that it might be more appropriate for vehicles on the shoulder to use an arrow board in arrow mode, given the Move Over law.
6.4.4 Illinois Tollway HELP Truck The Illinois Tollway uses a mobile vehicle assistance service named HELP to aid
disabled vehicles on its expressways. The HELP truck is equipped with a wide assortment of

37
warning devices, including an arrow board, a changeable message system, a light bar, and multiple strobe lights.
According to participants in all focus groups, the combination of strobe and caution lights were too overwhelming. They had difficulty identifying which element required a response and wondered whether to pay attention to the arrow, the message sign, or both. Participants reported that the arrow flash rate was too quick and that the multiple flash rates and lights at the bottom of the truck were distracting. While they reported that they would likely “be careful, stay alert, move over, and slow down,” many participants reported that they would like to see improvements in this scenario, making the following recommendations:
· Flash half the number of lights.
· Keep the lights solid and make the message sign flashing.
· Synchronize the flashing rates or keep the message sign solid.
· Reduce the number of strobe lights.
6.4.5 State Police with Standard and Directional Light Bars The final video was a state police vehicle with a standard roof-mounted light bar with
random flashing red and blue lights, plus a directional light bar in the rear window. The directional light bar was set to flash from right to left and was amber-colored, similar to DOT vehicles. The police car was positioned on the right shoulder of a rural interstate.
In general, all participants recognized that red and blue lights mean police and stated that they would respond to this situation by slowing down and changing lanes, if possible. The reasons for taking these actions included knowledge of the Move Over law, courtesy or concern for the officer, and concern about receiving a ticket. Participants agreed that the lights are highly visible and attention-getting; however, there was concern that they can be too intense, especially when raining, causing glare discomfort and possibly momentary loss of vision when approaching at close distances. Several people suggested that the directional light bar was a good addition by giving the message “move to the left,” much like an arrow board (but without the arrow head).
Suggestions for improvement included:
· Reduce the intensity of the roof-mounted lights or design a shield to reduce glare when drivers are near the vehicle.
· Incorporate the directional light bar either as a stand-alone device or program the roof-mounted light bar to function in directional mode when the situation is appropriate.
6.5 QUESTIONNAIRE
6.5.1 General Topic Responses After the discussion ended, each participant completed a survey that took about 20
min. The survey covered general questions about work zone characteristics and driver behavior. We created the survey to examine further driver behaviors and nighttime work zone characteristics, as revealed by the rest area interviews. For example, drivers most often recalled signs and lights as they passed through the work zone. We incorporated these elements into the survey, along with other relevant challenges to driving through nighttime work zones. Participants made judgments about their responses to these scenarios, identified elements about the site that were unclear, described their level of

38
certainty about their actions, and stated what would improve their work zone comprehension.
Participants ranked how a series of traffic-related items influenced their behavior when driving in traffic work zones at night. These items were ranked on a 1-to-10 scale (1 = least influential, 10 = most influential). Figure 6.5 presents the mode score for each work zone factor by focus group location.
Figure 6.5 Influence of work zone factors on driver behavior (1 = least, 10 = most).
Participants most often ranked emergency responders, workers, and traffic or other
vehicles, as having the most influence on their driving behavior. Similarly, both groups of participants ranked reflective materials and equipment as having the least effect on their behavior. Lighted signs, drums and cones, signs, and lights (all types) had a moderate influence on both sets of drivers. The work zone factors were based on responses from the driver surveys and included factors common to stationary lane closures, mobile lane closures, and other nighttime mobile operations, such as incident response. Given the free-response nature of the driver survey questions, some factors, such as lights and reflective materials, were general and can include a wide range of specific devices and applications within each category.
Participants indicated whether they typically experienced too little, just enough, or too much information, reflective material, and light when driving through a work zone at night. Figures 6.6 and 6.7 show that participants (both rural and urban drivers) typically experienced too little information in nighttime work zones. This finding is largely consistent with comments made during focus group discussions, in which participants remarked that they desired more information. For example, they often stated that they wanted to know when workers were present, to see written signs rather than symbols, and to know the
0
1
2
3
4
5
6
7
8
9
10
EmergencyResponders
Workers Traffic orVehicles
LightedSigns
Drums andor Cones
Signs Lights Guardrailsor Barriers
ReflectiveMaterials
Equipment
Work Zone Factor
Influ
ence
on
Driv
ers
Champaign
Downers Grove

39
duration of work activity. Participants from both groups indicated that there typically exist just enough reflective materials in work zones. Finally, the majority of participants from Champaign indicated that there was too little light in nighttime work zones, while participants from Downers Grove responded that the amount of lighting was just enough. The high-mast lighting typical of urban expressways and interstates may explain the difference between the Downers Grove and Champaign participants’ responses.
Figure 6.6 Driver opinions of different work zone characteristics—Champaign group.
28%
42%
61%
21%
0%
11%
21%
58% 58%
0%
20%
40%
60%
80%
Information Reflective Materials Light
Work Zone Characteristic
Perc
enta
ge o
f Par
ticip
ants
Too Little Just Enough Too Much
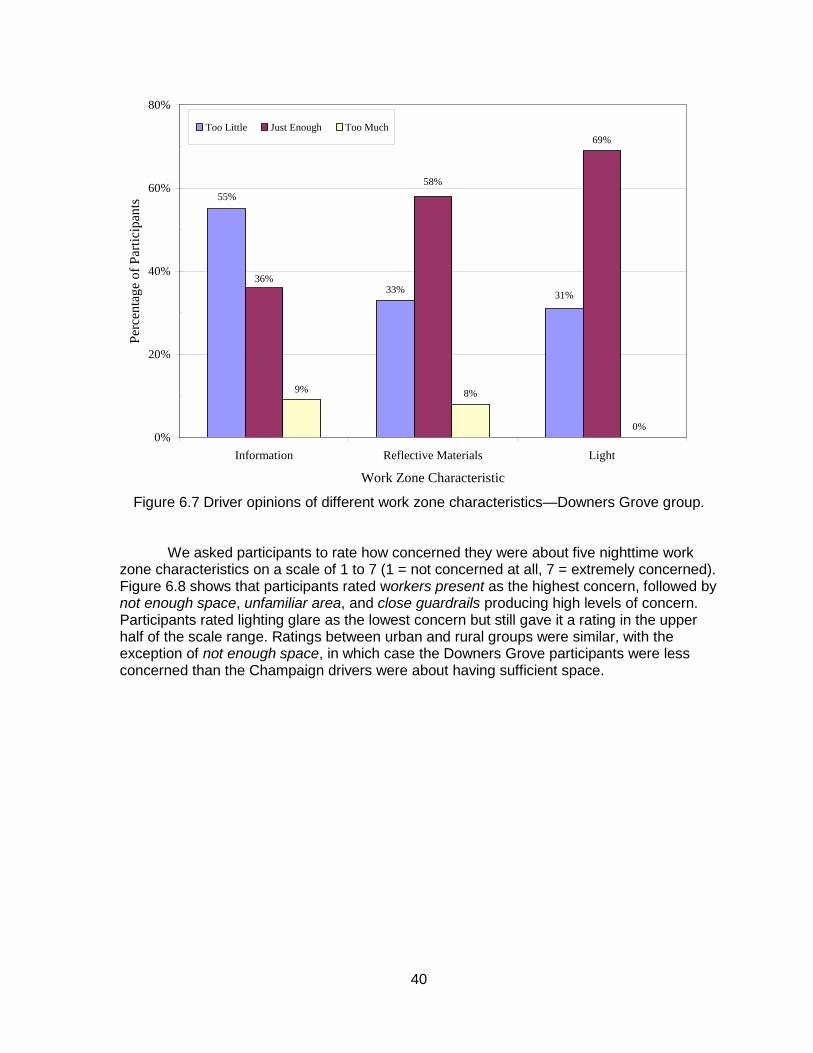
40
Figure 6.7 Driver opinions of different work zone characteristics—Downers Grove group.
We asked participants to rate how concerned they were about five nighttime work
zone characteristics on a scale of 1 to 7 (1 = not concerned at all, 7 = extremely concerned). Figure 6.8 shows that participants rated workers present as the highest concern, followed by not enough space, unfamiliar area, and close guardrails producing high levels of concern. Participants rated lighting glare as the lowest concern but still gave it a rating in the upper half of the scale range. Ratings between urban and rural groups were similar, with the exception of not enough space, in which case the Downers Grove participants were less concerned than the Champaign drivers were about having sufficient space.
33%
69%
9% 8%
0%
31%
55%
36%
58%
0%
20%
40%
60%
80%
Information Reflective Materials Light
Work Zone Characteristic
Perc
enta
ge o
f Par
ticip
ants
Too Little Just Enough Too Much

41
Figure 6.8 Level of driver concern caused by various factors (1 = low, 7 = high).
6.5.2 Responses to Specific Work Zones Following the general questions, the survey presented an image of a nighttime
mobile lane closure. A caption with each image provided additional information about the work zone. The questionnaire asked participants to study the work zone image and respond to a series of questions regarding what actions they would take in each situation, how clear their comprehension of the situations was (noting any specific uncertainties), and what could improve the certainty of each situation. Finally, we asked participants to provide any additional comments they may have had regarding the specific work zones. Figure 6.9 shows the work zone image and caption provided in the questionnaire.
0
1
2
3
4
5
6
7
Workers Present Not Enough Space Unfamiliar Area Close Guardrails Lighting Glare
Factor Causing Concern
Leve
l of C
once
rn
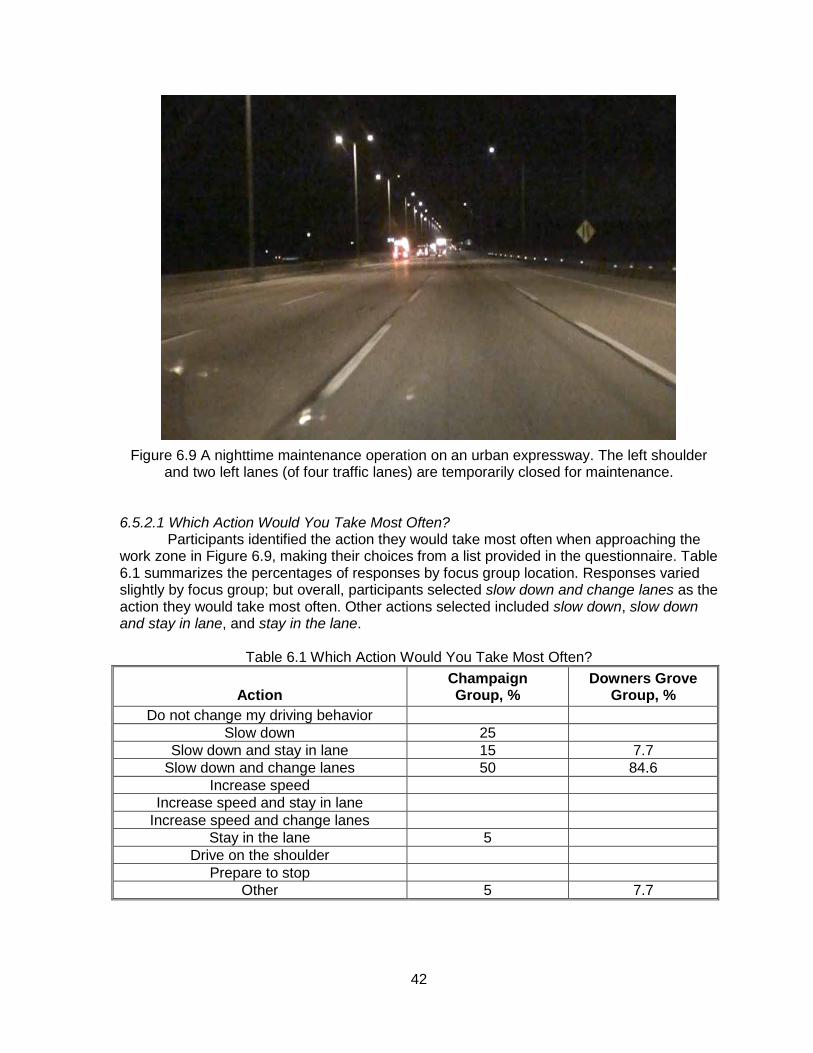
42
Figure 6.9 A nighttime maintenance operation on an urban expressway. The left shoulder
and two left lanes (of four traffic lanes) are temporarily closed for maintenance. 6.5.2.1 Which Action Would You Take Most Often?
Participants identified the action they would take most often when approaching the work zone in Figure 6.9, making their choices from a list provided in the questionnaire. Table 6.1 summarizes the percentages of responses by focus group location. Responses varied slightly by focus group; but overall, participants selected slow down and change lanes as the action they would take most often. Other actions selected included slow down, slow down and stay in lane, and stay in the lane.
Table 6.1 Which Action Would You Take Most Often?
Action
Champaign Group, %
Downers Grove Group, %
Do not change my driving behavior Slow down 25
Slow down and stay in lane 15 7.7 Slow down and change lanes 50 84.6
Increase speed Increase speed and stay in lane
Increase speed and change lanes Stay in the lane 5
Drive on the shoulder Prepare to stop
Other 5 7.7

43
6.5.2.2 Which Actions Would You Take First, Second, and Third? Participants indicated the sequence of actions they would take in each work zone by
recording the first, second, and third actions they would perform. Table 6.2 summarizes their reported rankings and shows identical results between focus groups. In all cases, participants indicated that their first action in the work zone would be to slow down. Their second action would be to slow down and change lanes or stay in the lane, while their third action would be to prepare to stop.
Table 6.2 Which Action Would You Take First, Second, and Third?
Action
Champaign Group
Downers Grove Group
Do not change my driving behavior Slow down 1 1
Slow down and stay in lane Slow down and change lanes 2 2
Increase speed Increase speed and stay in lane
Increase speed and change lanes Stay in the lane 2 2
Drive on the shoulder Prepare to stop 3 3
Other
6.5.2.3 Situational Certainty Participants rated how certain they would be about their behavior when approaching
the work zone sites, on a 1-to-7 scale (1 = completely uncertain, 7 = completely certain). Across groups, the mean rating was 5.5, and there were no significant differences between groups. These scores indicate a moderately high level of driver certainty for this case.
When asked whether there was anything specifically unclear about the two work zones, ten Champaign participants reported elements about the situation that included actions (questions about what action to take or decision to make), physical cues (physical items in the scene), and environment information (information about the work zone). The following are examples:
· Actions
o “When can you get back in the left lanes?”
o “When to merge?”
o “Do I need to slow down if traffic is not slowing down?”
· Physical cues
o “Cannot see signage indicating lane change. Lighted arrows are first indicator.”
· Environment information:
o “How long is the construction?”
o “Where does it [the construction] begin?”

44
Three Downers Grove participants identified elements that made the situation unclear. They reported concerns about the physical environment.
· Physical cues
o “Needs warning signs.”
o “There should be a sign with advance warning.”
6.5.2.4 What Would Improve Your Comprehension?
Participants provided multiple suggestions for changes that might improve their comprehension. Across all locations, participants made 31 suggestions. Six additional participants (two from Downers Grove) indicated that the work zone did not require improvements. Across all locations, 45.2% of these suggestions recommended improving the signs in the work zone. Participants specifically identified adding written content to the signs in 28.6% of their suggestions. For example, participants recommended:
· “Written signs”
· “‘Left two lanes closed’ sign”
Advance warning comprised 16.1% of recommendations. Participants made general recommendations about warnings, such as “more warning” and “advance warning.” It should be noted that the survey included only the still photo shown in Figure 6.9 and did not show the advance warning area. Other recommendations included increasing lighting in the area (9.7%), increasing barrels (9.7%), using trucks or vehicles in the work zone to guide behavior (9.7%), arrows (3.2%), speed indicators (3.2%), and information about work zone length (3.2%).
The results show the importance of several key work zone components, such as signs and messages provided in the advance warning area (not depicted in the photo), on driver comprehension. While devices such as strobe lights and flashing arrows serve as caution and provide guidance at night, other devices, such as signs with written text and changeable message signs, provide information that increases driver comprehension of what is happening in the work zone, what to expect, and what actions to take.
6.5.2.5 Additional Comments
Three Champaign participants and one Downers Grove participant made additional comments. Champaign participants reported:
· “From this photo, we see very little warning until we are upon the construction.”
· “The signs are helpful in this circumstance. Just make sure the lanes stay marked.”
· “I think barrels might be helpful to give the workers more protection.”
The one Downers Grove participant expressed concern that the area was “not well lighted” and that “maybe a couple of signs,” such as those typically included in the advance warning area, would improve drivers’ comprehension.
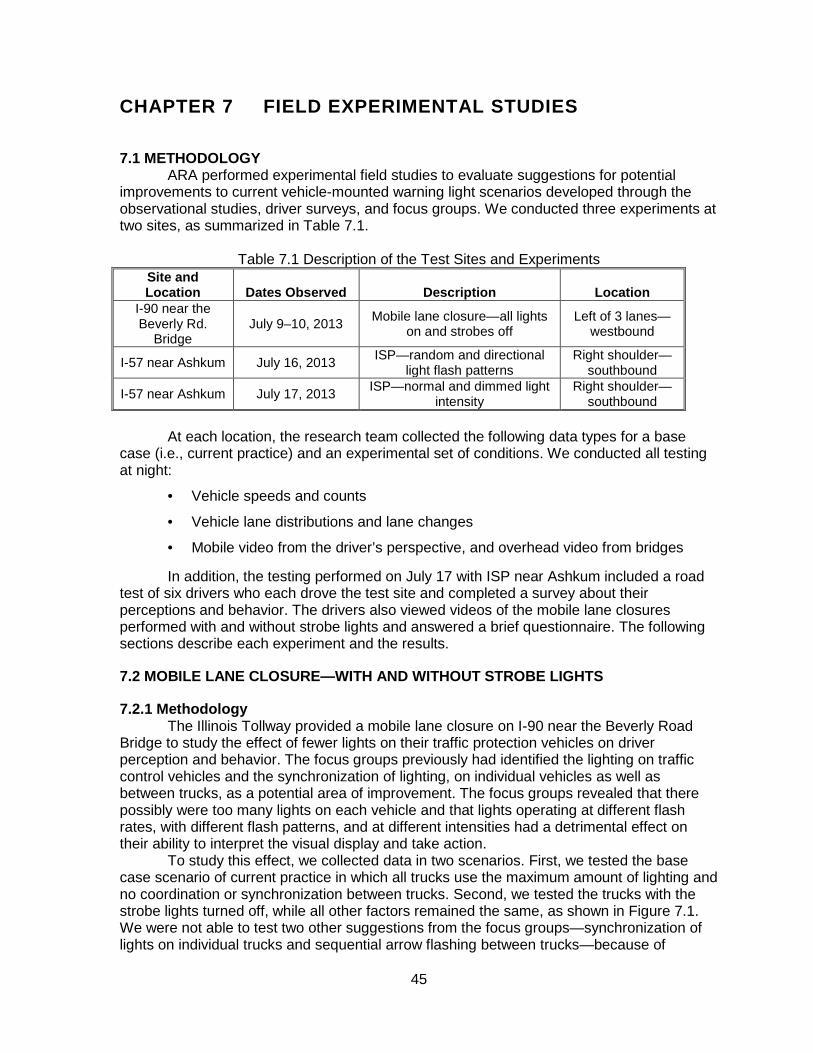
45
CHAPTER 7 FIELD EXPERIMENTAL STUDIES
7.1 METHODOLOGY ARA performed experimental field studies to evaluate suggestions for potential
improvements to current vehicle-mounted warning light scenarios developed through the observational studies, driver surveys, and focus groups. We conducted three experiments at two sites, as summarized in Table 7.1.
Table 7.1 Description of the Test Sites and Experiments
Site and Location Dates Observed Description Location
I-90 near the Beverly Rd.
Bridge July 9–10, 2013 Mobile lane closure—all lights
on and strobes off Left of 3 lanes—
westbound
I-57 near Ashkum July 16, 2013 ISP—random and directional light flash patterns
Right shoulder—southbound
I-57 near Ashkum July 17, 2013 ISP—normal and dimmed light intensity
Right shoulder—southbound
At each location, the research team collected the following data types for a base
case (i.e., current practice) and an experimental set of conditions. We conducted all testing at night:
· Vehicle speeds and counts
· Vehicle lane distributions and lane changes
· Mobile video from the driver’s perspective, and overhead video from bridges
In addition, the testing performed on July 17 with ISP near Ashkum included a road test of six drivers who each drove the test site and completed a survey about their perceptions and behavior. The drivers also viewed videos of the mobile lane closures performed with and without strobe lights and answered a brief questionnaire. The following sections describe each experiment and the results.
7.2 MOBILE LANE CLOSURE—WITH AND WITHOUT STROBE LIGHTS
7.2.1 Methodology The Illinois Tollway provided a mobile lane closure on I-90 near the Beverly Road
Bridge to study the effect of fewer lights on their traffic protection vehicles on driver perception and behavior. The focus groups previously had identified the lighting on traffic control vehicles and the synchronization of lighting, on individual vehicles as well as between trucks, as a potential area of improvement. The focus groups revealed that there possibly were too many lights on each vehicle and that lights operating at different flash rates, with different flash patterns, and at different intensities had a detrimental effect on their ability to interpret the visual display and take action.
To study this effect, we collected data in two scenarios. First, we tested the base case scenario of current practice in which all trucks use the maximum amount of lighting and no coordination or synchronization between trucks. Second, we tested the trucks with the strobe lights turned off, while all other factors remained the same, as shown in Figure 7.1. We were not able to test two other suggestions from the focus groups—synchronization of lights on individual trucks and sequential arrow flashing between trucks—because of

46
limitations in the vehicles’ lighting systems, which would have required significant technical modification and expense for testing.
Figure 7.1 Traffic control vehicle with strobe lights turned on (top) and off (bottom).
Strobes on
Strobes off

47
7.2.2 Results 7.2.2.1 Performance Measures
ARA measured vehicle speeds from an overhead bridge position 1,000 ft upstream of the beginning of the mobile lane closure operation. In addition to the two test scenarios, we collected baseline data under open road conditions. We measured speeds between 12:30 and 3:00 a.m., during which time traffic volumes ranged from 350 to 500 vehicles per hour, meaning free flow traffic conditions. The posted speed limit at this location was 55 mph. Figure 7.2 summarizes the speed data and shows very similar mean speeds for both test conditions. Vehicle speeds with the lane closure were approximately 5 to 6 mph lower than for the open road conditions.
Figure 7.2 Speed data for the mobile lane closure test site.
Figure 7.3 presents the lane distribution data for three conditions—no mobile lane
closure, mobile lane closure with all lights on the trucks turned on, and mobile lane closure with strobe lights turned off. The data show that during open road conditions at this time and location, 16.2% of the traffic was in the left lane. With the mobile lane closures, the amount of traffic approaching the closure within 1,000 ft reduced to 1% to 2%, and there was no significant difference between the all-lights and no-strobes conditions. There was a significant decrease in the number of vehicles approaching the left lane closure in the adjacent center lane when the strobe lights were turned off, which may indicate that drivers were able to identify and react to the lane closure at a greater distance upstream relative to the case of all lights on. Interestingly, both lane closure scenarios resulted in an overshift of traffic to the right lane, meaning that the increase in vehicles in the right lane was much greater than what can be accounted for because of the closed lane. With the left lane closed, traffic in the right lane increased from 35.6% to approximately 80%.
65.363.3
60.2
70.0
57.660.7 57.8
0
10
20
30
40
50
60
70
80
Left Center RightLane
Spee
d, m
ph
No lane closure All lights on Strobes off
Posted speed limit
No difference in speeds between the two scenarios
Left
Lane
Clo
sed
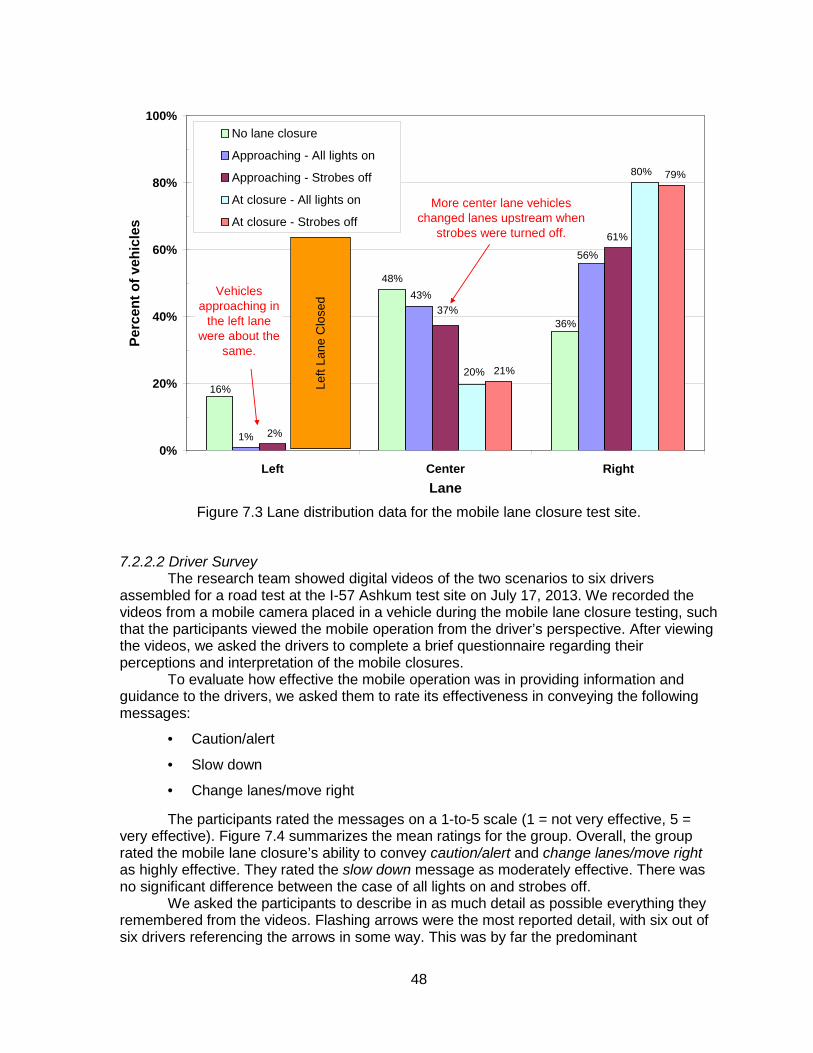
48
Figure 7.3 Lane distribution data for the mobile lane closure test site.
7.2.2.2 Driver Survey
The research team showed digital videos of the two scenarios to six drivers assembled for a road test at the I-57 Ashkum test site on July 17, 2013. We recorded the videos from a mobile camera placed in a vehicle during the mobile lane closure testing, such that the participants viewed the mobile operation from the driver’s perspective. After viewing the videos, we asked the drivers to complete a brief questionnaire regarding their perceptions and interpretation of the mobile closures.
To evaluate how effective the mobile operation was in providing information and guidance to the drivers, we asked them to rate its effectiveness in conveying the following messages:
· Caution/alert
· Slow down
· Change lanes/move right
The participants rated the messages on a 1-to-5 scale (1 = not very effective, 5 = very effective). Figure 7.4 summarizes the mean ratings for the group. Overall, the group rated the mobile lane closure’s ability to convey caution/alert and change lanes/move right as highly effective. They rated the slow down message as moderately effective. There was no significant difference between the case of all lights on and strobes off.
We asked the participants to describe in as much detail as possible everything they remembered from the videos. Flashing arrows were the most reported detail, with six out of six drivers referencing the arrows in some way. This was by far the predominant
48%
1%
36%
16%
56%
43%
61%
37%
2%
80%
20%
79%
21%
0%
20%
40%
60%
80%
100%
Left Center RightLane
Perc
ent o
f veh
icle
sNo lane closure
Approaching - All lights on
Approaching - Strobes off
At closure - All lights on
At closure - Strobes offMore center lane vehicles
changed lanes upstream when strobes were turned off.
Left
Lane
Clo
sed
Vehicles approaching in
the left lane were about the
same.

49
characteristic reported by the group. Two participants mentioned the surrounding traffic, and two mentioned the trucks’ strobe lights. Their responses for the all-lights-on and strobes-off scenarios were very similar; however, the strobes-off scenario produced slightly more detailed responses, especially with respect to the arrow boards. For example, respondents commented “No strobes made it easier to focus on arrows” and “Can see flash pattern better without strobes.” One person commented that they found the strobes “annoying” and “unnecessary.”
When asked if they had a preference for one scenario over the other, five of six participants preferred the no-strobes scenario for reasons such as “easier to see” and that it was “cleaner.” Several participants responded that they thought the arrows in the no-strobes scenario formed a sequential pattern—for example, where one arrow turned off and the next arrow in line turned on. However, the flashing pattern was the same in both videos, which may suggest that drivers noticed it more in the strobes-off video because of their ability to focus better on the arrows.
Figure 7.4 Driver-reported effectiveness of conveying messages for the mobile lane closure.
7.3 STATE POLICE—RANDOM AND DIRECTIONAL FLASH PATTERNS
7.3.1 Methodology The Illinois State Police District 21 headquarters provided a trooper and vehicle for
testing on I-57 near Ashkum. The focus groups identified two characteristics of police lights of interest—flash pattern and light intensity. The first test we conducted was to study the effect of a directional flash pattern on driver behavior when passing a police car stopped on the shoulder. To do this, we used an ISP vehicle with a roof-mounted light bar that provides both random and directional flash patterns. The light bar contained six banks of rear-facing
4.7
3.2
4.7
3.5
4.8 4.8
0
1
2
3
4
5
Caution/alert Slow Down Change lanes/move rightMessage
Rat
ing
All lights on Strobes off
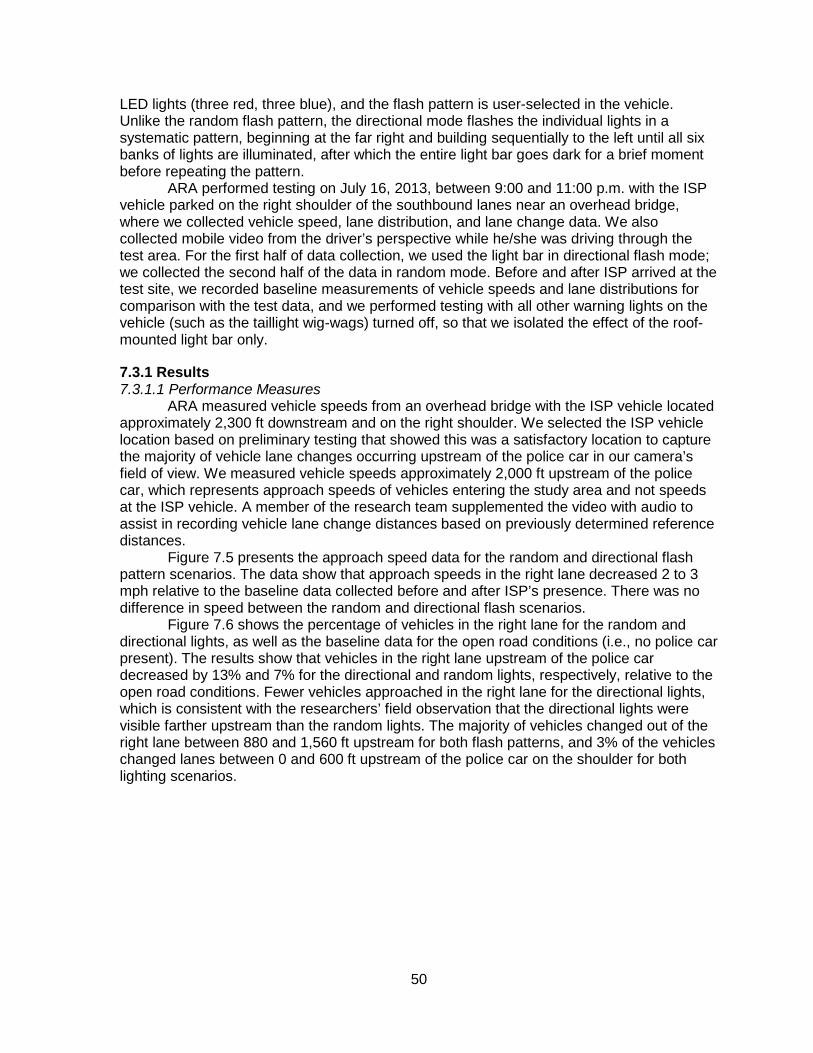
50
LED lights (three red, three blue), and the flash pattern is user-selected in the vehicle. Unlike the random flash pattern, the directional mode flashes the individual lights in a systematic pattern, beginning at the far right and building sequentially to the left until all six banks of lights are illuminated, after which the entire light bar goes dark for a brief moment before repeating the pattern.
ARA performed testing on July 16, 2013, between 9:00 and 11:00 p.m. with the ISP vehicle parked on the right shoulder of the southbound lanes near an overhead bridge, where we collected vehicle speed, lane distribution, and lane change data. We also collected mobile video from the driver’s perspective while he/she was driving through the test area. For the first half of data collection, we used the light bar in directional flash mode; we collected the second half of the data in random mode. Before and after ISP arrived at the test site, we recorded baseline measurements of vehicle speeds and lane distributions for comparison with the test data, and we performed testing with all other warning lights on the vehicle (such as the taillight wig-wags) turned off, so that we isolated the effect of the roof-mounted light bar only.
7.3.1 Results 7.3.1.1 Performance Measures
ARA measured vehicle speeds from an overhead bridge with the ISP vehicle located approximately 2,300 ft downstream and on the right shoulder. We selected the ISP vehicle location based on preliminary testing that showed this was a satisfactory location to capture the majority of vehicle lane changes occurring upstream of the police car in our camera’s field of view. We measured vehicle speeds approximately 2,000 ft upstream of the police car, which represents approach speeds of vehicles entering the study area and not speeds at the ISP vehicle. A member of the research team supplemented the video with audio to assist in recording vehicle lane change distances based on previously determined reference distances.
Figure 7.5 presents the approach speed data for the random and directional flash pattern scenarios. The data show that approach speeds in the right lane decreased 2 to 3 mph relative to the baseline data collected before and after ISP’s presence. There was no difference in speed between the random and directional flash scenarios.
Figure 7.6 shows the percentage of vehicles in the right lane for the random and directional lights, as well as the baseline data for the open road conditions (i.e., no police car present). The results show that vehicles in the right lane upstream of the police car decreased by 13% and 7% for the directional and random lights, respectively, relative to the open road conditions. Fewer vehicles approached in the right lane for the directional lights, which is consistent with the researchers’ field observation that the directional lights were visible farther upstream than the random lights. The majority of vehicles changed out of the right lane between 880 and 1,560 ft upstream for both flash patterns, and 3% of the vehicles changed lanes between 0 and 600 ft upstream of the police car on the shoulder for both lighting scenarios.

51
Figure 7.5 Upstream speeds—random and directional lights.
Figure 7.6 Percentage of vehicles in the right lane—random and directional lights.
65.1 65.267.3
71.4
63.865.9
63.7
70.4
40
50
60
70
80
Left RightLane
Spee
d, m
phNo ISP - Before Directional Lights
Random Lights No ISP - After
Some upstream speed reduction due to police presence (2 to 3 mph). No difference between directional and
random lights.
Posted speed limit
Polic
e on
Rig
ht S
houl
der
56%
64%
7%3%
20%
70%
76%
69%
60%
10%
3%
24%
0%
20%
40%
60%
80%
100%
0 600 880 1,560 1,960 2,320Upstream distance, ft
Perc
ent o
f veh
icle
s
Directional Lights
Random Lights
Polic
e on
Rig
ht S
houl
der Fewer vehicles approached in
the right lane for the directional lights.
With No Police = 83%
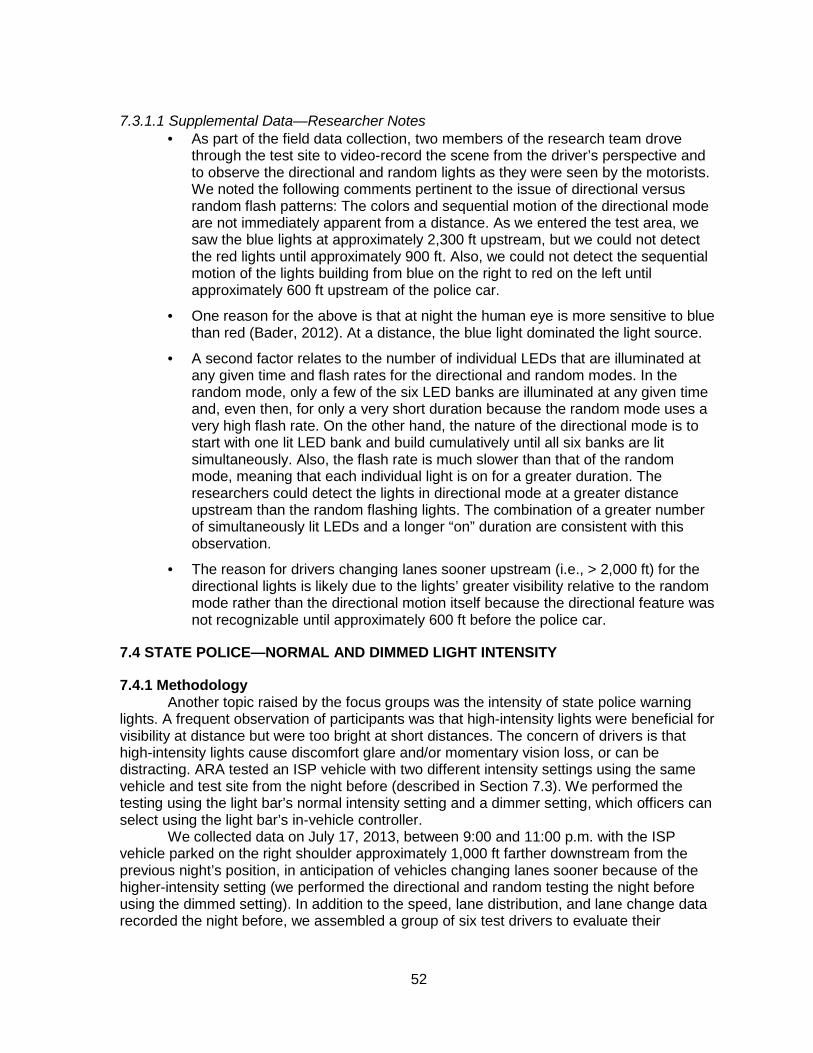
52
7.3.1.1 Supplemental Data—Researcher Notes
· As part of the field data collection, two members of the research team drove through the test site to video-record the scene from the driver’s perspective and to observe the directional and random lights as they were seen by the motorists. We noted the following comments pertinent to the issue of directional versus random flash patterns: The colors and sequential motion of the directional mode are not immediately apparent from a distance. As we entered the test area, we saw the blue lights at approximately 2,300 ft upstream, but we could not detect the red lights until approximately 900 ft. Also, we could not detect the sequential motion of the lights building from blue on the right to red on the left until approximately 600 ft upstream of the police car.
· One reason for the above is that at night the human eye is more sensitive to blue than red (Bader, 2012). At a distance, the blue light dominated the light source.
· A second factor relates to the number of individual LEDs that are illuminated at any given time and flash rates for the directional and random modes. In the random mode, only a few of the six LED banks are illuminated at any given time and, even then, for only a very short duration because the random mode uses a very high flash rate. On the other hand, the nature of the directional mode is to start with one lit LED bank and build cumulatively until all six banks are lit simultaneously. Also, the flash rate is much slower than that of the random mode, meaning that each individual light is on for a greater duration. The researchers could detect the lights in directional mode at a greater distance upstream than the random flashing lights. The combination of a greater number of simultaneously lit LEDs and a longer “on” duration are consistent with this observation.
· The reason for drivers changing lanes sooner upstream (i.e., > 2,000 ft) for the directional lights is likely due to the lights’ greater visibility relative to the random mode rather than the directional motion itself because the directional feature was not recognizable until approximately 600 ft before the police car.
7.4 STATE POLICE—NORMAL AND DIMMED LIGHT INTENSITY
7.4.1 Methodology Another topic raised by the focus groups was the intensity of state police warning
lights. A frequent observation of participants was that high-intensity lights were beneficial for visibility at distance but were too bright at short distances. The concern of drivers is that high-intensity lights cause discomfort glare and/or momentary vision loss, or can be distracting. ARA tested an ISP vehicle with two different intensity settings using the same vehicle and test site from the night before (described in Section 7.3). We performed the testing using the light bar’s normal intensity setting and a dimmer setting, which officers can select using the light bar’s in-vehicle controller.
We collected data on July 17, 2013, between 9:00 and 11:00 p.m. with the ISP vehicle parked on the right shoulder approximately 1,000 ft farther downstream from the previous night’s position, in anticipation of vehicles changing lanes sooner because of the higher-intensity setting (we performed the directional and random testing the night before using the dimmed setting). In addition to the speed, lane distribution, and lane change data recorded the night before, we assembled a group of six test drivers to evaluate their

53
perception and driving behavior under actual field conditions. This testing took place simultaneous to speed and lane usage data collection.
7.4.1 Results 7.4.1.1 Performance Measures
Figure 7.7 summarizes the approach speed data for the dimmed and normal light intensities. It shows that 2,900 ft upstream of the ISP vehicle, speed reductions were minimal (only 1 to 2 mph in the right lane) relative to the open road conditions. There was no significant difference between the mean speeds for the dimmed and normal intensity lights.
Figure 7.7 Upstream speeds—dimmed and normal-intensity lights.
Figure 7.8 shows the percentage of vehicles in the right lane for the dimmed and
normal intensity lights, as well as the baseline data for the open road conditions (i.e., no police car present). The results show that vehicles in the right lane upstream of the police car decreased by 6 and 9 percentage points for the dimmed and normal-intensity lights, respectively, relative to the open road conditions. Fewer vehicles approached in the right lane for the normal-intensity lights, reflecting the lights’ increased visibility upstream as a result of their higher intensity. The most common lane change location was between 1,840 and 2,520 ft upstream for both light intensities, and all vehicles changed lanes by 960 ft upstream of the police car on the shoulder for both lighting scenarios.
66.8
70.9
67.067.9
64.964.2
68.4
64.8
40
50
60
70
80
Left RightLane
Spee
d, m
ph
No ISP - Before Dimmed
Normal intensity No ISP - After
Posted speed limit
Polic
e on
Rig
ht S
houl
der
Some upstream speed reduction due to police presence (1 to 2 mph). No
difference between dimmed and normal intensity lights.

54
Figure 7.8 Percentage of vehicles in the right lane—dimmed and normal-intensity lights.
7.4.1.2 Driver Survey
As part of the light intensity field testing, ARA assembled six participants to test drive the study area while the research team monitored their driving behavior from inside the vehicle. Afterward, the participants answered questions about their perceptions and driving actions. The group included three females and three males distributed in the following age categories: < 24 years (2), 25 to 34 years (1), 35 to 44 years (1), and 55 to 64 years (2). Their nighttime driving experiences ranged from one new driver to very experienced.
To prevent biasing participants’ behavior, ARA did not inform the participants of specific details of the test site or purpose of the study. We informed them only that we were interested in studying their nighttime driving habits on a rural interstate. Each participant drove the test site individually using the same vehicle and with a research team member in the vehicle to provide driving directions and to video-record and take notes. Three of the participants drove the test site with the lights in the dimmed setting and three drove the test site with the lights set to their normal intensity. The researcher recorded driver speeds upstream of the test site and while passing the ISP vehicle, as well as their upstream and downstream lane change locations, relative to the police car on the shoulder. Overall, drivers reduced their speeds 4 to 7 mph when passing the police car, relative to their upstream speeds.
The test drive included a 4-mi drive on a rural interstate at night under light traffic conditions. The road geometry was primarily straight with one set of reverse curves prior to the test scene, which included the ISP vehicle with warning lights (displaying either the dimmed or the normal intensities) behind a white passenger vehicle with its headlights on. The driver of the passenger vehicle and the ISP trooper stood on foot near the police car’s rear bumper.
19%
61%
72%
5%7%
35%
75%
0%
54%
34%
67%
72%
13%
0%
20%
40%
60%
80%
100%
0 960 1,560 1,840 2,520 2,920 3,280Upstream distance, ft
Perc
ent o
f veh
icle
sDimmed
Normal intensity
Polic
e on
Rig
ht S
houl
der
Fewer vehicles approached in the right lane for the normal
intensity lights.
With No Police = 81%

55
Upon completion of the driving test, the participants took a survey containing the following questions:
· Please think back to the stretch of interstate you just drove between the interchanges. What do you remember?
· Think about the police car and what was going on at this location. Please describe in as much detail as possible everything you remember.
· Regarding the police car, please rate the following factors on a scale of 1 to 10 (1 = very low, 10 = very high):
o Warning light intensity o Discomfort glare from the lights o Anxiety (and if you experienced any, what caused this?)
Regarding the first question, in addition to the police vehicle, signs and other vehicles were the most frequently recalled items. When asked to be specific about the area around the police car itself, all six participants mentioned the white passenger car, and five out of six drivers mentioned the police lights. Only one driver mentioned seeing the police officer and driver standing behind the police vehicle, and two participants stated specifically that they had not seen the trooper outside of his car. The failure to identify the pedestrians (state trooper and passenger car driver) outside of the vehicle is a reason for concern because it is a potential safety hazard to officers and motorists outside of their vehicles at night. Failure to notice the pedestrians may be caused by the driver’s fixation on the roof-mounted warning lights, avoidance of looking directly at the lights because of the glare, or inability to detect less visible details because the high-intensity warning lights dominated the visual scene—and therefore the driver’s attention.
Figure 7.9 summarizes the results for the intensity, glare, and anxiety ratings. Both sets of participants (dimmed and normal-intensity settings) rated the lights as high intensity, with average scores of 9.0 and 8.3 for the dimmed and normal-intensity lights, respectively. The glare and anxiety factors received moderate scores, with the normal-intensity lights receiving higher ratings in both cases than the dimmed lights. The individual user ratings showed a positive correlation between glare discomfort and anxiety, meaning that as perceived glare increased so did driver anxiety.

56
Figure 7.9 Lane change distances for the car on shoulder and car+police.
When asked to specify what caused their anxiety, two drivers mentioned the police
lights themselves, stating “lights too bright and distracting” and “bright lights.” Two drivers indicated that the police presence caused them to question or alter their driving behavior, which led to anxiety. One driver expressed concern for the officer’s safety, and one participant reported no anxiety.
While the small sample size was not great enough to make the driver survey results statistically significant, they did provide anecdotal evidence that drivers perceived both light settings to be high intensity and causing moderate levels of discomfort glare and anxiety.
9.0
6.0
5.0
8.3
7.06.7
0
2
4
6
8
10
Intensity Glare AnxietyCriteria
Rat
ing
DimmedNormal intensity
Users rated intensity high for both scenarios.
Users rated the normal setting higher glare and anxiety.
57
CHAPTER 8 FINDINGS AND CONCLUSIONS
8.1 FINDINGS This research revealed several important findings regarding driver cognition,
comprehension, and behavior while driving in and around mobile nighttime highway operations.
8.1.1 Observational Field Studies · An observational study of a mobile closure of the right lane on a rural interstate
showed that drivers decreased their speed by 9.3 mph at the first traffic control truck and reduced speed another 8.0 mph by the time they reached the lead truck (i.e., 2000 ft downstream). The addition of a state police vehicle with lights in front of the lead truck caused drivers to reduce speeds by another 3.3 mph. With no mobile lane closure operation present, drivers reduced their speed 8.8 mph for the ISP vehicle on the right shoulder.
· A mobile lane closure of the left lane of a six-lane (three lanes per direction) urban expressway showed that traffic speeds decreased by 8.8 mph at the lead truck compared with the same location with no closure. With the left lane closed, there was a vehicle overshift to the right lane, meaning that traffic in the right lane increased by more than the amount resulting from the left lane closure. The overshift may have been caused by drivers’ preference to distance themselves from the mobile operation or that they interpreted the traffic control devices as telling them to change lanes as far right as possible. Thirty-five percent of the vehicles that passed the mobile operation in the center lane (i.e., adjacent to the closed lane) shifted to the right lane side, and 63%drove down the lane center. Only 2%of the vehicles drove on the left side of the lane.
· Two test sites on an urban expressway with a disabled vehicle incident response on the right shoulder showed drivers reduced their speed by 2 to 3 mph when passing the vehicles on the shoulder. Traffic changed lanes away from the shoulder incident; however, the change was dependent on traffic volumes and the ability of drivers to merge into the adjacent traffic lane. Right-lane traffic adjacent to the shoulder incident decreased from 21.7% to 8.8% and 0.6% at sites with medium and low traffic, respectively. Eighty-seven percent of the vehicles that remained in the right lane shifted to the left side of the lane, while 13% drove down the lane center. No vehicles shifted to the right side of the lane when passing the vehicles on the shoulder.
8.1.2 Oasis Driver Surveys · Motorists who had recently passed by the I-90 mobile lane closure and incident
responses cited lights, cognitive operations or interpretations of the scenario (e.g., “had to get over a lane”), and the traffic control vehicles as the distinguishing characteristics of the operation. To a lesser degree, they recalled people and other visual cues (e.g., signs and the dancing diamond).
· The mobile lane closure operation was highly visible and identifiable to drivers. Eighty-eight percent of the drivers correctly identified the operation as roadway maintenance. On the other hand, the incident response was less noticeable and identifiable. Fifty percent of the drivers did not recall passing the shoulder operation prior to entering the oasis, and out of the 50% who noticed, only half

58
correctly identified it as an incident response (the remaining identified it as roadway maintenance or utility work).
· The mobile lane closure elicited mainly schematic responses, that is, they responded in ways consistent with common mental frameworks drivers’ possess. Drivers reported actions we might expect them to report, such as “slow down” and “change lanes.” Most frequently, drivers’ responses for the incident response operation were specific to the situation. Examples include, “get out of near lane to give them space” and “merged over one lane and went back over once car passed.” Drivers gave mainly external reasons for taking actions, such as “lights” and “signs” for both situations and, to a lesser degree, internal reasons such as “wanted to be safe” and “knew construction workers and they complained about people getting too close.”
8.1.3 Focus Groups · A series of focus groups conducted with drivers of various ages and driving
experience in both rural and urban areas produced meaningful insight into the perceptions drivers have and actions they take when passing mobile nighttime highway operations.
· Participants ranked workers and vehicles as the work zone–related factors that have the most influence on their driving behavior, followed by traffic control devices, including lights, drums or cones, and signs.
· The presence of workers caused participants the most concern in nighttime work zones, followed by not having enough space, close guardrails, and driving in an unfamiliar area.
· When asked specifically about three items—information, reflective materials, and lighting—participants in both rural and urban groups indicated that the level of information provided at work zones was too little and that the amount of reflective materials was just enough. Rural drivers felt that the amount of lighting was too little, while urban drivers, who typically drive on roads with overhead lighting, felt that the amount of lighting was just enough.
· When shown a picture of a nighttime mobile lane closure on an urban expressway, participants from all groups provided schema-consistent responses about the actions and order of actions they would take, indicating that their first action would be to slow down, followed by slowing down and changing lanes, and third, preparing to stop.
· With respect to the picture depicting the nighttime mobile work zone, participants expressed a moderate degree of certainty about their behavior when approaching the site. The reasons for uncertainty generally related to comprehension of the visual cues and what actions to take. Participants felt that the use of more signs, including specific information about what was taking place and what they needed to do, could reduce drivers’ uncertainty (note: the picture did not depict the advance warning vehicle, which typically displays this information on a changeable message system).
· Responses to specific nighttime mobile operation video:
o Traffic Control Truck with Strobes On and Off. Participants stated that the flashing arrow provided the guidance to change lanes and that the flashing rate and intensity of warning lights influenced their perception of

59
the seriousness of the situation. While the strobe lights increased the attention-getting aspect of the trucks, most groups were either neutral on the use of the strobe lights or preferred no strobes. The reasons for preferring the truck with strobes off were related to making it a less-visually cluttered scene that allowed them to see the arrows better, and causing less distraction and discomfort. Suggestions for improvement included synchronizing the flashing of the strobe lights with the arrow or turning the strobe lights off.
o Mobile Lane Closure of a Single Left Lane. All groups interpreted the scenario as a work activity and found the flashing lights intense but attention-getting. Participants across all groups were unsure about how they should respond to the activity. They suggested alternating the flashing arrows and other flashing lights so that they do not flash at the same time on each truck and synchronizing the arrow flashing between trucks to create a domino effect (i.e., sequential flashing) to improve driver understanding and responses.
o Incident Response on Shoulder. The dancing diamond light panel dominated the conversation regarding the incident response operation. All groups had difficulty interpreting the large, dynamic diamond, and additional lights and strobes did not assist with interpretation of the situation. Nevertheless, the majority agreed that confusion over the diamonds would not alter their actions and that most of them would slow down and change lanes. Participants believed that this was a case where text, such as “Caution” would be better at conveying the message than an unfamiliar symbol.
o HELP Truck. All focus groups commented that the HELP truck’s strobe and caution lights were overwhelming. They had difficulty deciding which of the truck’s lighting systems (e.g., arrow board, changeable message system, and strobes) they should pay attention to and follow. Specifically, they mentioned that the multiple lights and flash rates were distracting. Suggestions to improve included reducing the number of lights, synchronizing flash rates, and making some of the displays (such as the arrow or text message) constant, while other lights flashed.
o State Police Standard and Directional Light Bars. Participants perceived the red and blue flashing lights as highly visible and strongly identified with police vehicles. The main concern drivers have regarding police light is intensity. Participants commented that the roof-mounted lights can be too intense at close distances, causing glare discomfort and possibly momentary loss of vision, especially in rainy conditions. Several people responded that the rear window-mounted directional light bar was effective in encouraging drivers to move over. Participants suggested reducing the intensity of the roof-mounted lights or devising a shield to reduce glare at close distances and incorporating the directional light bar as either a stand-alone device or program the roof-mounted light bar in directional mode for situations where it would be appropriate.

60
8.1.4 Experimental Field Studies · ARA performed experimental studies of mobile lane closures and an ISP police
vehicle to evaluate possible improvements suggested by the focus groups. They included:
o Mobile lane closure—flashing arrow boards only (no strobes) o ISP—directional light bar motion o ISP—dimmed light intensity
· We were not able to test two other suggestions for mobile lane closures because of limitations of the current technology. These limitations included being unable to synchronize the strobe lights and the flashing arrow on individual traffic control trucks or to produce sequential flashing of arrow panels between trucks in the convoy.
· The performance measures for the mobile lane closure experiment of a left-lane closure of three traffic lanes showed 6% more vehicles changed out of the center lane upstream of the work zone for the case of flashing arrows only (with no strobes) compared with the base case of flashing arrows and strobes. This finding may indicate that drivers were able to perceive, interpret, and react to the flashing arrows sooner with the flashing arrows and no strobes. There was no difference in traffic speeds for the base and experimental cases. In each case, the average traffic speeds in the lane adjacent to the lane closure were approximately 5 mph lower than when there was no lane closure.
· A small sample driver survey of six participants who viewed videotapes of the two scenarios rated the ability of the mobile operations to convey the messages of caution/alert and change lanes/move right as high. Drivers indicated that the setups were only moderately effective at conveying the message to slow down. When asked to recall from memory what they remembered of the work zones, the flashing arrows were the predominant theme. Participants answered with slightly more detail for the no-strobes case, and when asked for their preference between cases, five of six participants stated a preference for the no-strobes case, for reasons such as it was “easier to see” and it was “cleaner.”
· Performance measures for the ISP experiment between the base case of a randomly flashing red and blue light bar and the same light bar flashing in a right to left directional mode on the right shoulder of a four-lane interstate showed 6% more vehicles changed lanes upstream for the directional case versus the randomly flashing lights. There was no difference in traffic speeds for the base and experimental cases. In each case, the average approach traffic speeds in the lane adjacent to the police vehicle on the shoulder were approximately 2 to 3 mph lower than when no police car was present.
· Researchers observed that at large upstream distances (i.e., >2,000 ft) at night, the ISP vehicle’s blue lights came into view much sooner than the red lights, and the directional motion of the light bar was not detectable until approximately 600 ft upstream of the police vehicle. The lights in directional mode were more visible at a greater distance upstream than the case of randomly flashing lights because of the greater number of individual LED light banks lit at the same time and the longer-duration “on” time for the directional mode.
· Performance measures for the ISP experiment between the randomly flashing red and blue light bar set to normal and dimmed intensities showed 3% more

61
vehicles changed lanes upstream for the normal intensity case versus the dimmed light intensity. There was no difference in traffic speeds for the base and experimental cases. In each case, the average approach traffic speeds in the lane adjacent to the police vehicle on the shoulder were approximately 1 to 2 mph lower than when no police car was present.
· A small sample of six participants who drove this test section at night rated both the normal and dimmed lights as very high intensity. They rated both discomfort glare and their level of anxiety as moderate for both cases, with slightly higher ratings for normal intensity lights compared with the dimmed setting. There was a positive correlation between discomfort glare and anxiety, meaning that as glare increased so did the driver’s rating of anxiety.
· Of particular concern was the inability of drivers to detect the police officer and vehicle driver standing near the rear of the police car. Five of six participants failed to see the pedestrians during a survey taken shortly after driving the test section. This failure to see the pedestrians may have been because the visual scene was dominated by the intense police lights at night or because drivers focused away from the police vehicle to avoid discomfort glare from its lights.
· While the survey sample size was too small to make the results statistically significant, drivers did provide anecdotal evidence that they perceived both light settings to be high intensity and causing moderate levels of discomfort glare and anxiety.
8.2 CONCLUSIONS Nighttime driving involving mobile highway operations, such as mobile lane closures,
incident responses, and police activities is cognitively demanding and involves several mental processes, including attention, perception, and memory. Upstream of the activities, drivers are alerted to the coming event and what actions they need to take, such as slowing down and preparing to change lanes. Approaching the activities, drivers need to take action to change lanes, if they have not done so already; and adjacent to the operations, drivers are continuously processing visual cues (for example, traffic control devices, roadway features, other vehicles, and workers and equipment) to make decisions about speed control, spacing between vehicles, lane use, and lateral lane position. With a large amount of information presented in a very short time period and the need to make quick decisions, drivers do not attend to every cue. Instead, their cognitive processes reduce a large amount of information to the few most critical items that determine behavior.
The role of vehicle-mounted warning lights is essential in warning motorists of the presence of mobile operations in and along the roadway, but the interaction of warning lights and drivers is complex and depends on many factors, including drivers, roadway features, and light characteristics, such as color, intensity, flash rate, flash pattern, and number of lights. In addition, warning light technology is rapidly changing, and multiple lighting technologies are currently in service on highway agency, police, and emergency response vehicles.
ARA performed this study to better understand the interaction between current warning light technologies and drivers from a cognitive perspective—specifically, to determine how well drivers perceive, comprehend, and react to vehicle-mounted warning lights at night, how effective current light configurations are at conveying warning and guidance information, and what can be done to improve current practices.
Based on the results of this research, we conclude:

62
· Warning lights can contribute highly to the identifiability of specific agencies and activities. For example, drivers in our studies strongly associated amber flashing lights and flashing arrow panels with highway maintenance activities, and red and blue lights with police vehicles. Incident response operations on the shoulder were less identifiable, and many drivers either didn’t notice the activity or incorrectly identified the operation.
· Drivers offered schema-consistent responses for their likely actions when encountering highway operations at night. In other words, when shown a variety of nighttime mobile operations, they responded that their actions would be to slow down, change lanes, and prepare to stop. Field observations showed that, in many cases, drivers do display appropriate behavior (e.g., reduce speed, change lanes, and shift laterally within in the lane to distance themselves from lane closures and vehicles on the shoulder); however, driver behavior is variable, and there is room for improvement, especially in terms of speed reduction and upstream lane change distances.
· Drivers view current nighttime vehicle-mounted warning lights as highly visible and effective at getting their attention. They interpret flashing lights as conveying the message of alert/caution and faster flash rates and intensities as conveying a higher sense of urgency.
· The highly visible lights, which have very high intensities or flash rates, can cause uncomfortable glare and undesirable driver emotions. This is especially of concern at close driving distances, for older drivers, inexperienced drivers, or persons who are not comfortable driving at night. Lights that are too intense or attention-getting can be distracting, annoying, and anxiety-inducing, all of which are undesirable driver characteristics from a safety point of view. For example, field testing revealed that in the presence of high-intensity police lights, five of six drivers did not detect pedestrians standing near the vehicle.
· Another concern of drivers is the confounding of lights, arrow panels, and message boards on either an individual vehicle or between multiple vehicles in an operation. For example, current highway maintenance trucks typically use a roof-mounted strobe beacon or light bar, bed-mounted strobe lights near the taillights, and possibly an arrow board, changeable message sign, or retroreflective static sign, in addition to their vehicle operating lights (e.g., taillights, brake lights, marker lights, and headlights) at night. Multiple light sets can confuse drivers, causing them to take them longer to process cognitively and interpret the information than simpler configurations do. Of particular concern is the interference of bed-, roof-, and side-mounted strobe lights with the appearance of flashing arrow panels, which by themselves are highly visible and effective at providing guidance to drivers.
· Suggestions for improvement from the focus groups centered primarily on three concepts—synchronizing or reducing the number of lights on individual vehicles; incorporating directional motion into light bars and/or synchronizing flashing arrows between multiple trucks in a convoy to produce a sequential motion effect; and reducing the intensity of individual lights.
· We were not able to test the concepts of synchronizing lights on individual vehicles (e.g., timing strobe “on” periods with the “off” period of a flashing arrow

63
board) or sequential flashing of multiple arrow boards in a convoy owing to the limitations of current technologies.
· Field experiments of mobile lane closures with flashing arrows and no strobe lights showed only slightly improved results over the base case in terms of upstream lane changes, but driver surveys showed a strong preference for the experimental case of flashing arrows with no strobe lights, a finding primarily attributed to a “cleaner” visual scene and the ability of drivers to more readily perceive and interpret the arrows.
· Field testing of a state police vehicle light bar with both random (base case) and directional (experimental case) flash patterns showed a slight improvement in upstream lane changes with the directional flash mode; however, researchers believe the improvement was related to its increased upstream visibility because of the number of simultaneously lit LEDs and the longer “on” time of the LED banks. The directional motion effect was not visible until a very short distance from the police car, at a point where the majority of traffic had already changed lanes. In other words, drivers sense and react to the high-intensity police lights much sooner than they can perceive the directional light bar motion.
· Field testing of the ISP light bar set to normal and dimmed settings showed no significant decrease in driver perception of light intensity for the dim setting, while reducing perceived discomfort glare and anxiety.
· An interesting finding is that drivers in the test sample did not report seeing the pedestrians standing near the police car. Focus group participants reported concern for workers and other people in work zones, indicating their behavior might have been influenced if they had seen the pedestrians.
· The lights and configurations for many scenarios seemed to evoke discomfort glare and anxiety in participants, although the lights and configurations seemingly did not influence behavior or perception of scenario effectiveness. This situation is worth further investigation, using larger sample sizes, to determine participants’ preference for one configuration over another.
· The concepts of synchronized lighting on individual vehicles and sequential flashing of multiple arrow boards in a convoy as improvements to current practice have strong driver support and are worthy of further investigation.

64
REFERENCES
Bader, J., 2012. “Risk Reduction in Emergency Response.” Site visit and seminar handouts. University Park, IL: Federal Signal Corporation.
Bryden, J.E., 2003. Traffic Control Handbook for Mobile Operations at Night. Washington, DC: FHWA.
Federal Highway Administration (FHWA), 2009. Manual on Uniform Traffic Control Devices. Washington, DC: FHWA.
Flannagan, M.J., Blower, D.F., and Devonshire, J.M., 2008. Effects of Warning Lamp Color and Intensity on Driver Vision. Ann Arbor, MI: University of Michigan Transportation Research Institute.
Gibbons, R.B., Lee, S.E., Williams, B., and Miller, C.C., 2008. Selection and Application of Warning Lights on Roadway Operations Equipment. NCHRP Report 624. Washington, DC: Transportation Research Board.
Hanscom, F.R., and Pain, R.F., 1990. Service Vehicle Lighting and Traffic Control Systems for Short-Term and Moving Operations. NCHRP Report 337. Washington, DC: Transportation Research Board.
Illinois Department of Transportation (IDOT), 2010. Work Site Protection Manual: For Operations Activities and Emergency Callouts. Issue #9. Springfield: IDOT.
Illinois Department of Transportation (IDOT), 2012. Standard Specifications for Road and Bridge Construction. Adopted January 1, 2012. Springfield: IDOT.
Illinois Department of Transportation (IDOT), 2013. Highway Standards—Revision 214. Effective January 1, 2013. Springfield: IDOT.
Illinois Tollway, 2010. Roadway Traffic Control and Communications Guidelines. Revised March, 2013. Downers Grove: ISTHA.
Schrock, S.D., See, C.F., and Mulinazzi, T.E., 2008. Public Opinion and Understanding of Advance Warning Arrow Displays Used in Short-Term, Mobile, and Moving Work Zones. Technical Report 45110-1. Lawrence, KS: University of Kansas.
Steele, D.A., and Vavrik, W.R., 2009. Improving the Safety of Moving Lane Closures. ICT Research Report ICT-09-049. Rantoul, IL: Illinois Center for Transportation.
Wolfe, J.M., 2000. Visual attention. In K.K. De Valois (Ed.), Seeing. 2nd ed. (pp. 335–386). San Diego: Academic Press.
Ullman, G., Ragsdale, J., and Chaudhary, N., 1998. Highway Construction, Maintenance, and Service Equipment Warning Lights and Pavement Data Collection System Safety. Report No. TX-99/3972-1. College Station, TX: Texas Transportation Institute (TTI).

A-1
APPENDIX A COGNITIVE PROCESSES LITERATURE REVIEW General theories of memory and cognition can help explain why drivers have difficulty
seeing and interpreting warning signals at night. In this section of the literature review, we focus on three areas of cognition: attention, perception, and memory. Areas of cognition such as attention and perception occur automatically and without awareness. These processes contribute to higher-order cognition, which requires deliberate focus, such as decision making, problem solving, reasoning, and some elements of memory.
Attention is the lowest level of cognition. Before we pass information into our memory, and even before we perceive objects and process information about these objects in our environment, we need to attend to the objects. Some research suggests that perception can occur without attention (Kimchi and Peterson 2008); however, processing natural scenes requires attention (Cohen, Alvarez, and Nakayama 2011; Silva, Groeger, and Bradshaw 2006; Treisman and Gelade 1980), as does detecting changes in the environment (Rensink, O’Regan, and Clark 1997).
Perceiving a scene and detecting changes are both critical to understanding how drivers interpret items in a roadway. Perception occurs after attention and is the process by which we make sense of the objects in our environment. We must attend to information, process and interpret it, before we can make decisions and take actions. By understanding basic theories of visual perception, attention, and memory, we can better identify the factors that influence drivers and the decisions they may make.
We address the following questions during this literature review:
· What is attention? o How does attention help us understand what drivers see when driving? o What environmental features (for example, lights, color) capture attention and
influence driver behavior? o How do drivers’ goals or intentions influence where they guide attention (as
opposed to instances where drivers attend to objects and then form goals), and why do drivers’ goals, memories, and intentions influence attention?
· What is perception? o What role does central and peripheral vision play in driving at night? o How does perception impact the risk work crews face from drivers at night?
· What is memory? o How does memory influence and interact with attention and perception? o How does the interaction between memory and these lower-order processes
affect driving behavior? o How does cognitive load influence driver performance?
A.1 ATTENTION Attention is sustained mental focus on an object, item, or activity. Attentional
mechanisms protect us from too much incoming information from the environment. Information from multiple sensory inputs (e.g., sight and smell) helps to focus attention (Ho and Spence 2009), but only if the sensory inputs are coordinated and meaningful. Because not all inputs are coordinated or meaningful to a given task, we cannot consciously attend to all information (sensory) that is ongoing in our environment. We passively take in information, but we devote attention to the information that is most relevant to our current behavior. Wolfe (2000) described attention as the gatekeeper that allows relevant information in and keeps irrelevant information out. Given these constraints, drivers will not be able to “see” (attend and subsequently perceive) all information available in their visual field.

A-2
A.1.1 What Visual Features of Objects Capture Drivers’ Attention? Visual attention allows us to perceive and recognize objects in our environment. As
such, it is generally a precursor to perceptual processes (Wolfe 2000). Basic features of stimuli help select whether we attend to them. For example, color is one feature of objects that directs and prioritizes attention (see, for example, Cave and Pashler 1995). Toet et al. (1998) found that objects must be sufficiently different from their surroundings to capture attention. Objects may be conspicuous because of color, luminosity, distance, or location of information in our visual field.
When an object is a different color from its surroundings, it stand outs and causes people to devote attention to it. Although color might be a feature conspicuous enough to capture attention in some instances, research suggests that a color different from the objects currently grabbing a driver’s attention (for example, a white truck among a set of orange cones) may not necessarily capture attention. It may, in fact, harm a driver’s ability to detect the unexpected object and delay a driver’s reaction to the intrusion.
Some evidence suggests that the ability to quickly detect a stimulus that is a different color from its surroundings may impede a driver’s ability to act accordingly. Most and Astur (2007) studied how well drivers could detect and avoid an unexpected object—in that case a motorcyclist, in a driving simulation. They studied whether drivers’ reaction time and collision rates were different if the motorcycle was the same or a different color as an arrow they were told to attend to and follow. When the arrow and motorcycle were the same color, participants had a collision 7% of the time, whereas when the arrow and motorcycle were mismatched, participants had a 36% collision rate. Participants also took longer to brake in the mismatched condition. This finding is a practical concern for drivers because we all have immediate intentions (for example, looking for a landmark or sign) that can influence our ability to attend to otherwise behaviorally relevant stimuli.
Changes in luminance, or the appearance of brightness, automatically attract attention, regardless of the observer’s goals and intentions (Franconeri, Hollingsworth, and Simons 2005). This information should capture attention immediately because the visual system is so sensitive to changes in luminance.
Distance matters to the extent that the object is inconspicuous. If an object is prominent, it can easily capture attention from far away. However, if the object is relatively inconspicuous, it does not capture attention until one is approaching it closely. Objects capture attention differentially, depending on whether they are in our central or peripheral vision. Information in our peripheral vision grabs our attention more readily than information in our central vision (Posner 1980; Vercera and Rizzo 2003). This phenomenon declines in older drivers because they suffer from reduced peripheral skills (Mestre 2002). As a result, older drivers may be less able to rapidly attend to objects in their peripheral field, reducing their ability to quickly respond to changing elements in a night work zone.
Objects in our central visual field require deliberate attention and, as a result, often require the driver to attend to the objects based on goals, expectations and intentions (Vercera and Rizzo 2003). Our ability to capture attention is meaningless if the visual inputs (or other sensory inputs) are arbitrary. If the objects that capture attention while driving (such as signs or signals) are arbitrary, then drivers have difficulty perceiving and interpreting their meaning (Holmes 1971; Ho and Spence 2009). For example, the sound of a car horn carries meaning (such as watch out, get over, get out of my way!), whereas white noise or pure tones carry little meaning because we generally do not interact with these kinds of sounds regularly (Graham 1999). The same goes for signs: we regularly understand a stop sign, even without the words, because we have attributed meaning to it on a daily basis. However, if the sign is unclear or has little meaning, such as blinking amber lights (without an arrow or some indication the driver needs to take action and move over), drivers may get the sense they should respond to the sign

A-3
but be unable to interpret a clear meaning from it. This confusion will influence the ability to select the appropriate action to take in response to the object.
A.2 PERCEPTION Perception is our ability to receive information from our senses and interpret it. In this
review, we are largely concerned with visual perception, although the other information we take in from our senses can influence and help to guide visual perception (Ho, Santangelo, and Spence 2009). To receive information and interpret it, we rely on different parts of the eyes to relay information to our brains. Because the focus of this research is on nighttime roadwork, we are primarily interested in understanding vision and visual perception at night.
Our retinas have two general types of photoreceptors: cones and rods. These photoreceptors are able to convert light into signals used by the brain to convey information about the images we see and ultimately help form a visual representation of our world. While someone is driving, peripheral vision is largely responsible for monitoring other vehicles, looking for road signs, and maintaining one’s own position in a lane (Mourant and Rockwell 1970). The cones, which are most dense in the center of the retina, are largely active during the day because they are sensitive to high levels of light. At night, the rods are more active because they are sensitive to low levels of light. This means that peripheral vision is more acute at night because rods largely contribute to vision at night. As we switch from day vision to night vision, our visual acuity drops for a number of reasons as this adaptation happens. First, during the adaptation process, our eyes take about 20 to 30 min to adapt properly to night. Although cones adapt quickly, in about 10 min, rods take upwards of 30 min to adapt fully (Lamb and Pugh 2006). Second, because rods are not as good as cones at detecting small details, our visual acuity at night is about two-thirds that of normal daylight acuity (Mestre 2002).
A.2.1 Why Are Work Crews at Risk from Drivers During Night Work? We rely on external visual cues to help us judge speed. Common items like signs, trees,
lights, road edges, and overpasses help us judge how fast other drivers are going and how quickly we may come upon an object on the roadway (Kemeny and Paneri 2003). Such visual cues also help us with simple driving behaviors, such as maneuvering the steering wheel (Karimi and Mann 2008; Wallis et al. 2007). Nighttime or poor driving conditions reduce the visibility of cues, making it more difficult to judge speed and distance. Additionally, drivers have difficulty estimating speed under reduced luminance conditions. Snowden, Stimpton, and Ruddle (1998) found that we tend to overestimate distance to objects when driving at night or in poor conditions. However, they also found that we tend to underestimate our speed, despite the fact that we tend to drive faster as a way to compensate for this misperception (see also, Gegenfurtner, Mayser, and Sharpe 1999).
The lack of cues at night (or in other poor conditions, such as fog and reduced visibility) impedes our ability to judge others’ speed (for example, road crews driving along the roadside/in or out of lanes); thus, we tend to increase our own speed. Driving faster than the recommended speed limit narrows our useable visual field, reducing the likelihood that we will detect work crews or construction vehicles moving in and out of roadways (Mestre 2002). One moderator of this effect is driving in urban areas. Speed estimation is generally preserved in urban areas where other cues are present in peripheral vision (Kemeny and Paneri 2003).
Likewise, too much information or clutter on a roadway can also impede our ability to rapidly search for relevant information when driving. In a test of driving performance in a simulator, Ho et al. (2001) investigated how visual clutter, or the nonrelevant information in a visual scene, affected the reaction times and number of errors made by participants. Ho et al. presented participants with photographs of visual scenes they would likely encounter while driving and asked them to search for a specific traffic sign shown briefly before presentation of the scene. Half of the scenes included the target sign and half did not. Participants could identify

A-4
that the target sign was either present or absent. The researchers found that participants made more errors in high-clutter scenes, especially older adults and at night on target-present trials. Older adults had slower reaction times in high-clutter conditions in night scenes and were especially slow when the target sign was absent. This suggests that a high-clutter environment could be particularly troublesome for older drivers.
Much like attention, top-down processes can influence perception. What we expect to see on a roadway influences our perception of objects as we drive. For example, we may expect to see signs, lights, and objects related to construction. These items are consistent with our schema, or our typical mental representation, of what a roadway looks like. Viewing and perceiving information that is consistent with our schema is easy—because we need little effort to identify this information, we process it faster. Our expectations focus our attention and perception. For example, on a familiar highway, we expect to see the exit sign to our house on the right side of the road. Such signs are easier to perceive and subsequently to act upon because we expect them to be there.
However, unexpected objects, or schema-inconsistent objects, can be present on roadways. For instance, while driving in New Mexico, one of the authors came across a sticklike ball floating across the highway. As an East Coast native, she was unsure how to respond to the object moving toward her. She slowed until she realized this object was a tumbleweed and drove through it gingerly. She had no schema of what to do in this situation because tumbleweeds were inconsistent with her schema of driving.
New construction sites and configurations of emergency response vehicles can be schema-inconsistent for some drivers. By understanding what drivers expect, we can create situations that drivers perceive easily and, thus, are safer for both drivers and night workers.
A.3 MEMORY Memory is the process by which we encode, store, and retrieve information. The multi-
store model of memory (Atkinson and Shiffrin 1968) proposes that memory is made up of multiple stores, each of varying degrees of capacity, permanence, and automaticity. For example, our sensory memory is incredibly brief, automatic, and somewhat larger in capacity (9 to 12 items) but requires attention to pass information to working, or short-term, memory. This store is also brief, somewhat smaller (7 plus or minus 2 items) and requires conscious processing to pass information to our long-term memory store.
Similar to the relationship between attention and perception—that we cannot attend to all information that we sense—we also cannot perceive all information that we attend to, and we cannot remember all information that we perceive. Think of our cognitive systems as a funnel, where only the most relevant information passes through the attention and perception filters. Once information gets to memory, our working, or short-term, memory serves as another filter before information is permanently stored in long-term memory.
Working memory, the short-term memory store, largely does not interfere with attention (Jonides 1981). However, it can interfere with perception. Kang et al. (2011) tested undergraduate students to determine whether the information held in visual working memory actually changed their perception of later images. The researchers showed students a set of dots moving in a certain direction and told them to remember the direction the dots were moving. This instruction would ensure that participants held those images in working memory. They then viewed a second display of moving dots and after 2 sec made a judgment about the direction of the second set (a perceptual judgment). Results demonstrated that holding the first motion display in working memory biased their judgments of the second display.
These results demonstrate how working memory can actually bias perception of reality. Images we call to mind while driving are strong enough to affect how we perceive objects in the driving environment, leading to the likelihood that we may miss critical visual cues while driving, if those critical cues were missing from our memory. Despite our best attempts to capture

A-5
attention and enhance perception, drivers who are thinking about past events or trying to remember information could misperceive the current reality.
A.3.1 Memory Can Actually Interact in Ways That Inhibit Perception Stokes et al. (2012) found that previous experiences stored in long-term memory
influence perception and attention and that it takes little effort to retrieve previous experiences. Previous experiences guide where we devote our attention and perception. For example, we know from information stored in long-term memory that red, blue, and white lights flashing on a vehicle in our rearview mirror means that an emergency vehicle (police or fire) is approaching. When those lights capture our attention and we perceive them, we automatically know what to do (that is, “sirens and lights, move to the right!”). Knowledge stored in our memories, which comprise our schemas and expectations of what those cues mean, prompts this response. Thus, long-term memory guides our attention to capture the lights, helps our perceptual processes to interpret and identify the lights as an emergency vehicle, and allows us take an action based upon that.
A.3.2 How Does Cognitive Load Influence Driver Performance? Our level of cognitive load affects our memory and attentional processes. Although our
long-term memory stores are unlimited, the processes through which information enters our long-term stores are not. The filtering mechanisms of attention and working memory mean that we have a limited number of tasks we can do at one time. For example, if we are trying to maintain our driving and speed, send text messages, and remember that a sign a mile back indicated construction ahead, one of these tasks would likely suffer.
Studies of divided attention show that attending to multiple tasks at once (for example, texting and driving) results in a dramatic increase in accidents (Strayer and Johnston 2001). Lee, Lee, and Boyle (2007) found that the effects of cognitive load and short glances away from the road are additive, such that they have a tendency to increase the likelihood that drivers miss critical events while driving.
Task difficulty itself can induce cognitive load. For example, driving in poor weather conditions could induce cognitive load. It changes a well-practiced, automated task to one that requires conscious and deliberate focus.

A-6
APPENDIX REFERENCES
Atkinson, R.C., and Shiffrin, R.M., 1968. Human memory: A proposed system and its control processes. In K.W. Spence, and J.T. Spence (Eds.), The Psychology of Learning and Motivation (pp. 89–195). New York: Academic Press.
Cave, K., and Pashler, H., 1995. Repetition blindness: Perception or memory failure? Journal of Experimental Psychology: Human Perception and Performance, 21, 275–292.
Cohen, M.A., Alvarez, G.A., and Nakayama, K., 2011. Natural-scene perception requires attention. Psychological Science, 22, 1165–1172.
Franconeri, S.L., Hollingsworth, A., and Simons, D.J., 2005. Do new objects capture attention? Psychological Science, 16, 275–281.
Gegenfurtner, K.R., Mayser, H., and Sharpe, L.T., 1999. Seeing movement in the dark. Nature, 398, 475–476.
Graham, R., 1999. Use of auditory icons as emergency warnings: Evaluation within a vehicle collision avoidance application. Ergonomics, 42, 1233–1248.
Ho, C., and Spence, C., 2009. Using peripersonal warning signals to orient a driver’s gaze. Human Factors, 51, 539–556.
Ho, C., Santangelo, V., and Spence, C., 2009. Multisensory warning signals: When spatial correspondence matters. Experimental Brain Research, 195, 261–272.
Ho, G., Scialfa, C.T., Caird, J.K., and Graw, T., 2001. Visual search for traffic signs: The effects of clutter, luminance, and aging. Human Factors, 43, 194–207.
Holmes, J.G., 1971. The Language of Flashing Lights. In J.G. Holmes (Chairman), The Perception and Application of Flashing Lights. London: Adam Hilger Ltd.
Jonides, J., 1981. Voluntary vs. Automatic control over the mind's eye's movement. In J.B. Long and A.D. Baddeley (Eds.), Attention and Performance IX. Hillsdale, NJ: Lawrence Erlbaum Associates, 1981.
Kang, M.S., Hong, S.W., Blake, R., and Woodman, G.F., 2011. Visual working memory contaminates perception. Psychonomic Bulletin & Review, 18, 860–869.
Karimi, D., and Mann, D.D., 2008. Role of visual cues from the environment in driving an agricultural vehicle. The Ergonomics Open Journal, 1, 54–61.
Kemeny, A., and Paneri, F., 2003. Evaluating perception in driving simulation experiments. Trends in Cognitive Science, 7, 31–37.
Kimchi, R., and Peterson, M.A., 2008. Figure–ground segmentation can occur without attention. Psychological Science, 19, 660–668.
Lamb, T.D., and Pugh, E.N., 2006. Phototransduction, dark adaptation, and rhodopsin regeneration. Investigative Ophthalmology and Visual Science, 47, 5138–5152.
Lee, Y.C., Lee, J.D., and Boyle L.N., 2007. Visual attention in driving: The effects of cognitive load and visual disruption. Human Factors, 49, 721–733.
Mestre, D.R., 2002. Visual factors in driving. In R. Fuller and J. Santos (Eds.), Human Factors for Highway Engineers (pp. 99–114). New York: Elsevier Science Ltd.

A-7
Most, S.B., and Astur, R.S., 2007. Feature-based attentional set as a cause of traffic accidents. Visual Cognition, 15, 125–132.
Mourant, R.R., and Rockwell, T.H., 1970. Mapping eye-movement pattern to the visual scene in driving: An exploratory study. Human Factors, 12, 81–87.
Posner, M.I., 1980. Orienting of attention. Journal of Experimental Psychology, 32, 2–25.
Rensink, R.A., O’Regan, J.K., and Clark, J.J., 1997. To see or not to see: The need for attention to perceive changes in scenes. Psychological Science, 8, 368–373.
Silva, M.M., Groeger, J.A., and Bradshaw, M.F., 2006. Attention-memory interactions in scene perception. Spatial Vision, 19, 9–19.
Snowden, R.J., Stimpton, N., and Ruddle, R.A., 1998. Speed perception fogs up as visibility drops. Nature, 392, 450.
Stokes, M.G., Atherton, K., Patai, E.Z., and Nobre, A.C., 2012. Long-term memory prepares neural activity for perception. Proceedings of the National Academy of Sciences of the United States of America, 109, E360-E367.
Strayer, D.L., and Johnston, W.A., 2001. Driven to distraction: Dual-task studies of simulated driving and conversing on a cellular telephone. Psychological Science, 12, 462–466.
Toet, A., Kooi, F.L., Bijl, P., and Valeton, J.M., 1998. Visual conspicuity determines human target acquisition performance. Optical Engineering, 37, 1969–1975.
Treisman, A., and Gelade, G., 1980. A feature integration theory of attention. Cognitive Psychology, 12, 97–136.
Vercera, S.P., and Rizzo, M., 2003. Spatial attention: Normal processes and their breakdown. Neurologic Clinics of North America, 21, 575–607.
Wallis, G., Chatziastros, A., Tresilian, J., and Tomasevic, N., 2007. The role of visual and nonvisual feedback in a vehicle steering task. Journal of Experimental Psychology: Human Perception and Performance, 33, 1127–1144.
Wolfe, J.M., 2000. Visual attention. In K.K. De Valois (Ed.), Seeing. 2nd ed. (pp. 335–386). San Diego: Academic Press.