improving the meat quality of blesbok (damaliscus dorcas ... · iii abstract this research had a...
TRANSCRIPT

IMPROVING THE MEAT QUALITY OF BLESBOK (DAMALISCUS DORCAS
PHILLIPSI) AND SPRINGBOK (ANTIDORCAS MARSUPIALIS) THROUGH
ENHANCEMENT WITH INORGANIC SALTS
By
PETRO-MARÈ DU BUISSON
Thesis presented in partial fulfilment of the requirements for the degree of
MASTERS OF SCIENCE IN ANIMAL SCIENCES (Meat Science)
at the University of Stellenbosch
Study Supervisor: Prof. L.C. Hoffman
April 2006
Stellenbosch

ii
Declaration
I, the undersigned, hereby declare that the work contained in this thesis is my own original
work and that I have not previously, in its entirety or in part, submitted it at any university for a
degree.
Signature:…………………………….
Date:…………………………………..

iii
Abstract
This research had a dual purpose, firstly to study five muscles (M. biceps femoris, M.
longissimus et lumborum, M. rectus femoris, M. semitendinosus and M. supraspinatus) of the
blesbok (Damaliscus dorcas phillipsi) and springbok (Antidorcas marsupialis) in terms of the
physical and chemical meat quality characteristics, and secondly, to investigate the effects of
inorganic salt enhancement on the physical, chemical and sensory meat quality
characteristics.
The muscles differed significantly for the investigated characteristics, with the exception of a*
value, chroma, and ash percentage, which did not differ in either blesbok or springbok.
Furthermore, no muscle differences were found in fat percentage in blesbok or protein
percentage in springbok meat. Muscle differences were found in the stearic acid (C18:0)
composition, the percentage saturated fatty acids (SF) and the polyunsaturated: saturated
fatty acid ratio (P:S) of the blesbok. Only linoleic acid (C18:2) as a percentage of the total
fatty acids differed significantly amongst the springbok muscles.
The shear force values were found to be significantly lower in the enhanced samples
(blesbok: 25.16 vs. 43.75 N/1.27cm; and springbok: 23.96 vs. 34.89 N/1.27cm), which means
that the enhanced muscles were more tender.
The enhanced muscles of both species were found to have lower values for all investigated
colour characteristics. Moisture values were found to be higher in all the enhanced muscles
(blesbok: 76.53% vs. 74.38%; and springbok: 75.34% vs. 73.37%). The lower fat and protein
contents of the enhanced muscles can possibly be ascribed to a diluent effect caused by the
water added as part of the inorganic salt injection (blesbok: fat, 1.86% vs. 2.22%, protein,
19.61% vs. 21.67%; and springbok: fat, 1.84% vs. 2.14%, protein, 21.23% vs. 23.26%).
Major changes in the mineral contents were expected between the two treatments and in both
species the enhanced muscles had higher phosphorus, potassium, sodium and copper
values, but lower magnesium, iron and zinc levels than the untreated muscles.
Analytical sensory analyses were performed on the M. biceps femoris and M. longissimus et
lumborum samples of both species. Tenderness and juiciness were significantly higher in the
enhanced muscles. Although salty taste was significantly higher in the enhanced muscles
due to the addition of the inorganic salt solution, it remained acceptable.
Analytical and consumer sensory analyses were performed on blesbok and springbok M.
longissimus et lumborum samples prepared in a stock mixture. The outcome of the analytical
sensory analysis was similar to the analytical results reported above. The consumer sensory

Abstract
iv
analysis showed that consumers preferred the enhanced blesbok and springbok muscles,
with a significant improvement in consumers’ likeness of enhanced vs. untreated meat.
This study provides important insights into the muscle differences of two of the most common
game species currently utilised in South African meat production. It confirms that both
species can be marketed as a low fat organic red meat source well capable of filling the
modern consumer’s nutritional and health needs. It also shows that enhancing game meat
with an inorganic salt solution might be a very useful processing tool to use to further game
meat acceptability in terms of tenderness and juiciness as game meat is often experienced as
being dry and less tender because of its lower fat content and the use of incorrect preparation
techniques.

v
Opsomming
Hierdie navorsing het ‘n tweeledige doel, eerstens om die vyf spiere (M. biceps femoris, M.
longissimus et lumborum, M. rectus femoris, M. semitendinosus en M. supraspinatus) van
die blesbok (Damaliscus dorcas phillipsi) en die springbok (Antidorcas marsupialis) in terme
van die fisiese en chemiese eienskappe van vleiskwaliteit te bestudeer, en tweedens, om die
effek van ‘n anorganiese sout oplossing op die fisiese, chemiese en sensories
kwaliteitseienskappe te ondersoek.
Die spiere het betekenisvol verskil vir die meeste van die kwaliteitseienskappe, met die
uitsondering van die a* waarde, chroma en as-persentasie, waarvoor daar geen verskille by
die blesbok of die springbok was nie. Verder is daar ook geen spierverskille in die vet
persentasie in blesbok of in die persentasie proteïene in springbokvleis gevind nie. Spier
verskille is gevind in die steariensuur (C18:0) samestelling, die persentasie versadigde
vetsure (SF) en die poli-onversadigde: versadigde vetsuur ratio (P:S) van die blesbok. Slegs
linoleïensuur (C18:2) as persentasie van die totale vetsure het betekenisvol verskil tussen die
springbok spiere.
Die skeurkrag waardes was betekenisvol laer in die behandelde monsters (blesbok: 25.16 vs.
43.75 N/1.27cm; en springbok: 23.96 vs. 34.89 N/1.27cm), wat beteken dat die behandelde
spiere sagter was.
Die behandelde spiere van beide spesies het laer waardes getoon vir alle kleur eienskappe
wat ondersoek is. Vog waardes was hoër in al die behandelde spiere (blesbok: 76.53% vs.
74.38%; en springbok: 75.34% vs. 73.37%). Die laer vet en proteïen inhoud in die
behandelde spiere kan waarskynlik verklaar word deur die verdunningseffek wat veroorsaak
is deur die water wat bygevoeg is as deel van die anorganiese sout-inspuiting (blesbok: vet,
1.86% vs. 2.22%, proteïen, 19.61% vs. 21.67%; en springbok: vet, 1.84% vs. 2.14%,
proteïen, 21.23% vs. 23.26%). Groot veranderinge is verwag in die mineraal inhoud van die
twee behandelinge en in beide spesies het die behandelde spiere hoër fosfor, kalium, natrium
en koper waardes en laer magnesium, yster en sink waardes as die onbehandelde spiere
getoon.
Analitiese sensoriese analises is op die M. biceps femoris en M. longissimus et lumborum
monsters van beide spesies uitgevoer. Sagtheid en sappigheid was betekenisvol hoër in die
behandelde spiere. Alhoewel souterige smaak betekenisvol hoër was in die behandelde
spiere as gevolg van die byvoeging van die anorganiese sout oplossing, was dit steeds
aanvaarbaar.

Opsomming
vi
Analitiese en verbruiker sensoriese analises is uitgevoer op blesbok en springbok M.
longissimus et lumborum monsters wat in ‘n aftreksel voorberei is. Die uitkoms van die
analitiese sensoriese analise was soortgelyk aan die bogenoemde gerapporteerde analitiese
resultate. Die verbruikers sensoriese analise het getoon dat verbruikers die behandelde
blesbok en springbok spiere verkies, met ‘n betekenisvolle verbetering in die hoeveelheid
waarvan verbruikers van die behandelde, eerder as die onbehandelde vleis, gehou het.
Hierdie studie lewer belangrike insigte in die spierverskille van twee van die mees algemene
wild species wat op die oomblik in Suid-Afrikaanse vleisproduksie benut word. Dit bevestig
dat beide blesbok and springbok bemark kan word as ‘n bron van lae vet, organiese rooivleis
wat uiters geskik is om aan die moderne verbruiker se voedings- en gesondheidsbehoeftes te
voldoen. Dit wys ook dat die behandeling van wildsvleis met ‘n anorganiese sout oplossing
moontlik ’n baie bruikbare prosesseringsmetode is om die aanvaarbaarheid van wildsvleis in
terme van sagtheid en sappigheid te verbeter, aangesien wildsvleis dikwels as droog en
minder sag ondervind word as gevolg van die laer vet inhoud en foutiewe
voorbereidingstegnieke.

vii
Acknowledgements
I wish to sincerely express my appreciation to the following people and institutions:
Prof. L.C. Hoffman, for his invaluable knowledge and guidance throughout this project.
Freddy Hirsch, for providing technical assistance and the inorganic salt solution.
The Department of Tourism, Environmental and Economic affairs (Free State Province) for
the procurement of animals.
The Department of Animal Sciences, for technical, as well as statistical assistance.
The Department of Consumer Sciences, for providing the sensory laboratory and consumer
sensory locales and for their assistance in the execution of the sensory tests.
Family and friends, for their support and encouragement throughout this project.

viii
Notes
The language and style used in this thesis are in accordance with the requirements of the
scientific journal, Meat Science. This thesis represents a compilation of manuscripts where
each chapter is an individual entity and therefore, some repetition between chapters may
occur.
Results from this study have been presented at the following congress:
du Buisson, P. & Hoffman, L.C. (2004). Tender Springbok – we did it! The 2nd Joint
Congress of the Grassland Society of Southern African and South African Society of
Animal Science. Goudini Spa (28 June – 1 July).
du Buisson, P. & Hoffman, L.C. (2004). Improving the eating quality of Blesbok meat by
injecting an inorganic salt mixture. The 2nd Joint Congress of the Grassland Society of
Southern African and South African Society of Animal Science. Goudini Spa (28 June –
1July).

ix
Table of contents
Chapter Page
1. Introduction……………………………………………………………. 1
2. Literature review……………………………………………….……... 8
1. Game meat image………………………………………….…….. 8
2. Game meat as a ‘healthier’ red meat…………………………… 10
3. Game species……………………………………………………... 15
4. Species differences in meat composition………………………. 16
5. Muscle differences………………………………………………... 18
6. Physical properties of meat……………………………………… 22
7. Chemical properties of meat…………………………………….. 37
8. Sensory quality……………………………………………………. 45
9. Consumers………………………………………………………… 53
10. Enhancement of meat…………………………………………... 61
11. Conclusion and objectives……………………………………… 73
12. References……………………………………………………….. 74 3. The effect of enhancement on the physical characteristics of five
muscles of the blesbok (Damaliscus dorcas phillipsi) and
springbok (Antidorcas marsupialis)………………………………… 88
4. The effect of enhancement on the chemical characteristics of
five muscles of the springbok (Antidorcas marsupialis) and
blesbok (Damaliscus dorcas phillipsi)……………………………… 106
5. Analytical sensory evaluation of two springbok (Antidorcas
marsupialis) and blesbok (Damaliscus dorcas phillipsi) muscles
after injection with an inorganic salt mixture………………………. 130
6. Effect of enhancement with an inorganic salt solution on the
eating quality of blesbok (Damaliscus dorcas phillipsi) and
springbok (Antidorcas marsupialis) longissimus et lumborum
muscle as shown by analytical and consumer sensory
evaluation……………………………………………………………… 142
7. Conclusion…………………………………………………………….. 155

Introduction
1
Chapter 1
Introduction
Over the last few decades people’s impression of meat has changed dramatically – from
traditionally being seen as an overall healthy nutritious food, it has become negatively
associated with health risks. Red meat in particular has been associated with a high fat and
cholesterol content (Schönfeldt, 1993; Higgs, 2000).
As people became more health conscious (especially since the 1980’s), consumers started
demanding knowledge of the nutritional composition of everything that passed their lips. Fat,
particularly animal fat, as well as high cholesterol-foods (again linked to meat) had to be
reduced or avoided where possible. Consumers have become much more informed about
food components that could be harmful (e.g. saturated fatty acids) and those components that
are beneficial (e.g. polyunsaturated fatty acids and anti-oxidants) to their health.
Reports such as those by the Committee on Medical Aspects of Food and Nutrition (COMA,
1984) and the World Cancer Research Fund (WCRF, as reported by Higgs, 2000) only broke
down red meat’s image as a healthy nutrient-rich food source further. The COMA report of
1984, which dealt with coronary heart disease, pointed out that meat is a major source of
saturated fatty acids and since then a lot of the controversy surrounding the fat content of
meat has (incorrectly) dealt with its saturated fat content. Higgs (2000) reported that it is
generally assumed that all the fat in meat is saturated, but since the meat industry has been
succeeding in producing meat with a lower fat content, the fatty acid composition of meat has
gradually shifted and the percentage saturated fat is now lower than in the past. Pork and
beef contains less than 50% saturated fat, while lamb and poultry contains 51% and 30%
saturated fat respectively.
During 1997 and 1998 meat’s association with cancer was blown out of proportion by the
WCRF (as cited by Higgs, 2000) and COMA (1984) reports, which both dealt with diet and
cancer and were published at the same time. The WCRF (as cited by Higgs, 2000) report
was extremely negative towards meat and recommended that no more than 80g of red meat
should be consumed per day. This recommendation could not be scientifically substantiated
and a similar recommendation by COMA (1984) was revised.
A demand for low kilojoule-, low cholesterol products, has been created by growing health
concerns. People are more than ever concerned about cardiovascular disease and high
cholesterol. According to Elliot (1993) decreasing the intake of saturated fatty acids leads to
lower blood serum cholesterol levels, which in turn diminish the risk of developing
cardiovascular disease.

Introduction
2
The demand for “healthier” food has created the perfect marketing niche for game meat.
Game meat has a much lower fat content than red meat from domesticated species and can
therefore be seen as being the “healthier” red meat option. Kritzinger (2002) noted that
because game meat can be an attractive alternative to health conscious red meat consumers,
a wonderful opportunity has arisen to aggressively market game meat and cause it to
advance in the industry. Hudson (1999) observed that the ideal niche for game meat
utilization was created by consumer demand for lean muscle with less fat and suggested that
game meat should be promoted on the basis of its low fat content and natural image. Along
the same lines, Stevenson, Seman and Littlejohn (1992) came to the conclusion that game
meat should be promoted as a top-quality gourmet food item specifically because of its
nutritional profile and that it should be targeted at health conscious consumers.
Since South African consumers consider fat content the most important quality when they buy
meat, this is clearly the best way to market and promote game meat since it has a lower fat
content than lamb, beef or pork (Hoffman, Muller, Schutte and Crafford, 2004). Elliot (1993)
also showed that venison had less fat than roast skin-on chicken and was only moderately
fatter than skinless roast chicken. Hoffman, Muller, Schutte, Calitz and Crafford (2005) found
that 52.6% of 300 South African respondents would buy game meat more often if they had
more information on the health benefits and cooking methods of game meat.
In 1984 Swatland reported that consumers were looking for alternative sources of red meat.
Even though the meat industry was one of the oldest and most important industries in the
world, people were concerned about the risks associated with, in particular, beef
consumption. During the last few decades consumers yet again had to deal with safety and
quality concerns surrounding meat and meat products with several outbreaks of foot-and-
mouth disease as well as Bovine Spongiform Encephalopathy (BSE) scares (Swatland, 1984;
MacRae, O’Reilly and Morgan, 2005). Another big concern to consumers is the use of
hormones and other growth promoters, especially in feedlots.
Pauw (1993), as well as Hoffman and Bigalke (1999), noted that game meat could be seen as
an organic product. The animals are not in intensive farming systems and are usually left to
forage in the veld without any additional feeding. They are free of chemical fertilisers and
growth hormones. This links well with the increasing concern about the environment and
animal welfare that Steenkamp (1997) found expressed by consumers. He found that
consumers had more interest in free-range and organic products, as well as natural
production methods, because of this concern.
The gross income of the South African game industry was calculated to be around R843
million in 2000 (Eloff, 2002). However, prices of live sales of game animals are decreasing
and game farmers need to look into alternative utilisation of game (Berry, 1986; Hearne,

Introduction
3
Lamberson and Goodman, 1996). One of the possible alternatives is the production of game
meat, which can be quite lucrative since there is a trend towards natural food utilisation
worldwide. Berry (1986) found venison production to be the most profitable of the four most
common ways of wild animal utilisation (which were trophy hunting, non-trophy recreational
hunting, live animal sales and venison production) when an index was developed based on
the numbers of animals involved. In 1982 Conroy and Gaigher reported that game meat
could fetch high prices as it is considered a luxury product. Talbot, Payne, Ledger, Verdcourt
and Talbot (1965) found that wildlife management and utilisation as a natural resource in
Africa were becoming increasingly important because of their value to the tourist industry, but
that their meat production potential only received marginal consideration.
A major advantage that wild animals have over domesticated meat animals is their ability to
survive in relatively dry areas without being fed and watered. Several authors have
commented on wild game animals’ adaptation and ability to survive in harsh environments
(Talbot et al., 1965; Fairall, 1985; Onyango, Izumimoto and Kutima, 1998; Barnett, 2000).
According to Hearne et al. (1996) many cattle farmers are changing over to game farming
which could lead to more meat utilisation since farmers have to focus on the optimum
sustained use of these animal resources. More meat production can lead to more export
opportunities, but in order for that to happen, the exact nutritional composition of the meat
from the different game species must be known. Hoffman (2000) has stated that meat
produced from wild ungulates must be put to the same criteria as that applied to meat from
domestic species. These criteria include yield, physical and chemical properties and sensory
characteristics.
It has been confirmed by numerous authors that game meat contains less fat than any other
red meat type (Talbot et al., 1965; Von la Chevallerie, 1972; Elliot, 1993; Schönfeldt, 1993;
Hoffman, 2000) and was found by Von la Chevallerie (1972) to be below 2.5%, while
Schönfeldt (1993) and Hoffman (2000) both reported game meat fat levels of between 2 and
3%. Hoffman (2000) also reported game meat to be lower in saturated fatty acids and higher
in polyunsaturated fatty acids than beef. This supports the findings of Schönfeldt (1993). An
intermediate moisture content was found for game meat by both Von la Chevallerie (1972), at
75.5%, and Elliot (1993), at 56.8%. Onyango et al. (1998) found that moisture, ash and
protein values of beef and game meat were similar to that of other red meat. Van Zyl and
Ferreira (2004) reported the protein value of game meat to be between 22 and 24%, which is
much higher than that of domesticated meat species (Sayed, Frans and Schönfeldt, 1999).
The physical properties of game meat were found to be very similar to that of domesticated
meat species. Hoffman and Bigalke (1999) reported that carcass yields of wild ungulates are
usually in the range of 56 to 66% of the live weight and this was also found by several other
authors (Talbot et al., 1965; Van Zyl, Von la Chevallerie and Skinner, 1969; Conroy and

Introduction
4
Gaigher, 1982). These dressing percentages of wild ungulate species are only slightly higher
than the 50 to 55% reported for sheep (Pauw, 1993) and is similar to those found for cattle
(Van Zyl et al., 1969).
There has been little sensory research on game meat and there is almost nothing to be found
in the literature on the sensory aspects of game meat. Forss, Manley, Platt and Moore (1979)
reported that all venison types that they were examining tended to be dry and Jansen van
Rensburg (1997) also reported that springbok meat was found to be rather dry. Hoffman
(2001) confirmed that South African game meat is often seen as dry and suggested that it
could be because the meat is derived from stressed animals. Several authors commented on
the use of the right cropping and slaughtering procedures to ensure that animals experience
the least amount of stress and that the highest quality meat can be produced (MacDougal,
Shaw, Nute and Rhodes, 1979; Conroy and Gaigher, 1982; Elliot, 1993; Smit, 2004).
According to Conroy and Gaigher (1982) springbok, eland, blesbok, impala and kudu are the
most common game species farmed with in South Africa. Jansen van Rensburg (1997) found
that springbok was ranked as the favourite species to farm with by South African game
farmers. Presently, springbok is the most extensively cropped game species in South Africa
(Jansen van Rensburg, 1997; Hoffman, 2000). Hoffman et al. (2005) found that most
respondents to their questionnaires have eaten springbok and kudu before and these two
species, along with gemsbok, were found to be regularly available in supermarkets,
butcheries and restaurants.
Game meat image has suffered because of several misconceptions of which the idea that
game meat is less tender and juicy, is probably the most harmful. These particular
misconceptions have resulted from ignorance, as improper handling and preparation can
negatively influence the eating quality of game meat (Webb, 2001). Informing consumers
about proper preparation methods is one way of dealing with it, but another less conventional
way of dealing with the problem of tenderness and juiciness may be to enhance the meat with
an inorganic salt solution. Several authors have commented on the effect certain inorganic
salts have on meat tenderness (Wheeler, Koohmaraie and Shackelford, 1997; Dhanda,
Taylor and Murray, 2003; Lawrence, Dikeman, Hunt, Kastner and Johnson, 2003; Robbins,
Jensen, Ryan, Homco-Ryan, McKeith and Brewer, 2003) and juiciness (Smith, Simmons,
McKeith, Betchel and Brady, 1984; Robbins et al., 2003).
With increased tenderness, game meat will acquire an even more positive image as the better
red meat alternative. In 1963 Mitchell reported that consumers considered tenderness to be
the most important eating quality characteristic in meat acceptance. This is still true today:
Bickerstaffe, Bekhit, Robertson, Roberts and Geesink (2001) reported that tenderness was
identified as the most important meat quality characteristic considered by consumers and at

Introduction
5
supermarkets, meat tenderness is the deciding factor determining whether or not consumers
become repeat buyers of a certain meat product.
References Barnett, R. (2000). Food for thought: the utilization of wild meat in eastern and southern
Africa. TRAFFIC east/southern Africa, Nairobi, Kenya.
Berry, M.P.S. (1986). A comparison of different wildlife production enterprises in the northern
Cape Province, SA. South African Journal of Wildlife Research 16, 124-128.
Bickerstaffe, R., Bekhit, A.E.D., Robertson, L.J., Roberts, N. & Geesink, G.H. (2001). Impact
of introducing specifications on the tenderness of retail meat. Meat Science 59, 303-315.
Committee on Medical Aspects of Food Policy (1984). ‘Diet and Cardiovascular Disease.’
Report on Health and social subjects, Department of Health and Social Security, No. 28,
HMSO, London.
Conroy, A.M. & Gaigher, I.G. (1982). Venison, Aquaculture and ostrich meat production:
Action 2003. South African Journal of Animal Science 2, 219-233.
Dhanda, J.S., Taylor, D.G. & Murray, P.J. (2003). Part 2. Carcass composition and fatty
acid profiles of adipose tissue of male goats: effects of genotype and live weight at
slaughter. Small Ruminant Research 50, 67-74.
Elliot, J. (1993). Farmed Venison, the new meat comes of age. Nutrition and Food Science
4, 26-29.
Eloff, T. (2002). The economic realities of the game meat industry in South Africa. In: H.
Ebedes, B. Reilly, W. van Hoven, and B. Penzhorn (Eds.) Sustainable utilisation –
Conservation in practice. Pp. 78-86.
Fairall, N. (1985). Manipulation of age and sex ratios to optimise production from impala
(Aepyceros melampus) populations. SA Journal of Wildlife Research 15, 85-88.
Forss, D.A., Manley, T.R., Platt, M.P. & Moore, V.J. (1979). Palatability of venison from
farmed and feral red deer. Journal of the Science of Food and Agriculture 30, 932-935.
Hearne, J., Lamberson, R. & Goodman, P. (1996). Optimising the off take of large
herbivores from a multi-species community. Ecological Modelling 92, 225-233.
Higgs, J.D. (2000). The changing nature of red meat: 20 years of improving nutritional
quality. Trends in Food Science and Technology 11, 85-95.
Hoffman, L.C. (2001). The effect of different culling methodologies on the physical meat
quality attributes of various game species. In: H. Ebedes, B. Reilly, W. van Hoven, & B.
Penzhorn, (Eds.) Sustainable utilisation - conservation in practice.
Hoffman, L.C. (2000). The yield and carcass chemical composition of impala (Aepyceros
melampus), a southern African antelope species. Journal of the Science of Food and
Agriculture 80, 752-756.
Hoffman, L.C. & Bigalke, R.C. (1999). Utilizing wild ungulates from southern Africa for meat
production: Potential research requirements for the new millennium. Congress of the
Wildlife Management Association of SA (pp. 1-14). George, South Africa.

Introduction
6
Hoffman, L.C., Muller, M., Schutte, De W., Calitz, F.J. & Crafford, K. (2005). Consumer
expectations, perceptions and purchasing of South African game meat. South African
Journal of Wildlife Research 35, 33-42.
Hoffman, L.C., Muller, M., Schutte, De W. & Crafford, K. (2004). Retail of South African game
meat: current trade and marketing trends. South African Journal of Wildlife Research 34,
123-134.
Hudson, R.J. (1999). Wildlife production: trends and issues. New Zealand diversified
livestock. URL http://www.deer.rr.ualberta.ca/library/wcapkora/WCAPfinal.html
Jansen van Rensburg, D.M. (1997). The physical, chemical and sensory quality
characteristics of Springbok (Antidorcas marsupialis marsupialis) meat. D. Tech. (Food
and Nutrition). Department of Food and Nutrition. Technikon Pretoria, Pretoria.
Kritzinger, B. (2002). Meat quality parameters of the Impala (Aepyceros melampus). M.Sc.
Agric (Animal Science) thesis. Department of Animal Science. University of Stellenbosch,
Stellenbosch.
Lawrence, T.E., Dikeman, M.E., Hunt, M.C., Kastner, C.L. & Johnson, D.E. (2003). Effects of
calcium salts on beef longissimus quality. Meat Science 64, 299-308.
MacDougall, D.B., Shaw, B.G., Nute, G.R. & Rhodes, D.N. (1979). Effect of pre-slaughter
handling on the quality and microbiology of venison from farmed young red deer. Journal
of the Science of Food and Agriculture 30, 1160-1167.
MacRae, J., O’Reilly, L. & Morgan, P. (2005). Desirable characteristics of animal products
from a human health perspective. Livestock Production Science, 94, 95-103.
Mitchell, J.D. (1963). Problems relating to uniform meat tenderness in a commercial
operation. In: Proceedings meat tenderness symposium (pp. 243-253). Campbell Soup
Company, Camden.
Onyango, C.A., Izumimoto, M. & Kutima, P.M. (1998). Comparison of some physical and
chemical properties of selected game meats. Meat Science 49, 117-125.
Pauw, J. (1993). The development of venison marketing. In: Forum: The venison industry.
Research requirements and possibilities (pp. 3-5). Meat industry centre, Irene
Agricultural research Council, Pretoria, South Africa.
Robbins, K., Jensen, J., Ryan, K.J., Homco-Ryan, C., McKeith, F.K. & Brewer, M.S. (2003).
Consumer attitudes towards beef and acceptability of enhanced beef. Meat Science 65,
721-729. Sayed, N., Frans, Y. & Schönfeldt, H.C. (1999). Composition of South African foods.
Medical Research Council. Parow.
Schönfeldt, H. (1993). Nutritional content of venison. In: Forum: The venison industry.
Research requirements and possibilities (pp. 51-60). Meat industry centre, Irene
Agricultural research Council, Pretoria, South Africa.
Smit, K. (2004). Meat quality characteristics of blesbok (Damaliscus dorcas phillipsi) and red
hartebeest (Alcelaphus buselaphus caama) meat. M. Consumer Sc. (Food) thesis.
Department of Consumer Science. University of Stellenbosch, Stellenbosch.

Introduction
7
Smith, L.A., Simmons, S.L., McKeith, F.K., Betchel, P.J. and Brady, P.L. (1984). Effects of
sodium tripolyphosphate on physical and sensory properties of beef and pork roasts.
Journal of Food Science 49, 1636-1637.
Steenkamp, J. E. M. (1997). Dynamics in consumer behaviour with respect to agricultural
and food products. In: B. Wierenga, A. van Tilburg, K. Grunert, J.E.M. Steenkamp, & M.
Wedel (Eds.). Agricultural marketing and consumer behaviour in a changing world (pp.
143-188). Boston: Kluwer academic publishers.
Stevenson, J.M., Seman, D.L. & Littlejohn, R.P. (1992). Seasonal variation in venison quality
of mature, farmed red deer stags in New Zealand. Journal of Animal Science 70, 1389-
1396.
Swatland, H.J. (1984). Structure and development of meat animals. Ontario Agricultural
College, University of Guelph, Englewood Cliffs, NY: Prentice Hall.
Talbot, L.M., Payne, W.J.A., Ledger, H.P., Verdcourt, L.D. & Talbot, M.H. (1965). The meat
production potential of wild animals in Africa. A review of biological knowledge.
Technical Communication No. 16. Commonwealth Agricultural Bureaux, Farnham.
Van Zyl, L. & Ferreira, A.V. (2004). Physical and chemical carcass composition of springbok
(Antidorcas marsupialis), blesbok (Damaliscus dorcas phillipsi) and impala (Aepyceros
melampus). Small Ruminant Research 53, 103-109.
Van Zyl, J.H.M., Von la Chevallerie, M. & Skinner, J.D. (1969). A note on the dressing
percentage in the springbok (Antidorcas marsupialis) and impala (Aepyceros melampus).
Proceedings of the South African Society for Animal Production 8, 199-200.
Von la Chevallerie, M. (1972). Meat quality of seven wild ungulate species. South African
Journal of Animal Science 2, 101-103.
Webb, R. (2001). It’s all in the game. Diabetes Forecast 54, 30-33.
Wheeler, T.L., Koohmaraie, M. & Shackelford, S.D. (1997). Effect of post-mortem injection
time and postinjection ageing time on the calcium-activated tenderisation process in beef.
Journal of Animal Science 75, 2652-2660.

8
Chapter 2
Literature review
1. Game meat image
Unfortunately the image of game meat has suffered greatly because of ignorance. While
consumers are left ill-informed about other aspects such as sensory qualities and preparation
methods, the cause of game meat is not helped at all (Webb, 2001; Hoffman, Muller, Schutte
and Crafford 2004; Bronkhorst, 2005). This ignorance on the handling and preparation of
game has mainly caused game meat to have a fairly negative connotation regarding eating
quality. Because consumers are unsure of how to prepare game meat, they often end up with
“tough, dry and chewy meat” according to Webb (2001), since that is what game meat is
reduced to by incorrect preparation and cooking techniques. Of all the participants of their
survey, Hoffman, Crafford, Muller and Schutte (2003) stated that European tourists visiting
South Africa had the most knowledge about the health benefits and sensory properties of
game meat.
While working on nyala (Tragelaphus angasii), Jansen van Rensburg (2001) listed three
factors that contribute to consumers’ dislike in venison: improper preparation and cooking
procedures can result in tough and dry meat and generally results in a bad eating experience;
incorrect handling and care during harvesting can, among other things, result in a strong
“gamey” flavour, which is not preferred by most consumers; and most consumers are
apprehensive about trying new or unfamiliar things, especially food products, and game meat
is not quite as common as beef, pork or chicken and therefore some consumers may harbour
a preconceived dislike of game meat without ever trying it. Something that closely relates to
this last point is the emotional connotation many consumers have with game meat (or any
meat, for that matter). McCarthy, de Boer, O’Reilly and Cotter (2003) reported that consumer
concern with animal welfare and environmental issues were found to be responsible for a
reduction in the consumption of red meat in Ireland and the rest of Europe. Participating
consumers associated conventional farming practices with environmental damage, as well as
maltreatment of animals. This confirmed the findings of Issanchou (1996) that consumers
would lower their meat consumption, or even entirely stop eating meat, when their concerns
about animal welfare are not placated by perceived improvement in animal treatment and
meat production systems.
In a survey on game meat (Hoffman et al., 2003), tourists to South Africa were asked their
opinions on game meat. All 60 participants had eaten game before and 90% liked the taste of
game meat, while 2% stated that they would eat game in South Africa because it is meat
typical to Africa. Most tourists (87%) stated that they would eat game meat again. Some

Literature review Game meat image
9
respondents (3%) claimed that they would not eat game again, as they were afraid some
wildlife species might become extinct. Warthog (13%), springbok (12%) and kudu (10%)
were the most popular South African game species consumed by most tourists. In the survey
performed on South African consumers (Hoffman et al., 2003), 73% of the meat-eating group
had eaten game meat, and the game species most frequently consumed were springbok and
kudu. This survey found that local consumers thought game meat too expensive and 76% of
consumers were not willing to pay more for game meat than for other meat types.
When tourists were asked to comment on the possible health benefits they thought game
meat held, 80% stated that game meat definitely has health benefits, including being low in fat
(32%), cholesterol (32%) and kilojoules (32%). The fact that game meat was not at all
associated with BSE was also mentioned (Hoffman et al., 2003). When local consumers
were asked to comment on positive and negative attributes of game meat, the top three
positive characteristics were healthfulness (25%), leanness (23%) and taste (14%), while the
top three negative characteristics were price (19%), taste (18%) and lack of availability (12%).
When respondents were questioned on the possible health benefits of game meat, 48%
thought that game meat will benefit health, and low fat (83%) and cholesterol (7%) content
were listed as the top beneficial attributes (Hoffman, Muller, Schutte, Calitz and Crafford,
2005).
Bronkhorst (2005) stated that local (South African) consumers were not acquainted well
enough with the use of game meat as part of their weekly menu. He blamed the ignorance of
consumers with regard to game meat and the fact that there is no controlling or governing
body that controls the game meat industry, therefore, game meat quality is perceived as
being unreliable.
In addition to the health benefits, game meat can be considered an “untainted” meat source
since it contains no added antibiotics, growth hormones or other chemicals regularly used in
conventional farming systems. The following principles were compiled from the work of
Lampkin and Padel (1994) and Madge (1995) as part of the basis of organic agriculture:
farming methods should co-exist with natural systems; there should be minimal damage to
the environment; mineral fertilisers should be avoided; agro-chemical pesticides are
prohibited; and attention should be given to the impact of farming on the environment and the
conservation of wildlife and natural habitats. Free-range game farming, as mostly found
throughout South Africa, can therefore be considered as organic agriculture and thus, game
meat is an organic product (Pauw, 1993; Hoffman and Bigalke, 1999; Webb, 2001; Jansen
van Rensburg, 2001). Nowadays organic food products are in high demand by consumers
and therefore marketing game meat as an organic product may positively influence game
meat consumption.

10
2. Game meat as a ‘healthier’ red meat
Schönfeldt (1993) noted that red meat consumption in South Africa and in other countries has
been steadily declining in favour of white meat and other non-meat protein sources. People
are becoming more concerned about the quality and safety of their food and consumers’
growing health concerns have led them to demand low kilojoule, low cholesterol products
(Dransfield, 2001). Higgs (2000) reported that red meat has gotten a bad reputation health-
wise even though it was traditionally seen as an essential part of a balanced diet. This shift in
consumers’ perception of the role that meat plays in their health has been attributed to the
negative image of meat because of its fat content and composition. Many factors have led to
this negative image of red meat: formal reports such as those from COMA (1984) and the
WCRF (as cited by Higgs, 2000) that incorrectly appointed red meat as the main culprit
leading up to various adverse health conditions; foot-and-mouth-disease outbreaks among
meat animals in various countries; BSE scares; and concerns about hormone-use as growth
stimulators (Swatland, 1984; Higgs, 2000).
2.1. Fat content
According to nutritional guidelines, dietary fat should provide 15-30% of the total calorie-
intake and saturated fats should not exceed 10% of the caloric intake (Chizzolini, Zanardi,
Dorigoni and Ghidini, 1999). Melanson, Gootman, Myrdal, Kline and Rippe (2003) reported
that many people believe red meat (especially beef) to be unsuited for a balanced, weight-
loss diet since red meat is associated with obesity because of its total dietary fat and
saturated fat content. Because obesity has been linked with dietary fat intake, it has long
been suggested that red meat intake be decreased or eliminated from the diet.
Due to all the inconsistent recommendations surrounding red meat consumption in weight-
loss programmes and diets designed to minimise the risk of cardiovascular disease,
Melanson et al. (2003) tested the effects of red meat versus white meat as the protein source
in a hypocaloric diet. A 12-week hypocaloric diet with either lean beef or chicken as primary
protein source was followed and it was found that there was significant weight loss in both
groups, with results between groups being similar. The total body fat percentages as well as
the total and low-density lipoprotein (LDL) cholesterol were significantly reduced within both
lean beef- and chicken consumption groups and there were no differences between groups.
They found that the major fatty acid found in beef, stearic acid, did not have the same
hypercholesterolemic effects that other saturated fatty acids have shown and it has been
postulated that other meat components, such as conjugated linoleic acid (CLA) and arginine
might be beneficial for cardiovascular health. Higgs (2000) also reported that CLA is only
found in useful amounts in meat (particularly from ruminants) and dairy products. Conjugated
linoleic acid is a mixture of geometric and positional isomers of linoleic acid in meat and 76-
93% of it is in the form of cis-9, trans-11-octadienoic acid.

Literature review Game meat as a ‘healthier’ red meat
11
The lipid hypothesis focussed attention on the dietary fat contributed by meat and reports
such as the COMA report on coronary heart disease (COMA, 1984) also pointed at meat as
the main source of saturated fatty acids. Epidemiologically, regular red meat consumption
became linked to increased cardiovascular disease risk, a stigma that still sticks to red meat
(Higgs, 2000; Melanson et al., 2003). Higgs (2000) stated that the reports by the WCRF (as
cited by Higgs, 2000) and COMA (1984) implicated meat in the development of various
cancers, especially colorectal cancer, and many people believe red meat to be associated
with cancer (Melanson et al., 2003). Chizzolini et al. (1999) also reported that there appear to
be relationships between a high fat intake, particularly saturated fat, and an increased risk of
cancers such as colon and breast cancer. However, there is no sufficient scientific evidence
to link meat directly with human cancers (Higgs, 2000).
The average fat content of most game species has been recorded to be less than 3% (Von la
Chevallerie, 1972; Kroon, Van Rensburg and Hofmeyr, 1972; Schönfeldt, 1993; Pauw, 1993;
Hoffman, 2000) and is therefore much lower than meat from domesticated species (Table 1).
Although Van Zyl and Ferreira (2004) reported fat percentages as high as 4.6% for whole
blesbok carcasses, it is still much lower than red meat from domesticated meat animals.
From the values in Table 1 it is clear that both springbok and blesbok contain the lowest
amount of fat (1.7%) from all species evaluated.
Table 1 Nutritional value of seven game species compared to that of domesticated meat
species.
Species Moisture (g/100g)
Protein content of carcass (g/100g)
Fat content of buttocks (g/100g)
Springbok 74.71 23.73 1.71
Eland 75.81 - 2.41
Impala 75.71 22.53 1.41
Blesbok 75.51 23.53 1.71
Gemsbok 75.91 - 1.91
Hartebeest 76.31 - 2.01
Black Wildebeest 77.01 - 2.31
Mutton 60.72 13.92 21.62
Ostrich 76.32 21.12 3.12
Pork 55.02 13.92 17.62
Beef 65.42 19.22 14.22
(1Von la Chevallerie, 1972; 2Sayed, Frans and Schönfeldt 1999; 3Van Zyl and Ferreira, 2004)
As can be seen from the work of McCane and Widdowson (1991, as cited by Elliot, 1993), the
fat content of venison is much lower than that of other red meat and it is even lower than skin-
on roast chicken (Table 2). The fact that skinless roast chicken, commonly assumed to be

Literature review Game meat as a ‘healthier’ red meat
12
the meat with the lowest fat content, contains only 1g/100g less fat than venison shows that
venison can compete with so-called low-fat meat types such as chicken.
Table 2 Nutritional information on cooked meat from several meat species.
Fat (g/100g)
Protein (g/100g)
Energy (kcal)
Water (g/100g)
Venison (haunch roast) 6.4 35.0 198 56.8
Beef (topside roast) 12.0 26.6 214 60.2
Lamb (leg roast) 17.9 26.1 266 55.3
Pork (leg roast) 26.9 19.8 286 51.9
Chicken (roast, skin-on) 14.0 22.6 216 61.9
Chicken (roast, meat only) 5.4 24.8 148 68.4
(From McCane and Widdowson, 1991, as referenced by Elliot, 1993)
When the fat content from venison is compared with that of the game species commonly
found in South Africa (Tables 1 and 2), it is remarkable how much lower South African game
meat (from all game species evaluated) is in fat content. This alone should merit further
investigation into the marketing of South African game meat.
Since it has been shown by several authors (Higgs, 2000; Melanson et al., 2003) that lean
meat has a positive influence on health, game meat could be considered as the healthier red
meat and a definite threat to white meat (specifically chicken) as the overall healthiest meat
available.
2.2. Cholesterol content
Chizzolini et al. (1999) reported that most nutritional guidelines advised that cholesterol-intake
should not exceed 300mg per day. Serum cholesterol has been associated with chronic heart
disease for quite some time, although it has recently been shown that dietary cholesterol had
only little effect on serum and low-density lipoprotein (LDL) cholesterol levels. Higgs (2000)
stated that consumers associate meat with cholesterol, no matter what the scientific evidence
shows, and that cholesterol content is just another black spot on the image of meat.
Cholesterol is an essential constituent of animal cells and therefore dietary cholesterol is
stringently linked with foods of animal origin.
Nelson, Schmidt and Kelley (1995) confirmed that blood LDL cholesterol levels appeared to
be unaffected by the fat calories (either saturated or unsaturated) in the diet. These authors
suggested that the changes in blood cholesterol levels could actually be ascribed to the ratio
of fatty acids in the diet. Chizzolini et al. (1999) reported that cholesterol content differences
between breeds, sexes or feeding regimes are small compared to the differences that have
been noticed between muscle types. Lower cholesterol content was found in predominantly

Literature review Game meat as a ‘healthier’ red meat
13
white muscle (e.g. M. longissimus lumborum in pigs) compared to predominantly red muscle
(e.g. M. semispinalis capitits in pigs). Oxidative muscles contain more phospholipids and the
higher the phospholipid contents of the muscle, the higher its cholesterol content. Muscle
total cholesterol content varied between 61.0 mg/100g and 63.5 mg/100g, while adipose total
cholesterol levels were between 113 mg/100g and 121 mg/100 g (Hoelscher, Savell, Harris,
Cross and Rhee, 1987; Chizzolini et al., 1999). This shows that lean meat intake would have
an almost negligible effect on cholesterol levels and might even positively influence lipid
biochemistry by lowering saturated and increasing polyunsaturated fatty acids because the
polyunsaturated fatty acids are part of the structural components of membranes and their
absolute values cannot change (Chizzolini et al., 1999). Higgs (2000) also found that the
inclusion of beef fat increased blood cholesterol levels, but that lean beef as part of a low fat,
low saturated fat diet reduced plasma cholesterol and LDL-cholesterol levels similarly to equal
amounts of fish and chicken.
Elliot (1993) found venison to have a cholesterol content that was half that of lamb and beef,
in both wet fat and lean tissue.
2.3. Fatty acid composition
As reported, the fatty acid composition of meat, particularly the ratio of polyunsaturated fatty
acids to saturated fatty acids, is more important for health reasons than the total fat content
(Nelson et al., 1995; Chizzolini et al., 1999; Higgs, 2000). Schönfeldt (1993) mentioned that a
dietary decrease of saturated fatty acids, especially myristic and palmitic acids, is associated
with lower blood serum cholesterol, which ultimately leads to a decrease in the risk of
cardiovascular disease. Thus, it is imperative to know the fatty acid composition of meat from
different species so that an informed choice regarding the best protein source can be made.
Several authors (Schönfeldt, 1993; Viljoen, 1999; Hoffman, 2000) have commented on the
high levels of polyunsaturated fatty acids in game meat – higher polyunsaturated fatty acid
levels and lower saturated fat contents than beef – as part of its claim as a ‘healthier’ red
meat (Table 3).
Springbok meat contains a high percentage of arachidonic acid (C20:4) – this poly-
unsaturated fatty acid has the ability to lower serum cholesterol (Viljoen, 1999). Springbok
also has lower palmetoleic acid (C16:1) levels. Palmetoleic acid has cholesterol increasing
properties.
As stated by Elliot (1993): “For those wishing to eat meat, nothing could be better than to
consider the merits of venison.” People used to eating red meat often find it difficult to keep
to a diet of fish and chicken when they are advised to follow a low-fat, low-cholesterol diet.

Literature review Game meat as a ‘healthier’ red meat
14
Table 3 Fatty acid content of several game species compared to some domesticated species.
Fatty acid (%) Springbok Blesbok Black
Wildebeest
Mountain
reedbuck
Red Hartebeest Beef Lamb Pork
Myristic (14:0) - - - - - 2.660 ± 0.5404 3.30 ± 1.074 1.330 ± 2.204
Palmitic (16:0) 13.931 ± 1.201 16.44 ± 3.502 0.693 16.123 18.27 ± 4.252 25.000 ± 1.7704 22.2 ± 1.564 23.200 ± 1.464
Palmetoleic (16:1) 0.067 ± 0.031 02 6.163 0.183 02 4.540 ± 0.8104 2.20 ± 0.264 2.710 ± 0.454
Arachidonic (20:4) 9.304 ± 0.731 10.96 ± 3.402 0.063 7.723 7.01 ± 2.922 0.630 ± 0.2104 0.64 ± 0.234 2.210 ± 0.734
Linoleic (18:2n-6) 21.615 ± 1.331 18.89 ± 4.482 8.853 20.453 14.55 ± 5.942 2.420 ± 0.6304 2.70 ± 0.864 14.200 ± 4.094
α-Linolenic (18:3n-3) 3.371 ± 0.291 3.72 ± 1.282 7.113 4.573 4.06 ± 1.742 0.700 ± 0.1804 1.37 ± 0.484 0.950 ± 0.334
SFA 41.108 ± 2.111 - 42.583 38.473 - - - -
MUFA 20.994 ± 2.101 - 14.283 17.273 - - - -
PUFA 36.342 ± 3.371 - 43.143 44.153 - - - -
P:S 1.141 ± 0.131 1.00 ± 0.392 1.093 0.75 ± 0.462 - - -
n-6:n-3 3.278 ± 0.121 3.62 ± 0.752 2.823 2.75 ± 0.362 - - -
(1 Kroucamp, 2004; 2 Smit, 2004; 3Van Schalkwyk, 2004; 4Enser, Hallett, Hewett, Fursey, Wood and Harrington, 1998)

Literature review Game meat as a ‘healthier’ red meat
15
Elliot (1993) has shown that venison compares favourably with chicken in fat content, has the
highest protein and lowest energy content of all the meats evaluated, has a low cholesterol
count that is about half the value of the cholesterol content found in beef and lamb, and has a
very high polyunsaturated fatty acid to saturated fatty acid ratio.
The health benefits of game meat remain largely unknown to most consumers. Of the total
group of respondents polled by Hoffman et al. (2005) 47.7% thought that game meat might
have health benefits and 83.2% of these consumers thought game meat to be low in fat, while
7% thought it had a low cholesterol content. Their research also indicated that 52.6% of all
the respondents would buy game meat more often if they were given more information on its
health benefits.
3. Game species
In lists compiled of the most common and most favoured game species to farm with in South
Africa, springbok ranks first, while blesbok seems to be in the top four (Conroy and Gaigher,
1982; Jansen van Rensburg, 1997). Hoffman and Bigalke (1999) and Jansen van Rensburg
(1997) found springbok to be the most frequently cropped species in South Africa. In a study
that included game meat consumption of South African consumers, Hoffman et al. (2005)
found that most consumers had eaten springbok meat on a previous occasion and that
springbok was one of three game meat species regularly available in supermarkets,
butcheries and restaurants.
3.1. Blesbok (Damaliscus dorcas phillipsi)
The blesbok is a large antelope and is very similar to the bontebok (Hanks, 1983). Smithers
(1983) recorded blesbok live weight as 61kg for females and 70kg for males, which falls in the
range of 58-86kg reported by Kroon et al. (1972) and is similar to the live weights reported by
other authors (Huntley, 1971; Conroy and Gaigher, 1982; Smit, 2004). Carcass yield reported
for blesbok lies in the range of 49-55% (Huntley, 1971; Conroy and Gaigher, 1982; Van Zyl
and Ferreira, 2004).
3.2. Springbok (Antidorcas marsupialis)
The springbok is a medium-sized antelope (Hanks, 1983) and compared to six other wild
game species, springbok meat performed the best in the quality tests conducted by Von la
Chevallerie (1972). Springbok live weights was found to be around 37kg for females and
41kg for males (Smithers, 1983), with a total live weight range of 27-37kg (Conroy and
Gaigher, 1982; Van Zyl and Ferreira, 2004). The carcass yield for springbok is shown to be
around 56-58% (Van Zyl, von la Chevallerie and Skinner, 1969; Conroy and Gaigher, 1982;
Van Zyl and Ferreira, 2004).

Literature review Species differences in meat composition
16
4. Species differences in meat composition
4.1. Proximate composition
There are very definite differences in the proximate composition of game species vs. other
ruminant (domesticated) species (Table 4). For example, Jansen van Rensburg (2001)
reported nyala (Tragelaphus angasii) meat contained 10% more protein than beef, while
having significantly lower cholesterol levels, kilojoules and fat contents.
Table 4 Differences in the proximate meat composition of game, sheep and beef.
Characteristic Game meat (%) Sheep (%) Beef loin (%)
Protein 22.1 – 24.21 14.5 – 18.52 19.4 ± 0.43
Moisture 58.4 – 65.01 52.0 – 58.02 77.5 ± 0.43
Ash 6.1 – 7.51 4.0 – 4.92 1.1 ± 0.053
Fat 1.3 – 9.01 17.0 – 25.02 0.4 ± 0.063
(1Van Zyl and Ferreira, 2004; 2Kirton and Barton, 1962; 3Onyango, Izumimoto and Kutima,
1998)
4.2. Fat and fatty acids
Several authors have reported the much lower fat content of game meat compared to
domesticated meat species (Schönfeldt, 1993; Jansen van Rensburg, 2001; Van Zyl and
Ferreira, 2004). Dhanda, Taylor and Murray (2003) did, however, note that goat meat is also
low in fat and high in protein when compared to sheep (at similar ages), but there were also
marked differences between goat genotypes. While the fat content of game meat is usually
described as being in the range of 1.0-9.0%, Enser, Hallett, Hewett, Fursey, Wood and
Harrington, (1997a) reported much higher fat contents for beef (15.6%), lamb (30.2%) and
pork (21.1%).
Pig fat is less firm (hard) than the fat tissue of ruminants because its fatty acid profile contains
more unsaturated fatty acids, while ruminant fat contains more saturated fatty acids (Wood et
al., 2004). While studying the fatty acid composition of ruminants (beef and lamb) and pigs,
Wood et al. (2004) observed the n-6:n-3 ratio to be less (thus, more favourable) in ruminants,
because of its lower amount of C18:2 than in pork and its higher levels of n-3 polyunsaturated
fatty acids, especially C18:3. The n-6:n-3 values of loin muscle were reported by Enser,
Hallett, Hewett, Fursey and Wood (1996) to be much lower in beef (2.1) and lamb (1.3) than
in pork (7.2), which shows that in this regard ruminant meat complies better to the
recommended value of 4.0 or less stipulated by the UK Department of Health (1994). Pork
has a higher polyunsaturated to saturated fatty acid (P:S) ratio, mainly because of the higher

Literature review Species differences in meat composition
17
levels of C18:2 – this was suggested to be the result of the cereal-based diet pigs are fed.
These findings also confirmed the findings of Enser et al. (1996).
Enser, Hallett, Hewett, Fursey, Wood and Harrington (1997b) also suggested that ruminants
had a lower P:S ratio because dietary unsaturated fatty acids are hydrogenated in the rumen,
whereas pigs deposit unsaturated fatty acids virtually unchanged. According to the UK
Department of Health (1994) the P:S ratio of beef and lamb is considered as unfavourably
low, as the recommendation is 0.45 or higher for the whole diet. The P:S ratio for beef (0.11)
and lamb (0.15) were found to be much less than that of pork (0.58) (Enser et al., 1996).
Conjugated linoleic acids (CLA) are produced naturally by ruminants and may be beneficial in
human health (Enser, 2001).
4.3. Cholesterol content
The cholesterol content of various meat species differ tremendously (Table 5) and depending
on the tissue type (lean muscle vs. fat), the amount of cholesterol actually consumed may
also differ greatly. In animals, cholesterol is an integral part of cell membranes and therefore
the cholesterol content of meat cannot be lowered too much without compromising cell
membrane integrity.
Table 5 Fat and Cholesterol content in meat and fat of several meat species.
Species Fat (%) Cholesterol (mg/100g-1)
Beef (muscle) 1 1.90 60.00
Veal (muscle) 1 0.81 70.00
Pork (muscle) 1 1.86 65.00
Mutton (fillet) 1 3.41 70.00
Chicken (average) 1 5.60 81.00
Chicken (breast without skin, average) 2 0.70 43.40
Turkey (average) 1 15.00 74.00
Turkey (breast without skin, average) 2 1.00 44.00
Lamb (intermuscular fat) 1 68.30 75.00
Beef (intermuscular fat) 1 70.90 99.00
Pork (intermuscular fat) 1 76.70 93.00
Black wildebeest (muscle, male) 3 0.97 46.05
Blesbok (muscle, male) 4 0.76 51.38
(1 Chizzolini et al., 1999; 2Honikel and Arneth, 1996; 3Van Schalkwyk, 2004; 4Smit, 2004)
As shown above, both black wildebeest and blesbok contain lower cholesterol levels than any
of the traditional red meat species and show lower cholesterol levels than chicken and turkey.
However, once skinless chicken and turkey breasts are considered, the cholesterol levels of
these two species are lower than the two game meat species shown. This shows that game

Literature review Species differences in meat composition
18
meat can compete favourably with meat from other species where cholesterol content is
considered.
4.4. Myoglobin
Meat colour differs amongst species mostly because of the difference in myoglobin content
(Young and West, 2001). Species or breeds that underwent intensive selection over the
years, such as most commercial pig and chicken breeds, usually have paler meat. When
selecting for an increased muscle protein quantity, myoglobin content is not increased
similarly to protein, which leads to a lesser overall myoglobin concentration in these breeds.
South African game animals roam freely and have to forage for food, since they do not
receive supplementary food and generally have to fend for themselves, unlike domesticated
meat animals which are normally kept in pens or feedlots. Game animals, thus have higher
amounts of myoglobin in their muscles because of the exercise involved in foraging, since the
myoglobin quantity is also influenced by muscle activity and exercise (Hoffman, 2001; Young
and West, 2001).
5. Muscle differences
5.1. Individual muscles
The M. longissimus thoracis et lumborum (also known as the M. longissimus et lumborum or
M. longissimus dorsi) is considered to be a ribcage (thoracic region) and a loin (lumbar
region) muscle, because of its length, and provides the round of meat in chops and steaks cut
from the posterior rib and loin (Swatland, 1994). It is a compound muscle formed by subunits,
each of which stretches over several vertebrae and helps with the flexibility of the vertebral
column. Because of its compound nature and its length, the M. longissimus et lumborum
shows qualities usually associated with either ribcage or loin muscles and therefore its
characteristics may differ widely throughout the muscle. The muscle increases in width
towards the posterior part of the ribcage, but through the loin the cross-sectional area remains
unvarying. The muscle fibre bundles are angled towards the vertebral column. Swatland
(1994) describes muscles from the ribcage as having intermediate levels of tenderness, while
loin muscles are tender with a desirable taste.
The M. supraspinatus is a shoulder muscle found dorsally to the spine (Swatland, 1994). It
has an intermediate level of tenderness and generally needs to be cooked completely to
make it tender.
The M. biceps femoris, as well as the M. semitendinosus, is located in the hind limb
(Swatland, 1994). These muscles are quite large and are considered to be moderately
tender. While the M. biceps femoris appears to be made up of two parts divided by a deep

Literature review Physical properties of meat
19
cleft, it is actually a single muscle even though the smaller segment is often paler in colour. It
can be found on the lateral side, while the M. semitendinosus can be found on the posterior
side of the hind limb. Paul (1963) described the M. biceps femoris as having a mealy texture
after cooking, which can be related to pronounced granulation of the collagen structure of the
muscle fibres because of cooking.
5.2. Muscle tenderness
The different muscles have different levels of tenderness and Shackelford, Wheeler and
Koohmaraie (1995) found the M. longissimus dorsi to rank higher than M. semitendinosus and
M. supraspinatus (ranked equally), which in turn ranked higher than biceps femoris in overall
tenderness. Olsson, Hertzman and Tornberg (1994) also found M. biceps femoris to have a
lower overall tenderness score than M. semitendinosus, while Shorthose and Harris (1990)
reported no significant differences between the tenderness of these two muscles. The latter
authors found that M. semitendinosus and M. longissimus dorsi tenderness was similar in
cattle at 10 months of age, but when muscles from cattle older than 24 months were
compared the M. semitendinosus muscle was much less tender (P<0.01). In the Shackelford
et al. (1995) study, Warner-Bratzler shear force values did not detect any differences between
the muscles (Table 6).
Table 6 Mean values found in overall tenderness and Warner-Bratzler shear force values for
different beef muscles (SD = Standard deviation).
Overall tenderness (8 point scale) (1=extremely tough; 8= extremely tender)
Warner-Bratzler shear force (kg)
Muscles Mean SD Minimum Maximum Mean SD Minimum Maximum
Biceps femoris 5.0 0.6 3.2 6.1 4.3 0.8 3.2 6.0
Longissimus dorsi 6.5 0.8 5.1 7.4 4.1 1.1 2.7 6.7
Semitendinosus 5.7 0.4 4.8 6.4 4.1 0.7 3.3 5.8
Supraspinatus 5.6 0.6 4.6 6.8 4.3 0.9 3.0 5.8
(Shackelford et al., 1995)
Shackelford et al. (1995) found that the myofibrillar component of tenderness, or ease of
fragmentation, described more of the variation in overall tenderness than the amount of
connective tissue could and that ease of fragmentation followed the same trend as overall
tenderness in the different muscles. The shear force of the M. longissimus dorsi could not be
highly related to the shear force of other muscles (Shackelford et al., 1995).
While studying the course of rigor mortis, ageing and tenderness in beef M.
semimembranosus and M. longissimus dorsi, Olsson et al. (1994) found that shear force
values of M. longissimus dorsi are low after only two days (at 7 and 10 ºC) and that there is a
greater reduction in shear force values of M. longissimus dorsi than in M. semimembranosus

Literature review Physical properties of meat
20
between days two and 15 (at 14 ºC). This led them to believe that the ageing process is more
active in M. longissimus dorsi than M. semimembranosus, which means that M. longissimus
dorsi is more tender after ageing.
M. rectus femoris and M. semitendinosus were rated as having the highest sensory
tenderness of five sheep muscles examined by Jeremiah, Smith and Carpenter (1971).
Cover, Ritchey and Hostetler (1962c) reported M. biceps femoris fragmented more easily than
M. longissimus dorsi at 80 and 100ºC. It was also reported that there was less adhesion
between the muscle fibres of M. biceps femoris than that of M. longissimus dorsi. The trend
of muscle fibres to become more easily fragmented and to adhere less to each other with
increased internal temperature is a tendency towards tendering with heat.
5.3. Connective tissue and muscle tenderness
Connective tissue plays a part in tenderness, but because factors such as gender, age,
species and breed can greatly influence the connective tissue content of meat as well as the
solubility of the collagen component, the exact impact of connective tissue on muscle
tenderness cannot really be generalised, but has to be ascertained for each specific sample.
Jeremiah, Dugan, Aalhus and Gibson (2003b) found that the most tender muscles (e.g. M.
triceps brachii and M. ilio-psoas) contained very low (<30µmol/g) levels of insoluble
hydroxyproline.
5.4. Fatty acid differences between muscles
Muscle types differ in fatty acid content – red oxidative muscles have a higher concentration
of phospholipids than white muscles. Enser et al. (1998) chalks fatty acid differences
between muscles up to their differences in phospholipid concentration and levels of
intramuscular fat.
Lengyel, Husvèth, Polgar, Szabo and Magyar (2003) found the M. longissimus of bulls
contained lower levels of polyunsaturated fatty acids than M. semitendinosus, although the
concentrations of saturated and mono-unsaturated fatty acids were much higher in the M.
longissimus dorsi. These findings show that muscles that consist predominantly of red
oxidative fibres (e.g. M. semitendinosus) have higher levels of polyunsaturated fatty acids
than muscles low in red oxidative fibres (e.g. M. longissimus dorsi).
5.5. Cholesterol differences between muscles
In beef M. longissimus dorsi the majority (60-80%) of total cholesterol is located in the
membrane component and 20-40% in the cytoplasmic component (Hoelscher et al., 1987).
The reverse was found in the subcutaneous fat, with the majority (88-92%) of total cholesterol
found in the cytoplasm and 8-12% in the membrane component.

Literature review Physical properties of meat
21
5.6. Muscle colour
Young and West (2001) states that colour differences between muscles are because of
myoglobin and iron differences. The differences in myoglobin concentration between muscles
often relate to the function of the muscle, which translates into muscles used in a repetitive
action (e.g. diaphragm used for breathing) containing higher myoglobin concentrations and
thus appearing redder than muscles used less often.
Muscles using glycolysis as an energy mechanism contain low levels of myoglobin as
opposed to muscles using oxidative metabolism, which contain high levels of myoglobin.
Muscles rich in myoglobin also contain more mitochondria and cytochromes because of
oxidative metabolism (Young and West, 2001). Wheeler, Koohmaraie and Shackelford
(1997) found M. longissimus dorsi to have the greatest colour stability during display than
other beef muscles. Young and West (2001) reported muscles with low colour stability
contained high metmyoglobin-reductase activity, with high oxygen-consumption rates.
5.7. The effect of age on muscles
With increased age and increased weight, tissue proportions in the animal’s body changes,
with muscle and bone proportions decreasing as fat proportions increases. Most muscles are
affected by age with regard to its different characteristics. In general muscles become
tougher with age. This increased toughness is related to the connective tissue strength and
that is why Shorthose and Harris (1990) found beef M. biceps femoris, which have high
connective tissue strength, trebled in toughness with increased age. In direct opposition to
that, the tenderness of the M. psoas major was found to be virtually unchanged by increased
age.
Total intramuscular lipid content and fatty acid composition are also affected by slaughter age
(Lengyel et al., 2003). These authors found that with increased age the proportions of
saturated and mono-unsaturated fatty acids in the total lipid content increased, while
polyunsaturated fatty acids decreased for all muscles analysed. The M. semitendinosus had
lower total lipid content at all slaughtering ages than the M. longissimus dorsi and M. psoas
major. The M. longissimus dorsi showed higher intramuscular lipid content at slaughter ages
of 14 and 19 months than at 7 months. All muscles had significantly higher levels of
saturated fatty acids at 14 and 19 months than at a slaughter age of 7 months of age and the
percentage polyunsaturated fatty acids decreased markedly between 7 and 14 months of
age. The polyunsaturated fatty acids mostly affected were linoleic (C18:2n-6) and
arachidonic (C20:4n-6), which decreased (Lengyel et al., 2003).
5.8. Muscle shortening
M. longissimus dorsi has a higher level of cold shortening than M. semimembranosus,
because it has more oxidative fibres (Olsson et al., 1994). On the other hand, the M.

Literature review Physical properties of meat
22
semitendinosus reaches constant shortening earlier than M. semimembranosus or M. biceps
femoris even though its shortening process starts later than the latter two muscles (Hertzman,
Olsson and Tornberg, 1993). This happens because the M. semitendinosus contains the
most white (rapid) fibres and predominantly white muscles have a longer delay phase than
muscles containing more red fibres.
5.9. Juiciness and marbling fat
M. biceps femoris and M. rectus femoris were rated juiciest, M. semimembranosus received
intermediate ratings and M. semitendinosus and M. vastus lateralis were rated least juicy
when these five sheep muscles were investigated (Jeremiah et al., 1971). Sheep M.
semitendinosus showed significantly more and M. rectus femoris had significantly less
marbling than M. biceps femoris and M. vastus lateralis (Jeremiah et al., 1971). Marbling fat
acts as lubrication during chewing and causes initial juiciness to be experienced, whereas the
moisture left in meat after cooking is responsible for the awareness of prolonged juiciness
(Warriss, 2000).
6. Physical properties of meat
6.1. Colour
Meat colour is one of the most important factors that consumers consider when purchasing
meat. Consumers consider colour to be a particularly important indicator of meat quality and
use colour as a cue for freshness (Jeremiah, Smith and Carpenter, 1972; Stevenson, Seman,
Weatherall and Littlejohn, 1989; Wheeler, Koohmaraie and Shackelford, 1996a; Young and
West, 2001; Mancini and Hunt, 2005). According to Issanchou (1996) consumers tend to
favour normally coloured meat, rather than meat that is either too dark or too pale. Carpenter,
Cornforth and Whittier (2001) established that there was a close relationship between colour
preference and a consumer’s decision to purchase beef and that consumers preferred bright
red beef instead of purple or brown. The colour of meat is, unfortunately, influenced by a
variety of factors, which can range from ante mortem stress to the type of myoglobin molecule
primarily present in the cut of meat (Issanchou, 1996; Honikel, 1998; Lawrie, 1998).
6.1.1. Myoglobin
The redness of the meat of land mammals is chiefly caused by the pigment myoglobin, which
is chemically very similar to haemoglobin (blood protein) and also contains iron bound in
porphyrin (Young and West, 2001; Mancini and Hunt, 2005). The water-soluble myoglobin
structure contains eight alpha helices, which are linked by short non-helical sections.
Additionally, it contains a haeme ring with an iron atom in the centre – this iron atom can form
six bonds: four with pyrrole nitrogens, one in co-ordination with the proximal histidine-93 and
the 6th site can reversibly bind with ligands (Mancini and Hunt, 2005). It is true that there is
also haemoglobin present in muscle, but compared to the myoglobin content, it is fairly
minimal. The primary function of myoglobin is to bind oxygen (O2) temporarily in between

Literature review Physical properties of meat
23
haemoglobin-bound O2 in the blood and chemically reduced O2 produced as water (H2O) by
mitochondrial respiration in the cells. Mancini and Hunt (2005) also mentioned that
cytochrome C may play a minor role in beef, lamb, pork and poultry colour.
Lawrie (1998) observed that surface-appearance of meat is subject to the quantity of
myoglobin, as well as the type of myoglobin, present in the meat, the chemical state of the
myoglobin and also the chemical and physical state of other meat components.
Myoglobin concentration in the muscle generally depends on the activity level of the muscle,
with highly active muscles generally containing more myoglobin (Honikel, 1998; Lawrie, 1998;
Young and West, 2001). This generalisation carries over into other areas such as species,
breed, age, type of muscle and training. Muscles such as the M. longissimus dorsi is less
intensively used than the diaphragm, which is a highly active muscle, therefore, the
diaphragm contains more myoglobin than the M. longissimus dorsi. Animals that are kept in
relative confinement (i.e. a stall or pen) have less myoglobin than pasture-kept or free-range
animals. Thus, game animals, which are generally free roaming, often have darker meat
than their domesticated counterparts, since game animals have to forage for food and
therefore exercise more, while domesticated animals are usually fed and exercise fairly little.
Diet can also influence pigmentation, with diets low in iron causing lower myoglobin levels in
the meat.
Oxymyoglobin is the most important chemical form of myoglobin in fresh, uncooked meat.
Oxymyoglobin is formed by oxygenating myoglobin and occurs only on the surface of meat
(Lawrie, 1998). The thickness of the oxymyoglobin layer (and thus, the depth to which O2
penetrates the meat) may depend on several factors, such as the temperature, O2 partial
pressure and pH of the meat (Mancini and Hunt, 2005). This pigment is extremely important
when taking consumer demands and perceptions into consideration as it represents the bright
red colour that consumers want their meat to be (Lawrie, 1998). Cytochrome enzymes
remain capable of O2 utilization for quite some time post-mortem. O2 diffuses into the meat
for some distance from the exposed surfaces until a balance is reached between diffusion-
rates and uptake by cytochrome enzymes.
The purplish-red colour associated with vacuum packaged meat or that occurs just after meat
has been cut, is the result of deoxymyoglobin (Mancini and Hunt, 2005). When no ligand is
bound to the 6th binding site of the haeme ring and when the haeme iron is in the ferrous
(Fe2+) form, deoxymyoglobin occurs.
According to Lawrie (1998) brown pigmentation is a desirable attribute in cooked meat.
Pigment conversion is affected by temperature in the following ways: beef cooked to an
internal temperature of 60ºC has a bright red interior, internal temperatures of 60-70ºC

Literature review Physical properties of meat
24
causes a pink interior and internal temperatures of 70-80ºC causes a greyish brown colour.
Maillard-type reactions and caramelisation of carbohydrates also contribute to the brown
colour of cooked meat.
There are a few undesirable colour-occurrences when dealing with meat, but metmyoglobin-
formation is the most common of these. When about 60% of myoglobin appears in the
metmyoglobin form, its brown colour is quite noticeable (Lawrie, 1998). Carpenter et al.
(2001) found that, once metmyoglobin reaches 30-40% of the total amount of pigments on the
surface of fresh beef, consumers will make a no-purchase decision. Metmyoglobin can be
produced from myoglobin or oxymyoglobin and can be accelerated by, for example, low pH,
heat, salts, lipid oxidation, microbial load and O2-consumption rates. Low temperatures tend
to delay metmyoglobin formation. Furthermore, Mancini and Hunt (2005) noted that
metmyoglobin forming beneath the surface, can also influence meat appearance since it
gradually thickens and moves to the surface of the meat.
6.1.2. Colour stability
Colour stability is very important, especially in retail display, and can be influenced by several
factors, but is most often linked to oxidation. Sanchez-Escalante, Djenane, Torrescano,
Beltran and Roncales (2001) observed that with time (thus, storage) metmyoglobin forms
because of the oxidation of oxymyoglobin. This oxidation of oxymyoglobin to metmyoglobin
has been described by several authors, including Lawrie (1998) and Wood et al. (2004). As
previously mentioned, metmyoglobin has an unattractive brown colour which consumers
usually discriminate against. Metmyoglobin reduction is important to ensure colour stability,
which is why many studies research the effects of antioxidant addition to meat (Sanchez-
Escalante et al., 2001; Mancini and Hunt, 2005).
Different antioxidants have been tried and tested to varying degrees of success. So, for
example, Sanchez-Escalante et al. (2001) found rosemary powder (1 000 ppm) extremely
effective in inhibiting oxymyoglobin oxidation when used alone or in conjunction with ascorbic
acid (500 ppm) in beef patties. When rosemary was used in conjunction with ascorbic acid,
the relative metmyoglobin to total myoglobin ratio was significantly lower than in the untreated
samples (Sanchez-Escalante et al., 2001). After 20 days of storage, the treated samples
reached and maintained critical, but still acceptable, metmyoglobin levels (30-40%).
Rosemary alone could only cause beef patties to maintain non-critical metmyoglobin levels for
up to eight days of storage, when 40% metmyoglobin was exceeded (still significantly lower
than control samples), while ascorbic acid alone inhibited metmyoglobin formation effectively.
Samples treated with both rosemary and ascorbic acid displayed a* values that were
significantly higher than control samples throughout the whole storage period investigated
(Sanchez-Escalante et al., 2001). During the first 12 days of storage, rosemary and ascorbic

Literature review Physical properties of meat
25
acid also caused treated samples to attain significantly higher a* values when used alone and
ascorbic acid had an additive effect on a* values when used in conjunction with the
antioxidants taurine and carnosine. Ascorbic acid can act either as an antioxidant or as a pro-
oxidant, depending on the presence of metal ions, the tocopherol content and the
concentration in which ascorbic acid is added to the meat (Sanchez-Escalante et al., 2001).
Mancini, Hunt, Kim and Lawrence (2004, as cited by Mancini and Hunt, 2005) reported that
the regeneration of post-mortem NADH and metmyoglobin reduction involved lactate
dehydrogenase, which caused the enhanced colour stability in a study on enhanced beef. It
was suggested that the lactate dehydrogenase converted the lactate injected into post-
mortem muscle to pyruvate and NADH. This additional pyruvate and NADH expanded the
reducing equivalent pool of post-mortem muscle. This increased the metmyoglobin reducing
activity and metmyoglobin was therefore chemically reduced, causing greater meat colour life.
Vitamin E has also been shown to delay colour oxidation (Wood et al., 2004).
Diet can also influence colour stability, as has already been reported by Warren et al. (2002)
through the difference between grass-fed and grain-fed cattle and the improved colour
stability in grass-fed cattle. The bright red colour of oxymyoglobin in grass-fed beef, keeps
longer in retail display than the colour of meat from grain-fed cattle (Warren et al., 2002). It
was thought to be due to antioxidants in grass that caused vitamin E to be present in higher
concentrations in grass-fed animals. Higher vitamin E-levels resulted in lower lipid oxidation
and thus, better colour retention even though the grass-fed animals had higher levels of n-3
polyunsaturated fatty acids. The n-3 polyunsaturated fatty acids are more oxidisable than the
n-6 polyunsaturated fatty acids, with the latter being higher in grain-fed animals (Warren et al.,
2002). Vatansever et al. (2000) reported decreased colour saturation in ruminants receiving a
fish oil diet in which lipid oxidation was also the greatest.
Colour change (oxymyoglobin oxidation) usually precedes lipid oxidation (Wood et al., 2004).
6.1.3. Colour measurement
Although meat colour can be measured both as a sensory attribute and as a physical
attribute, it is most commonly measured objectively with a reflectance colorimeter as part of
the physical analyses of meat. Measuring colour with an instrument is generally accepted as
more objective and reproducible at different times and locations than using human taste
panellists who can produce results that differ extensively (Young and West, 2001). These
instrumental measurements are based on a three-dimensional ‘colour space’.
Stevenson et al. (1989) noted the CIEL*a*b* (CIELAB) colour scale (Commission
International De l’Eclairage, 1976) as appropriate for meat colour measurement. This was

Literature review Physical properties of meat
26
confirmed by Honikel (1998) and this author explained the different measurement properties
often used (Table 7) as well as the aspects of meat colour measured by them.
Table 7 Description of main measurement properties most commonly used in CIEL*a*b*
colour measurement of meat.
Measurement property Measurement taken Scales / values used
L* Lightness 0 = black 100 = white
a* Redness and greenness (red-green value)
b* Yellowness and blueness (yellow-blue value)
Hue angle (º) Defines the colour Calculated as tan –1 (b*/a*) Is determined by rotation about
the a* and b* axes.
Chroma Colour intensity Calculated as √(a*2 + b*2)
(Honikel, 1998)
Stevenson et al. (1989) further explained that hue angle is increased as b* rotates towards a*.
When a* and b* values are high, it results in higher saturation (higher chroma values) and the
muscle will appear brighter. According to Onyango et al. (1998) this meat will have higher
appeal and desirability to consumers because of its greater colour purity. It was also found
that three component equations, rather than a trained colour panel, could be used and that a
significantly better relationship was produced if L*, a* and b* values or L*, hue and chroma
values were used instead of only one or two of these variables (Stevenson et al., 1989).
Young and West (2001) stated that, although the meat surface mainly reflects light in a diffuse
way, a minor amount of spectral reflectance from the glossy surface of wet (fresh, uncooked)
meat does occur. There is also some light reflected internally since a part of the incident light
is transmitted below the surface because of the partial translucency of meat. Meat grading
scales often refer to the paleness or darkness, or to the chroma of meat samples.
Young and West (2001) reported that a* values and hue angle are both good indicators of
meat discolouration. These authors observed that the a* values fell and hue angles
increased as discolouration progressed in beef during retail display. It was also noted that
chroma (colour intensity) drops and meat is seen as dull.
6.1.4. Game meat colour
Several authors have reported game meat (or venison) as being darker in colour than red
meat from other meat animals (Hoffman, 2001; Young and West, 2001). Hoffman (2001)
stated that, in South Africa, game meat is often perceived as having a dark, unattractive red

Literature review Physical properties of meat
27
colour, linked to DFD (dark, firm, dry) meat. This author gave the explanation for DFD meat
in game animals as being due to stress when harvested and explained that the normal,
slightly darker red colour of game meat is due to the extensive way in which game is reared.
Game animals are more active than traditional meat animals and therefore have higher
myoglobin levels in their muscles.
Venison has a high tendency to form a brown colour and generally has a higher level of
myoglobin than domesticated meat animals, therefore also appearing darker (Young and
West, 2001). While investigating the properties of meat from black wildebeest and mountain
reedbuck, Van Schalkwyk (2004) reported a series of colour findings (Table 8) noting, among
other things, that game meat has lower L* values than other meat species which partly
causes game meat to be perceived as darker than, for example, beef. The colour
measurements for blesbok, as found by Smit (2004), are also shown.
Table 8 Colour findings for blesbok, black wildebeest and mountain reedbuck.
Animal L* value a* value b* value Hue angle (º) Chroma
Blesbok (male) 1 30.53 12.54 8.46 33.98 15.26
Black wildebeest (male) 2 35.98 14.85 9.24 30.21 17.64
Mountain reedbuck (male)2 31.13 11.89 8.16 36.5 14.52
(1Smit, 2004; 2Van Schalkwyk, 2004)
Of all the species investigated by Von la Chevallerie (1972), eland and gemsbok had the
lightest colour and it was found that the colour of the other species varied from dark red-
brown to pale-red.
6.1.5. Other factors affecting colour
The pH value of meat may influence meat colour and colour stability and is also a major
influence in DFD meat formation. The influence of pH on meat and meat qualities, along with
DFD meat, will be covered at a later stage.
Paul (1963) observed that heating caused changes in the colour and structure of collagen and
that there was a link between these characteristics. As collagen structure changes from
fibrous to granular, its colour changes from areas of red to areas stained yellow. Changes in
pigment due to temperature, as reported by Lawrie (1998), have been addressed earlier.
If intra-muscular fat is present in large quantities, it can increase lightness even when the
pigment content is increased (Fiems, De Campeneere, De Smet, Van de Voorde, Vanacker
and Boucque, 2000).

Literature review Physical properties of meat
28
Packaging can also exert an influence on meat colour, particularly when different gasses are
used in modified atmosphere packaging as shown by Carpenter et al. (2001). Beef packaged
in 0.5% CO2 was described as red, beef packaged in 100% N2 as purple and beef packaged
in 1.0% O2 as brown by sensory panellists. Beef packaged in CO2 showed the highest a*
values and was therefore seen as the most red, while beef packaged in O2 had the highest b*
values (thus more yellow) and was seen as brown. Beef packaged in N2 had lower a* values,
but similar b* values and the meat seemed purple.
6.2. Water holding capacity
Water holding capacity (WHC) has a very important function in meat quality. Together with
meat pH, it influences important aspects of meat eating quality, such as tenderness and
juiciness, and also directly influences physical properties such as cooking loss and drip loss
(Honikel, 1998; Lawrie, 1998; Immonen, Ruusenen and Puolanne, 2000; Thomas, Gondoza,
Hoffman, Oosthuizen and Naudè, 2004).
Huff-Lonergan and Lonergan (2005) reported that about 75% of lean muscle is water and that
this water is held by the structure of the muscle and muscle cells. Lawrie (1998) stated that
WHC refers to the way moisture is present in muscle, which is mostly in the spaces between
myosin (thick) and actin/tropomyosin (thin) filaments in the myofibrils. A maximum of 5% of
the total water in muscle can bind directly to hydrophilic groups on proteins. Bound water
cannot easily be moved to other compartments (Lawrie, 1998; Huff-Lonergan and Lonergan,
2005). Entrapped and free water are the two other water fractions, although free water is not
often encountered in pre-rigor meat. Entrapped water is the water fraction mainly affected by
rigor. Especially post-mortem pH fall affects the sarcoplasmic proteins, to which some of the
WHC is due or attributed to – the faster the rate of pH fall, the worse the sarcoplasmic protein
denaturation.
In normal muscle tissue post-mortem glycolysis will proceed to an ultimate pH that is close to
the isoelectric point of meat, which is at pH 5.4-5.5 and is also the point at which WHC is at a
minimum (Lawrie, 1998). This means that there will always be some loss of water after
death. Thus, the higher the ultimate pH of muscle, the stronger water is bound in that muscle.
This was confirmed by the work of Thomas et al. (2004). These authors found that drip loss
percentage and pH followed opposite trends – as muscle pH values increased, drip loss
percentage declined. Changes in the ion-protein relationship can cause an increased WHC
as there is a net increase in change through K+ -absorption and Ca2+-release to enhance
WHC, particularly in comminuted meats, when salts of weak acids, specifically phosphates
and polyphosphates, are added to meat (Lawrie, 1998).
Offer and Trinick (1983) explained WHC as increased water up-take by myofibrils in strong
salt solutions. This occurs when the lattice of thick and thin filaments expand when the

Literature review Physical properties of meat
29
increasingly negatively charged components repel one another and when those forces
determining the arrangement of the filaments at the Z- and M-lines and between myosin
heads and actin filaments, are disrupted.
Bouton, Harris and Shorthose (1971) showed that WHC was significantly (P<0.001)
correlated with pH in both whole and minced samples (r =0.80 and r = 0.88, respectively).
Again, this strengthens the fact that anything that affects pH, and specifically the rate of pH
fall, will affect WHC, which in turn can affect other quality aspects of meat.
Appearance may also be influenced. Lawrie (1998) reported that meat with a high WHC
might appear to have a dry surface.
6.3. Cooking loss
Cooking loss is the moisture lost from muscle during cooking and may act as a measure of
WHC, along with drip loss. Cooking loss can mostly be attributed to structural changes
occurring in the muscle because of the denaturing of various proteins at varying temperatures
(37-75ºC). Shrinkage of the myofibrils occurs when the filament lattice expands and this
results in water loss during cooking (Honikel, 1998). Some of the structural changes that
occur are cell membrane destruction, shrinkage of muscle fibres, and aggregation of
sarcoplasmic proteins and shrinkage of the connective tissue. Although all of these changes
contribute to cooking loss, changes in connective tissue are of particular interest.
In the work of Marsh, Ringkob, Russell, Swartz and Pagel (1987) a linear relationship was
shown between cooking losses and pH. At 65ºC there was a linear decrease in cooking loss
as pH increased in raw or cooked meat over the pH range of 5.6-7.0. However, at 90ºC there
was little change in cooking loss until pH 5.9 in raw, and 6.2 in cooked meat, which saw a
linear decrease in cooking loss with increased pH.
Animal age had almost no effect on cooking loss in samples from seven out of eight beef age
groups (Shorthose and Harris, 1990). Contradictory findings were reported by Jeremiah et al.
(1971) who showed significant (P<0.05) correlations between chronological age and
measures of tenderness and cooking loss. The way in which carcasses were hung caused
differences in cooking loss, as was shown by the work of Shorthose and Harris (1990) when it
was found that carcasses hung via the sarcosciatic ligament (so-called tenderstretched)
showed significantly (P<0.001) lower cooking losses than carcasses hung (conventionally)
from the Achilles tendon (29.2% vs. 30.6%).
Jeremiah, Dugan, Aalhus and Gibson (2003a) observed that muscles differed extensively
when cooking loss was considered. The cuts containing more fat showed lower cooking

Literature review Physical properties of meat
30
losses and cuts that contained more insoluble and total hydroxyproline sustained greater total
cooking losses because of its higher connective tissue content.
Cooking loss is associated with tenderness and Briskey (1963) found muscles with a low
cooking loss to be very tender, while muscles with a high cooking loss lacked tenderness.
Silva, Patarata and Martins (1999) showed a significant (P<0.05) relationship between
tenderness and cooking loss. A similar trend was found by Thomas et al. (2004), i.e.
increased tenderness was found in meat with decreased cooking loss. These latter authors
thought it possible that this was due to a diluting effect of the bound water. That is to say, in a
fixed area, when more water is bound, a smaller amount of muscle fibres will be found.
Thomas et al. (2004) observed that cooking loss and drip loss showed opposite tendencies –
i.e. percentage cooking loss increased, while drip loss percentage decreased as shear force
values increased.
6.4. Tenderness and meat tenderisation
To the consumer, tenderness is the most important quality characteristic of meat (Whipple,
Koohmaraie, Dikeman, Crouse, Hunt and Klemm, 1990; Dransfield, Zamora and Bayle, 1998;
Lawrie, 1998; Pietrasik and Shand, 2004). Toughness in meat is seen as a serious quality
defect and Mitchell (1963) found this to be a common problem in lamb.
Deatherage (1963) described tenderness as “a quality representing the summation of
properties of the various protein structures of skeletal muscle.” Tenderness can be described
as a function of the solid (or water-insoluble) structures of muscles and that tenderness could
be directly related to the protein structure of muscle and the denaturation, coagulation and
hydrolysis of these proteins. Miller et al. (1995) related the cause of tenderness to four main
factors: muscle shortening (state of actomyosin complex); ageing (action of enzymes over
longer periods of time); contents of connective tissue; and marbling; although tenderness is
actually a very complex matter that cannot be explained thoroughly in such simplistic terms.
6.4.1. Consumers and meat tenderness
Consumers want their meat to be tender and flavourful (Husaini, Deatherage, Kunkle and
Draudt, 1950) and have very specific preferences and ideas about ideal tenderness, juiciness
and flavour (the three most important eating qualities of meat). As previously mentioned,
several authors have found that consumers are chiefly concerned with meat tenderness
(Lawrie, 1998; Gerelt, Ikeuchi and Suzuki, 2000; Pietrasik and Shand, 2004). They will find
any meat that does not comply with their demands on tenderness as unsatisfactory,
notwithstanding the satisfaction of all other aspects of quality and enjoyment.
Dransfield et al. (1998) reported that steak acceptability increased if steaks were more tender
and other authors also declared that tenderness after consumption, is the meat quality
Literature review Physical properties of meat
31
characteristic that will lead consumers to decide about the overall acceptability of the product
(Miller et al., 1995; Gerelt et al., 2000). In a study conducted by Miller et al. (1995),
consumers had to rate steaks in terms of tenderness and overall acceptability. The steaks
found acceptable were ranked between 3 (moderately tough) and 4 (slightly tough) on an 8-
point scale, which translated to Warner-Bratzler shear force values of 4.6-5.0 kg.
6.4.2. Tenderness measurement
Tenderness (or the sensation of tenderness) is an intricate meat property and it is very
difficult to take all aspects of tenderness into account when measuring it. The perception of
tenderness is construed by various processes and sensations (Pearson, 1963). The physical
process of chewing alone involves cutting, grinding, tearing, shearing and squeezing. The
impression of tenderness collected by sensors in the mouth, tongue, teeth and lips, as well as
other aspects of meat quality such as texture influence the perception of tenderness.
Tenderness may be measured either by a trained sensory panel as part of the sensorial
analyses, or by instruments as part of the physical analyses of meat. Warner-Bratzler shear
force values are most commonly used for objective tenderness evaluation (Pearson, 1963;
Bouton and Harris, 1972; Lawrie, 1998; Shackelford, Wheeler and Koohmaraie, 1999),
although there are a few other instrumental methods also frequently used such as the Instron
Universal Testing Machine (with a Warner-Bratzler attachment) and the MIRINZ tenderometer
(Bouton and Harris, 1972). The way in which meat cores are obtained for shear force
measurement may influence the outcome. Wheeler, Shackelford and Koohmaraie (1996b)
described meat cores obtained perpendicular to the steak surface as much less repeatable
and reported that such cores caused lower mean shear force values to be measured. On the
other hand, meat cores obtained parallel to muscle fibres delivered much better results.
These authors also found that shear force repeatability increased as more sample cores were
tested, but found that more than five cores per sample did not improve repeatability
significantly. AMSA (1995) advises to obtain meat cores from chilled (2-5 ºC) meat rather
than meat at room temperature (24-28 ºC) because it is then easier to ensure that all cores
have a uniform diameter.
Bickerstaffe, Bekhit, Robertson, Roberts and Geesink (2001) noted that shear force, as
measured by a MIRINZ tenderometer, accurately reflected eating assessment of tenderness
by consumers. These authors created instrumental tenderness categories, which were linked
to consumer tenderness perceptions.
6.4.3. Game meat tenderness
Consumers generally have the idea that game meat is tougher and drier than red meat from
other red meat species, but Von la Chevallerie (1972) found that Warner-Bratzler shear force
values did not correspond with the perception of game meat as being tougher. Hoffman

Literature review Physical properties of meat
32
(2001) reported that impala shear force values were similar to shear force values observed in
pigs, which shows that meat tenderness of at least some game species is similar to pork
tenderness. When examining the Warner-Bratzler shear force values of seven game species
(Table 9), Von la Chevallerie (1972) found springbok to be the most tender of all the
examined species.
Table 9 Shear force values of seven game species
Species Shear force value (g/cm2)
Blesbok 2 323
Eland 3 366
Gemsbok 4 088
Hartebeest 2 907
Impala 2 751
Springbok 1 181
Wildebeest 1 805
(Von la Chevallerie, 1972)
Elliot (1993) accounted for the idea that game meat (or venison) is generally tough,
originating from incorrect, or improper, harvesting and slaughtering procedures. Especially
wild venison quality suffered as a result of this and it led to wild venison being associated with
an unpleasant taste.
Although it has been well established that there is a correlation between pH and meat
tenderness, Wiklund, Barnier, Smulders, Lundström and Malmfors (1997) found no significant
correlations between the two characteristics in reindeer meat.
6.4.4. Connective tissue
Cover, Ritchey and Hostetler (1962a) identified the two structural components involved in
meat tenderness as muscle fibres and connective tissue. Connective tissue content and
composition can influence tenderness. Collagen is the main protein of connective tissue and
Bailey and Light (1989) reported it as the “one major protein common to all connective tissues
in all higher animals”. Collagen constitutes 25-30% of total protein in mammals.
Jeremiah (1978, as cited by Jeremiah et al, 2003b) identified the two factors that influence the
ultimate tenderness of muscle most, as a myofibrillar component (ultra structure of myofibrillar
proteins) and a stromal component (content, composition and structure of connective tissue
proteins). Olsson et al. (1994) stated that ‘background toughness’ refers to the quality and
maturity of connective tissue in meat.

Literature review Physical properties of meat
33
Toughness caused by connective tissue is due to cross-linkages forming between collagen
molecules over a prolonged period (Jeremiah et al., 2003a). Thus, older animals have more
cross-linkages and produce tougher meat than younger animals. Solubility differs between
cross-linked and non-cross-linked collagen – cross-linked collagen is less soluble than non-
cross-linked collagen. Non-cross-linked collagen is therefore also known as soluble collagen
(Hill, 1966). Berry, Smith and Carpenter (1974) found that an increased soluble collagen
percentage, along with a lower amount of collagen, were associated with higher tenderness in
beef. Light, Champion, Voyle and Bailey (1985) found higher heat-stable collagen cross-links
in tougher muscles and declared collagen cross-links important to meat tenderness.
6.5. pH
Various meat quality characteristics, such as colour, tenderness and WHC are influenced by
the pH value of the meat (Lawrie, 1998; Silva et al. 1999). In turn, the pH value is affected by
many factors – such as ante-mortem stress.
The post-mortem pH of meat is determined by the amount of lactic acid produced from
glycogen during anaerobic glycolysis. The isoelectric point (pH 5.4-5.5) is the pH range
where, in normal muscle, under normal conditions, the enzymes implementing glycogen-
conversion to lactic acid are inactivated (Lawrie, 1998). Normal pH decline occurs because of
post-mortem lactic acid accumulation (Immonen et al., 2000).
The final pH reached after glycolysis has ceased, is referred to as the ultimate pH (pHu). The
pHu of individual muscles differ according to ante-mortem metabolic state, but settles in the
region of about 5.4. Temperature has a definite effect on pHu. Usually when pHu is reached,
temperatures are still relatively high. Olsson et al. (1994) found that pHu was affected by
temperature and that the rate of glycolysis was reduced so much by very low temperatures
that ‘normal’ pHu was not reached. In a similar study the results of Hertzman et al. (1993)
included the following temperature and pH values of two beef muscles entering rigor at
constant temperatures in the cold-shortening region: 1ºC, pH 6.6; 10ºC, pH 6.3; 15ºC, pH 6.2
Many sensory aspects of meat are influenced by its pHu. However, there is some
controversy surrounding the relationship between pHu and tenderness. Some authors
(Bouton, Carroll, Harris and Shorthose, 1973; Guignot, Touraille, Ouali and Renerre, 1994;
Thomas et al., 2004) have found a linear relationship between pHu and tenderness, while
others (Jeremiah, Tong and Gibson, 1991) have found a curvilinear relationship, with
minimum tenderness between pH 5.8 and 6.2.
Silva et al. (1999) found that beef tenderness increased linearly with increasing pHu (5.5 to
6.7), even after periods of ageing (1, 6 and 13 days). At a high pHu (>6.3) neutral proteases
(i.e. calpains) are favoured, while cathepsin activity is favoured by a low pHu (<5.8).

Literature review Physical properties of meat
34
Intermediate pHu values are not favourable to either calpain or cathepsin-activity, which
results in the lowest degree of tenderisation. According to Yu and Lee (1986) this is the
reason for the curvilinear relationship sometimes found between tenderness and pHu and this
was confirmed by Jeremiah (1990, as cited by Van Schalkwyk, 2004).
Bouton et al. (1971) found peak toughness at pH 6 (Warner-Bratzler shear force only). While
studying the effect of acidity and temperature on muscle structure, Wismer-Pedersen and
Briskey (1961) found that temperatures up to 40ºC were not critical if pH values were higher
than 6.2, but if the pH values were lower than 5.9, temperatures above 35ºC would alter
muscle structure. By maintaining a specified pre-rigor temperature (from 0 to 30ºC) until the
pH had reached 6.4 and by then keeping muscle at 15ºC (Dransfield, Wakefield and
Parkman, 1992), neither tenderness, nor rate of tenderisation after rigor, was affected. After
a pH value of 6.1 was reached, first-order tenderisation began and thereafter rate of
tenderisation was severely affected by temperature. Tenderisation rate at 30ºC was 10 times
higher than at 1ºC and was unaffected by pH varying from 6.1 to 5.5. Dransfield et al. (1992)
found that aged meat was slightly tougher at higher temperatures than at the lower
temperatures. The temperature and pH at the start of rigor mortis were deemed very
important for tenderness in beef by Hannula and Puolanne (2004) who stated that M.
longissimus dorsi pH values should fall to below 5.7 before or when muscle temperature
reaches 7ºC.
Varnam and Sutherland (1995) reported that pHu had a negligible effect on juiciness.
It appears that flavour intensity and pHu show opposite trends – as muscle pHu increases,
flavour intensity decreases and Lawrie (1998) explains that the access of substances to the
palate is encumbered by the swollen myofibrillar structure.
MacDougal, Shaw, Nute and Rhodes (1979) reported that game meat with a high pHu is
darker than game meat with a normal pHu. This is in agreement with dark, firm, dry (DFD)
meat which is caused by limited post-mortem glycolysis and has a pH value higher than 5.8
(Lawrie, 1998). DFD meat is associated with better ultimate tenderness, but can be very
susceptible to bacterial spoilage, which means a short shelf life, and has reduced flavour
(Silva et al., 1999; Hoffman, 2001). It also has very poor processing characteristics. DFD
meat is also known as dark-cutting meat. This, according to Young and West (2001), is not
only because of its colour, but also because surface blooming is poor because of its high O2-
consumption rate. The dark red colour is due to protein that is relatively undenatured, thus it
is non-reflective and meat appears darker because of light-absorption and also no myoglobin
is lost through drip due to its high WHC (Hoffman, 2001; Young and West, 2001).

Literature review Physical properties of meat
35
DFD meat is usually caused by pre-slaughter stress. Stress causes the glycogen stores to
become so depleted that not enough lactic acid can be formed for meat acidification to
progress normally and that causes the pHu to remain high (Hoffman, 2001). This explains
why DFD meat is a quality problem that often occurs in game meat. As Hoffman (2001)
explains, when an animal is wounded and chased afterwards, it is a typical chronic stress
situation, which causes DFD meat.
As previously mentioned, stress can have a huge influence on pHu. Virtually anything can act
as a stressor – from transportation to diet restriction to genetic factors. If an animal is
slaughtered before its glycogen reserves are replenished, this will act negatively on pH-
decline and pHu. This, unfortunately, is a very big problem with game meat and that is why
correct harvesting procedures must be followed. Because game animals are farmed in
extensive systems, they are not familiar with people or vehicles and capture can be very
stressful. Hoffman and Ferreira (2000) found harvesting game animals at night to be the least
stressful and this is in accordance with the findings of several other authors (MacDougall et
al., 1979; Conroy and Gaigher, 1982).
When excessive post-mortem glycolysis occurs, it leads to pale, soft, exudative (PSE) meat
(Lawrie, 1998), which is also caused by stress before slaughter and results in meat with a low
pH and high temperature. Although PSE meat does affect game species, it is more often
seen in warthogs and animals that have been experiencing acute (short-term, heavy) stress
(Hoffman, 2001) and since neither springbok nor blesbok generally experience PSE meat
during normal harvesting procedures, it shall not be discussed further.
6.6. Enzymatic tenderisation
Calpains are the most important group of cysteine peptidases when meat tenderisation is
considered and are mainly controlled by calpastatin (their specific inhibitor), calcium ions and
phospholipids. Several calpains are known, but µ-calpain and m-calpain are most commonly
found (Sentandreu, Coulis and Ouali, 2002).
Although the precise action of calpains in the body could not be identified, treating myofibrils
with calpains is the action best able to explain density decline of the Z-disks (Sentandreu et
al., 2002). Using cathepsin B- and L-specific inhibitors had no effect on shear force or protein
solubility, which caused Hopkins and Thompson (2001) to believe that calpains were the
enzymes responsible. Koohmaraie (1996) found that µ-calpain is responsible for the
proteolysis of key myofibrillar proteins and pointed to this as the underlying mechanism
responsible for tenderisation during storage at low temperatures. After storage of 14 days at
4ºC, about 5-10% µ-calpain remains active in skeletal muscles. Dransfield (1994, as cited by
Hannula and Puolanne, 2004) notes that calpain-activity immediately post mortem is pH- and
temperature-dependent.

Literature review Physical properties of meat
36
Cathepsins are defined as mammalian intracellular enzymes exhibiting proteinase activity,
requiring sulfhydryl activators and varying largely between tissues and species (Landman,
1963). Sentandreu et al. (2002) describe cathepsins as lysosomal peptidases at an acidic
pH. Most cathepsins are stable over a wide pH range, but it is generally accepted that they are
only active in acidic environments (Sentandreu et al., 2002). The known cathepsins in muscle
tissue include six cysteine peptidases (cathepsins B, L, H, S, F and K) and one aspartic
peptidase (cathepsin D). Although there is much controversy on the role of cathepsins in
tenderness, free cathepsin activity (cathepsin B, L and D) have been linked to meat
tenderisation – from one day post mortem through the ageing process. Cathepsins have no
or very little effect on actin and myosin, but were shown to degrade other structural and
contractile proteins. Cathepsins were shown to play a role in ostrich tenderisation. Thomas
et al. (2004) found cathepsin D to remain active throughout ageing at 4ºC. Cathepsins B, L
and H showed little activity at first, but increased after the first few hours post-mortem and still
showed activity after 12 days.
Cystatin is a group of cysteine peptidase inhibitors, inactive against other peptidases such as
serine- or aspartyl peptidases (Sentandreu et al., 2002). All cystatins inhibit lysosomal
peptidases such as cathepsins B, H and L and cystein peptidases such as papain, which is
present in the latex of Carica papaya and affects the M-line and myosin filaments of the A-
band, while disrupting and disorganising the actin filaments (Wada, Suzuki, Yaguti and
Hasegawa, 2002; Azarkhan, El Moussaoui, van Wuytswinkel, Dehon and Looze, 2003).
7. Chemical properties of meat
7.1. Total moisture
The moisture content of meat is generally about 70-77% and decreases as the fat content of
meat increases (Young, Frost, West and Braggins, 2001). It was also stated by Lawrie (1998)
that, of all the components of meat, moisture constituted the biggest quantity by far. Moisture
in muscle is mainly found in the spaces between the myosin and actin or tropomyosin
filaments.
Crafford (2002) noted that the moisture content of game meat compared favourably with that
of beef, while Von la Chevallerie (1972) observed average percentage moisture of 75.5% in
game meat. The moisture content of several game species (Table 10) has been researched
and reported by several authors (Von la Chevallerie, 1972; Onyango et al., 1998; Van Zyl and
Ferreira, 2004) and was generally found to be in the range of 74-77%. Onyango et al. (1998)
found the moisture content (%) of three other game species (Kongoni loin, 73.4 ± 0.2; Oryx
loin, 76.6 ± 0.8; Zebra loin, 75.2 ± 0.3) to also fall within this range.

Literature review Chemical properties of meat
37
Table 10 Moisture contents of several game species compared to that of several domesticated
species.
Species Moisture (%) Moisture (%) Moisture (%) Moisture (%)
Black Wildebeest 77.01 - - 74.69(male)5
Blesbok 75.51 75.53 71.1 ± 1.14 75.12(male) 6
Eland 75.81 74.83 - -
Gemsbok 75.91 - - -
Hartebeest 76.31 - - -
Impala 74.71 75.73 74.0 ± 0.84 -
Mountain reedbuck - - - 72.76(male) 5
Springbok 74.71 74.73 75.3 ± 5.54 74.24 ± 0.167
Beef 65.42
Mutton 60.72
Ostrich 76.32
Pork 55.02
(1Von la Chevallerie, 1972; 2Sayed et al., 1999; 3Skinner and Louw, 1996; 4Van Zyl and
Ferreira, 2004; 5Van Schalkwyk, 2004; 6Smit, 2004; 7Kroucamp, 2004)
Game meat species are expected to have higher moisture contents than other domesticated
species, because of their low intramuscular fat content and the inverse correlation between
intramuscular fat and moisture content of meat Sales (1995).
Various authors have established that moisture plays an indirect role in tenderness and
juiciness, both important eating quality characteristics (Lawrie, 1998; Jeremiah et al., 2003b;
Thomas et al., 2004). Moisture content of meat is usually investigated under the guise of
WHC and has thus been discussed in depth as WHC.
Moisture levels in meat can be increased by various methods. Pietrasik and Shand (2004)
observed that 16 hours of tumbling increased the moisture percentage in non-tenderised
meat. It was concluded by Baublits, Pohlman, Brown Jr. and Johnson (2005) that steaks
injected with a solution containing NaCl and different phosphates at 18% pumped gain (of raw
weight) showed higher moisture percentages and were generally rated as more tender and
juicy. The same phenomenon was found for several other inorganic salt injections.
7.2. Total fat
Total fat can be defined as encompassing all fatty acid-containing substances (Young et al.,
2001). The substances mainly found in meat fats primarily include tri-, di- and mono-
acylglycerols, but also include some phospholipids, cholesterol esters and free fatty acids.
The fat contents of meat and meat products show great variation and can be influenced by

Literature review Chemical properties of meat
38
animal species, animal age, as well as the parts of the carcass used (Valsta, Tapanainen and
Männistö, 2005).
Intramuscular fat has an important function in several sensory quality attributes of meat.
Jeremiah et al. (2003b) reported a direct effect on both juiciness and flavour, with an indirect
effect on tenderness was observed. Tenderness is increased when intramuscular fat
deposited between fasiculi disrupts the endomysium structure and this causes the perimysial
fibres to separate and thin out (Nishimura, Hattori and Takahashi, 1999). Jeremiah et al.
(2003b) calculated intramuscular fat to be accountable for 12-14% of the variation in all
palatability traits of meat.
Consumer-demand for leaner meat has caused the meat industry to respond in several ways.
Resurreccion (2004) reported that the fat contents of pork was lowered by more than 30%
between the 1970’s and 1990’s – this was achieved mostly by selective breeding, improved
husbandry practices and better trimming of outside fat on retail cuts.
In meat and meat products, fat content is usually measured as crude fat (or ether extract) and
extracted from meat using a mixture of chloroform and methanol (Young et al., 2001). A
chloroform and methanol mixture is used because it extracts lipids more thoroughly than other
solvents, it causes lipids to undergo little chemical change during extraction and is a good
solvent for phospholipids.
7.3. Fatty acids
In the last few decades the fat content of meat has been reduced to satisfy consumer demand
and as the fat content changed, the fatty acid profile of meat also changed. The percentage
saturated fat of red meat is now lower than ever (Higgs, 2000) with the fat in lamb being about
51%, pork and beef being less than 50% and poultry being about 31% saturated.
7.3.1. Saturated fatty acids
A decreased saturated fatty acid intake is associated with a lowering of blood serum
cholesterol levels, which in turn lowers the risk of cardiovascular heart disease. The main
saturated fatty acids found in red meat are palmitic (C16:0) and stearic (C18:0) acid
(Schönfeldt, 1993; Higgs, 2000; Melanson et al., 2003). Stearic acid is seen as neutral and
does not display the cholesterol elevating effects of other saturated fatty acids. Schönfeldt
(1993) identifies myristic (C14:0) and palmitic acids as the culprits usually responsible for
increased cholesterol levels and Valsta et al. (2005) concurs. In general, myristic acid is seen
as the most atherogenic and has four times the cholesterol-raising potential of palmitic acid
(Higgs, 2000). Therefore, a decrease in myristic and palmitic acids will be quite beneficial
while either a decrease or increase in stearic acid should not have any affect on serum

Literature review Chemical properties of meat
39
cholesterol levels. Luckily only minor amounts of myristic acid are present in meat (Higgs,
2000), with Valsta et al. (2005) estimating it to be less than 6%.
7.3.2. Mono-unsaturated fatty acids
The principal mono-unsaturated fatty acid in meat is oleic acid (C18:1) and Higgs (2000)
reports that mono-unsaturated fatty acids constitute about 40% of the fat in meat.
Trichopoulou, Costacou, Bamia and Trichopoulos (2003) reported that oleic acid is consumed
in high quantities when the traditional Mediterranean diet is eaten. The traditional
Mediterranean diet is associated with improved health, such as a lower risk of cardiovascular
disease. Meat is one of the best sources of mono-unsaturated fatty acids in the diet and
replacing meat with dairy products (as in a vegetarian diet) may cause the fatty acid profile to
worsen because dairy products have higher myristic acid and less mono-unsaturated fatty
acids than red meat.
7.3.3. Polyunsaturated fatty acids
Generally it is believed that higher polyunsaturated fatty acid consumption, as opposed to
saturated fatty acid consumption, leads to better health. However, in the last few years it has
been found that not all polyunsaturated fatty acids are beneficial (Gibney and Hunter, 1993).
Immunologists showed that omega-6 (n-6) polyunsaturated fatty acids (e.g. linoleic acid) are
less advantageous than the omega-3 (n-3) polyunsaturated fatty acids (e.g. linolenic acid,
EPA and DHA). During the post-absorptive metabolism of n-6 fatty acids in humans, pro-
inflammatory eicosanoids are produced. Inflammatory responses are important factors in
cardiovascular heart disease- and cancer-development (Gibney and Hunter, 1993). The n-3
fatty acids can act as modulators to this inflammation because of the competition between n-3
and n-6 metabolites for inclusion in the immune cells’ phospholipids. Furthermore, in the
GISSI investigation (Gissi-Prevenzione Investigators, 1999) an inverse relationship between
serum phospholipid concentrations of eicosapentaenoic acid (EPA) and docosahexaenoic
acid (DHA) and cardiovascular heart disease risk was found.
Conjugated linoleic acid (CLA) is a mixture of geometric and positional isomers of linoleic acid
(Higgs, 2000). Useful levels of CLA are only found in dairy products and meat, with ruminant
meat being the richer source. Higgs (2000) estimates that 76 to 93% of meat and milk CLA is
in the cis-9, trans-11-octadienoic acid form. MacRae, O’Reilly and Morgan (2005) explains
that CLA is formed as an intermediate metabolite when unsaturated linoleic acid (C18:2)
undergoes bio-hydrogenation to form saturated stearic acid (C18:0) during rumen
fermentation. This then, is the reason why CLA is generally considered as a ruminant product
and why ruminant products (milk, cheese, beef, etc.) have higher CLA contents than non-
ruminant products.

Literature review Chemical properties of meat
40
CLA has contributed to various beneficial actions in animal health – it can improve plasma
lipoprotein composition, reduce adiposity and significantly modulate immunity (MacRae et al.,
2005) – and while findings in human health varied, the potential benefit of CLA to human
health is encouraging. Higgs (2000) reported that CLA-inclusion into an animal’s diet,
regardless of the amount and type of fat consumed, had anti-mutagenic activities in test
animals.
Trans-fatty acids are omega-6 fatty acids produced when vegetable oil is hydrogenated
(Ronco, De Stefani and Fabra, 2003) and displays physical properties similar to saturated
fatty acids. Trans-fatty acids raise serum cholesterol and triglyceride concentrations.
7.3.4. Omega-6:omega-3 ratio
The balance between omega-6 and omega-3 fatty acids is very important for human health
and a n-6:n-3 ratio of 2-3:1 is recommended (Ronco et al., 2003). The recommendation
made by the British Department of Health (1994) for n-6:n-3 ratio is less than 4.0. An excess
of n-6 fatty acids may lead to the onset of coronary heart disease and cancer because of its
pro-inflammatory aspects (Gibney and Hunter, 1993). The n-3 fatty acids have the ability to
counteract the negative effects of the n-6 fatty acids. Ruminant meat is a very good source of
n-3 fatty acids and has a low n-6:n-3 ratio, especially the meat derived from grass-fed animals
(Wood et al., 2004).
7.3.5. Polyunsaturated: saturated fatty acid ratio
The recommended polyunsaturated: saturated fatty acid (P:S) ratio should be above 0.4
(Wood et al., 2004) – the British Department of Health (1994) recommends a P:S value of
0.45. The P:S value normally found in meat, reports Wood et al. (2004), is 0.1. Higher values
have been reported for springbok (1.114 ± 0.13; Kroucamp, 2004), blesbok (1.00 ± 0.39; Smit,
2004), red hartebeest (0.75 ± 0.46; Smit, 2004) and black wildebeest (1.09; Van Schalkwyk,
2004).
7.3.6. The effect of animal diet on fatty acid composition
Animal diet can effect major changes in the fatty acid profile of meat. The biggest difference
caused by diet is seen in the meat from animals fed grain-based diets (concentrates) and
those consuming grass (pasture). Several authors (Kemp, Mahyuddin, Ely, Fox and Moody,
1981; Enser et al., 1997b; Lengyel et al., 2003; Wood et al., 2004) reported the differences in
the fatty acid profiles of animals following these two distinctive feeding regimes. The most
important difference is found in the linolenic acid levels and long chain n-3 polyunsaturated
fatty acids, which is much higher in grass-fed beef and lamb (Wood et al., 2004). The grass-
fed animals also have higher anti-oxidant levels that prevent oxidation of the polyunsaturated
fatty acids. On the other hand, animals on a grain-based diet have higher n-6
polyunsaturated fatty acid concentrations. The reason for this major difference in fatty acid

Literature review Chemical properties of meat
41
composition between grass- and grain-based diets is the high levels of α-linolenic acid
(C18:3n-3) present in grass, while grains have higher linoleic acid (C18:2n-6) levels (Marmer
et al., 1984, as referred to by Enser et al., 1997b). Enser et al. (1997b) found the linoleic acid
levels in grain-fed beef and lamb to be 2.5 times higher than in grass-fed animals, but
astonishingly enough, the α-linolenic acid levels in grass-fed animals were 3.1 times higher
than in grain-fed animals. Oleic acid (C18:1) was 1.6 times higher in the longissimus muscle
of grass-fed animals and all other fatty acids, except the n-6 polyunsaturated fatty acids, were
generally higher in grass-fed animals.
Supplementing animal diets with n-3-rich foodstuffs may lead to better n-6:n-3 ratios in meat.
Wood et al. (2004) achieved just that when they supplemented pig diets with linseed. Their
results confirmed similar results by Enser, Richardson, Wood, Gill and Sheard (2000) who
found that n-6:n-3 ratios in pork could be lowered close to the recommended value (<4.0) by
adding crushed whole linseed to the diet. Vatansever et al. (2000) studied the effect of
linseed and fish oil as additions to meat animal diets and found that linolenic acid in the
phospholipids of linseed-fed meat doubled in comparison to controls. This led to higher levels
of EPA, but not DHA. However, in the fish oil and linseed/fish oil diets, both EPA and DHA
increased. Meat from the fish oil-containing diets was more prone to oxidation than control or
linseed diets.
If pigs are fed unsaturated fatty acids, the saturation of pork fat decreases, but in order to
cause similar changes in ruminant fat, protected unsaturated fatty acids must be fed (Melton,
1990). Protection against changes in the rumen is necessary if fatty acid changes are to be
achieved in this way.
7.3.7. The effect of fatty acids on cholesterol levels
Some fatty acids (e.g. myristic and palmitic) have the ability to increase serum cholesterol
levels, while others (e.g. arachidonic) may lower serum cholesterol levels (Viljoen, 1999;
Higgs, 2000). Nelson et al. (1995) suggest that all 12 to 16 carbon atom saturated fatty acids
increase blood total-, low-density lipoprotein (LDL)- and high-density lipoprotein (HDL)-
cholesterol levels, as well as the LDL:HDL ratio. Most n-6 polyunsaturated fatty acids lower
LDL-cholesterol levels, while most mono-unsaturated fatty acids are neutral as pertaining to
plasma cholesterol levels (Nelson et al., 1995).
7.3.8. The effect of fatty acids on fat firmness
The concentration of stearic acid (C18:0) is closely associated with the carcass fat firmness
and the melting point of lipid in beef, lamb and pork (Wood et al., 2004). Fat firmness is very
dependent on the melting points of the different fatty acids, for example stearic acid (C18:0)
melts at 69.6ºC, oleic acid (C18:1) at 13.4ºC, linoleic acid (C18:2) at -5ºC and linolenic acid
(C18:3) at -11ºC (Wood et al., 2004). Enser (1984) reports that melting points increases as

Literature review Chemical properties of meat
42
saturation decreases, thus, fat containing more unsaturated fatty acids has a lower melting
point and is softer than fat containing more saturated fatty acids, which will be harder.
7.3.9. Gender differences in fatty acid composition
There are definite differences in the fatty acid composition between males and females within
species. In crossbred sheep lambs Kemp et al. (1981) found the subcutaneous fat of ewes to
contain more total unsaturated fatty acids and higher levels of oleic acid than that of wethers,
while rams contained higher amounts of total unsaturated fatty acids and palmitoleic acid, but
lower stearic acid levels than wethers. However, the intramuscular fat of rams showed higher
levels of palmitoleic, linoleic and linolenic acids than that of wethers.
In the M. longissimus dorsi of the black wildebeest and mountain reedbuck, Van Schalkwyk
(2004) reported males to have slightly higher percentages of saturated and polyunsaturated
fatty acids, but females contained higher percentages mono-unsaturated fatty acids. On the
other hand, Smit (2004) reported higher values (mg/100 g) of saturated and polyunsaturated
fatty acids in blesbok females compared to males, with nearly the same trend in red
hartebeest, except for saturated fatty acids being slightly higher in males. In springbok M.
longissimus dorsi, the intramuscular fat of males contained higher percentages saturated and
mono-unsaturated fatty acids, while females had a higher percentage of polyunsaturated fatty
acids (Kroucamp, 2004).
7.4. Crude Protein
MacRae et al. (2005) observed that the nutritive value of animal proteins is higher than that of
plant proteins. That is to say, if it is considered in terms of protein efficiency ratio, which is
defined as weight gain per unit protein consumed, or in terms of biological value, which refers
to the nitrogen retained per unit nitrogen absorbed. This was in corroboration with the view of
Higgs (2000) who commented on the high biological value of meat protein and its rich store of
essential amino acids.
Game meat is generally declared to have a fairly high protein content and was shown by
several authors (Table 11) to be higher than other red meat species. Onyango et al. (1998)
found the crude protein percentage in the loin of three other game species (Kongoni, 22.4 ±
0.8; Oryx, 20.3 ± 0.4; Zebra, 22.8 ± 0.7) to be slightly higher than that of beef (19.4±0.4).
Clearly the protein contents of the game species are much higher than that of specifically mutton
and pork, which is probably a reflection of the higher fat contents found in the latter two species as
opposed to the game species.

Literature review Chemical properties of meat
43
Table 11 Protein value of several game species in comparison to that of domesticated
species.
Species Protein content of carcass (g/kg)
Protein (%)
Black Wildebeest - 19.42 (male) 3
Blesbok 23.51 22.39 (male) 4
Impala 22.51 -
Mountain reedbuck - 23.68 (male) 3
Springbok 23.71 -
Beef 19.22
Mutton 13.92
Ostrich 21.12
Pork 13.92
(1Van Zyl and Ferreira, 2004; 2Sayed et al., 1999; 3Van Schalkwyk, 2004; 4Smit, 2004)
7.5. Ash
The ash content of a meat sample represents the mineral contents of that sample. AOAC
(1997) methodology for ash determination is to ash the moisture-free weighed meat sample
for 5-6 h at 500ºC. The sample should be allowed to cool down in a moisture-free
environment and weighed to determine the ash percentage.
Kroucamp (2004), Smit (2004) and Van Schalkwyk (2004) worked on game meat and the ash
values found by them are quite low (Table 12). Van Schalkwyk (2004) declared the ash
percentage of game meat to be higher than that of domesticated animals.
Table 12 Ash content (g / 100 g) of several game species
Species Black Wildebeest (male)
Blesbok (male)
Mountain reedbuck (male)
Springbok
(male)
Ash 1.291 1.262 1.231 1.24 ± 0.043
(1Van Schalkwyk, 2004; 2Smit, 2004; 3Kroucamp, 2004)
7.6. Mineral content
The mineral content of meat is very important as it provides several minerals that are vital in
human nutrition (Higgs, 2000; MacRae et al., 2005; Biesalski, 2005). Red meat has a high
iron content (Higgs, 2000) and Lawrie (1998) reported potassium and phosphorus to be the
two minerals most often found in the highest quantities in meat. Higgs (2000) stated that
meat also provides useful amounts of copper, magnesium, cobalt, chromium and nickel.

Literature review Chemical properties of meat
44
7.6.1. Iron
The reason why red meat is considered to be such an excellent iron source is due to the fact
that 50-60% is found in the haem form (Higgs, 2000). Haem iron is absorbed more effectively
since its absorption in meat is through a more efficient mechanism than that of non-haem iron
in plants. Iron in meat is unaffected by iron-inhibitors, such as phytate in cereals, and Higgs
(2000) therefore calls it an “assured source of iron” with good reason. Not only is iron-
absorption from meat higher (15-25%) than that of plant foods (1-7%), meat also enhances
iron-absorption from plant foods.
Wells, Haub, Fluckey, Williams, Chernoff and Campbell (2003) found no differences between
the total iron-intake of vegetarian (lacto-ovo) diets and beef-containing diets. They did,
however, find that the bioavailability (the degree to which dietary iron is absorbed and made
available for use or storage in the body) of iron was three to four times higher in the beef-
consuming group than in the vegetarian group. These authors ascribed the higher
bioavailability of iron in meat to the presence of haem iron, and also an enhancing factor, that
causes iron to be absorbed and retained in greater percentages. MacRae et al. (2005) also
found the bioavailability of meat iron to be higher than the iron of plant foods (20-30% vs.
<10%). Iron is an essential ingredient in numerous biological processes (as it can act as a
biological catalyst) and a few were listed by Biesalski (2005) as being essential for gas
exchange through haemoglobin (at tissue and cellular levels) and oxygenation of myoglobin
(in skeletal muscle); supportive of oxidative metabolism; involved in cellular energy
metabolism via iron-containing enzymes; and involved in host-defence responses via iron-
containing enzymes.
7.6.2. Zinc
Zinc is essential in the action of some enzymes (i.e. metalloenzymes) and is important in cell
growth and -replication, osteogenesis and immunity (Biesalski, 2005). It was observed that
cancer patients have lower Zinc-levels. Higgs (2000) declared red meat one of the best Zinc
sources, along with poultry and seafood. Higgs (2000) observed that meat has a big
influence on the Zinc-status of the diet because Zinc bioavailability is increased when its
intake occurs in the presence of meat proteins. Phytate and oxalate, which can be found in
fairly high amounts in some plants, inhibit Zinc bioavailability.
7.6.3. Selenium
Biesalski (2005) stated that selenium (Se) is important for its role in the active site of the
glutathione peroxidase enzyme that plays a vital role in the mechanism that causes oxygen
metabolism and detoxification. Studies with selenium (organic and inorganic) enlightened the
role it can play in tumour growth inhibition, through inhibiting the proliferation of both normal
and malignant cells. Selenium is also recognised as one of the main antioxidants that are
reported to protect against coronary heart disease (Higgs, 2000). According to Higgs (2000)

Literature review Chemical properties of meat
45
meat provides about 25% of the daily selenium requirements (10 µg Se / 100 g meat) and
Biesalski (2005) estimates that 17% of the total selenium in the American diet is provided by
beef.
7.6.4. Mineral content of game meat
Niemenin (1992) found game meat contained higher quantities of the macro minerals calcium,
magnesium and potassium, and the trace elements iron, copper and selenium than meat from
domesticated animals. The values of eight minerals present in meat from different game
species have been reported by several authors (Table 13).
Table 13 Mineral content (mg/100 g meat) of several game species.
Minerals Black Wildebeest (male)
Blesbok (male)
Mountain reedbuck (male)
Springbok (male)
Phosphorus 194.431 145.312 207.771 148.55 ± 9.533
Potassium 189.721 150.472 204.601 121.75 ± 5.633
Calcium 6.981 6.932 8.041 79.24 ± 23.033
Magnesium 22.041 20.402 25.251 17.77 ± 1.083
Sodium 14.481 15.822 16.931 14.12 ± 0.673
Iron 3.641 3.962 4.611 2.74 ± 0.213
Copper 0.111 0.272 0.151 0.09 ± 0.013
Zinc 1.001 1.482 1.751 1.29 ± 0.083
(1Van Schalkwyk, 2004; 2Smit, 2004; 3Kroucamp, 2004)
7.7. Micronutrient content
Red meat is a very valuable dietary source of micronutrients such as zinc, selenium and
calcium (MacRae et al., 2005; Higgs, 2000). All B-vitamins (except folate and biotin) are
found in useful amounts in meat, pork being one of the best sources of thiamine. Only foods
of animal origin provide the body with vitamin B12 (cobalamin) and the active form of vitamin
A, retinol (Higgs, 2000; Melanson et al., 2003). Some micronutrients, such as iron and folic
acid, found both in meat and plants have better bioavailability when derived from meat
(Biesalski, 2005). All the micronutrients found in meat are necessary for the maintenance of a
healthy immune system and also assist in the prevention of various non-communicable
diseases (MacRae et al., 2005).
8. Sensory quality
8.1. Analytical sensory work (Trained taste panel)
In analytical sensory analysis, panellists are trained to evaluate specific attributes of certain
products and while test conditions are generally far removed from normal conditions they are
designed to improve panellists’ sensitivity, reliability and consistency. Generic descriptive

Literature review Sensory quality
46
analysis is usually employed during analytical sensory analysis (Moskowitz, 1984; Stone and
Sidel, 1993; Lawless and Heymann, 1998).
Chollet, Valentin and Abdi (2005) showed that trained panellists performed much better than
novices in discriminating between learned beers, but not for new beers, and that trained
panellists performed a matching task much better than novices for both learned and new
beers. From these results they concluded that it is more difficult to generalise perceptual (or
observation) learning than verbal learning. It was postulated that trained panellists used a
better strategy during the matching task than novices. When asked to describe a new beer,
trained panellist used the attributes and terminology they were trained to use when describing
learned beers, thus they activated and applied an existing list of terminology, while novices
generated terms based on the sensations experienced while tasting the beer. Rabin (1988)
showed that panellists trained in a certain odour task, could adapt and use the knowledge
learned during training to describe new odours and to perform new tasks. Trained panellists
performed better than novices when asked to perform discrimination tasks.
8.1.1. Panel composition and training
Screening of potential panellists is very important (Stone and Sidel, 1993; Lawless and
Heymann, 1998). Firstly, all panellists should have normal sensory acuity, which can be
tested using various methods. Testing normal sensory acuity for food products includes
testing the panellists’ ability to identify the basic tastes correctly, testing their ability to rank
intensities of the basic tastes and their ability to identify odours appropriate to the product.
After establishing sensory acuity, further screening of potential panellists should be done
using the product type that will be tested. Methods similar to those that will be used during
testing should be utilised and each panellist’s reproducibility should be determined through
the use of replications, the number of which should also be predetermined.
Before proper analysis can be started, panellists should be trained on the methods that will be
used, including interpretation and use of the questionnaires and the terminology used. During
training, panellists should be familiarised with the questionnaire used and the terminology and
anchors should be refined and settled upon (Stone and Sidel, 1993; Lawless and Heymann,
1998). Panellists should also be introduced and familiarised with the products to be tested.
This includes showing panellists reference standards of the products, as well as providing
verbal definitions for all attributes tested. During training, the panel should also be taught the
language used, or must be allowed to formulate their own terminology for the attributes or
products tested (Lawless and Heymann, 1998). Characteristics tested should be clearly
defined and there should be no redundancy. Combination terms such as creamy, soft or
fresh should be either completely discarded or broken down into the different contributing
components.

Literature review Sensory quality
47
Right after final training, panellist reproducibility should be tested by serving them with a
triplicate of the product to be tested, using a subset of the samples to be used during the
actual testing. If the panellists are well trained, there should be no significant differences
between the tests of each panellist of amongst panellists. Panellists who differ significantly,
should be retrained or eliminated from the panel (Lawless and Heymann, 1998).
8.1.2. Sample preparation and presentation
The proper methodology for cooking meat for sensory analysis is given by AMSA (1995). It is
suggested that samples be oven roasted at around 160 ºC to an internal temperature of 71ºC.
However, since the internal temperature still increases in the few minutes after the sample
has been removed from the oven, it is wise to remove samples when it reaches an internal
temperature about 5ºC lower than the target internal temperature (71ºC). Bejerholm and
Aaslyng (2003) compared the sensory analysis results of meat samples prepared by cooking
to different internal temperatures and found that meat with an internal temperature of 65ºC
was better suited to studies that dealt with flavour components, but cooking to an internal
temperature of 75ºC will provide a better sample for an overall discrimination in sensory
characteristics. When cooking method and temperature were considered, oven cooking at
low temperatures (90ºC) resulted in the most tender and juicy meat.
Before wrapping and coding samples, all surfaces that were exposed to the cooking
environment should be removed from the sample so as to avoid bias and minimise the
variation in samples (AMSA, 1995).
Avoiding bias in sensory testing is very important, therefore it is standard practice to use blind
labelling of samples using random three-digit codes and to randomise the order in which
samples are tested (Lawless and Heymann, 1998).
8.1.3. Sensory quality characteristics
8.1.3.1. Aroma
Only a small amount of the volatile compounds present in meat possess meaty aroma
characteristics and these are primarily sulphur-containing compounds (Shahidi, 1998).
Mottram (1998) lists the non-species related meat aroma characteristics as: the characteristic
meaty aroma of all cooked meats, roast meat and fatty aromas. Species-specific aromas are
related to the fat composition of each species and aldehydes are probably involved, as
aldehydes are one of the chief lipid degradation products.
Meaty aroma is primarily caused by sulphur-containing compounds. Although most of these
compounds are present at low levels, they have low odour thresholds (Mottram, 1998).
Furans with a thiol group (at position 3) and disulphides formed from the oxidation of furan

Literature review Sensory quality
48
and thiophene thiols (these are often used in simulated meat flavourings) also contribute to
meaty aroma. Roast meat aroma is associated with heterocyclic compounds (e.g. pyrazines
and thiazoles) formed during the Maillard-reaction. When roast and boiled beef were
compared, boiled beef showed higher levels of aliphatic thiols, sulphides and disulphides.
Fatty aroma is caused by the lipid fraction in meat – aldehydes, ketones and lactones all
contribute to the fatty aromas that may be detected in cooked meat (Mottram, 1998).
During sensory evaluation of meat, panellists may be asked to evaluate several aromatic
characteristics linked to meat, such as intensity of species-specific aroma (e.g. Beef aroma
intensity), generally performed by smelling the samples (AMSA, 1995).
8.1.3.2. Juiciness
The juiciness of meat is related to its intramuscular lipid and moisture content. Warriss (2000)
states that, while lipids act as lubrication and is responsible for tenderness, it is actually the
remaining water after cooking that is responsible for juiciness. Cover, Ritchey and Hostetler
(1962b) reported two types of moisture present in meat: 1) relatively free moisture that can be
pressed out as juice, and 2) adsorbed water. The adsorbtion levels of water may vary greatly,
but the authors postulated that large amounts of bound moisture might be responsible for
softness to tongue and cheek, while hardness may be related to smaller values of adsorbed
moisture. According to Von la Chevallerie (1972), because of its low fat content, game meat
is perceived as less succulent than beef. For that reason, there is an overall perception of
game meat as dry. But this is not a valid assumption to make because the moisture levels of
game meat compares favourable with that of beef and thus, game meat handled and
prepared correctly, should have the same juiciness as beef.
In sensory analysis, juiciness may be evaluated in different ways, such as the initial
impression of juiciness, performed by pressing the sample to observe the amount of fluid
exuding from the cut surfaces, and sustained juiciness, which is based on the impression
formed after the first two to three chews (between the molars) of the sample (AMSA, 1995).
8.1.3.3. Tenderness
Tenderness has been discussed previously. The evaluation of tenderness in analytical
sensory panels consists of evaluating the impression of tenderness at first bite, after the first
two to three chews between the molar teeth, and the amount of residue left in the mouth after
20 to 30 chews (AMSA, 1995). When the amount of residue left over in the mouth is high, it is
generally accepted that the sample is tougher than samples where there is very little residue.
8.1.3.4. Flavour
Flavour has an important role in sensory evaluation – because it encompasses both smell
and taste properties, it is quite important in the evaluation of overall acceptability (Shahidi,
Literature review Sensory quality
49
1998). Meat flavour is influenced by the combined influences of taste and smell, while
juiciness and mouth feel may also contribute to the overall flavour (Mottram, 1998). Amino
acids, peptides and nucleotides contribute to taste and flavour by interacting with other flavour
components, producing flavour volatiles and contributing to sweet, salty, bitter and sour taste
sensations of meat (Shahidi, 1998).
Meat is rich in aroma and flavour precursors (non-volatile precursors include reducing sugars,
free amino acids and vitamins) and flavour enhancers, all of which are heightened by heating
(Shahidi, 1998). Raw meat has very little flavour, but when meat is heated several
interactions occur between the different components contributing to flavour. Mottram (1998)
notes two categories of meat flavour precursors: 1) water-soluble, including peptides, amino
acids, carbohydrates and thiamine, and 2) lipid components such as branched
polyunsaturated fatty acids. The Maillard reaction (between amino acids and reducing sugars
in which mainly cysteine and ribose are involved) and thermal degradation of lipids are the
two most important causative actions of aroma volatiles (Mottram, 1998; Shahidi, 1998).
Huang and Ho (2001) identified several of the precursors involved in meat flavour: Inosine
manophosphate (IMP), forms sulphur-containing compounds; thiamine, forms methyl-3-
furanthiol and bis- (2-methyl-3-furyl) disulfide, which are both meat aroma components;
Strecker aldehydes, cooked beef components; fatty aldehydes, the largest contributor to
cooked meat volatiles; and carbohydrate degradation products, several carbonyls are formed
when carbohydrates are heated.
The flavour of cooked meat is usually species-specific and this is mostly due to the fat
composition of the species (Shahidi, 1998). For example, the fatty acids 4-methyl nonanoic
and 4-methyl octanoic acids are mutton-specific and contribute to the distinct flavour of
mutton. Huang and Ho (2001) found similar aromas (basic meat flavour) on heating water-
soluble (no fat) beef, pork and lamb extracts. However, when the fat of these three species
were heated, the species-specific aromas could be easily detected. In a taste test of lean
beef and pork, adding 10% fat to the lean meat sample caused panellists to identify the lean
meats more easily.
Red meat flavour can be affected by animal nutrition. Grass-fed animals generally produce
meat with less acceptable flavour than high-energy grain-fed animals (Melton, 1990). Meat
from animals on the high-energy grain diet also had a more intense flavour. Grass-fed
animals have higher levels of n-3 and lower levels of n-6 polyunsaturated fatty acids, which
might explain the flavour-difference since fatty acids act as precursors for certain flavours.
When it comes to flavour, meat species differ in acceptability (Von la Chevallerie, 1972).
Often game meat is perceived as having a ‘gamey’ flavour that is not acceptable to all
consumers. This ‘gamey’ flavour can be linked to several factors: meat from old male animals

Literature review Sensory quality
50
(it is common in South Africa for trophy hunters to shoot older male animals); spoilage of
meat by incorrect slaughtering and bleeding methods; progressive stage of meat ripeness;
and/or high polyunsaturated fatty acid levels present in meat (Pietersen, 1993; Jansen van
Rensburg, 1997). Von la Chevallerie (1972) detected no ‘gamey’ flavours in meat from
correctly bled and hung carcasses.
Even within game meat species differences in flavour acceptability occurs – Von la
Chevallerie (1972) found springbok flavour was preferred and the least acceptable flavour of
the seven species studied was attributed to red hartebeest. During analytical sensory
evaluation panellists are normally asked to rate the overall flavour of the sample and it is
described as a combination of taste and swallowing (AMSA, 1995).
8.2. Consumer panel work
The main reason for doing consumer sensory testing is to establish how consumers (current
or potential consumers) will react to a product, a specific attribute of a product or a product
idea (de Kock, 1993). The consumer reaction can determine acceptance, preference or both.
Munoz (1997) adds that consumer opinion on products can also be valuable in testing
products. Companies usually interpret and use information gathered from consumer testing
to answer questions on marketing or research since consumer information is considered most
important when product decisions on developing and marketing of new products are made
(Munoz, 1997). If companies want to test the acceptance level of a product, consumer-liking
tests can be used. During consumer sensory evaluation, target consumers are used to
determine degree of liking, preferences and sometimes purchase intent and to study the
responses or emotional reactions displayed by consumers to the food tested (Resurrecion,
1998).
There are several factors to consider when dealing with consumer evaluation. Since
consumers are not trained to make unbiased evaluations of attributes, they always evaluate
products with a frame of reference in mind (Lawless, 1995). Another potential problem is
representation, but this will be addressed when panel composition is discussed.
It is important to ensure that the correct criteria are being tested because consumers are used
to interacting with several exterior factors when dealing with any product. Factors that may
potentially bias consumers are brand and the price-to-quality-ratio. Therefore, blind labelled
testing is best for testing the sensory characteristics of a product, while it would tell you
nothing about how a product would fare in a real-life situation when different brands and
price-classes are also competing with a product. Munoz (1997) cautions that consumer data
should be used in conjunction with other product information (such as descriptive analysis
data, physical or chemical data, demographics and company employee consumer data),

Literature review Sensory quality
51
rather than on its own. This ensures that consumer data is better interpreted and fully
understood.
Several authors have noted consumers’ tendency to give an overall score to a product
(Lawless and Claassen, 1993; Lawless, 1995). Consumers will generally treat individual
attributes on a questionnaire as if they were interrelated. Therefore, better information will be
gained from asking consumers for their overall impression during testing.
Extrinsic cues such as brand, product labelling or ingredients used can influence consumers’
attitude towards a product. In a restaurant-based study by Wansink, Painter and van Ittersum
(2001), two sets of six products were prepared according to the same recipes, but one set
were labelled using descriptive names (e.g. Succulent Italian Seafood filet), while the second
set used more basic names (e.g. Seafood filet). Products with descriptive names were
chosen 27% more often during the six weeks of testing. The quality of food with the
descriptive names was rated higher than their counterparts with basic names. This study
shows how vulnerable consumers can be to suggestibility and therefore, it is important to
control extrinsic cues when testing sensory characteristics alone (Wansink, 2003).
The four types of consumer panels most frequently used are employee panels, standing
external panels, central location panels and home-use panels (Lawless and Heymann, 1998).
Employee and standing external panels are used repeatedly over time, while central location
and home-use panels use random consumer selection and the panel is only used for one test.
8.2.1. Panel composition
A potential problem is representation. The consumer group used in a testing session must
represent a valid reference group – the target population – for example, when testing meat
characteristics, use meat eaters, not vegetarians (Lawless, 1995; Lawless and Heymann,
1998; Resurreccion, 1998). The target population is defined as the consumers who would
purchase and use the product being tested. Significant differences were found between
heavy, light and non-users of canned soup (Wansink and Park, 2000), which shows that
consumption rates and previous experience will influence sensory experience. Since
consumers’ prior experience with a product category can bias their taste and opinion,
Wansink (2003) advises choosing (or screening) potential participants of consumer testing,
which will also lower variance of the data. Asking potential panellists about the frequency at
which they use the product being tested is the easiest way to determine whether or not they
belong to the target group. Furthermore, Resurreccion (1998) advises 50 to 100 consumers
as the most likely response-size where significant differences would be well detected.

Literature review Sensory quality
52
8.2.2. Questionnaire design
When considering questionnaire design, asking for overall opinion takes less time and
eliminates the possibility of taster’s fatigue setting in. Lawless (1995) also advises against
using double-barrelled questions such as “Do you think game meat is healthy and less
fattening?” Questions like this might only serve to confuse consumers or cause them to score
products differently than they otherwise would have.
The 9-point hedonic, or degree-of-liking, scale (1 = dislike extremely; 2 = dislike very much; 3
= dislike moderately; 4 = dislike slightly; 5 = neither like, nor dislike; 6 = like slightly; 7 = like
moderately; 8 = like very much; 9 = like extremely) is the most commonly used hedonic scale
(Moskowitz, 1984; Lawless and Heymann, 1998). It is simple and easy to use and to
understand. The 9-point hedonic scale is reliable and has a high stability of responses,
irrespective of region, but its effectiveness in other languages has not been widely
investigated. This scale, according to Lawless and Heymann (1998), has ruler-like properties
(psychologically) because of the equal interval spacing of the words chosen for each point.
This is a very important aspect, since it allows the sensory scientist to assign numerical
values to the choices made by the consumer, which makes statistical analysis of the data
much easier. The hedonic scale assumes that consumer preferences exist on a range and
that it can be categorised by responses based on likes and dislikes. Resurreccion (1998)
reports that preference tests are useful tools when consumers are asked to compare two
products against each other, but cautions that, while consumers may detect differences
between products, they cannot identify differences within specific characteristics.
8.3. Findings of Trained panel tests vs. Consumer panel tests.
Because consumer evaluation of a product focuses mainly on an overall impression, it is not a
very reliable testing mechanism for testing the contribution of individual characteristics of the
product. In that regard descriptive analysis performed by trained panels is much more
reliable (Lawless, 1995). Munoz (1997) concurs that a trained panel can provide specific
product information that can be used to better interpret and understand consumer responses
when it is related to consumer data.
Although data gathered from analytical sensory testing can be correlated to consumer
opinions, trained panels mostly do not represent consumers accurately and there are
discrepancies on the accuracy of the regression of consumer acceptance against
descriptively analysed attributes (Lawless, 1995).
Trained panellists are better equipped to detect and quantify differences in the characteristics that
they are trained to investigate. However, Moskowitz (1984) stated that it is very important to keep
in mind that, if consumers are not able to detect differences between products when trained
panellists are able to do so, it means that the differences detected by the trained panellists are not

Literature review Sensory quality
53
as relevant when the products are consumed by the consumer, away from a laboratory
environment.
9. Consumers
The consumer’s perception of food is compiled from the inherent attributes of the food, its
interaction with the immediate external factors surrounding it and the previous experience of
the consumer (Dransfield et al., 1998).
Several models for consumer perception of food have been proposed over the years. Pilgrim
(1957) stated that food perception depended on three factors: properties of the food;
perception of sensory attributes; and environmental factors. The model proposed by
Steenkamp (1997) focuses more on the consumer’s decision making and is based on four
stages: need recognition; search for information; evaluation of alternatives; and choice. This
author found that consumers were more concerned about the consequences or benefits that
products would bring instead of product attributes. While meat attributes can be defined as
the physical qualities (concrete, such as fatty acid composition, or abstract, such as
fattening), consequences and benefits are related to product use and is a representation of
what the consumer perceives the product to be doing for him or her.
Bocker (1997) found that a consumer’s overall impression of a product is based on a
compensatory decision rule. This means that the presence of highly valued attributes in a
product can compensate for the lack of certain attributes or the presence of unsatisfactory
attributes. The overall impression formed during consumption is usually most important for
food products.
Consumers make food decisions based mostly on three types of factors: characteristics of
the food product (supplied by industry); factors related to the person engaged in food
consumption; and environmental factors (Steenkamp, 1997). The means-end theory
(Audenaert and Steenkamp, 1997) suggests that consumers view products as a way through
which they can attain certain valued outcomes (“ends”). In other words, the reason why
consumers demand certain products is not related simply to either the product or the
consumer, but to the consequences (linked to life values) that will be reached by consuming
these products.
Consumer-involvement is defined by Verbeke and Vackier (2004) as the “level of perceived
personal importance, interest or relevance evoked by a stimulus/stimuli, which are linked by
the consumer to enduring or situation-specific goals.” A consumer’s behaviour can be greatly
explained by his involvement in a product. The stimuli involved can be anything from the
products themselves, brands, and advertisements to the purchase decisions made by the
consumer. It is more likely that consumers will be involved in products with a high potential

Literature review Consumers
54
reflection on self-image and those products usually at high cost or risk and/or high social
pressure (Verbeke and Vackier, 2004). The level of involvement can explain many of the
steps in the decision-making process of consumers. These steps may include: length of the
decision-making process, extensiveness of information search, attitudes and intentions and
formation of beliefs. Several behavioural outcomes such as brand switching, brand
commitment or loyalty, variety-seeking behaviour, shopping enjoyment and frequency of
product usage can also be attributed to involvement level (Verbeke and Vackier, 2004).
A low level of involvement excludes extensive information processing, but rather associates
with routine, impulsive or habitual behaviour. On the other hand, Vebeke and Vackier (2004)
list the steps taken at a high level of involvement as: an active search, information use after
careful processing, weighing and evaluating product characteristics prior to forming beliefs
and developing an attitude. All these steps are necessary before the consumer can move on
to behavioural intentions and actual behaviour because high involvement requires extensive
problem solving.
Most food products, especially low-priced and frequently purchased products, are considered
as low involvement products. That is because most food products are associated with a low
potential reflection of self-image and low social pressure, with some exceptions, mainly risk-
associated – whether it is real or perceived. Such risks include products with possible health
implications and the probability of making a wrong choice (Verbeke and Vackier, 2004). Meat
is one of the exceptions to the usual food-involvement rule, especially since meat has
attained its negative image associated with various health risks. Meat is still perceived as
having a high hedonic or pleasure value, even though its perceived symbolic value is fairly
low. Verbeke and Vackier (2004) have found that in general consumers viewed the pleasure
value of fresh meat as dominant over symbolic value, risk probability and risk importance.
9.1. Meat consumers
In the last few years, consumers have been attaching more value to attributes such as animal
welfare, animal feeding assurance and environmentally friendly production practices, mostly
because of concerns about health, safety and ethical factors being given new urgency by
various groups (Bernues, Olaizola and Corcoran 2003b). Several authors have noted that
consumers’ perception of food quality, especially meat quality, is changing and that
consumers are becoming more demanding about quality (Issanchou, 1996; Grunert, 1997;
Bernues, Olaizola and Corcoran 2003a). There has been a shift away from focussing on the
product, to rather focussing on the quality of the production process, especially since issues
such as animal welfare, ethics and traceability have become more important.
Verbeke and Vackier (2004) classified Belgian meat consumers into four groups according to
their level of involvement in meat: straightforward meat lovers (enjoy meat consumption,
without perceiving much risk in its consumption); cautious meat lovers (choose to eat meat,

Literature review Consumers
55
but make a much more cautious choice of meat); indifferent meat consumers (do not consider
the negative consequences of poor choice as highly important, perceive the probability of
making a wrong choice as high and report a low pleasure value for meat consumption); and
concerned meat consumers (highly concerned about perceived risk). They found that more
men belonged to the first group that was linked to men attaching a higher pleasure value and
lower risk importance than women. The indifferent meat consumers group is made up of
more consumers under 25 years than any other age group, while families with children were
mostly divided between cautious meat lovers and concerned meat consumers. Kubberod,
Ueland, Rodbotten, Westad and Risvik (2002) also found that men supported “pro-red meat”
statements much more then women.
When looking into issues that may concern meat consumers, it was found that concern about
BSE, antibiotics, hormones and fat and cholesterol content were the main concerns. Meat
lovers and indifferent meat consumers were in general less concerned about all issues than
the other two groups. The cautious meat lovers and concerned meat consumers were more
concerned about BSE, antibiotics and hormones with only concerned meat consumers
showing high concern in regard to fat and cholesterol content. With higher education,
concern for BSE and fat and cholesterol were much lower, women were more concerned
about all issues than men, while families with children showed slightly more concern (except
for fat and cholesterol) than other groups (Verbeke and Vackier, 2004).
Working with Australian consumers, Russell and Cox (2004) looked at age-group differences.
These authors found that young and middle-aged (40-60 years) consumers perceived white
meat and fish as healthy meat options. While older consumers perceived red meat as
healthy. Middle-aged consumers shared views on different meat-related issues with both
young and older age groups. Since the middle-aged consumers group of industrialised
populations is large and growing, they are recognised as an important consumer segment
with different needs than other age groups. These consumers may not respond positively to
products focussed at elderly consumers or even all products focussing on younger
consumers. For example, middle-aged consumers do not share younger consumers’ views
on lamb and pork chops, roasted chicken and comminuted or processed products, but rather
tend to perceive these products more positively like the older consumers. Red meat
consumption among younger women was found to be declining (Kubberod et al., 2002).
When consumers were asked to identify the factors responsible for their attitude towards
beef, McCarthy et al. (2003) found health, eating enjoyment to be the two most important
factors, with price, animal welfare and environment of lesser importance. European beef and
lamb consumers were asked which non-physical (extrinsic) attributes they considered
important and the following list of attributes was generated: animal feeding; origin of meat;
environmentally friendly production; animal welfare; and storage (Bernues et al., 2003a).

Literature review Consumers
56
It was found that consumers who were primarily interested in the safety, nutritional value and
health aspects of meat, attached special importance to most of the extrinsic characteristics of
meat, except origin (Bernues et al., 2003a). Consumers concerned with the origin of meat
showed average or lower than average concern for safety, nutritional value and health.
Ethical values played an important role in consumer consideration of meat as the relative
importance of environmental concerns and animal feeding were rated more important by
consumers who rated safety, nutritional value and health the most valued attributes of meat
(Bernues et al., 2003a).
Consumers seeking convenience considered processing, packaging, knowledge of
preparation and ease of purchasing as very important aspects of meat (Bernues et al.,
2003a).
Beef consumers considered labels and brands to provide reliable information about quality.
Especially consumers concerned about safety, nutritional value and health attached a lot of
value to label information (Bernues et al., 2003b). Lamb consumers considered label and
brand as important sources of information, but “own assessment” at the time of purchase was
also important.
Consumers prefer and demand lean meat. Resurreccion (2004) showed that visible fat could
severely influence purchase behaviour. Consumers became biased against pork chops with
high amounts of visible fat and did not purchase it. Out of 142 consumers, 42% purchased
lean chops, 40% purchased medium marbled chops and 18% purchased highly marbled
chops. As long as consumers could not visibly detect fat, the fat content of meat did not
influence purchasing behaviour to a great extent.
While studying the effect of different factors surrounding meat products, Dransfield et al.
(1998) found that steak tenderness influenced consumer purchase behaviour tremendously.
After consumption, most consumers preferred to purchase the most tender steaks, even if
those turned out to be the most expensive steaks offered. Various other authors have
highlighted the importance of tenderness to consumers (Koohmaraie, Whipple and Crouse,
1990; Girolami, Marsico, D’Andrea, Braghieri, Napolitano and Cifuni, 2003; Robbins, Jensen,
Ryan, Homco-Ryan, McKeith and Brewer, 2003).
Over a two month period, Miller et al. (1995) had consumers rate steaks on tenderness and
overall acceptability at home and then had them rate a steak a week in a restaurant over
seven weeks. These authors found consumers to be more critical in regard to beef
tenderness in their homes than at restaurants. Although tenderness is regarded as the most
important quality characteristic valued by consumers, it is not the only characteristic

Literature review Consumers
57
contributing to the overall acceptability of steaks. In the study by Miller et al. (1995) this fact
was proven when restaurant consumers rated 81.3% of the total amount of steaks as
acceptably tender, but 87.6% of all the steaks were considered acceptable overall. Meat
quality characteristics such as flavour and juiciness also have a part in overall acceptability of
meat. Huffman, Miller, Hoover, Wu, Brittin and Ramsey (1996) reported that 51% of 67
consumers participating in a study to determine consumer acceptability of beef tenderness at
home and in a restaurant, chose tenderness as the most important meat quality
characteristic, 39% considered flavour to be most important and 10% rated juiciness as most
important.
9.2. Perceived quality
Perceived quality is defined as the consumer’s perception of the product’s fitness for use with
regards to the purpose it was intended for and relative to alternative products (van Trijp,
Steenkamp and Candel, 1997). Dransfield (2001) expanded on this idea by stating that a
consumer develops an expected quality perception of a product and will purchase the product
if this expected perceived quality satisfies his needs. Only after purchase would the
consumer actually experience the product’s quality and this experienced quality will be used,
along with perceived quality when the product is bought in the future. According to Issanchou
(1996) perceived quality of food depends on the consumer and the context in which food is
consumed and could, therefore, change after consumption of the product.
Issanchou (1996) identified three stages in quality perception: perceived quality prior to
purchase (formed from beliefs and attitude of the consumer and depends on social, personal
and psychological factors as well as previous experience); perceived quality at the point of
purchase (mostly dependent on intrinsic cues such as physical attributes of the product,
extrinsic cues, quality cues such as labels and the price of the product are used to evaluate
the perceived quality); and perceived quality upon consumption (sensory characteristics of the
product is most important).
Because food products are measured against other similar products, price can be an
important factor (Issanchou, 1996), especially when deciding between unknown products.
Dransfield et al. (1998) found that with no knowledge of eating quality a third of consumers
chose higher priced steaks when a study was conducted on steaks similar in appearance and
intrinsic qualities, but differing in price. As soon as the higher priced steaks were labelled
“Charolais and tender”, the preference for those steaks increased. This shows that previous
experience and product information have a definite impact on perceived quality.
Carpenter et al. (2001) found beef colour and packaging influenced purchasing behaviour but
not perceived eating quality. The importance of colour in meat purchasing is followed by
flavour, odour and texture (Kubberod et al., 2002).

Literature review Consumers
58
9.3. Health concerns
Consumers form their opinions on health and the healthiness of food products mostly on what
they hear from friends and family, doctors, nutritionists and the media. The opinions of
medical professionals usually weigh heavily and people tend to take their advice to heart.
Modern consumers are very health-conscious and nutritional concerns, together with the
vilification of animal fats, have caused consumers to become more selective in their
purchasing behaviour (Kupiec, 2001; Resurreccion, 2004). These health views of consumers
were confirmed by a survey in which 76% of all participants concurred that they consider the
health aspects of food products before purchasing (Hoffman et al., 2005).
Unnevehr and Bard (1993, as cited by Issanchou, 1996) reported that nutritionists in the USA
advised consumers to reduce their beef intake so as to reduce saturated fat intake which
would In turn lead to a lesser risk of heart and coronary diseases and cancer. This way beef
(and red meat in general) was negatively associated with health. Recommendations made
about beef consumption are partly responsible for a decline in beef consumption seen in most
industrialised countries (Porin and Mainsant, 1996). Dietary cholesterol intake, although it
influences blood cholesterol levels very little, scares many consumers. Consumers have
associated meat with a negative influence on serum cholesterol levels (Higgs, 2000).
Red meat has been linked to coronary heart disease, which also negatively influence
consumers’ attitude towards it (Melanson et al., 2003). The saturation of animal fats have
particularly been blamed in this regard (Wood et al., 2004) and Girolami et al. (2003) reported
that a high ratio of n-6:n-3 fatty acids increased the risk of arteriosclerosis and coronary heart
disease. A dietary intake of 1g per day of n-3 polyunsaturated fatty acids had a protective
effect against cardiovascular death and the risk of fatal heart disease can furthermore be
reduced by regularly consuming α-linolenic acid or fish (Gissi-Prevenzione Investigators,
1999).
The fatty acid composition rather than the total amount of fat is important in human nutrition,
especially the saturation levels and ratios (Lengyel et al., 2003). In the UK, the Department of
Health (1994) has recommended fat intake be reduced by 30% of the total energy intake and
that saturated fatty acid intake should not exceed 10%.
Recently red meat has become associated with various cancers, such as colorectal, breast
and prostate cancer (Higgs, 2000; Stoeckli and Keller, 2004) even though the majority of
epidemiological studies could not confirm the part of meat in most cancers (Biesalski, 2005).
However, consuming fatty forms of white meat, such as fried fish and chicken with skin, were
associated with increased risk of breast cancer (Ronco et al., 2003), showing that any meat
high in fat should be considered a risk, not just red meat in general.

Literature review Consumers
59
Biesalski (2005) reported a positive correlation between fat intake and breast, colon and
prostate cancer, although controversy remains. Reddy (1981) reported red meat
consumption, which increased dietary fat intake, increased colon cancer risk. Because
animal fat is generally more saturated in nature, it is related to cancerogenesis, while plant
fats are considered as more protective because of its high polyunsaturated fat content
(Biesalski, 2005). While linoleic acid (n-6 fatty acid) enhanced cancerogenesis in rodents,
linolenic acid (n-3 fatty acids) suppressed colon cancer development through the inhibition of
the arachidonic pathway.
9.4. Safety concerns
As previously mentioned, food product safety is important to consumers. Issanchou (1996)
noted the importance of consumer perception vs. actual food safety. Perceived safety is
always in a fragile state, especially when a potentially high-risk product such as meat is
involved. Because of this precarious state of perceived safety, it is easily influenced
negatively by any new information, regardless of its medical or scientific soundness.
Issanchou (1996) mentions the Creutzfeldt-Jakob disease scare (linked to BSE) as a good
example of how non-scientific information can cause havoc with the perceived safety of beef.
Kubberod et al. (2002), Sadler (2004) and MacRae et al. (2005) also stated that the various
BSE scares caused European consumers specifically to become very concerned about food
safety in general, and meat safety in particular. Several such examples exist regarding a
variety of different topics, the use of hormones and antibiotics being two of them (Issanchou,
1996). When the perceived safety of meat decreases meat sales and consumption also
drops considerably.
Borchard and Arinder (2002) mentioned that problems in the basic hygiene routine in the
meat production cycle could cause illness and even death due to foodborne pathogens. A
good example of what the effects of improper handling and preparation of meat and meat
products could have on health is the Escherichia coli O157:H7 outbreak during 1992 (Fang et
al. (2001). The outbreak was caused by undercooked hamburger in a fast food chain in the
Pacific Northwest and resulted in 501 cases of infection and four deaths. This case opened
the eyes of many consumers to the possible health and safety risks associated with meat and
meat products and resulted in government policy and regulation changes improving food
safety in all areas of the food industry. Food safety and prevention systems such as Hazard
Analysis of Critical Control Points (HACCP) are implemented to control and prevent food
contamination by foodborne pathogens (Warriss, 2000).
9.5. Quality characteristics valued by consumers
Food quality perception and the characteristics involved are very complex and influenced by
various interior and exterior factors. According to Steenkamp (1990) the consumer receives
quality information in the form of quality cues. These cues provide information about the

Literature review Consumers
60
product and can be either intrinsic (relating to the physical aspects of the product, e.g. colour
or shape) or extrinsic (relating to the product, but not physically, e.g. brand or packaging).
The consumer uses these cues to form a perception of the quality of the product.
When Hoffman et al. (2005) asked consumers about the qualities they normally considered
important when buying meat, fat content (29.4%) colour (13.5%) and freshness (13.2%) were
considered most important.
Marshall (2003) stated that British consumers rated price as most important, with taste as
second most important factors when buying food. Quality, family health, appearance,
freshness, brand name, nutritional value and food safety were also mentioned.
In a study conducted in the USA by Resurreccion (2004), it was found that consumers’
demand for meat and meat products were chiefly influenced by an increased concern for
health; changes in demographic characteristics; a need for convenience; distribution changes;
and changes in relative price. Resurreccion (2004) reported that American consumers were
concerned about cholesterol and calorie content, artificial ingredients, convenience and price,
when asked about meat and meat products. Grunert (1997) reported that European (from
France, Germany, Spain and the UK) consumers were mainly concerned about the taste (that
it tastes good), tenderness, juiciness, freshness, leanness, healthiness and nutritional value
of beef.
In their study on the quality of meat (beef, lamb and pork) collected from several retail outlets
in the USA, Bickerstaff et al. (2001) reported that 20% of supermarket consumers were not
satisfied with the eating quality of beef. Furthermore these authors revealed that several
countries have recognised the existence of inconsistent quality of retail meat and that some
countries have taken drastic steps in improving the quality of meat. Thus, Australia has
incorporated the five-star quality grading system, the UK and France have introduced the
“blue print” and “label range” guidelines, while New Zealand introduced the New Zealand Beef
and Lamb Quality Mark Standard. The latter goes so far as to set standards for animal
welfare, microbiological quality, storage life, as well as meat eating quality.
Colour (or appearance) changes, along with changes in texture and flavour (when off-flavours
are not present) can affect meat preference with consumers (Risvik, 1994). Appearance is
important to consumers since consumers prefer leaner meat and would therefore discriminate
against meat containing visible fat. Consumers prefer meat with a bright red colour as they
associate it with freshness and wholesomeness (Hood and Riordan, 1973). Appearance is,
however, not a reliable predictor of eating quality.

Literature review Enhancement of meat
61
10. Enhancement of meat
Meat enhancement generally focuses on improving tenderness, and juiciness to a lesser
degree, by preventing or minimising the toughening phase or by accelerating or improving the
tenderisation phase (Koohmaraie, 1996). Meat can be enhanced in several ways, such as
hanging the carcass by the pelvis (Bouton et al., 1973), freezing the carcass immediately after
storage and then storing at sub-freezing temperatures to prevent cold shortening or by
marinating or injecting with inorganic salt solutions. For this study, enhancement through
injection of inorganic salt solutions will be focussed on.
10.1. Inorganic salts used
Several inorganic salts can be used to enhance meat, calcium salts being the most frequently
studied, but all inorganic salts do not have the same effect on meat properties (Table 14).
For instance, enhancement with lactic acid is known to increase shelf life of meat by inhibiting
bacterial growth. Eilers, et al., (1994) and Djenane, Sanchez-Escalante, Beltran and
Roncales (2003) found lactic acid-treated steaks to have decreased levels of microbial growth
compared to Ca-treated or untreated steaks. The downside of using lactic acid as
enhancement-tool is the adverse effects it has on flavour. Not only do lactic acid-treated
steaks score lower for flavour intensity, it has a notable increased amount of off-flavours
(Morris et al., 1997).
10.1.1. Calcium
Koohmaraie et al. (1990) showed that infusing carcasses or injecting portions (i.e. cuts or
muscles) of the carcass with calcium chloride improved ultimate tenderness in young animals
by accelerating post-mortem ageing. Morgan, Miller, Mendez, Hale and Savell (1991)
hypothesised that the positive effect of calcium chloride-injection on meat tenderness is
achieved by an increase of intracellular calcium concentration, which in turn, activates the
calcium-dependent proteases (i.e. calpain).
Calcium chloride is mostly used when studying the effects of calcium-salt injections on meat
quality aspects, but various researchers have noted certain quality problems when this salt is
used. Detrimental effects on flavour intensity (Wheeler et al., 1997; Lawrence et al., 2003a)
and more noticeable off-flavours (Benito-Delgado et al., 1994; Lawrence et al., 2003a) are
some of the negative aspects noted. Microbial growth was higher when calcium chloride
rather than calcium lactate was used (Wheeler et al., 1993; Lawrence et al., 2003b) and
calcium chloride also caused muscle darkening and faster meat discolouration (Kerth et al.,
1995). These side effects of calcium chloride prompted examination of other calcium salts,
particularly calcium lactate and calcium ascorbate.

Literature review Enhancement of meat
62
Table 14 Effect of different inorganic salts used in meat-enhancement on various meat properties as compared to that of non-enhanced meat.
Meat Property Calcium chloride Calcium ascorbate Calcium lactate Phosphate + salt Sodium chloride Sodium phosphate
Colour (raw/retail) - - Increased colour stability2
Decreased14 - -
Colour (cooked) Increased1 - - - - -
Cooking loss (%) Increased 1, 13 - - Decreased [some Na phosphates] 15
- Decreased [some Na phosphates] 15
Discolouration (faster)
Higher & faster 3, 11 Faster 2 Slower 2 - - -
Flavour intensity Decreased 1, 2, 6 Decreased 2 - Decreased 5 Increased 14 Increased 14
Juiciness Increased 1 - - Increased 15 Increased 14 Increased 10, 14
Off-flavours More – bitter, metallic 1, 2, 4, 6, 7, 8, 9
More 2 More 7 - - -
Overall acceptability - - - - Increased 14 Increased 14
Saltiness Increased 4 - - - Increased 14 Increased 14
Tenderness (consumer)
- - - - - Increased 14
Tenderness Increased 1, 4 Increased 2 Increased 2 Increased 14, 15 Increased 8, 12, 14 Increased 10
Water holding capacity
Increased 8, 12 - Increased 2 Increased 5, 15 Increased 8, 15 Increased 8
(1Wheeler et al., 1997; 2Lawrence, Dikeman, Hunt, Kastner and Johnson 2003a; 3Kerth, Miller and Ramsey, 1995; 4Benito-Delgado, Marriott, Claus, Wang and Graham, 1994; 5Lawrence, Dikeman, Hunt, Kastner and Johnson, 2003b; 6Eilers, Morgan, Martin, Miller, Hale and Acuff 1994; 7Morris, Theis, Miller, Acuff and Savell, 1997; 8Deatherage,
1963; 9Scanga, Delmore Jr., Ames, Belk, Tatum and Smith, 2000; 10Smith, Simmons, McKeith, Betchel and Brady, 1984; 11Wheeler et al., 1996a; 12Wierbicki, Cahill and
Deatherage, 1957; 13Koohmaraie et al., 1990; 14Robbins et al., 2003; 15Baublits et al., 2005)

Literature review Enhancement of meat
63
Lawrence et al. (2003a) found calcium lactate-treated beef M. longissimus dorsi had lower
aerobic microbial plate counts than either calcium chloride- or calcium ascorbate-treated
samples and also experienced calcium-lactate to have a more positive effect on beef flavour
intensity and off-flavour rating than the other two calcium treatments. Calcium lactate
injections resulted in less discolouration than either calcium chloride or calcium ascorbate
(highest amount of discolouration). Red colour retention was improved in samples injected
with calcium lactate and Lawrence et al. (2003a) reported this positive influence on colour
stability on the increased lactate concentration in the system.
Calcium ascorbate injections inhibited lipid oxidation, while Lawrence et al. (2003a) found
calcium chloride and calcium lactate to act as pro-oxidants for lipid oxidation. Even so,
calcium ascorbate-treated steaks received lower colour scores than calcium chloride- or
calcium lactate-treated steaks. This colour deterioration was due to a higher degree of
myoglobin oxidation (Lawrence et al., 2003a). Liu and Watts (1970) proved that ascorbic acid
could be a pro-oxidant when iron is present. When vitamin C (ascorbic acid) were added to
steak solely or in addition to calcium chloride, Wheeler et al. (1996a) found that steaks had
more red colour and less surface discolouration on 5 and 7 days of display at 1°C than either
non-treated or calcium chloride-treated steaks.
Non-calcium treated beef showed no change in m-calpain activity during storage, its ų-calpain
activity decreased tremendously and only a moderate decrease in calpastatin activity was
seen during storage (Gerelt, Rusman, Nishiumi and Suzuki, 2005). On the other hand, no ų-
calpain or calpastatin activity was observed after 48 hours at cold-room temperatures in
calcium chloride-treated beef. The m-calpain activity in treated meat was reduced to only
6.1% of its activity after 48 hours. These authors concluded that calpain autolysis and
proteolytic degradation of calpastatin occur if enough calcium is present. These processes
lead to diminished calpain and calpastatin activities and it was found that improved
tenderness (reduced toughness) was related to reduced calpain and calpastatin activities.
Whipple and Koohmaraie (1993) concluded that improved tenderness was achieved through
m-calpain activation.
No differences were found between calcium salts for tenderness or juiciness, according to
Lawrence et al. (2003a). These authors did, however, recommend using a solution of
calcium-lactate, rather than calcium chloride or calcium ascorbate, to achieve tenderness with
display colour stability and microbial inhibition of meat.
10.1.2. Phosphates
There are conflicting opinions on the relationship between calcium and phosphate. Some
researchers reported that phosphates bind with calcium to form chelates when found in a

Literature review Enhancement of meat
64
solution (Lawrence et al., 2003b), thus preventing positive results when used together in
brines. Others believe that phosphates cannot complex with calcium already bound to meat
proteins (Inklaar, 1967) and since about 60% of calcium in meat is bound to meat protein,
most of the calcium is not free to chelate with the phosphates. Inklaar (1967) also found no
effect of phosphate addition on calcium and Mg concentrations left in meat. Lawrence et al.
(2003b) suggested adding calcium to the muscle before adding phosphates, thus accelerated
tenderisation can be initiated by calcium and yields can be maximised by adding phosphates
which will also reduce losses through purge.
Consumers found bison steaks injected with up to 0.3% sodium tripolyphosphate and 0.5%
sodium chloride more tender, juicier, more flavourful and overall more acceptable than non-
treated steaks (Dhanda, Pegg, Janz, Aalhus and Shand, 2001, as cited by Robbins et al.,
2003). Robbins et al. (2003) reported beef steaks and pork chops treated with phosphates to
be more tender and juicy than non-treated meat by a trained sensory panel.
Phosphate addition caused meat to show a higher WHC (Baublits et al., 2005), regardless of
phosphate type. When it came to cooking losses, a difference in type of phosphate was
observed: sodium hexameta-phosphate caused higher (same as non-treated) cooking losses
than either sodium tripolyphosphate or tetrasodium pyrophosphate (both less than non-
treated meat). In their study on the effect of either sodium chloride- or different phosphate
salt-solutions on beef, Baublits et al. (2005) found 12% phosphate-pumped steaks to be
juicier than sodium chloride- and non-treated steaks, although steaks pumped to 18%
phosphate solution were not experienced as juicier than sodium chloride-treated steaks.
10.1.3. Sodium chloride
Deatherage (1963) reported that sodium chloride accentuated the following effects on meat
when heated: the pH-change increased; juice expressed was reduced; WHC was heightened;
and tenderness was increased. During cooking temperature (40-70°C) there is a shift in
calcium, magnesium, sodium and potassium ions so as to counteract shrinkage. This ability
of sodium chloride (when added before heating) to increase WHC of meat proteins on heating
(to 70°C) corroborates the work of Wierbicki et al. (1957).
10.1.4. Other inorganic salts
Sodium lactate (sodium lactate) was noted to enhance beef flavour and to minimise the
decline in flavour during storage (Papadopoulos, Miller, Ringer and Cross, 1991). Increasing
sodium lactate concentration (from 0 to 4%) caused meat to have a darker red colour with
less surface grey and also led to increased cooking yields (increased WHC). However,
increased sodium lactate concentration beyond 1% did not improve palatability any further.
Tenderness and juiciness were improved for all sodium lactate concentrations compared to

Literature review Enhancement of meat
65
untreated samples, but increasing sodium lactate above 1-2% resulted in no further
improvement.
Sodium nitrate and nitrite infusion (at 10% of weight) of an old cow before dressing-out
caused all muscles to be very tender and no drip loss was reported when meat was frozen or
thawed (Deatherage, 1963).
Potassium chloride and magnesium chloride accounted for higher WHC values in heated
meat, but had detrimental effects on meat flavour (Wierbicki et al., 1957; Deatherage, 1963).
Magnesium chloride-treated meat expressed less juice on heating than potassium chloride.
10.2. Tenderisation effects
The entire motivation for enhancing meat with inorganic salts is to ultimately result in more
tender meat. Most authors agree that tenderness is improved by inorganic salt-treatment of
meat (Morgan et al., 1991; Papadopoulos et al., 1991; Lawrence et al., 2003a, b).
Koohmaraie et al. (1990) proved that tenderness of whole carcasses, cuts or individual
muscles could be improved by calcium chloride-treatment. Morgan et al. (1991) found that
calcium chloride-treatment lowered the Warner-Bratzler shear force values of strip loin by
approximately 50% compared to untreated samples. In the same study it was also shown
how calcium chloride accelerated post-mortem ageing when untreated top sirloin samples
aged for 14 days had higher shear force values than calcium chloride-treated samples aged
only one day (Morgan et al., 1991).
M. longissimus dorsi of beef and sheep were more tender after injection with calcium chloride
and calcium chloride-treatment had to effect that treated samples were more tender with a
marked reduction in post-mortem storage time (Benito-Delgado et al., 1994). Similar results
were found by Koohmaraie et al. (1990) on lamb meat. Several authors reported that calcium
chloride-injections increased beef tenderness (Whipple and Koohmaraie, 1993; Kerth et al.,
1995) while accelerating ageing times (Koohmaraie et al., 1990; Benito-Delgado et al., 1994).
Koohmaraie et al. (1990) also reported that shear force values of calcium chloride-injected
beef M. longissimus dorsi decreased by approximately 1 kg during 14 days of storage, while
non-treated samples decreased by 2.8 kg, although treated beef still had much lower shear
force values than untreated samples. At one day of storage treated beef had lower shear
force values than untreated samples. Calcium chloride-treated beef shear force values at day
1 were similar, but lower than non-injected beef after 14 days of ageing. This shows that
there really is no need to age calcium chloride-treated beef for as long as untreated beef,
since the tenderness is already improved and does not improve any further with ageing.

Literature review Enhancement of meat
66
No differences between calcium chloride, calcium lactate and calcium ascorbate were found
in regard to tenderisation effects (Lawrence et al., 2003a) and all of these calcium salts
improved analytical sensory tenderness ratings equally. Calcium-treatment of beef M.
longissimus dorsi muscle increased both myofibrillar and overall tenderness significantly,
regardless of which salt was used.
While Lawrence et al. (2003a) found no difference in the tenderisation effects of different
calcium salts, higher concentrations of calcium salts (0.3 M) caused lower shear force values,
thus more tender meat, than lower (0.1M) concentrations. In sensory analysis, meat treated
with 0.3 M calcium salts was also judged as more tender. In the same study steaks were
considered as tough when shear force values were higher than 4.5 kg and of all calcium-
treated steaks, 4.2% qualified as tough, while 37.5% of untreated steaks were found to be
tough.
Koohmaraie et al. (1990) reported that calcium salts affected tenderness by increasing the
calpain activity in meat due to an increased calcium ion concentration and then went on to
explain that this activation of calpain caused degradation of Z-disks and cytoskeletal proteins
(Koohmaraie, 1994). Solubilisation of myofibrillar proteins were suggested by Takahashi, Kim
and Yano (1987) as the main effect contributing to tenderisation, caused by a non-enzymatic
salting-in of calcium ions. Treatment with calcium chloride caused an increase in calcium
concentration high enough to activate the calpain system, which leads to increased muscle
fragmentation (Eilers et al., 1994).
Sodium lactate treatment caused improved tenderness in top round roasts (Papadopoulos et
al., 1991), but using concentrations above 1.0-2.0% brought no further improvement. Vote et
al. (2000) reported similar results when sodium lactate was used to enhance M. longissimus
dorsi samples.
Phosphates, and most commonly sodium phosphate, are frequently used in meat processing
to improve protein solubility (Deatherage, 1963) and enhancing meat with phosphates has
increased meat tenderness as well (Smith et al., 1984; Scanga et al., 2000; Lawrence et al.,
2003b; Robbins et al., 2003). In sensory analysis, steaks treated with sodium hexameta-
phosphate, sodium tripolyphosphate or tetrasodium pyrophosphate, were scored higher in
tenderness than sodium chloride-treated or untreated steaks (Baublits et al., 2005) even
though no differences were found in Warner-Bratzler shear force values. All three phosphate-
solutions received higher ratings for myofibrillar, connective tissue and overall tenderness
than untreated samples, which also confirmed similar findings by Scanga et al. (2000).
Prestat, Jensen, McKeith and Brewer (2002) reported an improvement in Warner-Bratzler
shear force values when pork M. longissimus dorsi was injected with a phosphate-salt-
solution (0.4% each) and found that this treatment stabilised tenderness under a variety of

Literature review Enhancement of meat
67
conditions. Sodium phosphate (pyrophosphate or hexameta-phosphate) addition to freshly
slaughtered beef reportedly prevents rigor mortis and thus contributes to increased
tenderness (Streitel, Ockerman and Cahill, 1977).
10.3. Effect on juiciness
Several authors have reported that enhancing meat with inorganic salt solutions improves
juiciness (Papadopoulos et al., 1991; Wheeler et al., 1997; Scanga et al., 2000; Robbins et
al., 2003; Baublits et al., 2005). Wheeler et al. (1997) found that a calcium chloride-injection
improved juiciness of cooked meat because it caused the meat to retain enough added water
to effectively withstand moisture losses due to purge during ageing and cooking.
Smith et al. (1984) found pork and beef juiciness increased when sodium tripolyphosphate
was injected and Deatherage (1963) reported that sodium phosphate increased WHC of
meat. Bison steaks injected with sodium tripolyphosphate and sodium chloride were juicier
than untreated steaks (Dhanda et al., 2001, as cited by Robbins et al., 2003). Analytical
sensory panels also found beef steaks treated with solutions of sodium chloride (2.0%) and
either sodium hexametaphosphate, sodium tripolyphosphate or tetra sodium pyrophosphate
to be juicier on consumption than untreated steaks (Baublits et al., 2005). There were no
differences in juiciness between phosphate types, but all phosphate types achieved higher
juiciness ratings than sodium chloride-treated steaks. Prestat et al. (2002) found phosphate
addition improved juiciness and thought that the improved juiciness was caused by added
moisture as well as increased moisture retention because of increased pH levels caused by
phosphate addition. In the work of Baublits et al. (2005) it was shown that phosphate addition
caused increased water retention where untreated samples had greater levels of free water,
but phosphate-treated samples contained a higher total moisture percentage.
The effect of lactate injection on meat juiciness depends on its concentration. During storage,
the juiciness of top rounds injected with 1.0% sodium lactate decreased significantly, while
injecting 1.0-4.0% increased juiciness (Papadopoulos et al., 1991) and stabilised it during
storage.
10.4. Effect on other meat characteristics
10.4.1. Colour
The bright red colour favoured by consumers during display is achieved by the formation of
oxymyoglobin when myoglobin reacts with oxygen on the surface. During display, various
changes occur in meat that may be detrimental to its colour. These changes can mainly be
ascribed to myoglobin and lipid oxidation. When myoglobin undergoes oxidation, it forms
metmyoglobin and meat will start to turn brown. Consumers actively discriminate against
meat without even, bright red colouration and any discolouration will lead to a no-purchase
decision.

Literature review Enhancement of meat
68
Wheeler et al. (1996a) found that display time and display temperature influenced colour
score, discolouration score, a* value and hue angle of meat. With higher display
temperatures and longer display times, more discolouration was observed. Surface
discolouration was minimal from 1 to 3 days of retail display, at less than 1% surface
discolouration on day 3, but on day 5 discolouration levels were greatly elevated, at around
50% surface discolouration. Wheeler et al. (1997) observed that a display temperature of 1ºC
caused steaks to show no discolouration through five days of retail display, despite calcium
chloride treatment.
The display properties of meat treated with vitamin C as an antioxidant, were mainly
influenced by the vitamin C concentration, although together with display time and
temperature a three-way interaction was formed (Wheeler et al., 1997). Vitamin C addition
stabilised colour, but lower concentrations (0.5% and 1.0%) caused greater colour stability
than 1.5% vitamin C, and all vitamin C concentrations produced better colour scores than
untreated steaks. Steaks with a 1.0% vitamin C-treatment was the reddest (a* values), while
untreated steaks showed the least amount of lean red colour. The other vitamin C
concentrations tested, i.e. 0.25%, 0.5% and 4%, caused intermediate values.
Sodium lactate also improves meat colour, with darker red colour and less grey visible on the
surface of treated, than untreated top round roasts (Papadopoulos et al., 1991). It was found
that sodium lactate concentrations of more than 1.0% did not improve colour scores any
further. Untreated meat had lower a* (redness) values than treated meat. Sodium lactate
concentrations differed in their effects on L* (lightness) and b* (yellowness) values. Up to
2.0% sodium lactate, the L* valued decreased with increasing sodium lactate levels, but more
than 2.0 % sodium lactate had no further effect on L* values. Higher b* values were found in
untreated samples (0 %) and up to 1.0 % sodium lactate addition, while meat treated with 2.0-
4.0% were less yellow.
Calcium chloride was shown to accelerate discolouration (Kerth et al., 1995) and Lawrence et
al. (2003a) reported induced muscle darkening when calcium chloride was used. Steaks
treated with calcium chloride were more brown with more surface discolouration than
untreated steaks at 5 and 7 days of display but when vitamin C was added in conjunction with
calcium chloride, it resulted in more red colour with less discolouration (Wheeler et al.,
1996a).
Phosphate enhancement of pork caused a* values to increase, while b* values decreased
(Prestat et al., 2002).

Literature review Enhancement of meat
69
10.4.2. Flavour
Many of the chemical substances used in enhancement solutions have adverse effects on
meat flavour and several off flavours may be perceived after enhancement. Calcium chloride
injected along with lactic acid caused liver, metallic, sour and medicinal off flavours and beef
and brothy flavours were decreased (Wheeler et al., 1997; Scanga et al., 2000), while Morris
et al. (1996) found that a bloody flavour was also detectable in beef steaks. In addition,
Wheeler et al. (1997) reported that calcium chloride lowered beef flavour intensity.
The concentration at which calcium chloride is added to meat also affects the degree to which
flavour is influenced. Lawrence et al. (2003a) found higher beef flavour intensities when 0.1
M solutions were used in marinating beef steaks compared to a 0.3 M solution. The 0.3 M
solutions caused more off-flavours. This trend was also reported by Eilers et al. (1994) and
Morris et al. (1996) who found that even a 10% addition of a 0.3 M calcium chloride can
cause bitter, metallic and sour tastes in cooked meat.
Different calcium salts affect flavour differently. Calcium lactate-injected beef was judged to
have a higher flavour intensity than either calcium ascorbate- or calcium chloride-treated meat
(Lawrence et al., 2003a).
Lawrence et al. (2003b) found that phosphate salts tend to lower flavour intensity, while
Prestat et al. (2002) found that a phosphate and salt (0.4% each) solution lowered the amount
of off flavours of pork chops in comparison to control samples. Dhanda et al. (2001, as cited
by Robbins et al., 2003) reported higher flavour acceptability for bison steaks after treatment
with a 0.3% sodium tripolyphosphate and 0.5% sodium chloride solution. Papadopoulos et al.
(1991) reported that sodium lactate (1.0%) had no effect on ham flavour, while it enhanced
fresh beef flavour.
Several authors (Morris et al., 1996; Scanga et al., 2000) have reported a marked
improvement in flavour intensity and overall flavour of meat when commercial beef flavouring
was added to calcium chloride- or lactic acid-injected meat. The flavouring increased beefy,
brothy and oniony flavours, while it effectively decreased the sour and bitter flavours caused
by calcium chloride or lactic acid. Analytical sensory panellists rated the flavour of beef
flavouring-marinated steaks higher than untreated steaks or steaks treated with calcium
chloride or sodium phosphate (Scanga et al., 2000). Adding beef flavouring to steaks did
make the meat saltier than the other treatments.
10.4.3. pH
Different calcium salt solutions have different pH-values. For instance, calcium ascorbate
solutions are slightly acidic, increasing slightly in acidity as molar concentrations increases,
calcium chloride solutions are basic, increasing in alkalinity with increased molar

Literature review Enhancement of meat
70
concentrations, and calcium lactate solutions are slightly alkaline and increases in alkalinity,
while staying very close to a neutral pH, with increased molar concentrations (Table 15)
(Lawrence et al., 2003a).
Table 15 Differences in pH between different calcium salts for different molar concentrations.
Calcium salt 0.1 M 0.2 M 0.3 M
Calcium ascorbate 5.9 5.8 5.8
Calcium chloride 9.7 10.0 10.1
Calcium lactate 7.5 7.4 7.4
(From Lawrence et al., 2003a)
Morris et al. (1996) found that beef steaks treated with 0.3 M calcium chloride (pH 5.1) had
lower pH values than cold-boned, untreated (control) steaks. Wierbicki et al. (1957) found
calcium- and magnesium chlorides to lower pH values of raw meat.
The pH of beef samples treated with sodium hexametaphosphate was lower than that of
untreated samples and was similar to the pH values of samples treated with sodium chloride
(Baublits et al., 2005). Sodium tripolyphosphate- and tetrasodium pyrophosphate-treated
samples had higher pH values than untreated samples and sodium chloride- or sodium
hexametaphosphate-treated samples. There was no difference in pH values of different
concentrations or pumped rates.
Lactic acid treatment of meat caused meat pH to decline to values below untreated samples
(Eilers et al, 1994). Morris et al. (1996) reported similar findings in terms of cold-boned non-
injected samples, with no differences between treated sample pH values and that of hot-
boned untreated samples. Papadopoulos et al. (1991) found an inverse relationship between
sodium lactate and the pH of top round roasts and found that pH values decreased over time.
Low levels (1.0%) of sodium lactate had no significant effect on pH levels.
10.4.4. Cooking loss
Wheeler et al. (1997) reported a higher percentage cooking loss for calcium chloride-treated
steaks than for untreated steaks and explained that it was due to the higher amount of water
absorbed by calcium chloride-treated steaks. Scanga et al. (2000) reported similar results
although steaks treated with calcium chloride, phosphate or beef flavouring showed higher
final yields. Lamb meat treated with calcium chloride showed higher cooking losses than
untreated samples at day 1, but this difference disappeared after 14 days of ageing and the
same results were found for calcium chloride-treated beef (Koohmaraie et al., 1990).
A solution of sodium chloride and sodium tripolyphosphate (0.4% each) had no effect on
cooking loss of steaks or roasts (Robbins et al., 2003). Treatment with sodium

Literature review Enhancement of meat
71
hexametaphosphate caused no cooking loss differences to untreated steaks, but sodium
tripolyphosphate- and tetrasodium pyrophosphate-treated steaks had lower cooking losses
(Baublits et al., 2005). It was also shown that both phosphate concentration (0.2% and 0.4%)
and pumped rates (12% and 18%) caused lower cooking losses than untreated steaks.
As sodium lactate level increased (1.0-4.0%), cooking yields increased (lower cooking losses)
significantly (P< 0.001) and was higher than untreated samples (Papadopoulos et al., 1991).
Reid (1969, as cited by Papadopoulos et al., 1991) explained that these higher cooking yields
were probably due to a combined effect of the humectant properties of sodium lactate and the
higher levels of sodium ions. Salt increased the ionic strength of meat (Schmidt and Trout,
1982, referred to by Papadopoulos et al., 1991), thus causing increased WHC and therefore
lowering cooking losses (Pearson and Tauber, 1984, as cited by Papadopoulos et al., 1991).
10.5. Pumped gain
Pumped gain refers to the weight meat gains after injection enhancement and is mostly
ascribed to an increased WHC. Lawrence et al. (2003a) found differences in pumped gain
between calcium salts – calcium ascorbate marination produced the highest, calcium chloride
intermediate and calcium lactate the lowest yields. It was also observed that with molar
increase in calcium chloride or calcium ascorbate concentrations, a linear increase in pumped
yield resulted. Injecting calcium lactate along with phosphates consequently had higher
pumped yield than treating meat with only calcium lactate (Lawrence et al., 2003b).
10.6. Effect on shelf life
Shelf life of meat is, economically speaking, very important. Wheeler et al. (1996) declared
poor shelf life (most notably lean colour) resulted in tremendous retail losses. Meat colour is
the meat property that influences consumer purchasing behaviour the most and if the lean
colour of meat cannot be retained on display, this leads to the meat being discounted or
processed into products of lesser value. Oxidation of both lipids and myoglobin shortens
shelf life and cause detrimental effects on meat quality. The usual culprit involved in lipid
deterioration is unsaturated fatty acids (UFA) and Sanchez-Escalante et al. (2001) observed
that peroxidation of UFA of the phospholipids often occur and results in rancid meat. As for
myoglobin and oxymyoglobin, its oxidation leads to metmyoglobin formation, which causes an
undesirable brown discolouration of the meat surface (Sanchez-Escalante et al., 2001; Wood
et al., 2004).
Marshall and Bal’a (2001) reported that meat preservation procedures (and ultimately shelf
life) have been focussing on inhibiting microbial growth or the elimination of contaminants
through chemical, physical or biological measures. The idea behind these measures was to
thwart or at least slow down the growth of microbes that could lead to spoilage. Thus meat
can be preserved long enough to allow delivery and shelf life can be prolonged.

Literature review Enhancement of meat
72
The meat properties most commonly influencing shelf life is colour and microbial spoilage,
while flavour may also deteriorate during retail display, but cannot be observed on display.
Various treatments can be applied to inhibit or prevent the processes leading to decreased
shelf life. Antioxidant-treatment proved to delay myoglobin and lipid oxidation and Robbins et
al. (2003) declared such treatments extended the shelf life of meat, while other treatments,
such as inorganic salt addition, might shorten shelf life.
Faster discolouration was observed whenever the molar concentration of any of the calcium
salts used in enhancement solutions were increased and specifically calcium ascorbate
accelerated myoglobin oxidation (Wheeler et al., 1997). Although Sanchez-Escalante et al.
(2001) observed that when rosemary powder (1 000 ppm) was administered along with
ascorbic acid, it was very effective in inhibiting myoglobin and lipid oxidation, whereas
rosemary powder alone was a pronounced antioxidant at all storage times. When vitamin C
was added to meat alone or in conjunction with calcium chloride, Wheeler et al. (1996a) found
those steaks less discoloured and redder on 5 and 7 days of retail display than either
untreated or calcium chloride-treated steaks. Treating steaks with only vitamin C resulted in
the most stable lean colour. The antioxidant properties of ascorbic acid depend very much on
the ascorbic acid concentration, the presence of metal ions (specifically iron) and the
tocopherol content of the meat (Sanchez-Escalante et al., 2001). Thus ascorbic acid may act
as either an antioxidant or a pro-oxidant. Phosphate salts used in enhancement solutions
caused adverse effects on pork and beef colour during retail display (Jensen, Robbins, Ryan,
Homco-Ryan, McKeith and Brewer, 2003; Robbins et al., 2003).
Microbial spoilage of meat is another potentially harmful complication that can result in meat
during retail display. Djenane et al. (2003) established that lactic acid treatment, alone or
along with a modified 40% CO2 / 60% O2 atmosphere, effectively inhibited the growth of lactic
acid bacteria (Brochothrix thermosphacta) and Pseudomonas species. However, lactic acid
treatment did not affect myoglobin oxidation. Various authors have mentioned the positive
inhibitory effects of lactic acid on microbial spoilage of meat (Papadopoulos et al., 1991;
Morris et al., 1996).
Air exposure can lead to oxidised flavour within one hour in comminuted meat (Sanchez-
Escalante et al., 2001). Papadopoulos et al. (1991) found sodium lactate inhibits flavour
deterioration during storage and that there was an improvement of the flavour notes identified
with fresh beef. In pigs, Morrissey, Sheehy, Galvin, Kerry and Buckley (1998) reported iron-
release from cells and the shutdown of the glutathione enzyme system after slaughter to be
two of the factors influencing flavour oxidation.

Literature review Enhancement of meat
73
The animal’s diet may also influence shelf life – Wood et al. (2004) observed a high degree of
lipid oxidation and a faster occurrence of rancidity in the meat of sheep and beef fed a fish oil-
rich diet. The malonaladehyde levels were much higher than 2 mg/kg meat, the level at which
consumers can perceive rancidity (Younathan and Watts, 1959), in the meat of the sheep and
beef fed fish oil-rich diets (Wood et al., 2004). It was also shown that colour deterioration at
retail display occurred faster in meat from the fish oil-rich diet. Warren et al. (2002) reported
the bright red colour of beef from grass-fed cattle lasted longer during retail display than that
of grain-fed cattle. Grass is rich in natural antioxidants and subsequent grass consumption
possibly led to higher vitamin E levels in the tissue, explained Young et al. (2001), and this
had an inhibitant effect on lipid oxidation, which resulted in better colour retention even
though its fatty acid composition would normally favour lipid oxidation.
11. Conclusion and objectives
Springbok is the African wild ungulate most often farmed with, exported and consumed and is
regularly available in South African butcheries and restaurants. Blesbok is also favoured by
game farmers and, together with springbok, have been studied since the seventies (Huntley,
1971; Von la Chevallerie, 1972) and data is available for most characteristics, be it physical or
proximate. However, the data available is usually limited to a single muscle (quite often the
M. longissimus dorsi muscle) or to the whole carcass and data on several different muscles of
the same animals are lacking. Data on the inorganic enhancement of game meat is also very
limited.
The objectives of this study, therefore, were to investigate the possible differences that might
occur in the physical characteristics and chemical composition of five different muscles (M.
biceps femoris, M. longissimus et lumborum, M. rectus femoris, M. semitendinosus and M.
supraspinatus) in both blesbok and springbok. Furthermore, two muscles (M. biceps femoris
and M. longissimus et lumborum) were used in analytical sensory analysis and consumer
sensory analysis was also performed on one muscle (M. longissimus et lumborum) of both
species. No data on consumer sensory analysis of game meat were available in the
literature.
The five muscles were also enhanced with an inorganic salt solution to investigate the
possible positive influences that such treatments may have on the different meat quality
aspects and results were compared between muscles.
This study aims to broaden the data available on wild ungulates, specifically springbok and
blesbok, regarding most aspects of meat quality.

Literature review References
74
12. References AMSA (American Meat Science Association). (1995). Research Guidelines for cookery,
sensory evaluation and instrumental tenderness measurements of fresh meat. Chicago:
National Livestock and Meat Board.
AOAC. (1997). Official Methods of Analysis. 15th ed. Arlington, VA. USA: Association of
Official Analytical Chemists.
Azarkan, M., El Moussaoui, A., van Wuytswinkel, D., Dehon, G. & Looze, Y. (2003).
Fractionation and purification of the enzymes stored in the latex of Carica papaya.
Journal of Chromatography B 790, 229-238.
Bailey, A.J. & Light, N.D. (1989). Connective tissue in meat and meat products. London:
Elsevier.
Baublits, R.T., Pohlman, F.W., Brown Jr., A.H. & Johnson, Z.B. (2005). Effects of sodium
chloride, phosphate type and concentration, and pump rate on beef biceps femoris quality
and sensory characteristics. Meat Science 70, 205-214.
Bejerholm, C. & Aaslyng, M.D. (2003). The influence of cooking technique and core
temperature on results of a sensory analysis of pork – depending on the raw meat quality.
Food Quality and Preference 15, 19-30.
Benito-Delgado, J., Marriott, N.G., Claus, J.R., Wang, H. & Graham, P.P. (1994). Chuck
longissimus and infraspinatus muscle characteristics as affected by rigor state, blade
tenderisation and calcium chloride injection. Journal of Food Science 59, 295-299.
Bernues, A., Olaizola, A. & Corcoran, K. (2003a). Extrinsic attributes of red meat as
indicators of quality in Europe: an application for market segmentation. Food Quality and
Preference 14, 265-276.
Bernues, A., Olaizola, A. & Corcoran, K. (2003b). Labelling information demanded by
European consumers and relationships with purchasing motives, quality and safety of
meat. Meat Science 65, 1095-1106.
Berry, B.W., Smith, G.C. & Carpenter, Z.L. (1974). Relationships of certain muscle, cartilage
and bone traits to tenderness of beef longissimus. Journal of Food Science 39, 819-824.
Bickerstaffe, R., Bekhit, A.E.D., Robertson, L.J., Roberts, N. & Geesink, G.H. (2001). Impact
of introducing specifications on the tenderness of retail meat. Meat Science 59, 303-315.
Biesalski, H.K. (2005). Meat as a component of a healthy diet – are there any risks or
benefits if meat is avoided in the diet? Meat Science 70, 509-524.
Bocker, A. (1997). Consumer search and surplus in markets with differentiated food
products. In: B. Wierenga, A. van Tilburg, K. Grunert, J.E.M. Steenkamp & M. Wedel,
(Eds). Agricultural marketing and consumer behaviour in a changing world (pp. 231-244).
Dordrecht: Kluwer Academic Publishers.
Borchand, E. & Arinder, P. (2002). Bacteriological safety issues in red meat and ready-to-eat
meat products, as well as control measures. Meat Science 62, 381-390.
Bouton, P.E. & Harris, P.V. (1972). A comparison of some objective methods used to assess
meat tenderness. Journal of Food Science 37, 218-221.

Literature review References
75
Bouton, P.E., Harris, P.V. & Shorthose, W.R. (1971). Effect of ultimate pH upon the water-
holding capacity and tenderness of mutton. Journal of Food Science 36, 435-439.
Bouton, P.E., Carroll, F.D., Harris, P.V. & Shorthose, W.R. (1973). Influence of pH and fibre
contraction state upon factors affecting tenderness of bovine muscle. Journal of Food
Science 38, 404-407.
Briskey, E.J. (1963). Influence of ante- and post-mortem handling practices on properties of
muscle which are related to tenderness. In Proceedings meat tenderness symposium
(pp. 195-223). Camden: Campbell Soup Company.
Bronkhorst, N. (2005). Is koedoe en springbok op jou inkopielys? Landbouweekblad 24
Junie, 67.
Carpenter, C.E., Cornforth, D.P. & Whittier, D. (2001). Consumer preferences for beef colour
and packaging did not affect eating satisfaction. Meat Science 57, 359-363.
Chizzolini, R., Zanardi, E., Dorigoni, V. & Ghidini, S. (1999). Calorific value and cholesterol
content of normal and low-fat meat and meat products. Trends in Food Science and
Technology 10, 119-128.
Chollet, S., Valentin, D. & Abdi, H. (2005). Do trained assessors generalize their knowledge
to new stimuli? Food Quality and Preference 16, 13-23.
Commission International De l’Eclairage (1976). Colorimetry, 2nd ed. CIE, Vienna.
Committee on Medical Aspects of Food Policy (1984). ‘Diet and Cardiovascular Disease.’
Report on Health and social subjects, Department of Health and Social Security, No. 28,
HMSO, London.
Conroy, A.M. & Gaigher, I.G. (1982). Venison, Aquaculture and ostrich meat production:
Action 2003. South African Journal of Animal Science 2, 219-233.
Cover, S., Ritchey, S.J. & Hostetler, R.L. (1962a). Tenderness of Beef. I. The connective-
tissue component of tenderness. Journal of Food Science 27, 469 - 475.
Cover, S., Ritchey, S.J. & Hostetler, R.L. (1962b). Tenderness of Beef. II. Juiciness and the
softness components of tenderness. Journal of Food Science 27, 476-482.
Cover, S., Ritchey, S.J. & Hostetler, R.L. (1962c). Tenderness of Beef. III. The muscle-fibre
components of tenderness. Journal of Food Science 27, 483-488.
Crafford, K. (2002). An exploratory study in the Western Cape on game meat as a consumer
product. M.Sc. (Cons.) thesis. Department of Consumer Science. University of
Stellenbosch, Stellenbosch.
Deatherage, F.E. (1963). The effect of water and inorganic salts on tenderness. In
Proceedings meat tenderness symposium (pp. 45-68). Camden: Campbell Soup
Company.
De Kock, R. (1993). Consumer sensory evaluation. In Forum: The venison industry.
Research requirements and possibilities (pp. 61-64). Meat industry centre, Irene
Agricultural research Council, Pretoria, South Africa.
Department of Health. (1994). Department of Health, Nutritional Aspects of Cardiovascular
Disease. In: Report on Health and Social Subjects no. 46, HMSO, London.

Literature review References
76
Dhanda, J.S., Taylor, D.G. & Murray, P.J. (2003). Part 2. Carcass composition and fatty
acid profiles of adipose tissue of male goats: effects of genotype and live weight at
slaughter. Small Ruminant Research 50, 67-74.
Djenane, D., Sanchez-Escalante, A., Beltran, J.A. & Roncales, P. (2003). The shelf life of
beef steaks treated with DL-lactic acid and antioxidants and stored under modified
atmospheres. Food Microbiology 20, 1-7. (Abstract).
Dransfield, E. (2001). Consumer issues and acceptance of meat. 47th International
Congress of Meat Science and Technology (pp. 72-78). Krakòw, Poland.
Dransfield, E., Wakefield, D.K. & Parkman, I.D. (1992). Modelling post-mortem tenderisation
- I: Texture of electrically stimulated and non-stimulated beef. Meat Science 31, 57-73.
Dransfield, E., Zamora, F. & Bayle, M. (1998). Consumer selection of steaks as influenced
by information and price index. Food Quality and Preference 9, 321-326.
Eilers, J.D., Morgan, J.B., Martin, A.M., Miller, R.K., Hale, D.S. & Acuff, G.R. (1994).
Evaluation of calcium chloride and lactic acid injection on chemical, microbiological and
descriptive attributes of mature cow beef. Meat Science 38, 443-451.
Elliot, J. (1993). Farmed Venison, the new meat comes of age. Nutrition and Food Science
4, 26-29.
Enser, M. (2001). The role of fats in human nutrition. In B. Rossell (Ed.). Oils and fats, Vol.2.
Animal carcass fats (Pp. 77-122). Leatherhead, Surrey, UK: Leatherhead Publishing.
Enser, M. (1984). The chemistry, biochemistry and nutritional importance of animal fats. In
J. Wiseman (Ed.) Fats in animal nutrition (pp. 23-51), London: Butterworths.
Enser, M., Hallett, K., Hewett, B., Fursey, G.A.J. & Wood, J.D. (1996). Fatty acid content
and composition of English beef, lamb and pork at retail. Meat Science 44, 443-458.
Enser, M., Hallett, K., Hewett, B., Fursey, G.A.J., Wood, J.D. & Harrington, G. (1998). Fatty
acid composition of UK beef and lamb muscle in relation to production system and
implications for human nutrition. Meat Science 49, 329-341.
Enser, M., Hallett, K.G., Hewett, B., Fursey, A.J., Wood, J.D. & Harrington, G. (1997b). Fatty
acid content and composition of UK beef and lamb muscle in relation to production
system and implications for human nutrition. Meat Science 49, 329-341.
Enser, M., Hallett, K.G., Hewett, B., Fursey, G.A.J., Wood, J.D. & Harrington, G. (1997a).
The polyunsaturated fatty acid composition of beef and lamb liver. Meat Science 49, 321-
327.
Enser, M., Richardson, R.I., Wood, J.D., Gill, B.P. & Sheard, P.R. (2000). Feeding linseed to
increase the n-3 polyunsaturated fatty acids of pork: fatty acid composition of muscle,
adipose tissue, liver and sausages. Meat Science 55, 201 – 212.
Fang, D.Y.C., Hajmeer, M.N., Kastner, C.L., Kastner, J.J., Marsden, J.L., Penner, K.P.,
Phebus, R.K., Smith, J.S. & Vanier, M.A. (2001). Meat safety. In Hui, Nip, Rogers &
Young (Eds.) Meat Science and applications (pp. 171-205). New York: Marcel Dekker.

Literature review References
77
Fiems, L.O., De Campeneere, S., De Smet, S., Van de Voorde, G., Vanacker, J.M. &
Boucque, Ch. V. (2000). Relationship between fat depots in carcasses of beef bulls and
the effect on meat colour and tenderness. Meat Science 56, 41-47.
Gerelt, B., Ikeuchi, Y. & Suzuki, A. (2000). Meat tenderisation by proteolytic enzymes after
osmotic dehydration. Meat Science 56, 311-318.
Gerelt, B., Rusman, H., Nishiumi, T. & Suzuki, A. (2005). Changes in calpain and calpastatin
activities of osmotically dehydrated bovine muscle during storage after treatment with
calcium. Meat Science 70, 55-61.
Gibney, M.J. & Hunter, B. (1993). The effects of short- and long-term supplementation with
fish oil on incorporation of n-3 polyunsaturated fatty acids into cells of the immune system
in health volunteers. European Journal of Clinical Nutrition 47, 255-259.
Girolami, A., Marsico, I., D’Andrea, G., Braghieri, A., Napolitano, F. & Cifuni, G.F. (2003).
Fatty acid profile, cholesterol content and tenderness of ostrich meat as influenced by age
at slaughter and muscle type. Meat Science 64, 309-315.
Gissi-Prevenzione Investigators (1999). Dietary supplementation with n-3 polyunsaturated
fatty acids and vitamin E after myocardial infarction: results from the GISSI-Prevenzione
trial. Lancet 354, 447-455.
Grunert, K.G. (1997). What’s in a steak? A cross-cultural study on the quality perception of
beef. Food Quality and Preference 8, 157-174.
Guignot, F., Touraille, C., Ouali, A. & Renerre, M. (1994). Relationships between post
mortem pH changes and some traits of sensory quality in veal. Meat Science 37, 315-
325.
Hanks, J. (1983). Mammals of Southern Africa (pp. 27 & 38). Johannesburg, South Africa:
McGraw-Hill Book Co.
Hannula, T. & Puolanne, E. (2004). The effect of cooling rate on beef tenderness: The
significance of pH at 7 °C. Meat Science 67, 403-408.
Hertzman, C., Olsson, U. & Tornberg, E. (1993). The influence of high temperature, type of
muscle and electrical stimulation on the course of rigor, ageing and tenderness of beef
muscles. Meat Science 35, 119-141.
Higgs, J.D. (2000). The changing nature of red meat: 20 years of improving nutritional
quality. Trends in Food Science and Technology 11, 85-95.
Hoelscher, L.M., Savell, J.W., Harris, J.M., Cross, H.R. & Rhee, K.S. (1987). Effect of initial
fat level and cooking method - cholesterol content and calorific value of ground beef
patties. Journal of Food Science 52, 883-1253.
Hoffman, L.C. (2001). The effect of different culling methodologies on the physical meat
quality attributes of various game species. In H. Ebedes, B. Reilly, W. van Hoven & B.
Penzhorn (Eds.). Sustainable utilisation - conservation in practice. Proceedings of the 5th
International Wildlife Ranching Symposium.

Literature review References
78
Hoffman, L.C. (2000). The yield and carcass chemical composition of impala (Aepyceros
melampus), a southern African antelope species. Journal of the Science of Food and
Agriculture 80, 752-756.
Hoffman, L.C. & Bigalke, R.C. (1999). Utilizing wild ungulates from southern Africa for meat
production: Potential research requirements for the new millennium. Congress of the
Wildlife Management Association of SA (pp. 1-14). George, South Africa.
Hoffman, L.C. & Ferreira, A.V. (2000). pH decline of the M. longissimus thoracis of night-
cropped Grey Duiker (Sylvicapra grimmia). Short communication. South African Journal
of Animal Science 30, 16-17.
Hoffman, L.C., Crafford, K., Muller, M. & Schutte, De W. (2003). Perceptions and
consumption of game meat by a group of tourists visiting South Africa. South African
Journal of Wildlife Research 33, 125-130.
Hoffman, L.C., Muller, M., Schutte, De W., Calitz, F.J. & Crafford, K. (2005). Consumer
expectations, perceptions and purchasing of South African game meat. South African
Journal of Wildlife Research 35, 33-42.
Hoffman, L.C., Muller, M., Schutte, De W. & Crafford, K. (2004). Retail of South African game
meat: current trade and marketing trends. South African Journal of Wildlife Research 34,
123-134.
Honikel, K.O. (1998). Reference methods for the assessment of physical characteristics of
meat. Meat Science 49, 447-457.
Honikel, K.O. & Arneth, W. (1996). Cholesteringehalt in Fleisch und Eiern. Fleischwirtschaft
76, 1244-1253.
Hood, D.E. & Riordan, E.B. (1973). Discoloration in pre-packed beef: measurement by
reflectance spectroscopy and shopper discrimination. Journal of Food Technology 8, 333-
343.
Hopkins, D.L. & Thompson, J.M. (2001). Inhibition of protease activity. Part 1. The effect
on tenderness and indicators of proteolysis in ovine muscle. Meat Science 59, 175-185.
Huang, T. & Ho, C. (2001). Flavours of meat products. In Hui, Nip, Rogers & Young (Eds.)
Meat Science and applications (pp. 71-102). New York: Marcel Dekker.
Huff-Lonergan, E. and Lonergan, S.M. (2005). Mechanisms of water-holding capacity of
meat: The role of post-mortem biochemical and structural changes. Meat Science 71,
194-204.
Huffman, K.L., Miller, M.F., Hoover, L.C., Wu, C.K., Brittin, H.C. & Ramsey, C.B. (1996).
Effect of beef tenderness on consumer satisfaction with steaks consumed in the home
and restaurant. Journal of Animal Science 74, 91-97.
Huntley, B.J. (1971). Carcass composition of mature blesbok and kudu. South African
Journal of Animal Science 1, 125-128.
Husaini, S.A., Deatherage, F.E., Kunkle, L.E. & Draudt, H.N. (1950). Studies on Meat I. The
biochemistry of beef as related to tenderness. Food Technology 4, 313-316.

Literature review References
79
Immonen, K., Ruusenen, M. & Puolanne, E. (2000). Some effects of residual glycogen
concentration on the physical and sensory quality of normal pH beef. Meat Science 55,
33-38.
Inklaar, P.A. (1967). Interaction between polyphosphates and meat. Journal of Food
Science 32, 525-526.
Issanchou, S. (1996). Consumer expectations and perceptions of meat and meat product
quality. Meat Science 43, S5-S19.
Jansen van Rensburg, D.M. (2001). Venison as health food. In: H. Ebedes, B. Reilly, W.
van Hoven & B. Penzhorn (Eds.). Sustainable utilisation - conservation in practice.
Proceedings of the 5th International Wildlife Ranching Symposium (pp. 196-198).
Jansen van Rensburg, D.M. (1997). The physical, chemical and sensory quality
characteristics of Springbok (Antidorcas marsupialis marsupialis) meat. D. Tech. (Food
and Nutrition). Department of Food and Nutrition. Technikon Pretoria, Pretoria.
Jensen, J., Robbins, K., Ryan, K.J., Homco-Ryan, C., McKeith, F.K. & Brewer, M.S. (2003).
Effects of lactic and acetic acid salts on quality characteristics of enhanced pork. Meat
Science 63, 501-508.
Jeremiah, L.E., Dugan, M.E.R., Aalhus, J.L. & Gibson, L.L. (2003a). Assessment of the
chemical and cooking properties of the major beef muscles and muscle groups. Meat
Science 65, 985-992.
Jeremiah, L.E., Dugan, M.E.R., Aalhus, J.L. & Gibson, L.L. (2003b). Assessment of the
relationship between chemical components and palatability of major beef muscles and
muscle groups. Meat Science 65 1013-1019.
Jeremiah, L.E., Smith, G.C. & Carpenter, Z.L. (1972). Ovine yield grades. II. Palatability
attributes within various quality grades. Journal of Animal Science 34, 196-202.
Jeremiah, L.E., Smith, G.C. & Carpenter, Z.L. (1971). Palatability of individual muscles from
ovine leg steaks as related to chronological age and marbling. Journal of Food Science
35, 45-47.
Jeremiah, L.E., Tong, A.K.W. and Gibson, L.L. (1991). The usefulness of muscle colour and
pH for segregating beef carcasses into tenderness groups. Meat Science 30, 97-114.
Kemp, J.D., Mahyuddin, M., Ely, D.G., Fox, J.D. & Moody, W.G. (1981). Effect of feeding
systems, slaughter weight and sex on organoleptic properties, and fatty acid composition
of lamb. Journal of Animal Science 51, 321-330.
Kerth, C.R., Miller, M.F. & Ramsey, C.B. (1995). Improvement of beef tenderness and
quality traits with calcium chloride injection in beef loins 48 hours post mortem. Journal of
Animal Science 73, 750-756.
Kirton, A.H. & Barton, R.A. (1962). Study of some indices of the chemical composition of
lamb carcasses. Journal of Animal Science 21, 553-557.
Koohmaraie, M. (1996). Biochemical factors regulating the toughening and tenderisation
processes of meat. Meat Science 43, S193-S201.
Koohmaraie, M. (1994). Muscle proteinases and meat ageing. Meat Science 36, 93-104.

Literature review References
80
Koohmaraie, M., Whipple, G. & Crouse, J.D. (1990). Acceleration of post-mortem
tenderisation in lamb and Brahman-cross beef carcasses through infusion of calcium
chloride. Journal of Animal Science 68, 1278-1283.
Kroon, F.E., van Rensburg, W.J.J. & Hofmeyr, H.S. (1972). Seisoenale veranderinge in
chemiese samestelling van volwasse blesbokramme (Damaliscus dorcas phillipsi) van
die Van Riebeeck natuurreservaat. Suid Afrikaanse Tydskrif van Veekunde 2, 41-44.
Kroucamp, M. (2004). Meat quality characteristics of the springbok (Antidorcas marsupialis).
M. Sc. (Foods). Department of Food Science. University of Stellenbosch, Stellenbosch.
Kubberod, E., Ueland, O., Rodbotten, M., Westad, F. & Risvik, E. (2002). Gender specific
preferences and attitudes towards meat. Food Quality and Preference 13, 285-294.
Kupiec, B.E. (2001). Integrated food product development. 47th International Congress of
Meat Science and Technology (Pp. 100-106). Krakòw, Poland.
Lampkin, N.H. & Padel, S. (1994). The economics of organic farming: An international
perspective. Oxon: CAB International.
Landman, W.A. (1963). Enzymes and their influence on meat tenderness. In Proceedings
meat tenderness symposium (pp. 87-98). Camden: Campbell Soup Company.
Lawless, H. (1995). Dimensions of sensory quality: a critique. Food Quality and Preference
6, 191-199.
Lawless, H.T. & Claassen, M.R. (1993). Validity of descriptive and defect-oriented
terminology systems for sensory analysis of fluid milk. Journal of Food Science 58, 108-
112.
Lawless, H.T. & Heymann, H. (1998). Sensory evaluation of food: Principles and practices.
New York: Chapman & Hall.
Lawrence, T.E., Dikeman, M.E., Hunt, M.C., Kastner, C.L. & Johnson, D.E. (2003a). Effects
of calcium salts on beef longissimus quality. Meat Science 64, 299-308.
Lawrence, T.E., Dikeman, M.E., Hunt, M.C., Kastner, C.L. & Johnson, D.E. (2003b). Staged
injection marination with calcium lactate, phosphate and salt may improve beef water-
binding ability and palatability traits. Meat Science 65, 967-972.
Lawrie, R.A. (1998). Lawrie’s Meat Science (6th ed.). Cambridge, England: Woodhead
Publishing Ltd.
Lengyel, Z., Husvèth, F., Polgar, P., Szabo, F. & Magyar, L. (2003). Fatty acid composition
of intramuscular lipids in various muscles of Holstein-Friesian bulls slaughtered at
different ages. Meat Science 65, 593-598.
Light, N., Champion, A.E., Voyle, C. and Bailey, A.J. (1985). The role of epimysial, perimysial,
and endomysial collagen in determining texture in six bovine muscles. Meat Science 13,
137-149.
Liu, H.P. & Watts, B.M. (1970). Catalysis of lipid peroxidation in meats. 3. Catalysts of
oxidative rancidity in meats. Journal of Food Science 35, 596-598.

Literature review References
81
MacDougall, D.B., Shaw, B.G., Nute, G.R. & Rhodes, D.N. (1979). Effect of pre-slaughter
handling on the quality and microbiology of venison from farmed young red deer. Journal
of the Science of Food and Agriculture 30, 1160-1167.
MacRae, J., O’Reilly, L. & Morgan, P. (2005). Desirable characteristics of animal products
from a human health perspective. Livestock Production Science, 94, 95-103.
Madge, D.G. (1995). Organic Agriculture. Australia: Agriculture Victoria.
Mancini, R.A. and Hunt, M.C. (2005). Review: Current research in meat colour. Meat
Science 71, 100-121.
Marsh, B.B., Ringkob, T.P., Russell, R.L., Swartz, D.R. & Pagel, L.A. (1987). Effects of
early-post-mortem glycolytic rate on beef tenderness. Meat Science 21, 241-248.
(Abstract).
Marshall, D. (2003). Commentary on Garber et al. measuring consumer response to food
products. Food Quality and Preference 14, 17-21.
Marshall, D.L. & Bal’A, M.F. (2001). Microbiology of meats. In Hui, Nip, Rogers & Young
(Eds.) Meat Science and applications (pp. 149-169). New York: Marcel Dekker.
McCarthy, M., de Boer, M., O’Reilly, S. & Cotter, L. (2003). Factors influencing intention to
purchase beef in the Irish market. Meat Science 65, 1071-1083.
Melanson, K., Gootman, J., Myrdal, A., Kline, G. & Rippe, J. (2003). Weight loss and total
lipid profile changes in overweight women consuming beef or chicken as the primary
protein source. Nutrition 19, 409- 414.
Melton, S.L. (1990). Effects of feeds on flavour of red meat: a review. Journal of Animal
Science 68, 4421-4435.
Miller, M.F., Hoover, L.C., Cook, K.D., Guerra, A.L., Huffman, K.L., Tinney, K.S., Ramsey,
C.B., Brittin, H.C. & Huffman, L.M. (1995). Consumer acceptability of beef steak
tenderness in the home and restaurant. Journal of Food Science 60, 963-965.
Morgan, J.B., Miller, R.K., Mendez, F.M., Hale, D.S. & Savell, J.W. (1991). Using calcium
chloride injection to improve tenderness of beef from mature cows. Journal of Animal
Science 69, 4469-4476.
Morris, C.A., Theis, R.L., Miller, R.K., Acuff, G.R. & Savell, J.W. (1997). Improving the
flavour of calcium chloride and lactic acid injected mature beef top round steaks. Meat
Science 45, 531-537.
Morrissey, P.A., Sheehy, P.J.A., Galvin, K., Kerry, J. and Buckley, D.J. (1998). Lipid stability
in meat and meat products. In Proceedings of the 44th International Congress of Meat
Science and Technology (pp. 120-131).
Moskowitz, H.R. (1984). Sensory analysis, product modelling and product optimisation. In
G. Charalambous (Ed.). Analysis of foods and beverages. Modern techniques (pp. 13-
67). Orlando: Academic Press Inc.
Mottram, D.S. (1998). Flavour of muscle foods - an overview. In F. Shahidi (Ed.). Flavour
of meat, meat products and seafoods (pp. 5-24). London: Blackie Academic &
Professional.

Literature review References
82
Munoz, A.M. (1997). Importance, types, and applications of consumer data relationships. In
A.M. Munoz (Ed.). Relating consumer, descriptive, and laboratory data to better
understand consumer responses (pp. 1-7). West Conshohocken: ASTM.
Nelson, G.J., Schmidt, P.C. & Kelley, D.S. (1995). Low-fat diets do not lower plasma
cholesterol levels in healthy men compared to high-fat diets with similar fatty acid
composition and constant caloric intake. Lipids 30, 969-976.
Niemenin, M. (1992). Meat production and chemical composition of reindeer meat. In
Proceedings of the 3rd International Wildlife Ranching Symposium. Pretoria, South Africa.
Nishimura, T., Hattori, A. & Takahashi, K. (1999). Structural changes in intramuscular
connective tissue during the fattening of Japanese black cattle. Effect of marbling on beef
tenderisation. Journal of Animal Science 77, 93-104.
Offer, G. & Trinick, J. (1983). On the mechanism of water holding in meat: The swelling and
shrinking of myofibrils. Meat Science 4, 245-281.
Olsson, U., Hertzman, C. & Tornberg, E. (1994). The influence of low temperature, type of
muscle and electrical stimulation on the course of rigor, ageing and tenderness of beef
muscles. Meat Science 37, 115-131.
Onyango, C.A., Izumimoto, M. & Kutima, P.M. (1998). Comparison of some physical and
chemical properties of selected game meats. Meat Science 49, 117-125.
Papadopoulos, L.S., Miller, R.K., Ringer, L.J. & Cross, H.R. (1991). Sodium lactate effect on
sensory characteristics, cooked meat colour and chemical composition. Journal of Food
Science 56, 621-626.
Paul, P.C. (1963). Influence of methods of cooking on meat tenderness. In Proceedings
meat tenderness symposium (pp. 225-242). Camden: Campbell Soup Company.
Pauw, J. (1993). The development of venison marketing. In Forum: The venison industry.
Research requirements and possibilities (pp. 3-5). Meat industry centre, Irene
Agricultural research Council, Pretoria, South Africa.
Pearson, A.M. (1963). Objective and subjective measurements for meat tenderness. In
Proceedings meat tenderness symposium (pp. 135-160). Camden: Campbell Soup
Company.
Pietersen, T. (1993). Utilisation of venison for processed meat production. In Forum: The
venison industry. Research requirements and possibilities (pp. 41-46). Meat industry
centre, Irene Agricultural research Council, Pretoria, South Africa.
Pietrasik, Z. & Shand, P.J. (2004). Effect of blade tenderisation and tumbling time on the
processing characteristics and tenderness of injected cooked roast beef. Meat Science
66, 871-879.
Pilgrim, F.J. (1957). The components of food acceptance and their measurement. American
Journal of Clinical Nutrition 5, 171-175.
Porin, F. and Mainsant, P. (1996). In Consumer attitudes towards meat, AIR-CAT
Measurements of consumer attitudes and their influence on food choice and acceptability
(pp.19-20). Clermont-Ferrand.

Literature review References
83
Prestat, C., Jensen, J., McKeith, F.K. & Brewer, M.S. (2002). Cooking methods and endpoint
temperature effects on sensory and colour characteristics of pumped pork loin chops.
Meat Science 60, 395-400.
Rabin, M.D. (1988). Experience facilitates olfactory quality discrimination. Perception and
Pshychophysics 44, 532-540.
Reddy, B.S. (1981). Diet and excretion of bile acids. Cancer Research 41, 3766-3768.
Resurreccion, A.V.A. (1998). Consumer sensory testing for product development.
Gaithersburg, MD, USA: Aspen Publication.
Resurreccion, A.V.A. (2004). Sensory aspects of consumer choices for meat and meat
products. Meat Science 66, 11-20.
Risvik, E. (1994). Sensory properties and preferences. Meat Science 36, 67-77.
Robbins, K., Jensen, J., Ryan, K.J., Homco-Ryan, C., McKeith, F.K. & Brewer, M.S. (2003).
Consumer attitudes towards beef and acceptability of enhanced beef. Meat Science 65,
721-729. Ronco, A.L., De Stefani, E. & Fabra, A. (2003). White meat intake and the risk of breast
cancer: a case-control study in Montevideo, Uruguay. Nutrition Research 23, 151-162.
Russell, C.G. & Cox, D.N. (2004). Understanding middle-aged consumers’ perceptions of
meat using repertory grid methodology. Food Quality and Preference 15, 317-329.
Sales, J. (1995). Nutritional quality of meat from some alternative species. World review of
Animal Production 30, 47-56.
Sanchez-Escalante, A., Djenane, D., Torrescano, G., Beltran, J.A. & Roncales, P. (2001).
The effects of ascorbic acid, taurine, carnosine and rosemary powder on colour and lipid
stability of beef patties packaged in modified atmosphere. Meat Science 58, 421-429.
Sayed, N., Frans, Y. & Schönfeldt, H.C. (1999). Composition of South African foods. Parow:
Medical Research Council.
Scanga, J.A., Delmore Jr., R.J., Ames, R.P., Belk, K.E., Tatum, J.D. & Smith, G.C. (2000).
Palatability of beef steaks marinated with solutions of calcium chloride, phosphate, and
(or) beef-flavouring. Meat Science 55, 397-401.
Schönfeldt, H. (1993). Nutritional content of venison. In: Forum: The venison industry.
Research requirements and possibilities. Meat industry centre, Irene Agricultural
research Council, Pretoria, Pp. 51-60.
Sentandreu, M.A., Coulis, G. & Ouali, A. (2002). The role of muscle endopeptidases and
their inhibitors in meat tenderness. Trends in Food Science and Technology 13, 400-421.
Shackelford, S.D., Wheeler, T.L. & Koohmaraie, M. (1999). Evaluation of slice shear force
as an objective method of assessing beef longissimus tenderness. Journal of Animal
Science 77, 2693-2699.
Shackelford, S.D., Wheeler, T.L. & Koohmaraie, M. (1995). Relationship between shear
force and trained sensory panel tenderness ratings of 10 major muscles from Bos indicus
and Bos taurus cattle. Journal of Animal Science 73, 3333-3340.

Literature review References
84
Shahidi, F. (1998). Flavour of muscle foods - an overview. In F. Shahidi (Ed.). Flavour of
meat, meat products and seafoods (pp. 1-4). London: Blackie Academic & Professional.
Shorthose, W.R. & Harris, P.V. (1990). Effect of animal age on the tenderness of selected
beef muscles. Journal of Food Science 55, 1-8.
Silva, J.A., Patarata, L. & Martins, C. (1999). Influence of ultimate pH on bovine meat
tenderness during ageing. Meat Science 52, 453-459.
Skinner, J.D. & Louw, G.N. (1996). The Springbok – Antidorcas marsupialis (Zimmerman,
1780) 1st ed. (pp. 10-33). A. Dreyer (Ed.). South Africa: Transvaal Museum.
Smit, K. (2004). Meat quality characteristics of blesbok (Damaliscus dorcas phillipsi) and red
hartebeest (Alcelaphus buselaphus caama) meat. M. Consumer Sc. (Food) thesis.
Department of Consumer Science. University of Stellenbosch, Stellenbosch.
Smith, L.A., Simmons, S.L., McKeith, F.K., Betchel, P.J. and Brady, P.L. (1984). Effects of
sodium tripolyphosphate on physical and sensory properties of beef and pork roasts.
Journal of Food Science 49, 1636-1637.
Smithers, R.H.N. (1983). The mammals of the Southern African subregion (pp. 615-617,
627-631). University of Pretoria, Pretoria.
Steenkamp, J.E.M. (1997). Dynamics in consumer behaviour with respect to agricultural and
food products. In Wierenga, B., Van Tilburg, A., Grunert, K., Steenkamp, J.E.M., Wedel,
M. (Eds). Agricultural Marketing and consumer behaviour in a changing world (pp. 143-
188). Boston: Kluwer Academic Publishers.
Steenkamp, J.E.M. (1990). Conceptual model of the quality perception process. Journal of
Business Research 21, 309-333.
Stevenson, J.M., Seman, D.L., Weatherall, I.L. & Littlejohn, R.P. (1989). A research note.
Evaluation of venison colour by an objective method using CIELAB values. Journal of
Food Science 54, 1661-1662.
Stoeckli, R. & Keller, U. (2004). Nutritional fats and the risk of type 2 diabetes and cancer.
Physiology and Behaviour 83, 611-615.
Stone, H. & Sidel, J.L. (1993). Sensory evaluation practices, 2nd ed. San Diego, CA, USA:
Academic Press.
Streitel, R.H., Ockerman, H.W. & Cahill, V.R. (1977). Maintenance of beef tenderness by
inhibition of rigor mortis. Journal of Food Science 42, 583-585.
Swatland, H.J. (1994). Structure and development of meat animals and poultry (pp.143-
228). Lancaster: Technomic Publishing Co.
Swatland, H.J. (1984). Structure and development of meat animals. Ontario Agricultural
College, University of Guelph, Englewood Cliffs, NY: Prentice Hall.
Takahashi, K., Kim, O.H. & Yano, K. (1987). Calcium-induced weakening of Z-discs in post
mortem skeletal muscle. Journal of Biochemistry 101, 767-773.
Thomas, A.R., Gondoza, H., Hoffman, L.C., Oosthuizen, V. & Naudè, R.J. (2004). The roles
of the proteasome, and cathepsins B,L,H and D, in ostrich meat tenderisation. Meat
Science 67, 113-120.

Literature review References
85
Trichopoulou, A., Costacou, T., Bamia, C. & Trichopoulos, D. (2003). Adherence to a
Mediterranean diet and survival in a Greek population. New England Journal of Medicine
348, 2599-2608.
Valsta, L.M., Tapanainen, H. & Männistö, S. (2005). Meat fats in nutrition - a review. Meat
Science 70, 525-530.
Van Schalkwyk, S. (2004). Meat quality characteristics of three South African game species:
Black wildebeest (Connochaetes gnou), Blue wildebeest (Connochaetes taurinus) and
Mountain reedbuck (Redunca fulvorufula). M. Sc. Cons. (Foods). Department of
Consumer Science. University of Stellenbosch, Stellenbosch.
Van Trijp, H.C.M., Steenkamp, J.E.M. & Candel, M.J.J.M. (1997). Quality labelling as
instrument to create product equity: The case of IKB in the Netherlands. In Wierenga, B.,
Van Tilburg, A., Grunert, K., Steenkamp, J.E.M., Wedel, M. (Eds). Agricultural Marketing
and consumer behaviour in a changing world (pp. 201-215). Boston: Kluwer Academic
Publishers.
Van Zyl, L. & Ferreira, A.V. (2004). Physical and chemical carcass composition of springbok
(Antidorcas marsupialis), blesbok (Damaliscus dorcas phillipsi) and impala (Aepyceros
melampus). Small Ruminant Research 53, 103-109.
Van Zyl, J.H.M., Von la Chevallerie, M. & Skinner, J.D. (1969). A note on the dressing
percentage in the springbok (Antidorcas marsupialis) and impala (Aepyceros melampus).
Proceedings of the South African Society for Animal Production 8, 199-200.
Vatansever, L., Kurt, E., Enser, M., Nute, G.R., Scollan, N.D., Wood, J.D. and Richardson,
R.I. (2000). Shelf life and eating quality of beef from cattle of different breeds given diets
differing in n-3 polyunsaturated fatty acid composition. Animal Science 71, 471-482.
Verbeke, W. & Vackier, I. (2004). Profile and effects of consumer involvement in fresh meat.
Meat Science 67, 159-168.
Viljoen, J.J. (1999). ‘n Vergelyking van die lipiedkomponente van springbokvleis met die van
beesvleis en die verwante belangrikheid vir aspekte van die menslike gesondheid. Suid-
Afrikaanse Tydskrif vir Natuurwetenskap en Tegnologie 18, 51-53.
Von la Chevallerie, M. (1972). Meat quality of seven wild ungulate species. South African
Journal of Animal Science 2, 101-103.
Vote, D.J., Platter, W.J., Tatum, J.D., Schmidt, G.R., Belk, K.E., Smith, G.C. & Speer, N.C.
(2000). Injection of beef strip loins with solutions containing sodium tripolyphosphate,
sodium lactate and sodium chloride to enhance palatability. Journal of Animal Science
78, 952-957.
Wada, M., Suzuki, T., Yaguti, Y. & Hasegawa, T. (2002). The effects of pressure treatments
with kiwi fruit protease on adult cattle semitendinosus muscle. Food Chemistry 78, 167-
171.
Wansink, B. (2003). Response to “Measuring consumer response to food products”.
Sensory tests that predict consumer acceptance. Food Quality and Preference 14, 23-26.

Literature review References
86
Wansink, B. & Park, S.B. (2000). Comparison methods for identifying heavy users. Journal
of Advertising Research 40, 61-72.
Wansink, B., Painter, J.M. & van Ittersum, K. (2001). Descriptive menu labels. Effect on
sales. Cornell Hotel and Restaurant administrative Quarterly 42, 68-72.
Warren, H.E., Scollan, N.D., Hallett, K., Enser, M., Richardson, R.I., Nute, G.R. and Wood,
J.D. (2002). The effects of breed and diet on the lipid composition and quality of bovine
muscle. Proceedings of the 48th Congress of Meat Science and Technology (pp. 370-
371).
Warriss, P.D. (2000). Meat Science: an introductory text. Wallingford, Oxon: CAB
International Publishing.
Webb, R. (2001). It’s all in the game. Diabetes Forecast 54, 30-33.
Wells, A.M., Haub, M.D., Fluckey, J., Williams, D.K., Chernoff, R. & Campbell, W.W. (2003).
Comparisons of vegetarian and beef-containing diets on haematological indexes and iron
stores during a period of resistive training in older men. Journal of the American Dietetic
Association 103, 594-601.
Wheeler, T.L., Koohmaraie, M. & Shackelford, S.D. (1997). Effect of post-mortem injection
time and postinjection ageing time on the calcium-activated tenderisation process in beef.
Journal of Animal Science 75, 2652-2660.
Wheeler, T.L., Koohmaraie, M. & Shackelford, S.D. (1996a). Effect of vitamin C
concentration and co-injection with calcium chloride on beef retail display colour. Journal
of Animal Science 74, 1846-1853.
Wheeler, T.L., Shackelford, S.D. & Koohmaraie, M. (1996b). Sampling, cooking, and coring
effects on Warner-Bratzler shear force values in beef. Journal of Animal Science 74,
1553-1562.
Whipple, G. & Koohmaraie, M. (1993). Calcium chloride marination effects on beef steak
tenderness and calpain proteolytic activity. Meat Science 33, 265-275.
Whipple, G., Koohmaraie, M., Dikeman, M.E., Crouse, J.D., Hunt, M.C. & Klemm, R.D.
(1990). Journal of Animal Science 68, 2716-2728.
Wierbicki, E., Cahill, V.R. & Deatherage, F.E. (1957). Effects of added sodium chloride,
potassium chloride, calcium chloride, magnesium chloride and citric acid on meat
shrinkage at 70 °C and of added sodium chloride on drip losses after freezing and
thawing. Food Technology 11, 74-76.
Wiklund, E., Barnier, V.M.H., Smulders, F.J.M., Lundström, K. & Malmfors, G. (1997).
Proteolysis and tenderisation in reindeer (Rangifer tarandus tarandus L.) Bull longissimus
thoracis muscle of varying ultimate pH. Meat Science 46, 33-43.
Wismer-Pedersen, J. & Briskey, E.J. (1961). Relationship of post-mortem acidity and
temperature. Food Technology 15, 232 - 236.
Wood, J.D., Richardson, R.I., Nute, G.R., Fisher, A.V., Campo, M.M., Kasapidou, E., Sheard,
P.R. & Enser, M. (2004). Effects of fatty acids on meat quality: a review. Meat Science
66, 21-32.

Literature review References
87
Younathan, M.T. and Watts, B. (1959). Relationship of meat pigments to lipid oxidation. Food
Research 24, 728-734.
Young, O.A. & West, J. (2001). Meat colour. In Hui, Nip, Rogers & Young (Eds.) Meat
Science and applications (pp. 39-69). New York: Marcel Dekker.
Young, O.A., Frost, D.A., West, J. & Braggins, T. (2001). Analytical methods. In Hui, Nip,
Rogers & Young (Eds.) Meat Science and applications (pp. 103-126). New York: Marcel
Dekker.
Yu, L.P. and Lee, Y.B. (1986). Effects of post-mortem pH and temperature on bovine muscle
structure and meat tenderness. Journal of Food Science 51, 774-780.

Effect of enhancement on the physical characteristics of blesbok and springbok
88
Chapter 3 The effect of enhancement on the physical characteristics of five
muscles of the blesbok (Damaliscus dorcas phillipsi) and springbok (Antidorcas marsupialis)
Abstract Five muscles (M. biceps femoris, M. longissimus et lumborum, M. rectus femoris, M.
semitendinosus and M. supraspinatus) from springbok (n=10) and blesbok (n=10) originating
from the Gariep Nature Reserve in South Africa were used in this investigation. There were
marked differences among the five muscles for most of the physical characteristics
investigated, but in both species there were no significant differences amongst the five
muscles for the two colour characteristics a* value and chroma. The influence of an inorganic
salt solution, injected into the meat post mortem, on the drip loss, cooking loss, tenderness (in
terms of its effect on the Warner-Bratzler shear force values) and colour properties was
investigated. Both drip and cooking losses were higher in the enhanced muscles versus the
untreated muscles, whilst the Warner-Bratzler shear force values were much lower in the
enhanced muscles. The colour characteristics were, in general, lower in the enhanced
muscles as compared to untreated samples. Results indicate that the tenderness of game
meat may be enhanced with the injection of an inorganic salt solution with a minimal negative
influence on the tested physical characteristics of the muscles.
Key words: Blesbok, Springbok, Game meat, Injected meat, Cooking loss, Drip loss,
Tenderness, Colour
1. Introduction Over the last few years, the increased health consciousness of consumers may have
created the perfect marketing niche for game meat. Kritzinger (2002) noted that the cause of
game meat may be moved forwards in the meat industry by marketing it to especially health
conscious red meat consumers. Various health reports, such as that by the British
Government’s Committee on Medical Aspects of Food and Nutrition (COMA, 1984), have
caused consumers to consider red meat as unhealthy – this is in complete disagreement with
the view held before such reports surfaced. Traditionally meat was seen as an overall
healthy, nutritious food necessary for the maintenance of good health (Higgs, 2000). Since
then red meat has become linked to a high fat and cholesterol content (Scönfeldt, 1993;
Higgs, 2000) and with various health-conditions such as coronary heart disease and cancer.
Chizzolini, Zanardi, Dorigoni and Ghidini (1999) reported a relationship between high intake of
particularly saturated fat and an increased risk of cancer, such as breast and colon cancer.
Even though Higgs (2000) reported that there is insufficient scientific evidence to directly
associate meat with the development of human cancers, some consumers have eliminated

Effect of enhancement on the physical characteristics of blesbok and springbok
89
red meat completely from their diets. A new world trend that addresses this fear is the
marketing of “new” meat types derived from “wild” animals such as deer (venison) (Malmfors
and Wiklund, 1996; Wiklund, Stevenson-Barry, Duncan and Littlejohn, 2001), game meat
(Hoffman, Muller, Schutte and Crafford, 2004) and ostrich (Sales, 1995).
Several authors have reported that game species have fat contents less than
3.0g/100g (Kroon, Van Rensburg and Hofmeyr, 1972, Schönfeldt, 1993; Pauw, 1993;
Hoffman, 2000). For example, the fat content of seven wild ungulate species varied between
1.4g/100g and 2.4g/100g, with springbok and blesbok both having fat contents of 1.7g/100g
(Von la Chevallerie, 1972). Furthermore, Schönfeldt (1993) stated that game meat had
higher levels of polyunsaturated fatty acids and a lower saturated fat content than beef and
this view has been confirmed by other authors (Viljoen, 1999; Hoffman, 2000). Game meat
can thus be considered a healthier red meat because of its low fat and cholesterol and its
beneficial fatty acid composition.
Another blow to the image of meat in the last decade has been the outbreak of
various diseases (foot-and-mouth disease and Bovine Spongiform Encepalopathy (BSE) or
mad cow disease, to name but two) among meat animals, with consumers’ concern about
hormone- and antibiotic-use in animal production systems also mounting (Swatland, 1984;
Higgs, 2000). Furthermore, various animal rights organizations have lobbied against meat
production and this has made consumers very aware of animal rights and their welfare.
Animal welfare, along with animal and product safety and environmentally friendly production,
have indeed become hot topics with consumers in the past few years (Bernues, Olaizola and
Corcoran, 2003). In this regard game meat is the ideal red meat source because it can be
viewed as a wholesome product – game animals contain no added antibiotics, growth
hormones or other chemicals readily used in conventional farming systems. South African
game animals are generally farmed in extensive, free range farming systems with minimal
contact with humans and therefore game meat can be considered an organic product (Pauw,
1993; Hoffman and Bigalke, 1999, Jansen van Rensburg, 2001).
In the past, the image of game meat has suffered mainly because of ignorance –
consumers are ill informed about the potential health benefits of game meat and are left in the
dark as to proper preparation methods (Webb, 2001; Hoffman et al., 2004). Consumers often
end up with “tough, dry and chewy” meat because of incorrect preparation and cooking
techniques (Webb, 2001) and game meat quality is generally seen as unpredictable
(Bronkhorst, 2005). Enhancement of meat with various different combinations of inorganic
salts and lactates has improved the tenderness of the muscles and also resulted in a more
consistent quality product (Lawrence, Dikeman, Hunt, Kastner and Johnson, 2003a,b;
Hoffman, 2006).
Springbok and blesbok are two of the most common game species favoured by game
farmers in South Africa (Conroy and Gaigher, 1982). Springbok was found to be the game
species most often consumed by South African consumers (Hoffman, Muller, Schutte, Calitz
and Crafford, 2005) and was found to be one of the three game meat species that are

Effect of enhancement on the physical characteristics of blesbok and springbok
90
regularly available in South African supermarkets, butcheries and restaurants (Hoffman et al.,
2004).
The aim of this study was to determine the physical characteristics of five blesbok
and springbok muscles (M. biceps femoris, M. longissimus et lumborum, M. rectus femoris,
M. semitendinosus and M. supraspinatus) and to investigate the effects that enhancing game
meat with an inorganic salt solution might have on the physical meat quality.
2. Materials and Methods 2.1 Animals
Ten blesbok (Damaliscus dorcas phillipsi) and ten springbok (Antidorcas marsupialis)
were randomly harvested at the Gariep Nature Reserve in the Free State Province of South
Africa. All animals were male and carcass weight varied between 16.4 kg and 42.2 kg and
17.4 kg and 30.4 kg for blesbok and springbok, respectively. Animals were harvested at night
by a professional cull team, using similar culling methods to those described by Lewis,
Pinchin and Kestin (1997), and only head or neck shots were taken. Animals were
exsanguinated within 5 minutes of harvesting and together with the culling methods used this
resulted in animals being exposed to minimal stress conditions. Carcasses were hung by the
Achilles tendon. Bled and eviscerated skin-on carcasses were transported, in a temperature-
controlled vehicle, to Stellenbosch where they were skinned and processed further
approximately 24 h after harvesting.
An inorganic salt solution (Freddy Hirsch Tenderbite #802539; P.O. Box 2554, Cape
Town, 8000) with a chemical composition of sodium (5.21%) and potassium (2.53%) di- and
triphosphates (3.45%), lactate (12.40%) and water (75.75%) to give a pumped gain of 20%,
with a retention value of approximately 15%, after a resting period of 2h, was injected into the
left halves of the springbok carcasses. The right and left hand side M. biceps femoris, M.
longissimus et lumborum, M. rectus femoris, M. semitendinosus and M. supraspinatus of
each springbok carcass were removed. The muscles were trimmed of visible fat and
connective tissue. As the blesbok is a larger antelope species and the halved blesbok
carcasses were too large to fit into the Rühle Curing Centre, the same five muscles were first
removed and trimmed as described above prior to the muscles from the left hand side being
injected with the same inorganic salt solution. Injection was performed at a pressure of 2.4
bar at 30 strokes per minute on a Rühle Curing Centre IR56 (Rühl GmbH, D-79865,
Grafenhausen, Germany). Springbok carcass halves and blesbok muscles were weighed
before injection and again after injection (with a resting period of 2 hours) to assess final
pumped gain. All the right hand samples served as controls. After the required samples for
the determination of physical characteristics had been removed, the remaining samples were
individually vacuum packed and frozen at –20 ºC until required for either chemical or sensory
analyses.

Effect of enhancement on the physical characteristics of blesbok and springbok
91
2.2. Physical analyses The colour of the raw samples was measured 24 h postmortem with a GmbH
Colorimeter, after a 20-minute period of blooming was allowed. Four measurements were
performed at randomly selected positions on each sample. L*, a* and b* values were
measured on the meat samples, while chroma and hue angle were calculated (Commission
International De l’Eclairage, 1976).
Drip loss and cooking loss were performed according to the procedures described by
Honikel (1998) and expressed as a percentage of the initial weight. Four 1.0cm thick samples
were cut from each of the five muscles (two each for cooking loss and drip loss) with an
approximate weight of 61g and 42g for M. biceps femoris, 45g and 31g for M. longissimus et
lumborum, 33g and 22g for M. rectus femoris, 25g and 17g for M. semitendinosus, and 30g
and 18g for M. supraspinatus of blesbok and springbok, respectively. Drip loss was
determined by placing individually weighed samples in a net inside a polythene bag (under
atmospheric pressure) for a period of 24h at 4ºC. Samples were removed, dried and
weighed.
Cooking loss was performed by submerging individually weighed samples sealed
inside thin-walled polythene bags, in a water-bath at 75ºC for 1 h. Samples were removed,
allowed to cool in cold water, dried and weighed.
The cooled cooking loss samples were used to determine the toughness of the meat
by measuring the maximum force (Newton) necessary to shear a cylindrical core (1.27
diameter) of cooked meat perpendicular to the grain at a crosshead speed of 200mm/min.
Shear force measurements were produced with a Warner-Bratzler shear attachment fitted to
an Instron Universal Testing machine.
Crison 507 pH meters were used to measure pH. pH measurements were performed
on springbok samples before and after inorganic salt solution was injected.
2.2 Statistical analyses
The experiment consisted of a randomised block design with two main effects: salt,
i.e. salt enhanced or not, and muscle, i.e. M. biceps femoris, M. longissimus et lumborum, M.
rectus femoris, M. semitendinosus and M. supraspinatus, replicated in 10 blocks (10 animals)
per species. The standard GLM procedure was used when the physical data were
statistically analysed (SAS, 1999) after determining that the data was normally distributed.
Differences between treatments were tested for by means of the Bonferroni t-test. The
objective of this investigation was not to compare species, but rather differences within
species, therefore no statistical comparisons were made with species as main effect.
3. Results and discussion 3.1. Pumped gain
The pumped gain experienced by the halved springbok carcasses was 23.33%, while
the mean pumped gain for the five blesbok muscles was 16.60% (M. biceps femoris, 18.03%;

Effect of enhancement on the physical characteristics of blesbok and springbok
92
M. longissimus et lumborum, 12.28%; M. rectus femoris, 14.91%; M. semitendinosus,
20.08%; and M. supraspinatus, 16.99%). The retention objective of 15% was therefore
achieved with the blesbok muscles, but the springbok carcass halves retained more moisture
than was anticipated. The pumped gain is the direct measurement of the amount of moisture
added to the meat and may shed light on such characteristics as cooking loss, drip loss and
juiciness. These results show that moisture was definitely added to the enhanced meat.
However, the question remains whether the added moisture would be able to contribute to the
eating quality of the meat in the form of juiciness, or whether it is bound too tightly, in which
case the meat would remain dry, or whether it is bound too loosely and may escape as drip or
cooking loss.
3.2. Cooking loss, drip loss, tenderness and pH
3.2.1. Muscle differences
The results of the untreated (control) muscles were used to determine the differences
amongst the five muscles investigated in both species (Table 1).
Water holding capacity (WHC) has an important function in meat quality. By affecting
tenderness and juiciness it influences meat-eating quality and also directly influences physical
properties, such as cooking loss and drip loss (Honikel, 1998; Lawrie, 1998). All untreated
blesbok muscles, except M. semitendinosus and M. supraspinatus, differed significantly
(P<0.05) in terms of cooking loss, while there were significant (P<0.05) differences between
most untreated springbok muscles with the exception of M. rectus femoris, which did not differ
significantly from either the M. semitendinosus or M. biceps femoris.
In terms of blesbok drip loss, no significant differences were found between the M. biceps femoris and either the M. longissimus et lumborum, or the M. semitendinosus, and the
M. semitendinosus and M. supraspinatus did not differ significantly from one another either.
The M. rectus femoris differed significantly from the other muscles in terms of drip loss. There
was less variation in the drip loss of springbok muscles, with M. longissimus dorsi, M. semitendinosus and M. rectus femoris not differing significantly, and M. biceps femoris, M. supraspinatus and M. rectus femoris not differing significantly, while these two groups, with
the exception of the M. rectus femoris, differed significantly (P<0.05) from each other.
The blesbok muscles could be arranged in descending order of tenderness (from
most tender to least tender) as follows: M. longissimus et lumborum, M. rectus femoris, M. biceps femoris, M. supraspinatus and M. semitendinosus. The M. longissimus et lumborum,
M. rectus femoris and M. biceps femoris did not differ significantly, also the M. biceps femoris
and M. supraspinatus did not differ significantly from each other, but there were significant
differences between these groups, except for the M. biceps femoris which only differed
significantly (P<0.05) from the M. semitendinosus in terms of tenderness.
In the springbok, the M. semitendinosus and M. supraspinatus did not differ
significantly, while the M. biceps femoris and M. rectus femoris did not differ significantly from
each other, but the three groups of muscles differed significantly (P<0.05) in terms of

Effect of enhancement on the physical characteristics of blesbok and springbok
93
tenderness. The five springbok muscles could be arranged in descending order of
tenderness as follows: M. longissimus et lumborum, M. rectus femoris, M. biceps femoris, M. semitendinosus and M. supraspinatus. These results differ slightly from tenderness results
reported for different beef muscles (Shackelford, Wheeler and Koohmaraie, 1995). These
authors found the M. longissimus dorsi to have the lowest (2.7) and also the highest (6.7)
Warner-Bratzler shear force value (kg), with M. biceps femoris, following (3.2 min.; 6.0 max.),
then M. supraspinatus (3.0 min.; 5.8 max.),with M. semitendinosus (3.3 min.; 5.8 max.)
showing the lowest values. Jeremiah, Smith and Carpenter (1971) reported that the M. rectus
femoris and M. semitendinosus received the highest sensory tenderness rating of the five
sheep muscles investigated in their study. According to the shear force values obtained for
enhanced muscles in this study, the muscles can be arranged from the most tender to the
toughest muscle as follows: M. longissimus et lumborum (most tender), M. rectus femoris, M. biceps femoris, M. semitendinosus and M. supraspinatus (least tender), with both species
showing the same tendency.
The five springbok muscles could be divided into two clear groups for pH value: the
M. rectus femoris and M. supraspinatus being in the one group and the M. biceps femoris and
M. longissimus dorsi being in the other group, with only M. semitendinosus belonging to both
groups and the two groups differing significantly (P<0.05) from each other.
3.2.2. Treatment differences
Treatment differences were investigated in both species by comparing the results of
the enhanced muscles with the results found for the untreated muscles.
In this study the cooking loss of the five enhanced muscles averaged 37.79%, while
the untreated muscle had a mean of 36.86% for blesbok and 34.92% for enhanced and
34.01% for untreated springbok (Table 1). In all cases the upper limit was set by the M. supraspinatus, while the lower limit was set by the M. longissimus et lumborum. It is
expected that the enhanced muscles would experience greater moisture losses upon cooking
because of the added moisture (because of the water content of the injected solution). The
enhanced muscles showed significantly (P<0.05) higher cooking losses than the untreated
muscles in both species. There were, however, no significant differences found in the
treatments of blesbok M. longissimus et lumborum and M. rectus femoris or in springbok M. biceps femoris and M. semitendinosus.
Cooking loss is the moisture lost from muscle during cooking and, along with drip
loss, is a measure of the WHC of meat. Cooking loss can mostly be attributed to structural
changes occurring in the muscle because of the denaturing of various proteins at varying
temperatures (37-75ºC). Cooking loss is associated with tenderness and several authors
found a significant relationship between tenderness and cooking loss, where increased
tenderness was found in meat with decreased cooking loss (Briskey, 1963; Silva, Patarata
and Martins, 1999; Thomas, Gondoza, Hoffman, Oosthuizen and Naudè, 2004). In the
present study, however, the enhanced samples showed higher tenderness than the untreated

Effect of enhancement on the physical characteristics of blesbok and springbok
94
samples even though the untreated samples displayed lower cooking losses than the
enhanced samples. This may be ascribed to a diluting effect of the bound water – when more
water is bound (in a fixed area), a smaller amount of muscle fibres will be found, and
therefore less resistance is offered (Thomas et al., 2004).
Smit (2004) reported cooking for male blesbok as 36.11%, while Kroucamp (2004)
reported values of 31.50 ± 0.47% for the cooking of male springbok. The cooking loss results
of this study were found to be higher in both the untreated and enhanced muscles.
Table 1 Least squared means for physical analyses of five blesbok and springbok muscles, either
enhanced with an inorganic salt solution or left untreated.
Blesbok Springbok Muscles Cooking
loss (%) Drip loss
(%) Tough-ness
(N/1.27cmØ)
Cooking loss (%)
Drip loss (%)
Tough-ness
(N/1.27cmØ)
pH
Biceps femoris Enhanced 38.092 4.476 25.406 34.092 2.737 23.322 5.924 Untreated 36.365 b 3.214 a, b 40.077 b, c 32.902 c 1.981 b 32.740 b 5.660 b SEM 0.287 0.252 1.306 0.571 0.104 0.967 0.013 P-value 0.0002 0.0013 <0.0001 0.1511 <0.0001 <0.0001 <0.0001 Longissimus et lumborum
Enhanced 33.368 3.507 18.860 30.416 3.779 16.083 5.944 Untreated 32.987 d 4.694 a 41.201 c 28.482 d 2.818 a 26.603 c 5.642 b SEM 0.394 0.162 1.644 0.475 0.189 0.888 0.010 P-value 0.4987 <0.0001 <0.0001 0.0074 0.0011 <0.0001 <0.0001 Rectus femoris Enhanced 35.684 2.845 20.730 34.454 3.361 19.480 6.029 Untreated 35.957 c 2.781 c 40.783 c 35.403 b, c 2.421 a, b 33.061 b 5.762 a SEM 0.306 0.175 0.892 0.313 0.120 0.655 0.015 P-value 0.5341 0.7974 <0.0001 0.0405 <0.0001 <0.0001 <0.0001 Semitendinosus Enhanced 40.483 3.451 27.164 36.931 3.419 28.943 5.968 Untreated 39.345 a 2.708 b, c 45.313 a 35.620 b 2.860 a 40.367 a 5.696 a, b SEM 0.300 0.145 0.997 0.506 0.138 1.003 0.008 P-value 0.0118 0.0011 <0.0001 0.0774 0.0078 <0.0001 <0.0001 Supraspinatus Enhanced 41.330 3.135 33.632 38.688 2.673 31.973 5.968 Untreated 39.646 a 3.364 c 51.387 b 37.638 a 2.182 b 41.674 a 5.806 a SEM 0.232 0.206 1.216 0.315 0.105 1.413 0.011 P-value <0.0001 0.4374 <0.0001 0.0200 0.0018 <0.0001 <0.0001 a, b, c, d Muscles from the control group with different superscripts differ significantly (P<0.05).
The addition of several chemical components to meat, as is the case here where the
meat was enhanced with an inorganic salt solution, will undoubtedly lead to several changes,
including the ion-protein relationship existing in the muscle. Changing the ion-protein
relationship can lead to increased WHC because of the changes brought on through the K+-

Effect of enhancement on the physical characteristics of blesbok and springbok
95
absorption and Ca2+-release and this can clearly be observed in comminuted meats when the
salts of weak acids (particularly phosphates and polyphosphates) are added (Lawrie, 1998).
An increased water up-take by myofibrils in strong salt solutions was reported and attributed
mainly to the disruption in the forces determining the arrangement of the filaments at the Z-
and M-lines and between the myosin heads and the actin filaments (Offer and Trinick, 1983).
This happens when the lattice of thick and thin filaments expand when the increasingly
negatively charged components repel one another.
Adding phosphate to meat improved juiciness and Prestat, Jensen, McKeith and
Brewer (2002) postulated that it was because of the added moisture (the water included in the
enhancement solution) as well as the increased moisture retention due to the increased pH
levels caused by the added phosphate. Phosphate addition also caused increased water
retention in the work by Baublits, Pohlman, Brown Jr. and Johnson (2005). The untreated
samples in their study had greater levels of free water, but the phosphate-treated samples
contained a higher total moisture percentage. This was probably the case in the present
study where higher moisture losses (loss of free water as drip and cooking losses) were
found.
Jeremiah, Dugan, Aalhus and Gibson (2003) observed that muscles differed
extensively when cooking loss was considered. Those cuts that contained more fat showed
lower cooking losses and cuts that contained more insoluble and total hydroxyproline
sustained greater total cooking losses because of higher connective tissue content. However,
in this study the enhanced samples showed slightly lower fat contents (chapter 4) than the
untreated samples, probably due to a diluent effect caused by the added enhancement
solution, as was suggested by Thomas et al. (2004). Therefore, the bulk of the differences
observed in the cooking losses of enhanced vs. untreated muscles must be due to the
addition of some of the inorganic salts present in the enhancement solution.
The mean drip loss value for blesbok was 3.48% for enhanced and 3.35% for
untreated samples, while the average drip loss for enhanced springbok muscles was 3.19%
and 2.45% for untreated springbok muscles. Significant treatment differences were observed
in most of the muscles in both species, except in blesbok M. rectus femoris and M. supraspinatus. However, this time the two species did not follow the same trend – all of the
enhanced springbok muscles had significantly higher (P<0.01) drip losses than the untreated
muscles, but the differences in the blesbok muscles were slightly haphazard. While the
enhanced M. biceps femoris and M. semitendinosus had significantly higher (P<0.01) values
than the untreated muscles, the treatment difference in the M. longissimus et lumborum was
highly significant (P<0.0001), with the untreated muscle having a higher value than the
enhanced muscle. Drip loss can mostly be attributed to the free water component found in meat, which
has the ability to freely flow from meat as purge (Cover, Ritchey and Hostetler, 1962).
Thomas et al. (2004) observed that cooking loss and drip loss showed opposite tendencies
and that, as percentage cooking loss increased, drip loss percentage decreased as shear

Effect of enhancement on the physical characteristics of blesbok and springbok
96
force values increased. In this study, however, it was found that the enhanced samples had
both higher drip and cooking losses as well as lower shear force values (indicating higher
tenderness values).
The observed drip losses of the control muscles compare well with those reported by
Smit (2004) (4.30% for male blesbok) and Kroucamp (2004) (2.80 ± 0.19%male springbok).
Clearly enhancing meat with an inorganic salt solution causes it to have higher moisture
contents and therefore higher cooking and drip losses were observed, in the most part, in the
enhanced muscles as compared to the untreated muscles. Indeed, in springbok meat, all the
enhanced muscles (except the M. supraspinatus) had significantly (P<0.01) higher moisture
levels, while most of the blesbok muscles (except M. biceps femoris and M. longissimus et
lumborum) had significantly higher moisture (P<0.0001) levels (results not shown).
Tenderness is the most important quality attribute of meat, as far as consumers are
concerned (Lawrie, 1998; Pietrasik and Shand, 2004). Tenderness was described by
Deatherage (1963) as “a quality representing the summation of properties of the various
protein structures of skeletal muscle.” Furthermore, this author stated that tenderness could
be directly related to the protein structure of the muscle and the denaturation, coagulation and
hydrolysis of those proteins.
In the current study, a highly significant (P<0.0001) improvement was found in the
Warner-Bratzler shear force values of all five enhanced muscles in both species. The shear
force values were found to be an average of 25.16 N/1.27cm for enhanced and 43.75
N/1.27cm for untreated blesbok muscles and 23.96 N/1.27cm for enhanced and 34.89
N/1.27cm for untreated springbok muscles (Table 1). The tenderness of the game meat was
significantly improved by the injected inorganic salt solution.
Several authors have reported on the improved tenderness caused by enhancing
meat with various inorganic salt solutions (Papadopoulos, Miller, Ringer and Cross, 1991;
Scanga, Delmore Jr., Ames, Belk, Tatum and Smith, 2000; Lawrence et al., 2003b). Treating
top round roasts with sodium lactate improved the tenderness, reported Papadopoulos et al.
(1991), but using concentrations higher than 2.0% did not cause further improvements.
Phosphate addition has also been shown to improve meat tenderness (Scanga et al,
2000; Lawrence et al, 2003b) and Deatherage (1963) reported that sodium phosphate is
commonly used in the meat industry to improve protein solubility. Baublits et al, (2005)
reported that steaks enhanced with sodium hexameta-phosphate, sodium tripolyphosphate or
tetrasodium pyrophosphate, received higher sensory tenderness scores than steaks treated
with sodium chloride or left untreated, even though no differences could be detected in the
Warner-Bratzler shear force values between the treatments. When pork M. longissimus dorsi
was injected with a phosphate-salt-solution, Prestat et al. (2002) reported improved Warner-
Bratzler shear force values and observed that the tenderness was stabilised under a variety
of conditions.
Hoffman (2006) reported improved shear force values in both the M. longissimus and
M. semitendinosus of mature cows enhanced with a similar inorganic salt solution as the one

Effect of enhancement on the physical characteristics of blesbok and springbok
97
used in this study. Warner-Bratzler shear force values of 50.40 ± 8.7 N/1.27cm for untreated
and 36.73 ± 7.1 N/1.27cm for enhanced M. longissimus and 48.72 ± 6.8 N/1.27cm for
untreated and 42.03 ± 6.74 N/1.27cm for enhanced M. semitendinosus were reported by
Hoffman (2006). The treatment difference for the M. longissimus was highly significant
(P<0.0001) and a significant difference (P<0.05) was found in the treatment of the M. semitendinosus.
There were highly significant (P<0.0001) differences observed between the pH values
of enhanced and untreated muscles, with enhanced muscles having higher pH values than
the untreated muscles (Table 1) because of the added phosphates (Hoffman, 2006). pH
measurements were only performed on springbok muscles. The mean pH for the enhanced
muscles was 5.97 and 5.71 for the untreated muscles. The results of the untreated muscles
are in agreement with the results of Kroucamp (2004). However, the results of the enhanced
muscles are not supported by the literature. Eilers, Morgan, Martin, Miller, Hale and Acuff
(1994) reported that the pH of lactic acid-treated meat declined to values below those of
untreated samples. Baublits et al. (2005) found the pH values of beef treated with sodium
hexameta-phosphate to be lower than untreated samples and similar to sodium chloride-
treated beef. Although, these authors did report that the pH values of beef treated with either
tripolyphosphate or tetrasodium pyrophosphate were higher than untreated samples.
3.3. Colour
Meat colour is extremely important during the purchasing decision process of
consumers, since consumers use colour as a cue for the freshness of meat (Jeremiah, Smith
and Carpenter, 1972; Young and West, 2001). When the untreated muscles were
investigated (Table 2), it was found that there were definite differences between muscles in
both species for all the colour characteristics, except for the a* values and the chroma values
for which none of the five muscles of either blesbok or springbok differed significantly.
In blesbok, the M. supraspinatus did not differ significantly from the M. biceps
femoris, M. rectus femoris or the M. longissimus et lumborum and there were no significant
differences between the M. biceps femoris and M. rectus femoris, however, there were
significant (P<0.05) differences between the M. semitendinosus and M. supraspinatus and
between the M. biceps and M. rectus femoris and the M. longissimus et lumborum and M.
semitendinosus when the L* value was investigated. The five springbok muscles could be
divided into two significantly (P<0.05) different groups when the L* value was considered, with
the M. rectus femoris, M. semitendinosus and M. supraspinatus being in the one group (not
differing significantly from each other), the M. longissimus et lumborum being in the other
group, differing significantly from the first group and the M. biceps femoris not differing
significantly from either group. When the b* values are considered, the blesbok M. biceps
femoris, M. longissimus et lumborum, M. rectus femoris and M. supraspinatus showed no
significant difference, but these four muscles all differed significantly (P<0.05) from the M.
semitendinosus. For the same characteristic in the springbok, the M. semitendinosus and M.

Effect of enhancement on the physical characteristics of blesbok and springbok
98
supraspinatus did not differ significantly from each other, but there was a significant difference
(P<0.05) between these two muscles and the M. longissimus et lumborum, whereas there
was no significant difference between the three muscles already mentioned and the M. biceps
femoris and M. rectus femoris (both the latter two muscles did not differ significantly from
each other).
When hue was considered, the blesbok muscles followed a similar trend as was
shown with the b* value – there were no significant differences between the M. biceps
femoris, M. longissimus et lumborum, M. rectus femoris and M. supraspinatus and all these
muscles differed significantly (P<0.05) from the M. semitendinosus. In the springbok, the M.
rectus femoris and M. supraspinatus did not differ significantly from each other in terms of hue
and both these muscles did not differ significantly from any of the other three muscles.
However, there were significant hue differences (P<0.05) between M. biceps femoris, M.
longissimus et lumborum and M. semitendinosus.
Young and West (2001) found that differences in muscle colour could be mostly
attributed to the myoglobin and iron differences between muscles. Wheeler, Koohmaraie and
Shackelford (1997) found the M. longissimus dorsi to have the greatest colour stability, but
there were no indication of other colour characteristics and the differences between muscles.
In this study, the colour properties of enhanced muscles were slightly lower than the
untreated samples through all muscles investigated. This means that the enhanced meat
was slightly darker and a little less red than the untreated samples. Young and West (2001)
reported that game meat has a high tendency to form a brown colour and that it appears
darker than the meat from domesticated meat animals because of its higher myoglobin
concentration. Van Schalkwyk (2004) noted that game meat had lower L* values than that of
other meat species and that is partly why game meat is perceived as being darker in colour
than beef.
Meat colour may also be influenced by pH. Swatland (1984) observed that meat with
a low ultimate pH appeared to be bright red, while meat with high ultimate pH values
appeared darker. Meat will appear brighter when both its a* and b* values are high (Honikel,
1998). According to Volpelli, Valusso, Morgante, Pittia and Piasentier (2003), there are colour
measurement properties characteristic to the dark red colour of venison and these are: L*<40,
high a* values and low b* values.
Hoffman (2000) reported very dark meat in wounded impala (L*, 25.44; a*, 9.13; b*,
4.88), while Smit (2004) and Kroucamp (2004) reported the colour values for male blesbok
and springbok M. longissimus dorsi, respectively, to be compliant with the colour
measurement properties supplied by Volpelli et al. (2003).
The colour data generated in this study (Table 2) for the five blesbok muscles show
that the L*, a* and b* values do not quite meet the ‘characteristic’ criteria set by Volpelli et al.
(2003) for venison. All L* values are lower than 40, but a* and b* values are very close
together. The springbok L*, a* and b* values definitely follow the ‘characteristic’ colour trend
of venison – L* values are lower than 40 and the a* values are much higher than the b*

Effect of enhancement on the physical characteristics of blesbok and springbok
99
Table 2 Least squared means (± SE) of colour analyses of five inorganic salt-enhanced and untreated blesbok and springbok muscles. Blesbok Springbok Muscles L* value a* value b* value Hue Chroma L* value a* value b* value Hue Chroma Biceps femoris Enhanced 33.727 14.121 11.300 38.273 18.016 30.115 20.983 8.681 22.420 22.739 Untreated 34.535b 16.412 12.857 b 37.816 b 20.984 32.493 a, b 23.343 10.721 a, b 24.518 b 25.713 SEM 0.298 0.196 0.235 0.613 0.180 0.994 0.370 0.235 0.458 0.397 P-value 0.0650 <0.0001 <0.0001 0.6019 <0.0001 0.1014 <0.0001 <0.0001 0.0030 <0.0001 Longissimus et lumborum Enhanced 31.970 14.150 11.201 38.331 18.060 27.165 21.992 8.127 20.091 23.488 Untreated 32.737 c 15.491 12.145 b 38.049 b 19.718 29.469 b 24.198 9.218 b 20.721 c 25.930 SEM 0.253 0.246 0.233 0.756 0.232 0.697 0.437 0.281 0.626 0.450 P-value 0.0405 0.0006 0.0076 0.7941 <0.0001 0.0266 0.0013 0.0102 0.4825 0.0006 Rectus femoris Enhanced 33.446 13.769 10.437 37.169 17.307 31.552 20.345 9.329 24.625 22.412 Untreated 34.363 b 16.756 13.645 b 39.091 b 21.623 32.340 a 22.624 10.341 a, b 24.416 a, b 24.916 SEM 0.291 0.210 0.232 0.588 0.246 0.686 0.355 0.238 0.583 0.357 P-value 0.0340 <0.0001 <0.0001 0.0280 <0.0001 0.4227 <0.0001 0.0054 0.8015 <0.0001 Semitendinosus Enhanced 32.534 13.787 10.811 38.066 17.543 31.600 21.077 9.729 24.486 23.279 Untreated 34.165 a 16.533 12.408 a 37.077 a 20.567 34.167 a 22.983 11.622 a 26.676 a 25.787 SEM 0.151 0.209 0.196 0.500 0.214 0.633 0.381 0.226 0.548 0.388 P-value <0.0001 <0.0001 <0.0001 0.1728 <0.0001 0.0076 0.0014 <0.0001 0.0084 <0.0001 Supraspinatus Enhanced 36.087 13.349 11.778 41.236 17.865 32.969 22.452 10.215 24.464 24.692 Untreated 38.006 b, c 16.187 14.386 b 41.576 b 21.670 31.518 a 22.617 10.374 a 24.580 a, b 24.907 SEM 0.213 0.197 0.241 0.622 0.237 0.774 0.475 0.307 0.678 0.492 P-value <0.0001 <0.0001 <0.0001 0.7023 <0.0001 0.1758 0.7992 0.7045 0.9000 0.7482 a, b, c, d Muscles from the control group with different superscripts differ significantly (P<0.05).

Effect of enhancement on the physical characteristics of blesbok and springbok
100
values, with the b* values reported for the springbok meat also being much lower
than the b* values reported for the blesbok meat. Springbok meat had the characteristic dark
red colour venison usually displays. The L*, a* and b* values of all enhanced muscles were
lower than their untreated counterparts for both species. Most muscles had L* values that
significantly differed (P<0.05) between treatments, except blesbok M. biceps femoris and
springbok M. biceps femoris, M. rectus femoris and M. supraspinatus.
The treatment differences in a* and b* values were highly significant (P<0.01) for all
muscles, except for springbok M. supraspinatus (both a* and b* were not significantly
different). In blesbok meat the average L* values were 33.55 for the enhanced and 34.76 for
the untreated samples, the average a* values were 13.84 for the enhanced and 16.28 for the
untreated samples, with the average b* values being 11.11 for the enhanced and 13.09 for
the untreated samples, while the average values of springbok were: 30.69 (enhanced) and
32.00(untreated) for L*; 21.37 (enhanced) and 23.15 (untreated) for a*; and 9.22 (enhanced)
and 10.46 (untreated) for b*. Thus, the enhanced samples would appear darker in colour
than the untreated samples (lower L*) and less bright (lower a* and b*) although the colour of
the enhanced meat was not negatively influenced – no discolouration was perceived.
As far as hue angle and chroma of blesbok meat are considered, there were no
significant differences for hue angle between muscles, except for the M. rectus femoris in
which the untreated sample had significantly higher (P<0.05) values than the enhanced
sample, whereas all muscles presented highly significant (P<0.0001) treatment differences for
chroma, with untreated muscles having higher values. The mean blesbok hue angle was
38.62 for enhanced and 38.72 for untreated samples, while the average chroma values were
17.76 for enhanced and 20.91 for untreated samples. Both hue angle and chroma observed
for blesbok meat in this study were much higher than the values reported by Smit (2004) for
blesbok M. longissimus dorsi. In springbok meat, only two muscles (M. biceps femoris and M.
rectus femoris) presented significantly different (P<0.01) treatment values for hue angle, while
chroma differed significantly (P<0.01) between treatments in all muscles, except M.
supraspinatus. Springbok meat had a fairly low hue angle, the average value for enhanced
samples being 23.22 and 24.18 for untreated samples, much lower than those reported by
Kroucamp (2004) for springbok M. longissimus dorsi muscles, while the chroma values
averaged 23.32 for enhanced and 25.45 for untreated samples. In most cases the untreated
muscles had higher values for both hue angle and chroma than the enhanced samples.
These chroma values are much higher than those reported by Kroucamp (2004). Higher
chroma values represent higher colour saturation levels and the muscle will appear brighter in
colour (Stevenson, Seman, Weatherall and Littlejohn, 1989).
Papadopoulos et al. (1991) found that treated with sodium lactate improved meat
colour in top round roasts, with higher a* values (meat appeared more red) and lower L* and
b* values. Phosphate-enhanced pork presented higher a* and lower b* values than its
untreated counterparts (Prestat et al., 2002). On the other hand, several authors (Kerth,

Effect of enhancement on the physical characteristics of blesbok and springbok
101
Miller and Ramsey, 1995; Lawrence et al., 2003a) have reported that calcium chloride caused
accelerated discolouration and darkening in calcium chloride-enhanced meat.
Even though the enhanced springbok muscles do have slightly lower colour values
than the untreated samples, it would still appear brighter and much redder than the
(untreated) springbok samples observed in the work of Kroucamp (2004). The same goes for
the presented blesbok data. Compared to the blesbok samples observed in the work of Smit
(2004), the blesbok colour data presented in the current study shows that the enhanced
blesbok muscles would indeed appear brighter and more red in colour.
4. Conclusion
The respective muscles of the springbok and blesbok differed in terms of the physical
characteristics investigated in this study. There were significant (P<0.05) differences between
different muscles and groups of muscles for all the characteristics investigated, except for the
two colour characteristics, a*-value and chroma for which there were no significant
differences for any of the five muscles.
Enhancing blesbok and springbok meat with an inorganic salt solution has definite
advantages in terms of tenderness and moisture absorption, with enhanced meat being more
tender (much lower shear force values) and juicy (slightly higher drip and cooking losses
shows higher water-absorption) than untreated meat. No improvement was observed in
terms of the colour properties of meat samples of both species. However, both treated and
untreated meat from both species investigated in this study, displayed better colour properties
(in terms of bright red colour) than what has previously been reported for game meat.
5. References
Baublits, R.T., Pohlman, F.W., Brown Jr., A.H. & Johnson, Z.B. (2005). Effects of sodium
chloride, phosphate type and concentration, and pump rate on beef biceps femoris quality
and sensory characteristics. Meat Science 70, 205-214.
Bernues, A., Olaizola, A. & Corcoran, K. (2003). Labelling information demanded by
European consumers and relationships with purchasing motives, quality and safety of
meat. Meat Science 65, 1095-1106.
Briskey, E.J. (1963). Influence of ante- and post-mortem handling practices on properties of
muscle which are related to tenderness. In Proceedings meat tenderness symposium
(pp. 195-223). Camden: Campbell Soup Company.
Bronkhorst, N. (2005). Is koedoe en springbok op jou inkopielys? Landbouweekblad 24
Junie, 67.
Chizzolini, R., Zanardi, E., Dorigoni, V. & Ghidini, S. (1999). Calorific value and cholesterol
content of normal and low-fat meat and meat products. Trends in Food Science and
Technology 10, 119-128.
Commission International De l’Eclairage (1976). Colorimetry, 2nd ed. CIE, Vienna.
Effect of enhancement on the physical characteristics of blesbok and springbok
102
Committee on Medical Aspects of Food Policy (1984). ‘Diet and Cardiovascular Disease.
Report on Health and social subjects, Department of Health and Social Security, No. 28,
HMSO, London.
Conroy, A.M. & Gaigher, I.G. (1982). Venison, Aquaculture and ostrich meat production:
Action 2003. South African Journal of Animal Science 2, 219-233.
Cover, S., Ritchey, S.J. & Hostetler, R.L. (1962). Tenderness of Beef. II. Juiciness and the
softness components of tenderness. Journal of Food Science 27, 476-482.
Deatherage, F.E. (1963). The effect of water and inorganic salts on tenderness. In
Proceedings meat tenderness symposium (pp. 45-68). Camden: Campbell Soup
Company.
Eilers, J.D., Morgan, J.B., Martin, A.M., Miller, R.K., Hale, D.S. & Acuff, G.R. (1994).
Evaluation of calcium chloride and lactic acid injection on chemical, microbiological and
descriptive attributes of mature cow beef. Meat Science 38, 443-451.
Higgs, J.D. (2000). The changing nature of red meat: 20 years of improving nutritional
quality. Trends in Food Science and Technology 11, 85-95.
Hoffman, L.C. (2006). Sensory and physical characteristics of enhanced vs. non-enhanced
meat from mature cows. Meat Science 72, 195-202.
Hoffman, L.C. (2000). Meat quality attributes of night-cropped impala (Aepyceros melampus).
SA Journal of Animal Science 30, 133-137.
Hoffman, L.C. and Bigalke, R.C. (1999). Utilizing wild ungulates from southern Africa for
meat production: Potential research requirements for the new millennium. Congress of
the Wildlife Management Association of SA (pp. 1-14). George, South Africa.
Hoffman, L.C., Muller, M., Schutte, De W., Calitz, F.J. & Crafford, K. (2005). Consumer
expectations, perceptions and purchasing of South African game meat. South African
Journal of Wildlife Research 35, 33-42.
Hoffman, L.C., Muller, M., Schutte, De W. & Crafford, K. (2004). Retail of South African game
meat: current trade and marketing trends. South African Journal of Wildlife Research 34,
123-134.
Honikel, K.O. (1998). Reference methods for the assessment of physical characteristics of
meat. Meat Science 49, 447-457.
Jansen van Rensburg, D.M. (2001). Venison as health food. In H. Ebedes, B. Reilly, W. van
Hoven & B. Penzhorn (Eds.). Sustainable utilisation - conservation in practice.
Proceedings of the 5th International Wildlife Ranching Symposium (pp. 196-198).
Jeremiah, L.E., Dugan, M.E.R., Aalhus, J.L. & Gibson, L.L. (2003). Assessment of the
relationship between chemical components and palatability of major beef muscles and
muscle groups. Meat Science 65 1013-1019.
Jeremiah, L.E., Smith, G.C. & Carpenter, Z.L. (1972). Ovine yield grades. II. Palatability
attributes within various quality grades. Journal of Animal Science 34, 196-202.

Effect of enhancement on the physical characteristics of blesbok and springbok
103
Jeremiah, L.E., Smith, G.C. & Carpenter, Z.L. (1971). Palatability of individual muscles from
ovine leg steaks as related to chronological age and marbling. Journal of Food Science
35, 45-47.
Kerth, C.R., Miller, M.F. & Ramsey, C.B. (1995). Improvement of beef tenderness and
quality traits with calcium chloride injection in beef loins 48 hours post mortem. Journal of
Animal Science 73, 750-756.
Kritzinger, B. (2002). Meat quality parameters of the Impala (Aepyceros melampus). M.Sc.
Agric (Animal Science) thesis. Department of Animal Science. University of
Stellenbosch, Stellenbosch.
Kroon, F.E., van Rensburg, W.J.J. & Hofmeyr, H.S. (1972). Seisoenale veranderinge in
chemiese samestelling van volwasse blesbokramme (Damaliscus dorcas phillipsi) van die
Van Riebeeck natuurreservaat. Suid Afrikaanse Tydskrif van Veekunde 2, 41-44.
Kroucamp, M. (2004). Meat quality characteristics of the springbok (Antidorcas marsupialis).
M. Sc. (Foods). Department of Food Science. University of Stellenbosch, Stellenbosch.
Lawrence, T.E., Dikeman, M.E., Hunt, M.C., Kastner, C.L. & Johnson, D.E. (2003a). Effects
of calcium salts on beef longissimus quality. Meat Science 64, 299-308.
Lawrence, T.E., Dikeman, M.E., Hunt, M.C., Kastner, C.L. & Johnson, D.E. (2003b). Staged
injection marination with calcium lactate, phosphate and salt may improve beef water-
binding ability and palatability traits. Meat Science 65, 967-972.
Lawrie, R.A. (1998). Lawrie’s Meat Science (6th ed.). Cambridge, England: Woodhead
Publishing Ltd.
Lewis, A.R., Pinchin, A.M. & Kestin, S.C. (1997). Welfare implications of the night shooting of
wild impala (Aepyceros melampus). Animal Welfare 6, 123-131.
Malmfors, G. & Wiklund, E. (1996). Pre-slaughter handling of reindeer – effects on meat
quality. Meat Science 43, 257-264.
Offer, G. & Trinick, J. (1983). On the mechanism of water holding in meat: The swelling and
shrinking of myofibrils. Meat Science 4, 245-281.
Papadopoulos, L.S., Miller, R.K., Ringer, L.J. & Cross, H.R. (1991). Sodium lactate effect on
sensory characteristics, cooked meat colour and chemical composition. Journal of
Food Science 56, 621-626.
Pauw, J. (1993). The development of venison marketing. In Forum: The venison industry.
Research requirements and possibilities (pp.3-5). Meat industry centre, Irene Agricultural
research Council, Pretoria, South Africa.
Prestat, C., Jensen, J., McKeith, F.K. & Brewer, M.S. (2002). Cooking methods and endpoint
temperature effects on sensory and colour characteristics of pumped pork loin chops.
Meat Science 60, 395-400.
Pietrasik, Z. & Shand, P.J. (2004). Effect of blade tenderisation and tumbling time on the
processing characteristics and tenderness of injected cooked roast beef. Meat Science
66, 871-879.

Effect of enhancement on the physical characteristics of blesbok and springbok
104
Sales, J. (1995). Nutritional quality of meat from some alternative species. World review of
Animal Production 30, 47-56.
SAS (1999). SAS/STAT User’s Guide, Version 8 (Volume II). SAS Institute Inc., North
Carolina.
Scanga, J.A., Delmore Jr., R.J., Ames, R.P., Belk, K.E., Tatum, J.D. & Smith, G.C. (2000).
Palatability of beef steaks marinated with solutions of calcium chloride, phosphate, and
(or) beef-flavouring. Meat Science 55, 397-401.
Shackelford, S.D., Wheeler, T.L. & Koohmaraie, M. (1995). Relationship between shear
force and trained sensory panel tenderness ratings of 10 major muscles from Bos indicus
and Bos taurus cattle. Journal of Animal Science 73, 3333-3340.
Schönfeldt, H. (1993). Nutritional content of venison. In Forum: The venison industry.
Research requirements and possibilities (pp. 51-60). Meat industry centre, Irene
Agricultural research Council, Pretoria, South Africa.
Silva, J.A., Patarata, L. & Martins, C. (1999). Influence of ultimate pH on bovine meat
tenderness during ageing. Meat Science 52, 453-459.
Smit, K. (2004). Meat quality characteristics of blesbok (Damaliscus dorcas phillipsi) and red
hartebeest (Alcelaphus buselaphus caama) meat. M. Consumer Sc. (Food) thesis.
Department of Consumer Science. University of Stellenbosch, Stellenbosch.
Stevenson, J.M., Seman, D.L., Weatherall, I.L. & Littlejohn, R.P. (1989). A research note.
Evaluation of venison colour by an objective method using CIELAB values. Journal of
Food Science 54, 1661-1662.
Swatland, H.J. (1984). Structure and development of meat animals. Ontario Agricultural
College, University of Guelph, Englewood Cliffs, NY: Prentice Hall.
Thomas, A.R., Gondoza, H., Hoffman, L.C., Oosthuizen, V. & Naudè, R.J. (2004). The roles
of the proteasome, and cathepsins B,L,H and D, in ostrich meat tenderisation. Meat
Science 67, 113-120.
Van Schalkwyk, S. (2004). Meat quality characteristics of three South African game species:
Black wildebeest (Connochaetes gnou), Blue wildebeest (Connochaetes taurinus) and
Mountain reedbuck (Redunca fulvorufula). M. Sc. Cons. (Foods). Department of
Consumer Science. University of Stellenbosch, Stellenbosch.
Viljoen, J.J. (1999). ‘n Vergelyking van die lipiedkomponente van springbokvleis met die van
beesvleis en die verwante belangrikheid vir aspekte van die menslike gesondheid. SA
Tydskrif vir Natuurwetenskap enTegnologie 18, 51-53.
Volpelli, L.A., Valusso, R., Morgante, M., Pittia, P. & Piasentier, E. (2003). Meat quality in
male fallow deer (Dama dama): effects of age and supplementary feeding. Meat Science
65, 555-562.
Von la Chevallerie, M. (1972). Meat quality of seven wild ungulate species. South African
Journal of Animal Science 2, 101-103.
Webb, R. (2001). It’s all in the game. Diabetes Forecast 54, 30-33.

Effect of enhancement on the physical characteristics of blesbok and springbok
105
Wheeler, T.L., Koohmaraie, M. & Shackelford, S.D. (1997). Effect of post-mortem injection
time and post-injection ageing time on the calcium-activated tenderisation process in
beef. Journal of Animal Science 75, 2652-2660.
Wiklund, E., Stenvenson-Barry, J.M., Duncan, S.J. & Littlejohn, R.P. (2001). Electrical
stimulation of red deer (Cervus elaphus) carcasses – effects on rate of pH-decline, meat
tenderness, colour stability and water holding capacity. Meat Science 59, 211-220.
Young, O.A. & West, J. (2001). Meat colour. In Hui, Nip, Rogers & Young (Eds.) Meat
Science and applications (pp. 39-69). New York: Marcel Dekker.

106
Chapter 4 The effect of enhancement on the chemical characteristics of five
springbok (Antidorcas marsupialis) and blesbok (Damaliscus dorcas
phillipsi) muscles Abstract Very little is known about the proximate composition, mineral content and fatty acid profile of
different springbok and blesbok muscles. In the present investigation, the chemical
composition of M. biceps femoris, M. longissimus et lumborum, M. rectus femoris, M.
semitendinosus and M. supraspinatus of springbok (n=10) and blesbok (n=10) were
determined. The influence that an inorganic salt solution, injected into the meat, could have
thereupon was also investigated. Significant differences were detected amongst the five
control muscles for moisture in both species, while the protein content of blesbok and the fat
content of springbok differed significantly amongst the five control muscles. When the
mineral content is considered, significant muscle differences were detected amongst the
control muscles of the springbok for magnesium, iron and zinc, while the control muscles of
the blesbok differed significantly for calcium and magnesium. When the mineral content of
the enhanced muscles were investigated, significant muscle differences were detected for
potassium, iron and zinc in the springbok, and for iron in the blesbok. Fatty acid analysis was
performed on untreated muscles only and the high polyunsaturated fatty acid to saturated
fatty acid (P:S) ratio and low n-6:n-3 ratios of springbok and blesbok compared to those of
domesticated species has shown that springbok and blesbok meat do indeed have a fatty
acid profile that may positively influence human health. In both species it was found that the
moisture and ash percentages were significantly higher for the majority of the enhanced
muscle while fat and protein percentages were lower in the untreated muscles when
compared to the enhanced muscles. Potassium and sodium were the two minerals present in
significantly higher values in the enhanced springbok meat, while phosphorus, potassium and
sodium were significantly higher in enhanced blesbok meat. Magnesium was significantly
higher in untreated muscles of both species.
Key words: Game meat, Springbok, Blesbok, Inorganic salt injection, Enhancement, Fatty
acids, Minerals, Chemical analysis
1. Introduction Ever since reports, such as that of the British Government’s Committee on Medical
Aspects of Food and Nutrition (COMA, 1984) dealing with coronary heart disease, identified
meat as a substantial source of saturated fat, meat consumption has steadily declined.
People have become more health-conscious and consumers have become much more
informed about food components with potential health benefits, as well as those posing health

Effect of enhancement on the chemical characteristics of blesbok and springbok
107
threats. Of the latter, saturated fat and cholesterol have become the main culprits usually
focussed on. Higgs (2000) noted that consumers perceive all fat in meat to be saturated
although serious effort has been made by the meat industry to improve the fatty acid content
of various meat species. Consumers have since been demanding food products with low
cholesterol and low fat contents.
South African consumers were shown to consider fat content as a very important
criterion when purchasing meat (Hoffman, Muller, Schutte and Crafford, 2004), which clearly
paves the way for the possibility of promoting game meat as a low fat red meat – several
authors have commented on the low fat content of game meat (Von la Chevallerie, 1972;
Elliot, 1993; Hoffman, 2000).
Several authors have reported that the fatty acid composition of meat, rather than its
total fat content, is more important for health reasons (Nelson, Schmidt and Kelley, 1995;
Chizzolini, Zanardi, Dorigoni and Ghidini, 1999; Higgs, 2000). In this regard, the ratio of
polyunsaturated fatty acids to saturated fatty acids (P:S) is very important. Schönfeldt (1993),
Viljoen (1999) and Hoffman (2000) have all remarked on the high levels of polyunsaturated
fatty acids present in game meat.
Meat is also associated with a high cholesterol level because it is an essential
constituent of all cells of animal origin (Higgs, 2000). Even though nutritional guidelines
advises a cholesterol-intake of no more than 300mg per day (Chizzolini et al., 1999), Nelson
et al. (1995) reported that blood low-density lipoprotein (LDL) cholesterol levels apparently
remained unaffected by fat calories (saturated or unsaturated) in the diet. The latter authors
suggested that blood cholesterol level-changes might be attributed to fatty acid ratios in the
diet. Higgs (2000) noted that lean beef as part of a low saturated fat diet caused plasma
cholesterol and LDL-cholesterol levels to be reduced in a fashion similar to equal amounts of
chicken and fish, although, including beef fat in the diet did cause an increase in blood
cholesterol levels. Thus, red meat with a fairly high amount of lean muscle (low in fat)
definitely has a place in the modern consumer’s nutrition as far as health benefits are
concerned. Elliot (1993) reported venison to have a cholesterol content half of what was
reported for lamb and beef.
Game meat has moisture levels favourably comparable to those of other
domesticated meat species (Von la Chevallerie, 1972). Consumers are demanding meat that
is more tender and juicy, thus, meat with higher moisture levels might be more favourably
accepted by consumers. Moisture levels of meat can be increased by various methods,
including injecting various inorganic salts post-mortem. Baublits, Pohlman, Brown Jr. and
Johnson (2005) found that injecting steaks with a solution of sodium chloride and different
phosphates at 18% of the raw weight increased moisture percentages and caused the treated
steaks to be rated more tender and juicy. Enhancing meat with inorganic salts may thus
affect meat favourably in several different ways, although some negative effects have been
reported, for example the adverse flavour effects caused by several of the calcium salts
(Wheeler, Koohmaraie and Shackelford, 1997; Scanga, Delmore Jr., Ames, Belk, Tatum and

Effect of enhancement on the chemical characteristics of blesbok and springbok
108
Smith, 2000). The effects of inorganic salt-injection on the proximate composition of game
meat have not been intensively researched and part of the aim of this study was to report the
effects that inorganic salt-enhancement may have on the chemical composition of springbok
meat.
Springbok is presently the most extensively cropped game species in South Africa
(Hoffman, 2000). Hoffman, Muller, Schutte, Calitz and Crafford (2005) found that most
respondents to their questionnaire have eaten springbok meat before and that it was one of
the three game species found to be regularly available in supermarkets and restaurants.
Blesbok was also noted by Conroy and Gaigher (1982) as one of the most common game
species found naturally on farms in South Africa.
Where fatty acids are concerned, Lengyel, Husveth, Polgar, Szabo and Magyar
(2003) found the polyunsaturated fatty acid levels in bull M. semitendinosus were much
higher than that of the M. longissimus dorsi, while the latter muscles contained much higher
levels of both saturated and mono-unsaturated fatty acids. Enser, Hallett, Hewett, Fursey,
Wood and Harrington (1998), as well as Lengyel et al. (2003), noted that predominantly red
oxidative muscles (such as the M. semitendinosus) contain higher levels of phospholipids and
therefore have higher levels of polyunsaturated fatty acids than muscles low in oxidative
fibres (such as the M. longissimus dorsi).
The aim of this study was firstly, to report on the chemical differences between five
muscles of the springbok and blesbok, and secondly, to investigate the effects of inorganic
salt-enhancement on these chemical attributes. No information exists on muscle differences
of game meat – usually only data on the M. longissimus dorsi or M. biceps femoris are
reported. Thus, this study aspires to expand the amount of information currently available on
game meat.
2. Materials and Methods 2.1. Animals and sampling
Ten springbok (Antidorcas marsupialis) and ten blesbok (Damaliscus dorcas phillipsi)
were randomly harvested at the Gariep Nature Reserve in South Africa. All animals were
male and carcass weight varied between 17.4 kg and 30.4 kg for springbok and 16.4 kg and
42.2 kg for blesbok. Animals were harvested at night by a professional cull team, using
similar culling methods to those described by Lewis, Pinchin and Kestin (1997), and only
head or neck shots were taken to minimise animal stress. Animals were exsanguinated
within 5 minutes of harvesting and carcasses were hung by the Achilles tendon. Bled and
eviscerated skin-on carcasses were transported to Stellenbosch, with a temperature-
controlled vehicle, where they were skinned and processed further approximately 24 h after
harvesting.
The left halves of the springbok carcasses were injected with an inorganic salt
solution (Freddy Hirsch Tenderbite #802539; P.O. Box 2554, Cape Town, 8000) with a
chemical composition of sodium (5.21%) and potassium (2.53%) di- and triphosphates

Effect of enhancement on the chemical characteristics of blesbok and springbok
109
(3.45%), lactate (12.40%) and water (75.75%) to give a pumped gain of 15%, with a retention
level of approximately 12%. Injection was performed at a pressure of 2.4 bar at 30 strokes per
minute on a Rühle Curing Centre IR56 (Rühl GmbH, D-79865, Grafenhausen, Germany).
The right and left side M. biceps femoris, M. longissimus et lumborum, M. rectus femoris, M.
semitendinosus and M. supraspinatus of each carcass of both species were removed and
trimmed of any carcass connective tissue and fat (although these game species seldom have
any visible fat). As the blesbok is a larger antelope species and the halved blesbok
carcasses were too large to fit into the Rühle Curing Centre, the muscles were first removed
before the left muscles of blesbok carcasses were injected with the same inorganic salt
solution. Samples were individually vacuum packed and frozen at –20 ºC.
2.2. Chemical analyses
Chemical analyses were performed on finely minced muscle samples. Total moisture
(100ºC, 24 h) and ash content (500ºC, 5h) were determined according to AOAC method
numbers 934.01 and 942.05, respectively (AOAC, 1997). Total lipid content was determined
by extracting lipids with a chloroform: methanol (2:1 v/v) solution by the solvent extraction
method described by Lee, Trevino and Chaiyawat (1996). Total crude protein was
determined by means of the Dumas Combustion method (AOAC method 968.06; AOAC,
1997) using the LECO FP 528, while the mineral composition was determined by direct
current plasma emission spectrometry (Pinta, 1982).
Fatty acid analyses were only executed on untreated samples. The fatty acid content
was determined by extracting a 2 g sample of meat with a chloroform/methanol (CM 2:1; v/v)
solution according to a modified method of Folch, Lees and Sloane-Stanley (1957). An
antioxidant (0.01% butylated hydroxytoluene (BHT)) was added to all extraction solvents.
Heptadecanoic acid (C17H34O2) (Sigma-Aldrich Inc., 3050 Spruce St., St. Louis, MO, 63103,
USA; Cat. no. H3500) was used as an internal standard to quantify the individual fatty acids.
A polytron mixer (Kinematica, type PT 10-35, Switzerland) was used to homogenise the
sample within the extraction solvent and the isolated lipids were transmethylated with a
transmethylating reagent (methanol/sulphuric acid; 19:1; v/v) for 2 hours at 70ºC. After
cooling, the resulting fatty acid methyl esters (FAME) were extracted with water and hexane
and the top hexane phase was transferred to a spotting tube and dried under nitrogen.
The FAME were purified using thin layer chromatography plates (TLC, silica gel 60
plates) and analysed with a Thermo Finnigan Focus Gas chromatograph (Thermo Electron
S.p.A., Strada Rivoltana, 20090 Rodano, Milan, Italy). A 60 m BPX70 capillary column (SGE
Int. Pty. Ltd., 7 Argents Place, Ringwood, Victoria, 3134, Australia) with an internal diameter
of 0.25mm was utilised and Hydrogen (30 ml/min.) was used as carrier gas. Temperature
programming was linear at 4ºC/min., with the different temperature settings as follows: an
initial temperature of 140ºC, a final temperature of 240ºC, an injector temperature of 220ºC
and a detector temperature of 260ºC. The FAME were identified by comparing the retention

Effect of enhancement on the chemical characteristics of blesbok and springbok
110
times to those of a standard FAME mixture, Supelco 37 Component FAME Mix C4 – C24
(Supelco, 595 North Harrison Rd., Bellefonte, PA, 16823-0048, USA; Cat. no. 18919).
2.3. Statistical analysis
The experiment consisted of a randomised block design with two main effects: salt,
i.e. salt enhanced or not, and muscle, i.e. M. biceps femoris, M. longissimus et lumborum, M.
rectus femoris, M. semitendinosus and M. supraspinatus, replicated in 10 blocks (10 animals)
per species. The standard GLM procedure was used when the chemical data were
statistically analysed (SAS, 1999) after determining that the data was normally distributed.
Differences between treatments were tested for by means of the Bonferroni t-test. The
objective of this investigation was not to compare species, but rather differences within
species, therefore no statistical comparisons were made with species as main effect.
3. Results and discussion 3.1. Moisture and Ash content
Generally meat has a moisture content of 70-77%, depending on the fat content of
the meat. As the fat content increases, the moisture content decreases (Young, Frost, West
and Braggins, 2001). The moisture contents of untreated springbok and blesbok muscles
(Table 1) in this study were slightly lower (73.4% and 74.4%, respectively) than the average
of 75.5% shown by Von la Chevallerie (1972).
Of the five springbok muscles investigated, the M. biceps femoris and M.
supraspinatus did not differ significantly from each other or from any of the other muscles in
terms of moisture content. However, while the M. rectus femoris and M. semitendinosus did
not differ significantly from each other, it did differ significantly (P<0.05) from the M.
longissimus et lumborum. The blesbok M. longissimus et lumborum was the only muscle of
the five that differed significantly (P<0.05) from the other muscles in its moisture content.
There were no significant differences detected in the moisture contents of the M. biceps
femoris, M. rectus femoris, M. semitendinosus or M. supraspinatus.
Of the untreated springbok muscles, the M. rectus femoris had the highest, and the
M. longissimus et lumborum the lowest, moisture content (74.16 ± 1.10% vs. 72.16 ± 1.68%).
For the untreated blesbok muscles, the M. biceps femoris showed the highest moisture
content (75.05 ± 1.86%) and the M. longissimus et lumborum the lowest (73.47 ± 1.30%).
Although the literature is limited, Jeremiah, Smith and Carpenter (1971) reported that out of
five sheep muscles investigated, M. biceps femoris and M. rectus femoris were the two
muscles that were rated the juiciest, with M. semitendinosus and M. vastus lateralis rated
least juicy. It seems that there is a general harmony between the findings of this research
and the results reported in the literature where the muscles with the highest moisture contents
are concerned. Although it was not the same muscle in both species, it was in accordance
with the findings of Jeremiah et al. (1971). In both species the M. longissimus et lumborum
was found to be the muscle with the lowest moisture content, not the M. semitendinosus as

Effect of enhancement on the chemical characteristics of blesbok and springbok
111
Jeremiah et al. (1971) reported. The M. semitendinosus of both species had intermediate
moisture levels, with the M. biceps femoris (in the case of the springbok) and the M. rectus
femoris (in the case of the blesbok) showing even lower moisture contents.
When the moisture levels of the enhanced muscles are considered, there are marked
improvements in the moisture content of most of the five muscles investigated (Table 1).
Although the average value of the enhanced springbok muscles was, at 75.3%, slightly lower
than the average provided by Von la Chevallerie (1972), it was higher than the moisture value
that the reported for springbok meat, which was 74.7%. The average moisture value for
springbok was also higher than the 74.2% reported by Kroucamp (2004) and corresponds
well with the 75.3% reported (for the whole carcass) by Van Zyl and Ferreira (2004). An
average moisture value of 76.5% was found for the enhanced blesbok muscles. This value is
slightly higher than the 75.1% reported by Smit (2004) and much higher than the 71.1% Van
Zyl and Ferreira (2004) reported for whole blesbok carcasses.
Table 1 Least squared means of moisture and ash analysis of five springbok and blesbok
muscles either enhanced with an inorganic salt solution or left untreated.
Springbok Blesbok
Muscles Moisture (%) Ash (%) Moisture (%) Ash (%)
Biceps femoris
Enhanced 75.268 ± 1.145 2.136 ± 0.125 76.146 ± 1.209 2.164 ± 0.299
Untreated 72.613 ± 1.212a, b 1.192 ± 0.080 75.046 ± 1.864 a 1.205 ± 0.123
P-value 0.0003 <0.0001 0.1206 <0.0001
Longissimus et lumborum
Enhanced 74.745 ± 1.609 2.167 ± 0.154 74.353 ± 1.406 1.837 ± 0.390
Untreated 72.157 ± 1.682 b 1.324 ± 0.237 73.470 ± 1.300 b 1.382 ± 0.229
P-value <0.0001 <0.0001 0.1226 0.0222
Rectus femoris
Enhanced 75.817 ± 1.346 2.230 ± 0.537 77.300 ± 1.074 2.245 ± 0.486
Untreated 74.157 ± 1.102 a 1.370 ± 0.299 73.962 ± 0.538 a 1.250 ± 0.197
P-value 0.0008 0.0039 <0.0001 0.0003
Semitendinosus
Enhanced 75.779 ± 0.894 2.095 ± 0.229 77.884 ± 1.001 2.376 ± 0.375
Untreated 73.857 ± 0.969 a 1.465 ± 0.306 74.547 ± 1.607 a 1.293 ± 0.131
P-value 0.0002 0.0002 <0.0001 <0.0001
Supraspinatus
Enhanced 75.075 ± 1.971 1.967 ± 0.443 76.962 ± 1.136 2.316 ± 0.183
Untreated 74.087 ± 0.810 a, b 1.171 ± 0.132 74.869 ± 0.936 a 1.274 ± 0.228
P-value 0.1701 <0.0001 <0.0001 <0.0001 a, b Untreated (control) muscles with different superscripts differ significantly (P<0.05).

Effect of enhancement on the chemical characteristics of blesbok and springbok
112
Sales (1995) reported an inverse correlation between intramuscular fat and moisture
content of meat and it is therefore expected that game meat may have higher moisture values
than domesticated species. When comparing the moisture contents of the meat from several
game species with that of several domesticated meat species, the moisture content of the
game species, varying between 74.7 and 77.0% (Von la Chevallerie, 1972) compared very
favourably with that of mutton, 60.7%, pork, 55.0%, and beef, 65.4% (Sayed, Frans and
Schönfeldt, 1999).
For all the springbok muscles, except the M. supraspinatus, the enhanced muscles
differed highly significantly (P< 0.001) from the untreated muscles. Of the five blesbok
muscles investigated, only the M. biceps femoris and M. longissimus et lumborum did not
show highly significant (P<0.0001) improvements in the enhanced samples. This marked
increase in the moisture levels of treated muscles can be ascribed to the improved water
holding capacity (WHC) caused by the injection of the inorganic salts present in the
enhancing solution. A change in the ion-protein relationship can lead to increased WHC
because of the changes brought on through the K+-absorption and Ca2+-release, which is
particularly visible in comminuted meats when the salts of weak acids (particularly
phosphates and polyphosphates) are added (Lawrie, 1998). Offer and Trinick (1983)
reported an increased water up-take by myofibrils in strong salt solutions mainly because of a
disruption in the forces determining the arrangement of the filaments at the Z- and M-lines
and between the myosin heads and the actin filaments. This transpires when the lattice of
thick and thin filaments expand when the increasingly negatively charged components repel
one another.
In fact, several authors have shown that injecting meat with inorganic salts can
improve the juiciness of meat (Scanga et al., 2000; Baublits et al., 2005). Prestat, Jensen,
McKeith and Brewer (2002) found added phosphate improved juiciness and postulated that it
was because of the added moisture (the water included in the enhancement solution) and the
increased moisture retention due to the increased pH levels caused by the added phosphate.
Phosphate addition also caused increased water retention, although untreated samples had
greater levels of free water, the phosphate-treated samples contained a higher total moisture
percentage (Baublits et al., 2005). Injecting 1-4% sodium lactate into top rounds increased
the juiciness during storage, while injecting top rounds with only 1% sodium lactate caused
significant decreased in the juiciness (Papadopoulos, Miller, Ringer and Cross, 1991).
The moisture content for all the springbok and blesbok muscles investigated were
much higher than those values reported by Sayed et al. (1999) for mutton (60.7%), pork
(55.0%) and beef (65.4%), although the moisture values of ostrich meat was higher (76.3%)
than all of these species. The addition of the inorganic salt mixture definitely increased the
moisture content of enhanced game muscles and will have positive ramifications where the
eating quality of the meat is concerned, since juiciness will be improved by the increased
moisture content of the enhanced muscles.

Effect of enhancement on the chemical characteristics of blesbok and springbok
113
Usually the ash content of meat is very small, but Van Schalkwyk (2004) declared the
ash content of game meat to be higher than that of domesticated animals. No differences in
the ash contents could be found amongst the untreated muscles of either blesbok or
springbok. The average ash content reported for male game animals has been in the vicinity
of 1.23-1.29g/100 g (Kroucamp, 2004; Smit, 2004; Van Schalkwyk, 2004). The ash content of
meat represents its mineral contents and therefore, in this study, the expectation was that the
enhanced samples would have higher ash percentages than untreated samples (Table 1).
That was definitely the case with the enhanced springbok samples having a mean of 2.12%
and the blesbok samples a mean of 2.19%. The ash values of the enhanced samples were
significantly higher (P<0.01) than the untreated samples for all five muscles in both species.
3.2. Fat and protein content
The intramuscular fat of meat has a very important role in its eating quality, with
intramuscular fat directly affected juiciness and flavour and indirectly affected tenderness
(Jeremiah, Dugan, Aalhus and Gibson, 2003). Of the five springbok muscles investigated
(Table 2), the M. biceps femoris, M. longissimus et lumborum and M. rectus femoris did not
differ significantly from each other or from the M. semitendinosus or the M. supraspinatus in
fat contents. The M. semitendinosus and M. supraspinatus did, however, differ significantly
(P<0.05) from each other. No significant differences occurred amongst the investigated
blesbok muscles where fat content was considered.
In this study, the fat content of springbok muscles averaged 1.80% (enhanced) and
2.14% (untreated) and the blesbok fat content averaged 1.86% (enhanced) and 2.22%
(untreated), which is well under the value of 2-3% reported by Schönfeldt (1993) and Hoffman
(2000) (Table 2). The fat content of the untreated muscles were higher than the enhanced
muscles throughout all investigated muscles.
The untreated springbok M. longissimus et lumborum, M. rectus femoris and M.
semitendinosus had significantly higher (P<0.05) fat values than the enhanced muscles, with
M. biceps femoris and M. supraspinatus showing no significant treatment differences. Of the
five blesbok muscles investigated, the untreated M. rectus femoris, M. semitendinosus and M.
supraspinatus had significantly (P<0.01) higher fat contents, while M. biceps femoris and M.
longissimus et lumborum did not differ significantly although, the untreated muscles definitely
had higher fat values than the enhanced samples.
The fat content of most game species have been reported as averaging less than 3%
(Von la Chevallerie, 1972; Schönfeldt, 1993; Pauw, 1993; Hoffman, 2000). Von la Chevallerie
(1972) reported game fat contents of between 1.4 and 2.4g/100g, with springbok having a fat
content of 1.7g/100g, while the fat contents of the buttocks of beef (14.2g/100g), mutton
(21.6g/100g) and pork (17.6g/100g) were much higher (Sayed et al., 1999).
The lower fat content of the enhanced muscles could be ascribed to the fact that the
moisture content of these muscles were increased due to the enhancement effects and
therefore, the fat content would be lower than it would have before enhancement. Thomas,

Effect of enhancement on the chemical characteristics of blesbok and springbok
114
Gondoza, Hoffman, Oosthuizen and Naudè (2004) postulated that this was due to a diluting
effect the bound water had on the muscle fibres – when more water is bound (in a fixed area),
a smaller amount of muscle fibres will be found.
Meat protein has a very high biological value (Higgs, 2000) and the nutritive value of
animal protein is higher in terms of protein efficiency ratio and in terms of biological value than
protein from plant origin (MacRae, O’Reilly and Morgan, 2005). In terms of protein content,
no significant differences could be detected amongst the investigated untreated springbok
muscles (Table 2). In the blesbok, however, only the M. longissimus et lumborum differed
significantly (P<0.05) from the other four muscles, while the M. biceps femoris, M. rectus
femoris, M. semitendinosus and M. supraspinatus did not differ significantly in its protein
contents.
Table 2 Least squared means of fat and protein analysis of five springbok and blesbok
muscles either enhanced with an inorganic salt solution or left untreated.
Springbok Blesbok
Muscles Fat (%) Protein (%) Fat (%) Protein (%)
Biceps femoris
Enhanced 1.954 ± 0.537 20.816 ± 1.212 1.898 ± 0.525 19.719 ± 1.251
Untreated 2.241 ± 0.718 a, b 23.681 ± 1.411 2.056 ± 0.331 20.810 ± 1.694 b
P-value 0.1699 0.0035 0.2708 0.0837
Longissimus et lumborum
Enhanced 1.722 ± 0.621 21.783 ± 1.520 1.965 ± 0.567 21.923 ± 1.323
Untreated 2.273 ± 0.579 a, b 24.184 ± 1.476 2.089 ± 0.364 22.678 ± 1.446 a
P-value 0.0127 0.0008 0.5041 0.1886
Rectus femoris
Enhanced 1.558 ± 0.299 20.737 ± 1.291 1.856 ± 0.380 19.207 ± 1.620
Untreated 2.140 ± 0.168 a, b 22.581 ± 1.450 2.434 ± 0.561 21.898 ± 0.939 b
P-value 0.0006 0.0123 0.0062 0.0003
Semitendinosus
Enhanced 1.639 ± 0.312 21.577 ± 3.166 1.657 ± 0.624 18.444 ± 0.820
Untreated 1.814 ± 0.346 b 23.409 ± 0.569 1.886 ± 0.401 22.143 ± 1.562 b
P-value 0.0448 0.1156 0.1432 <0.0001
Supraspinatus
Enhanced 2.144 ± 0.485 21.215 ± 1.832 1.906 ± 1.039 18.731 ± 1.363
Untreated 2.213 ± 0.491 a 22.422 ± 1.258 2.653 ± 0.853 20.799 ± 1.602 b
P-value 0.7955 0.2506 0.0756 0.0019 a, b Untreated (control) muscles with different superscripts differ significantly (P<0.05).

Effect of enhancement on the chemical characteristics of blesbok and springbok
115
The protein content of the inorganic salt-treated springbok muscles in this study was
lower than the untreated muscles, with M. biceps femoris, M. longissimus et lumborum and M.
rectus femoris differing significantly (P<0.05) between treatments, although M.
semitendinosus and M. supraspinatus did not differ significantly between treatments, the
untreated muscles did have higher protein contents than the untreated muscles (Table 2).
The enhanced M. biceps femoris, M. longissimus et lumborum and M. rectus femoris were
significantly (P<0.01) higher in terms of protein levels, but even though the M. supraspinatus
and M. semitendinosus technically did not show significant P-values, there were big
differences between the treated and untreated muscle protein values, with control muscles
having higher protein percentages than the enhanced samples.
The reason for this could be that, as the moisture content increased in a particular
area of the muscle or carcass, it had a diluent effect on the number of muscle fibres and,
thus, the protein content found in a particular area (Thomas et al., 2004), or it could be due to
the solubilisation of myofibrillar proteins caused by similar mechanism as the non-enzymatic
salting-in of calcium ions (Takahashi, Kim and Yano, 1987). Deatherage (1963) commented
on the use of phosphates to cause improved protein solubility in meat processing and
enhancing meat with phosphates did increase meat tenderness (Scanga et al., 2000).
Game meat has fairly high protein contents and Smit (2004) found male blesbok M.
longissimus et lumborum to have an average protein content of 22.4%, while Van Zyl and
Ferreira (2004) reported the protein value of male springbok carcasses to be 23.7% on
average. McCane and Widdowson (1991, as cited by Elliot, 1993) reported the following
protein values for several domesticated meat species: beef topside roast, 26.6 g/100g; lamb
leg roast, 26.1 g/100g; pork leg roast, 19.8 g/100g; chicken roast, skin-on, 22.6 g/100g. The
protein contents of game meat found in this study, compares favourably with that of the above
mentioned meat species.
The general tendency in enhanced springbok and blesbok muscles was that, as the
moisture content became higher than that of the untreated muscle, the fat and protein
contents became decreased.
3.3. Mineral content
Meat provides several minerals that are vital to human health (Higgs, 2000) and
especially the iron content of meat is very important. Lawrie (1998) reported potassium and
phosphorus to be the two minerals present in the highest quantities in meat. Game meat
contains higher levels of the macro-minerals calcium, magnesium and potassium, as well as
the trace elements iron, copper and selenium, than the meat from domesticated animals
(Niemenin, 1992). The mineral values observed in the current study (Table 4) were in general
all higher than those reported by Smit (2004), except for iron and copper, which were lower.
Kroucamp (2004) reported lower mineral values for male springbok than the values found for
untreated springbok muscles in the present study (Table 3), except for calcium, which
Kroucamp (2004) found to be much higher.

Effect of enhancement on the chemical characteristics of blesbok and springbok
116
Table 3 Least squared means of the mineral (mg/100g) analyses of two treatments of five springbok muscles. Phosporus Potassium Calcium Magnesium Sodium Iron Copper Zinc Manganese
Biceps femoris Enhanced 230.07 256.56 a, b 9.06 23.16 38.04 2.55 a, b 0.16 2.15 b, c 0.03 a, b, c Untreated 220.56 163.65 9.58 28.46 a 15.14 2.92 a, b 0.09 2.56 b 0.04 SEM 20.05 9.60 0.66 1.33 2.24 0.11 0.02 0.12 0.01 P-value 0.7343 <0.0001 0.5828 0.0184 <0.0001 0.0431 0.0643 0.0394 0.6586 Longissimus et lumborum Enhanced 268.59 277.35 a 11.73 24.43 40.21 3.08 a 0.18 1.51 c 0.05 a Untreated 222.01 160.90 11.48 27.30 a, b 12.82 3.27 a 0.08 1.77 b 0.04 SEM 23.54 7.48 0.37 0.46 1.83 0.10 0.03 0.06 0.00 P-value 0.1951 <0.0001 0.6408 0.0017 <0.0001 0.2049 0.0648 0.0142 0.8923 Rectus femoris Enhanced 222.45 266.56 a, b 9.00 20.77 38.53 2.17 b 0.14 4.31 a 0.04 a, b Untreated 191.35 173.77 9.74 24.90 a, b 13.45 2.20 d 0.07 4.89 a 0.03 SEM 14.56 16.59 0.77 0.52 2.72 0.09 0.02 0.24 0.01 P-value 0.1652 0.0033 0.5140 0.0003 0.0001 0.8237 0.0621 0.1188 0.0934 Semitendinosus Enhanced 233.76 260.53 a, b 9.73 23.93 32.66 2.30 b 0.13 2.91 b 0.03 b, c Untreated 207.23 169.79 8.82 26.81 a, b 12.59 2.30 c, d 0.04 2.87 b 0.03 SEM 19.05 10.80 1.10 0.88 3.00 0.12 0.02 0.16 0.01 P-value 0.3506 0.0002 0.5772 0.0453 0.0011 0.9993 0.0048 0.8564 0.5362 Supraspinatus Enhanced 201.47 205.97 b 8.48 20.10 29.15 2.48 a, b 0.10 4.49 a 0.02 c Untreated 171.68 155.03 11.32 23.47 b 14.48 2.69 b, c 0.06 5.58 a 0.03 SEM 23.04 13.01 0.95 1.70 2.40 0.31 0.02 0.38 0.01 P-value 0.3500 0.0190 0.0535 0.1694 0.0021 0.6221 0.2194 0.0611 0.1227 a, b, c Muscles within a treatment group with different superscripts differ significantly (P<0.05) for the specified mineral.

Effect of enhancement on the chemical characteristics of blesbok and springbok
117
Table 4 Least squared means of the mineral (mg/100g) analyses of two treatments of five blesbok muscles. Phosporus Potassium Calcium Magnesium Sodium Iron Copper Zinc Manganese Biceps femoris Enhanced 251.61 279.26 9.19 20.50 37.51 2.91a 0.19 2.08 c 0.05 Untreated 161.21 153.39 7.74 b 24.46 a, b 12.77 2.78 0.05 2.04 b 0.04 SEM 11.59 12.14 0.50 1.96 1.73 0.20 0.02 0.14 0.00 P-value <0.0001 <0.0001 0.0548 0.1918 <0.0001 0.6628 <0.0001 0.8383 0.2043 Longissimus et lumborum Enhanced 221.57 248.25 9.05 21.60 31.00 3.05 a 0.14 1.33 c 0.04 Untreated 190.37 179.91 10.75 a 27.65 a 13.28 3.30 0.06 1.67 b 0.05 SEM 9.71 10.39 0.72 1.14 1.51 0.20 0.03 0.11 0.01 P-value 0.0356 0.0002 0.1100 0.0015 <0.0001 0.3835 0.0542 0.0424 0.6003 Rectus femoris Enhanced 233.34 272.03 7.83 19.40 43.04 2.42 a, b 0.09 3.58 b 0.04 Untreated 180.03 164.00 7.90 b 25.79 a, b 12.07 3.09 0.06 5.29 a 0.05 SEM 9.36 11.19 0.50 0.73 4.93 0.17 0.01 0.26 0.00 P-value 0.0007 <0.0001 0.3606 <0.0001 0.0003 0.0121 0.1318 0.0002 0.0389 Semitendinosus Enhanced 259.41 299.72 7.54 17.25 41.15 2.18 a 0.10 1.78 c 0.04 Untreated 193.74 183.34 8.24 b 27.57 a 13.79 2.58 0.07 2.33 b 0.04 SEM 13.21 16.99 0.49 1.53 3.20 0.13 0.02 0.11 0.01 P-value 0.0025 0.0001 0.3248 0.0002 <0.0001 0.0388 0.3350 0.0030 0.7035 Supraspinatus Enhanced 237.54 296.54 7.47 17.36 42.92 2.51 a, b 0.10 5.03 a 0.36 Untreated 164.46 171.47 8.22 b 22.93 c 15.47 3.09 0.06 6.03 a 0.41 SEM 16.06 18.70 0.38 0.83 3.38 0.16 0.02 0.34 0.00 P-value 0.0054 0.0002 0.1834 0.0002 <0.0001 0.0244 0.2703 0.0572 0.4499 a, b, c Muscles within a treatment group with different superscripts differ significantly (P<0.05) for the specified mineral.

Effect of enhancement on the chemical characteristics of blesbok and springbok
118
Since the inorganic salt solution used to enhance the meat contained additional
sodium (5.21%), potassium (2.53%), di- and triphosphates (3.45%) and lactate (12.40%), the
expected results would be an increase in these particular mineral values in the enhanced
samples. In the springbok muscles, potassium and sodium were significantly (P<0.01) higher
in the enhanced muscles compared with the untreated muscles, except in the case of the M.
supraspinatus where the difference in potassium was slightly less significant (P<0.05).
Although phosphorus was present at a higher concentration in the enhanced springbok
muscles, there was no significant difference between treatments. All blesbok muscles
showed highly significant differences (P<0.01) between treatment in phosphorus, potassium
and sodium (except M. longissimus et lumborum, which had a significance of P<0.05 in the
case of phosphorus, thus differing slightly less significantly than the other muscles), with the
enhanced samples having much higher values of these three minerals than the untreated
samples. All the enhanced springbok and blesbok muscles had higher copper quantities than
the untreated muscles, but only that of the M. semitendinosus (springbok, P<0.01) and M.
biceps femoris (blesbok, P<0.0001) differed significantly.
There was a significant difference (P<0.05) in the magnesium content of all springbok
muscles, with the exception of the M. supraspinatus), as well as a highly significant (P<0.01)
difference in all blesbok muscles (with the exception of the M. biceps femoris) with the
untreated samples having higher magnesium values than the enhanced samples. The same
trend was seen for the zinc content of the springbok M. biceps femoris and M. longissimus et
lumborum and blesbok M. longissimus et lumborum, M. rectus femoris and M.
semitendinosus, where the untreated samples had significantly (P<0.05) higher mineral
values than the enhanced samples.
The untreated muscles also showed higher iron values, but only the difference in the
springbok M. biceps femoris and blesbok M. rectus femoris, M. semitendinosus and M.
supraspinatus were significantly higher (P<0.05). For the most part, the calcium and
manganese contents of all five muscles remained fairly unchanged, with no significant
(P>0.05) differences between treatments, although significant differences amongst control
muscles were detected for calcium in the blesbok.
In the springbok, muscle differences (within treatments) were observed for potassium
and manganese, with significant differences occurring within the enhanced muscles. The
untreated muscles differed significantly for magnesium and when iron and zinc were
considered, there were significant muscle differences within both the enhanced and untreated
muscle groups. In blesbok, there were significant muscle differences within the untreated
calcium-, magnesium- and zinc-groups, while there were significant differences within the
muscles of the treated iron- and zinc groups.
3.4. Fatty acid content
Various authors have reported the higher levels of PUFA found in game meat as
opposed to that of beef (Schönfeldt, 1993; Viljoen, 1999; Hoffman, 2000). In this study the

Effect of enhancement on the chemical characteristics of blesbok and springbok
119
total amount of PUFA in springbok meat averaged 3.71mg/g-1 (Table 5), with the M. biceps
femoris containing the highest amount, while the M. rectus femoris had the lowest amount of
PUFA. This correlates very well with the values (3.849 ± 0.44mg/g-1) reported by Kroucamp
(2004). The total PUFA level in blesbok meat averaged 2.81mg/g-1 (Table 6), with the highest
(M. longissimus et lumborum) and lowest (M. supraspinatus) amounts contributed by the
same muscles as in the springbok. According to Kroucamp (2004) springbok meat has a
PUFA value of 36.34 ± 3.37% (M. longissimus dorsi) and Smit (2004) reported a PUFA value
of 2.89mg/100 g of total fatty acids for blesbok M. longissimus dorsi. P:S values of 1.11 ±
0.13 (Kroucamp, 2004) and 1.00 ± 0.39 (Smit, 2004) have been reported for springbok and
blesbok, respectively. The same authors reported n-6:n-3 values of 3.28 ± 0.12 for springbok
and 3.62 ± 0.75 for blesbok meat.
When the PUFA as a percentage of the total fatty acids were considered (Table 7),
the springbok M. semitendinosus had the highest value (36.937 ± 8.516%), while the M.
supraspinatus had the lowest value (30.714 ± 3.707%) – these values tie in well with the
PUFA percentage reported by Kroucamp (2004). The PUFA as a percentage of the total fatty
acids of blesbok (Table 8) is in the same vicinity, but slightly higher than those reported for
springbok, with a higher value of 40.515 ± 13.954% (M. biceps femoris) and a lower value of
34.125 ± 11.909% (M. supraspinatus).
It has been suggested that a higher dietary intake of polyunsaturated fatty acids (PUFA), in
comparison to the saturated fatty acids (SFA), is more beneficial. Wood et al. (2004) reported
a recommended P:S value of no less than 0.4, and furthermore noted that the normal P:S
ratio for meat is around 0.1. However, Gibney and Hunter (1993) found that high levels of the
omega-6 (n-6) PUFA could, in fact, have a detrimental impact on health. Inflammatory
eicosanoids are produced during the post-absorptive metabolism of n-6 PUFA and
inflammatory responses are important factors in the development of cardiovascular heart
disease and cancer. The omega-3 (n-3) PUFA can act as modulators to this inflammation
and that is why the ratio of n-6:n-3 PUFA is so important. The most important n-6 PUFA is
linoleic acid (C18:2) and linolenic acid (C18:3) is the most important n-3 PUFA. The British
Department of Health (1994) recommends a n-6:n-3 ratio of less than 4.0. It was reported
that ruminant meat has very low n-6:n-3 ratios, especially if the animals primarily graze,
because of the higher levels of linolenic acid (C18:3) found in grass (Wood et al., 2004). This
study showed that game meat can definitely compete well with domesticated meat where the
fatty acid profile is concerned, since both springbok and blesbok meat contains high levels of
PUFA, yet has high P:S and low n-6:n-3 ratios.
The mean P:S ratio of the five springbok muscles was 0.78 (M. supraspinatus lowest
and M. biceps femoris highest value), while the mean blesbok P:S ratio was 0.92 (M.
supraspinatus lowest and M. biceps femoris highest value). The springbok values are lower
than those previously reported by Kroucamp (2004), while the blesbok values are just slightly
higher than what Smit (2004) reported, however, both are much higher than the average
value reported by Wood et al. (2004) and is also higher than the recommended value of 0.4.
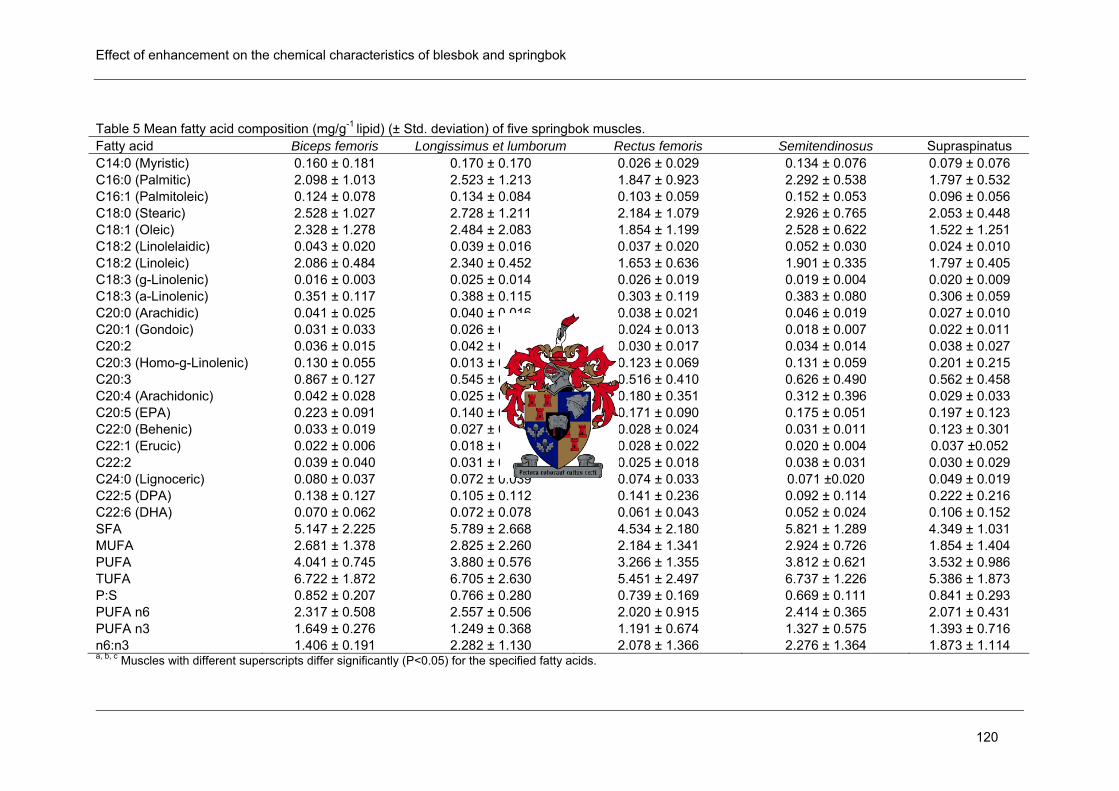
Effect of enhancement on the chemical characteristics of blesbok and springbok
120
Table 5 Mean fatty acid composition (mg/g-1 lipid) (± Std. deviation) of five springbok muscles. Fatty acid Biceps femoris Longissimus et lumborum Rectus femoris Semitendinosus Supraspinatus C14:0 (Myristic) 0.160 ± 0.181 0.170 ± 0.170 0.026 ± 0.029 0.134 ± 0.076 0.079 ± 0.076 C16:0 (Palmitic) 2.098 ± 1.013 2.523 ± 1.213 1.847 ± 0.923 2.292 ± 0.538 1.797 ± 0.532 C16:1 (Palmitoleic) 0.124 ± 0.078 0.134 ± 0.084 0.103 ± 0.059 0.152 ± 0.053 0.096 ± 0.056 C18:0 (Stearic) 2.528 ± 1.027 2.728 ± 1.211 2.184 ± 1.079 2.926 ± 0.765 2.053 ± 0.448 C18:1 (Oleic) 2.328 ± 1.278 2.484 ± 2.083 1.854 ± 1.199 2.528 ± 0.622 1.522 ± 1.251 C18:2 (Linolelaidic) 0.043 ± 0.020 0.039 ± 0.016 0.037 ± 0.020 0.052 ± 0.030 0.024 ± 0.010 C18:2 (Linoleic) 2.086 ± 0.484 2.340 ± 0.452 1.653 ± 0.636 1.901 ± 0.335 1.797 ± 0.405 C18:3 (g-Linolenic) 0.016 ± 0.003 0.025 ± 0.014 0.026 ± 0.019 0.019 ± 0.004 0.020 ± 0.009 C18:3 (a-Linolenic) 0.351 ± 0.117 0.388 ± 0.115 0.303 ± 0.119 0.383 ± 0.080 0.306 ± 0.059 C20:0 (Arachidic) 0.041 ± 0.025 0.040 ± 0.016 0.038 ± 0.021 0.046 ± 0.019 0.027 ± 0.010 C20:1 (Gondoic) 0.031 ± 0.033 0.026 ± 0.018 0.024 ± 0.013 0.018 ± 0.007 0.022 ± 0.011 C20:2 0.036 ± 0.015 0.042 ± 0.018 0.030 ± 0.017 0.034 ± 0.014 0.038 ± 0.027 C20:3 (Homo-g-Linolenic) 0.130 ± 0.055 0.013 ± 0.038 0.123 ± 0.069 0.131 ± 0.059 0.201 ± 0.215 C20:3 0.867 ± 0.127 0.545 ± 0.381 0.516 ± 0.410 0.626 ± 0.490 0.562 ± 0.458 C20:4 (Arachidonic) 0.042 ± 0.028 0.025 ± 0.012 0.180 ± 0.351 0.312 ± 0.396 0.029 ± 0.033 C20:5 (EPA) 0.223 ± 0.091 0.140 ± 0.076 0.171 ± 0.090 0.175 ± 0.051 0.197 ± 0.123 C22:0 (Behenic) 0.033 ± 0.019 0.027 ± 0.016 0.028 ± 0.024 0.031 ± 0.011 0.123 ± 0.301 C22:1 (Erucic) 0.022 ± 0.006 0.018 ± 0.007 0.028 ± 0.022 0.020 ± 0.004 0.037 ±0.052 C22:2 0.039 ± 0.040 0.031 ± 0.025 0.025 ± 0.018 0.038 ± 0.031 0.030 ± 0.029 C24:0 (Lignoceric) 0.080 ± 0.037 0.072 ± 0.039 0.074 ± 0.033 0.071 ±0.020 0.049 ± 0.019 C22:5 (DPA) 0.138 ± 0.127 0.105 ± 0.112 0.141 ± 0.236 0.092 ± 0.114 0.222 ± 0.216 C22:6 (DHA) 0.070 ± 0.062 0.072 ± 0.078 0.061 ± 0.043 0.052 ± 0.024 0.106 ± 0.152 SFA 5.147 ± 2.225 5.789 ± 2.668 4.534 ± 2.180 5.821 ± 1.289 4.349 ± 1.031 MUFA 2.681 ± 1.378 2.825 ± 2.260 2.184 ± 1.341 2.924 ± 0.726 1.854 ± 1.404 PUFA 4.041 ± 0.745 3.880 ± 0.576 3.266 ± 1.355 3.812 ± 0.621 3.532 ± 0.986 TUFA 6.722 ± 1.872 6.705 ± 2.630 5.451 ± 2.497 6.737 ± 1.226 5.386 ± 1.873 P:S 0.852 ± 0.207 0.766 ± 0.280 0.739 ± 0.169 0.669 ± 0.111 0.841 ± 0.293 PUFA n6 2.317 ± 0.508 2.557 ± 0.506 2.020 ± 0.915 2.414 ± 0.365 2.071 ± 0.431 PUFA n3 1.649 ± 0.276 1.249 ± 0.368 1.191 ± 0.674 1.327 ± 0.575 1.393 ± 0.716 n6:n3 1.406 ± 0.191 2.282 ± 1.130 2.078 ± 1.366 2.276 ± 1.364 1.873 ± 1.114 a, b, c Muscles with different superscripts differ significantly (P<0.05) for the specified fatty acids.

Effect of enhancement on the chemical characteristics of blesbok and springbok
121
Table 6 Mean fatty acid composition (mg/g-1 lipid) (± Std. Deviation) of five blesbok muscles. Fatty acid Biceps femoris Longissimus et lumborum Rectus femoris Semitendinosus Supraspinatus
C14:0 (Myristic) 0.036 ± 0.026 0.060 ± 0.042 0.061 ± 0.041 0.036 ± 0.033 0.103 ± 0.097 C16:0 (Palmitic) 1.201 ± 0.464 1.164 ± 0.625 1.482 ± 0.562 1.291 ± 0.719 1.689 ± 1.145 C16:1 (Palmitoleic) 0.056 ± 0.027 0.061 ± 0.027 0.066 ± 0.034 0.070 ± 0.039 0.083 ± 0.064 C18:0 (Stearic) 1.557 ± 0.511b 1.775 ± 0.541 a, b 1.793 ± 0.625 a, b 1.599 ± 0.514 b 2.310 ± 1.345 a C18:1 (Oleic) 1.588 ± 1.310 1.834 ± 1.050 1.912 ± 1.080 2.063 ± 1.350 1.928 ± 2.400 C18:2 (Linolelaidic) 0.128 ± 0.329 0.019 ± 0.027 0.012 ± 0.004 0.012 ± 0.004 0.015 ± 0.009 C18:2 (Linoleic) 1.431 ± 0.284 1.524 ± 0.271 1.340 ± 0.172 1.312 ± 0.300 1.423 ± 0.256 C18:3 (g-Linolenic) 0.016 ± 0.009 0.017 ± 0.002 0.014 ± 0.003 0.014 ± 0.005 0.015 ± 0.005 C18:3 (a-Linolenic) 0.486 ± 0.177 0.523 ± 0.113 0.445 ± 0.113 0.440 ± 0.196 0.482 ± 0.145 C20:0 (Arachidic) 0.022 ± 0.005 0.021 ± 0.004 0.022 ± 0.006 0.020 ± 0.005 0.026 ± 0.006 C20:1 (Gondoic) 0.012 ± 0.005 0.010 ± 0.003 0.011 ± 0.003 0.012 ± 0.005 0.011 ± 0.006 C20:2 0.018 ± 0.011 0.014 ± 0.009 0.013 ± 0.007 0.014 ± 0.014 0.015 ± 0.006 C20:3 (Homo-g-Linolenic) 0.062 ± 0.016 0.057 ± 0.013 0.063 ± 0.010 0.058 ± 0.010 0.064 ± 0.007 C20:3 0.371 ± 0.331 0.395 ± 0.284 0.584 ± 0.107 0.450 ± 0.264 0.306 ± 0.279 C20:4 (Arachidonic) 0.193 ± 0.337 0.221 ± 0.350 0.011 ± 0.002 0.071 ± 0.181 0.113 ± 0.264 C20:5 (EPA) 0.164 ± 0.067 0.168 ± 0.044 0.135 ± 0.042 0.148 ± 0.070 0.121 ± 0.035 C22:0 (Behenic) 0.012 ± 0.004 0.011 ± 0.003 0.009 ± 0.007 0.010 ± 0.004 0.097 ± 0.221 C22:1 (Erucic) 0.013 ± 0.004 0.012 ± 0.006 0.012 ± 0.003 0.011 ± 0.006 0.013 ± 0.005 C22:2 0.017 ± 0.010 0.014 ± 0.009 0.010 ± 0.004 0.012 ± 0.006 0.020 ± 0.012 C24:0 (Lignoceric) 0.039 ± 0.010 0.046 ± 0.014 0.043 ± 0.014 0.039 ± 0.010 0.053 ± 0.022 C22:5 (DPA) 0.082 ± 0.082 0.088 ± 0.081 0.030 ± 0.042 0.085 ± 0.078 0.053 ± 0.066 C22:6 (DHA) 0.029 ± 0.017 0.042 ± 0.024 0.034 ± 0.024 0.036 ± 0.031 0.018 ± 0.009 SFA 3.066 ± 1.013 3.231 ± 1.045 3.612 ± 1.267 3.177 ± 1.117 4.420 ± 2.588 MUFA 1.774 ± 1.346 2.011 ± 1.093 2.098 ± 1.138 2.240 ± 1.406 2.163 ± 2.474 PUFA 2.997 ± 0.848 3.083 ± 0.564 2.690 ± 0.435 2.651 ± 0.744 2.644 ± 0.488 TUFA 4.774 ± 1.282 5.094 ± 1.250 4.788 ± 1.173 4.891 ± 1.839 4.807 ± 2.780 P:S 1.074 ± 0.420 a 1.047 ± 0.363 a, b 0.827 ± 0.298 a, b 0.901 ± 0.309 a, b 0.754 ± 0.341 b PUFA n6 1.829 ± 0.794 1.839 ± 0.588 1.440 ± 0.177 1.466 ± 0.371 1.630 ± 0.504 PUFA n3 1.132 ± 0.447 1.217 ± 0.352 1.227 ± 0.269 1.159 ± 0.455 0.979 ± 0.147 n6:n3 1.870 ± 1.206 1.683 ± 0.898 1.205 ± 0.198 1.379 ± 0.501 1.717 ± 0.639 a, b, c Muscles with different superscripts differ significantly (P<0.05) for the specified fatty acids.

Effect of enhancement on the chemical characteristics of blesbok and springbok
122
The n-6:n-3 ratio averaged 1.98 (M. biceps femoris lowest and M. longissimus et
lumborum highest value) in springbok, and 1.57 (M. rectus femoris lowest and M. biceps femoris
highest value) in blesbok, which is much lower than the upper limit of 4.0 of the recommended
intake value. Since the n-6:n-3 ratio is calculated by dividing the sum of all the n-6 PUFA by
the sum of all the n-3 PUFA present in the sample, these relatively low n-6:n-3 ratios may be
explained by the low linoleic acid content observed in all five muscles.
Kroucamp (2004) reported a linoleic acid value of 21.62 ± 1.33% in springbok, while the
values found in the present study were lower and lay between 15.30 ± 2.33% (M.
supraspinatus) and 20.17 ± 4.67% (M. longissimus et lumborum). The α-linolenic acid values
found in this study (3.01 ± 0.63% - 3.24 ± 0.62%, found in M. biceps femoris and M.
semitendinosus muscles respectively) were very similar to that (3.37 ± 0.29%) reported by
Kroucamp (2004). The linoleic acid of blesbok meat ranged from 17.01 ± 4.78% (M. rectus
femoris) to 19.14 ± 4.78% (M. biceps femoris), while the α-linolenic acid values varied between
5.61 ± 1.66% (M. rectus femoris) and 6.49 ± 1.49% (M. longissimus et lumborum).
In this study, arachidonic acid in springbok meat was observed to be 1.10% (M.
longissimus et lumborum and M. supraspinatus, respectively lowest and highest value), which
was much lower than previously reported for springbok meat, while blesbok had an arachidonic
acid value of 1.27% (M. rectus femoris and M. longissimus et lumborum, respectively lowest
and highest value). The palmitoleic acid varied from 0.92 ± 0.31% (M. semitendinosus) to 1.20
± 0.31% (M. supraspinatus) in springbok, and between 0.69 ± 0.19% (M. biceps femoris) and
0.82 ± 0.31% (M. supraspinatus), and was higher than previously reported for springbok meat.
However, the arachidonic acid percentages observed in this study was still competitive to those
reported for other domesticated species and the palmitoleic acid values presented here were
much lower than those reported for beef, lamb and pork.
Viljoen (1999) reported that springbok meat contained high levels of arachidonic acid
(C20:4), a PUFA capable of lowering serum cholesterol, and that it contained lower palmitoleic
acid (C16:1) levels, a PUFA with cholesterol-increasing properties. These claims were
confirmed by Kroucamp (2004) who reported an arachidonic acid level of 9.30 ± 0.73% and a
palmitoleic acid level of 0.067 ± 0.03% for springbok meat, which was respectively higher and
lower than the arachidonic and palmitoleic acid percentages reported by Enser et al. (1998) for
beef (0.63 ±0.21%; 4.54 ± 0.81%), lamb (0.64 ± 0.23%; 2.20 ± 0.26%) and pork (2.21 ± 0.73%;
2.71 ± 0.45%). This alone may establish game meat as a ‘healthier’ meat alternative.
The SFA present in the highest quantities were palmitic (1.80 ± 0.53 – 2.52 ± 1.21mg/g-
1 in springbok, and 1.16 ± 0.63 – 1.69 ± 1.15mg/g-1 in blesbok) and stearic (2.05 ± 0.45 – 2.93 ±
0.77mg/g-1 in springbok and 1.56 ± 0.51 – 2.31 ± 1.35mg/g-1 n blesbok) acids, which was
consistent with the findings of other authors (Schönfeldt, 1993; Melanson, Gootman, Myrdal,
Kline and Rippe, 2003). The PUFA present in the highest quantities were oleic (C18:1) (1.52 ±
1.25 – 2.53 – 0.62mg/g-1 in springbok, and 1.59 ± 1.31 – 2.06 ± 1.35mg/g-1 in blesbok)

Effect of enhancement on the chemical characteristics of blesbok and springbok
123
Table 7 Mean fatty acid composition as a percentage (%) of total fatty acids (± Std. Deviation) of five springbok muscles. Fatty acid Biceps femoris Longissimus et lumborum Rectus femoris Semitendinosus Supraspinatus
C14:0 (Myristic) 1.148 ± 0.779 1.126 ± 0.731 1.331 ± 0.525 0.776 ± 0.590 1.092 ± 0.537 C16:0 (Palmitic) 17.152 ± 2.065 19.822 ± 2.701 18.388 ± 1.789 18.586 ± 3.309 18.166 ± 1.560 C16:1 (Palmitoleic) 1.008 ± 0.305 0.986 ± 0.296 1.044 ± 0.288 0.918 ± 0.314 1.204 ± 0.312 C18:0 (Stearic) 21.022 ± 2.375 21.865 ± 3.928 21.815 ± 2.002 21.598 ± 3.909 23.107 ± 2.672 C18:1 (Elaidic) 0.549 ± 0.378 0.613 ± 0.446 0.782 ± 0.461 0.522 ± 0.456 0.888 ± 0.597 C18:1 (Oleic) 18.951 ± 4.370 17.506 ± 8.821 18.397 ± 4.075 14.252 ± 10.799 19.961 ± 1.407 C18:2 (Linoleic) 18.156 ± 2.978 a, b 20.169 ± 4.670 a 17.150 ± 3.131 a, b 19.009 ± 4.192 a 15.303 ± 2.327 b C18:3 (g-Linolenic) 0.145 ± 0.050 0.211 ± 0.125 0.269 ± 0.180 0.209 ± 0.095 0.150 ± 0.039 C18:3 (a-Linolenic) 3.007 ± 0.634 3.235 ± 0.544 3.146 ± 0.499 3.239 ± 0.622 3.101 ± 0.653 C20:0 (Arachidic) 0.338 ± 0.135 0.352 ± 0.159 0.398 ± 0.141 0.277 ± 0.053 0.351 ± 0.085 C20:1 (Gondoic) 0.295 ± 0.361 0.204 ± 0.099 0.237 ± 0.097 0.223 ± 0.087 0.142 ± 0.042 C20:2 0.326 ± 0.167 0.348 ± 0.095 0.298 ± 0.105 0.368 ± 0.199 0.259 ± 0.072 C20:3 (Homo-g-Linolenic) 1.201 ± 0.658 1.097 ± 0.358 1.211 ± 0.530 1.937 ± 1.588 1.041 ± 0.370 C20:3 7.693 ± 1.478 4.985 ± 3.425 5.329 ± 3.401 5.620 ± 4.201 4.525 ± 3.508 C20:4 (Arachidonic) 0.362 ± 0.261 0.203 ± 0.075 1.549 ± 2.727 0.326 ± 0.418 3.058 ± 4.113 C20:5 (EPA) 2.031 ± 0.980 1.316 ± 0.796 1.658 ± 0.652 2.115 ± 1.365 1.464 ± 0.589 C22:0 (Behenic) 0.302 ± 0.217 0.223 ± 0.137 0.280 ± 0.191 1.539 ± 3.883 0.245 ± 0.073 C22:1 (Erucic) 0.199 ± 0.072 0.150 ± 0.050 0.260 ± 0.143 0.355 ± 0.400 0.160 ± 0.041 C22:2 0.357 ± 0.375 0.258 ± 0.189 0.256 ± 0.092 0.285 ± 0.207 0.295 ± 0.210 C24:0 (Lignoceric) 0.729 ± 0.390 0.589 ± 0.243 0.745 ± 0.226 0.529 ± 0.220 0.571 ± 0.132 C22:5 (DPA) 1.286 ± 1.208 1.137 ± 1.398 1.262 ± 2.233 2.487 ± 2.468 0.665 ± 0.806 C22:6 (DHA) 0.683 ± 0.749 0.808 ± 1.213 0.585 ± 0.402 1.091 ± 1.640 0.449 ± 0.298 SFA 42.451 ± 3.434 45.816 ± 6.137 45.278 ± 2.808 45.564 ± 8.133 46.208 ± 2.387 MUFA 21.945 ± 4.146 20.099 ± 8.904 21.650 ± 4.008 17.499 ± 11.110 23.079 ± 1.823 PUFA 35.604 ± 6.650 34.086 ± 9.302 33.072 ± 5.905 36.937 ± 8.516 30.714 ± 3.707 TUFA 57.549 ± 3.434 54.184 ± 6.137 54.722 ± 2.808 54.436 ± 8.133 53.793 ± 2.387 P:S 0.852 ± 0.207 0.766 ± 0.280 0.739 ± 0.169 0.841 ± 0.293 0.669 ± 0.111 PUFA n6 20.221 ± 3.365 22.000 ± 4.988 20.538 ± 4.757 21.731 ± 3.930 19.955 ± 5.439 PUFA n3 14.700 ± 3.351 11.481 ± 5.105 11.980 ± 4.457 14.553 ± 6.754 10.204 ± 3.191 N6:n3 1.406 ± 0.191 2.282 ± 1.130 2.078 ± 1.366 1.873 ± 1.114 2.276 ± 1.364 a, b, c Muscles with different superscripts differ significantly (P<0.05) for the specified fatty acid.

Effect of enhancement on the chemical characteristics of blesbok and springbok
124
Table 8 Mean fatty acid composition (%) (± Std. Deviation) of five blesbok muscles. Fatty acid Biceps femoris Longissimus et lumborum Rectus femoris Semitendinosus Supraspinatus
C14:0 (Myristic) 0.440 ± 0.258 0.732 ± 0.462 0.686 ± 0.355 0.447 ± 0.265 0.983 ± 0.776 C16:0 (Palmitic) 15.061 ± 2.642 13.602 ± 6.101 17.315 ± 2.204 15.819 ± 5.616 17.393 ± 3.736 C16:1 (Palmitoleic) 0.692 ± 0.187 0.712 ± 0.214 0.745 ± 0.210 0.813 ± 0.242 0.818 ± 0.307 C18:0 (Stearic) 19.709 ± 2.338 b 21.142 ± 2.017 b 21.230 ± 2.806 b 20.092 ± 2.029 b 25.013 ± 4.218a C18:1 (Elaidic) 0.691 ± 0.502 0.623 ± 0.543 0.496 ± 0.524 0.433 ± 0.380 1.003 ± 0.996 C18:1 (Oleic) 18.429 ± 11.658 20.766 ± 8.205 21.194 ± 7.014 23.230 ± 8.934 15.806 ± 12.936 C18:2 (Linolelaidic) 1.706 ± 4.405 0.267 ± 0.428 0.138 ± 0.034 0.156 ± 0.064 0.182 ± 0.075 C18:2 (Linoleic) 19.138 ± 4.782 19.004 ± 4.307 17.006 ± 4.776 17.431 ± 4.776 18.362 ± 6.419 C18:3 (g-Linolenic) 0.201 ± 0.096 0.215 ± 0.040 0.174 ± 0.037 0.182 ± 0.049 0.186 ± 0.055 C18:3 (a-Linolenic) 6.447 ± 2.214 6.494 ± 1.488 5.606 ± 1.663 5.574 ± 1.990 5.962 ± 1.811 C20:0 (Arachidic) 0.284 ± 0.057 0.268 ± 0.089 0.280 ± 0.094 0.260 ± 0.059 0.321 ± 0.101 C20:1 (Gondoic) 0.158 ± 0.038 0.127 ± 0.031 0.135 ± 0.026 0.149 ± 0.032 0.125 ± 0.059 C20:2 0.233 ± 0.136 0.157 ± 0.068 0.151 ± 0.058 0.187 ± 0.169 0.197 ± 0.102 C20:3 (Homo-g-Linolenic) 0.841 ± 0.284 0.717 ± 0.223 0.816 ± 0.284 0.785 ± 0.252 0.869 ± 0.371 C20:3 5.673 ± 5.517 5.235 ± 4.301 7.465 ± 2.270 6.305 ± 3.931 4.797 ± 5.423 C20:4 (Arachidonic) 2.103 ± 3.743 2.527 ± 3.872 0.136 ± 0.045 0.756 ± 1.822 0.827 ± 1.725 C20:5 (EPA) 2.251 ± 1.013 2.128 ± 0.702 1.721 ± 0.662 1.897 ± 0.829 1.577 ± 0.597 C22:0 (Behenic) 0.163 ± 0.052 0.138 ± 0.040 0.105 ± 0.087 0.130 ± 0.060 1.232 ± 2.810 C22:1 (Erucic) 0.176 ± 0.049 0.154 ± 0.095 0.151 ± 0.062 0.129 ± 0.067 0.167 ± 0.076 C22:2 0.234 ± 0.146 1.180 ± 0.116 0.127 ± 0.042 0.149 ± 0.060 0.252 ± 0.146 C24:0 (Lignoceric) 0.524 ± 0.170 0.552 ± 0.101 0.532 ± 0.148 0.527 ± 0.214 0.665 ± 0.323 C22:5 (DPA) 1.254 ± 1.261 1.188 ± 1.128 0.454 ± 0.765 1.021 ± 0.936 0.684 ± 0.861 C22:6 (DHA) 0.433 ± 0.351 0.538 ± 0.308 0.418 ± 0.309 0.452 ± 0.366 0.230 ± 0.134 SFA 38.698 ± 3.501 b 38.453 ± 5.815 b 42.413 ± 3.693 a, b 39.704 ± 4.359 b 47.466 ± 8.845 a MUFA 20.787 ± 11.461 22.897 ± 8.276 23.375 ± 7.087 25.404 ± 8.966 18.409 ± 12.264 PUFA 40.515 ± 13.954 38.650 ± 9.718 34.212 ± 10.092 34.892 ± 9.665 34.125 ± 11.909 TUFA 61.302 ± 3.501 a 61.547 ± 5.815 a 57.587 ± 3.693 a, b 60.296 ± 4.359 a 52.534 ± 8.845 b P:S 1.074 ± 0.420 a 1.047 ± 0.362 a, b 0.827 ± 0.298 a, b 0.901 ± 0.309 a, b 0.754 ± 0.341b PUFA n6 23.990 ± 9.787 22.730 ± 6.926 18.269 ± 5.083 19.309 ± 4.929 20.426 ± 6.403 PUFA n3 16.058 ± 8.545 15.583 ± 6.054 15.665 ± 5.141 15.248 ± 5.602 13.250 ± 6.322 n6:n3 1.870 ± 1.206 1.683 ± 0.898 1.205 ± 0.198 1.379 ± 0.501 1.717 ± 0.639 a, b, c Muscles with different superscripts differ significantly (P<0.05) for the specified fatty acids.

Effect of enhancement on the chemical characteristics of blesbok and springbok
125
and linoleic (1.65 ± 0.64 – 2.34 ± 0.45 mg/g-1 in springbok, and 1.31 ± 0.30 – 1.52 ± 0.27
mg/g-1 in blesbok) acids.
Schönfeldt (1993) reported that a decrease in cardiovascular disease risk could be
manipulated by decreasing the dietary intake of saturated fatty acids (SFA), especially
myristic (C14:0) and palmitic (C16:0) acid, as this results in lower blood serum cholesterol
levels. These two SFA are usually responsible for increasing cholesterol levels, with myristic
acid having four times the cholesterol-raising potential of palmitic acid (Higgs, 2000). Only
minor amounts of myristic acid are present in meat (Higgs, 2000). The main SFA found in
meat are palmitic and stearic (C18:0) acid (Schönfeldt, 1993; Melanson et al., 2003), but
stearic acid is viewed as a neutral fatty acid and does not display any cholesterol elevating
effects.
Muscle types also differ in fatty acid composition, with red oxidative muscles (e.g. M.
semitendinosus) having higher levels of PUFA than muscles with predominantly white muscle
fibres, such as the M. longissimus dorsi (Lengyel et al., 2003). Enser et al. (1998) explain
these differences by pointing out the differences in the phospholipid concentration between
the two muscle types; red oxidative muscles have higher phospholipid concentrations.
Although the five muscles investigated did differ slightly in terms of its fatty acid
profile, there were no significant differences found between any of the springbok muscles
when the fatty acid content (in mg/g-1) was examined, but for blesbok muscles significant
(P<0.05) differences were found between the muscles for stearic acid content and the P:S
ratio. However, significant differences between springbok muscles were found when the fatty
acids were investigated as a percentage of the total fatty acids, but only where linoleic acid
(C18:2) was concerned. When the blesbok fatty acid profile was investigated as a
percentage of the total fatty acids, differences between muscles were found for stearic acid,
total SFA content, total unsaturated fatty acid (TUFA) content and P:S ratio.
As far as the fatty acid profile is concerned, the five springbok and blesbok muscles
investigated in this study are pretty much equally matched.
4. Conclusion Enhancing springbok and blesbok muscles with an inorganic salt solution significantly
improved the moisture content of most muscles, except for the springbok M. supraspinatus
and blesbok M. biceps femoris and M. longissimus et lumborum. This will probably lead to
improved juiciness at consumption, which is exactly what the consumer desires. Ash
percentage was significantly affected in all muscles, mainly due to the additional minerals the
injected solution delivered to the enhanced muscles. Fat and protein percentages were lower
in the enhanced muscles, but that might be due to a dilution-effect caused by the higher
amount of moisture present in those muscles.
Potassium and sodium were significantly higher in the enhanced springbok muscles,
while phosphorus, as well as potassium and sodium, were significantly higher in the
enhanced blesbok muscles. Magnesium was significantly lower in most of the untreated

Effect of enhancement on the chemical characteristics of blesbok and springbok
126
muscles as compared to the enhanced muscles in both species. The mineral differences
between treatments were directly caused by the addition of the inorganic salt solution used to
enhance the meat.
Overall, the fatty acid profile for the five muscles investigated in this study, correlates
well with the results found in previous studies conducted on game species and compares
favourably with the fatty acid profiles of other (domesticated) meat species.
5. References
AOAC. (1997). Official Methods of Analysis. 15th ed. Arlington, VA. USA: Association of
Official Analytical Chemists.
Baublits, R.T., Pohlman, F.W., Brown Jr., A.H. & Johnson, Z.B. (2005). Effects of sodium
chloride, phosphate type and concentration, and pump rate on beef biceps femoris quality
and sensory characteristics. Meat Science 70, 205-214.
Chizzolini, R., Zanardi, E., Dorigoni, V. & Ghidini, S. (1999). Calorific value and cholesterol
content of normal and low-fat meat and meat products. Trends in Food Science and
Technology 10, 119-128.
Committee on Medical Aspects of Food Policy (1984). ‘Diet and Cardiovascular Disease.
Report on Health and social subjects, Department of Health and Social Security, No. 28,
HMSO, London.
Conroy, A.M. & Gaigher, I.G. (1982). Venison, Aquaculture and ostrich meat production:
Action 2003. South African Journal of Animal Science 2, 219-233.
Deatherage, F.E. (1963). The effect of water and inorganic salts on tenderness. In
Proceedings meat tenderness symposium (pp. 45-68). Camden: Campbell Soup
Company.
Department of Health. (1994). Department of Health, Nutritional Aspects of Cardiovascular
Disease. In: Report on Health and Social Subjects no. 46, HMSO, London.
Elliot, J. (1993). Farmed Venison, the new meat comes of age. Nutrition and Food Science
26-29.
Enser, M., Hallett, K., Hewett, B., Fursey, G.A.J., Wood, J.D. & Harrington, G. (1998). Fatty
acid composition of UK beef and lamb muscle in relation to production system and
implications for human nutrition. Meat Science 49, 329-341.
Folch, J., Lees, M. & Sloane-Stanley, G.H. (1957). A simple method for the isolation and
purification of total lipids from animal tissues. Journal of Biological Chemistry 226, 495-
509.
Gibney, M.J. & Hunter, B. (1993). The effects of short- and long-term supplementation with
fish oil on incorporation of n-3 polyunsaturated fatty acids into cells of the immune system
in health volunteers. European Journal of Clinical Nutrition 47, 255-259.
Higgs, J.D. (2000). The changing nature of red meat: 20 years of improving nutritional
quality. Trends in Food Science and Technology 11, 85-95.

Effect of enhancement on the chemical characteristics of blesbok and springbok
127
Hoffman, L.C. (2000). Meat quality attributes of night-cropped impala (Aepyceros melampus).
SA Journal of Animal Science 30, 133-137.
Hoffman, L.C., Muller, M., Schutte, De W., Calitz, F.J. & Crafford, K. (2005). Consumer
expectations, perceptions and purchasing of South African game meat. South African
Journal of Wildlife Research 35, 33-42.
Hoffman, L.C., Muller, M., Schutte, De W. & Crafford, K. (2004). Retail of South African game
meat: current trade and marketing trends. South African Journal of Wildlife Research 34,
123-134.
Jeremiah, L.E., Dugan, M.E.R., Aalhus, J.L. & Gibson, L.L. (2003). Assessment of the
relationship between chemical and components and palatability of major beef muscles
and muscle groups. Meat Science 65 1013-1019.
Jeremiah, L.E., Smith, G.C. & Carpenter, Z.L. (1971). Palatability of individual muscles from
ovine leg steaks as related to chronological age and marbling. Journal of Food Science
35, 45-47.
Kroucamp, M. (2004). Meat quality characteristics of the springbok (Antidorcas marsupialis).
M. Sc. (Foods). Department of Food Science. University of Stellenbosch, Stellenbosch.
Lawrie, R.A. (1998). Lawrie’s Meat Science (6th ed.). Cambridge, England: Woodhead
Publishing Ltd.
Lee, C.M., Trevino, B. & Chaiyawat, M. (1996). A simple and rapid solvent extraction method
for determining total lipids in fish tissue. Journal of AOAC International 79, 487-492.
Lengyel, Z., Husvèth, F., Polgar, P., Szabo, F. & Magyar, L. (2003). Fatty acid composition
of intramuscular lipids in various muscles of Holstein-Friesian bulls slaughtered at
different ages. Meat Science 65, 593-598.
Lewis, A.R., Pinchin, A.M. & Kestin, S.C. (1997). Welfare implications of the night shooting of
wild impala (Aepyceros melampus). Animal Welfare 6, 123-131.
MacRae, J., O’Reilly, L. & Morgan, P. (2005). Desirable characteristics of animal products
from a human health perspective. Livestock Production Science 94, 95-103.
Melanson, K., Gootman, J., Myrdal, A., Kline, G. & Rippe, J. (2003). Weight loss and total
lipid profile changes in overweight women consuming beef or chicken as the primary
protein source. Nutrition 19, 409-414.
Nelson, G.J., Schmidt, P.C. & Kelley, D.S. (1995). Low-fat diets do not lower plasma
cholesterol levels in healthy men compared to high-fat diets with similar fatty acid
composition and constant caloric intake. Lipids 30, 969-976.
Niemenin, M. (1992). Meat production and chemical composition of reindeer meat.
Proceedings of the 3rd International Wildlife Ranching Symposium, Pretoria, South Africa.
Offer, G. & Trinick, J. (1983). On the mechanism of water holding in meat: The swelling and
shrinking of myofibrils. Meat Science 4, 245-281.
Olsson, U., Hertzman, C. & Tornberg, E. (1994). The influence of low temperature, type of
muscle and electrical stimulation on the course of rigor, ageing and tenderness of beef
muscles. Meat Science 37, 115-131.

Effect of enhancement on the chemical characteristics of blesbok and springbok
128
Papadopoulos, L.S., Miller, R.K., Ringer, L.J. & Cross, H.R. (1991). Sodium lactate effect on
sensory characteristics, cooked meat colour and chemical composition. Journal of Food
Science 56, 621-626.
Pauw, J. (1993). The development of venison marketing. In Forum: The venison industry.
Research requirements and possibilities (pp.3-5). Meat industry centre, Irene Agricultural
research Council, Pretoria, South Africa.
Pinta, M. (1982). Modern methods for trace element analysis (3rd ed.). Ann Arbor, MI, USA:
Ann Arbor Science.
Prestat, C., Jensen, J., McKeith, F.K. & Brewer, M.S. (2002). Cooking methods and endpoint
temperature effects on sensory and colour characteristics of pumped pork loin chops.
Meat Science 60, 395-400.
Sales, J. (1995). Nutritional quality of meat from some alternative species. World review of
Animal Production 30, 47-56.
SAS (1999). SAS/STAT User’s Guide, Version 8 (Volume II). SAS Institute Inc., North
Carolina.
Sayed, N., Frans, Y. & Schönfeldt, H.C. (1999). Composition of South African foods. Parow:
Medical Research Council.
Scanga, J.A., Delmore Jr., R.J., Ames, R.P., Belk, K.E., Tatum, J.D. & Smith, G.C. (2000).
Palatability of beef steaks marinated with solutions of calcium chloride, phosphate, and
(or) beef-flavouring. Meat Science 55, 397-401.
Schönfeldt, H. (1993). Nutritional content of venison. In Forum: The venison industry.
Research requirements and possibilities (pp. 51-60). Meat industry centre, Irene
Agricultural research Council, Pretoria, South Africa.
Shackelford, S.D., Wheeler, T.L. & Koohmaraie, M. (1995). Relationship between shear
force and trained sensory panel tenderness ratings of 10 major muscles from Bos indicus
and Bos taurus cattle. Journal of Animal Science 73, 3333-3340.
Smit, K. (2004). Meat quality characteristics of blesbok (Damaliscus dorcas phillipsi) and red
hartebeest (Alcelaphus buselaphus caama) meat. M. Consumer Sc. (Food) thesis.
Department of Consumer Science. University of Stellenbosch, Stellenbosch.
Takahashi, K., Kim, O.H. & Yano, K. (1987). Calcium-induced weakening of Z-discs in post
mortem skeletal muscle. Journal of Biochemistry 101, 767-773.
Thomas, A.R., Gondoza, H., Hoffman, L.C., Oosthuizen, V. & Naudè, R.J. (2004). The roles
of the proteasome, and cathepsins B,L,H and D, in ostrich meat tenderisation. Meat
Science 67, 113-120.
Van Schalkwyk, S. (2004). Meat quality characteristics of three South African game species:
Black wildebeest (Connochaetes gnou), Blue wildebeest (Connochaetes taurinus) and
Mountain reedbuck (Redunca fulvorufula). M. Sc. Cons. (Foods). Department of
Consumer Science. University of Stellenbosch, Stellenbosch.

Effect of enhancement on the chemical characteristics of blesbok and springbok
129
Van Zyl, L. & Ferreira, A.V. (2004). Physical and chemical carcass composition of springbok
(Antidorcas marsupialis), blesbok (Damaliscus dorcas phillipsi) and impala (Aepyceros
melampus). Small Ruminant Research 53, 103-109.
Varnam, A.H. & Sutherland, J.P. (1995). Meat and meat products, technology, chemistry
and microbiology. London: Chapman & Hall. Pp. 57-76.
Viljoen, J.J. (1999). ‘n Vergelyking van die lipiedkomponente van springbokvleis met die van
beesvleis en die verwante belangrikheid vir aspekte van die menslike gesondheid. SA
Tydskrif vir Natuurwetenskap enTegnologie 18, 51-53.
Von la Chevallerie, M. (1972). Meat quality of seven wild ungulate species. South African
Journal of Animal Science 2, 101-103.
Wheeler, T.L., Koohmaraie, M. & Shackelford, S.D. (1997). Effect of post-mortem injection
time and post-injection ageing time on the calcium-activated tenderisation process in
beef. Journal of Animal Science 75, 2652-2660.
Wood, J.D., Richardson, R.I., Nute, G.R., Fisher, A.V., Campo, M.M., Kasapidou, E., Sheard,
P.R. & Enser, M. (2004). Effects of fatty acids on meat quality: a review. Meat Science
66, 21-32.
Young, O.A., Frost, D.A., West, J. & Braggins, T. (2001). Analytical methods. In: Hui, Nip,
Rogers & Young (Eds). Meat Science and applications (pp. 103-126). Marcel Dekker,
New York.

130
Chapter 5 Analytical sensory evaluation of two springbok (Antidorcas marsupialis) and blesbok (Damaliscus dorcas phillipsi) muscles after injection with
an inorganic salt mixture Abstract The effect of inorganic salt enhancement on the sensory quality of springbok and blesbok M.
biceps femoris and M. longissimus et lumborum were investigated. The springbok (n=10) and
blesbok (n=10) originated from the Gariep Nature Reserve in South Africa. The sensory
characteristics evaluated by the experienced analytical panel (n=7) were aroma intensity,
initial juiciness, sustained juiciness, tenderness at first bite, residue, overall flavour, and
saltiness. In both species and both muscles, intensity of aroma was not significantly different
between treatments. The overall flavour of the springbok samples did not differ significantly
between treatments, although the overall flavour of the enhanced samples were lower than
the untreated samples. The overall flavour of enhanced blesbok muscles was significantly
lower than the untreated samples. Furthermore, the characteristics valued most by
consumers, namely tenderness (tenderness at first bite and residue) and juiciness (initial and
sustained juiciness) were positively influenced by inorganic salt enhancement. In most cases
the enhanced samples were more tender and juicy than the untreated samples, with
exceptions being initial juiciness and residue of the springbok M. biceps femoris, and initial
juiciness of the blesbok M. longissimus et lumborum and M. biceps femoris. The
characteristic ‘saltiness’ was added to the list of attributes evaluated because of the addition
of various salts caused by the enhancement solution. Although there was a highly significant
difference between treatments concerning salty taste, the enhanced samples were still well
within the acceptable range, with values ranging between 2 (practically no salt) and 4 (very
little salt). Enhancing game meat holds definite advantages in regards to improving its eating
quality.
Key words: Springbok, Blesbok, Game meat, Meat enhancement, Injected meat, Eating
quality, Sensory characteristics
1. Introduction
Since the 1980’s red meat has been vilified in terms of its impact on human health.
The British Government’s Committee on Medical Aspects of Food and Nutrition (COMA,
1984) linked meat, a major source of saturated fatty acids according to their report, to
coronary heart disease. Many consumers believe that red meat is unsuited for a balanced,
weight-loss diet because of its association with obesity (Melanson, Gootman, Myrdal, Kline
and Rippe, 2003). This view has been fuelled by reports that dietary fat and saturated fat
intake were primarily responsible for obesity and therefore, it has been recommend that red

Analytical sensory evaluation of blesbok and springbok
131
meat intake should be limited or completely eliminated. Another nail in the red meat
consumption coffin was its cholesterol content. No matter what scientific evidence suggests,
consumers associate meat with cholesterol and because serum cholesterol has been
erroneously associated with chronic heart disease, most consumers still link red meat intake
with increased cholesterol consumption and increased heart disease risk (Higgs, 2000).
Since the surfacing of all these different reports, there has been a general decline in red meat
consumption in favour of “safer” food sources such as chicken and plant proteins.
In their survey of 300 South African consumers, Hoffman, Muller, Schutte and
Crafford (2004) found fat content to be the most important quality considered by consumers
when purchasing meat. According to Chizzolini, Zanardi, Dorigoni and Ghidini (1999)
nutritional guidelines dictate that dietary fat should provide 15-30% of the total calorie-intake
and saturated fats should be limited to less than 10% of the caloric intake. It is also
suggested that cholesterol-intake should not be in excess of 300mg per day. However, fatty
acid composition, especially the ratio of polyunsaturated to saturated fatty acids, has been
shown to be more important for health reasons than total fat content (Higgs, 2000; Chizzolini
et al., 2003).
It was found that the springbok meat had a total fat content of 1.80% (enhanced) and
2.14% (untreated), and blesbok meat had a total fat content of 1.86% (enhanced) and 2.21%
(untreated) (Chapter 4). These results compare very well with the fat contents of several
meat species. For example, McCane and Widdowson (1991, as referenced by Elliot, 1993)
reported the following fat values: Venison roast, 6.4g/100g; Beef roast, 12.0g/100g; Lamb
roast, 17.9g/100g; Pork roast, 26.9g/100g; Skin-on chicken roast, 14.0g/100g, and Chicken
meat (skinless), 5.4g/100g. From this data it is clear that venison can definitely compete with
chicken when fat content is considered. Several South African game species have been
found to have even lower fat contents than the 5.4g/100g that McCane and Widdowson
(1991, as cited by Elliot, 1993) contributed to European venison. Several authors have
reported game species to have fat contents less than 3.0g/100g (Kroon, Van Rensburg and
Hofmeyr, 1972; Von la Chevallerie, 1972; Schönfeldt, 1993; Pauw, 1993; Hoffman, 2000).
Schönfeldt (1993) stated that game meat had higher levels of polyunsaturated fatty acids and
lower saturated fat contents than beef and this view has been confirmed by other authors
(Viljoen, 1999; Hoffman, 2000). Therefore, game meat can be considered a “healthier” red
meat because of its low fat and cholesterol contents and its beneficial fatty acid composition.
Game meat image has suffered in the past because of ignorance. Consumers are ill
informed about the potential health benefits of game meat and are left in the dark as to proper
preparation methods (Webb, 2001; Hoffman et al., 2004). Consumers often end up with
“tough, dry and chewy” meat because of incorrect preparation and cooking techniques
(Webb, 2001) and in addition, game meat quality is generally perceived as irregular
(Bronkhorst, 2005).
Sensory analysis is a valuable tool in testing the different characteristics of a product
(Lawless and Heymann, 1998). Moskowitz (1984) stated the following about trained taste

Analytical sensory evaluation of blesbok and springbok
132
panellists: “…experts, by their very nature can better communicate nuances of the products
that might totally escape the consumer”. However, this author cautioned the exclusive use of
analytical sensory panels by stating: ”…consumers represent the target population. If a
consumer does not perceive differences between products where an expert does, this simply
means that the perceived difference do not amount to a relevant distinction.” Analytical
sensory evaluation of products is very important, but there is a difference between the
findings of the trained taste panel and the preferences of the consumer. There is almost no
data available on the sensory analysis of game meat, therefore, the data gathered in this
study, may fill a part of the hole left in the game meat information currently available.
The aim of this study was to investigate the possible improvements to the eating
quality of springbok and blesbok meat after enhancement with an inorganic salt mixture.
Springbok and blesbok were chosen because these are two of the most common game
species favoured by game farmers in South Africa (Conroy and Gaigher, 1982). Springbok
was found to be the game species most often consumed by South African consumers
(Hoffman, Muller, Schutte, Calitz and Crafford, 2005) and springbok was one of the three
game meat species regularly available in South African supermarkets and restaurants
(Hoffman et al., 2004).
2. Materials and Methods 2.1. Animals and sampling
Ten springbok (Antidorcas marsupialis) and ten blesbok (Damaliscus dorcas phillipsi)
were randomly harvested at the Gariep Nature Reserve in the Free State Province. All
animals were male and carcass weight varied between 17.4 kg and 30.4 kg for springbok,
and 16.4 kg and 42.2 kg for blesbok. Animals were harvested at night by a professional cull
team, using similar culling methods to those described by Lewis, Pinchin and Kestin (1997),
and only head or neck shots were taken. Animals were exsanguinated within 5 minutes of
harvesting and together with the culling methods used, this resulted in animals being exposed
to minimal stress conditions. Carcasses were hung by the Achilles tendon. Bled and
eviscerated skin-on carcasses were transported to Stellenbosch, in a temperature-controlled
vehicle, where they were skinned and processed further approximately 24 h after harvesting.
The left halves of the springbok carcasses were injected with an inorganic salt
solution (Freddy Hirsch Tenderbite #802539; P.O. Box 2554, Cape Town, 8000) with a
chemical composition of sodium (5.21%) and potassium (2.53%) di- and triphosphates
(3.45%), lactate (12.40%) and water (75.75%) to give a pumped gain of 20%, with a retention
level of approximately 15%. Injection was performed at a pressure of 2.4 bar at 30 strokes per
minute on a Rühle Curing Centre IR56 (Rühl GmbH, D-79865, Grafenhausen, Germany).
After injection, the right and left side M. biceps femoris and M. longissimus et lumborum of
each springbok carcass were removed. For the blesbok this procedure differed slightly
because the blesbok carcass halves were too large to fit into the curing centre: the M. biceps
femoris and M. longissimus et lumborum of each carcass were removed first and the whole

Analytical sensory evaluation of blesbok and springbok
133
left hand muscles were injected with the same solution in the same manner as the halved
springbok carcasses. Although these game species seldom have any visible fat, all visible
carcass fat and connective tissue were removed from the muscles. The right hand samples
served as the controls. All samples were individually vacuum-packed and frozen at -20 ºC
until analysed further.
2.2. Descriptive sensory analysis
Seven panellists made up the descriptive analytical sensory panel. Five of the seven
panellists had been part of a regular meat analysis group for over two years, while the other
two were fairly new to meat analysis, having only been involved for approximately a month.
The two new panellists were properly screened and tested for their sensitivity in the taste
panel environment before they were included in the taste panel. The panel received two
hours of training on treated (injected) and untreated M. biceps femoris and M. longissimus et
lumborum on the first two days of the tasting programme of each species. Thereafter, a test-
retest-session was held at the first session of the tasting programme to test each panellist’s
sensitivity and repeatability and to confirm that the panel understood the parameters set for
each characteristic tested. There was a rest period of a week after the conclusion of the
springbok tasting programme before the blesbok tasting programme started.
Left and right M. biceps femoris and M. longissimus et lumborum were defrosted at
3ºC for 24 h prior to the sensory evaluation. Whole muscles were roasted in two conventional
electric Defy 835 ovens connected to a computerised electronic temperature control system
(Viljoen, Muller, de Swart, Sadie and Vosloo, 2001) by means of high velocity, forced-air
convection. Samples were placed on foil-wrapped roasting pans inside individual cooking
bags. The American Meat Science Association (AMSA, 1995) recommends that samples be
removed at about 5ºC below the desired internal temperature, which is 71ºC. After removal,
the samples were allowed to cool for 5 minutes before being cut into 2 cm cubes. Cubed
samples were individually wrapped in aluminium foil squares and coded. All surface areas of
the meat exposed to the cooking environment were removed before the samples were cubed.
The samples were reheated at 100ºC 10 minutes prior to the start of evaluation. Panellists were seated in individual cubicles in a temperature-light-controlled room.
Each panellist received crackers, apple slices and distilled water to use as palate cleansers
between samples. For each species, panellists received two sets of four randomised
samples over five days. The basic 8-point hedonic questionnaire ascribed by AMSA (1995)
was used, but was changed slightly to better suit the purpose of the investigation and the
characteristic “salty taste” was added (Table 1). For blesbok evaluation, ‘Springbok’ was just
substituted with ‘Blesbok’.

Analytical sensory evaluation of blesbok and springbok
134
Table 1 Questionnaire used during analytical sensory evaluation of Springbok M. biceps
femoris and M. longissimus et lumborum samples.
Sensory attribute Explanation of attribute Scale used
Springbok aroma
intensity
Take a few short sniffs as soon as you remove
the foil
8 Extremely intense
1 Extremely bland
Initial impression
of juiciness The amount of fluid exuded on the cut surface
when pressed between your thumb and
forefinger
8 Extremely juicy
1 Extremely dry
Sustained
juiciness
The impression that you form after the first two
to three chews between the molar teeth
8 Extremely juicy
1 Extremely dry
First bite
The impression of tenderness after the first two
to three chews between the molar teeth
8 Extremely tender
1 Extremely tough
Residue
The amount of residue left in the mouth after
the first twenty to thirty chews.
8 None
1 Abundant
Overall springbok
flavour
This is a combination of taste and swallowing.
8 Extremely typical
1 Extremely untypical
Salty taste
Taste on the tongue associated with sodium
ions.
8 Extremely salty
1 No salty taste
2.3. Statistical analysis
The standard GLM Procedure was not used when sensory data was analysed
because the data was not normally distributed (SAS, 1999). Large proportions of the
variation in the data could be attributed to panellist and animal effects. Therefore, the Mixed
Procedure (SAS, 1999) was used for data analysis and both judge and animal were included
in the model as random variables, which effectively removed their contributions to total
variation.
3. Results and discussion
For all characteristics analysed, except saltiness, a higher value depicts a better
score. For saltiness the opposite is true, with higher values indicating a saltier taste, which
can be a detrimental factor in overall acceptability of the meat. Overall it was found that
enhancing the meat of both species improved the eating quality of the meat and the quality
characteristics most valued by consumers (tenderness and juiciness) were definitely
improved by enhancement with the inorganic salt solution.
The results of the analytical sensory panels of the springbok M. longissimus et
lumborum (Table 2) indicated significant differences (P<0.05) between treatments for the
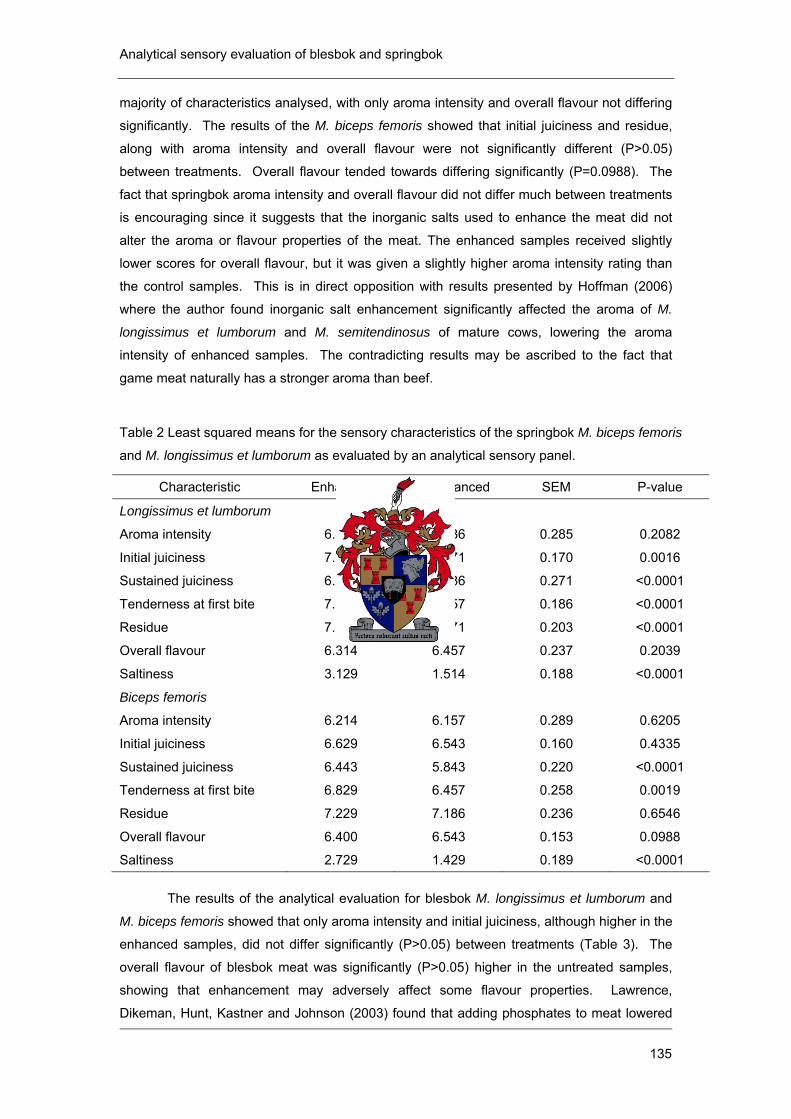
Analytical sensory evaluation of blesbok and springbok
135
majority of characteristics analysed, with only aroma intensity and overall flavour not differing
significantly. The results of the M. biceps femoris showed that initial juiciness and residue,
along with aroma intensity and overall flavour were not significantly different (P>0.05)
between treatments. Overall flavour tended towards differing significantly (P=0.0988). The
fact that springbok aroma intensity and overall flavour did not differ much between treatments
is encouraging since it suggests that the inorganic salts used to enhance the meat did not
alter the aroma or flavour properties of the meat. The enhanced samples received slightly
lower scores for overall flavour, but it was given a slightly higher aroma intensity rating than
the control samples. This is in direct opposition with results presented by Hoffman (2006)
where the author found inorganic salt enhancement significantly affected the aroma of M.
longissimus et lumborum and M. semitendinosus of mature cows, lowering the aroma
intensity of enhanced samples. The contradicting results may be ascribed to the fact that
game meat naturally has a stronger aroma than beef.
Table 2 Least squared means for the sensory characteristics of the springbok M. biceps femoris
and M. longissimus et lumborum as evaluated by an analytical sensory panel.
Characteristic Enhanced Not enhanced SEM P-value
Longissimus et lumborum
Aroma intensity 6.543 6.386 0.285 0.2082
Initial juiciness 7.114 6.771 0.170 0.0016
Sustained juiciness 6.800 5.586 0.271 <0.0001
Tenderness at first bite 7.643 6.857 0.186 <0.0001
Residue 7.729 7.271 0.203 <0.0001
Overall flavour 6.314 6.457 0.237 0.2039
Saltiness 3.129 1.514 0.188 <0.0001
Biceps femoris
Aroma intensity 6.214 6.157 0.289 0.6205
Initial juiciness 6.629 6.543 0.160 0.4335
Sustained juiciness 6.443 5.843 0.220 <0.0001
Tenderness at first bite 6.829 6.457 0.258 0.0019
Residue 7.229 7.186 0.236 0.6546
Overall flavour 6.400 6.543 0.153 0.0988
Saltiness 2.729 1.429 0.189 <0.0001
The results of the analytical evaluation for blesbok M. longissimus et lumborum and
M. biceps femoris showed that only aroma intensity and initial juiciness, although higher in the
enhanced samples, did not differ significantly (P>0.05) between treatments (Table 3). The
overall flavour of blesbok meat was significantly (P>0.05) higher in the untreated samples,
showing that enhancement may adversely affect some flavour properties. Lawrence,
Dikeman, Hunt, Kastner and Johnson (2003) found that adding phosphates to meat lowered

Analytical sensory evaluation of blesbok and springbok
136
the flavour intensity and Scanga, Delmore Jr., Ames, Belk, Tatum and Smith (2000) reported
that calcium chloride- or lactic acid-injection could cause sour and bitter flavours in meat.
Game meat is generally perceived as being less succulent than beef because of its
low fat content (Von la Chevallerie, 1972). Warriss (2000) explained that the water remaining
after cooking is responsible for the juiciness of meat and that lipids have only a small role in
juiciness, mainly acting as lubrication. The highly significant (P<0.0001) differences found for
sustained juiciness for all springbok and blesbok muscles is very encouraging. It shows that
inorganic salt enhancement has the propensity to ensure juicier game meat. Sustained
juiciness refers to the amount of moisture remaining in meat after cooking and is thus more
important than initial juiciness in terms of the overall perception the consumer will form of the
juiciness of the meat. The reason behind the improved juiciness of the enhanced samples lie
in its moisture contents. The moisture contents of the enhanced samples of both muscles
were significantly higher (P>0.01) than the untreated samples in both species (Chapter 4),
with moisture values of 74.75 ± 1.61% vs. 72.16 ± 1.68%, for enhanced vs. untreated M.
longissimus et lumborum; and 75.27 ± 1.15% vs. 74.75 ± 1.61%, for enhanced vs. untreated
M. biceps femoris. Although the differences between treatments in both blesbok muscles
were not significantly different, the moisture values of the enhanced muscles were still higher
than the untreated sample (M. longissimus et lumborum: 74.35 ± 1.41% vs. 73.48 ± 1.30%;
and M. biceps femoris: 76.15 ± 1.21% vs. 75.05 ± 1.86%).
Table 3 Least squared means for the sensory characteristics of the blesbok M. longissimus et
lumborum and M. biceps femoris as evaluated by an analytical sensory panel.
Characteristic Enhanced Not enhanced SEM P-value
Longissimus et lumborum
Aroma intensity 5.843 5.971 0.109 0.2059
Initial juiciness 6.900 6.714 0.201 0.1179
Sustained juiciness 6.943 5.786 0.193 <0.0001
Tenderness at first bite 7.529 6.414 0.188 <0.0001
Residue 7.571 6.786 0.168 <0.0001
Overall flavour 5.914 6.129 0.113 0.0049
Saltiness 2.729 1.286 0.104 <0.0001
Biceps femoris
Aroma intensity 5.929 5.914 0.129 0.8733
Initial juiciness 6.657 6.457 0.193 0.0576
Sustained juiciness 6.600 5.743 0.246 <0.0001
Tenderness at first bite 6.886 6.243 0.235 <0.0001
Residue 7.043 6.543 0.218 <0.0001
Overall flavour 5.871 6.043 0.086 0.0228
Saltiness 2.600 1.143 0.084 <0.0001

Analytical sensory evaluation of blesbok and springbok
137
Improved juiciness because of inorganic salt enhancement of meat has been
reported by several authors (Papadopoulos, Miller, Ringer, and Cross, 1991; Scanga et al.,
2000; Baublits, Pohlman, Brown Jr. and Johnson, 2005). Pork and beef juiciness was
increased when the meat was injected with sodium tripolyphosphate (Smith, Simmons,
McKeith, Betchel and Brady, 1984) and according to Deatherage (1963) sodium phosphate
increases the water holding capacity of meat. Dhanda, Pegg, Janz, Aalhus and Shand (2001,
as cited by Robbins, Jensen, Ryan, Homco-Ryan, McKeith and Brewer, 2003) found bison
steaks injected with sodium tripolyphosphate and sodium chloride to be juicier than untreated
steaks. Phosphate addition improves juiciness due to the added moisture because of the
improved moisture retention due to the increased pH levels caused by the added phosphate
(Prestat, Jensen, McKeith and Brewer, 2002). This reasoning was confirmed by Baublits et
al. (2005) who found that, while untreated samples had larger amounts of free water,
phosphate-treated samples contained a higher level of total moisture due to the increased
water retention caused by phosphate treatment.
Tenderness is the most important eating quality characteristic according to
consumers (Dransfield, Zamora and Bayle, 1998; Pietrasik and Shand, 2004) and because of
its very low fat content, game meat is often perceived as being tougher than other meat,
although Von la Chevallerie (1972) found that Warner-Bratzler shear force values did not
correspond with this perception. In this investigation, tenderness at first bite was significantly
(P<0.05) improved for all treated samples, while residue for all samples except springbok M.
biceps femoris (though the enhanced sample was still rated higher) was also significantly
(P<0.05) improved. During the physical analyses of the springbok and blesbok muscles
(Chapter 3), the Warner-Bratzler shear force values of both muscles in both species showed
highly significant (P<0.0001) treatment differences. The enhanced muscles produced shear
force values much lower than the untreated samples and since lower shear force values
indicate more tender meat, both enhanced muscles of both species were more tender than
the untreated samples. The Warner-Bratzler shear force values (Chapter 4) for the enhanced
and untreated M. longissimus et lumborum were 16.08 vs. 26.60 N/1.27cm Ø (springbok) and
18.86 vs. 41.20 N/1.27cm Ø (blesbok) while that of the M. biceps femoris were 23.32 vs.
32.74 N/1.27cm Ø (springbok) and 25.41 vs. 40.08 N/1.27cm Ø (blesbok). It was therefore
expected that the two sensory tenderness characteristics (tenderness at first bite and residue)
would be better scored in the enhanced samples as opposed to the untreated samples.
Papadopoulos et al. (1991) found improved tenderness when top round roasts were
treated with sodium lactate of up to 2.0%. Sodium phosphates are often used to improve
protein solubility in meat processing (Deatherage, 1963) and several authors have reported
increased tenderness when meat was enhanced with phosphates (Smith et al., 1984; Scanga
et al., 2000; Robbins et al., 2003). Baublits et al. (2005) reported that steaks treated with
sodium hexametaphosphate, sodium tripolyphosphate or tetrasodium pyrophosphate scored
higher in sensory analysis than sodium chloride-treated and untreated steaks, although there
were no differences in Warner-Bratzler shear force values. When freshly slaughtered beef

Analytical sensory evaluation of blesbok and springbok
138
was treated with sodium phosphate, rigor mortis was prevented and increased tenderness
was achieved (Streitel, Ockerman and Cahill, 1977).
The increased saltiness of the enhanced samples is due to the increased levels of
salt directly caused by the addition of the inorganic salt solution. Even though there are
highly significant (P<0.0001) differences between the enhanced and untreated samples, the
sensory panel ranked the saltiness of the enhanced samples as being between 2 (practically
no salt) and 4 (very little salt) on the 8-point hedonic scale. These values are still well within
the acceptability range and will therefore not detract from the overall acceptability of the
enhanced product.
Overall flavour encompasses several other characteristics, such as aroma, mouthfeel
and ease of swallowing, and is therefore a very good measurement of how well all the other
characteristics interact to contribute to a well-rounded, well-liked product. Many of the
substances used in enhancement solutions can have adverse effects on meat flavour. Most
of these adverse flavour-effects can be attributed to the use of calcium salts (Scanga et al.,
2000). Lawrence et al. (2003) reported that phosphate salts tended to lower flavour intensity,
but did not report any other adverse effects associated with phosphates. Although the
characteristics associated most with eating quality (tenderness and juiciness) were improved
by enhancing the meat with an inorganic salt solution, the overall flavour of both muscles of
both species were lower in the enhanced samples (not significant in springbok meat, but
significant in blesbok). In the springbok, the overall flavour of both muscles and both
treatments remained within the 6th scale point, which is “moderately typical” according to the
sensory scale (Table 1) used, and is therefore still very acceptable. For the blesbok the
overall flavour of both untreated muscles fell within the 6th scale point (a low 6), while that of
the enhanced muscles fell within the 5th scale point (a high 5). This means that, while the
enhanced meat flavour is still acceptable, it is closer to the more negatively perceived side of
the scale and may not be liked as much by consumers.
However, acceptability is a composite and complex phenomenon which
encompasses all eating quality aspects of meat, but in which some aspects may rank higher
than others. Tenderness and juiciness are eating quality characteristics which are valued
much more than, for example, aroma intensity or even overall flavour and the former two
characteristics will therefore influence the consumer’s overall acceptability much more than
the latter two characteristics. Overall, the enhanced samples of both species performed
better sensorically than the untreated samples.
4. Conclusion
Enhancing game meat with an inorganic salt solution holds definite benefits for the
consumer as well as the game meat industry. By enhancing the meat, the two qualities most
valued by consumers, i.e. tenderness and juiciness, are significantly increased. The overall
flavour of the enhanced samples was lower and this may lead to consumers not accepting
enhanced meat as well as they would if the overall flavour of enhanced meat was better than

Analytical sensory evaluation of blesbok and springbok
139
the untreated meat. However, the differences were quite small if the sensory scale used to
evaluate the characteristics is considered. No adverse flavour effects were encountered,
which may be attributed to the fact that no calcium-based inorganic salts were used in the
enhancing solution. Since consumers’ overall acceptability of meat is influenced more by the
characteristics more valued by them, in this case tenderness and juiciness, the enhanced
springbok and blesbok meat will in all probability be found to be overall more acceptable to
consumers than the untreated meat samples, although consumer sensory analysis would
have to be performed to verify this.
5. References AMSA (American Meat Science Association). (1995). Research Guidelines for cookery,
sensory evaluation and instrumental tenderness measurements of fresh meat. Chicago:
National Livestock and Meat Board.
Baublits, R.T., Pohlman, F.W., Brown Jr., A.H. & Johnson, Z.B. (2005). Effects of sodium
chloride, phosphate type and concentration, and pump rate on beef biceps femoris quality
and sensory characteristics. Meat Science 70, 205-214.
Bronkhorst, N. (2005). Is koedoe en springbok op jou inkopielys? Landbouweekblad 24
Junie, 67
Chizzolini, R., Zanardi, E., Dorigoni, V. & Ghidini, S. (1999). Calorific value and cholesterol
content of normal and low-fat meat and meat products. Trends in Food Science and
Technology 10, 119-128.
Committee on Medical Aspects of Food Policy (1984). ‘Diet and Cardiovascular Disease.’
Report on Health and social subjects, Department of Health and Social Security, No. 28,
HMSO, London.
Conroy, A.M. & Gaigher, I.G. (1982). Venison, Aquaculture and ostrich meat production:
Action 2003. South African Journal of Animal Science 2, 219-233.
Deatherage, F.E. (1963). The effect of water and inorganic salts on tenderness. In:
Proceedings meat tenderness symposium (pp. 45-68). Camden: Campbell Soup
Company.
Dransfield, E., Zamora, F. & Bayle, M. (1998). Consumer selection of steaks as influenced
by information and price index. Food Quality and Preference 9, 321-326.
Elliot, J. (1993). Farmed Venison, the new meat comes of age. Nutrition and Food Science
4, 26-29.
Higgs, J.D. (2000). The changing nature of red meat: 20 years of improving nutritional
quality. Trends in Food Science and Technology 11, 85-95.
Hoffman, L.C. (2006). Sensory and physical characteristics of enhanced vs. non-enhanced
meat from mature cows. Meat Science 72, 195-202.
Hoffman, L.C. (2000). Meat quality attributes of night-cropped impala (Aepyceros melampus).
SA Journal of Animal Science 30, 133-137.

Analytical sensory evaluation of blesbok and springbok
140
Hoffman, L.C., Muller, M., Schutte, De W., Calitz, F.J. & Crafford, K. (2005). Consumer
expectations, perceptions and purchasing of South African game meat. South African
Journal of Wildlife Research 35, 33-42.
Hoffman, L.C., Muller, M., Schutte, De W. & Crafford, K. (2004). Retail of South African game
meat: current trade and marketing trends. South African Journal of Wildlife Research 34,
123-134.
Kroon, F.E., van Rensburg, W.J.J. & Hofmeyr, H.S. (1972). Seisoenale veranderinge in
chemiese samestelling van volwasse blesbokramme (Damaliscus dorcas phillipsi) van die
Van Riebeeck natuurreservaat. Suid Afrikaanse Tydskrif van Veekunde 2, 41-44.
Lawless, H.T. & Heymann, H. (1998). Sensory evaluation of food: Principles and practices.
New York: Chapman & Hall.
Lawrence, T.E., Dikeman, M.E., Hunt, M.C., Kastner, C.L. & Johnson, D.E. (2003). Staged
injection marination with calcium lactate, phosphate and salt may improve beef water-
binding ability and palatability traits. Meat Science 65, 967-972.
Lewis, A.R., Pinchin, A.M. & Kestin, S.C. (1997). Welfare implications of the night shooting of
wild impala (Aepyceros melampus). Animal Welfare 6, 123-131.
Melanson, K., Gootman, J., Myrdal, A., Kline, G. & Rippe, J. (2003). Weight loss and total
lipid profile changes in overweight women consuming beef or chicken as the primary
protein source. Nutrition 19, 409-414.
Moskowitz, H.R. (1984). Sensory analysis, product modelling and product optimisation. In
G. Charalambous (Ed.). Analysis of foods and beverages. Modern techniques (pp. 13-
67). Orlando: Academic Press Inc.
Papadopoulos, L.S., Miller, R.K., Ringer, L.J. & Cross, H.R. (1991). Sodium lactate effect on
sensory characteristics, cooked meat colour and chemical composition. Journal of Food
Science 56, 621-626.
Pauw, J. (1993). The development of venison marketing. In Forum: The venison industry.
Research requirements and possibilities (pp. 3-5). Meat industry centre, Irene
Agricultural research Council, Pretoria, South Africa.
Pietrasik, Z. & Shand, P.J. (2004). Effect of blade tenderisation and tumbling time on the
processing characteristics and tenderness of injected cooked roast beef. Meat Science
66, 871-879.
Prestat, C., Jensen, J., McKeith, F.K. & Brewer, M.S. (2002). Cooking methods and endpoint
temperature effects on sensory and colour characteristics of pumped pork loin chops.
Meat Science 60, 395-400.
Robbins, K., Jensen, J., Ryan, K.J., Homco-Ryan, C., McKeith, F.K. & Brewer, M.S. (2003).
Consumer attitudes towards beef and acceptability of enhanced beef. Meat Science 65,
721-729.
SAS (1999). SAS/STAT User’s Guide, Version 8 (Volume II). SAS Institute Inc., North
Carolina.

Analytical sensory evaluation of blesbok and springbok
141
Scanga, J.A., Delmore Jr., R.J., Ames, R.P., Belk, K.E., Tatum, J.D. & Smith, G.C. (2000).
Palatability of beef steaks marinated with solutions of calcium chloride, phosphate, and
(or) beef-flavouring. Meat Science 55, 397-401.
Schönfeldt, H. (1993). Nutritional content of venison. In Forum: The venison industry.
Research requirements and possibilities (pp. 51-60). Meat industry centre, Irene
Agricultural research Council, Pretoria, South Africa.
Smith, L.A., Simmons, S.L., McKeith, F.K., Betchel, P.J. and Brady, P.L. (1984). Effects of
sodium tripolyphosphate on physical and sensory properties of beef and pork roasts.
Journal of Food Science 49, pp. 1636-1637.
Streitel, R.H., Ockerman, H.W. & Cahill, V.R. (1977). Maintenance of beef tenderness by
inhibition of rigor mortis. Journal of Food Science 42, 583-585.
Viljoen, J.J. (1999). ‘n Vergelyking van die lipiedkomponente van springbokvleis met die van
beesvleis en die verwante belangrikheid vir aspekte van die menslike gesondheid. SA
Tydskrif vir Natuurwetenskap en Tegnologie 18, 51-53.
Viljoen, D.L., Muller, M., de Swart, J.B., Sadie, A. & Vosloo, M.C. (2001). Computerised
electronic temperature control system for thermal efficiency during baking in food
research. International Journal of Consumer Studies 25, 30-42.
Von la Chevallerie, M. (1972). Meat quality of seven wild ungulate species. South African
Journal of Animal Science 2, 101-103.
Warriss, P.D. (2000). Meat Science: an introductory text. CABI Publishing, Wallingford,
Oxon.
Webb, R. (2001). It’s all in the game. Diabetes Forecast 54, 30-33.

142
Chapter 6 Effect of enhancement with an inorganic salt solution on the eating
quality of blesbok (Damaliscus dorcas phillipsi) and springbok (Antidorcas marsupialis) longissimus et lumborum muscle as shown by
analytical and consumer sensory evaluation Abstract The effects of inorganic salt enhancement on the sensory quality of springbok and blesbok M.
longissimus et lumborum, after cooking in a stock mixture, were investigated. The springbok
(n=5) and blesbok (n=5) originated from the Rustfontein Nature Reserve in the Free State
Province of South Africa. Sensory testing comprised an analytical sensory evaluation by a
panel (n=7) and a consumer sensory evaluation. The sensory characteristics evaluated by the
experienced analytical panel were aroma intensity, initial juiciness, sustained juiciness,
tenderness at first bite, residue, overall flavour and saltiness. Tenderness (tenderness at first
bite and residue) and juiciness (initial and sustained juiciness) were positively influenced by
inorganic salt enhancement for both species. These are the two eating quality characteristics
most valued by consumers. The characteristic ‘salty taste’ had to be added to the list of
attributes evaluated because of the addition of various salts in the enhancement solution.
Although there was a highly significant difference between treatments concerning salty taste,
the enhanced samples were still well within the acceptable range, with values ranging
between 2 (practically no salt) and 4 (very little salt). The consumer panel were asked to do a
likeness test of two springbok and blesbok M. longissimus et lumborum samples differing in
treatment. For both species the consumers liked the enhanced samples significantly more
than the untreated samples. Enhancing game meat holds definite advantages as pertaining
to its eating quality.
Key words: Springbok, Blesbok, Game meat, Meat enhancement, Injected meat, Eating
quality, Sensory characteristics, Tenderness, Juiciness
1. Introduction There has been a definite shift in people’s perception of the healthfulness of food
products. Red meat is associated with obesity and thus many consumers believe that it is
unsuitable for a balanced health-promoting diet (Melanson, Grootman, Myrdal, Kline and
Rippe, 2003). This view has been fuelled by reports that dietary fat and saturated fat intake
were primarily responsible for obesity and therefore it has been recommend that red meat
intake should be limited or completely eliminated. Higgs (2000) stated that consumers
associate meat with cholesterol and because serum cholesterol has been associated with
chronic heart disease, most consumers still link red meat intake with increased cholesterol
consumption and increased heart disease risk despite the fact that scientific evidence

Analytical and consumer sensory evaluation of blesbok and springbok
143
suggests otherwise. Worldwide red meat consumption has declined in favour of “safer” food
sources such as chicken and plant-proteins. Because of their growing health concerns
consumers are demanding food with lower kilojoule, cholesterol and fat contents (MacRae,
O’Reilly and Morgan, 2005). In a survey of 300 South African consumers, Hoffman, Muller,
Schutte and Crafford (2004) found that fat content was the most important quality considered
when purchasing meat. Nutritional guidelines suggests that dietary fat should provide 15-
30% of the total calorie-intake and saturated fats should be limited to less than 10% of the
caloric intake (Chizzolini, Zanardi, Dorigoni and Ghidini, 1999). It is also suggested that
cholesterol-intake should not be in excess of 300mg per day. However, fatty acid
composition, especially the ratio of polyunsaturated to saturated fatty acids, has been shown
to be more important for health reasons than total fat content (Higgs, 2000; Chizzolini et al.,
2003; MacRae et al., 2005).
Several authors have reported that South African game species have fat contents
less than 3.0g/100g (Kroon, van Rensburg and Hofmeyr, 1972, Schönfeldt, 1993; Pauw,
1993; Hoffman, 2000) and Von la Chevallerie (1972) reported the fat content of springbok and
blesbok to be 1.7g/100g. Furthermore, game meat has higher levels of polyunsaturated fatty
acids and lower saturated fat contents than beef (Schönfeldt, 1993; Viljoen, 1999; Hoffman,
2000). Game meat can thus be considered a healthier red meat because of its low fat and
cholesterol and its beneficial fatty acid composition.
The image of game meat has suffered in the past because consumers are ill informed
about the potential health benefits of game meat and proper preparation methods (Webb,
2001; Hoffman et al., 2004). Consumers often erroneously assume that game meat is “tough,
dry and chewy”, states Webb (2001) but the author chalks this up to incorrect preparation and
cooking techniques. Bronkhorst (2005) reported that consumers often perceive game meat
quality as unpredictable.
Animal welfare, along with animal and product safety and environmentally friendly
production, have become hot topics with consumers in the past few years, mainly because of
a growing concern for health, safety and ethics encouraged further by several concerned
groups and the media (Bernues, Olaizola and Corcoran, 2003b). BSE, antibiotics, hormones
and fat and cholesterol content were found to be the issues that meat consumers were mostly
concerned about (Verbeke and Vackier, 2004). European beef and lamb consumers listed
animal feeding, origin of meat, environmentally friendly production and animal welfare as the
most important non-physical factors associated with meat (Bernues, Olaizola and Corcoran,
2003a). Issanchou (1996) reported that consumers would lower their meat consumption if
they were convinced that animal welfare and animal treatment in the meat production system
is not as good as it should be. In the research of McCarthy, de Boer, O’Reilly and Cotter
(2003) European consumers also associated conventional farming systems with
environmental damage and negligent treatment of animals. Hoffman, Muller, Schutte, Calitz
and Crafford (2005) found consumers had less of a problem with consuming game meat if
they knew that the animals were harvested in a humane manner.

Analytical and consumer sensory evaluation of blesbok and springbok
144
In this regard game meat is the ideal red meat source for even the most concerned
consumer since it can be viewed as a wholesome, untainted product. Game animals contain
no added antibiotics, growth hormones or other chemicals readily used in conventional
farming systems. South African game animals are generally farmed in extensive free range,
farming systems with minimal contact with humans and therefore game meat can be
considered an organic, or natural, product (Pauw, 1993; Hoffman and Bigalke, 1999, Jansen
van Rensburg, 2001).
The aim of this study was to investigate the possible improvements to the eating
quality of springbok and blesbok meat after enhancement with an inorganic salt mixture and
to test consumers’ reaction towards enhanced game meat. Two types of sensory testing,
analytical and consumer taste panels, were used to determine how enhanced game meat
would be influenced by ‘regular’ cooking methods as opposed to strict laboratory conditions
where no extra ingredients are added to the meat. In general, there has been very little
sensory research done on game meat, with more analytical evaluations have been performed
than consumer evaluations (Chapter 5). Springbok and blesbok were chosen because these
are two of the most common game species favoured by game farmers in South Africa
(Conroy and Gaigher, 1982). Springbok was found to be the game species most often
consumed by South African consumers (Hoffman et al., 2005) and one of the three game
meat species regularly available in South African supermarkets, butcheries and restaurants
(Hoffman et al., 2004).
2. Materials and Methods 2.1. Animals
Five Blesbok (Damaliscus dorcas phillipsi) and five Springbok (Antidorcas
marsupialis) were randomly harvested at the Rustfontein Nature Reserve in the Free State
Province. Although the animals were all male, they differed in weight within species, with
blesbok carcass weight varying between 30.7 kg and 36.9 kg and springbok carcass weight
varying between 15.5 kg and 22.9 kg. Animals were harvested at night by a professional cull
team, using similar culling methods to those described by Lewis, Pinchin and Kestin (1997),
and only head or neck shots were taken. This resulted in animals experiencing minimum
stress conditions. Animals were exsanguinated within 5 minutes of harvesting and hung by
the Achilles tendon. Bled and eviscerated carcasses, but still with the skin on, were
transported to Stellenbosch, in a temperature-controlled vehicle, where they were skinned
and processed further approximately 24 h after harvesting.
The right and left hand side M. longissimus et lumborum of each carcass was
removed, trimmed of any carcass connective tissue and fat, although these game species
seldom have any visible fat, and the left side samples were injected with an inorganic salt
solution (Freddy Hirsch Tenderbite #802539; P.O. Box 2554, Cape Town, 8000) containing
sodium (5.21%) and potassium (2.53%) di- and triphosphates (3.45%), lactate (12.40%) and
water (75.75%) to give a pumped gain of 20%, with a retention level of approximately 15%.

Analytical and consumer sensory evaluation of blesbok and springbok
145
Injection was performed at a pressure of 2.4 bar at 30 strokes per minute on a Rühle Curing
Centre IR56 (Rühl GmbH, D-79865, Grafenhausen, Germany). Samples were individually
vacuum packed and frozen at -20 ºC. 2.2. Analytical sensory analysis
The analytical sensory panel consisted of seven panellists of who five had been part
of a regular meat analysis group for over two years, while the other two were fairly new to
meat analysis, having only been involved for approximately two months prior to their inclusion
in the meat tasting programme. This panel received only one hour of training on treated and
untreated blesbok and springbok meat the day before the actual analysis because they all
had been tasting blesbok and springbok meat for two months prior to this specific session and
had received rigorous training on both species during those two months. Still, all seven
characteristics evaluated were thoroughly discussed.
Left and right M. longissimus et lumborum of blesbok and springbok were defrosted
at 3 ºC for 24 h prior to the sensory evaluation. Muscles were cooked in a stock mixture
(Table 1) at 160ºC in a Hobart combi steamer to an internal temperature of 66ºC. The
American Meat Science Association (AMSA, 1995) recommends that samples be removed at
about 5ºC below the desired internal temperature, which is 71ºC. After removal, the samples
were allowed to cool for 1 hour before being cut into 2 cm cubes. Cubed samples were
individually wrapped in aluminium foil squares and coded. All surface areas of the meat
exposed to the cooking environment were removed before the samples were cubed. The
samples were reheated at 100ºC 15 minutes prior to the start of evaluation.
Table 1 Ingredients comprising the stock mixture used to prepare blesbok and springbok M.
longissimus et lumborum for analytical and consumer sensory analysis.
Treated samples Untreated samples
Ingredients Mass (g) per 500 g meat Mass (g) per 500 g meat
Carrots (sliced) 120 120
Onions (sliced) 75 75
Celery (chopped) 30 30
Water 150 150
Salt 0.00 1.00
Pepper 0.50 0.50
Bay leaves 1.00 1.00
Panellists were seated in individual cubicles in a temperature-light-controlled room.
Each panellist received crackers, apple slices and distilled water to use as palate cleansers
between samples. Panellists received four randomised samples over five sessions with a 20-
minute break between sessions three and four. The basic 8-point hedonic questionnaire
ascribed by AMSA (1995) was used, but was changed slightly to better suit the purpose of the

Analytical and consumer sensory evaluation of blesbok and springbok
146
investigation and the characteristic “salty taste” was added (Table 2). This was the same
questionnaire used in all previous blesbok and springbok evaluations, except that it referred
to the generic term “Game” as panellists were evaluating blesbok and springbok samples
consecutively.
Table 2 Questionnaire used during analytical sensory evaluation of Blesbok and Springbok M.
longissimus et lumborum muscle samples.
Sensory attribute Explanation of attribute Scale used
Game aroma
intensity
Take a few short sniffs as soon as you remove
the foil
8 Extremely intense
1 Extremely bland
Initial impression
of juiciness
The amount of fluid exuded on the cut surface
when pressed between your thumb and
forefinger
8 Extremely juicy
1 Extremely dry
Sustained
juiciness
The impression that you form after the first two
to three chews between the molar teeth
8 Extremely juicy
1 Extremely dry
First bite
The impression of tenderness after the first two
to three chews between the molar teeth
8 Extremely tender
1 Extremely tough
Residue
The amount of residue left in the mouth after
the first twenty to thirty chews.
8 None
1 Abundant
Overall game
flavour
This is a combination of taste and swallowing.
8 Extremely typical
1 Extremely untypical
Salty taste
Taste on the tongue associated with sodium
ions.
8 Extremely salty
1 No salty taste
2.3. Consumer sensory analysis
Consumers were asked to rate their likeness of four game meat samples. Of the
91(all regular meat consumers) people participating in the consumer sensory analysis, the
majority were students and employees of Stellenbosch University. Since the analysis venue
was on campus, it was much easier to get students and university employees to commit to a
tasting session than non-university consumers. Participants were asked to supply their
demographic detail on age (18-24; 25-34; 35-44; 45-54, and 55+), game meat consumption
(more than once a week; once a week; once a month; less than once a month, and never)
and gender. Nearly twice as many participants were female (n=56) than male (n=35) and
about two thirds were between the ages of 18 and 24 (n=60). Most consumers consumed
game meat less than once a month (n=48), with the second largest consumption group being
consumers who enjoyed game meat at least once a month (n=29).

Analytical and consumer sensory evaluation of blesbok and springbok
147
Every participant was thoroughly instructed on tasting and scoring procedure by
assistants and were encouraged to ask for help if needed, with the assistants being close by
at all times. When questionnaires were handed back, it was checked to assure that all boxes
were filled out (demographic detail and liking scores) to ensure that as much information as
possible were gathered.
Exactly the same muscles (blesbok and springbok M. longissimus et lumborum) were
used during the consumer analysis part of the study and sample preparation is therefore
exactly the same as described for the analytical sensory analysis.
Every consumer received four samples, two treatment samples from a particular
blesbok (e.g. left and right M. longissimus et lumborum sample from animal 1) and a
particular springbok so as to minimise inter-animal variation. The two samples from the same
species were always located right next to each other so consumers would evaluate treatment
differences within species rather than species differences. Samples were still coded with
random three digit codes and species placement on the questionnaires were randomised
between consumers. Each consumer sat alone at a table and received distilled water as a
palate cleanser. A 9-point likeness scale was used on the questionnaire and consumers were
asked only to rate their likeness of a particular sample, no validation or comments were
asked. The nine scale points used were: Like extremely; Like very much; Like moderately;
Like slightly; Neither like nor dislike; Dislike slightly; Dislike moderately; Dislike very much;
and, Dislike extremely. According to Lawless and Heymann (1998) the 9-point hedonic scale
has ruler-like properties (psychologically) because of the equal interval spacing of the words
chosen to represent each point and this will allow sensory scientists to assign numerical
values to the consumers’ choices.
2.4. Statistical analysis
In both analytical and consumer sensory data analyses, the standard GLM Procedure
was not used (SAS, 1999). The data was not normally distributed and large proportions of
the variation in the data could be attributed to judge (panellist or consumer) and animal
effects. Therefore, the Mixed Procedure was used for data analysis and both judge and
animal were included in the model as random variables, which effectively removed their
contributions to total variation (SAS, 1999). In the consumer sensory study, the main effect
studied was the possible differences in likeness between the two muscle treatments in both
species, which is why only this effect was statistically analysed, though demographic detail
was collected and may be used in future correlate these detail with the sensory results
attained.
3. Results and discussion
3.1 Analytical sensory analysis
The characteristics analysed by the analytical panel were the same characteristics
commonly referred to by the standard hedonic questionnaire for meat given by AMSA (1995),

Analytical and consumer sensory evaluation of blesbok and springbok
148
with the addition of salty taste (Table 2). The analytical panel found that treatments differed
significantly for most of the attributes analysed in both blesbok and springbok M. longissimus
et lumborum (Table 3). Generally the inorganic salt-treated samples scored higher than the
untreated samples (higher scores indicate better performance for an attribute, except in the
case of salty taste where a higher score actually indicates a more negative performance,
since 1 = No salty taste, while 8 = Extremely salty taste).
Table 3 Least squared means of the analytical sensory analyses of blesbok and springbok M. longissimus et
lumborum differing in treatment.
Blesbok Springbok
Sensory attribute Treated Untreated SEM P-value Treated Untreated SEM P-value
Aroma intensity 6.200 6.171 0.207 0.8279 5.743 5.800 0.159 0.7141
Initial juiciness 6.829 6.600 0.303 0.0894 6.371 5.971 0.246 0.0083
Sustained juiciness 6.171 5.686 0.438 0.0042 5.829 5.171 0.318 0.0002
Tenderness 7.229 6.543 0.278 0.0004 7.114 6.429 0.196 <0.0001
Residue 7.457 6.886 0.191 <0.0001 7.371 6.943 0.126 0.0038
Flavour 6.286 6.114 0.158 0.2173 5.971 5.857 0.198 0.2334
Salty taste 3.571 2.743 0.571 <0.0001 3.629 2.829 0.424 <0.0001
Aroma intensity did not differ between treatments for either blesbok or springbok
samples. Since sulphur-containing compounds, present at fairly low levels in meat, chiefly
causes meat aroma (Mottram, 1998) and species-specific aromas are related to the fat
composition of the meat and since neither one is influenced by any of the inorganic salts
added when the meat is enhanced, it is fairly reasonable to expect that there will be no
differences in the aroma of enhanced vs. untreated samples.
The initial impression of juiciness of blesbok M. longissimus et lumborum tended to
differ significantly (P=0.089) between treatments, while the initial juiciness of springbok
samples differed significantly (P=0.008). Sustained juiciness was much higher (P<0.01) in
the treated samples from both species. Consumers consider juiciness an important attribute
in meat eating quality (Dransfield, Zamora and Bayle, 1998; Lawrie, 1998; Pietrasik and
Shand, 2004). In sensory analysis on venison, Forss, Manley, Platt and Moore (1979)
reported that all samples tested, tended to be dry. The springbok meat analysed by Jansen
van Rensburg (1997) was reported to be dry. Hoffman (2001) suggested that the reason
South African game meat is frequently perceived as dry is due to animals experiencing stress
during harvesting because of improper harvesting and handling procedures. The fact that
enhancing meat with an inorganic salt solution improves juiciness may have very positive
consequences for the game meat industry.
There have been several reports of the improvement of juiciness by means of
inorganic salt enhancement of meat (Papadopoulos, Miller, Ringer, and Cross, 1991; Scanga,
Delmore Jr., Ames, Belk, Tatum and Smith, 2000; Baublits, Pohlman, Brown Jr. and Johnson,
2005). Sodium tripolyphosphate injections increased pork and beef juiciness (Smith,

Analytical and consumer sensory evaluation of blesbok and springbok
149
Simmons, McKeith, Betchel and Brady, 1984). According to Deatherage (1963) sodium
phosphate increased the water holding capacity of meat. Dhanda, Pegg, Janz, Aalhus and
Shand (2001, as cited by Robbins, Jensen, Ryan, Homco-Ryan, McKeith and Brewer, 2003)
found bison steaks injected with sodium tripolyphosphate and sodium chloride to be juicier
than untreated steaks. Prestat, Jensen, McKeith and Brewer (2002) reported that phosphate
addition improved juiciness due to the added moisture as well as the improved moisture
retention because of the increased pH levels caused by the added phosphate. Baublits et al.
(2005) confirmed the findings of Prestat et al. (2002) when they found that phosphate-treated
samples contained a higher level of total moisture due to the increased water retention
caused by phosphate treatment, while untreated samples had larger amounts of free water. Game meat is often perceived as being tougher than other meat because of its very
low fat content. However, Von la Chevallerie (1972) found that Warner-Bratzler shear force
values did not correspond with this perception. Tenderness was shown to be the eating
quality characteristic most revered by consumers (Dransfield et al., 1998; Pietrasik and
Shand, 2004) and influences consumer purchase behaviour tremendously (Dransfield et al.,
1998). Consumers would choose to buy a steak that is known to be more tender even if it is
the most expensive steak on offer. The results from this study show that the improvement in
tenderness at first bite caused by enhancing the meat was highly significant, with P=0.0004
and P<0.0001, for blesbok and springbok muscles respectively. There was a significant
improvement in the residue of the enhanced samples. A high rating for residue points to meat
that is more tender, since higher residue ratings means that there is smaller amounts of
residue remaining in the mouth after the designated amount of chewing has been completed.
The improved tenderness ratings of enhanced samples can be explained by the addition of
certain chemical compounds present in the enhancement solution.
Papadopoulos et al. (1991) found improved tenderness in top round roasts after
treatment with sodium lactate of up to 2.0%. Several authors have reported increased
tenderness when meat was enhanced with phosphates (Smith et al., 1984; Scanga et al.,
2000; Robbins et al., 2003). Sodium phosphates are often used to improve protein solubility
in meat processing (Deatherage, 1963). Baublits et al. (2005) reported that steaks treated
with sodium hexametaphosphate, sodium tripolyphosphate or tetrasodium pyrophosphate
scored higher in sensory analysis than sodium chloride-treated and untreated steaks although
there were no differences in Warner-Bratzler shear force values. Rigor mortis was prevented
and increased tenderness was achieved when freshly slaughtered beef was treated with
sodium phosphate (Streitel, Ockerman and Cahill, 1977). In this study, tenderness at first bite
and residue were both rated particularly high in the treated samples of both species. Upon
consumption, treated meat will most likely be perceived as more tender than untreated meat
samples.
Although the treated samples had a significantly higher (P<0.0001) salty taste than
untreated samples, it was still very acceptable as far as eating quality is concerned. The fact
that treated samples was saltier than untreated samples can be ascribed to the inorganic salt

Analytical and consumer sensory evaluation of blesbok and springbok
150
content of the treatment mixture injected into treated samples. During the preparation of the
meat samples, no additional salt was added to the enhanced samples because it was already
found to be saltier than the untreated samples (Chapter 5) and consumers discriminating
against the enhanced samples purely because of a saltier taste had to be prevented.
However, adding too much salt to the untreated meat may also cause a partiality to arise and
therefore only 1.00 g salt was added to 500 g meat. Since the salt was added to the stock
mixture (for untreated meat) and not injected directly into the muscle (as in the case of the
enhanced samples), the salt only penetrated the surface of the untreated meat and thus, the
enhanced samples were still perceived as saltier than the untreated samples.
Overall flavour is the impression that is created by the accumulation of different
eating quality characteristics during consumption. Overall flavour did not differ between
treatments in either species, which shows that inorganic salt treatment of meat does not
change aroma and flavour properties. It is important for the overall flavour to remain the
same regardless of the treatment.
In the end, however, it is not the acceptability of single characteristics that will
determine a consumer’s future purchasing behaviour, but the overall acceptability of the
product, which is mostly influenced by the quality characteristics most valued by the
consumer.
3.2 Consumer sensory analysis
The purpose of a consumer sensory evaluation is to establish consumer reaction to a
product or specific treatment (de Kock, 1993). In this study it was imperative to know whether
or not the enhancement of game meat would influence consumer perception and choice.
Consumers were asked to rate their likeness of a particular sample on a 9-point likeness
scale, where 1=Dislike extremely and 9=Like extremely. Consumers continuously rated the
enhanced samples significantly higher (P<0.05) than the untreated samples, which meant that
they liked the enhanced samples better than the untreated samples (Table 4).
Table 4 Consumer sensory analysis of inorganic salt-enhanced vs. untreated blesbok and
springbok M. longissimus et lumborum.
Species Enhanced Untreated SEM P-value
Blesbok 6.562 5.936 0.178 0.0107
Springbok 7.023 6.276 0.167 0.0011
Consumers were not asked for comments or to validate their choices in any way – the
choices they made were, therefore, made mostly on the inherent eating quality characteristics
of the game meat. Consumer evaluation mainly focuses on the overall impression created
on consumption of the product and cannot be used in the evaluation of individual
characteristics of a product. Data from analytical analyses can be correlated to consumer
Analytical and consumer sensory evaluation of blesbok and springbok
151
opinions, but discrepancies in the accuracy of the regression of consumer acceptance against
descriptively analysed attributes often occur (Lawless, 1995).
Even though the analytical data cannot be accurately correlated with the consumer
findings, it can, however, be postulated that the reason why consumers preferred the
enhanced game meat to the untreated samples has a lot to do with the improved tenderness
and juiciness as found by the analytical sensory panel. As previously stated, consumers
value tenderness and juiciness very highly (Dransfield et al., 1998) and with the improved
tenderness and juiciness of the enhanced samples, the overall acceptability also increased.
4. Conclusion Enhancing game meat with an inorganic salt solution holds definite benefits for the
consumer as well as the game meat industry. By enhancing the meat, the two qualities most
valued by consumers, tenderness and juiciness, are significantly increased as was shown by
the analytical sensory analysis. The acceptance of the enhanced meat was significantly
improved as was clearly shown by consumers preferring enhanced game meat to untreated
samples. By using enhancement as a processing method, the game meat industry may
benefit tremendously. No adverse effects on meat eating quality characteristics were
encountered, which may be attributed to the fact that no calcium salts were used in the
enhancement solution as calcium salts may cause unacceptable flavour effects.
5. References AMSA (American Meat Science Association). (1995). Research Guidelines for cookery,
sensory evaluation and instrumental tenderness measurements of fresh meat. Chicago:
National Livestock and Meat Board.
Baublits, R.T., Pohlman, F.W., Brown Jr., A.H. & Johnson, Z.B. (2005). Effects of sodium
chloride, phosphate type and concentration, and pump rate on beef biceps femoris quality
and sensory characteristics. Meat Science 70, 205-214.
Bernues, A., Olaizola, A. & Corcoran, K. (2003a). Extrinsic attributes of red meat as
indicators of quality in Europe: an application for market segmentation. Food Quality and
Preference 14, 265-276.
Bernues, A., Olaizola, A. & Corcoran, K. (2003b). Labelling information demanded by
European consumers and relationships with purchasing motives, quality and safety of
meat. Meat Science 65, 1095-1106.
Bronkhorst, N. (2005). Is koedoe en springbok op jou inkopielys? Landbouweekblad 24
Junie, 67
Chizzolini, R., Zanardi, E., Dorigoni, V. & Ghidini, S. (1999). Calorific value and cholesterol
content of normal and low-fat meat and meat products. Trends in Food Science and
Technology 10, 119-128.
Conroy, A.M. & Gaigher, I.G. (1982). Venison, Aquaculture and ostrich meat production:
Action 2003. South African Journal of Animal Science 2, 219-233.

Analytical and consumer sensory evaluation of blesbok and springbok
152
Deatherage, F.E. (1963). The effect of water and inorganic salts on tenderness. In
Proceedings meat tenderness symposium (pp. 45-68). Camden: Campbell Soup
Company.
De Kock, R. (1993). Consumer sensory evaluation. In Forum: The venison industry.
Research requirements and possibilities (pp. 61-64). Meat industry centre, Irene
Agricultural research Council, Pretoria, South Africa.
Dransfield, E., Zamora, F. & Bayle, M. (1998). Consumer selection of steaks as influenced
by information and price index. Food Quality and Preference 9, 321- 326.
Forss, D.A., Manley, T.R., Platt, M.P. & Moore, V.J. (1979). Palatability of venison from
farmed and feral red deer. Journal of the Science of Food and Agriculture 30, 932-935.
Higgs, J.D. (2000). The changing nature of red meat: 20 years of improving nutritional
quality. Trends in Food Science & Technology 11, 85-95.
Hoffman, L.C. (2001). The effect of different culling methodologies on the physical meat
quality attributes of various game species. In H. Ebedes, B. Reilly, W. van Hoven & B.
Penzhorn (Ed.). Sustainable utilisation - conservation in practice. Proceedings of the 5th
International Wildlife Ranching Symposium.
Hoffman, L.C. (2000). Meat quality attributes of night-cropped impala (Aepyceros melampus).
SA Journal of Animal Science 30, 133-137.
Hoffman, L.C. & Bigalke, R.C. (1999). Utilizing wild ungulates from southern Africa for meat
production: Potential research requirements for the new millennium. Congress of the
Wildlife Management Association of SA. George, pp. 1-14.
Hoffman, L.C., Muller, M., Schutte, De W., Calitz, F.J. & Crafford, K. (2005). Consumer
expectations, perceptions and purchasing of South African game meat. South African
Journal of Wildlife Research 35, 33-42.
Hoffman, L.C., Muller, M., Schutte, De W. & Crafford, K. (2004). Retail of South African game
meat: current trade and marketing trends. South African Journal of Wildlife Research 34,
123-134.
Issanchou, S. (1996). Consumer expectations and perceptions of meat and meat product
quality. Meat Science 43, S5-S19.
Jansen van Rensburg, D.M. (2001). Venison as health food. In H. Ebedes, B. Reilly, W. van
Hoven & B. Penzhorn (Ed.). Sustainable utilisation - conservation in practice.
Proceedings of the 5th International Wildlife Ranching Symposium (pp. 196-198).
Jansen van Rensburg, D.M. (1997). The physical, chemical and sensory quality
characteristics of Springbok (Antidorcas marsupialis marsupialis) meat. D. Tech. (Food
and Nutrition). Department of Food and Nutrition. Technikon Pretoria, Pretoria.
Kroon, F.E., van Rensburg, W.J.J. & Hofmeyr, H.S. (1972). Seisoenale veranderinge in
chemiese samestelling van volwasse blesbokramme (Damaliscus dorcas phillipsi) van die
Van Riebeeck natuurreservaat. Suid Afrikaanse Tydskrif van Veekunde 2, 41-44.
Lawless, H. (1995). Dimensions of sensory quality: a critique. Food Quality and Preference
6, 191-199.

Analytical and consumer sensory evaluation of blesbok and springbok
153
Lawless, H.T. & Heymann, H. (1998). Sensory evaluation of food: principles and practices.
Gaithersburg, MD, USA:Aspen Publishers.
Lawrie, R.A. (1998). Lawrie’s Meat Science (6th ed.). Cambridge, England: Woodhead
Publishing Ltd.
Lewis, A.R., Pinchin, A.M. & Kestin, S.C. (1997). Welfare implications of the night shooting of
wild impala (Aepyceros melampus). Animal Welfare 6, 123-131.
MacRae, J., O’Reilly, L. & Morgan, P. (2005). Desirable characteristics of animal products
from a human health perspective. Livestock Production Science, 94, 95-103.
McCarthy, M., de Boer, M., O’Reilly, S. & Cotter, L. (2003). Factors influencing intention to
purchase beef in the Irish market. Meat Science 65, 1071-1083.
Melanson, K., Gootman, J., Myrdal, A., Kline, G. & Rippe, J. (2003). Weight loss and total
lipid profile changes in overweight women consuming beef or chicken as the primary
protein source. Nutrition 19, 409-414. Mottram, D.S. (1998). Flavour of muscle foods - an overview. In F. Shahidi (Ed.). Flavour of
meat, meat products and seafoods (pp. 5-24). London: Blackie Academic and
Professional.
Papadopoulos, L.S., Miller, R.K., Ringer, L.J. & Cross, H.R. (1991). Sodium lactate effect on
sensory characteristics, cooked meat colour and chemical composition. Journal of Food
Science 56, 621-626.
Pauw, J. (1993). The development of venison marketing. In Forum: The venison industry.
Research requirements and possibilities (pp. 3-5). Meat industry centre, Irene
Agricultural research Council, Pretoria, South Africa.
Pietrasik, Z. & Shand, P.J. (2004). Effect of blade tenderisation and tumbling time on the
processing characteristics and tenderness of injected cooked roast beef. Meat Science
66, 871-879.
Prestat, C., Jensen, J., McKeith, F.K. & Brewer, M.S. (2002). Cooking methods and endpoint
temperature effects on sensory and colour characteristics of pumped pork loin chops.
Meat Science 60, 395 - 400.
Robbins, K., Jensen, J., Ryan, K.J., Homco-Ryan, C., McKeith, F.K. & Brewer,M.S. (2003).
Consumer attitudes towards beef and acceptability of enhanced beef. Meat Science 65,
721-729.
SAS (1999). SAS/STAT User’s Guide, Version 8 (Volume II). SAS Institute Inc., North
Carolina.
Scanga, J.A., Delmore Jr., R.J., Ames, R.P., Belk, K.E., Tatum, J.D. & Smith, G.C. (2000).
Palatability of beefsteaks marinated with solutions of calcium chloride, phosphate, and
(or) beef flavouring. Meat Science 55, 397-401.
Schönfeldt, H. (1993). Nutritional content of venison. In Forum: The venison industry.
Research requirements and possibilities (pp. 51-60). Meat industry centre, Irene
Agricultural research Council, Pretoria, South Africa.

Analytical and consumer sensory evaluation of blesbok and springbok
154
Smith, L.A., Simmons, S.L., McKeith, F.K., Betchel, P.J. and Brady, P.L. (1984). Effects of
sodium tripolyphosphate on physical and sensory properties of beef and pork roasts.
Journal of Food Science 49, pp. 1636-1637.
Streitel, R.H., Ockerman, H.W. & Cahill, V.R. (1977). Maintenance of beef tenderness by
inhibition of rigor mortis. Journal of Food Science 42, 583-585.
Verbeke, W. & Vackier, I. (2004). Profile and effects of consumer involvement in fresh meat.
Meat Science 67, 159-168.
Viljoen, J.J. (1999). ‘n Vergelyking van die lipiedkomponente van springbokvleis met die van
beesvleis en die verwante belangrikheid vir aspekte van die menslike gesondheid. SA
Tydskrif vir Natuurwetenskap en Tegnologie 18, 51-53.
Von la Chevallerie, M. (1972). Meat quality of seven wild ungulate species. South African
Journal of Animal Science 2, 101-103.
Webb, R. (2001). It’s all in the game. Diabetes Forecast 54, 30-33.

155
Conclusion
In South Africa, game meat from wild ungulates is still considered as novel meat. Most
tourists view it as a truly African delicacy, while most South African consumers have
conflicting thoughts on game meat – most think it too expensive and others have only
experienced it as meat with a dubious quality, often being dry and tough. However, game
meat does not necessarily have to be tough and dry every time, depending on harvesting and
preparation methods, game meat has the ability to be just as tender and juicy as any red
meat. A unifying corporate body or institution, laying down regulations as to the proper
harvesting and pre-slaughter handling procedures, may be able to make game meat quality
more uniform and more acceptable to the consumer.
This study has highlighted differences in five muscles (M. biceps femoris, M. longissimus et
lumborum, M. rectus femoris, M. semitendinosus and M. supraspinatus), of both blesbok and
springbok, as pertaining to the physical (cooking loss, drip loss, tenderness and colour), as
well as the chemical (moisture, ash, fat, protein, mineral composition and fatty acid
composition) characteristics of meat. It was found that there were definite differences
amongst muscles for most of these characteristics.
There is no information available on game muscles, except for the M. longissimus dorsi that is
usually used in research studies. This study, therefore, may be able to fill some of the void
that is presently found available in game meat information.
Furthermore, the aim was to make game meat even more acceptable and preferable by trying
to improve its tenderness and juiciness by injecting an inorganic salt solution into the meat.
This proved to be a very successful method of improving most of the eating quality
characteristics of the meat, as was shown by the analytical and consumer sensory analyses
performed on the M. biceps femoris and M. longissimus et lumborum of both springbok and
blesbok.
Enhancing game meat with inorganic salts proved to improve the two quality characteristics
most valued by consumers, i.e. tenderness and juiciness. This was also shown by the
physical analyses, where the Warner-Bratzler shear force values of enhanced muscles were
much lower (therefore more tender) than the untreated muscles. The chemical analyses
showed that the moisture content of the enhanced samples were higher than that of the
untreated samples. The only characteristic that may have a less positive effect on the overall
acceptability of the enhanced meat was its salty taste – the enhanced samples had a slightly
higher salty taste than untreated samples, but were still found to be very acceptable.

Conclusion
156
Consumers chose the enhanced game meat samples over the untreated samples of both
springbok and blesbok, which shows that the overall acceptability of enhanced game meat
was improved. This can probably be attributed to an improvement in the tenderness and
juiciness of the enhanced meat, for these two characteristics are most valued by consumers
and would therefore influence the overall acceptability of the product more.
Game meat should be more actively promoted as a healthy red meat, since it has a very low
fat content and a very beneficial fatty acid profile. More information about the good qualities,
as well as the correct preparation techniques should be provided to consumers. This should
make consumers aware of the excellent benefits that game meat holds for human health and
should definitely further the cause of South African game meat.