improving the quality and safety of patient care · hygiene says a lot about our overall attention...
TRANSCRIPT

Pediatrics Grand Rounds
23 March 2012
University of Texas Health Science
Center at San Antonio
1
archildrens.org uams.edu arpediatrics.org archildrens.org uams.edu arpediatrics.org
Improving the Quality and Safety of Improving the Quality and Safety of Patient CarePatient Care
Lessons Learned from Hand HygieneLessons Learned from Hand Hygiene
W. Matthew Linam, MD, MS
archildrens.org uams.edu arpediatrics.org archildrens.org uams.edu arpediatrics.org
DisclosuresDisclosures
• I have nothing to disclose.
archildrens.org uams.edu arpediatrics.org archildrens.org uams.edu arpediatrics.org
ObjectivesObjectives
• Understand the basic components of the Model for Improvement
• Effectively use data to guide the improvement process
• Be able to design and run test a change
• List the steps needed to sustain improvement
archildrens.org uams.edu arpediatrics.org archildrens.org uams.edu arpediatrics.org
WHY DO WE NEED TO IMPROVE?WHY DO WE NEED TO IMPROVE?
archildrens.org uams.edu arpediatrics.org archildrens.org uams.edu arpediatrics.org
Medical ErrorsMedical Errors
Mortality • 44,000-98,000 Americans die each year from medical errors
(1999 est.)
Prevalence • 2.9%-3.7% hospitalized patients have an adverse event
(annual estimates) • Adverse drug reactions occur during 2.0%-6.7% of hospital
admissions (annual estimates)
Cost • Cost attributable to medical errors (2008 est.) is $19.5 billion • Total cost per error (2008 est.) is $13,000 • Annual cost attributable to surgical errors (2008 est.) is $1.5 billion
Institute of Medicine Committee on the Quality of Health Care in America . To Err is Human: Building a Safer Health System. November 1999.
Pediatrics Grand Rounds
23 March 2012
University of Texas Health Science
Center at San Antonio
2
archildrens.org uams.edu arpediatrics.org archildrens.org uams.edu arpediatrics.org
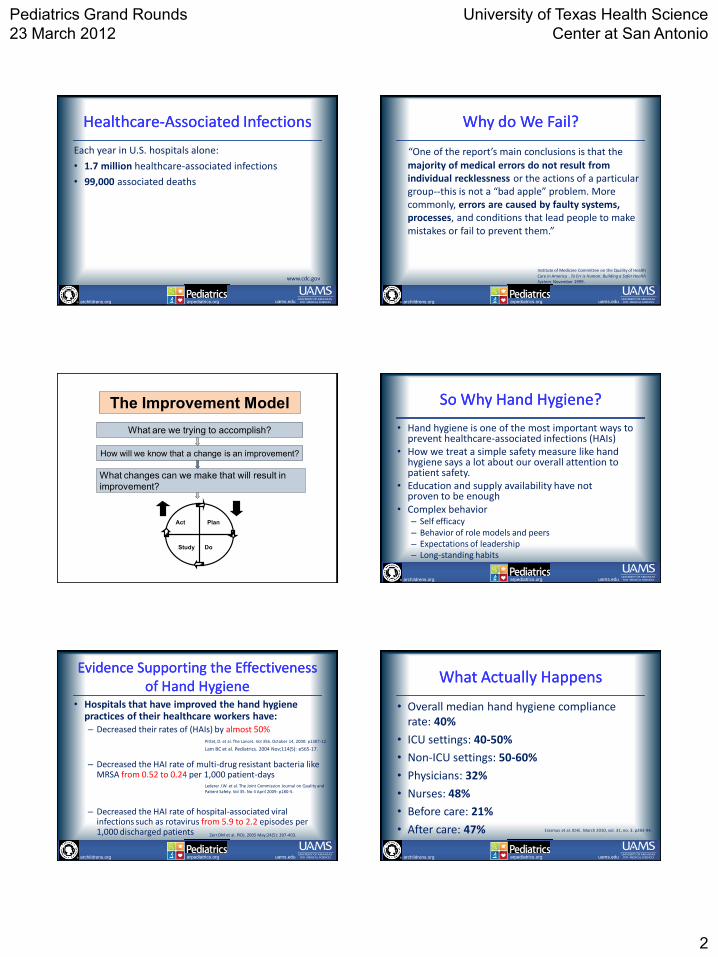
HealthcareHealthcare--Associated InfectionsAssociated Infections
Each year in U.S. hospitals alone:
• 1.7 million healthcare-associated infections
• 99,000 associated deaths
www.cdc.gov
archildrens.org uams.edu arpediatrics.org archildrens.org uams.edu arpediatrics.org
Why do We Fail? Why do We Fail?
“One of the report’s main conclusions is that the majority of medical errors do not result from individual recklessness or the actions of a particular group--this is not a “bad apple” problem. More commonly, errors are caused by faulty systems, processes, and conditions that lead people to make mistakes or fail to prevent them.”
Institute of Medicine Committee on the Quality of Health Care in America . To Err is Human: Building a Safer Health System. November 1999.
How will we know that a change is an improvement?
Plan
Do Study
Act
What are we trying to accomplish?
What changes can we make that will result in
improvement?
The Improvement Model
archildrens.org uams.edu arpediatrics.org archildrens.org uams.edu arpediatrics.org
So Why Hand Hygiene?So Why Hand Hygiene?
• Hand hygiene is one of the most important ways to prevent healthcare-associated infections (HAIs)
• How we treat a simple safety measure like hand hygiene says a lot about our overall attention to patient safety.
• Education and supply availability have not proven to be enough
• Complex behavior – Self efficacy – Behavior of role models and peers – Expectations of leadership – Long-standing habits
archildrens.org uams.edu arpediatrics.org archildrens.org uams.edu arpediatrics.org
Evidence Supporting the Effectiveness Evidence Supporting the Effectiveness of Hand Hygieneof Hand Hygiene
• Hospitals that have improved the hand hygiene practices of their healthcare workers have: – Decreased their rates of (HAIs) by almost 50%
– Decreased the HAI rate of multi-drug resistant bacteria like MRSA from 0.52 to 0.24 per 1,000 patient-days
– Decreased the HAI rate of hospital-associated viral infections such as rotavirus from 5.9 to 2.2 episodes per 1,000 discharged patients
Pittet, D. et al. The Lancet. Vol 356. October 14, 2000: p1307-12.
Lederer J.W. et al. The Joint Commission Journal on Quality and Patient Safety. Vol 35. No 4 April 2009: p180-5.
Zerr DM et al. PIDJ. 2005 May;24(5): 397-403.
Lam BC et al. Pediatrics. 2004 Nov;114(5): e565-17.
archildrens.org uams.edu arpediatrics.org archildrens.org uams.edu arpediatrics.org
What Actually HappensWhat Actually Happens
• Overall median hand hygiene compliance rate: 40%
• ICU settings: 40-50%
• Non-ICU settings: 50-60%
• Physicians: 32%
• Nurses: 48%
• Before care: 21%
• After care: 47% Erasmus et al. ICHE. March 2010, vol. 31, no. 3. p283-94.
Pediatrics Grand Rounds
23 March 2012
University of Texas Health Science
Center at San Antonio
3
How will we know that a change is an improvement?
Plan
Do Study
Act
What are we trying to accomplish?
What changes can we make that will result in
improvement?
The Improvement Model
archildrens.org uams.edu arpediatrics.org archildrens.org uams.edu arpediatrics.org
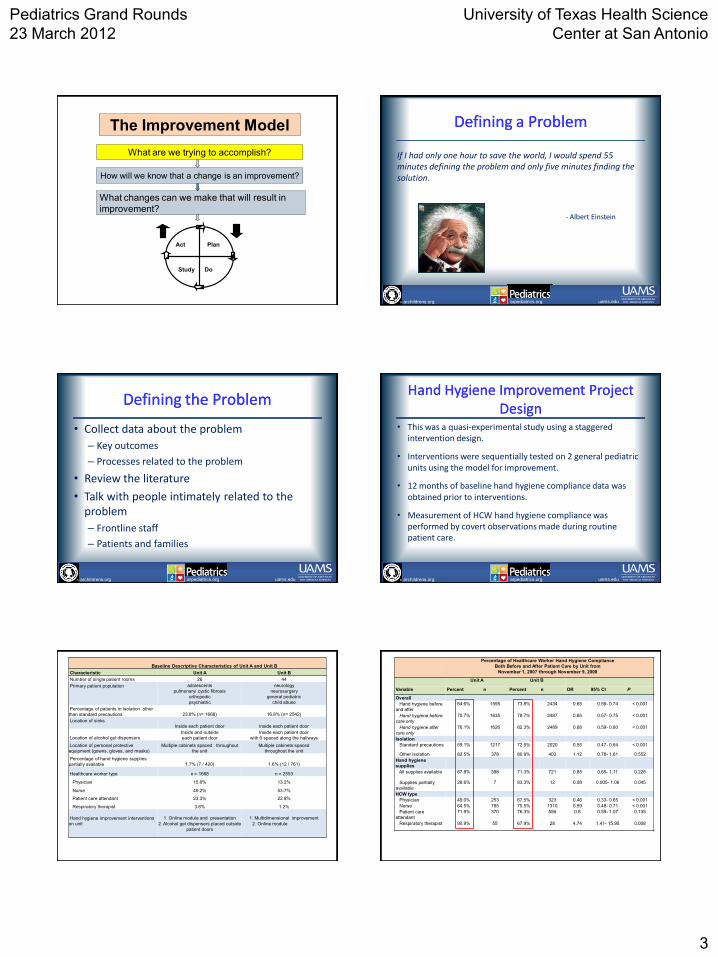
Defining a ProblemDefining a Problem If I had only one hour to save the world, I would spend 55 minutes defining the problem and only five minutes finding the solution.
- Albert Einstein
archildrens.org uams.edu arpediatrics.org archildrens.org uams.edu arpediatrics.org
Defining the ProblemDefining the Problem
• Collect data about the problem
– Key outcomes
– Processes related to the problem
• Review the literature
• Talk with people intimately related to the problem
– Frontline staff
– Patients and families
archildrens.org uams.edu arpediatrics.org archildrens.org uams.edu arpediatrics.org
Hand Hygiene Improvement Project Hand Hygiene Improvement Project DesignDesign
• This was a quasi-experimental study using a staggered intervention design.
• Interventions were sequentially tested on 2 general pediatric units using the model for improvement.
• 12 months of baseline hand hygiene compliance data was obtained prior to interventions.
• Measurement of HCW hand hygiene compliance was performed by covert observations made during routine patient care.
Baseline Descriptive Characteristics of Unit A and Unit B
Characteristic Unit A Unit B
Number of single patient rooms 26 44
Primary patient population
adolescents
pulmonary/ cystic fibrosis
orthopedic
psychiatric
neurology
neurosurgery
general pediatric
child abuse
Percentage of patients in isolation other
than standard precautions 23.8% (n= 1668) 16.8% (n= 2542)
Location of sinks
Inside each patient door Inside each patient door
Location of alcohol gel dispensers
Inside and outside
each patient door
Inside each patient door
with 6 spaced along the hallways
Location of personal protective
equipment (gowns, gloves, and masks)
Multiple cabinets spaced throughout
the unit
Multiple cabinets spaced
throughout the unit
Percentage of hand hygiene supplies
partially available 1.7% (7 / 420) 1.6% (12 / 761)
Healthcare worker type n = 1668 n = 2553
Physician 15.6% 13.2%
Nurse 49.2% 53.7%
Patient care attendant 23.3% 22.8%
Respiratory therapist 3.6% 1.2%
Hand hygiene improvement interventions
on unit
1. Online module and presentation
2. Alcohol gel dispensers placed outside
patient doors
1. Multidimensional improvement
2. Online module
Percentage of Healthcare Worker Hand Hygiene Compliance
Both Before and After Patient Care by Unit from
November 1, 2007 through November 9, 2008
Unit A Unit B
Variable Percent n Percent n OR 95% CI P
Overall
Hand hygiene before
and after
64.6% 1595 73.8% 2434 0.65 0.56- 0.74 < 0.001
Hand hygiene before
care only
70.7% 1635 78.7% 2487 0.65 0.57- 0.75 < 0.001
Hand hygiene after
care only
76.1% 1626 82.3% 2489 0.68 0.59- 0.80 < 0.001
Isolation
Standard precautions 59.1% 1217 72.5% 2020 0.55 0.47- 0.64 < 0.001
Other isolation 82.5% 378 80.9% 403 1.12 0.78- 1.61 0.552
Hand hygiene
supplies
All supplies available 67.8% 398 71.3% 721 0.85 0.65- 1.11 0.228
Supplies partially
available
28.6% 7 83.3% 12 0.08 0.005- 1.06 0.045
HCW type
Physician 49.0% 253 67.5% 323 0.46 0.33- 0.65 < 0.001
Nurse 64.5% 785 75.5% 1310 0.59 0.48- 0.71 < 0.001
Patient care
attendant
71.9% 370 76.3% 556 0.8 0.59- 1.07 0.135
Respiratory therapist 90.9% 55 67.9% 28 4.74 1.41- 15.95 0.008

Pediatrics Grand Rounds
23 March 2012
University of Texas Health Science
Center at San Antonio
4
0%
10%
20%
30%
40%
50%
60%
70%
80%
90%
100%
12/3
1/200
7
1/14
/200
8
1/28
/200
8
2/11
/200
8
2/25
/200
8
3/10
/200
8
3/24
/200
8
4/7/
2008
4/21
/200
8
5/5/
2008
5/19
/200
8
6/2/
2008
6/16
/200
8
6/30
/200
8
7/14
/200
8
7/28
/200
8
8/11
/200
8
8/25
/200
8
9/8/
2008
9/22
/200
8
10/6
/200
8
10/2
0/200
8
Week Beginning
Perc
en
t C
om
plian
t
Control Limits Percent Center Line Special Cause
Last update: 11-06-08 by M. Linam, Data source: Hand Hygiene Database
HAND HYGIENE COMPLIANCE
A6N
Statistical Process Control Chart Showing Percentage of Hand Hygiene
Compliance Both Before and After Patient Care by Month from January 1, 2008 through October 31, 2008 on Unit A
archildrens.org uams.edu arpediatrics.org archildrens.org uams.edu arpediatrics.org
Literature ReviewLiterature Review
• HCWs knowledgeable about when, how and why to perform hand hygiene correctly
• Hand hygiene supplies consistently available at the point of care
• Leadership committed to improving hand hygiene compliance
• HCW behavior had to be addressed
– Create a change in culture
– Change long-standing habits Lederer J.W. et al. The Joint Commission Journal on Quality and Patient Safety. Vol 35. No 4 April 2009: p180-5. How-to Guide: Improving Hand Hygiene A Guide for Improving Practices among Health Care Workers.
Setting Project Goals
S
M
A
R
T
SPECIFIC
MEASURABLE
ATTAINABLE
RELEVANT
TIME-BOUND
archildrens.org uams.edu arpediatrics.org archildrens.org uams.edu arpediatrics.org
Goals vs. SMART GoalsGoals vs. SMART Goals
Goal: Improve the hand hygiene compliance of healthcare workers (HCWs) throughout the hospital
SMART Goal: To improve hand hygiene compliance among HCWs on units A and B from a baseline compliance of 65% and 74%, respectively, to > 90% within 6 months.
How will we know that a change is an improvement?
Plan
Do Study
Act
What are we trying to accomplish?
What changes can we make that will result in
improvement?
The Improvement Model
archildrens.org uams.edu arpediatrics.org archildrens.org uams.edu arpediatrics.org
Effective MeasurementEffective Measurement
• Outcome Measures – Measure the performance of the system under study
– Directly relate to the aim of the project
• Process Measures – Measure whether the parts/steps in the system
performing as planned
• Balancing Measures – Measure whether changes designed to improve one
part of the system cause problems in other parts of the system
Pediatrics Grand Rounds
23 March 2012
University of Texas Health Science
Center at San Antonio
5
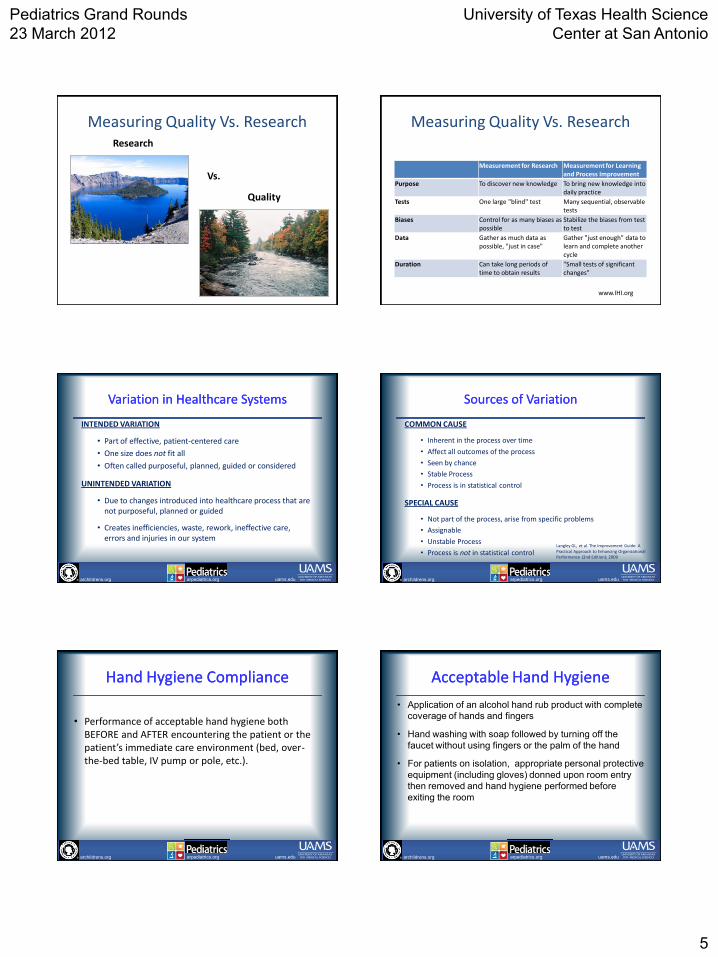
Measuring Quality Vs. Research Research
Quality
Vs.
Measuring Quality Vs. Research
Measurement for Research Measurement for Learning and Process Improvement
Purpose To discover new knowledge To bring new knowledge into daily practice
Tests One large "blind" test Many sequential, observable tests
Biases Control for as many biases as possible
Stabilize the biases from test to test
Data Gather as much data as possible, "just in case"
Gather "just enough" data to learn and complete another cycle
Duration Can take long periods of time to obtain results
"Small tests of significant changes"
www.IHI.org
archildrens.org uams.edu arpediatrics.org archildrens.org uams.edu arpediatrics.org
Variation in Healthcare SystemsVariation in Healthcare Systems
INTENDED VARIATION
• Part of effective, patient-centered care
• One size does not fit all
• Often called purposeful, planned, guided or considered
UNINTENDED VARIATION
• Due to changes introduced into healthcare process that are not purposeful, planned or guided
• Creates inefficiencies, waste, rework, ineffective care, errors and injuries in our system
archildrens.org uams.edu arpediatrics.org archildrens.org uams.edu arpediatrics.org
Sources of VariationSources of Variation
COMMON CAUSE
• Inherent in the process over time
• Affect all outcomes of the process
• Seen by chance
• Stable Process
• Process is in statistical control
SPECIAL CAUSE
• Not part of the process, arise from specific problems
• Assignable
• Unstable Process
• Process is not in statistical control
Langley GL, et al. The Improvement Guide: A Practical Approach to Enhancing Organizational Performance (2nd Edition); 2009
archildrens.org uams.edu arpediatrics.org archildrens.org uams.edu arpediatrics.org
Hand Hygiene ComplianceHand Hygiene Compliance
• Performance of acceptable hand hygiene both BEFORE and AFTER encountering the patient or the patient’s immediate care environment (bed, over-the-bed table, IV pump or pole, etc.).
archildrens.org uams.edu arpediatrics.org archildrens.org uams.edu arpediatrics.org
Acceptable Hand HygieneAcceptable Hand Hygiene
• Application of an alcohol hand rub product with complete
coverage of hands and fingers
• Hand washing with soap followed by turning off the
faucet without using fingers or the palm of the hand
• For patients on isolation, appropriate personal protective
equipment (including gloves) donned upon room entry
then removed and hand hygiene performed before
exiting the room
Pediatrics Grand Rounds
23 March 2012
University of Texas Health Science
Center at San Antonio
6
archildrens.org uams.edu arpediatrics.org archildrens.org uams.edu arpediatrics.org
The Data Collection ProcessThe Data Collection Process
• Cohort of 15 patient attendants (12% of the 128 patient attendants)
• Patient attendants provide 24-hour bedside observation of patients who have medical or behavioral conditions that could result in self-injury, removal of medical devices, flight or abduction.
• Trained by the infection control staff
• Hand hygiene observations were recorded on a standard data collection tool
– Make up to 8 observations during an 8-hour shift
– No more than 2 observations on any one HCW during a shift
• Entered into a database by a single person
• To ensure consistency of the data collection
– handbook was created
– infection control staff met with the data collection team monthly
0%
10%
20%
30%
40%
50%
60%
70%
80%
90%
100%
12/3
1/200
7
1/14
/200
8
1/28
/200
8
2/11
/200
8
2/25
/200
8
3/10
/200
8
3/24
/200
8
4/7/
2008
4/21
/200
8
5/5/
2008
5/19
/200
8
6/2/
2008
6/16
/200
8
6/30
/200
8
7/14
/200
8
7/28
/200
8
8/11
/200
8
8/25
/200
8
9/8/
2008
9/22
/200
8
10/6
/200
8
10/2
0/200
8
Week Beginning
Perc
en
t C
om
plian
t
Control Limits Percent Center Line Special Cause
Last update: 11-06-08 by M. Linam, Data source: Hand Hygiene Database
HAND HYGIENE COMPLIANCE
A6N
Statistical Process Control Chart Showing Percentage of Hand Hygiene
Compliance Both Before and After Patient Care by Month from January 1, 2008 through October 31, 2008 on Unit A
How will we know that a change is an improvement?
Plan
Do Study
Act
What are we trying to accomplish?
What changes can we make that will result in
improvement?
The Improvement Model
archildrens.org uams.edu arpediatrics.org archildrens.org uams.edu arpediatrics.org
What is a Test?What is a Test?
• Putting a change into effect on a temporary basis and learning about its potential impact
archildrens.org uams.edu arpediatrics.org archildrens.org uams.edu arpediatrics.org
Reasons to Test ChangesReasons to Test Changes
• To increase your belief that the change will result in improvement
• To evaluate how much improvement can be expected from the change
• To test whether the proposed change will work in the environment of interest
• To evaluate costs, social impact, and side effects from a proposed change
• To minimize resistance to the change
PDSA Model
Plan
Do Study
Act
Pediatrics Grand Rounds
23 March 2012
University of Texas Health Science
Center at San Antonio
7
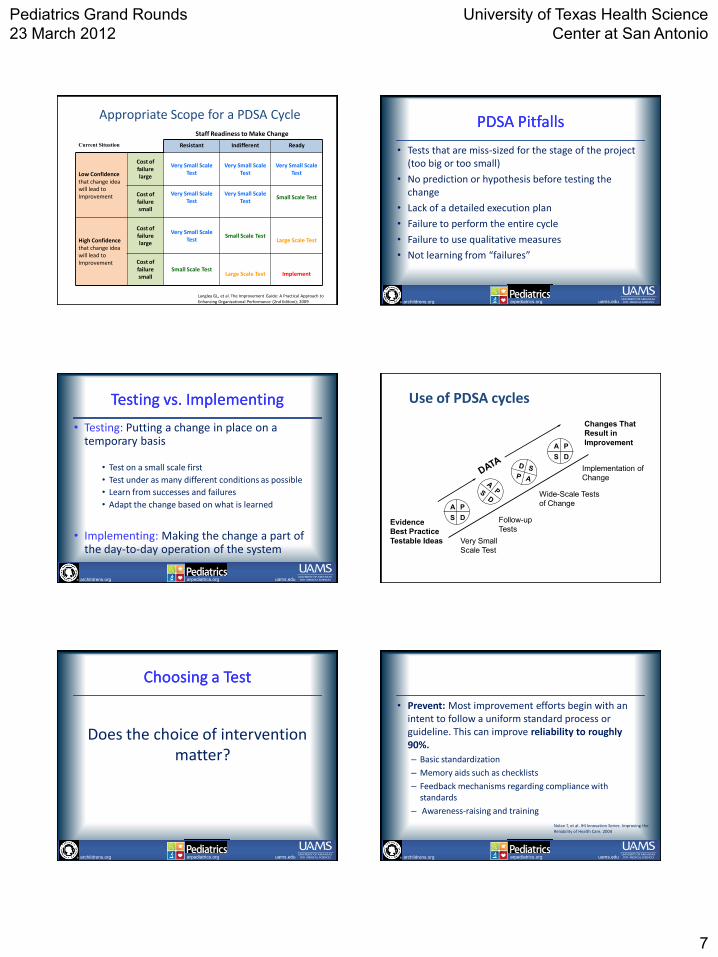
Appropriate Scope for a PDSA Cycle
Current Situation Resistant Indifferent Ready
Low Confidence that change idea will lead to Improvement
Cost of failure large
Very Small Scale Test
Very Small Scale Test
Very Small Scale Test
Cost of failure small
Very Small Scale Test
Very Small Scale Test
Small Scale Test
High Confidence that change idea will lead to Improvement
Cost of failure large
Very Small Scale Test
Small Scale Test
Large Scale Test
Cost of failure small
Small Scale Test
Large Scale Test
Implement
Staff Readiness to Make Change
Langley GL, et al. The Improvement Guide: A Practical Approach to Enhancing Organizational Performance (2nd Edition); 2009 archildrens.org uams.edu arpediatrics.org archildrens.org uams.edu arpediatrics.org
PDSA PitfallsPDSA Pitfalls
• Tests that are miss-sized for the stage of the project (too big or too small)
• No prediction or hypothesis before testing the change
• Lack of a detailed execution plan
• Failure to perform the entire cycle
• Failure to use qualitative measures
• Not learning from “failures”
archildrens.org uams.edu arpediatrics.org archildrens.org uams.edu arpediatrics.org
Testing vs. ImplementingTesting vs. Implementing
• Testing: Putting a change in place on a temporary basis
• Test on a small scale first
• Test under as many different conditions as possible
• Learn from successes and failures
• Adapt the change based on what is learned
• Implementing: Making the change a part of the day-to-day operation of the system
Changes That
Result in
Improvement
A P
S D
A P
S D
Very Small
Scale Test
Follow-up
Tests
Wide-Scale Tests
of Change
Implementation of
Change
Evidence
Best Practice
Testable Ideas
Use of PDSA cycles
archildrens.org uams.edu arpediatrics.org archildrens.org uams.edu arpediatrics.org
Choosing a TestChoosing a Test
Does the choice of intervention matter?
archildrens.org uams.edu arpediatrics.org archildrens.org uams.edu arpediatrics.org
• Prevent: Most improvement efforts begin with an intent to follow a uniform standard process or guideline. This can improve reliability to roughly 90%.
– Basic standardization
– Memory aids such as checklists
– Feedback mechanisms regarding compliance with standards
– Awareness-raising and training
Nolan T, et al. IHI Innovation Series: Improving the Reliability of Health Care. 2004
Pediatrics Grand Rounds
23 March 2012
University of Texas Health Science
Center at San Antonio
8
archildrens.org uams.edu arpediatrics.org archildrens.org uams.edu arpediatrics.org
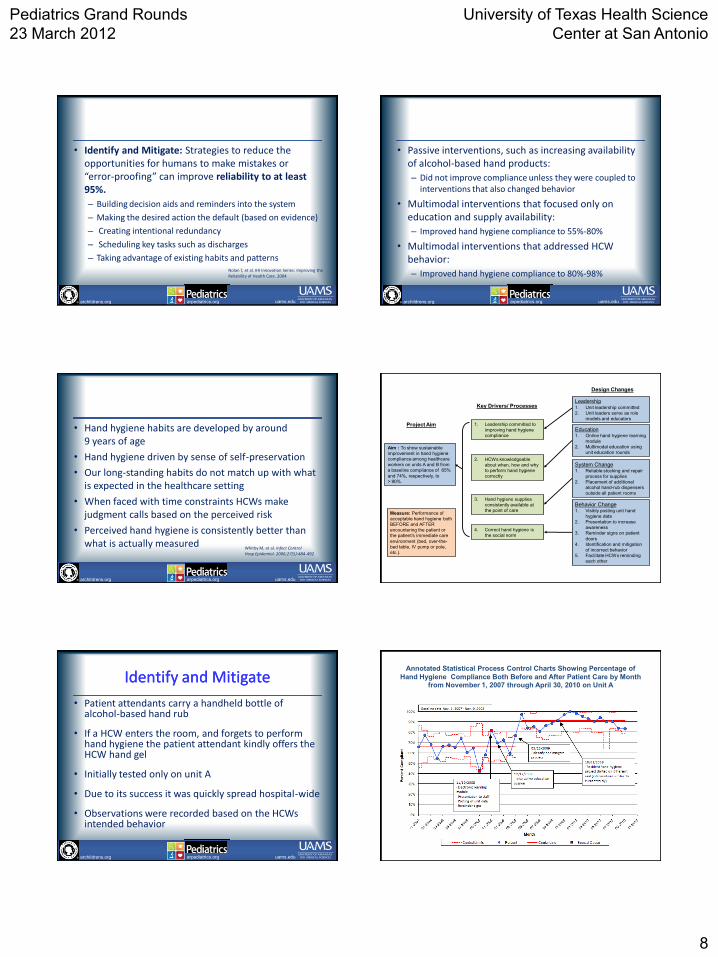
• Identify and Mitigate: Strategies to reduce the opportunities for humans to make mistakes or “error-proofing” can improve reliability to at least 95%.
– Building decision aids and reminders into the system
– Making the desired action the default (based on evidence)
– Creating intentional redundancy
– Scheduling key tasks such as discharges
– Taking advantage of existing habits and patterns Nolan T, et al. IHI Innovation Series: Improving the Reliability of Health Care. 2004
archildrens.org uams.edu arpediatrics.org archildrens.org uams.edu arpediatrics.org
• Passive interventions, such as increasing availability of alcohol-based hand products:
– Did not improve compliance unless they were coupled to interventions that also changed behavior
• Multimodal interventions that focused only on education and supply availability:
– Improved hand hygiene compliance to 55%-80%
• Multimodal interventions that addressed HCW behavior:
– Improved hand hygiene compliance to 80%-98%
archildrens.org uams.edu arpediatrics.org archildrens.org uams.edu arpediatrics.org
• Hand hygiene habits are developed by around 9 years of age
• Hand hygiene driven by sense of self-preservation
• Our long-standing habits do not match up with what is expected in the healthcare setting
• When faced with time constraints HCWs make judgment calls based on the perceived risk
• Perceived hand hygiene is consistently better than what is actually measured
Whitby M, et al. Infect Control Hosp Epidemiol. 2006;27(5):484-492
Aim : To show sustainable
improvement in hand hygiene
compliance among healthcare
workers on units A and B from
a baseline compliance of 65%
and 74%, respectively, to
> 90%.
1. Leadership committed to
improving hand hygiene
compliance
Key Drivers/ Processes
Design Changes
Project Aim
4. Correct hand hygiene is
the social norm
3. Hand hygiene supplies
consistently available at
the point of care
Education
1. Online hand hygiene learning
module
2. Multimodal education using
unit education rounds
System Change
1. Reliable stocking and repair
process for supplies
2. Placement of additional
alcohol hand-rub dispensers
outside all patient rooms
Behavior Change
1. Visibly posting unit hand
hygiene data
2. Presentation to increase
awareness
3. Reminder signs on patient
doors
4. Identification and mitigation
of incorrect behavior
5. Facilitate HCWs reminding
each other
Measure: Performance of
acceptable hand hygiene both
BEFORE and AFTER
encountering the patient or
the patient’s immediate care
environment (bed, over-the-
bed table, IV pump or pole,
etc.).
2. HCWs knowledgeable
about when, how and why
to perform hand hygiene
correctly
Leadership 1. Unit leadership committed
2. Unit leaders serve as role
models and educators
archildrens.org uams.edu arpediatrics.org archildrens.org uams.edu arpediatrics.org
Identify and MitigateIdentify and Mitigate
• Patient attendants carry a handheld bottle of alcohol-based hand rub
• If a HCW enters the room, and forgets to perform hand hygiene the patient attendant kindly offers the HCW hand gel
• Initially tested only on unit A
• Due to its success it was quickly spread hospital-wide
• Observations were recorded based on the HCWs intended behavior
Annotated Statistical Process Control Charts Showing Percentage of
Hand Hygiene Compliance Both Before and After Patient Care by Month from November 1, 2007 through April 30, 2010 on Unit A

Pediatrics Grand Rounds
23 March 2012
University of Texas Health Science
Center at San Antonio
9
Annotated Statistical Process Control Charts Showing Percentage of
Hand Hygiene Compliance Both Before and After Patient Care by Month from November 1, 2007 through April 30, 2010 on Unit B
archildrens.org uams.edu arpediatrics.org archildrens.org uams.edu arpediatrics.org
Barriers and Keys to SuccessBarriers and Keys to Success
• Barriers – Trying to overcome long-standing habits – Lack of belief their hand hygiene was poor
• Keys to success
– Support from the unit leadership was crucial – Interventions built upon existing processes – Worked to increase awareness and urgency – The identify and mitigate process was able to improve
hand hygiene compliance to 90% or greater across multiple HCW types
archildrens.org uams.edu arpediatrics.org archildrens.org uams.edu arpediatrics.org
Implementing a Successful ChangeImplementing a Successful Change
• Implementation is a permanent change to the way work is done
• If the change is not built into the process improvement often erodes over time
• Key components necessary for sustainability
– Process owner
– Ongoing monitoring process
– Redesign of the system
archildrens.org uams.edu arpediatrics.org archildrens.org uams.edu arpediatrics.org
Designing for SustainabilityDesigning for Sustainability
• Process owner:
– who is going to oversee the new process?
– Who is going to monitor the data collection?
• Monitoring system:
– Integrate the data collection plan to monitor the process and continued improvement
– Have a process in place to address special causes and trends in the data
archildrens.org uams.edu arpediatrics.org archildrens.org uams.edu arpediatrics.org
Designing for SustainabilityDesigning for Sustainability
• Redesigning the system:
– Update key stakeholders
– Create a revised process map
– Update policies and procedures
– Redesign job responsibilities
– Training employees in the new procedures and use of new equipment
archildrens.org uams.edu arpediatrics.org archildrens.org uams.edu arpediatrics.org
SPREADING IMPROVEMENTSPREADING IMPROVEMENT

Pediatrics Grand Rounds
23 March 2012
University of Texas Health Science
Center at San Antonio
10
archildrens.org uams.edu arpediatrics.org archildrens.org uams.edu arpediatrics.org
Arkansas Children’s Hospital Hand Arkansas Children’s Hospital Hand Hygiene Improvement Project GoalHygiene Improvement Project Goal
• To improve hand hygiene compliance for each patient care unit to at least 90% and show sustained improvement for at least 6 months
To improve hand hygiene compliance for each patient care unit to at least 90% and show sustained improvement for at least 6 months
1. Leadership committed to
improving hand hygiene
compliance
Key Drivers/ Processes
Design Changes
Project Aim
4. Correct hand hygiene is
the social norm
3. Hand hygiene supplies
consistently available at
the point of care
Education and Training 1. ACH Moments for Hand
Hygiene posters
2. Online education module
3. Update new employee
orientation
Supply Availability 1. Reliable restocking process
for supplies
2. Placement of alcohol hand-
rub dispensers in the path of
care
Behavior Change
1. Sharing compliance data with
staff
2. Immediate positive feedback
to staff
3. Resident physician team-
based competition
Measure: Performance of
acceptable hand hygiene
upon ENTERING and
LEAVING the patient’s care
environment (zone).
2. HCWs knowledgeable
about when, how and why
to perform hand hygiene
correctly
Leadership 1. Senior leadership priority
2. Unit leadership makes hand
hygiene a priority
3. Hand hygiene Infomercial
HCW indicates healthcare worker.
How will we know that a change is an improvement?
Plan
Do Study
Act
What are we trying to accomplish?
What changes can we make that will result in
improvement?
The Improvement Model
archildrens.org uams.edu arpediatrics.org archildrens.org uams.edu arpediatrics.org
WHERE DO WE GO FROM HERE?WHERE DO WE GO FROM HERE?
Pediatrics Grand Rounds
23 March 2012
University of Texas Health Science
Center at San Antonio
11
archildrens.org uams.edu arpediatrics.org archildrens.org uams.edu arpediatrics.org
Additional ReferencesAdditional References
• Whitby M, et al. Am J Infect Control. 2008;36(5):349-355
• Pittet D, et al. Lancet. 2000;356(9238):1307-1312 • Lam BC, et al. Pediatrics. 2004;114(5):e565-571
• Lederer JW, et al. Jt Comm J Qual Patient Saf. 2009;35(4):180-185 • Won SP, et al. Infect Control Hosp Epidemiol. 2004;25(9):742-746 • Zerr DM, et al. Pediatr Infect Dis J. 2005;24(5):397-403