imrt and 3dcrt
TRANSCRIPT

INTENSITY MODULATED
RADIOTHERAPY(IMRT)
AND
3 D CONFORMAL
RADIOTHERAPY(3D CRT)
DR GURU PRASAD MOHANTY
CONSULTANT RADIATION ONCOLOGIST
DEPARTMENT OF RADIATION ONCOLOGY
RAJKOT CANCER SOCIETY

The Evolution of Radiation Therapy1ST Telecobalt machine in August 1951 in
Sasaktoon Cancer Clinic, Canada
High resolution IMRTMultileaf Collimator
Dynamic MLCand IMRT
1960’s 1970’s 1980’s 1990’s2000’s
Cerrobend BlockingElectron Blocking
Blocks were used to reduce the dose to normal tissues
MLC leads to 3D conformal therapy which allows the first dose escalation trials.
Computerized IMRT introduced which allowed escalation of dose and reduced compilations
Functional Imaging
IMRT Evolution evolves to smaller and smaller subfields and high resolution IMRT along with the introduction of new imaging technologies
The First Clinac
Computerized 3D CT Treatment Planning
Standard Collimator
The linac reduced complications compared to Co60
9/25/2010

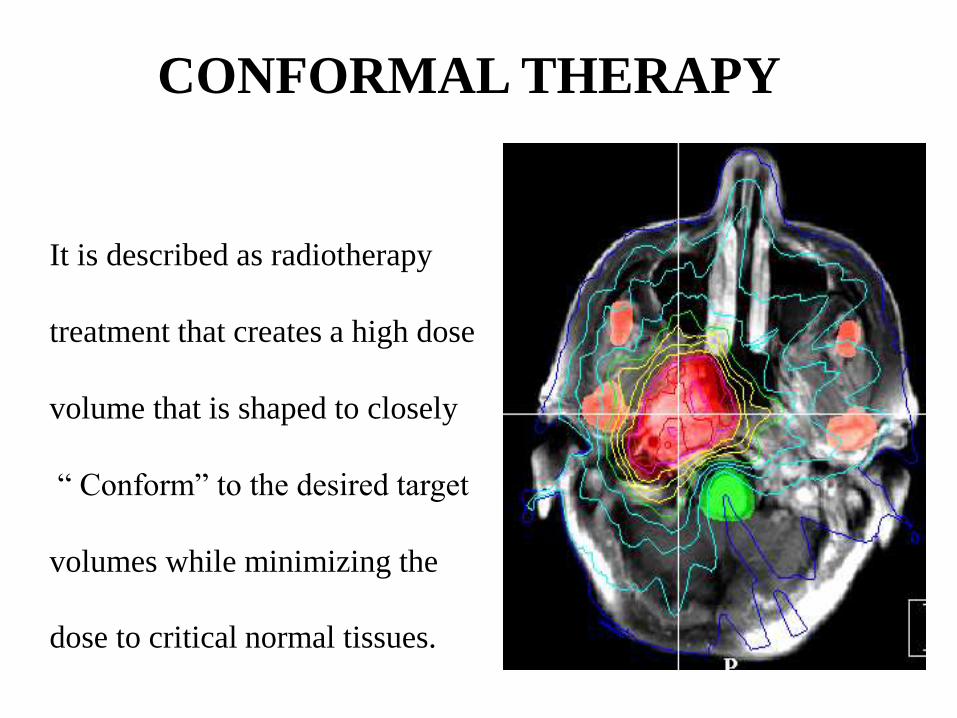
CONFORMAL THERAPY
It is described as radiotherapy
treatment that creates a high dose
volume that is shaped to closely
“ Conform” to the desired target
volumes while minimizing the
dose to critical normal tissues.

Features of Conformal Radiotherapy
1)Target volumes are defined in three dimensions using contours
drawn on many slices from a CT imaging study.
2)Multiple beam directions are used to crossfire on the targets.
3)Individual beams are shaped or intensity modulated to create a
dose distribution that conforms to the target volume and desired
dose levels.
4)Use of image guidance,accurate patient setup ,immobilization
and management of motion to ensure accurate delivery of the
planned dose distributions to the patient.

Types of Conformal Radiation
Two broad subtypes :
Techniques aiming to employ geometric fieldshaping alone( 3D-CRT)
Techniques to modulate the intensity of fluenceacross the geometrically-shaped field (IMRT)
Geometrical Field shaping
Geometrical Field shaping with Intesity Modulation

WHAT IS 3-D CRT
To plan & deliver treatment based on 3D anatomicinformation. such that resultant dose distribution conforms tothe target volume closely in terms of
Adequate dose to tumor &
Minimum dose to normal tissues.
The 3D CRT plans generally
use increased number of radiation beams
to improve dose conformation and conventional beammodifiers (e.g., wedges and/or compensating filters) are used.

Automated 3-D Conformal Radiation Therapy
Beam shaping automated with first multileaf collimators (MLC)
Less labor intensive--no entering and exiting treatment room to change blocks
Use of CT scans to see tumorsin 3-D for more precise treatment planning
Treatment uses 4-6 beam angles

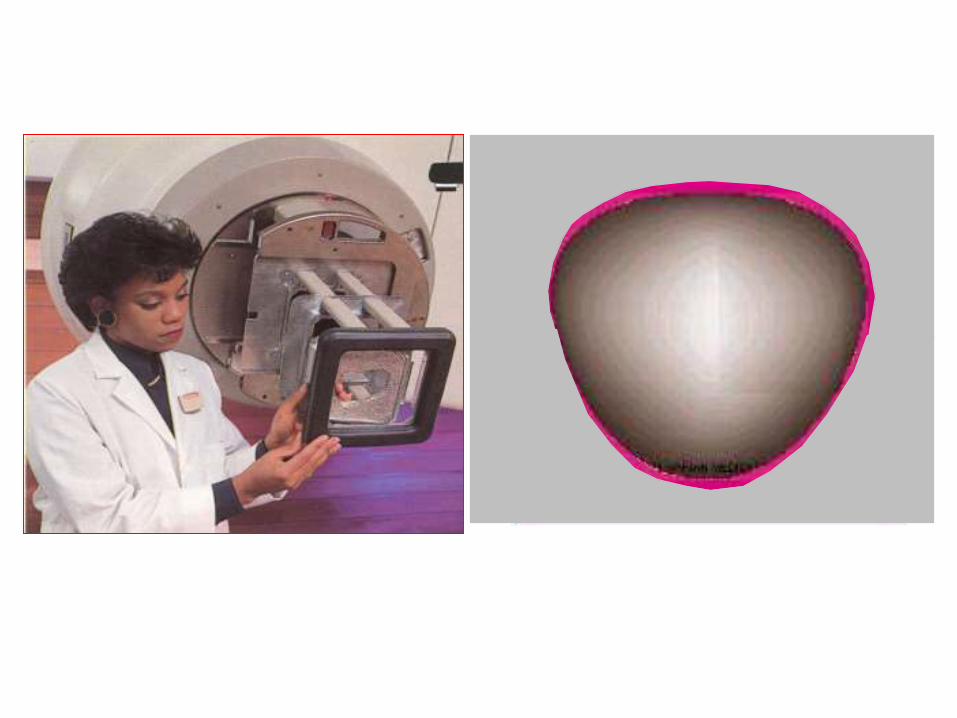
•Custom-molded block(s) match beam shape to tumor profile
•Beam shaping from multiple angles conforms radiation dose to tumor volume
•Typical treatments use 4-6 beam angles
•Dose still relatively low
•Blocks still changed by hand
•Still slow and labor intensive
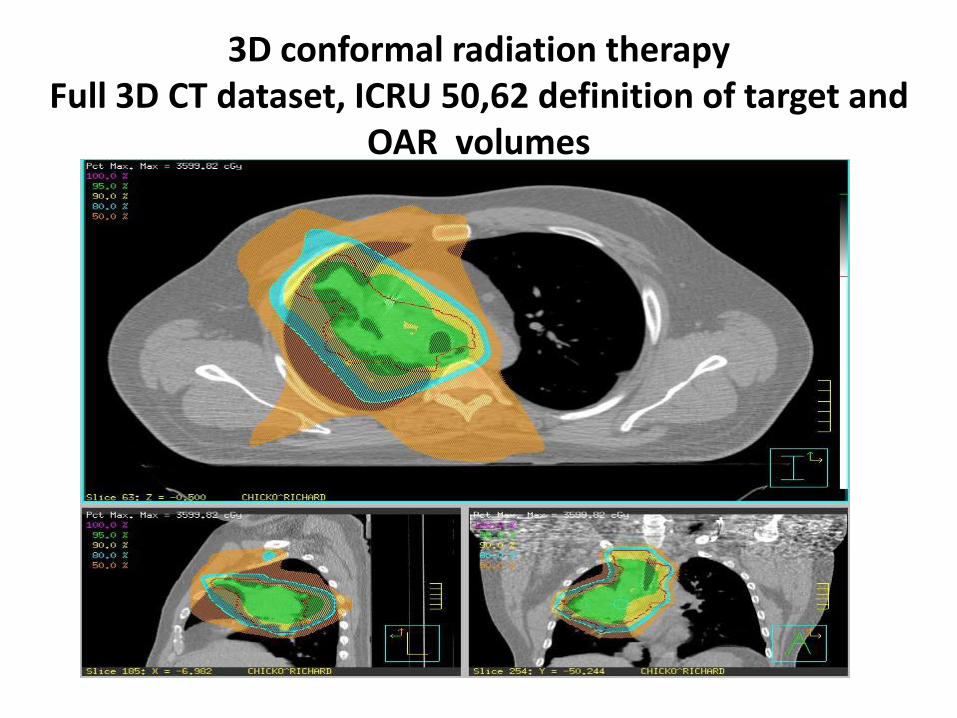
3D conformal radiation therapy Full 3D CT dataset, ICRU 50,62 definition of target and
OAR volumes

3D-CRT
1/ Radiation intensity is uniform
within each beam
2/ Modulation conferred only by
wedges.

History of Conformal Therapy

IMRT
IMRT is an advanced form of 3D CRT
IMRT refers to a radiation therapy technique in
which
nonuniform fluence is delivered to the patient from any
given position of the treatment beam
using computer-aided optimization
to attain certain specified
dosimetric and clinical objectives.
IMRT RATIONALE
More conformal than 3D CRT
Dose distribution more homogeneous within PTV
A sharp fall off PTV boundary
Reduction of normal tissue dose
To create concave isodose surfaces or
low-dose areas surrounded by high dose.
Lower rate of complication-lower cost of
patient care following treatment
Large fields and boosts can be integrated
in single treatment plan
Radiobiologic advantage
Divides each treatment field into multiple segments upto(500/angle)
Allows dose escalation to most aggressive tumor cells; best protection of healthy tissue
Modulates radiation intensity; gives distinct dose to each segment
Uses 9+ beam angles, thousands of segments
Improves precision/accuracy
Requires inverse treatment planning software to calculate dose distribution
LIMITATIONS OF IMRT
Many dose distributions physically not achievable
Interfraction variation
Positioning
Displacement and distortion of internal anatomy
Intrafraction motion
Changes of physical and radiobiologic characteristic of tumor and
normal tissue
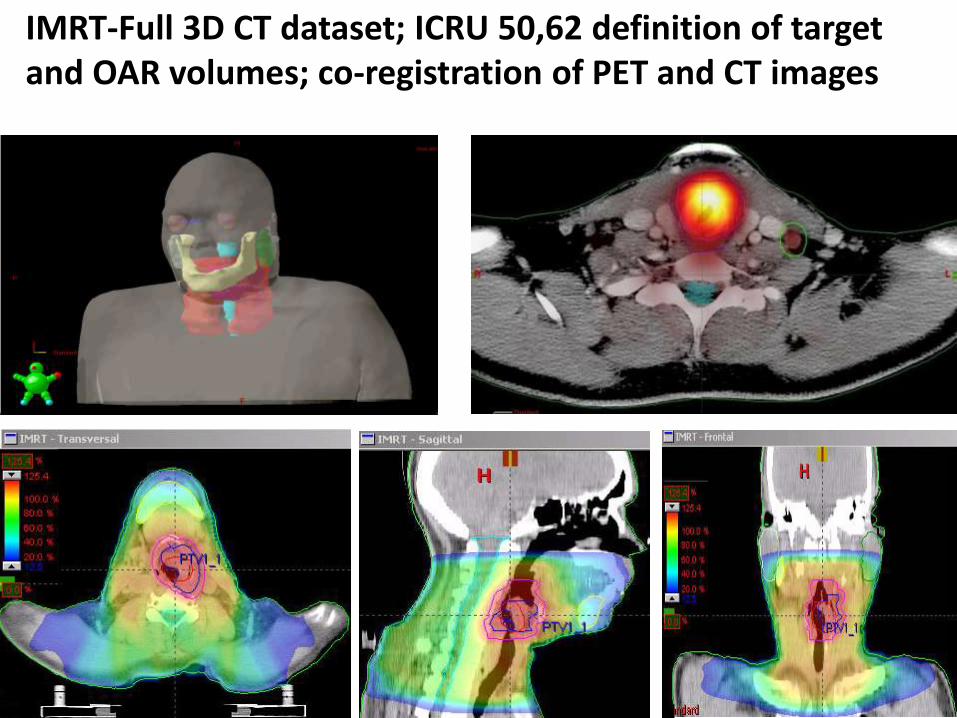
IMRT-Full 3D CT dataset; ICRU 50,62 definition of target and OAR volumes; co-registration of PET and CT images
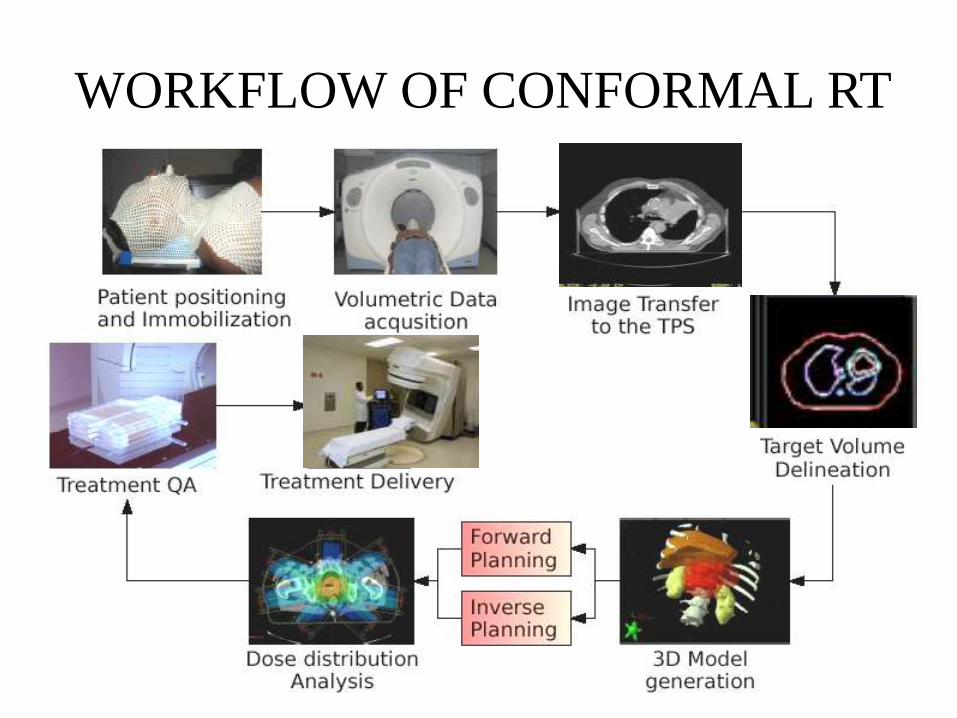
WORKFLOW OF CONFORMAL RT
POSITIONING
• Important component of conformal RT
• Position
– Should be comfortable & Reproducible
– Should be suitable for beam entry, with minimum accessories in beampath
• For this purpose positioning devices may be used
• Positioning devices are ancillary devices used to help maintainthe patient in a non-standard treatment position.
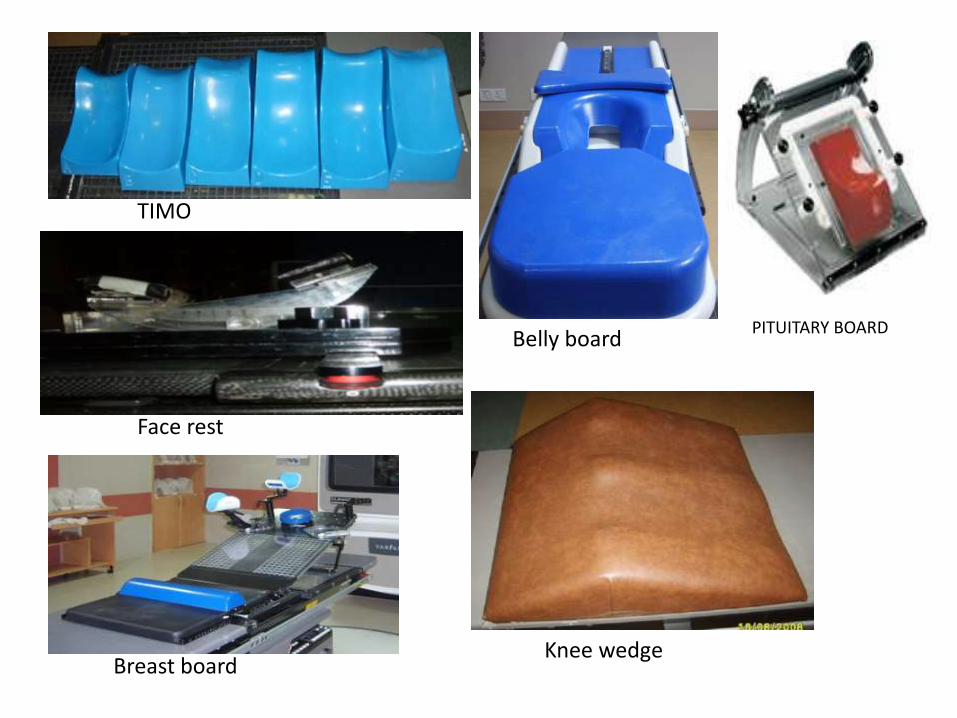
TIMO
Face rest
Breast boardKnee wedge
Belly boardPITUITARY BOARD

IMMOBILIZATION
• Patient is immobilized using individualized casts or moulds.• An immobilization device is any device that helps to establish and
maintain the patient in a fixed, well-defined position from treatment totreatment over a course of radiotherapy-reproduce the treatmenteveryday

IMAGE ACQUISITION
• It provides foundation for treatment planning
• Usually more than one imaging modalities are required for betterdelineation of target volume
• Images are acquired for :
– Treatment planning
– Image guidance and/or treatment verification
– Follow-up studies (during & after treatment)

IMAGING MODALITIES
• No single imaging modality produces all theinformation, needed for the accurate identificationand delineation of the target volume and criticalorgans.
• Various imaging modalities used are :
– CT
– MRI
– PET-CT
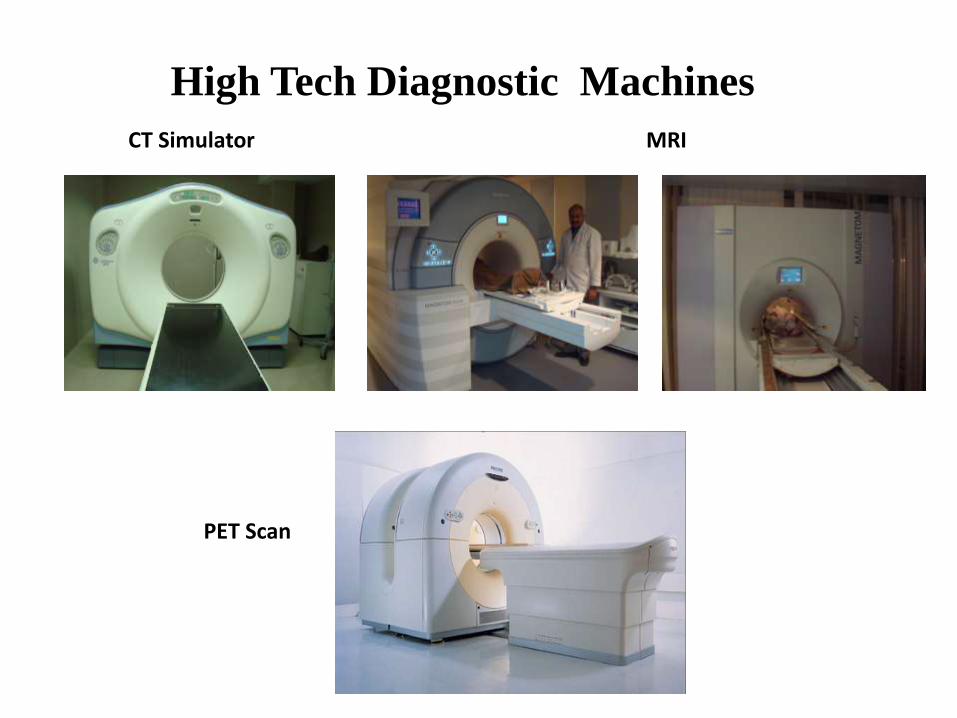
High Tech Diagnostic Machines
CT Simulator
PET Scan
MRI

CT IMAGING
• Advantages of CT
– Gives quantitative data inform of CT no. (electrondensity) to account fortissue heterogeneities whilecomputing dose distribution.
– Gives detailed informationof bony structures
– Potential for rapid scanning
– 4 -D imaging can be done.
– Widely available;(relatively) inexpensive
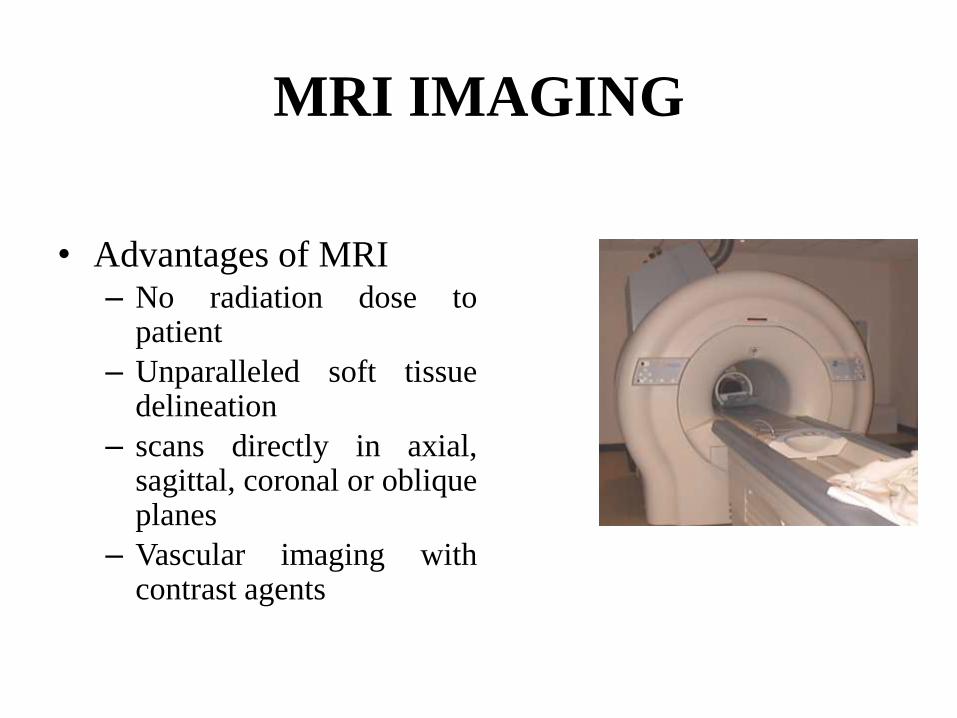
MRI IMAGING
• Advantages of MRI– No radiation dose to
patient
– Unparalleled soft tissuedelineation
– scans directly in axial,sagittal, coronal or obliqueplanes
– Vascular imaging withcontrast agents

PET/CT
• Recently introduced PET/CTmachines, integrating PET &CT technologies , enables thecollection of both anatomical& biological informationsimultaneously
• ADV. of PET/CT– Earlier diagnosis of tumor
– Precise localization
– Accurate staging
– Precise treatment
– Monitoring of response totreatment
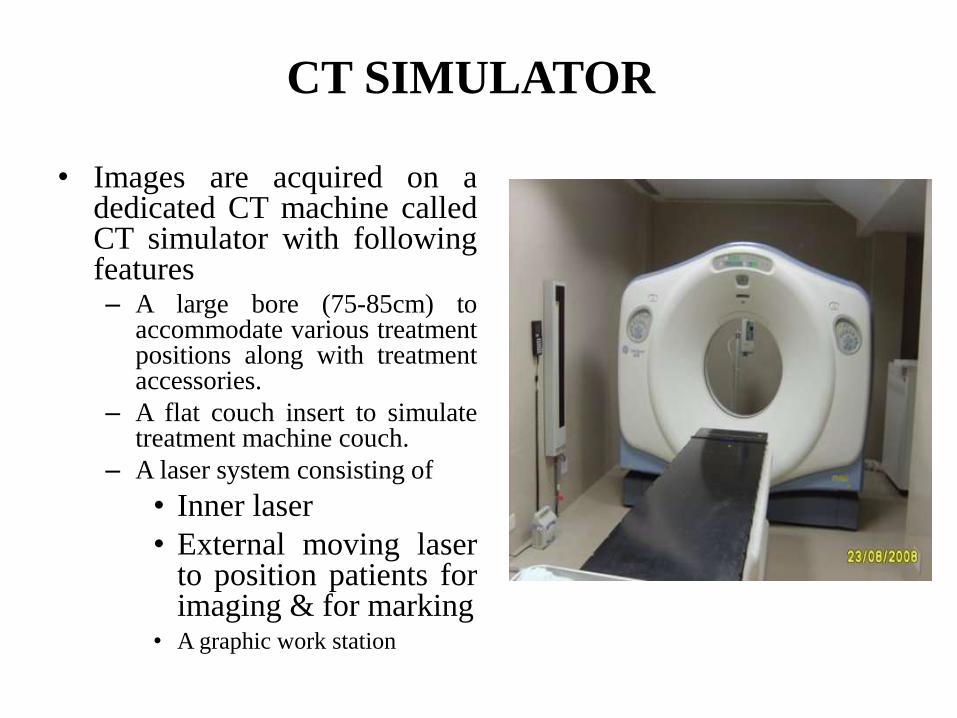
CT SIMULATOR
• Images are acquired on adedicated CT machine calledCT simulator with followingfeatures– A large bore (75-85cm) to
accommodate various treatmentpositions along with treatmentaccessories.
– A flat couch insert to simulatetreatment machine couch.
– A laser system consisting of
• Inner laser
• External moving laserto position patients forimaging & for marking
• A graphic work station

IMAGE ACQUISITION
• CT is done with pt in the treatment position with immobilization
device if used.
• Radio opaque fiducial are placed .
• These fiducial assist in any coordinate transformation needed as
a result of 3D planning and eventual plan implementation.
• A topogram is generated to insure that patient alignment is
correct & then using localizer, area to be scanned is selected.
• The FOV is selected to permit visualization of the external
contour, which is required for accurate dose calculations.
• Using site dependent protocols, images are acquired.
• The planning CT data set is transferred to a 3D-TPS or
workstation via a computer network.

TREATMENT PLANNING SYSTEM
• TPS provides tools for
– Image registration
– Image segmentation or contouring
– Virtual Simulation
– Dose calculations
– Plan Evaluation
– Data Storage and transmission to console
– Treatment verification

IMAGE REGISTRATION
• registration allows use of complementary features of differentscan types.
• Employs a unique algorithm that allows full voxel to voxelintensity match, Image Fusion automatically correlates thousandsof points from two image sets, providing true volumetric fusionof anatomical data sets.
• This requires calculation of 3D transformation that relatescoordinates of a particular imaging study to planning CTcoordinates.
• Various registration techniques include– Point-to-point fitting,
– Line or curve matching
– Surface or topography matching
– Volume matching

MRI IMAGE
CT IMAGE
CONTOURING ON BLENDED IMAGE
POINT TO POINT MATCHING
IMAGE FUSION
APPLICATIONS OF IMAGE
REGISTRATION
• Identifying the volume of a tumour on a preoperative scan andtransferring it to the postoperative treatment planning scan todefine the target volume.
• Visualizing CNS structures more clearly seen on MRI andmapping them to CT image for planning-fusion
• Combining functional or biochemical signals from emissiontomography onto CT scans for planning purposes.
• For organ motion studies
• Image guidance
• For follow-up studies
• 4D CT
• Image registration allows computation of cumulative dosesfrom multiple plans done on different image sets for samepatient

IMAGE SEGMENTATION OR
CONTOURING
• Most labour-intensive componentof 3-D CRT
• Necessary for the qualitative andquantitative evaluation oftreatment plan.
• Reconstructed sagittal & coronalimages provide additionalorientation cues & are useful indefining spatially consistentvolumes of interest.
• Segmentation is done manuallyor automatically delineatinganatomic regions of interest on aslice-by-slice basis
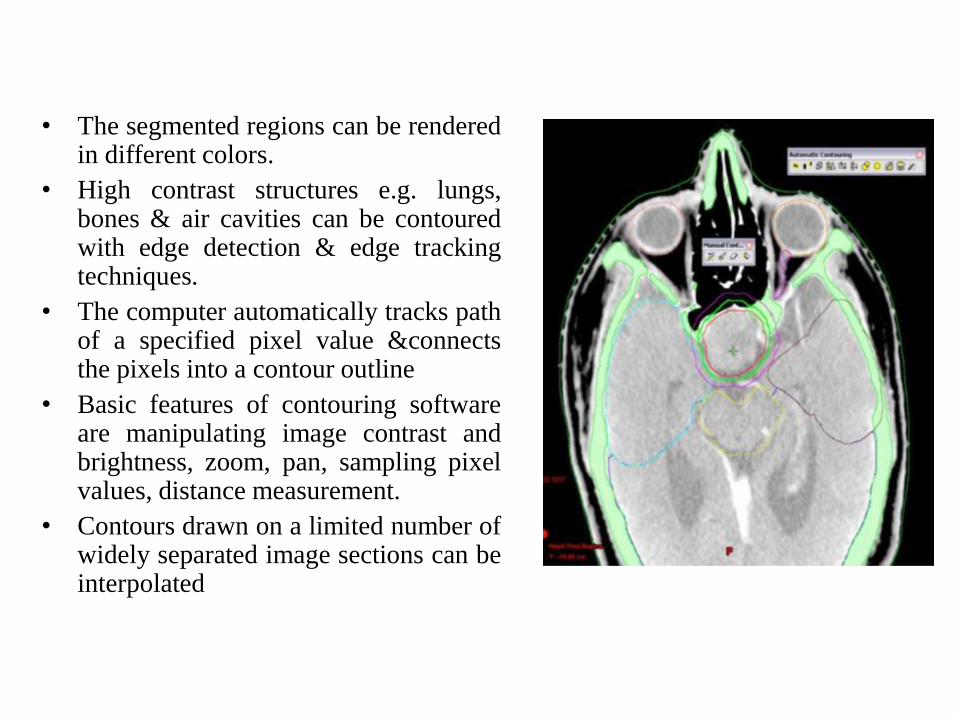
• The segmented regions can be renderedin different colors.
• High contrast structures e.g. lungs,bones & air cavities can be contouredwith edge detection & edge trackingtechniques.
• The computer automatically tracks pathof a specified pixel value &connectsthe pixels into a contour outline
• Basic features of contouring softwareare manipulating image contrast andbrightness, zoom, pan, sampling pixelvalues, distance measurement.
• Contours drawn on a limited number ofwidely separated image sections can beinterpolated
VOLUME DEFINITION
• Volume definition isprerequisite for 3-Dtreatment planning.
• To aid in the treatmentplanning process &provide a basis forcomparison of treatmentoutcomes.
• ICRU reports50 & 62define & describe target& critical structurevolumes.
ICRU 50 & 62
• When delivering Radiotherapy treatment, parameters suchas volume & dose have to be specified for:
– Prescription
– Recording
– Reporting
• Such specifications serve a number of purposes
– To enable the Radiation Oncologist to maintain a consistenttreatment policy and improve it in the light of experience.
– To compare the results of treatment and benefit from otherdepartmental treatments.
– It is particularly important in multi-center studies in order to keeptreatment parameters well defined, constant & reproducible.
• It is expected that rapid development of new techniqueswould increase the complexity of radiotherapy andemphasize the need for general strict guidelines.
9/25/2010
VOLUMES
• Two volumes should be defined prior to treatmentplanning, these volumes are:
– Gross tumor volume (GTV).
– Clinical target volume (CTV).
• During the treatment planning process, other volumeshave to be defined.
– Planning target volume (PTV).
– Organs at risk.
• As a result of treatment planning, further volumes canbe described. These are:
– Treated volume (TV).
– Irradiated volume (IRV).
9/25/2010

• The GTV is the gross (palpable, visible or demonstrable) extentand location of malignant growth.
• This may consist of primary tumor, metastatic lymphadenopathy orother metastases.
• No GTV can be defined if the tumor has been removed. Eg. Byprevious surgery.
• The CTV is GTV + sub clinical microscopic disease.
• Additional volumes with presumed sub clinical spread may also beconsidered for therapy and may be designated as CTV II, CTV IIIetc. (ICRU 62)
• The PTV is a geometrical concept defined to select appropriatebeam sizes and beam arrangements.
• It considers the net effect of the geometrical variations to ensurethat the prescribed dose is actually absorbed in the CTV.
• These variations may be intra-fractional or inter-fractional due tonumber of factors like
– Movement of tissues/patient.
– Variations in size & shape of tissues.
– Variations in beam characteristics.
– The uncertainties may be random or systematic.
9/25/2010

9/25/2010
Organs at Risk
• Organs at risk are normal tissues, whose radiationsensitivity may significantly reduce the treatmentplanning and/or prescribed dose.
• Any possible movement of the organ at risk as wellas uncertainties in the setup during the wholetreatment course must be considered.
• Organs at risk may be divided into three differentclasses:
– Class I (Radiation lesions are fatal & result in severemorbidity.)
– Class II (Result in moderate to mild morbidity.)
– Class III (Radiation lesions are mild, transient andreversible or result in no significant morbidity.)
9/25/2010

Organs at Risk
OARs
• Lungs
• Spinal Cord

ICRU 62, 1999• Gives more detailed recommendations on different
margins that must be considered to account forAnatomical & Geometrical uncertainties.
• Introduces concept of reference points &coordinate systems.
• Introduces the concept of conformity index.
• Classifies Organs at Risk.
• Introduces planning organ at risk volume.
• Gives recommendations on graphic.
• Gives additional recommendations on reportingdoses, not only in a single patient but also in aseries of patients.
• Of all, Reporting is Emphasized.
9/25/2010

Internal Margin (IM) & Internal Target
Volume (ITV)• A margin must be added to the CTV to
compensate for expected physiological movements
& expected variations in size, shape & position of
the CTV during therapy.
• It is in relation to an internal reference point and
its corresponding coordinate systems.
• This margin is now denoted as the Internal
Margin (IM).
• They do not depend on external uncertainties of
beam geometry.
• They cannot be easily controlled.

ICRU 62 report
Target volumes
•GTV = Gross Tumour Volume= Macroscopic tumour
•CTV = Clinical Target Volume= Microscopic tumour
•PTV = Planning target Volume
PTV
Advice: Always use the
ICRU reports to specify and
record dose and volumeBaumert et al. IJROBP 2006 Sep 1;66(1):187-94
Set up Margin (SM):
• It accounts for the uncertainties in patientpositioning and aligning of therapeutic beams.
• It includes the treatment planning session as wellas all the treatment sessions.
Planning organ at risk volume (PRV):
• An integrated margin must be added to the OR to
compensate for variations including the movement
of organ as well as setup uncertainties.
• In particular the internal margin & the setup
margin for the OR must be identified. This leads to
the concept of PRV.
9/25/2010

IM = Internal MarginSM = Setup Margin
IM
CTV
SM
PRV
OR
ICRU 62 – Volume definitions
ITV
PTV
9/25/2010

ICRU 83 (2010)
• Gross tumor volume or GTV• Clinical target volume or CTV• Planning target volume or PTV• Organ at risk or OAR• Planning organ-at-risk volume or PRV• Internal target volume or ITV• Treated volume or TV• Remaining volume at risk or RVR
As introduced in ICRU Reports 50, 62, 71, and 78 (ICRU, 1993; 1999; 2004; 2007)

Biological Target Volume
A target volume that
incorporated data from
molecular imaging techniques
Target volume drawn
incorporates information
regarding:
Cellular burden
Cellular metabolism
Tumor hypoxia
Tumor proliferation
Intrinsic Radioresistance or
sensitivity
Biological Target Volumes
Lung Cancer: 30 -60% of all GTVs and PTVs are changed with
PET.
Increase in the volume can be seen in 20 -40%.
Decrease in the volume in 20 – 30%.
Several studies show significant improvement in nodal delineation.
Head and Neck Cancer: PET fused images lead to a change in GTV volume
in 79%.
Can improve parotid sparing in 70% patients.
ORGAN AT RISK(ICRU 62)
• Normal critical structures whose radiation sensitivity may significantly influence treatment planning and/or prescribed dose
• Organs are made up of functional units.
• Radio sensitivity of an organ is determinedby the arrangement of these units.
• If functional units are arranged in seriesthen inactivation of one subunit causes lossof function of whole organ –spinal cord
• In parallel organization of functionalsubunits, inactivation of a large no. ofsubunits doesn’t affect overall organfunction.
• Consequently,– an organ with high tolerance may be lost by
inactivation of a small part.
– While an organ with very low tolerance maysustain loss of even large no. of subunits.

Digitally Reconstructed Radiograph-DRR
• A synthetic radiograph produced
by tracing ray-lines from a virtual
source position through the CT
data to a virtual film plane .
• It is analogous to conventional
simulation radiographs.
• DRR is used
– for treatment portal design
– for verification of treatment portal by
comparison with port films or
electronic portal images
– provides planar reference image for
transferring 3D treatment plan to
clinical setting

Digitally Composite Radiograph -DCR
• The digitally composite radiograph is a type of
DRR that allows different ranges of CT
numbers related to a certain tissue type to be
selectively suppressed or enhanced in the
image.
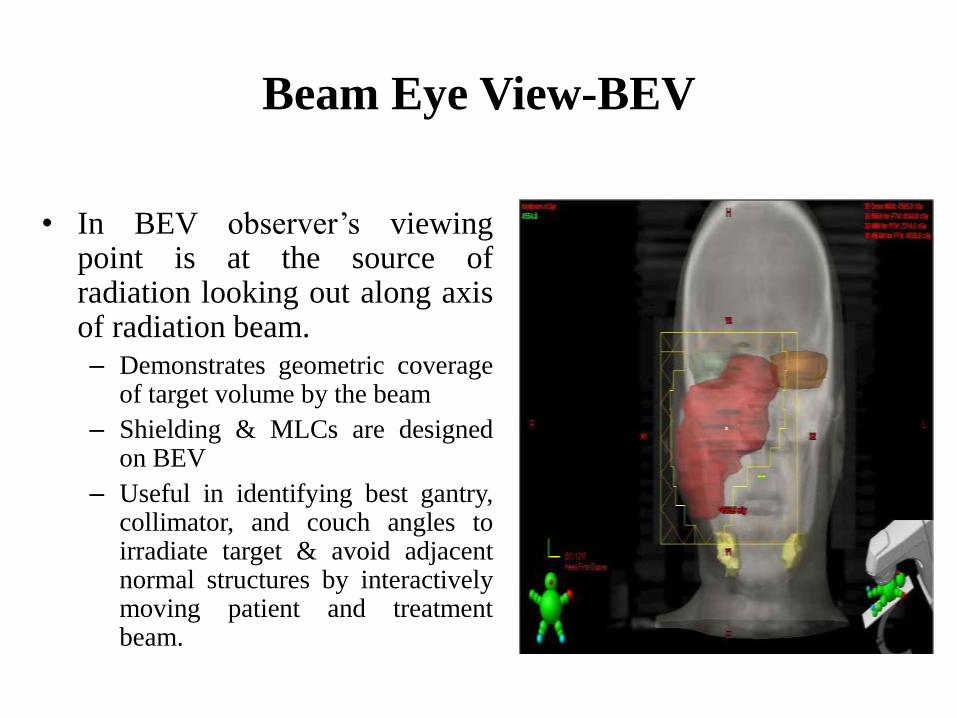
Beam Eye View-BEV
• In BEV observer’s viewingpoint is at the source ofradiation looking out along axisof radiation beam.
– Demonstrates geometric coverageof target volume by the beam
– Shielding & MLCs are designedon BEV
– Useful in identifying best gantry,collimator, and couch angles toirradiate target & avoid adjacentnormal structures by interactivelymoving patient and treatmentbeam.

Room Eye View-REV
• The REV display provides a
viewing point simulating any
arbitrary location within the
treatment room.
•
• The REV helps
– To better appreciate overall
treatment technique
geometry and placement of
the isocenter
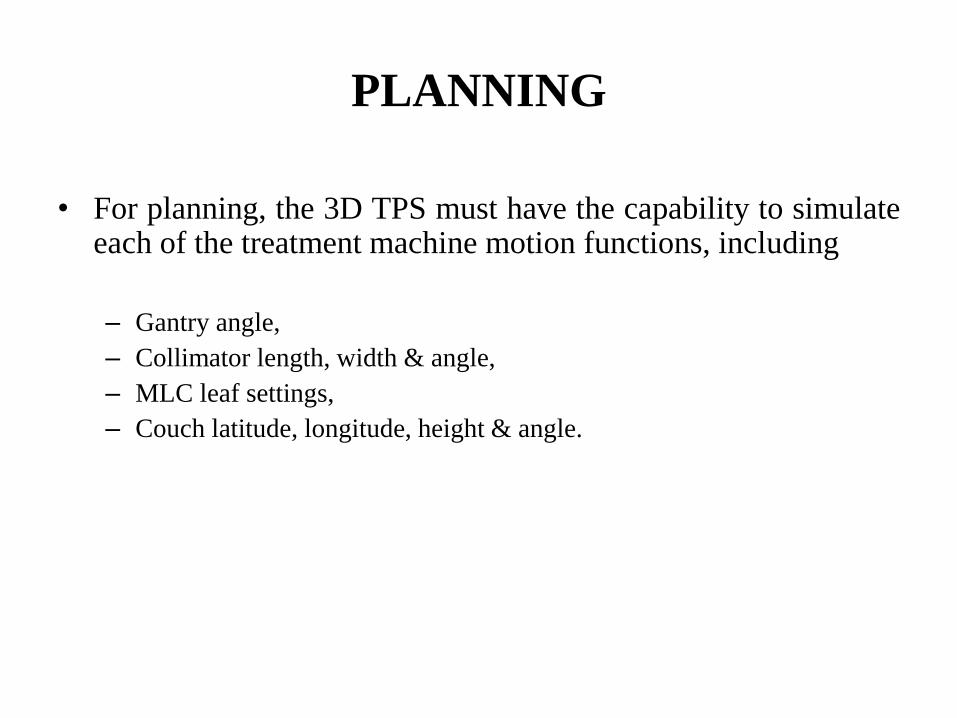
PLANNING
• For planning, the 3D TPS must have the capability to simulateeach of the treatment machine motion functions, including
– Gantry angle,
– Collimator length, width & angle,
– MLC leaf settings,
– Couch latitude, longitude, height & angle.

FORWARD PLANNING
• For 3D CRT forward planning is used.
• Beam arrangement is selected based on clinical experience.
• Using BEV, beam aperture is designed
• Dose is prescribed.
• 3D dose distribution is calculated.
• Then plan is evaluated.
• Plan is modified based on dose distribution evaluation, using
various combinations of
– Beam , collimator & couch angle,
– Beam weights &
– Beam modifying devices (wedges, compensators) to get desired dose
distribution.
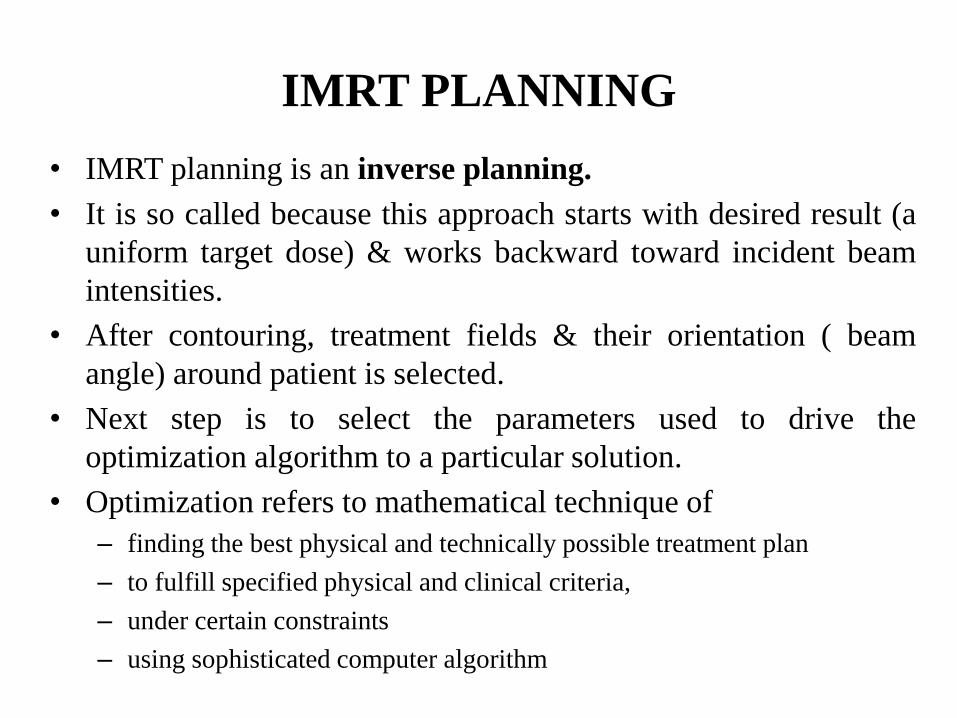
IMRT PLANNING
• IMRT planning is an inverse planning.
• It is so called because this approach starts with desired result (a
uniform target dose) & works backward toward incident beam
intensities.
• After contouring, treatment fields & their orientation ( beam
angle) around patient is selected.
• Next step is to select the parameters used to drive the
optimization algorithm to a particular solution.
• Optimization refers to mathematical technique of
– finding the best physical and technically possible treatment plan
– to fulfill specified physical and clinical criteria,
– under certain constraints
– using sophisticated computer algorithm
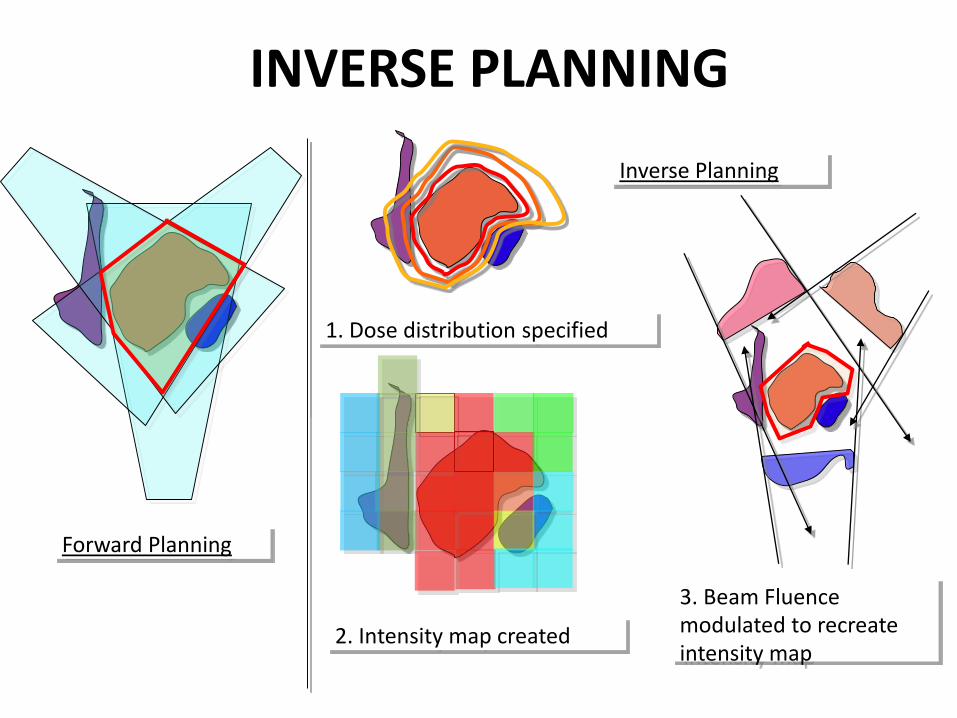
INVERSE PLANNING
1. Dose distribution specified
Forward Planning
2. Intensity map created
3. Beam Fluencemodulated to recreate intensity map
Inverse Planning

• Dose-volume constraints for the target andnormal tissues are entered into the optimizationprogram of TPS– Maximum and minimum target doses
– Maximum normal tissues doses
– Priority scores for target and normal tissues
• The dose prescription for IMRT is morestructured and complex than single-valuedprescription used in 3-D CRT & conventionalRT
• Ideally some dose value is prescribed to everyvoxel.

OPTIMIZATION
Refers to the technique of finding the best physical
and technically possible treatment plan to fulfill the
specified physical and clinical criteria.
A mathematical technique that aims to maximize (or
minimize) a score under certain constraints.
It is one of the most commonly used techniques for
inverse planning.
The objective of the Optimization process is to vary
the beam intensities so that the dose requirement is
best approximated.
This could be based on a ‘Cost Function’ - a figure of
merit based on the specification for target and sensitive
organ dose requirement.
Or simply trying to match the dose requirement
pattern.
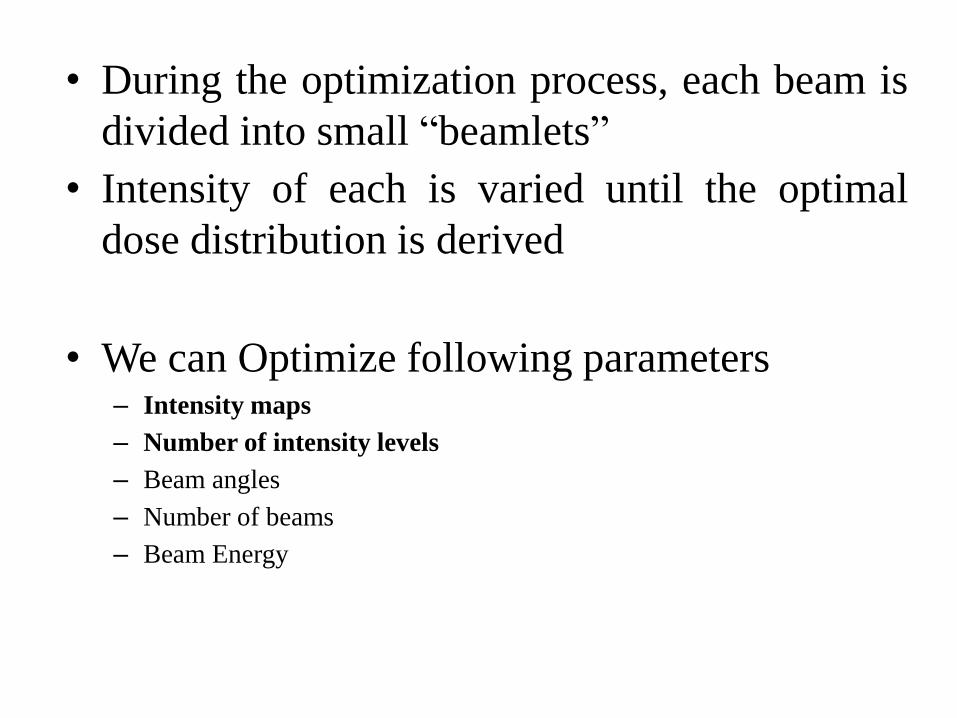
• During the optimization process, each beam is
divided into small “beamlets”
• Intensity of each is varied until the optimal
dose distribution is derived
• We can Optimize following parameters– Intensity maps
– Number of intensity levels
– Beam angles
– Number of beams
– Beam Energy

IMRT OPTIMIZATION ALGORITHMS
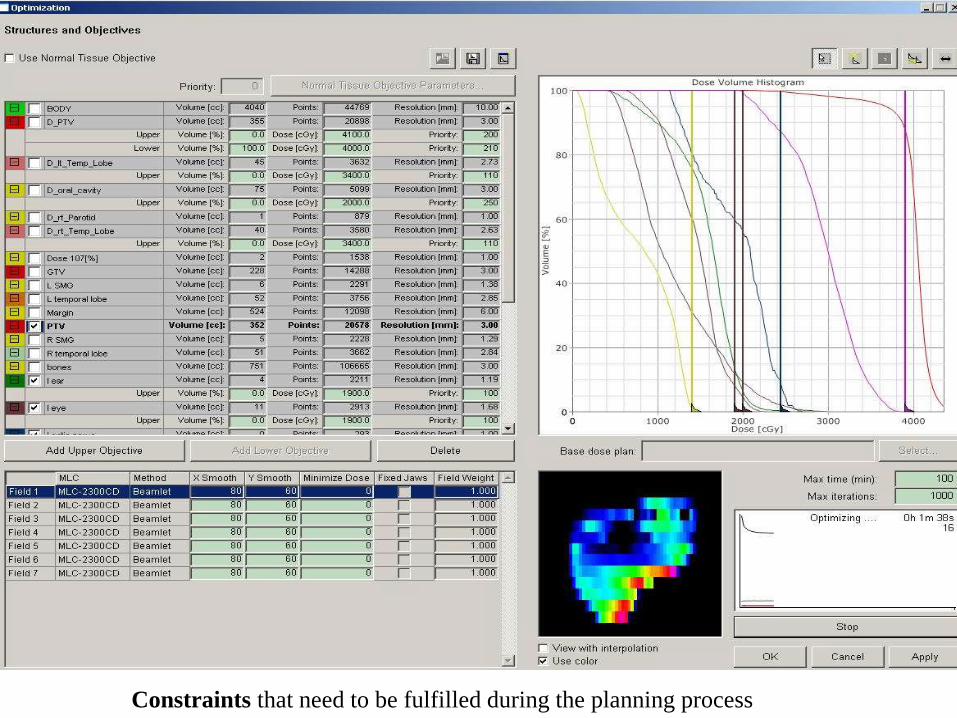
Constraints that need to be fulfilled during the planning process


Types:
Physical Optimization Criteria: Based on physical
dose coverage
Biological Optimization Criteria: Based on TCP
and NTCP calculation A total objective function (score) is then derived from these criteria.
Priorities are defined to tell the algorithm the relative importance of the
different planning objectives (penalties)
The algorithm attempts to maximize the score based on the criteria and
penalties.
PLAN EVALUATION
• The following tools are used in the evaluation
of the planned dose distribution:
– 2-D display
• Isodose lines
• Color wash
• DVHs (Dose volume histograms )
– Dose distribution statistics

2D EVALUATION
• Isodose lines superimposed onCT images
• Color wash - Spectrum of colorssuperimposed on the anatomicinformation represented bymodulation of intensity
– Gives quick over view of dosedistribution
– Easy to assess overdosage innormal tissue that are notcontoured.
– To assess dose heterogeneity insidePTV
• Slice by slice evaluation of dosedistribution can be done.

DOSE VOLUME HISTOGRAM - DVH
• DVHs summarize the information contained in
the 3-D dose distribution & quantitatively
evaluates treatment plans.
• DVHs are usually displayed in the form of ‘per
cent volume of total volume’ against dose.
• The DVH may be represented in two forms:
– Cumulative integral DVH
– Differential DVH.

CUMULATIVE DVH
• It is plot of volume of a given
structure receiving a certain
dose.
• Any point on the cumulative
DVH curve shows the volume
of a given structure that receives
the indicated dose or higher.
• It start at 100% of the volume
for zero dose, since all of the
volume receives at least more
than zero Gy.

DIFFERENTIAL DVH
• The direct or differential DVH isa plot of volume receiving a dosewithin a specified dose interval(or dose bin) as a function ofdose.
• It shows extent of dose variationwithin a given structure.
• The ideal DVH for a targetvolume would be a single columnindicating that 100% of volumereceives prescribed dose.
• For a critical structure, the DVHmay contain several peaksindicating that different parts ofthe organ receive different doses.
DVH - target vol.
DVH - OAR
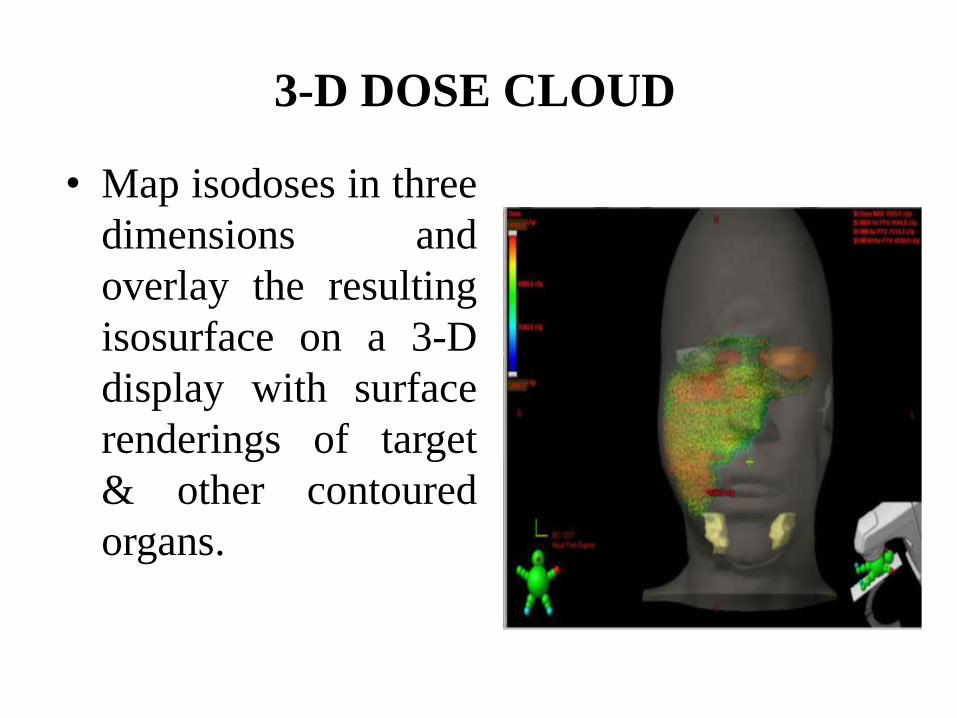
3-D DOSE CLOUD
• Map isodoses in three
dimensions and
overlay the resulting
isosurface on a 3-D
display with surface
renderings of target
& other contoured
organs.
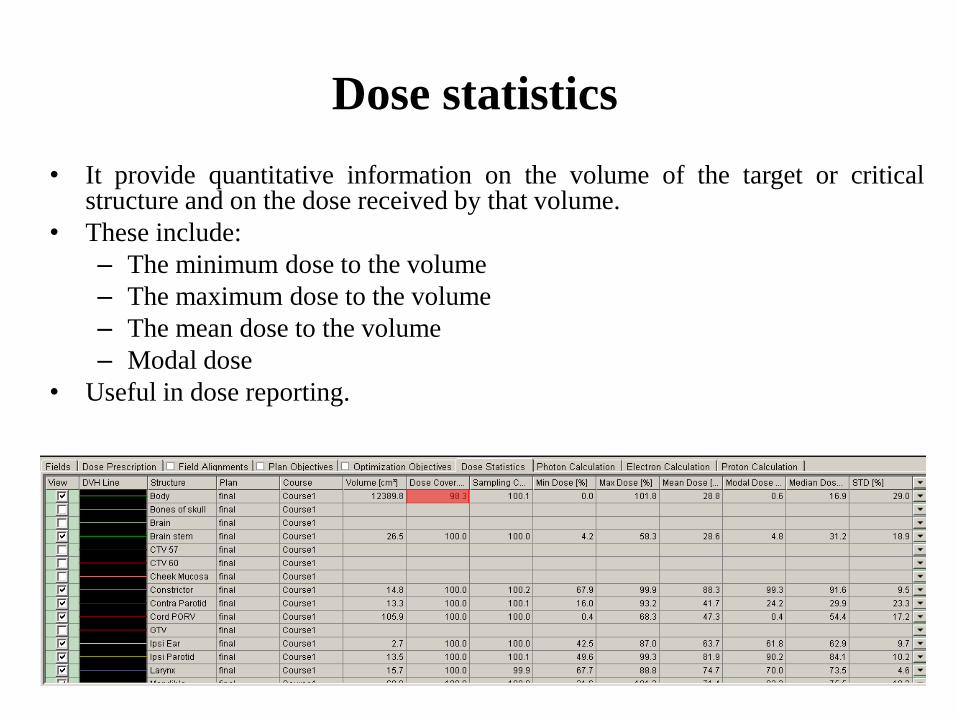
Dose statistics
• It provide quantitative information on the volume of the target or criticalstructure and on the dose received by that volume.
• These include:
– The minimum dose to the volume
– The maximum dose to the volume
– The mean dose to the volume
– Modal dose
• Useful in dose reporting.

PLAN EVALUATION
• The planned dose distribution approved by theradiation oncologist is one in which
– a uniform dose is delivered to the target volume(e.g., +7% and –5% of prescribed dose)
– with doses to critical structures held below sometolerance level specified by the radiation oncologist
• Acceptable dose distribution is one that differsfrom desired dose distribution
– within preset limits of dose and
– only in regions where desired dose distribution can’tbe physically achieved.

PLAN IMPLEMENTATION
• Once the treatment plan has been evaluated &approved, documentation for plan implementationmust be generated.
• It includes– beam parameter settings transferred to the treatment
machine’s record and verify system,
– MLC parameters communicated to computer systemthat controls MLC system of the treatment machine,
– DRR generation & printing or transfer to an imagedatabase.

IMRT PLAN VERIFICATION
• The goal is to verify that correct dose & dose distribution will be delivered to the patient.
• One needs to check that– the plan has been properly computed
– leaf sequence files & treatment parameters charted and/or stored in the R/V server are correct &
– plan will be executable.• Before first treatment, verification is done to check
– MU (or absolute dose to a point)
– MLC leaf sequences or fluence maps
– Dose distribution

PLAN VERIFICATION
• Specially designed IMRTphantoms are used.
• These phantoms have variousinhomogeneity built in thatallow verification not only ofIMRT plans but also of thealgorithm used for tissueinhomogeneity corrections.
• It is also possible, however, touse simple phantoms made ofLucite, polystyrene or otherwater equivalent materials, inwhich dosimeters can bepositioned.
IMRT PHANTOM
ionamatrixx
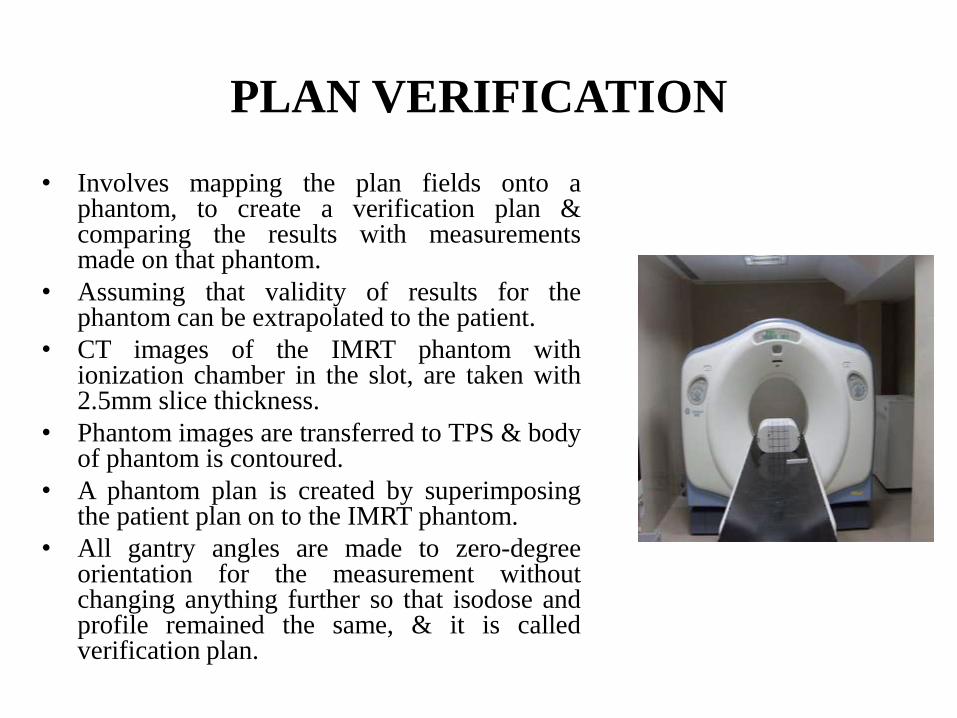
PLAN VERIFICATION
• Involves mapping the plan fields onto aphantom, to create a verification plan &comparing the results with measurementsmade on that phantom.
• Assuming that validity of results for thephantom can be extrapolated to the patient.
• CT images of the IMRT phantom withionization chamber in the slot, are taken with2.5mm slice thickness.
• Phantom images are transferred to TPS & bodyof phantom is contoured.
• A phantom plan is created by superimposingthe patient plan on to the IMRT phantom.
• All gantry angles are made to zero-degreeorientation for the measurement withoutchanging anything further so that isodose andprofile remained the same, & it is calledverification plan.


IMRT DELIVERY
• Having calculated the fluence distributions or
fluence maps for each field angle, one now needs
to have a means of delivering those fluence maps.
• Methods to deliver an IMRT treatment are:
– Compensator based IMRT
– Multileaf collimator (MLC) based
• Static or step & shoot mode
• Dynamic mode
– Intensity modulated arc therapy (IMAT)
– Tomotherapy

COMPENSATOR BASED IMRT
• compensators are used to modulate intensity.
• compensators must be constructed for each gantry positionemployed and then placed in the beam for each treatment.
• Adv. of physical attenuators are– Highest MU efficiency
– Devoid of problems such as• leaf positioning accuracy,
• interleaf leakage and
• intraleaf transmission,
• rounded leaf, and
• tongue-and-groove effect that are intrinsic to MLC systems.
• Disadv of physical attenuators– issues related to material choice, machining accuracy, and placement
accuracy.
– Labour intensive as each field has unique intensity map & requiresseparate compensator.


STEP & SHOOT IMRT
• In static or step & shoot mode the intensity modulated fields are deliveredwith a sequence of small segments or subfields, each subfield with a uniformintensity.
• The beam is only turned on when the MLC leaves are stationary in each of theprescribed subfield positions.
• Adv. of SMLC
– Simple concept resembles conventional treatment
– Easy to plan, deliver & to verify
– an interrupted treatment is easy to resume
– fewer MUs in comparison to DMLC
– less demanding in terms of QA
• Disadv. of SMLC
– Slow dose delivery (5 min/field)
– Hard on MLC hardware

Intesn
tiy
Distance
Since beam is interrupted
between movements
leakage radiation is less.
Easier to deliver and plan.
More time consuming

DYNAMIC MODE
• In the DMLC or sliding window mode, the leaves of MLC are
moving during irradiation i.e. each pair of opposing leaf sweeps
across target volume under computer control.
• Adv. Of DMLC
– Better dose homogeneity for target volumes
– Shorter treatment time for complex IM beams
• Disadv of DMLC
– More demanding in terms of QA
• leaf position (gap), leaf speed need to be checked
– Beam remains on throughout – leakage radiation increased
– Total MU required is more than that for SMLC
• increased leakage dose

Dynamic IMRT
Faster than Static IMRT
Smooth intensity modulation
acheived
Beam remains on throughout
– leakage radiation increased
More susceptible to tumor
motion related errors.
Additional QA required for
MLC motion accuracy.
Intesn
tiy
Distance
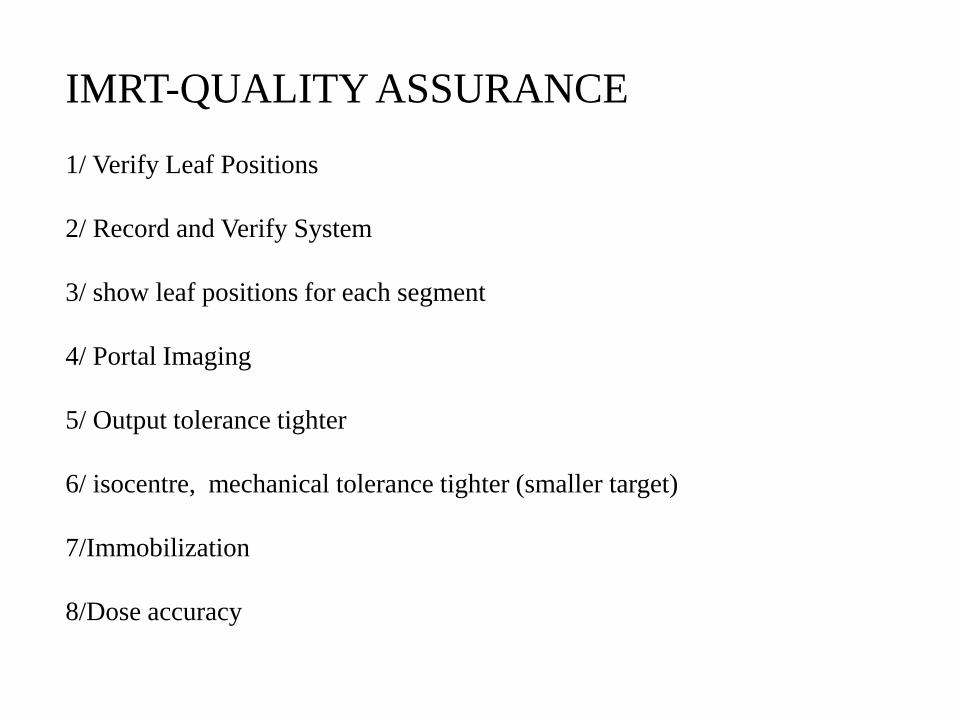
IMRT-QUALITY ASSURANCE
1/ Verify Leaf Positions
2/ Record and Verify System
3/ show leaf positions for each segment
4/ Portal Imaging
5/ Output tolerance tighter
6/ isocentre, mechanical tolerance tighter (smaller target)
7/Immobilization
8/Dose accuracy

TOMOTHERAPY
A form of IMRT using rotational fan beams
Uses slip ring rotating gantry
Treatment delivery by continuous gantry
rotation and treatment couch translation.
Delivered by two methods:
Slice based tomotherapy
Helical tomotherapy

.
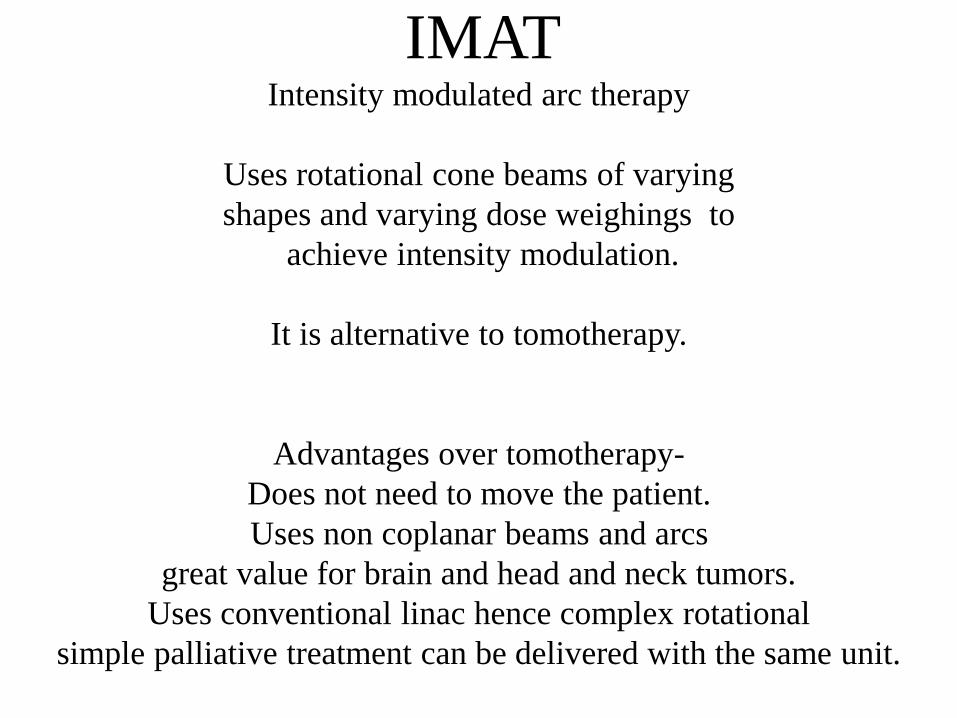
IMATIntensity modulated arc therapy
Uses rotational cone beams of varying
shapes and varying dose weighings to
achieve intensity modulation.
It is alternative to tomotherapy.
Advantages over tomotherapy-
Does not need to move the patient.
Uses non coplanar beams and arcs
great value for brain and head and neck tumors.
Uses conventional linac hence complex rotational
simple palliative treatment can be delivered with the same unit.

VMAT
•VOLUMETRIC MODULATED ARC THERAPY/ RAPID ARC
•Delivers a precisely sculpted 3D dose distribution with a single 360 degree
rotation of LIN-AC Gantry.
•Treatment Algorithm depends upon three parameters-
1/ Rotation speed of the Gantry.
2/ Shape of the treatment aperture using multileaf
collimator leaves.
3/ Delivery dose rates.
•Delivers dose to the whole volume, rather than slice by slice.
•Treatment planning algorithm ensures the treatment precision and helps to
spare the normal tissue.


TAKE HOME MESSAGE
3DCRT IMRT
Less Conformal More Conformal
No need of volume and OAR Target and OAR must be
specified
Forward Planning Inverse Planning
Uniform dose High Gradient dose
. Dose defined to volume but Isocenter dose undefined
specified at isocenter

3DCRT IMRT
Analogue dose distribution Digital dose distribution
No dose escalation More dose escalation
Target dose less homogenous Target dose more homogenous
No dose intensity modulation Dose intensity can be modulated within target
No sharp fall off sharp fall off PTV boundary

3DCRT IMRT
cannot avoid selectively selectively avoid
. critical structures and tissues
Exact solution Approximate solution
Less reduction of normal More reduction of normal
tissue dose tissue dose
creation of concave isodose
surface
Simultaneous integrated boost
More chances of geographical
miss of target
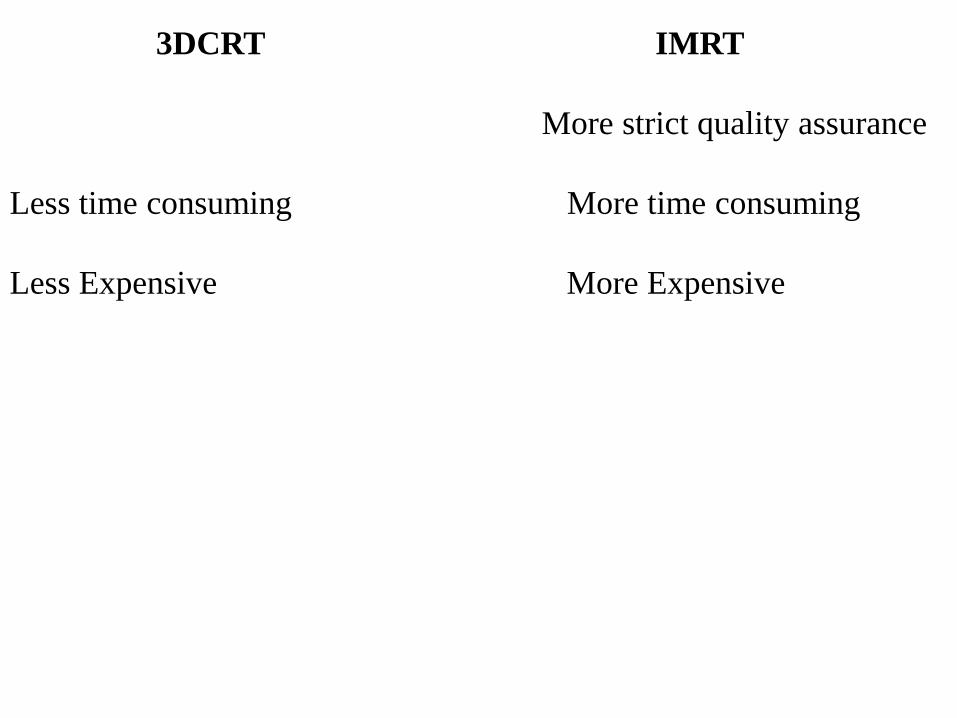
3DCRT IMRT
More strict quality assurance
Less time consuming More time consuming
Less Expensive More Expensive
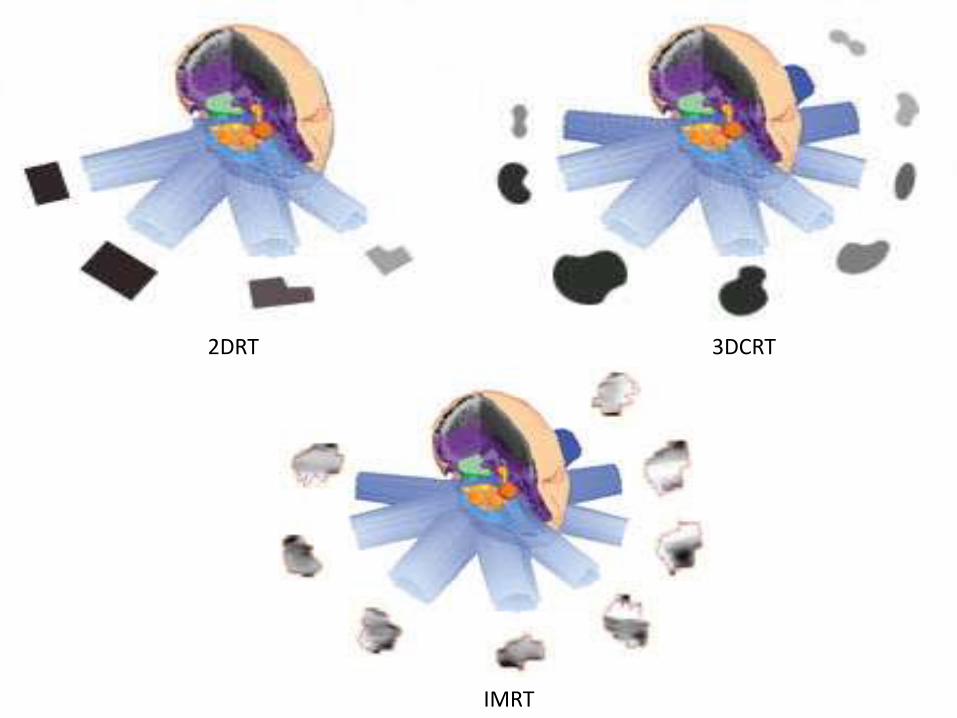
2DRT 3DCRT
IMRT


THANK YOU