ims q3 2011/media/files/r/rbs-ir/archived/q3... · rbs core operating profit of £1,264 million in...
TRANSCRIPT
Interim Management Statement
Q3 2011
rbs.com


Highlights
The Royal Bank of Scotland Group plc (RBS) reports a third quarter operating profit(1) of £267 million and a year to date operating profit of £2,138 million, up 15%
RBS core operating profit of £1,264 million in the third quarter and £5,033 million year-to-date Q3 attributable profit of £1,226 million after fair value of own debt credit of £2,357 million
Strong Core Tier 1 ratio increases to 11.3%; TNAV increases to 52.6p Funding and liquidity metrics continue to strengthen; loan:deposit ratio 112%, liquidity pool of
£170 billion Key highlights RBS successfully focused on maintaining a strong balance sheet during the volatile and uncertainmacroeconomic environment experienced in the third quarter. Capital, funding and liquidity metrics improved and remain robust. The decline in Core operating performance reflects a challenging quarter inGlobal Banking & Markets (GBM), which maintained a cautious risk appetite in a very subdued operating environment. Retail & Commercial maintained income in the quarter, and year-to-date profits for these businesses were up 9%. RBS Insurance maintained and built on its recovery, and Non-Core made further progress. Non-Core is on course to meet its year-end target of £96 billion of funded assets, a reduction ofover £40 billion during 2011. Core return on equity year-to-date is 12% despite continuing market, economic and regulatory headwinds.
• Income – Group income was £6,358 million in the third quarter, down 18% compared with the second quarter, driven by a decline in Non-Core income of over £900 million as valuation gains reported in the second quarter were not repeated. GBM income was down 29% at £1.1 billion in the third quarter, reflecting a cautious risk appetite and difficult market conditions.
• Expenses – Group third quarter operating expenses were £3,821 million, down 2% from the second quarter and down 6% year to date. The cost:income ratio was 62% in Core and 68% for the Group, reflecting the weaker revenue environment.
• Impairments – Impairments were £1,536 million in Q3 2011, down £728 million compared with Q2 2011 principally driven by lower provisions in Non-Core, which in Q2 2011 had recorded substantial provisions in respect of Irish development land values. Trends in most divisions remain broadly stable and comparable with the previous quarter.
• Balance sheet – The Group funded balance sheet fell by £16 billion during the quarter, with Non-Core down £8 billion and GBM down £20 billion. This was partially offset by an increase of £15 billion within Group Treasury due to a planned increase in the liquidity pool. The credit provision and coverage of risk elements in lending were maintained at Q2 levels.
• Funding and liquidity – The Group loan:deposit ratio (LDR) improved 200 basis points to 112%, with Core LDR at 95%. The Group has met its £23 billion 2011 term funding issuance target, and has increased its liquidity portfolio to £170 billion.
• Capital – Core Tier 1 ratio has improved further to 11.3%, with gross risk-weighted assets (RWAs)down by £17 billion in the quarter. The implementation of CRD 3 and Basel III is now expected to resultin uplifts to RWAs some £20 billion lower than previous estimates, due to mitigation, restructuring andcontinuing risk reduction in both GBM and Non-Core. Tangible equity increased by over £2 billion to£58 billion and TNAV increased by 2.3p to 52.6p, primarily as a result of FVOD.
Note: (1) Operating profit/(loss) before tax, movements in the fair value of own debt (FVOD), Asset Protection Scheme credit default swap - fair value changes,
Payment Protection Insurance costs, sovereign debt impairment and related interest rate hedge adjustments, amortisation of purchased intangible assets, integration and restructuring costs, gain on redemption of own debt, strategic disposals, bonus tax and RFS Holdings minority interest. Statutory operating profit before tax of £1,210 million for the nine months ended 30 September 2011.
i RBS Group – Q3 2011 Results
Key financial data Quarter ended Nine months ended
30 September
2011 30 June
2011 30 September
2010 30 September
2011 30 September
2010 £m £m £m £m £m
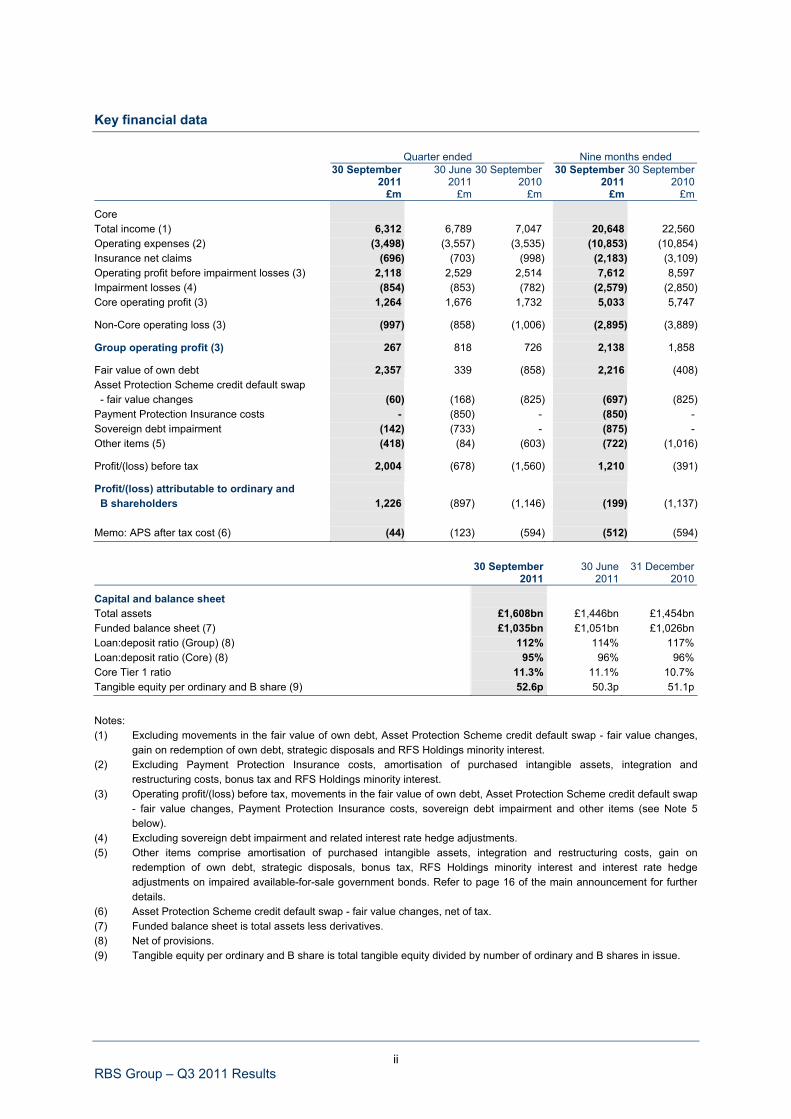
Core Total income (1) 6,312 6,789 7,047 20,648 22,560 Operating expenses (2) (3,498) (3,557) (3,535) (10,853) (10,854)Insurance net claims (696) (703) (998) (2,183) (3,109)Operating profit before impairment losses (3) 2,118 2,529 2,514 7,612 8,597 Impairment losses (4) (854) (853) (782) (2,579) (2,850)Core operating profit (3) 1,264 1,676 1,732 5,033 5,747
Non-Core operating loss (3) (997) (858) (1,006) (2,895) (3,889)
Group operating profit (3) 267 818 726 2,138 1,858
Fair value of own debt 2,357 339 (858) 2,216 (408)Asset Protection Scheme credit default swap - fair value changes (60) (168) (825) (697) (825)Payment Protection Insurance costs - (850) - (850) - Sovereign debt impairment (142) (733) - (875) - Other items (5) (418) (84) (603) (722) (1,016)
Profit/(loss) before tax 2,004 (678) (1,560) 1,210 (391)
Profit/(loss) attributable to ordinary and B shareholders 1,226 (897) (1,146) (199) (1,137) Memo: APS after tax cost (6) (44) (123) (594) (512) (594)
30 September
2011 30 June
2011 31 December
2010
Capital and balance sheet Total assets £1,608bn £1,446bn £1,454bn Funded balance sheet (7) £1,035bn £1,051bn £1,026bn Loan:deposit ratio (Group) (8) 112% 114% 117% Loan:deposit ratio (Core) (8) 95% 96% 96% Core Tier 1 ratio 11.3% 11.1% 10.7% Tangible equity per ordinary and B share (9) 52.6p 50.3p 51.1p
Notes: (1) Excluding movements in the fair value of own debt, Asset Protection Scheme credit default swap - fair value changes,
gain on redemption of own debt, strategic disposals and RFS Holdings minority interest. (2) Excluding Payment Protection Insurance costs, amortisation of purchased intangible assets, integration and
restructuring costs, bonus tax and RFS Holdings minority interest. (3) Operating profit/(loss) before tax, movements in the fair value of own debt, Asset Protection Scheme credit default swap
- fair value changes, Payment Protection Insurance costs, sovereign debt impairment and other items (see Note 5below).
(4) Excluding sovereign debt impairment and related interest rate hedge adjustments. (5) Other items comprise amortisation of purchased intangible assets, integration and restructuring costs, gain on
redemption of own debt, strategic disposals, bonus tax, RFS Holdings minority interest and interest rate hedgeadjustments on impaired available-for-sale government bonds. Refer to page 16 of the main announcement for furtherdetails.
(6) Asset Protection Scheme credit default swap - fair value changes, net of tax. (7) Funded balance sheet is total assets less derivatives. (8) Net of provisions. (9) Tangible equity per ordinary and B share is total tangible equity divided by number of ordinary and B shares in issue.
ii RBS Group – Q3 2011 Results

Comment Stephen Hester, Group Chief Executive, commented: “RBS’s third quarter results show the improved strength and resilience we have built up since 2008. They also highlight the external pressures facing banks, and economies more broadly, which are making the road to recovery longer and bumpier than hoped for. Service to customers remains at the top of RBS’s agenda. We care about our customers and the communities we serve and are part of. Across our businesses we have both the means and the will to meet creditworthy demand with lending and other support. We provided £28.5 billion of new lending in Q3 across both UK businesses and personal mortgages, again exceeding our natural customer market shares in each segment. In the face of eurozone turmoil and economic slowdown RBS has sustained its restructuring momentum. Our Core Tier 1 capital ratio is strong. Our loan:deposit ratio improved again, as did our liquidity position. Non-Core run-down is on-track for year end targets. Impairment charges fell, especially in Ireland. In common with other banks, the picture on profitability is mixed. Our Retail & Commercial businesses are holding up well with 16% return on equity for the quarter, excluding Ulster Bank. Forward momentum will be challenging, however, until the economies we serve see stronger growth. Our investment bank was only modestly profitable in the third quarter, performing in line with competitors. While we have been pleased with GBM’s risk management in volatile markets, we expect difficult conditions to continue in Q4. Losses in Non-Core are coming down year by year but will remain significant and volatile for a while longer. RBS will take clear action to adjust strategy where needed in the light of new economic and regulatory realities. The foundation established since 2009 helps us immeasurably. The path ahead is navigable, and we are committed to delivering the best of RBS for customers and shareholders.”
iii RBS Group – Q3 2011 Results

Highlights Third quarter results summary The Royal Bank of Scotland Group (RBS or the Group) reported an operating profit(1) of £267 million in the third quarter of 2011. Operating profit for the first nine months of 2011 was £2,138 million, compared with £1,858 million in the same period of 2010. The result reflects a challenging and uncertain economic environment, with the Group adopting a cautious approach by reducing its risk appetite and ensuring a strong and liquid balance sheet. The Group liquidity buffer was expanded from £155 billion to £170 billion and deposit growth remained a key strategic target, with the Group loan:deposit ratio improving to 112%, compared with 126% at 30 September 2010. Total funded assets were down £16 billion from Q2 and £44 billion from Q3 2010. Average value-at-risk in the Group’s Core businesses was £58.3 million in Q3 2011 compared with £123.8 million in Q3 2010. Retail & Commercial profitability was impacted by increased funding costs and impairments remaining high, particularly in Ulster Bank. Year-to-date return on equity was 17% excluding Ulster Bank, compared with 13% in the same period of 2010. In GBM, however, the subdued operating environment and lower risk appetite led to a year-to-date return on equity of 11%, compared with 19% in the prior year. Total Core return on equity in the first nine months was 12%, compared with 14% for the comparable period of 2010. Non-Core kept up good progress, reducing its funded balance sheet by £8 billion during Q3 2011 to £105 billion. The division remains on course to meet its year-end asset target of £96 billion. Significant non-operating items during Q3 2011 included a gain of £2,357 million on movements in the fair value of own debt, as the volatile market conditions led to a significant widening in the Group’s credit spreads during the quarter. This compared with a gain of £339 million in Q2 2011 and a charge of £858 million in Q3 2010. An additional impairment of £142 million was booked against the Group’s holdings of Greek sovereign bonds, which were marked at 37% of par value as at 30 September 2011. A further charge of £60 million (compared with £168 million in Q2 2011) was recorded in respect of the Asset Protection Scheme (APS), which is accounted for as a derivative, with changes in fair value booked each quarter. The cumulative APS charge now stands at £2.2 billion. After these and other charges RBS recorded a pre-tax profit of £2,004 million, compared with a loss of £678 million in Q2 2011. Profit before tax for the first nine months of 2011 was £1,210 million, compared with a loss of £391 million in the prior year. Net of tax and minority interests, Q3 2011 attributable profit was £1,226 million, compared with an attributable loss of £897 million in the second quarter. Income Group income totalled £6,358 million in Q3 2011, down 18% from the second quarter, driven primarily by a decline in Non-Core income as valuation gains booked in Q2 2011 were not repeated. Retail & Commercial income was flat at £4,171 million, with growth in US Retail & Commercial, Global Transaction Services and Ulster Bank offset by declines in UK Retail and UK Corporate. GBM income was 29% lower at £1,099 million, reflecting a cautious risk appetite in view of the difficult market conditions. (1) As defined on page i.
iv RBS Group – Q3 2011 Results
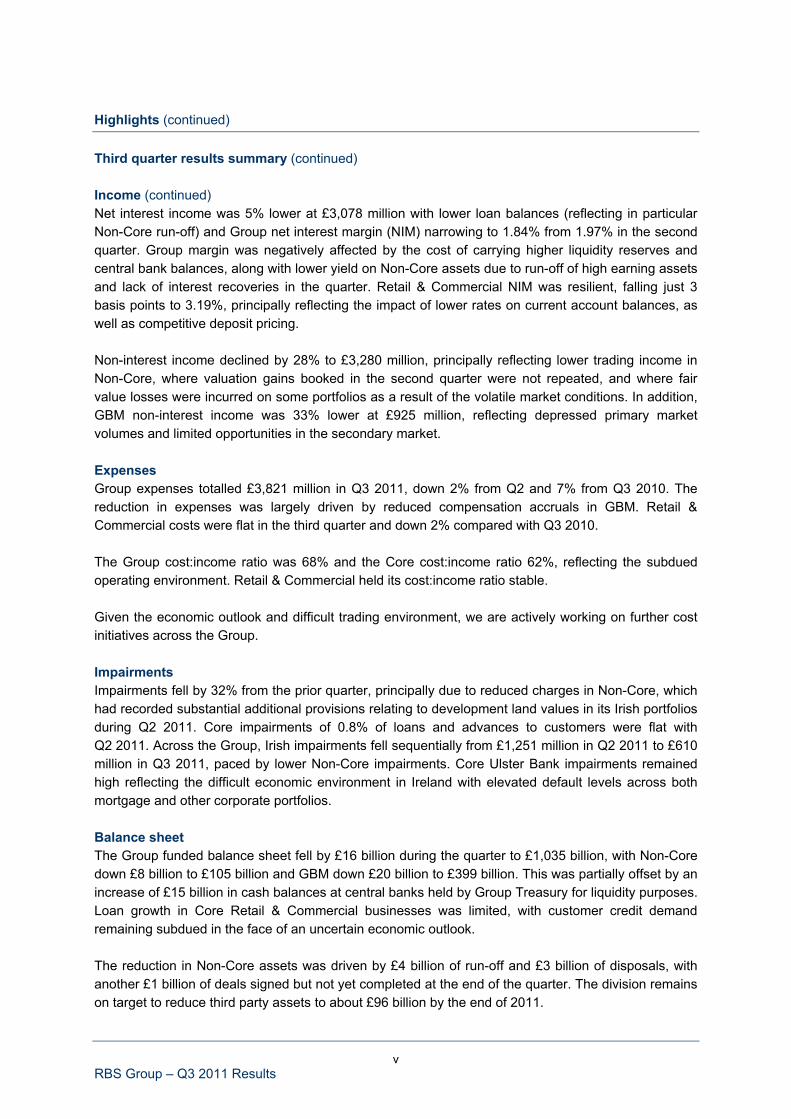
Highlights (continued) Third quarter results summary (continued) Income (continued) Net interest income was 5% lower at £3,078 million with lower loan balances (reflecting in particular Non-Core run-off) and Group net interest margin (NIM) narrowing to 1.84% from 1.97% in the second quarter. Group margin was negatively affected by the cost of carrying higher liquidity reserves and central bank balances, along with lower yield on Non-Core assets due to run-off of high earning assets and lack of interest recoveries in the quarter. Retail & Commercial NIM was resilient, falling just 3 basis points to 3.19%, principally reflecting the impact of lower rates on current account balances, as well as competitive deposit pricing. Non-interest income declined by 28% to £3,280 million, principally reflecting lower trading income in Non-Core, where valuation gains booked in the second quarter were not repeated, and where fair value losses were incurred on some portfolios as a result of the volatile market conditions. In addition, GBM non-interest income was 33% lower at £925 million, reflecting depressed primary market volumes and limited opportunities in the secondary market. Expenses Group expenses totalled £3,821 million in Q3 2011, down 2% from Q2 and 7% from Q3 2010. The reduction in expenses was largely driven by reduced compensation accruals in GBM. Retail & Commercial costs were flat in the third quarter and down 2% compared with Q3 2010. The Group cost:income ratio was 68% and the Core cost:income ratio 62%, reflecting the subdued operating environment. Retail & Commercial held its cost:income ratio stable. Given the economic outlook and difficult trading environment, we are actively working on further cost initiatives across the Group. Impairments Impairments fell by 32% from the prior quarter, principally due to reduced charges in Non-Core, which had recorded substantial additional provisions relating to development land values in its Irish portfolios during Q2 2011. Core impairments of 0.8% of loans and advances to customers were flat with Q2 2011. Across the Group, Irish impairments fell sequentially from £1,251 million in Q2 2011 to £610 million in Q3 2011, paced by lower Non-Core impairments. Core Ulster Bank impairments remained high reflecting the difficult economic environment in Ireland with elevated default levels across both mortgage and other corporate portfolios. Balance sheet The Group funded balance sheet fell by £16 billion during the quarter to £1,035 billion, with Non-Core down £8 billion to £105 billion and GBM down £20 billion to £399 billion. This was partially offset by an increase of £15 billion in cash balances at central banks held by Group Treasury for liquidity purposes. Loan growth in Core Retail & Commercial businesses was limited, with customer credit demand remaining subdued in the face of an uncertain economic outlook. The reduction in Non-Core assets was driven by £4 billion of run-off and £3 billion of disposals, with another £1 billion of deals signed but not yet completed at the end of the quarter. The division remains on target to reduce third party assets to about £96 billion by the end of 2011.
v RBS Group – Q3 2011 Results

Highlights (continued) Third quarter results summary (continued) Balance sheet (continued) The Group continues to be vigilant, and carefully monitors and controls country risk and exposures. Eurozone peripheral sovereign exposures have been substantially reduced and are at modest levels. Total exposures to central and local governments in Portugal, Greece, Italy, Spain and the Republic of Ireland have been reduced in 2011 from £4.6 billion to £1.1 billion (see pages 132 to 140). Our exposure to the Republic of Ireland is substantially funded domestically and is domiciled primarily in Ulster Bank, an in-market bank which has been established 175 years. Funding and liquidity The Group’s prudent approach during the third quarter’s uncertain market conditions was reflected in its strong funding and liquidity metrics. The Group loan:deposit ratio (LDR) improved again from 114% to 112%. The Core LDR also improved on the second quarter to 95%, principally reflecting a £5 billion increase in deposits. Short-term wholesale funding levels remained stable and the Group continues to access the markets as required, although consistent with the overall market, tenors are shorter. RBS has completed its £23 billion term funding issuance target for 2011, successfully issuing in the secured and private markets during the third quarter and October despite difficult market conditions. We will look to access the term markets opportunistically over the remainder of the year. The Group decided to increase its liquidity portfolio from £155 billion to £170 billion in view of the uncertain market environment. This portfolio substantially exceeds short-term wholesale funding, excluding derivatives collateral, of £141 billion. Capital The Core Tier 1 ratio remained strong at 11.3%. While gross risk-weighted assets (which excludes the benefit provided by APS) fell by £17 billion to £512 billion, this impact was partially offset by the attributable loss of £593 million, excluding FVOD. The Group’s TNAV increased from 50.3p to 52.6p during the quarter reflecting the reported attributable profit as well as positive movements in the available-for-sale (AFS) and cash flow hedging reserves, reflecting the decline in long-term interest rates. Strategy 2011 marks the halfway point of the Group’s five year recovery plan, adopted in 2009. Our plan’s three primary goals are to restore RBS to financial strength and stability; to support customers well (and better) across the Group’s core businesses; and to rebuild value for shareholders from the nadir reached in January 2009. RBS’s structural approach to these tasks has worked well. The identification of Core businesses to drive the Group’s recovery has been validated; the customer franchises have shown their strength. The Non-Core bank as the primary vehicle of risk reduction and reduction in strategic scope has also paid off.
vi RBS Group – Q3 2011 Results

Highlights (continued) Third quarter results summary (continued) Strategy (continued) The RBS Strategic Plan has met or exceeded all material targets to date. Over £600 billion of assets have come off the balance sheet. Capital and funding ratios have been transformed. £32 billion of pre-impairment profits have been generated by the Core businesses since the Plan’s inception. These have been necessary to absorb the loan losses and restructuring costs incurred in dealing with the Bank’s legacy risk positions, a task that is well advanced but by no means finished. At the same time, customer support has been uninterrupted and is improving in key areas. UK customer satisfaction has risen and is at the top end of competitor ratings, though further improvement remains important. Lending has been made available to meet demand, with RBS increasing market share in UK mortgages. In SME lending, the latest figures show RBS exceeding 40% of UK lending despite a much lower “natural” share of customer relationships (in the 20-30% range). We remain the only UK bank to guarantee the price and availability of SME overdraft facilities. Our Strategic Plan has anticipated many of the challenges in our operating environment and has proved resilient. However, two important developments require additional strategic response. Now that the Independent Commission on Banking (ICB) has published its final report, the future shape of UK banking regulation has become clearer. The Government’s formal response to the ICB is expected in December, but it has already indicated that it intends to implement the ICB’s recommendations, including the creation of a ring fence between different banking activities, and RBS is preparing for that outcome. Clearly, extensive engagement will be needed between Government, regulators and industry to sort out the myriad of operational details that are inherent in proposals on this scale and then to implement them. We anticipate that it will take most of the scheduled adjustment period to complete this. At the same time, the outlook for economic growth has been downgraded. Interest rates are likely to remain low for longer than originally forecast and markets appear likely to remain volatile for some time. We expect that unsecured wholesale funding availability for banks generally will remain scarcer and more expensive than in the past even when current uncertainties subside. The impact of these challenges will be felt by all banks. Taken together, the impact of the ICB’s ring-fencing proposals and changes in market and economic outlook will result in a further shift in the balance of RBS towards its retail and commercial businesses. It will drive a further shift in the Bank’s funding model to even greater deposit focus. We will pursue additional cost cutting to reduce the impact on customers and shareholders of the regulatory and market developments. We do expect that the higher equity capital requirements and other changes to funding structure that the ICB measures entail will be met organically during the adjustment period. RBS anticipates that it may take some years for the full implications of the ICB to be clear. It will also take time for the path of economic recovery to be more positive. This will mean RBS’s own restructuring is likely to take longer to produce the targeted results and those results will be impacted by these external events.
vii RBS Group – Q3 2011 Results

Highlights (continued) Third quarter results summary (continued) Strategy (continued) RBS remains on course to meet or exceed its extant targets for capital, risk and balance sheet, and committed to the goal of all its businesses being capable of generating returns in excess of their cost of equity. Achievement of return on equity consistent with this goal and the related cost:income ratio is likely to take longer than the 2013 date originally envisaged.
Key Measures Worst point YTD 2010 YTD 2011
2013 Target
Value drivers Core Core Core • Return on equity (1) (31%)(2) 14% 12% >15% • Cost:income ratio (3) 97%(4) 56% 59% <50%
Risk measures Group Group Group • Core Tier 1 ratio 4%(5) 10.2% 11.3% >8% • Loan:deposit ratio 154%(6) 126% 112% c.100% • Short-term wholesale funding (7) £297bn(8) £139bn £141bn <£125bn • Liquidity portfolio (9) £90bn(8) £151bn £170bn c.£150bn • Leverage ratio (10) 28.7x(11) 18.0x 17.5x <20x
Notes: (1) Based on indicative Core attributable profit taxed at 28% and Core average tangible equity per the average balance sheet (c.75% of Group tangible equity based on RWAs at 30 September 2011); (2) Group return on tangible equity for 2008; (3) Cost:income ratio net of insurance claims; (4) Year ended 31 December 2008; (5) As at 1 January 2008; (6) As at October2008; (7) Excluding derivatives collateral; (8) As at December 2008; (9) Eligible assets held for contingent liquidity purposes including cash, Government issued securities and other eligible securities with central banks; (10) Funded tangible assets divided by total Tier 1 capital; (11) As at June 2008.
viii RBS Group – Q3 2011 Results

Highlights (continued) Third quarter results summary (continued) Customer franchises RBS Group is committed to supporting customers well. Improving the services the Group provides its customers and improving the way in which those services are provided are key to achieving this. During the quarter UK Retail was awarded the “Best Financial Services Contact Centre in the UK” and “Best Large Contact Centre Organisation” accolades at the annual Customer Service Awards. To be recognised in this way is an important milestone in the division’s transformation programme, begun in 2010, and acts as further motivation in achieving its goal of becoming the UK’s most Helpful Bank. Global Transaction Services (GTS) and Citizens both launched new products aimed at helping their customers manage their money better and more efficiently. GTS customers can now benefit from a product improving their ability to effectively manage cash positions and make successful liquidity and investment decisions while, in the US, Citizens focused on the specific needs of its small business customers. The launch of its expense management product follows on from a mobile cash management product launched during Q2 and allows business owners to track spend on cards issued by the business in real time and set limits for employee spending. UK Corporate continued to promote its customer promise under the banner of Ahead for Business. By the end of Q3 for example, in addition to their regular customer visits, our relationship managers had spent over 600 additional days working in our customers’ businesses, to better understand how these businesses work and support them through the pressures and challenges they face, under our Working With You programme. In the current difficult markets it is especially important that customers are able to monitor their money and for GBM customers with money invested in turbulent markets this can be especially important. In September, GBM launched RBS Agile, an automated trading tool which uses client specified criteria to enact hedging trades as required, helping customers to automatically manage their foreign exchange risk and strategy. The Group recognises that there will always be more to achieve in customer satisfaction and product innovation but by focusing on the things that really matter to customers, it is moving in the right direction. UK Lending Q3 2011 was a difficult quarter for UK businesses, with weak macroeconomic news flows and the continuing sovereign debt crisis in the eurozone affecting confidence in future prospects and growth opportunities. In these conditions, RBS remains committed to serving its customers and the UK economy as a whole. In Q3 2011 RBS provided a total of £24.5 billion of new lending to UK business customers - more than £375 million every working day. That brings total new lending in the first nine months of 2011 to £68.7 billion. These totals lead the industry, substantially exceed RBS’s ‘natural’ share of customer relationships and underpin the Bank’s demonstrable commitment to supporting customers.
ix RBS Group – Q3 2011 Results

Highlights (continued) Third quarter results summary (continued) UK Lending (continued) Third quarter new business lending comprised £10.0 billion of new loans and facilities to mid and large corporates, £4.1 billion of mid-corporate overdraft renewals, £8.1 billion of new loans and facilities to SMEs and £2.3 billion of SME overdraft renewals. New SME lending in the first nine months of the year totalled £30.7 billion (£23.6 billion of new loans and facilities and £7.1 billion of overdraft renewals). The overall pattern of credit demand remained similar to the previous quarter. Mid and large corporate demand was robust and largely driven by refinancing, with businesses taking advantage of longer tenors available and opportunistically refinancing 2010 facilities at lower margins. Demand from SMEs remained more muted, with loan applications during the quarter down 12% from the prior year at 68,000. Approval rates remained above 85%. Most businesses remained focused on deleveraging. Repayments in the mid and large segments remained significant in the quarter, although mid corporate drawn balances remained stable in the quarter. SMEs also continued to pay down existing debt and focus on building up their cash balances, with Core drawn balances overall falling by 2% in the quarter and overall credit balances increasing £2 billion since the beginning of 2011. Overdraft utilisation remained below 50%, as it has consistently been since February 2010. In Q3 2011, average price of new SME lending was generally stable, averaging 3.77%. RBS continues with a range of measures to reinforce SMEs’ confidence that it is open for business including: • An overdraft price promise, which has seen SME customers save more than £250 million since
it was introduced in November 2008.
• Committed overdrafts (most banks’ overdrafts can be withdrawn on demand).
• Experienced specialist bankers to support struggling companies.
• Business support seminars for exporters.
• A Business Hotline, which will review the decision if a business has been turned down for aloan, by RBS or another bank.
• A Start-up Hotline, which provides advice for those considering starting up their own business.
• Targeted industry funds, focusing on areas such as franchising, manufacturing and renewableenergy.
On 3 November the Group launched a new loan product to support its SME customers with low fixed interest rates, no early repayment charges and, for a limited three month period, no initial fees. This offer responds to small businesses’ increasing concerns about investing in the face of significant uncertainty. This is part of our efforts to instil confidence in our small business customers and encourage them to speak to us about their investment plans.
x RBS Group – Q3 2011 Results

Highlights (continued) Third quarter results summary (continued) UK Lending (continued) Additionally, in the immediate aftermath of the August riots in London and other parts of England, the Group was quick to recognise the extra support its customers might need as a result, providing £10 million of interest free and fee-free loans to business customers affected by the rioting. RBS also contributed to the “High Street Fund”, in conjunction with other UK banks, to provide free cash support to small, independent traders to help them make repairs and get back to business. RBS also recognises the importance of providing mortgage lending to UK consumers. Gross new lending in Q3 2011 increased by 5% compared with Q2 to £4.0 billion. In the first nine months of 2011 net mortgage lending to UK households increased by over £3.8 billion to £103.1 billion. One in five of the new mortgages provided by the Group during Q3 2011 was to first time buyers. RBS continues to provide more new mortgage lending than its historic market share. Outlook External market and economic conditions in Q4 are expected to remain challenging. RBS will continue to prioritise a strong balance sheet with an appropriate capital, funding and liquidity position. We anticipate trends in our Core businesses broadly consistent with the third quarter. We expect to accelerate some Non-Core disposal losses to reduce RWAs in partial mitigation of Basel III implementation. Headline results will also be affected by volatility of own debt valuations and other non-operating items.
xi RBS Group – Q3 2011 Results

xii RBS Group – Q3 2011 Results
Contacts For analyst enquiries: Richard O’Connor Head of Investor Relations +44 (0) 20 7672 1758 For media enquiries: Group Media Centre +44 (0) 131 523 4205 Analysts’ presentation The Royal Bank of Scotland Group will be hosting a conference call and live audio webcast following the release of the results for the quarter ended 30 September 2011. The details are as follows: Date: Friday 4 November 2011
Time: 9.00am UK time
Webcast: www.rbs.com/ir
Dial in details:
International – +44 (0) 1452 568 172 UK Free Call – 0800 694 8082 US Toll Free – 1 866 966 8024
Slides Slides accompanying this document, which will not be formally presented at the analysts’ conference call, will be available on www.rbs.com/ir.
Financial supplement A financial supplement will be available on www.rbs.com/ir. This supplement shows published income and balance sheet financial information by quarter for the last nine quarters to assist analysts for modelling purposes.
Third quarter 2011 Results

1 RBS Group – Q3 2011 Results
Contents
Page
Forward-looking statements 3
Presentation of information 4
Results summary 5
Results summary - statutory 8
Summary consolidated income statement 9
Summary consolidated balance sheet 11
Analysis of results 12
Divisional performance 20 UK Retail 23 UK Corporate 27 Wealth 30 Global Transaction Services 33 Ulster Bank 35 US Retail & Commercial 38 Global Banking & Markets 43 RBS Insurance 46 Central items 50 Non-Core 51
Condensed consolidated income statement 58
Condensed consolidated statement of comprehensive income 59
Condensed consolidated balance sheet 60
Commentary on condensed consolidated balance sheet 61
Average balance sheet 63
Condensed consolidated statement of changes in equity 66
Notes 69

2 RBS Group – Q3 2011 Results
Contents (continued)
Page
Risk and balance sheet management 98
Capital 98
Funding and liquidity risk 102
Credit risk 111
Market risk 148
Additional information 153
Appendix 1 Income statement reconciliations
Appendix 2 Businesses outlined for disposal
Appendix 3 Additional risk management disclosures
Appendix 4 Asset Protection Scheme
Glossary of terms
3 RBS Group – Q3 2011 Results
Forward-looking statements Certain sections in this document contain ‘forward-looking statements’ as that term is defined in the United States Private Securities Litigation Reform Act of 1995, such as statements that include the words ‘expect’, ‘estimate’, ‘project’, ‘anticipate’, ‘believes’, ‘should’, ‘intend’, ‘plan’, ‘could’, ‘probability’, ‘risk’, ‘Value-at-Risk (VaR)’, ‘target’, ‘goal’, ‘objective’, ‘will’, ‘endeavour’, ‘outlook’, ‘optimistic’, ‘prospects’ and similar expressions or variations on such expressions. In particular, this document includes forward-looking statements relating, but not limited to: the Group’s restructuring plans, capitalisation, portfolios, net interest margin, capital ratios, liquidity, risk weighted assets, return on equity (ROE), profitability, cost:income ratios, leverage and loan:deposit ratios, funding and risk profile; certain ring-fencing proposals; the Group’s future financial performance; the level and extent of future impairments and write-downs, including sovereign debt impairments; the protection provided by the Asset Protection Scheme (APS); and the Group’s potential exposures to various types of market risks, such as interest rate risk, foreign exchange rate risk and commodity and equity price risk. These statements are based on current plans, estimates and projections, and are subject to inherent risks, uncertainties and other factors which could cause actual results to differ materially from the future results expressed or implied by such forward-looking statements. For example, certain market risk disclosures are dependent on choices about key model characteristics and assumptions and are subject to various limitations. By their nature, certain of the market risk disclosures are only estimates and, as a result, actual future gains and losses could differ materially from those that have been estimated. Other factors that could cause actual results to differ materially from those estimated by the forward-looking statements contained in this document include, but are not limited to: the full nationalisation of the Group or other resolution procedures under the Banking Act 2009; the global economic and financial market conditions and other geopolitical risks, and their impact on the financial industry in general and on the Group in particular; the financial stability of other financial institutions, and the Group’s counterparties and borrowers; the ability to complete restructurings on a timely basis, or at all, including the disposal of certain Non-Core assets and assets and businesses required as part of the EC State Aid restructuring plan; organisational restructuring, including any adverse consequences of a failure to transfer, or delay in transferring, certain businesses, assets and liabilities from RBS Bank N.V. to RBS plc; the ability to access sufficient funding to meet liquidity needs; the extent of future write-downs and impairment charges caused by depressed asset valuations; the inability to hedge certain risks economically; costs or exposures borne by the Group arising out of the origination or sale of mortgages or mortgage-backed securities in the United States; the value and effectiveness of any credit protection purchased by the Group; unanticipated turbulence in interest rates, yield curves, foreign currency exchange rates, credit spreads, bond prices, commodity prices, equity prices and basis, volatility and correlation risks; changes in the credit ratings of the Group; ineffective management of capital or changes to capital adequacy or liquidity requirements; changes to the valuation of financial instruments recorded at fair value; competition and consolidation in the banking sector; HM Treasury exercising influence over the operations of the Group; the ability of the Group to attract or retain senior management or other key employees; regulatory or legal changes (including those requiring any restructuring of the Group’s operations) in the United Kingdom, the United States and other countries in which the Group operates or a change in United Kingdom Government policy; changes to regulatory requirements relating to capital and liquidity; changes to the monetary and interest rate policies of central banks and other government and regulatory bodies; impairments of goodwill; pension fund shortfalls; litigation and regulatory investigations; general operational risks; insurance claims; reputational risk; changes in UK and foreign laws, regulations, accounting standards and taxes, including changes in regulatory capital regulations and liquidity requirements; the recommendations made by the UK Independent Commission on Banking and their potential implications; the participation of the Group in the APS and the effect of the APS on the Group’s financial and capital position; the ability to access the contingent capital arrangements with HM Treasury; the conversion of the B Shares in accordance with their terms; limitations on, or additional requirements imposed on, the Group’s activities as a result of HM Treasury’s investment in the Group; and the success of the Group in managing the risks involved in the foregoing. The forward-looking statements contained in this document speak only as of the date of this announcement, and the Group does not undertake to update any forward-looking statement to reflect events or circumstances after the date hereof or to reflect the occurrence of unanticipated events. The information, statements and opinions contained in this document do not constitute a public offer under any applicable legislation or an offer to sell or solicitation of any offer to buy any securities or financial instruments or any advice or recommendation with respect to such securities or other financial instruments.

4 RBS Group – Q3 2011 Results
Presentation of information The financial information on pages 5 to 57, prepared using the Group’s accounting policies, shows the underlying performance of the Group on a managed basis which excludes certain one-off and other items. This information is provided to give a better understanding of the results of the Group’s operations. Group operating profit on this basis excludes: • movements in the fair value of own debt;
• Asset Protection Scheme credit default swap - fair value changes;
• Payment Protection Insurance costs;
• sovereign debt impairment and related interest rate hedge adjustments;
• amortisation of purchased intangible assets;
• integration and restructuring costs;
• gain on redemption of own debt;
• strategic disposals;
• bonus tax; and
• RFS Holdings minority interest (RFS MI). Net interest margin The basis of calculating the net interest margin (NIM) was refined in Q1 2011 and reflects the actual number of days in each quarter. Group and divisional NIMs for 2010 have been re-computed on the new basis.

5 RBS Group – Q3 2011 Results
Results summary Quarter ended Nine months ended
30 September
2011 30 June
201130 September
2010 30 September
2011 30 September
2010 £m £m £m £m £m
Core Total income (1) 6,312 6,789 7,047 20,648 22,560 Operating expenses (2) (3,498) (3,557) (3,535) (10,853) (10,854)Insurance net claims (696) (703) (998) (2,183) (3,109)Operating profit before impairment losses (3) 2,118 2,529 2,514 7,612 8,597 Impairment losses (4) (854) (853) (782) (2,579) (2,850)Operating profit (3) 1,264 1,676 1,732 5,033 5,747
Non-Core Total income (1) 46 978 870 1,510 2,643 Operating expenses (2) (323) (335) (561) (981) (1,775)Insurance net claims (38) (90) (144) (256) (492)Operating (loss)/profit before impairment losses (3) (315) 553 165 273 376 Impairment losses (4) (682) (1,411) (1,171) (3,168) (4,265)Operating loss (3) (997) (858) (1,006) (2,895) (3,889)
Total Total income (1) 6,358 7,767 7,917 22,158 25,203 Operating expenses (2) (3,821) (3,892) (4,096) (11,834) (12,629)Insurance net claims (734) (793) (1,142) (2,439) (3,601)Operating profit before impairment losses (3) 1,803 3,082 2,679 7,885 8,973 Impairment losses (4) (1,536) (2,264) (1,953) (5,747) (7,115)Operating profit (3) 267 818 726 2,138 1,858 Fair value of own debt 2,357 339 (858) 2,216 (408)Asset Protection Scheme credit default swap - fair value changes (60) (168) (825) (697) (825)Payment Protection Insurance costs - (850) - (850) - Sovereign debt impairment (142) (733) - (875) - Other items (418) (84) (603) (722) (1,016)Profit/(loss) before tax 2,004 (678) (1,560) 1,210 (391) Memo: Profit/(loss) before tax, pre APS 2,064 (510) (735) 1,907 434
For definitions of the notes refer to page 7.

6 RBS Group – Q3 2011 Results
Results summary (continued) Quarter ended Nine months ended
Key metrics 30 September
2011 30 June
2011 30 September
2010 30 September
2011 30 September
2010
Performance ratios Core - Net interest margin 2.10% 2.18% 2.28% 2.18% 2.23% - Cost:income ratio (5) 62% 58% 58% 59% 56% - Return on equity 8.5% 11.7% 12.6% 11.7% 13.7% - Adjusted earnings per ordinary and B share from continuing operations - 0.7p 1.1p 1.3p 2.0p - Adjusted earnings per ordinary and B share from continuing operations assuming a normalised tax rate of 26.5% (2010 - 28.0%) 0.9p 1.1p 1.2p 3.4p 3.7p Non-Core - Net interest margin 0.43% 0.87% 1.04% 0.74% 1.18% - Cost:income ratio (5) nm 38% 77% 78% 83% Group - Net interest margin 1.84% 1.97% 2.03% 1.94% 2.00% - Cost:income ratio (5) 68% 56% 60% 60% 58% Continuing operations - Basic earnings/(loss) per ordinary and B share (6) 1.1p (0.8p) (1.1p) (0.2p) (0.5p) nm = not meaningful For definitions of the notes refer to page 7.

7 RBS Group – Q3 2011 Results
Results summary (continued)
30 September
2011 30 June
2011 Change 31 December
2010 Change
Capital and balance sheet Funded balance sheet (7) £1,035bn £1,051bn (2%) £1,026bn 1% Total assets £1,608bn £1,446bn 11% £1,454bn 11% Loan:deposit ratio - Core (8) 95% 96% (100bp) 96% (100bp)Loan:deposit ratio - Group (8) 112% 114% (200bp) 117% (500bp)Risk-weighted assets - gross £512bn £529bn (3%) £571bn (10%)Benefit of Asset Protection Scheme (APS) (£89bn) (£95bn) (6%) (£106bn) (16%)Risk-weighted assets - net of APS £423bn £434bn (3%) £465bn (9%)Total equity £79bn £76bn 4% £77bn 3% Core Tier 1 ratio* 11.3% 11.1% 20bp 10.7% 60bp Tier 1 ratio 13.8% 13.5% 30bp 12.9% 90bp Risk elements in lending (REIL) £43bn £42bn 2% £39bn 10% REIL as a % of gross loans and advances (9) 8.4% 8.3% 10bp 7.3% 110bp Tier 1 leverage ratio (10) 17.5x 17.8x (2%) 16.8x 4% Tangible equity leverage ratio (11) 5.7% 5.3% 40bp 5.5% 20bp Tangible equity per ordinary and B share (12) 52.6p 50.3p 5% 51.1p 3%
* Benefit of APS in Core Tier 1 ratio is 1.3% at 30 September 2011 (30 June 2011 - 1.3%; 31 December 2010 - 1.2%). Notes: (1) Excluding movements in the fair value of own debt, Asset Protection Scheme credit default swap - fair value changes,
gain on redemption of own debt, strategic disposals and RFS Holdings minority interest. (2) Excluding Payment Protection Insurance costs, amortisation of purchased intangible assets, integration and
restructuring costs, bonus tax and RFS Holdings minority interest. (3) Operating profit/(loss) before tax, movements in the fair value of own debt, Asset Protection Scheme credit default swap
- fair value changes, Payment Protection Insurance costs, sovereign debt impairment and related interest rate hedgeadjustments, amortisation of purchased intangible assets, integration and restructuring costs, gain on redemption of owndebt, strategic disposals, bonus tax and RFS Holdings minority interest.
(4) Excluding sovereign debt impairment and related interest rate hedge adjustments. (5) Cost:income ratio is based on total income and operating expenses as defined in (1) and (2) above and after netting
insurance claims against income. (6) Profit/(loss) from continuing operations attributable to ordinary and B shareholders divided by weighted average number
of ordinary and B shares in issue. Refer to page 76. (7) Funded balance sheet represents total assets less derivatives. (8) Net of provisions. (9) Gross loans and advances to customers include disposal groups and exclude reverse repurchase agreements. (10) Tier 1 leverage ratio is total tangible assets (after netting derivatives) divided by Tier 1 capital. (11) Tangible equity leverage ratio is total tangible equity divided by total tangible assets (after netting derivatives). (12) Tangible equity per ordinary and B share is total tangible equity divided by number of ordinary and B shares in issue.
8 RBS Group – Q3 2011 Results
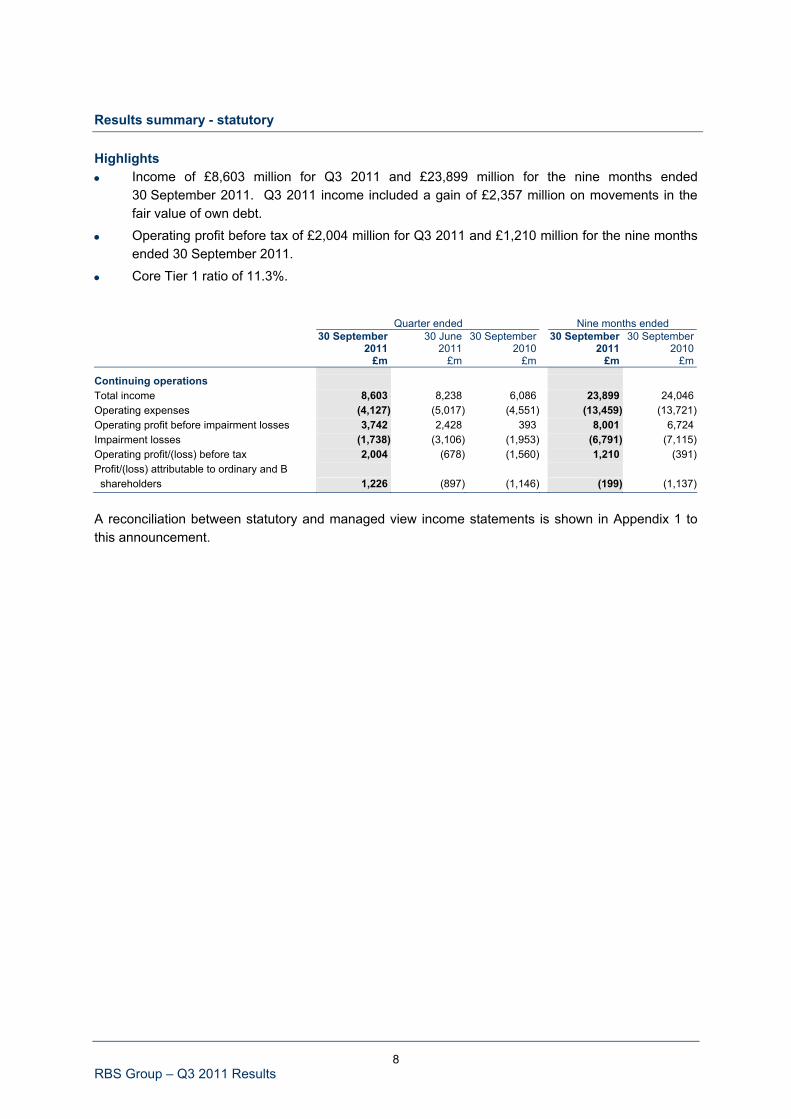
Results summary - statutory Highlights • Income of £8,603 million for Q3 2011 and £23,899 million for the nine months ended
30 September 2011. Q3 2011 income included a gain of £2,357 million on movements in thefair value of own debt.
• Operating profit before tax of £2,004 million for Q3 2011 and £1,210 million for the nine monthsended 30 September 2011.
• Core Tier 1 ratio of 11.3%. Quarter ended Nine months ended
30 September
2011 30 June
2011 30 September
2010 30 September
2011 30 September
2010 £m £m £m £m £m
Continuing operations Total income 8,603 8,238 6,086 23,899 24,046 Operating expenses (4,127) (5,017) (4,551) (13,459) (13,721)Operating profit before impairment losses 3,742 2,428 393 8,001 6,724 Impairment losses (1,738) (3,106) (1,953) (6,791) (7,115)Operating profit/(loss) before tax 2,004 (678) (1,560) 1,210 (391)Profit/(loss) attributable to ordinary and B shareholders 1,226 (897) (1,146) (199) (1,137)
A reconciliation between statutory and managed view income statements is shown in Appendix 1 to this announcement.

9 RBS Group – Q3 2011 Results
Summary consolidated income statement for the period ended 30 September 2011 In the income statement set out below, movements in the fair value of own debt, Asset Protection Scheme credit default swap - fair value changes, Payment Protection Insurance costs, sovereign debt impairment and related interest rate hedge adjustments, amortisation of purchased intangible assets, integration and restructuring costs, gain on redemption of own debt, strategic disposals, bonus tax and RFS Holdings minority interest are shown separately. In the statutory condensed consolidated income statement on page 58, these items are included in income and operating expenses as appropriate. Quarter ended Nine months ended
30 September
2011 30 June
2011 30 September
2010 30 September
2011 30 September
2010 Core £m £m £m £m £m
Net interest income 2,968 3,000 3,050 9,020 9,297
Non-interest income (excluding insurance net premium income) 2,352 2,794 2,888 8,630 9,928 Insurance net premium income 992 995 1,109 2,998 3,335
Non-interest income 3,344 3,789 3,997 11,628 13,263
Total income (1) 6,312 6,789 7,047 20,648 22,560 Operating expenses (2) (3,498) (3,557) (3,535) (10,853) (10,854)
Profit before other operating charges 2,814 3,232 3,512 9,795 11,706 Insurance net claims (696) (703) (998) (2,183) (3,109)
Operating profit before impairment losses (3) 2,118 2,529 2,514 7,612 8,597 Impairment losses (4) (854) (853) (782) (2,579) (2,850)
Operating profit (3) 1,264 1,676 1,732 5,033 5,747 Non-Core
Net interest income 110 233 354 593 1,325
Non-interest income (excluding insurance net premium income) (108) 650 336 640 797
Insurance net premium income 44 95 180 277 521
Non-interest income (64) 745 516 917 1,318
Total income (1) 46 978 870 1,510 2,643 Operating expenses (2) (323) (335) (561) (981) (1,775)
(Loss)/profit before other operating charges (277) 643 309 529 868 Insurance net claims (38) (90) (144) (256) (492)
Operating (loss)/profit before impairment losses (3) (315) 553 165 273 376 Impairment losses (4) (682) (1,411) (1,171) (3,168) (4,265)
Operating loss (3) (997) (858) (1,006) (2,895) (3,889)
For definitions of the notes refer to page 7.

10 RBS Group – Q3 2011 Results
Summary consolidated income statement for the period ended 30 September 2011 (continued) Quarter ended Nine months ended
30 September
2011 30 June
2011 30 September
2010 30 September
2011 30 September
2010 Total £m £m £m £m £m
Net interest income 3,078 3,233 3,404 9,613 10,622
Non-interest income (excluding insurance net premium income) 2,244 3,444 3,224 9,270 10,725 Insurance net premium income 1,036 1,090 1,289 3,275 3,856
Non-interest income 3,280 4,534 4,513 12,545 14,581
Total income (1) 6,358 7,767 7,917 22,158 25,203 Operating expenses (2) (3,821) (3,892) (4,096) (11,834) (12,629)
Profit before other operating charges 2,537 3,875 3,821 10,324 12,574 Insurance net claims (734) (793) (1,142) (2,439) (3,601)
Operating profit before impairment losses (3) 1,803 3,082 2,679 7,885 8,973 Impairment losses (4) (1,536) (2,264) (1,953) (5,747) (7,115)
Operating profit (3) 267 818 726 2,138 1,858 Fair value of own debt 2,357 339 (858) 2,216 (408)Asset Protection Scheme credit default swap - fair value changes (60) (168) (825) (697) (825)Payment Protection Insurance costs - (850) - (850) - Sovereign debt impairment (142) (733) - (875) - Amortisation of purchased intangible assets (69) (56) (123) (169) (273)Integration and restructuring costs (233) (208) (311) (586) (733)Gain on redemption of own debt 1 255 - 256 553 Strategic disposals (49) 50 27 (22) (331)Other (68) (125) (196) (201) (232)
Profit/(loss) before tax 2,004 (678) (1,560) 1,210 (391)Tax (charge)/credit (791) (222) 295 (1,436) (637)
Profit/(loss) from continuing operations 1,213 (900) (1,265) (226) (1,028)Profit/(loss) from discontinued operations, net of tax 6 21 18 37 (688)
Profit/(loss) for the period 1,219 (879) (1,247) (189) (1,716)Non-controlling interests 7 (18) 101 (10) 703 Preference share and other dividends - - - - (124)
Profit/(loss) attributable to ordinary and B shareholders 1,226 (897) (1,146) (199) (1,137)
For definitions of the notes refer to page 7.

11 RBS Group – Q3 2011 Results
Summary consolidated balance sheet at 30 September 2011
30 September
2011 30 June
2011 31 December
2010 £m £m £m
Loans and advances to banks (1) 52,602 53,133 57,911 Loans and advances to customers (1) 485,573 489,572 502,748 Reverse repurchase agreements and stock borrowing 102,259 98,135 95,119 Debt securities and equity shares 244,545 268,596 239,678 Other assets 150,405 141,661 131,043
Funded assets 1,035,384 1,051,097 1,026,499 Derivatives 572,344 394,872 427,077
Total assets 1,607,728 1,445,969 1,453,576 Bank deposits (2) 78,370 71,573 66,051 Customer deposits (2) 433,660 428,703 428,599 Repurchase agreements and stock lending 131,918 124,203 114,833 Settlement balances and short positions 66,478 79,011 54,109 Subordinated liabilities 26,275 26,311 27,053 Other liabilities 230,361 252,117 262,113
Funded liabilities 967,062 981,918 952,758 Derivatives 561,790 387,809 423,967
Total liabilities 1,528,852 1,369,727 1,376,725 Owners’ equity 77,443 74,744 75,132 Non-controlling interests 1,433 1,498 1,719
Total liabilities and equity 1,607,728 1,445,969 1,453,576 Memo: Tangible equity (3) 57,955 55,408 55,940 Notes: (1) Excluding reverse repurchase agreements and stock borrowing. (2) Excluding repurchase agreements and stock lending. (3) Tangible equity is equity attributable to ordinary and B shareholders less intangible assets.

12 RBS Group – Q3 2011 Results
Analysis of results Quarter ended Nine months ended
30 September
2011 30 June
2011 30 September
2010 30 September
2011 30 September
2010 Net interest income £m £m £m £m £m
Net interest income (1) 3,074 3,245 3,459 9,608 10,473
Average interest-earning assets 663,956 661,672 676,290 661,416 699,484
Net interest margin - Group 1.84% 1.97% 2.03% 1.94% 2.00% - Core - Retail & Commercial (2) 3.19% 3.22% 3.20% 3.23% 3.11% - Global Banking & Markets 0.71% 0.70% 1.13% 0.72% 1.09% - Non-Core 0.43% 0.87% 1.04% 0.74% 1.18% Notes: (1) For further analysis and details of adjustments refer to pages 64 and 65. (2) Retail & Commercial comprises the UK Retail, UK Corporate, Wealth, Global Transaction Services, Ulster Bank and US
Retail & Commercial divisions. Key points Q3 2011 compared with Q2 2011 • Group NIM was impacted by the cost of carrying higher liquidity portfolio and balances held at
central banks (3 basis points). Lower recoveries and run-off in Non-Core also negativelyimpacted Group NIM (6 basis points).
• R&C NIM fell 3 basis points, principally reflecting lower long-term swap yields on currentaccount balances and competitive deposit pricing. Front book asset margins in UK Retail andUK Corporate have continued to rebuild.
• Average interest-earning assets remained stable, as the build-up in the liquidity portfolio wasoffset by continued run-off of Non-Core.
Q3 2011 compared with Q3 2010 • R&C NIM remained essentially flat, with asset repricing offsetting the tightening of liability
margins to support the Group’s deposit-gathering targets.

13 RBS Group – Q3 2011 Results
Analysis of results (continued) Quarter ended Nine months ended
30 September
2011 30 June
201130 September
2010 30 September
2011 30 September
2010 Non-interest income £m £m £m £m £m
Net fees and commissions 1,148 1,377 1,433 3,907 4,379 Income from trading activities 547 1,204 1,432 3,241 5,159 Other operating income 549 863 359 2,122 1,187
Non-interest income (excluding insurance net premium income) 2,244 3,444 3,224 9,270 10,725 Insurance net premium income 1,036 1,090 1,289 3,275 3,856
Total non-interest income 3,280 4,534 4,513 12,545 14,581
Key points Q3 2011 compared with Q2 2011 • Non-interest income decreased by £1,254 million, 28%, principally reflecting lower trading
income in Non-Core and in GBM. In Non-Core, Q2 2011 had reflected significant valuationgains c.£0.5 billion which were not repeated in the third quarter. Also in Q3 2011 Non-Corerecorded net fair value losses on monoline related portfolios c.£0.2 billion.
• GBM’s non-interest income was 33% lower, reflecting depressed primary market volumes,limited opportunities in the secondary market and a cautious risk appetite.
• Insurance net premium income fell 5%, driven by continued run-off of legacy insurance policiesin Non-Core. Net premium income in RBS Insurance, at £990 million, remained largely flatquarter on quarter.
Q3 2011 compared with Q3 2010 • The 27% decline in non-interest income was largely driven by uncertain market conditions
during the quarter.
• Q3 2010 Non-Core trading results included some substantial valuation gains with tradingincome of £219 million in the quarter, compared with a loss of £246 million in Q3 2011.
• Insurance net premium income declined by 20%, driven by the run-off of legacy policies in Non-Core and an 8% decrease in RBS Insurance largely as a result of the de-risking of the motorbook and exit from unprofitable business lines.
14 RBS Group – Q3 2011 Results
Analysis of results (continued) Quarter ended Nine months ended
30 September
2011 30 June
2011 30 September
2010 30 September
2011 30 September
2010 Operating expenses £m £m £m £m £m
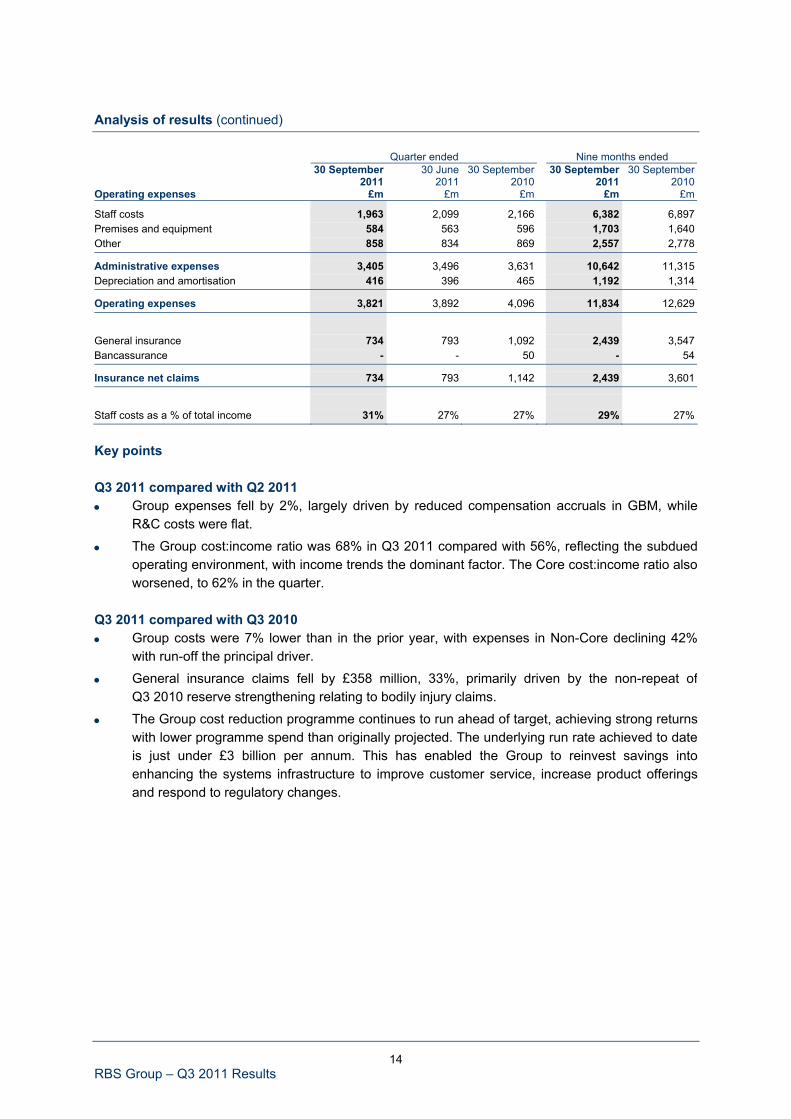
Staff costs 1,963 2,099 2,166 6,382 6,897 Premises and equipment 584 563 596 1,703 1,640 Other 858 834 869 2,557 2,778
Administrative expenses 3,405 3,496 3,631 10,642 11,315 Depreciation and amortisation 416 396 465 1,192 1,314
Operating expenses 3,821 3,892 4,096 11,834 12,629
General insurance 734 793 1,092 2,439 3,547 Bancassurance - - 50 - 54
Insurance net claims 734 793 1,142 2,439 3,601
Staff costs as a % of total income 31% 27% 27% 29% 27%
Key points Q3 2011 compared with Q2 2011 • Group expenses fell by 2%, largely driven by reduced compensation accruals in GBM, while
R&C costs were flat.
• The Group cost:income ratio was 68% in Q3 2011 compared with 56%, reflecting the subduedoperating environment, with income trends the dominant factor. The Core cost:income ratio alsoworsened, to 62% in the quarter.
Q3 2011 compared with Q3 2010 • Group costs were 7% lower than in the prior year, with expenses in Non-Core declining 42%
with run-off the principal driver.
• General insurance claims fell by £358 million, 33%, primarily driven by the non-repeat ofQ3 2010 reserve strengthening relating to bodily injury claims.
• The Group cost reduction programme continues to run ahead of target, achieving strong returnswith lower programme spend than originally projected. The underlying run rate achieved to dateis just under £3 billion per annum. This has enabled the Group to reinvest savings intoenhancing the systems infrastructure to improve customer service, increase product offeringsand respond to regulatory changes.

15 RBS Group – Q3 2011 Results
Analysis of results (continued) Quarter ended Nine months ended
30 September
2011 30 June
2011 30 September
2010 30 September
2011 30 September
2010 Impairment losses £m £m £m £m £m
Loan impairment losses 1,452 2,237 1,908 5,587 6,989 Securities impairment losses 84 27 45 160 126
Group impairment losses 1,536 2,264 1,953 5,747 7,115 Loan impairment losses - customers - latent (60) (188) 40 (355) (5) - collectively assessed 689 591 748 2,000 2,341 - individually assessed 823 1,834 1,120 3,942 4,653
Loan impairment losses 1,452 2,237 1,908 5,587 6,989
Core 817 810 779 2,479 2,825 Non-Core 635 1,427 1,129 3,108 4,164
Group 1,452 2,237 1,908 5,587 6,989 Customer loan impairment charge as a % of gross loans and advances (1) Group 1.1% 1.8% 1.4% 1.5% 1.7% Core 0.8% 0.8% 0.7% 0.8% 0.9% Non-Core 2.8% 6.0% 3.9% 4.6% 4.7% Note: (1) Gross loans and advances to customers include disposal groups and exclude reverse repurchase agreements. Key points Q3 2011 compared with Q2 2011 • Loan impairments fell 35% on the prior quarter to £1,452 million or 1.1% of gross loans and
advances to customers. Core impairments were largely flat on Q2 2011 with a small increase inRetail & Commercial being offset by a reduction in GBM.
• Non-Core’s Q3 2011 loan impairments fell £792 million on the previous quarter, primarilyreflecting a decline in impairments on the Ulster Bank portfolio, including a significantly reducedcharge for development land values in Ireland.
• The Retail & Commercial impairment uplift mainly reflected a £58 million increase in Core UlsterBank driven primarily by deteriorating mortgage metrics. Combined Ulster Bank (Core and Non-Core) impairments were £610 million, down 51% or £641 million from Q2 2011.
Q3 2011 compared with Q3 2010 • Core loan impairments were up 5% on Q3 2010, primarily driven by the increase in Ulster
Bank’s mortgage portfolio. GTS increased its provision on an existing single name impairment,while UK Corporate saw an increase in collective charges.
• The Group customer loan impairment charge as a percentage of loans and advances was 1.1%,compared with 1.4% in Q3 2010.
• Provision coverage of risk elements in lending was 49% at the end of Q3 2011, in line withQ3 2010.

16 RBS Group – Q3 2011 Results
Analysis of results (continued) Quarter ended Nine months ended
30 September
2011 30 June
2011 30 September
2010 30 September
2011 30 September
2010 One-off and other items £m £m £m £m £m
Fair value of own debt* 2,357 339 (858) 2,216 (408)Asset Protection Scheme credit default swap - fair value changes (60) (168) (825) (697) (825)Payment Protection Insurance costs - (850) - (850) - Sovereign debt impairment (1) (142) (733) - (875) - Other - Amortisation of purchased intangible assets (69) (56) (123) (169) (273) - Integration and restructuring costs (233) (208) (311) (586) (733) - Gain on redemption of own debt 1 255 - 256 553 - Strategic disposals** (49) 50 27 (22) (331) - Bonus tax (5) (11) (15) (27) (84) - RFS Holdings minority interest (3) (5) (181) (5) (148) - Interest rate hedge adjustments on impaired available-for-sale Greek government bonds (60) (109) - (169) -
1,737 (1,496) (2,286) (928) (2,249) * Fair value of own debt impact: Income from trading activities 470 111 (330) 395 (185)Other operating income 1,887 228 (528) 1,821 (223)
Fair value of own debt (FVOD) 2,357 339 (858) 2,216 (408) **Strategic disposals (Loss)/gain on sale and provision for loss on disposal of investments in: - RBS Asset Management’s investment strategies business - - - - 80 - Global Merchant Services - - - 47 - - Life assurance business - - - - (235) - Other (49) 50 27 (69) (176)
(49) 50 27 (22) (331)
Note: (1) The Group holds Greek government bonds with a notional amount of £1.45 billion. In the second quarter of 2011, the
Group recorded an impairment loss of £733 million in respect of these bonds as a result of Greece’s continuing fiscaldifficulties. This charge (c.50% of notional) wrote the bonds down to their market price as at 30 June 2011. In the thirdquarter of 2011, an additional impairment loss of £142 million was recorded to write the bonds down to their marketprice as at 30 September 2011 (c.37% of notional).
17 RBS Group – Q3 2011 Results
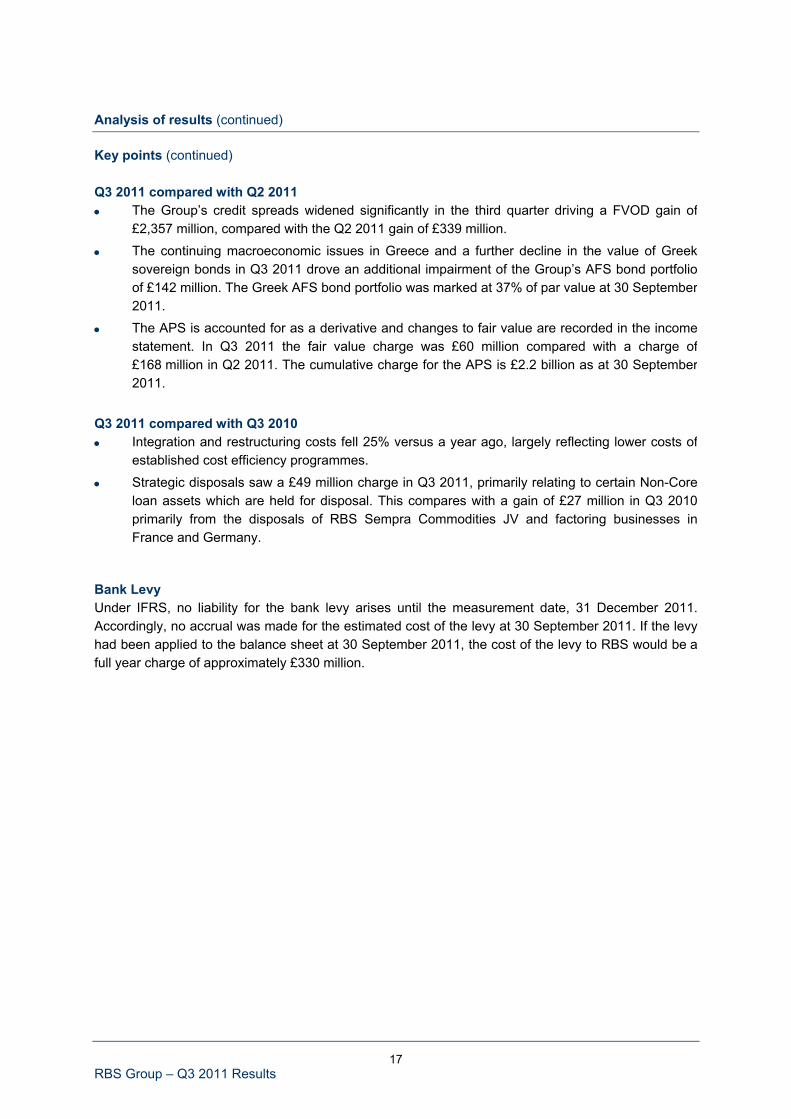
Analysis of results (continued) Key points (continued) Q3 2011 compared with Q2 2011 • The Group’s credit spreads widened significantly in the third quarter driving a FVOD gain of
£2,357 million, compared with the Q2 2011 gain of £339 million.
• The continuing macroeconomic issues in Greece and a further decline in the value of Greeksovereign bonds in Q3 2011 drove an additional impairment of the Group’s AFS bond portfolioof £142 million. The Greek AFS bond portfolio was marked at 37% of par value at 30 September2011.
• The APS is accounted for as a derivative and changes to fair value are recorded in the incomestatement. In Q3 2011 the fair value charge was £60 million compared with a charge of£168 million in Q2 2011. The cumulative charge for the APS is £2.2 billion as at 30 September2011.
Q3 2011 compared with Q3 2010 • Integration and restructuring costs fell 25% versus a year ago, largely reflecting lower costs of
established cost efficiency programmes.
• Strategic disposals saw a £49 million charge in Q3 2011, primarily relating to certain Non-Coreloan assets which are held for disposal. This compares with a gain of £27 million in Q3 2010primarily from the disposals of RBS Sempra Commodities JV and factoring businesses inFrance and Germany.
Bank Levy Under IFRS, no liability for the bank levy arises until the measurement date, 31 December 2011. Accordingly, no accrual was made for the estimated cost of the levy at 30 September 2011. If the levy had been applied to the balance sheet at 30 September 2011, the cost of the levy to RBS would be a full year charge of approximately £330 million.
18 RBS Group – Q3 2011 Results
Analysis of results (continued)
Capital resources and ratios 30 September
2011 30 June
2011 31 December
2010
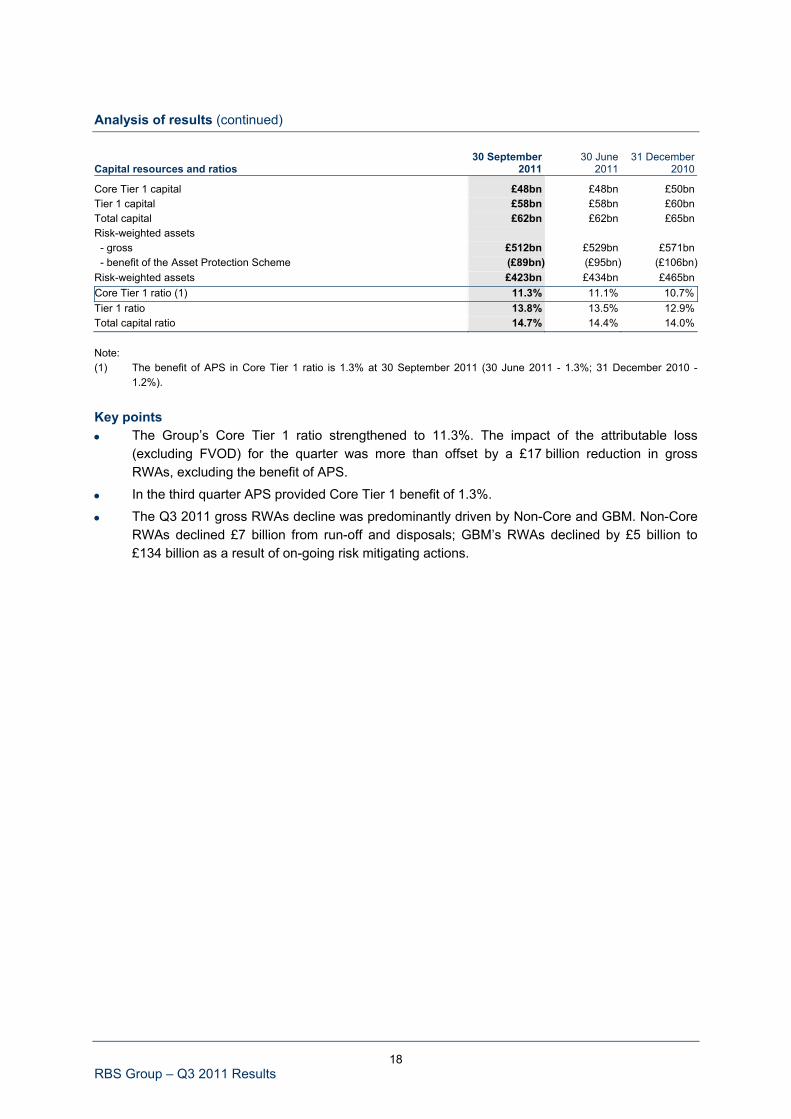
Core Tier 1 capital £48bn £48bn £50bn Tier 1 capital £58bn £58bn £60bn Total capital £62bn £62bn £65bn Risk-weighted assets - gross £512bn £529bn £571bn - benefit of the Asset Protection Scheme (£89bn) (£95bn) (£106bn)Risk-weighted assets £423bn £434bn £465bn Core Tier 1 ratio (1) 11.3% 11.1% 10.7% Tier 1 ratio 13.8% 13.5% 12.9% Total capital ratio 14.7% 14.4% 14.0% Note: (1) The benefit of APS in Core Tier 1 ratio is 1.3% at 30 September 2011 (30 June 2011 - 1.3%; 31 December 2010 -
1.2%). Key points • The Group’s Core Tier 1 ratio strengthened to 11.3%. The impact of the attributable loss
(excluding FVOD) for the quarter was more than offset by a £17 billion reduction in grossRWAs, excluding the benefit of APS.
• In the third quarter APS provided Core Tier 1 benefit of 1.3%.
• The Q3 2011 gross RWAs decline was predominantly driven by Non-Core and GBM. Non-CoreRWAs declined £7 billion from run-off and disposals; GBM’s RWAs declined by £5 billion to£134 billion as a result of on-going risk mitigating actions.

19 RBS Group – Q3 2011 Results
Analysis of results (continued)
Balance sheet 30 September
2011 30 June
2011 31 December
2010
Funded balance sheet £1,035bn £1,051bn £1,026bn Total assets £1,608bn £1,446bn £1,454bn Loans and advances to customers (1) £486bn £490bn £503bn Customer deposits (2) £434bn £429bn £429bn Loan:deposit ratio - Core (3) 95% 96% 96% Loan:deposit ratio - Group (3) 112% 114% 117%
Notes: (1) Excluding reverse repurchase agreements and stock borrowing. (2) Excluding repurchase agreements and stock lending. (3) Net of provisions. Key points • The Group’s Q3 2011 funded balance sheet decreased by £16 billion versus the prior quarter
to £1,035 billion. GBM’s funded balance sheet fell £20 billion to £399 billion while Non-Core’s steady progress in run-off and disposals during the quarter reduced its assets by a further £8 billion to £105 billion. Non-Core is well placed to reach its year end target of funded assets of £96 billion. A £15 billion increase in liquidity portfolio assets held by Group Treasury partially offset these asset declines.
• The Group’s total assets increased by £162 billion compared with Q2 2011 due to an increase in derivative fair values as a result of lower interest rates. Further discussion of derivatives is included on pages 121 to 125.
• Group customer deposits increased by £5 billion from Q2 2011, reflecting an increase in GBM and strong growth in both savings and current account balances in UK Retail. Loans and advances to customers fell in the third quarter as Non-Core continued to run down assets. In the core franchises there was modest loan growth in Wealth, US Retail & Commercial, GTS and GBM.
• The Q3 2011 Group loan:deposit ratio improved to 112% compared with 114% in Q2 2011. The Core loan:deposit ratio also improved to 95% versus 96% at Q2 2011.
Further discussion of the Group’s funding and liquidity position is included on pages 102 to 110.

20 RBS Group – Q3 2011 Results
Divisional performance The operating profit/(loss)(1) of each division is shown below.
Quarter ended Nine months ended
30 September
201130 June
2011 30 September
2010 30 September
2011 30 September
2010 £m £m £m £m £m
Operating profit/(loss) before impairment losses by division UK Retail 694 731 649 2,127 1,752 UK Corporate 529 563 580 1,690 1,672 Wealth 75 77 75 237 229 Global Transaction Services 240 218 312 665 827 Ulster Bank 108 80 110 272 295 US Retail & Commercial 199 193 198 582 654
Retail & Commercial 1,845 1,862 1,924 5,573 5,429 Global Banking & Markets 80 483 549 1,637 2,993 RBS Insurance 123 139 (33) 329 (286)Central items 70 45 74 73 461
Core 2,118 2,529 2,514 7,612 8,597 Non-Core (315) 553 165 273 376
Group operating profit before impairment losses 1,803 3,082 2,679 7,885 8,973 Impairment losses/(recoveries) by division UK Retail 195 208 251 597 938 UK Corporate 228 218 158 551 542 Wealth 4 3 1 12 12 Global Transaction Services 45 54 3 119 6 Ulster Bank 327 269 286 1,057 785 US Retail & Commercial 84 66 125 260 412
Retail & Commercial 883 818 824 2,596 2,695 Global Banking & Markets (32) 37 (40) (19) 156 Central items 3 (2) (2) 2 (1)
Core 854 853 782 2,579 2,850 Non-Core 682 1,411 1,171 3,168 4,265
Group impairment losses 1,536 2,264 1,953 5,747 7,115
Note: (1) Operating profit/(loss) before movements in the fair value of own debt, Asset Protection Scheme credit default swap -
fair value changes, Payment Protection Insurance costs, sovereign debt impairment and related interest rate hedgeadjustments, amortisation of purchased intangible assets, integration and restructuring costs, gain on redemption of owndebt, strategic disposals, bonus tax and RFS Holdings minority interest.

21 RBS Group – Q3 2011 Results
Divisional performance (continued) Quarter ended Nine months ended
30 September
2011 30 June
2011 30 September
2010 30 September
2011 30 September
2010 £m £m £m £m £m
Operating profit/(loss) by division UK Retail 499 523 398 1,530 814 UK Corporate 301 345 422 1,139 1,130 Wealth 71 74 74 225 217 Global Transaction Services 195 164 309 546 821 Ulster Bank (219) (189) (176) (785) (490)US Retail & Commercial 115 127 73 322 242
Retail & Commercial 962 1,044 1,100 2,977 2,734 Global Banking & Markets 112 446 589 1,656 2,837 RBS Insurance 123 139 (33) 329 (286)Central items 67 47 76 71 462
Core 1,264 1,676 1,732 5,033 5,747 Non-Core (997) (858) (1,006) (2,895) (3,889)
Group operating profit 267 818 726 2,138 1,858
Quarter ended Nine months ended
30 September
2011 30 June
2011 30 September
201030 September
2011 30 September
2010 % % % % %
Net interest margin by division UK Retail 3.90 4.00 3.99 3.98 3.87 UK Corporate 2.48 2.55 2.56 2.59 2.49 Wealth 3.46 3.61 3.41 3.51 3.40 Global Transaction Services 5.33 5.63 6.67 5.61 6.98 Ulster Bank 1.85 1.69 1.88 1.76 1.86 US Retail & Commercial 3.09 3.11 2.89 3.07 2.80
Retail & Commercial 3.19 3.22 3.20 3.23 3.11 Global Banking & Markets 0.71 0.70 1.13 0.72 1.09 Non-Core 0.43 0.87 1.04 0.74 1.18
Group net interest margin 1.84 1.97 2.03 1.94 2.00

22 RBS Group – Q3 2011 Results
Divisional performance (continued)
30 September
2011 30 June
2011 31 December
2010 £bn £bn Change £bn Change
Risk-weighted assets by division UK Retail 48.7 49.5 (2%) 48.8 -UK Corporate 75.7 77.9 (3%) 81.4 (7%)Wealth 13.0 12.9 1% 12.5 4%Global Transaction Services 18.6 18.8 (1%) 18.3 2%Ulster Bank 34.4 36.3 (5%) 31.6 9%US Retail & Commercial 56.5 54.8 3% 57.0 (1%)
Retail & Commercial 246.9 250.2 (1%) 249.6 (1%)Global Banking & Markets 134.3 139.0 (3%) 146.9 (9%)Other 9.8 11.8 (17%) 18.0 (46%)
Core 391.0 401.0 (2%) 414.5 (6%)Non-Core 117.9 124.7 (5%) 153.7 (23%)
Group before benefit of Asset Protection Scheme 508.9 525.7 (3%) 568.2 (10%)Benefit of Asset Protection Scheme (88.6) (95.2) (7%) (105.6) (16%)
Group before RFS Holdings minority interest 420.3 430.5 (2%) 462.6 (9%)RFS Holdings minority interest 3.0 3.0 - 2.9 3%
Group 423.3 433.5 (2%) 465.5 (9%)
For the purposes of the divisional return on equity ratios, notional equity has been calculated as a percentage of the monthly average of divisional risk-weighted assets, adjusted for capital deductions. Currently, 9% has been applied to the Retail & Commercial divisions and 10% to Global Banking & Markets. However, these will be subject to modification as the final Basel III rules and ICB recommendations are considered. Employee numbers by division (full time equivalents in continuing operations rounded to the nearest hundred)
30 September 2011
30 June 2011
31 December 2010
UK Retail 27,900 27,900 28,200 UK Corporate 13,600 13,400 13,100 Wealth 5,600 5,500 5,200 Global Transaction Services 2,700 2,700 2,600 Ulster Bank 4,400 4,300 4,200 US Retail & Commercial 15,300 15,200 15,700
Retail & Commercial 69,500 69,000 69,000 Global Banking & Markets 18,900 19,000 18,700 RBS Insurance 15,200 14,600 14,500 Group Centre 6,100 5,100 4,700
Core 109,700 107,700 106,900 Non-Core 5,300 6,300 6,900
115,000 114,000 113,800 Business Services 34,200 33,500 34,400 Integration 1,100 800 300
Group 150,300 148,300 148,500
The increase in Group employee numbers primarily reflects project staff employed to meet the short-term demands of the Group’s change and customer service related programmes. The increase is temporary, and we expect a decline in Q4 2011, and further into 2012, due to the Group’s on-going cost reduction programmes.

23 RBS Group – Q3 2011 Results
UK Retail Quarter ended Nine months ended
30 September
2011 30 June
2011 30 September
2010 30 September
2011 30 September
2010 £m £m £m £m £m
Income statement Net interest income 1,074 1,086 1,056 3,236 2,990
Net fees and commissions 259 295 262 824 784 Other non-interest income (net of insurance claims) 33 38 65 105 182
Non-interest income 292 333 327 929 966
Total income 1,366 1,419 1,383 4,165 3,956
Direct expenses - staff (206) (218) (226) (639) (681) - other (102) (106) (134) (321) (409)Indirect expenses (364) (364) (374) (1,078) (1,114)
(672) (688) (734) (2,038) (2,204)
Operating profit before impairment losses 694 731 649 2,127 1,752Impairment losses (195) (208) (251) (597) (938)
Operating profit 499 523 398 1,530 814 Analysis of income by product Personal advances 260 278 248 813 718 Personal deposits 236 257 277 747 831 Mortgages 576 581 527 1,700 1,427 Cards 231 243 243 712 711 Other, including bancassurance 63 60 88 193 269
Total income 1,366 1,419 1,383 4,165 3,956 Analysis of impairments by sector Mortgages 34 55 55 150 147 Personal 120 106 150 321 551 Cards 41 47 46 126 240
Total impairment losses 195 208 251 597 938 Loan impairment charge as % of gross customer loans and advances (excluding reverse repurchase agreements) by sector Mortgages 0.1% 0.2% 0.2% 0.2% 0.2% Personal 4.7% 3.9% 4.8% 4.2% 5.9% Cards 2.9% 3.4% 3.0% 3.0% 5.2%
Total 0.7% 0.8% 0.9% 0.7% 1.2%

24 RBS Group – Q3 2011 Results
UK Retail (continued) Key metrics Quarter ended Nine months ended
30 September
2011 30 June
2011 30 September
2010 30 September
2011 30 September
2010
Performance ratios Return on equity (1) 26.7% 27.6% 21.2% 26.8% 14.1% Net interest margin 3.90% 4.00% 3.99% 3.98% 3.87% Cost:income ratio 49% 48% 51% 49% 55% Adjusted cost:income ratio (2) 49% 48% 53% 49% 56%
30 September
2011 30 June
2011 31 December
2010 £bn £bn Change £bn Change
Capital and balance sheet Loans and advances to customers (gross) - mortgages 94.2 94.0 - 90.6 4% - personal 10.3 10.8 (5%) 11.7 (12%) - cards 5.6 5.6 - 6.1 (8%)
110.1 110.4 - 108.4 2% Customer deposits (excluding bancassurance) 98.6 95.9 3% 96.1 3% Assets under management (excluding deposits) 5.6 5.8 (3%) 5.7 (2%)Risk elements in lending 4.7 4.6 2% 4.6 2% Loan:deposit ratio (excluding repos) 109% 112% (300bp) 110% (100bp)Risk-weighted assets 48.7 49.5 (2%) 48.8 - Notes: (1) Divisional return on equity is based on divisional operating profit after tax divided by average notional equity (based on
9% of the monthly average of divisional RWAs, adjusted for capital deductions). (2) Adjusted cost:income ratio is based on total income after netting insurance claims and operating expenses. Key points UK Retail’s transformation into the UK’s most helpful and sustainable bank picked up speed during Q3 2011, with good progress on reducing branch queuing, improving telephone services and reducing complaints. With an uncertain economic environment and difficult financial market conditions across Europe, the third quarter was characterised by an additional focus on deposit gathering. UK Retail achieved good balance growth during the period, including successful fixed rate bond sales, though in a competitive pricing environment this growth came at the cost of margin. There has been positive feedback from RBS customers following the introduction of the facility to obtain emergency cash and on the new packaged accounts. UK Retail continued to develop mobile banking applications and online functionality by developing iPad, Blackberry and Android applications for customers.

25 RBS Group – Q3 2011 Results
UK Retail (continued) Key points (continued) Q3 2011 compared with Q2 2011 • Operating profit of £499 million in Q3 2011 was £24 million lower than in the previous quarter.
Income fell 4%, £53 million, though this was partly offset by a reduction in costs of 2%,£16 million and impairment losses of 6%, £13 million. Return on equity was 26.7% comparedwith 27.6% in Q2 2011.
• UK Retail achieved strong customer deposit growth of £2.7 billion in the quarter. Fixed ratebond offerings helped deliver strong savings deposit balance growth in Q3 2011. Mortgagebalances increased marginally in the quarter and RBS’s share of gross new lending was 8% inthe quarter, in line with its share of stock, at 8%. Unsecured lending declined 3% in the quarteras the Group continue to focus on lower risk secured lending. Strong deposit growth contributedto the fall in the loan to deposit ratio to 109%.
• Net interest income fell 1%, £12 million in the quarter driven by a fall in deposit income due tocontinued lower long-term swap rate returns on current account balances and strong savingsbalance growth. Net interest margin declined 10 basis points to 3.90% driven by this reductionin the liability margin.
• Non-interest income declined by 12%, £41 million, on Q2 2011 driven by reductions intransactional fees, and investment product related income. Seasonal factors, largely related toISA sales, attributed to an uplift in income in Q2 2011, which was not repeated in Q3 2011. Non-interest income was further negatively impacted by lower consumer spending and investmentconfidence in Q3 2011, linked to the current state of the economy and the market, respectively.
• Overall expenses decreased by 2%, or £16 million quarter on quarter. Direct costs fell by 5%due to headcount reductions and continued efficiency benefits. Indirect costs remained flat,reflecting high inflationary increases in utility and mail costs offset by further cost savinginitiatives.
• Impairment losses fell by 6% or £13 million during the period. ○ Mortgage impairment losses were £34 million on a total book of £94 billion, a £21 million
reduction quarter-on-quarter. Arrears rates were stable and remained below the Council ofMortgage Lenders industry average.
○ The unsecured portfolio impairment charge increased 5% to £161 million, on a book of almost £16 billion, as there were lower provision surplus releases on the already defaultedbook compared with Q2 2011. Underlying default levels were slightly lower quarter-on-quarter. Industry benchmarks for cards arrears remain stable, with RBS continuing toperform better than the market.
• Risk-weighted assets decreased 2% in the quarter, primarily reflecting lower balances andimproved quality within the unsecured portfolio, partly offset by volume growth in lower risksecured mortgages.
26 RBS Group – Q3 2011 Results
UK Retail (continued) Key points (continued) Q3 2011 compared with Q3 2010 • Operating profit increased by £101 million, with income down 1%, costs down 8% and
impairments 22% lower than in Q3 2010.
• Net interest income was 2% higher than Q3 2010, with strong mortgage balance growth andrecovering asset margins across all products, partially offset by continued competitive pressureon savings margins and continued lower long term swap rate returns adversely impactingcurrent account income.
• Savings balances were up 10% on Q3 2010, significantly outperforming the market whichremains highly competitive. The strong savings growth contributed to an improvement in theloan to deposit ratio from 115% to 109%.
• Non-interest income declined by 11%, £35 million primarily driven by lower investment incomeas a result of the dissolution of the UK Retail bancassurance joint venture.
• Costs were 8% lower than in Q3 2010, reflecting continued implementation of processefficiencies, lower Financial Services Compensation Scheme charges and the impact of thedissolution of the bancassurance joint venture. The adjusted cost:income ratio improved from53% to 49%.
• Impairment losses decreased by 22% on Q3 2010, primarily reflecting improvements in defaultrates on the unsecured book. Q3 2010 also included additional charges on the alreadydefaulted book.

27 RBS Group – Q3 2011 Results
UK Corporate Quarter ended Nine months ended
30 September
2011 30 June
2011 30 September
2010 30 September
2011 30 September
2010 £m £m £m £m £m
Income statement Net interest income 621 641 662 1,951 1,919
Net fees and commissions 244 231 244 719 701 Other non-interest income 83 94 80 265 292
Non-interest income 327 325 324 984 993
Total income 948 966 986 2,935 2,912
Direct expenses - staff (184) (199) (186) (585) (580) - other (88) (71) (81) (249) (266)Indirect expenses (147) (133) (139) (411) (394)
(419) (403) (406) (1,245) (1,240)
Operating profit before impairment losses 529 563 580 1,690 1,672 Impairment losses (228) (218) (158) (551) (542)
Operating profit 301 345 422 1,139 1,130 Analysis of income by business Corporate and commercial lending 647 666 651 2,042 1,941 Asset and invoice finance 176 163 163 491 451 Corporate deposits 172 171 183 513 544 Other (47) (34) (11) (111) (24)
Total income 948 966 986 2,935 2,912 Analysis of impairments by sector Banks and financial institutions 6 13 15 22 8 Hotels and restaurants 22 13 6 43 34 Housebuilding and construction 29 15 62 76 84 Manufacturing 9 6 2 21 10 Other 36 89 19 126 139 Private sector education, health, social work, recreational and community services 20 1 1 32 9 Property 82 51 34 151 161 Wholesale and retail trade, repairs 24 16 14 56 60 Asset and invoice finance - 14 5 24 37
Total impairment losses 228 218 158 551 542

28 RBS Group – Q3 2011 Results
UK Corporate (continued) Quarter ended Nine months ended
30 September
2011 30 June
2011 30 September
201030 September
2011 30 September
2010
Loan impairment charge as % of gross customer loans and advances (excluding reverse repurchase agreements) by sector Banks and financial institutions 0.4% 0.9% 1.0% 0.5% 0.2% Hotels and restaurants 1.4% 0.8% 0.3% 0.9% 0.7% Housebuilding and construction 2.9% 1.4% 5.5% 2.5% 2.5% Manufacturing 0.8% 0.5% 0.2% 0.6% 0.3% Other 0.4% 1.1% 0.2% 0.5% 0.6% Private sector education, health, social work, recreational and community services 0.9% - - 0.5% 0.1% Property 1.1% 0.7% 0.5% 0.7% 0.7% Wholesale and retail trade, repairs 1.1% 0.7% 0.5% 0.8% 0.8% Asset and invoice finance - 0.6% 0.2% 0.3% 0.5%
Total 0.8% 0.8% 0.6% 0.7% 0.6%
Key metrics Quarter ended Nine months ended
30 September
2011 30 June
2011 30 September
2010 30 September
2011 30 September
2010
Performance ratios Return on equity (1) 11.1% 12.3% 14.1% 13.1% 12.2% Net interest margin 2.48% 2.55% 2.56% 2.59% 2.49% Cost:income ratio 44% 42% 41% 42% 43%
30 September
2011 30 June
2011 31 December
2010 £bn £bn Change £bn Change
Capital and balance sheet Total third party assets 112.7 113.6 (1%) 114.6 (2%)Loans and advances to customers (gross) - banks and financial institutions 5.7 5.9 (3%) 6.1 (7%) - hotels and restaurants 6.3 6.5 (3%) 6.8 (7%) - housebuilding and construction 4.0 4.2 (5%) 4.5 (11%) - manufacturing 4.7 4.9 (4%) 5.3 (11%) - other 32.6 32.2 1% 31.0 5% - private sector education, health, social work, recreational and community services 8.7 8.8 (1%) 9.0 (3%) - property 29.0 29.2 (1%) 29.5 (2%) - wholesale and retail trade, repairs 8.9 9.2 (3%) 9.6 (7%) - asset and invoice finance 10.1 9.9 2% 9.9 2%
110.0 110.8 (1%) 111.7 (2%) Customer deposits 98.9 99.5 (1%) 100.0 (1%)Risk elements in lending 4.9 4.8 2% 4.0 23% Loan:deposit ratio (excluding repos) 109% 109% - 110% (100bp)Risk-weighted assets 75.7 77.9 (3%) 81.4 (7%) Note: (1) Divisional return on equity is based on divisional operating profit after tax, divided by average notional equity (based on
9% of the monthly average of divisional RWAs, adjusted for capital deductions).

29 RBS Group – Q3 2011 Results
UK Corporate (continued) Key points UK Corporate continues to support UK businesses through a challenging economic climate. In Q3 2011, following the August riots, UK Corporate responded with a number of emergency measures to support SME customers. On 3 November we launched a new loan product to support our SME customers with low fixed interest rates, no early repayment charges and, for a limited three month period, no initial fees. The division has worked closely with over 2,000 customers so far this year (600 in the quarter) to help reduce banking operations complexity and improve efficiency. The benefits include converting 30,000 cheques to BACS payments, migrating 22,000 credits from branch counters and reducing manual payments by 2,000 per annum. Q3 2011 also saw UK Corporate’s strategic investment programme deliver two new deposit products. The Managed Rate account enables customers to manage their liquidity requirements on a day by day basis. Since launch, £3 billion of base rate balances have migrated to the Managed Rate product. Additionally, an education sector specific product suite, offering attractively priced products and a deposit structure better suited to the sector’s unique needs was also launched during the quarter. Q3 2011 compared with Q2 2011 • Operating profit of £301 million was £44 million, 13%, lower, with adverse movements in lending
income, costs and impairments.
• Net interest income fell by 3%, impacted by a small reduction in lending volumes and marginallyhigher costs of funding. Net interest margin declined by 7 basis points in the quarter.
• Non-interest income remained broadly in line with Q2 2011 with higher Global Banking & Markets(GBM) revenue share income largely offset by the non-repeat of modest asset disposal gainsrecognised in Q2 2011.
• Total costs increased 4% due to an operational loss recovery in Q2 2011 and higher operational costs of managing the non-performing book, partially offset by lower discretionary staff costs in Q3 2011.
• Impairments increased £10 million due to lower latent provision releases and higher collective provisions on the SME book, partially offset by a fall in specific provisions in the quarter.
Q3 2011 compared with Q3 2010 • Operating profit decreased by £121 million, 29%, primarily driven by increased impairments and
higher costs of funding.
• Net interest income fell 6%, reflecting increased funding costs together with a 3% fall in net lending balances. This was partially offset by further re-pricing of the lending portfolio. Deposit growth of 1% supported an improvement in the loan to deposit ratio from 114% to 109%.
• Non-interest income was £3 million higher as a result of a rise in GBM revenue share and Invoice Finance income, partially offset by lower fee income.
• Expenses increased £13 million, 3%, primarily driven by higher operational costs of managing thenon-performing book, increased costs associated with GBM cross-sales and increased marketing spend to support strategic customer initiatives.
• Impairments were £70 million or 44% higher primarily driven by an increased flow into collectivelyassessed balances.
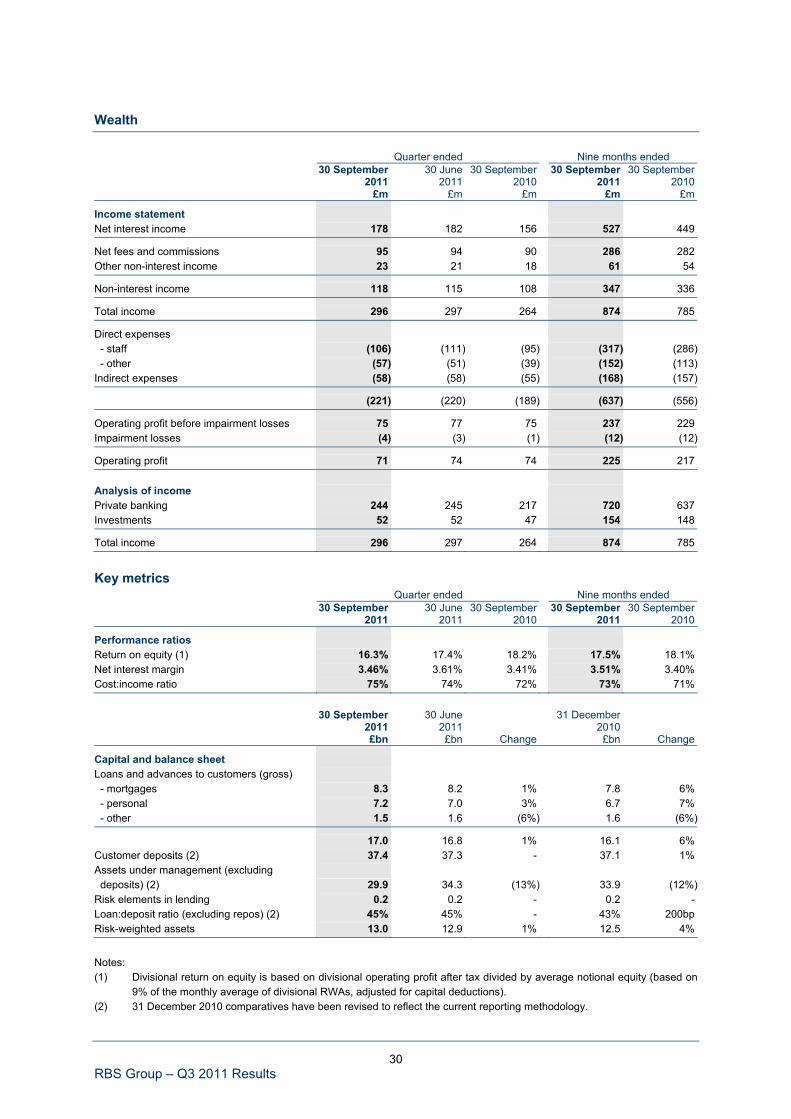
30 RBS Group – Q3 2011 Results
Wealth Quarter ended Nine months ended
30 September
2011 30 June
2011 30 September
2010 30 September
2011 30 September
2010 £m £m £m £m £m
Income statement Net interest income 178 182 156 527 449
Net fees and commissions 95 94 90 286 282 Other non-interest income 23 21 18 61 54
Non-interest income 118 115 108 347 336
Total income 296 297 264 874 785
Direct expenses - staff (106) (111) (95) (317) (286) - other (57) (51) (39) (152) (113)Indirect expenses (58) (58) (55) (168) (157)
(221) (220) (189) (637) (556)
Operating profit before impairment losses 75 77 75 237 229 Impairment losses (4) (3) (1) (12) (12)
Operating profit 71 74 74 225 217 Analysis of income Private banking 244 245 217 720 637 Investments 52 52 47 154 148
Total income 296 297 264 874 785
Key metrics Quarter ended Nine months ended
30 September
2011 30 June
2011 30 September
2010 30 September
2011 30 September
2010
Performance ratios Return on equity (1) 16.3% 17.4% 18.2% 17.5% 18.1% Net interest margin 3.46% 3.61% 3.41% 3.51% 3.40% Cost:income ratio 75% 74% 72% 73% 71%
30 September
2011 30 June
2011 31 December
2010 £bn £bn Change £bn Change
Capital and balance sheet Loans and advances to customers (gross) - mortgages 8.3 8.2 1% 7.8 6% - personal 7.2 7.0 3% 6.7 7% - other 1.5 1.6 (6%) 1.6 (6%)
17.0 16.8 1% 16.1 6% Customer deposits (2) 37.4 37.3 - 37.1 1% Assets under management (excluding deposits) (2) 29.9 34.3 (13%) 33.9 (12%)Risk elements in lending 0.2 0.2 - 0.2 - Loan:deposit ratio (excluding repos) (2) 45% 45% - 43% 200bp Risk-weighted assets 13.0 12.9 1% 12.5 4%
Notes: (1) Divisional return on equity is based on divisional operating profit after tax divided by average notional equity (based on
9% of the monthly average of divisional RWAs, adjusted for capital deductions). (2) 31 December 2010 comparatives have been revised to reflect the current reporting methodology.

31 RBS Group – Q3 2011 Results
Wealth (continued) Key points Q3 2011 has seen continued execution of the Wealth strategy as announced in Q1 2011. Plans to refresh the Coutts brand were finalised in the quarter with the initial launch in the UK market scheduled for Q4 2011. The new brand will bring Coutts UK and RBS Coutts under one single contemporary Coutts brand. The Wealth divisional strategy focuses on territories where the businesses have the opportunity for greatest scale or growth and during Q3 2011 the refocus on target markets was completed. The division also furthered plans to enhance its propositions in strategic international markets such as Asia, the Middle East, and Eastern Europe. In products and services further work was undertaken on the development of propositions for the diverse segments in the UK and International markets and the division continues to look to optimise how new products and services are delivered across multiple markets. The RBS Group provides significant opportunity to leverage synergies across divisions and Wealth continues to look at the connectivity potential with relevant businesses. Strategic investment in technology continued in Q3 2011, in particular with the finalisation of plans to deploy a new class-leading global banking platform in the UK, Further technology solutions continue to be assessed to enhance client experience, client to advisor interaction, and advisor to advisor collaboration. Q3 2011 compared with Q2 2011 • Operating profit fell 4% to £71 million in the third quarter as a result of stable income and a
small rise in impairments.
• Income remained stable as a 3% increase in non-interest income was offset by a 2% decline innet interest income. The growth in non-interest income reflects strong foreign exchange dealingincome, primarily driven by movements in Swiss franc exchange rates during the quarter. Netinterest income declined despite continued growth in the lending book margin, as the divisionreceived lower internal reward for its funding surplus. This resulted in a 15 basis point decline innet interest margin.
• Expenses remained flat in the quarter as increased regulatory costs were offset by discretionarycost management.
• Client assets and liabilities managed by the division declined 5%. Lending volumes maintainedtheir strong momentum, increasing a further 1% and deposit volumes remained stable. Assetsunder management declined 13% given adverse market movements, reflecting £3.2 billion ofthe movement, as well as net new business outflows of £1.2 billion as clients became cautioustowards equities.

32 RBS Group – Q3 2011 Results
Wealth (continued) Key points (continued) Q3 2011 compared with Q3 2010 • Operating profit declined 4% on prior year as a strong income performance was offset by higher
expenses, reflecting continued investment in the division and adverse foreign exchangemovements.
• Income increased by 12% with growth in both net interest and non-interest income. Net interestincome rose £22 million with a 5 basis point increase in net interest margin buttressed by robustgrowth in lending and deposit volumes. Non-interest income increased 9% with strongperformances in foreign exchange dealing and investment income.
• Expenses grew by 17%, reflecting the impact of the increased regulatory costs in Q3 2011,adverse movements in foreign exchange and significant investment in strategic initiatives andprivate banker recruitment.
• Client asset and liabilities were up £0.4 billion, with continued growth in lending and deposits ina competitive environment. This growth was partially offset by a 9% fall in assets undermanagement, with tough market conditions reducing values by 11%, partially offset by 2%growth provided by net new business.
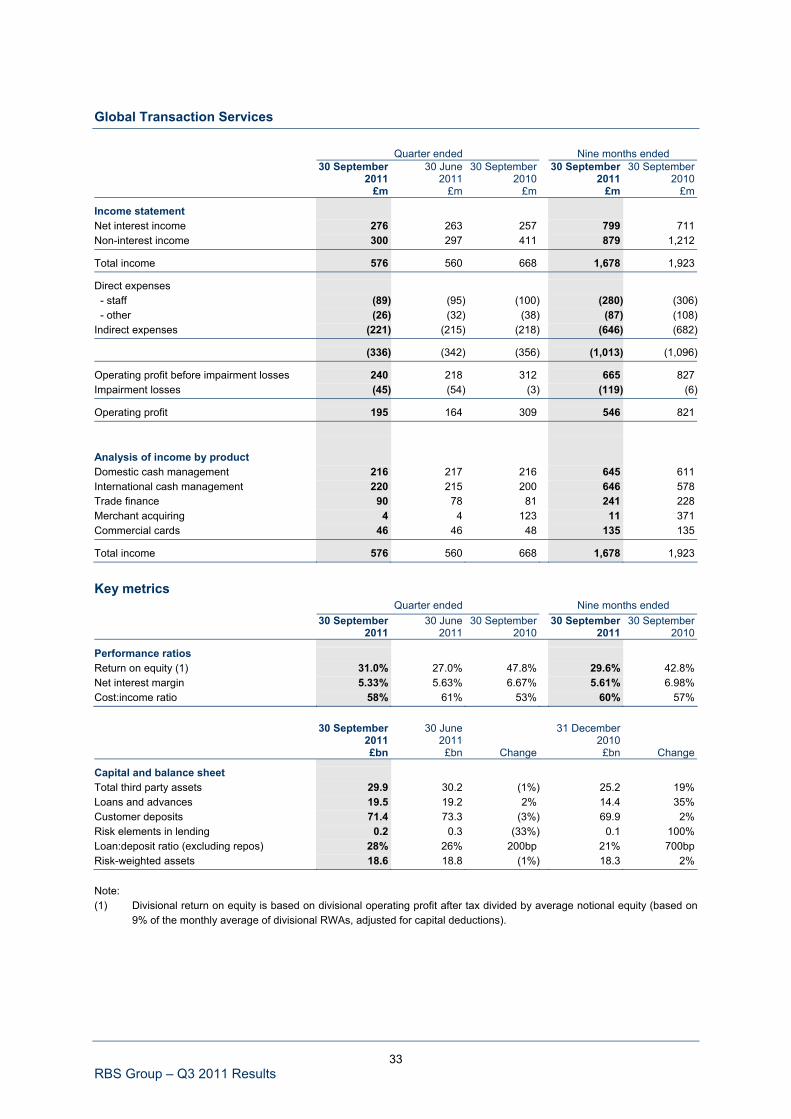
33 RBS Group – Q3 2011 Results
Global Transaction Services Quarter ended Nine months ended
30 September
2011 30 June
2011 30 September
2010 30 September
2011 30 September
2010 £m £m £m £m £m
Income statement Net interest income 276 263 257 799 711 Non-interest income 300 297 411 879 1,212
Total income 576 560 668 1,678 1,923
Direct expenses - staff (89) (95) (100) (280) (306) - other (26) (32) (38) (87) (108)Indirect expenses (221) (215) (218) (646) (682)
(336) (342) (356) (1,013) (1,096)
Operating profit before impairment losses 240 218 312 665 827 Impairment losses (45) (54) (3) (119) (6)
Operating profit 195 164 309 546 821 Analysis of income by product Domestic cash management 216 217 216 645 611 International cash management 220 215 200 646 578 Trade finance 90 78 81 241 228 Merchant acquiring 4 4 123 11 371 Commercial cards 46 46 48 135 135
Total income 576 560 668 1,678 1,923
Key metrics Quarter ended Nine months ended
30 September
2011 30 June
2011 30 September
2010 30 September
2011 30 September
2010
Performance ratios Return on equity (1) 31.0% 27.0% 47.8% 29.6% 42.8% Net interest margin 5.33% 5.63% 6.67% 5.61% 6.98% Cost:income ratio 58% 61% 53% 60% 57%
30 September
2011 30 June
2011 31 December
2010 £bn £bn Change £bn Change
Capital and balance sheet Total third party assets 29.9 30.2 (1%) 25.2 19% Loans and advances 19.5 19.2 2% 14.4 35% Customer deposits 71.4 73.3 (3%) 69.9 2% Risk elements in lending 0.2 0.3 (33%) 0.1 100% Loan:deposit ratio (excluding repos) 28% 26% 200bp 21% 700bp Risk-weighted assets 18.6 18.8 (1%) 18.3 2% Note: (1) Divisional return on equity is based on divisional operating profit after tax divided by average notional equity (based on
9% of the monthly average of divisional RWAs, adjusted for capital deductions).

34 RBS Group – Q3 2011 Results
Global Transaction Services (continued) Key points In Q3 2011 Global Transaction Services (GTS) delivered revenue growth, careful cost management and resilient deposit performance. GTS continued to deliver solutions to clients, for example, launching the new Liquidity Solutions Portal which gives clients the ability to view and control balances, forecast their cash positions and make effective liquidity and investment decisions in real time. The business also launched the new enhanced e-Invoicing solution, which received a ‘Green Apple’ award for environmental best practice from The Green Organisation. Q3 2011 compared with Q2 2011 • Operating profit increased 19%, driven by income growth, lower costs and impairment charges.
• Income increased by 3% with good performance in trade finance and international cashmanagement.
• Total expenses decreased by 2%, reflecting tight management of discretionary costs whilstsupporting investment in technology and support infrastructure.
• Q3 2011 impairment losses of £45 million, which were largely related to additional provision onan existing single name impairment, were down 17%.
• Customer deposit levels held up well in a competitive environment, but were adversely affectedby exchange rate movements.
Q3 2011 compared with Q3 2010 • Operating profit fell 37%, in part reflecting the sale of Global Merchant Services (GMS), which
completed on 30 November 2010. Adjusting for the disposal, operating profit decreased 24%,reflecting provision on a single name impairment.
• Excluding GMS, income increased by 5% supported by the success of deposit-gatheringinitiatives and increased trade finance activity.
• Excluding GMS, expenses increased by 16%, reflecting business improvement initiatives andinvestment in technology and support infrastructure.
• Customer deposits were 9% higher at £71.4 billion, reflecting strong deposit volumes indomestic and international cash management, in a challenging competitive environment.
• Third party assets increased by £5.7 billion, largely due to strong growth in trade finance andinternational cash management.
• During Q3 2010, GMS recorded income of £120 million, total expenses of £67 million and anoperating profit of £53 million.

35 RBS Group – Q3 2011 Results
Ulster Bank Quarter ended Nine months ended
30 September
2011 30 June
2011 30 September
2010 30 September
2011 30 September
2010 £m £m £m £m £m
Income statement Net interest income 185 171 192 525 574
Net fees and commissions 41 37 38 114 116 Other non-interest income 19 14 14 48 42
Non-interest income 60 51 52 162 158
Total income 245 222 244 687 732
Direct expenses - staff (55) (57) (54) (168) (180) - other (17) (17) (18) (52) (57)Indirect expenses (65) (68) (62) (195) (200)
(137) (142) (134) (415) (437)
Operating profit before impairment losses 108 80 110 272 295 Impairment losses (327) (269) (286) (1,057) (785)
Operating loss (219) (189) (176) (785) (490) Analysis of income by business Corporate 107 117 120 337 399 Retail 116 98 124 327 341 Other 22 7 - 23 (8)
Total income 245 222 244 687 732 Analysis of impairments by sector Mortgages 126 78 69 437 135 Corporate - property 78 66 107 241 306 - other corporate 111 103 100 334 309 Other lending 12 22 10 45 35
Total impairment losses 327 269 286 1,057 785 Loan impairment charge as % of gross customer loans and advances (excluding reverse repurchase agreements) by sector Mortgages 2.4% 1.4% 1.3% 2.8% 0.8% Corporate - property 6.1% 5.0% 8.1% 6.3% 7.7% - other corporate 5.4% 4.7% 4.3% 5.4% 4.4% Other lending 3.2% 5.5% 2.4% 4.0% 2.7%
Total 3.7% 2.9% 3.0% 4.0% 2.8%
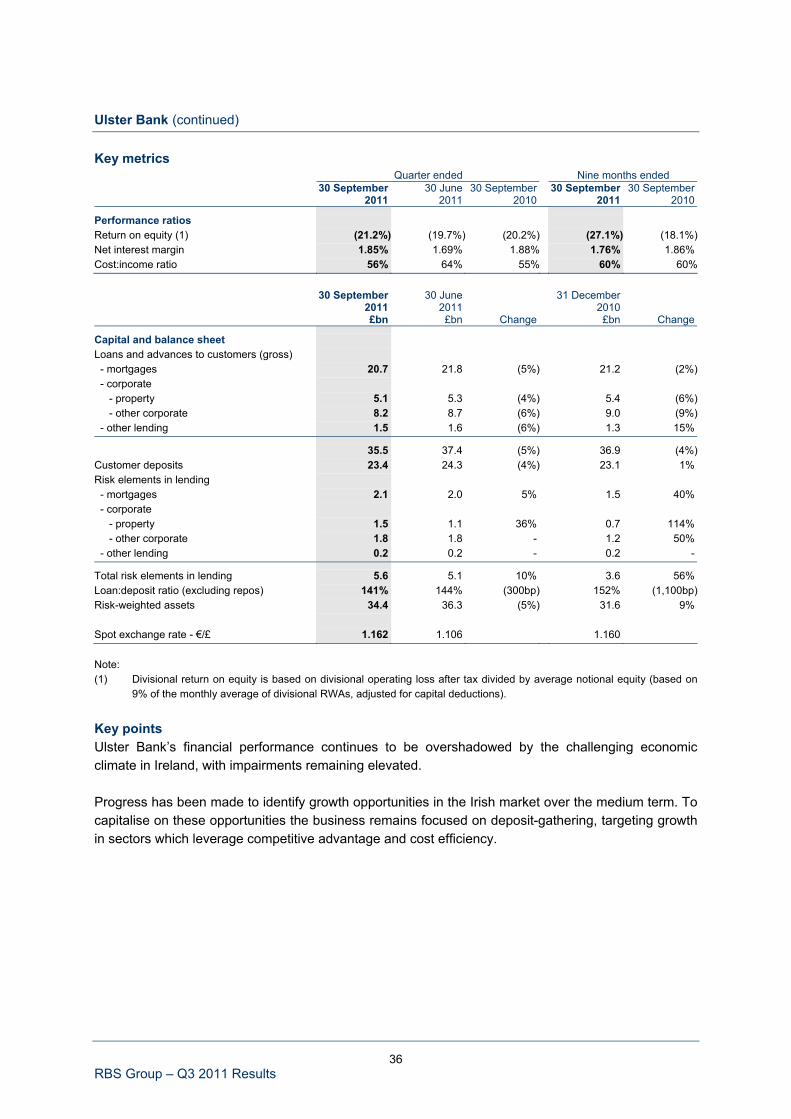
36 RBS Group – Q3 2011 Results
Ulster Bank (continued) Key metrics Quarter ended Nine months ended
30 September
2011 30 June
2011 30 September
2010 30 September
2011 30 September
2010
Performance ratios Return on equity (1) (21.2%) (19.7%) (20.2%) (27.1%) (18.1%)Net interest margin 1.85% 1.69% 1.88% 1.76% 1.86% Cost:income ratio 56% 64% 55% 60% 60%
30 September
2011 30 June
2011 31 December
2010 £bn £bn Change £bn Change
Capital and balance sheet Loans and advances to customers (gross) - mortgages 20.7 21.8 (5%) 21.2 (2%) - corporate - property 5.1 5.3 (4%) 5.4 (6%) - other corporate 8.2 8.7 (6%) 9.0 (9%) - other lending 1.5 1.6 (6%) 1.3 15%
35.5 37.4 (5%) 36.9 (4%)Customer deposits 23.4 24.3 (4%) 23.1 1% Risk elements in lending - mortgages 2.1 2.0 5% 1.5 40% - corporate - property 1.5 1.1 36% 0.7 114% - other corporate 1.8 1.8 - 1.2 50% - other lending 0.2 0.2 - 0.2 -
Total risk elements in lending 5.6 5.1 10% 3.6 56% Loan:deposit ratio (excluding repos) 141% 144% (300bp) 152% (1,100bp)Risk-weighted assets 34.4 36.3 (5%) 31.6 9% Spot exchange rate - €/£ 1.162 1.106 1.160 Note: (1) Divisional return on equity is based on divisional operating loss after tax divided by average notional equity (based on
9% of the monthly average of divisional RWAs, adjusted for capital deductions). Key points Ulster Bank’s financial performance continues to be overshadowed by the challenging economic climate in Ireland, with impairments remaining elevated. Progress has been made to identify growth opportunities in the Irish market over the medium term. To capitalise on these opportunities the business remains focused on deposit-gathering, targeting growth in sectors which leverage competitive advantage and cost efficiency.

37 RBS Group – Q3 2011 Results
Ulster Bank (continued) Key points (continued) Q3 2011 compared with Q2 2011 • Operating profit before impairment grew by £28 million in Q3 2011 to £108 million. However,
higher impairment losses resulted in an increase in the operating loss for the quarter to£219 million.
• Net interest income increased by £14 million reflecting a higher return on the bank’s capitalbase, coupled with the impact of loan re-pricing, where progress continues to be made toimprove customer margins, counteracting the impact of higher funding costs, contracting depositmargins and the non-performing loan book. Consequently, net interest margin rose by 16 basispoints to 1.85%. Customer loan balances reduced marginally in the quarter on a constantcurrency basis.
• Non-interest income rose by £9 million driven by a one-off foreign exchange gain during thequarter.
• Expenses declined by £5 million, with direct costs falling by 4% on a constant currency basisreflecting continued discipline in managing the cost base. Indirect costs were 6% lower on aconstant currency basis due to the non-repeat of a charge on the value of own property assetsin Q2 2011.
• Impairment losses increased by £58 million in the quarter primarily due to a further decline inasset values driving higher losses on defaulted assets in both the mortgage and corporateportfolios.
• Customer deposit balances remained largely stable in the quarter on a constant currency basisdespite rating downgrades and market uncertainty. This has resulted in an erosion of corporatebalances, offset by growth in retail and SME deposits.
Q3 2011 compared with Q3 2010 • Operating loss increased by £43 million driven by the impact of deteriorating credit quality on
impairment losses. Operating profit before impairment losses was broadly flat.
• Income decreased by 3% in constant currency terms reflecting a reduction in loan volumescoupled with the increased impact of the default portfolio.
• Loans and advances to customers fell by 5% on a constant currency basis as redemptionsoutweighed new business demand. Customer deposits remained stable resulting in an improvedloan to deposit ratio of 141%.
• Expenses decreased by 5% in constant currency terms driven by cost reduction actions initiatedto mitigate the underlying business performance.
• Risk-weighted assets increased by 6% on a constant currency basis due to deterioration in therisk metrics of both the retail and corporate lending portfolios.
• Customer numbers increased by 3% overall, with a 3% increase in consumer banking and a 2%increase in SME and corporate customers.
• Impairment losses increased by £41 million primarily due to a decline in asset values drivinghigher losses in the mortgage portfolio.

38 RBS Group – Q3 2011 Results
US Retail & Commercial (£ Sterling) Quarter ended Nine months ended
30 September
2011 30 June
2011 30 September
2010 30 September
2011 30 September
2010 £m £m £m £m £m
Income statement Net interest income 483 469 480 1,403 1,450
Net fees and commissions 190 185 180 545 560 Other non-interest income 67 61 91 201 238
Non-interest income 257 246 271 746 798
Total income 740 715 751 2,149 2,248
Direct expenses - staff (206) (205) (214) (608) (580) - other (152) (135) (148) (411) (445)Indirect expenses (183) (182) (191) (548) (569)
(541) (522) (553) (1,567) (1,594)
Operating profit before impairment losses 199 193 198 582 654Impairment losses (84) (66) (125) (260) (412)
Operating profit 115 127 73 322 242 Average exchange rate - US$/£ 1.611 1.631 1.551 1.614 1.534 Analysis of income by product Mortgages and home equity 119 108 142 336 381 Personal lending and cards 111 108 127 326 363 Retail deposits 236 231 223 683 697 Commercial lending 149 147 145 433 439 Commercial deposits 75 72 78 216 245 Other 50 49 36 155 123
Total income 740 715 751 2,149 2,248 Analysis of impairments by sector Residential mortgages 7 13 14 26 55 Home equity 29 11 56 80 100 Corporate and commercial 7 22 23 46 148 Other consumer 11 9 28 40 91 Securities 30 11 4 68 18
Total impairment losses 84 66 125 260 412 Loan impairment charge as % of gross customer loans and advances (excluding reverse repurchase agreements) by sector Residential mortgages 0.5% 0.9% 0.9% 0.6% 1.2% Home equity 0.8% 0.3% 1.5% 0.7% 0.9% Corporate and commercial 0.1% 0.4% 0.5% 0.3% 1.0% Other consumer 0.7% 0.6% 1.6% 0.8% 1.8%
Total 0.4% 0.5% 1.0% 0.5% 1.1%

39 RBS Group – Q3 2011 Results
US Retail & Commercial (£ Sterling) (continued) Key metrics Quarter ended Nine months ended
30 September
2011 30 June
2011 30 September
2010 30 September
2011 30 September
2010
Performance ratios Return on equity (1) 6.0% 6.8% 3.3% 5.7% 3.6% Net interest margin 3.09% 3.11% 2.89% 3.07% 2.80% Cost:income ratio 73% 73% 74% 73% 71%
30 September
2011 30 June
2011 31 December
2010 £bn £bn Change £bn Change
Capital and balance sheet Total third party assets 72.9 70.9 3% 71.2 2% Loans and advances to customers (gross) - residential mortgages 5.9 5.7 4% 6.1 (3%) - home equity 14.9 14.6 2% 15.2 (2%) - corporate and commercial 22.1 21.3 4% 20.4 8% - other consumer 6.6 6.3 5% 6.9 (4%)
49.5 47.9 3% 48.6 2% Customer deposits (excluding repos) 58.5 56.5 4% 58.7 - Risk elements in lending - retail 0.6 0.5 20% 0.4 50% - commercial 0.4 0.4 - 0.5 (20%)
Total risk elements in lending 1.0 0.9 11% 0.9 11% Loan:deposit ratio (excluding repos) 83% 83% - 81% 200bp Risk-weighted assets 56.5 54.8 3% 57.0 (1%) Spot exchange rate - US$/£ 1.562 1.607 1.552 Note: (1) Divisional return on equity is based on divisional operating profit after tax divided by average notional equity (based on
9% of the monthly average of divisional RWAs, adjusted for capital deductions). Key points • Sterling weakened relative to the US dollar during the third quarter with the average exchange
rate decreasing by 1%.
• Performance is described in full in the US dollar-based financial statements set out on pages 40and 41.
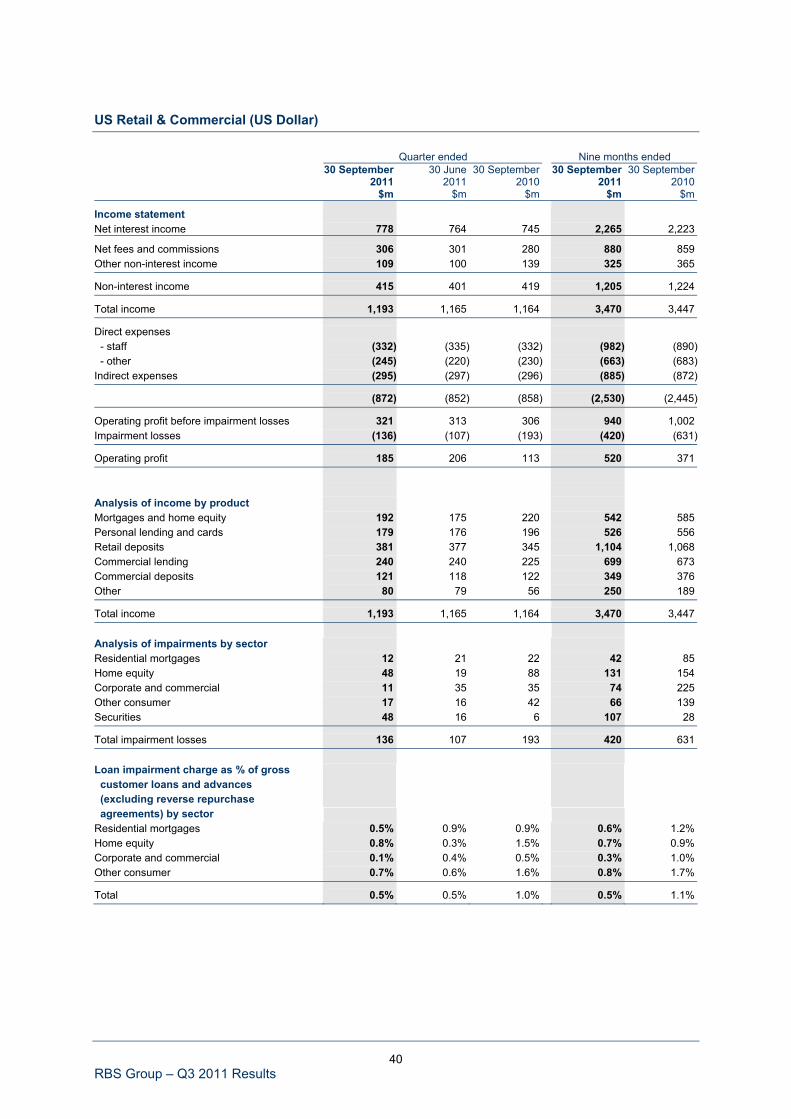
40 RBS Group – Q3 2011 Results
US Retail & Commercial (US Dollar) Quarter ended Nine months ended
30 September
2011 30 June
2011 30 September
2010 30 September
2011 30 September
2010 $m $m $m $m $m
Income statement Net interest income 778 764 745 2,265 2,223
Net fees and commissions 306 301 280 880 859 Other non-interest income 109 100 139 325 365
Non-interest income 415 401 419 1,205 1,224
Total income 1,193 1,165 1,164 3,470 3,447
Direct expenses - staff (332) (335) (332) (982) (890) - other (245) (220) (230) (663) (683)Indirect expenses (295) (297) (296) (885) (872)
(872) (852) (858) (2,530) (2,445)
Operating profit before impairment losses 321 313 306 940 1,002 Impairment losses (136) (107) (193) (420) (631)
Operating profit 185 206 113 520 371 Analysis of income by product Mortgages and home equity 192 175 220 542 585 Personal lending and cards 179 176 196 526 556 Retail deposits 381 377 345 1,104 1,068 Commercial lending 240 240 225 699 673 Commercial deposits 121 118 122 349 376 Other 80 79 56 250 189
Total income 1,193 1,165 1,164 3,470 3,447 Analysis of impairments by sector Residential mortgages 12 21 22 42 85 Home equity 48 19 88 131 154 Corporate and commercial 11 35 35 74 225 Other consumer 17 16 42 66 139 Securities 48 16 6 107 28
Total impairment losses 136 107 193 420 631 Loan impairment charge as % of gross customer loans and advances (excluding reverse repurchase agreements) by sector Residential mortgages 0.5% 0.9% 0.9% 0.6% 1.2% Home equity 0.8% 0.3% 1.5% 0.7% 0.9% Corporate and commercial 0.1% 0.4% 0.5% 0.3% 1.0% Other consumer 0.7% 0.6% 1.6% 0.8% 1.7%
Total 0.5% 0.5% 1.0% 0.5% 1.1%

41 RBS Group – Q3 2011 Results
US Retail & Commercial (US Dollar) (continued) Key metrics Quarter ended Nine months ended
30 September
2011 30 June
2011 30 September
2010 30 September
2011 30 September
2010
Performance ratios Return on equity (1) 6.0% 6.8% 3.3% 5.7% 3.6% Net interest margin 3.09% 3.11% 2.89% 3.07% 2.80% Cost:income ratio 73% 73% 74% 73% 71%
30 September
2011 30 June
2011 31 December
2010 $bn $bn Change $bn Change
Capital and balance sheet Total third party assets 113.8 113.9 - 110.5 3% Loans and advances to customers (gross) - residential mortgages 9.1 9.2 (1%) 9.4 (3%) - home equity 23.3 23.5 (1%) 23.6 (1%) - corporate and commercial 34.5 34.0 1% 31.7 9% - other consumer 10.4 10.2 2% 10.6 (2%)
77.3 76.9 1% 75.3 3% Customer deposits (excluding repos) 91.3 90.7 1% 91.2 - Risk elements in lending - retail 0.9 0.9 - 0.7 29% - commercial 0.6 0.6 - 0.7 (14%)
Total risk elements in lending 1.5 1.5 - 1.4 7% Loan:deposit ratio (excluding repos) 83% 83% - 81% 200bp Risk-weighted assets 88.2 88.1 - 88.4 - Note: (1) Divisional return on equity is based on divisional operating profit after tax divided by average notional equity (based on
9% of monthly average of divisional RWAs, adjusted for capital deductions). Key points US Retail & Commercial continued to focus on its “back-to-basics” strategy, with good progress made in developing the division’s customer franchise during 2011. The bank has continued to re-energise the franchise through new branding, product development and competitive pricing. Consumer Finance continues to strengthen its alignment with branch banking, further improving the penetration of products to deposit households, which has increased over nine consecutive quarters. In addition, Consumer continues to improve its penetration of the on-line banking market, while also focusing on growing its auto, business banking, education finance and wealth management businesses. The Commercial Banking business continues to achieve good momentum through a refreshed sales training programme, benefiting over 900 employees so far, an improved product offering and further improvements in the cross-sell of Global Transaction Services (GTS) products to its customer base. Furthermore, Commercial Banking took an important step forward in branding, by unifying under the RBS Citizens brand, helping to ensure that customers and prospects understand both the depth of local expertise and the breadth of global capabilities.

42 RBS Group – Q3 2011 Results
US Retail & Commercial (US Dollar) (continued) Key points (continued) Q3 2011 compared with Q2 2011 • US Retail & Commercial posted an operating profit of $185 million compared with $206 million
in the prior quarter, a decrease of $21 million, or 10% driven by an increase in mortgageservicing rights impairment ($23 million) and higher securities impairments ($32 million).Excluding these items, operating profit was up $34 million, or 15%.
• The macroeconomic operating environment remained challenging, with low rates, highunemployment, a soft housing market, sluggish consumer activity and the continuing impact oflegislative changes. While short term rates remained low, there was also a significant flatteningof the yield curve as the 10 year Treasury rate dropped 130 basis points from a quarter high of3.22%, ending the quarter at 1.92%.
• Net interest income was up $14 million, or 2%. Product net interest income was in line with theprevious quarter. Loans and advances were up slightly from the previous quarter due to stronggrowth in commercial loan volumes, partly offset by some continued planned run-off of longterm fixed rate consumer products.
• Non-interest income was up $14 million, or 3%, reflecting higher mortgage banking income.
• Total expenses were up $20 million, or 2%, reflecting an increase in mortgage servicing rightsimpairment of $23 million, driven by declining rates.
• Impairment losses were up $29 million, or 27%, reflecting higher impairments ($32 million)related to securities. Loan impairments as a percent of loans and advances were essentiallyunchanged and stable at 0.5%.
Q3 2011 compared with Q3 2010 • Operating profit increased by 64% to $185 million substantially driven by lower impairments and
improved net interest income.
• Net interest income was up $33 million, or 4%. Net interest margin improved by 20 basis pointsto 3.09%, reflecting changes in deposit mix and continued discipline around deposit pricing aswell as the positive impact of the balance sheet restructuring programme carried out duringQ3 2010 combined with strong commercial loan growth partially offset by run-off of consumerloans.
• Impairment losses declined by $57 million, or 30%, reflecting an improved credit environmentpartially offset by higher impairments related to securities. Loan impairments as a percentage ofloans and advances improved to 0.5% from 1.0%.
• Customer deposits were down $4 billion, or 4%, reflecting the impact of a changed pricingstrategy on low margin term and time products offset by strong checking balance growth.Consumer checking balances grew by 4% while small business checking balances grew by 5%over the year.
• Non-interest income was down $4 million, or 1%, reflecting lower mortgage banking incomelargely offset by increased commercial banking fee income and higher ATM fees as a result ofnew pricing initiatives.
• Total expenses were up $14 million, or 2%, reflecting an increase in mortgage servicing rightsimpairment of $23 million and costs related to regulatory challenges.

43 RBS Group – Q3 2011 Results
Global Banking & Markets Quarter ended Nine months ended
30 September
2011 30 June
2011 30 September
2010 30 September
2011 30 September
2010 £m £m £m £m £m
Income statement Net interest income from banking activities 174 178 317 545 1,031
Net fees and commissions receivable 289 363 411 1,042 1,070 Income from trading activities 602 922 830 3,276 4,089 Other operating income (net of related funding costs) 34 87 (4) 166 135
Non-interest income 925 1,372 1,237 4,484 5,294
Total income 1,099 1,550 1,554 5,029 6,325
Direct expenses - staff (527) (605) (621) (1,995) (2,139) - other (243) (229) (166) (688) (550)Indirect expenses (249) (233) (218) (709) (643)
(1,019) (1,067) (1,005) (3,392) (3,332)
Operating profit before impairment losses 80 483 549 1,637 2,993 Impairment recoveries/(losses) 32 (37) 40 19 (156)
Operating profit 112 446 589 1,656 2,837 Analysis of income by product Rates - money markets (19) (41) 38 (134) 130 Rates - flow 113 357 402 1,203 1,572 Currencies 227 234 218 685 692 Credit and mortgage markets 93 437 349 1,415 1,782
Fixed income & currencies 414 987 1,007 3,169 4,176 Portfolio management and origination 571 329 349 1,237 1,399 Equities 114 234 198 623 750
Total income 1,099 1,550 1,554 5,029 6,325 Analysis of impairments by sector Manufacturing and infrastructure - (45) 34 (77) 53 Property and construction (11) - - (17) (64)Banks and financial institutions 44 (2) 3 65 (123)Other (1) 10 3 48 (22)
Total impairment recoveries/(losses) 32 (37) 40 19 (156) Loan impairment charge as % of gross customer loans and advances (excluding reverse repurchase agreements) (0.2%) 0.2% (0.2%) - 0.2%

44 RBS Group – Q3 2011 Results
Global Banking & Markets (continued) Key metrics Quarter ended Nine months ended
30 September
2011 30 June
2011 30 September
2010 30 September
2011 30 September
2010
Performance ratios Return on equity (1) 2.3% 8.7% 11.6% 10.7% 18.8% Net interest margin 0.71% 0.70% 1.13% 0.72% 1.09% Cost:income ratio 93% 69% 65% 67% 53% Compensation ratio (2) 48% 39% 40% 40% 34%
30 September
2011 30 June
2011 31 December
2010 £bn £bn Change £bn Change
Capital and balance sheet Loans and advances to customers 73.1 71.2 3% 75.1 (3%)Loans and advances to banks 34.1 38.6 (12%) 44.5 (23%)Reverse repos 100.6 97.5 3% 94.8 6% Securities 124.5 141.5 (12%) 119.2 4% Cash and eligible bills 33.3 32.8 2% 38.8 (14%)Other 33.0 37.5 (12%) 24.3 36%
Total third party assets (excluding derivatives mark-to-market) 398.6 419.1 (5%) 396.7 - Net derivative assets (after netting) 45.6 32.2 42% 37.4 22% Customer deposits (excluding repos) 39.5 35.7 11% 38.9 2% Risk elements in lending 1.6 1.5 7% 1.7 (6%)Loan:deposit ratio (excluding repos) 185% 200% (1,500bp) 193% (800bp)Risk-weighted assets 134.3 139.0 (3%) 146.9 (9%) Notes: (1) Divisional return on equity is based on divisional operating profit after tax divided by average notional equity (based on
10% of the monthly average of divisional RWAs, adjusted for capital deductions). (2) Compensation ratio is based on staff costs as a percentage of total income. Key points The ongoing European sovereign debt crisis and heightened concerns about growth expectations for the world economy caused market sentiment to deteriorate significantly during Q3 2011. Markets were volatile and generally pessimistic. Against this backdrop primary volumes were heavily depressed and opportunities in the secondary market were limited. During this challenging period, it is all the more important that customers are provided with the best possible service and that the division capitalises on its strengths. Therefore, GBM continues to focus on improving relationships with its clients, while managing its activities very tightly and ensuring that sound risk policies are in place.

45 RBS Group – Q3 2011 Results
Global Banking & Markets (continued) Key points (continued) Q3 2011 compared with Q2 2011 • A small operating profit of £112 million reflected a sharp reduction in revenue, which fell 29% to
£1,099 million.
• The fall in revenue was caused by the deterioration in the market environment:
○ As in previous quarters, negative revenue in Rates-Money Markets reflected the cost of the division’s funding activities, which more than offset revenue generated by the short-term markets business.
○ Rates-Flow fell significantly for the second quarter in a row. Although client flow remained stable, trading margins were weak and a higher level of cost was incurred on the division’scounterparty exposure management activities (circa £200 million).
○ Credit Markets recorded losses approaching £200 million during the quarter on the flow trading business as widening credit spreads resulted in mark-downs on a range of exposures. The Mortgage business was also negatively impacted by lower client activity.
○ Amidst a volatile and generally negative environment, Equities suffered from subdued client activity in both the primary and secondary markets.
○ The sharp increase in Portfolio Management and Origination income was driven by market derivative values. The underlying business weakened marginally as issuance volumes declined, partially offset by gains on portfolio hedging activities.
• Total costs fell £48 million, as performance-related pay accruals were adjusted in response tothe decline in revenue. This was partially offset by higher investment costs, primarily reflectingdepreciation. The increase in compensation ratio reflected the low level of revenue comparedwith fixed staff costs.
• Impairments generated a net credit, reflecting a single name provision release during thequarter.
• Third party assets were slightly below the targeted range of £400 - £450 billion, due to lowerlevels of activity and rigorous management of balance sheet exposures.
• Risk-weighted assets decreased 3%, reflecting the ongoing focus on efficient capitaldeployment.
• Return on equity was 2.3% driven by the fall in revenue. Q3 2011 compared with Q3 2010 • A sharp fall in operating profit reflected a 29% fall in revenue.
•
Rates-Flow and Credit Markets both suffered from the nervous and volatile credit environmentduring Q3 2011. Rates-Flow incurred higher costs on counterparty exposure managementactivities and Credit-Markets suffered losses on credit positions in the flow credit business.
• Equities revenue declined as the market weakness limited client activity.
• Staff costs declined as levels of performance-related pay fell as a result of the decline inrevenue. The increase in other and indirect expenses is driven by higher investment spendingand depreciation at both the divisional and group levels.

46 RBS Group – Q3 2011 Results
RBS Insurance Quarter ended Nine months ended
30 September
2011 30 June
2011 30 September
2010 30 September
2011 30 September
2010 £m £m £m £m £m
Income statement Earned premiums 1,057 1,056 1,111 3,178 3,359 Reinsurers' share (67) (60) (36) (181) (108)
Net premium income 990 996 1,075 2,997 3,251 Fees and commissions (83) (81) (96) (239) (277)Instalment income 35 35 39 105 121 Other income 19 27 31 81 109
Total income 961 977 1,049 2,944 3,204 Net claims (695) (704) (942) (2,183) (3,034)
Underwriting profit/(loss) 266 273 107 761 170
Staff expenses (67) (70) (72) (213) (215)Other expenses (88) (79) (77) (254) (248)
Total direct expenses (155) (149) (149) (467) (463)Indirect expenses (60) (54) (66) (170) (193)
(215) (203) (215) (637) (656)
Technical result 51 70 (108) 124 (486)Investment income 72 69 75 205 200
Operating profit/(loss) 123 139 (33) 329 (286) Analysis of income by product Personal lines motor excluding broker - own brands 439 438 450 1,317 1,357 - partnerships 45 57 82 175 252 Personal lines home excluding broker - own brands 117 118 120 352 354 - partnerships 94 90 93 282 288 Personal lines other excluding broker - own brands 43 46 47 135 143 - partnerships 47 48 44 141 153 Other - commercial 80 80 78 234 238 - international 91 80 79 251 234 - other (1) 5 20 56 57 185
Total income 961 977 1,049 2,944 3,204 Note: (1) Other predominantly consists of the discontinued personal lines broker business.

47 RBS Group – Q3 2011 Results
RBS Insurance (continued) Key metrics Quarter ended Nine months ended
30 September
2011 30 June
2011 30 September
2010 30 September
2011 30 September
2010 In-force policies (000s) Personal lines motor excluding broker - own brands 3,832 3,931 4,276 3,832 4,276 - partnerships 388 474 698 388 698 Personal lines home excluding broker - own brands 1,832 1,844 1,807 1,832 1,807 - partnerships 2,504 2,524 2,533 2,504 2,533 Personal lines other excluding broker - own brands 1,886 1,932 2,027 1,886 2,027 - partnerships 7,714 7,577 6,527 7,714 6,527 Other - commercial 410 393 363 410 363 - international 1,357 1,302 1,060 1,357 1,060 - other (1) 44 211 861 44 861
Total in-force policies (2) 19,967 20,188 20,152 19,967 20,152
Gross written premium (£m) Personal lines motor excluding broker - own brands 438 408 458 1,236 1,277 - partnerships 36 36 70 109 198 Personal lines home excluding broker - own brands 133 117 135 362 362 - partnerships 144 135 145 417 419 Personal lines other excluding broker - own brands 48 44 49 134 137 - partnerships 48 42 43 130 120 Other - commercial 101 120 90 333 301 - international 125 134 79 428 302 - other (1) 4 (2) 59 (1) 194
Total gross written premium 1,077 1,034 1,128 3,148 3,310
Performance ratios Return on regulatory capital (3) 12.3% 15.4% (3.5%) 11.0% (10.3%)Return on equity (4) 11.0% 12.9% (3.0%) 10.0% (8.6%)Loss ratio (5) 70% 71% 88% 72% 93% Commission ratio (6) 8% 8% 9% 8% 8% Expense ratio (7) 20% 20% 19% 21% 20% Combined operating ratio (8) 98% 99% 116% 101% 121%
Balance sheet Total insurance reserves - total (£m) (9) 7,545 7,557 7,668
Notes: (1) Other predominantly consists of the discontinued personal lines broker business. (2) Total in-force policies include travel and creditor policies sold through RBS Group. These comprise travel policies
included in bank accounts e.g. Royalties Gold Account, and creditor policies sold with bank products includingmortgage, loan and card repayment payment protection.
(3) Return on regulatory capital required is based on annualised divisional operating profit/(loss) after tax divided bydivisional average notional equity.
(4) Return on equity is based on annualised divisional operating profit/(loss) after tax divided by divisional average tangibleequity.
(5) Loss ratio is based on net claims divided by net premium income. (6) Commission ratio is based on fees and commissions divided by gross written premium. (7) Expense ratio is based on expenses (excluding fees and commissions) divided by gross written premium. (8) Combined operating ratio is the sum of the loss, expense and commission ratios. (9) Consists of General and Life insurance liabilities, unearned premium reserve and liability adequacy reserve.

48 RBS Group – Q3 2011 Results
RBS Insurance (continued) Key points RBS Insurance continues to undertake a significant programme of investment, designed to achieve a substantial improvement in financial and operational performance ahead of its planned divestment from the Group. The results of the first phase of this transformation - to recover profitability - are now apparent after four successive quarters of year-on-year improvement. The clearest evidence of the recovery is in September YTD 2011 underwriting profit of £761 million, an increase of £591 million versus September YTD 2010, primarily driven by a substantial improvement in net claims. The loss ratio for the first 9 months of 2011 was 72% compared with 93% for the equivalent period in 2010. RBS Insurance is also making good progress in building its competitive advantage through its investment programme and business transformation, the largest element of which is the transformation of claims operations. Launched this year, the first phase of a new Claims Centre system now processes 100% of new Churchill home claims and 70% of all new Churchill, Direct Line, and Privilege motor claims. This system is set to achieve a substantial uplift in operational and financial performance. The rollout of a rating engine, which is largely complete on motor, and new pricing tools will complement customer propositions in order to generate greater value from RBS Insurance’s multi-brand, multi-distribution strategy. Implementation of the plan to rationalise the number of sites occupied, announced in 2010, continues, with 10 site exits to date. Progress is also being made to simplify the legal entity structure, to improve the efficient use of capital and to facilitate compliance with the Solvency II regulations. Investment markets remain challenging as yields on quality fixed income instruments remain low. RBS Insurance’s investment portfolio is composed of high quality gilts and bonds and cash. Of the total portfolio of £9.7 billion, 1.5% is directly exposed to issuers in Spain, Italy and Ireland. There is no direct exposure to either Greece or Portugal. In September 2011 it was announced by The Ministry of Justice that referral fees will be banned. From a customer perspective, RBS Insurance is supportive of this proposal provided that there is a contemporaneous reduction in legal fees. Overall, RBS Insurance is making good progress, has a positive momentum and is well positioned with powerful brands, coupled with a transformed claims function. In personal lines the business will continue to look for partners that fit with its strategy of providing a full end-to-end service, while complementing its own business and distribution channels. Elsewhere, RBS Insurance continues to develop its commercial and international divisions.

49 RBS Group – Q3 2011 Results
RBS Insurance (continued) Key points (continued) Q3 2011 compared with Q2 2011 • Operating profit reduced by £16 million from the previous quarter as a result of seasonal trends,
reduced other income and the phasing of expenses. • Overall gross written premium has increased by £43 million quarter-on-quarter. This was
primarily driven by motor, up £30 million, due to seasonality, and home, up £25 million, as aresult of higher web renewals on own brands and growing partnerships with Nationwide BuildingSociety and the RBS branch network . These increases were partially offset by a £19 million fallin commercial reflecting a seasonal high in Q2 2011.
• The quarter saw continued income growth in the International business of £11 million principallydue to the flow through of higher written premiums in Italy. Home income also increased, by£3 million. These increases partially offset the reductions in motor business from lower earnedpremiums together with the reduction in income from personal lines broker activities, which arein run-off.
• Claims decreased by £9 million, with lower motor claims volumes as a result of reducedaccidental damage and third party property damage frequency.
• Total direct expenses were up £6 million on the prior quarter primarily due to the phasing ofmarketing spend.
• Investment income rose by £3 million in the quarter with realised gains on the sale of bondspartially offset by lower gilt yields.
• The loss ratio reduced by 1% to 70%, the expense ratio remained at 20%, and the combinedratio improved by 1% to 98%.
Q3 2011 compared with Q3 2010 • Operating profit was £123 million compared with a loss of £33 million for Q3 2010. The loss in
Q3 2010 included reserve strengthening for bodily injury claims. The improved results were alsoattributable to the reduction in the risk of the book, selected business line exits, and pricingaction taken. These factors led to a £247 million improvement in claims year-on-year.
• International in-force policies have increased by 28% year-on-year primarily driven by growth inItaly including a partnership with Fiat which commenced in Q4 2010. Motor in-force policieshave reduced by 15%, reflecting the continued de-risking activity over the same period.
• Overall gross written premium is down £51 million year-on-year. ○ Motor gross written premium declined £54 million driven by continued de-risking of the book
coupled with lower new business and lower average premiums as a result of improvements in mix.
○ Other gross written premium was down £55 million due to the exit of unprofitable business lines.
○ International gross written premium was up £46 million, primarily driven by growth involumes, including through the Fiat partnership Italy.
○ Commercial gross written premium increased £11 million, driven by growth in the property and liability books partially offset by a reduction in the van business.
• Total income was down £88 million year-on-year, principally due to lower premium income andlower other income in motor driven by reduced volumes.
• Other expenses were up £11 million due to the phasing of marketing spend. Total expenseswere flat.

50 RBS Group – Q3 2011 Results
Central items Quarter ended Nine months ended
30 September
2011 30 June
2011 30 September
2010 30 September
2011 30 September
2010 £m £m £m £m £m
Central items not allocated 67 47 76 71 462
Funding and operating costs have been allocated to operating divisions based on direct service usage, the requirement for market funding and other appropriate drivers where services span more than one division. Residual unallocated items relate to volatile corporate items that do not naturally reside within a division. Key points Q3 2011 compared with Q2 2011 • Central items not allocated represented a credit of £67 million, an increase of £20 million on the
previous quarter. This movement was driven by increased profits on bond disposals in Q3 2011partially offset by non-repeat of the Q2 2011 gain on the sale of the investment in VISA.
Q3 2011 compared with Q3 2010 • Central items not allocated represented a credit of £67 million, a decline of £9 million on
Q3 2010 due to slightly lower bond disposal gains in Q3 2011.

51 RBS Group – Q3 2011 Results
Non-Core Quarter ended Nine months ended
30 September
2011 30 June
2011 30 September
2010 30 September
2011 30 September
2010 £m £m £m £m £m
Income statement Net interest income 164 285 438 752 1,540
Net fees and commissions (85) 47 43 9 305 (Loss)/income from trading activities (246) 230 219 (314) 121 Insurance net premium income 44 95 180 277 521 Other operating income - rental income 182 206 166 580 534 - other (1) (13) 115 (176) 206 (378)
Non-interest income (118) 693 432 758 1,103
Total income 46 978 870 1,510 2,643
Direct expenses - staff (93) (109) (172) (293) (626) - operating lease depreciation (82) (87) (126) (256) (344) - other (62) (68) (133) (199) (432)Indirect expenses (86) (71) (130) (233) (373)
(323) (335) (561) (981) (1,775)
Operating (loss)/profit before other operating charges and impairment losses (277) 643 309 529 868 Insurance net claims (38) (90) (144) (256) (492)Impairment losses (682) (1,411) (1,171) (3,168) (4,265)
Operating loss (997) (858) (1,006) (2,895) (3,889)
Note: (1) Includes losses on disposals (quarter ended 30 September 2011 - £37 million; quarter ended 30 June 2011 -
£20 million; quarter ended 30 September 2010 - £253 million; nine months ended 30 September 2011 - £91 million; ninemonths ended 30 September 2010 - £257 million).

52 RBS Group – Q3 2011 Results
Non-Core (continued) Quarter ended Nine months ended
30 September
2011 30 June
2011 30 September
2010 30 September
2011 30 September
2010 £m £m £m £m £m
Analysis of income/(loss)by business Portfolios & banking 214 830 280 1,642 1,516 International businesses 101 137 182 327 694 Markets (269) 11 408 (459) 433
Total income 46 978 870 1,510 2,643 (Loss)/income from trading activities Monoline exposures (230) (67) 191 (427) 52 Credit derivative product companies (5) (21) (15) (66) (101)Asset-backed products (1) (51) 36 160 51 202 Other credit exotics (7) 8 (2) (167) 56 Equities (11) (2) (15) (12) (28)Banking book hedges 73 (9) (123) 35 (12)Other (2) (15) 285 23 272 (48)
(246) 230 219 (314) 121 Impairment losses Portfolios & banking 656 1,405 1,159 3,119 4,070 International businesses 17 15 25 52 141 Markets 9 (9) (13) (3) 54
Total impairment losses 682 1,411 1,171 3,168 4,265 Loan impairment charge as % of gross customer loans and advances (excluding reverse repurchase agreements) (3) Portfolios & banking 2.8% 6.1% 4.0% 4.7% 4.7% International businesses 2.7% 1.9% 1.5% 2.8% 2.9% Markets (0.4%) (1.2%) 0.2% (1.1%) 13.0%
Total 2.8% 6.0% 3.9% 4.6% 4.7%
Notes: (1) Asset-backed products include super senior asset-backed structures and other asset-backed products. (2) Q3 2011 includes profits in RBS Sempra Commodities JV of £1 million (quarter ended 30 September 2010 - £78 million).
Q2 2011 includes securities gains of £362 million not repeated in Q3 2011. (3) Includes disposal groups.

53 RBS Group – Q3 2011 Results
Non-Core (continued) Key metrics Quarter ended Nine months ended
30 September
2011 30 June
2011 30 September
2010 30 September
2011 30 September
2010
Performance ratios Net interest margin 0.43% 0.87% 1.04% 0.74% 1.18% Cost:income ratio nm 34% 64% 65% 67% Adjusted cost:income ratio nm 38% 77% 78% 83%
30 September
201130 June
2011 31 December
2010 £bn £bn Change £bn Change
Capital and balance sheet (1) Total third party assets (excluding derivatives) (2) 105.1 112.6 (7%) 137.9 (24%)Total third party assets (including derivatives) (2) 117.7 134.7 (13%) 153.9 (24%)Loans and advances to customers (gross) 88.9 94.9 (6%) 108.4 (18%)Customer deposits 4.3 5.0 (14%) 6.7 (36%)Risk elements in lending 24.6 24.9 (1%) 23.4 5% Risk-weighted assets (2) 117.9 124.7 (5%) 153.7 (23%) nm = not meaningful Notes: (1) Includes disposal groups. (2) Includes RBS Sempra Commodities JV (30 September 2011 Third party assets, excluding derivatives (TPAs)
£0.3 billion, RWAs £1.7 billion; 30 June 2011 TPAs £1.1 billion, RWAs £1.9 billion; 31 December 2010 TPAs£6.7 billion, RWAs £4.3 billion).
30 September
2011 30 June
2011 31 December
2010 £bn £bn £bn
Gross customer loans and advances Portfolios & banking 86.6 92.1 104.9 International businesses 2.2 2.7 3.5 Markets 0.1 0.1 -
88.9 94.9 108.4 Risk-weighted assets Portfolios & banking 66.6 72.6 83.5 International businesses 4.5 5.2 5.6 Markets 46.8 46.9 64.6
117.9 124.7 153.7

54 RBS Group – Q3 2011 Results
Non-Core (continued) Third party assets (excluding derivatives)
Quarter ended 30 September 2011
30 June
2011 Run-off Disposals/
restructuring Drawings/ roll overs Impairments FX
30 September 2011
£bn £bn £bn £bn £bn £bn £bn
Commercial real estate 36.6 0.3 (0.6) 0.2 (0.5) (0.7) 35.3 Corporate 50.4 (2.4) (1.3) 0.5 - (0.3) 46.9 SME 2.7 (0.3) - - - - 2.4 Retail 8.0 (0.3) (0.3) - (0.1) 0.1 7.4 Other 2.3 (0.4) - - - - 1.9 Markets 11.5 (0.9) (0.4) 0.6 - 0.1 10.9
Total (excluding derivatives) 111.5 (4.0) (2.6) 1.3 (0.6) (0.8) 104.8 Markets - RBS Sempra Commodities JV 1.1 - (0.8) - - - 0.3
Total (1) 112.6 (4.0) (3.4) 1.3 (0.6) (0.8) 105.1 Quarter ended 30 June 2011
31 March
2011 Run-off Disposals/
restructuring Drawings/ roll overs Impairments FX
30 June 2011
£bn £bn £bn £bn £bn £bn £bn
Commercial real estate 38.7 (1.1) (0.3) 0.2 (1.3) 0.4 36.6 Corporate 56.0 (2.6) (4.0) 0.6 - 0.4 50.4 SME 3.1 (0.4) - - - - 2.7 Retail 8.3 (0.2) - - (0.1) - 8.0 Other 2.5 (0.2) - - - - 2.3 Markets 12.3 (0.7) (0.4) 0.3 - - 11.5
Total (excluding derivatives) 120.9 (5.2) (4.7) 1.1 (1.4) 0.8 111.5 Markets - RBS Sempra Commodities JV 3.9 (0.5) (2.2) - - (0.1) 1.1
Total (1) 124.8 (5.7) (6.9) 1.1 (1.4) 0.7 112.6
Quarter ended 30 September 2010
30 June
2010 Run-off Disposals/
restructuring Drawings/ roll overs Impairments FX
30 September 2010
£bn £bn £bn £bn £bn £bn £bn
Commercial real estate 44.1 2.9 (0.3) (0.2) (1.2) 1.2 46.5 Corporate 70.4 (2.8) (2.4) 0.6 0.1 0.2 66.1 SME 4.7 (0.8) - - - - 3.9 Retail 16.8 (6.2) - - (0.1) (0.2) 10.3 Other 3.0 (0.2) (0.3) 0.1 - - 2.6 Markets 22.3 (1.4) (4.4) 0.4 - (0.4) 16.5
Total (excluding derivatives) 161.3 (8.5) (7.4) 0.9 (1.2) 0.8 145.9 Markets - RBS Sempra Commodities JV 12.7 (0.5) (3.3) - - (0.6) 8.3
Total (1) 174.0 (9.0) (10.7) 0.9 (1.2) 0.2 154.2
Notes: (1) £1 billion of disposals have been signed as at 30 September 2011 but are pending completion (30 June 2011 -
£2 billion; 30 September 2010 - £9 billion). (2) Business restructuring in Q3 2011 resulted in third party assets of £1 billion transferring from Corporate to Commercial
Real Estate resulting in run-off totalling £0.3 billion in the quarter.

55 RBS Group – Q3 2011 Results
Non-Core (continued) Quarter ended Nine months ended
30 September
2011 30 June
2011 30 September
2010 30 September
2011 30 September
2010 £m £m £m £m £m
Impairment losses by donating division and sector
UK Retail Mortgages 1 1 1 (1) 4 Personal 1 3 4 7 6
Total UK Retail 2 4 5 6 10
UK Corporate Manufacturing and infrastructure 3 47 5 50 21 Property and construction 92 36 130 141 334 Transport - 26 26 46 23 Banking and financial institutions - 1 (8) 4 18 Lombard 12 25 25 55 79 Invoice finance - - (3) - (3)Other 18 46 (2) 75 119
Total UK Corporate 125 181 173 371 591
Ulster Bank Mortgages - - (1) - 42 Commercial real estate - investment 74 161 180 458 424 - development 162 810 415 1,475 1,163 Other corporate 45 6 82 158 270 Other EMEA 2 5 13 13 46
Total Ulster Bank 283 982 689 2,104 1,945
US Retail & Commercial Auto and consumer 14 12 (2) 51 45 Cards - (3) 2 (10) 20 SBO/home equity 57 58 57 168 226 Residential mortgages 4 6 3 14 5 Commercial real estate (4) 11 49 26 154 Commercial and other (1) (6) 7 (10) 15
Total US Retail & Commercial 70 78 116 239 465
Global Banking & Markets Manufacturing and infrastructure 23 (6) (53) 15 (305)Property and construction 189 217 147 511 1,120 Transport (6) (1) 8 (13) 9 Telecoms, media and technology 27 34 32 50 32 Banking and financial institutions (29) (39) 5 (67) 177 Other (1) (36) 52 (45) 177
Total Global Banking & Markets 203 169 191 451 1,210
Other Wealth 1 (1) 7 1 51 Global Transaction Services - (3) (10) (3) (7)Central items (2) 1 - (1) -
Total Other (1) (3) (3) (3) 44
Total impairment losses 682 1,411 1,171 3,168 4,265
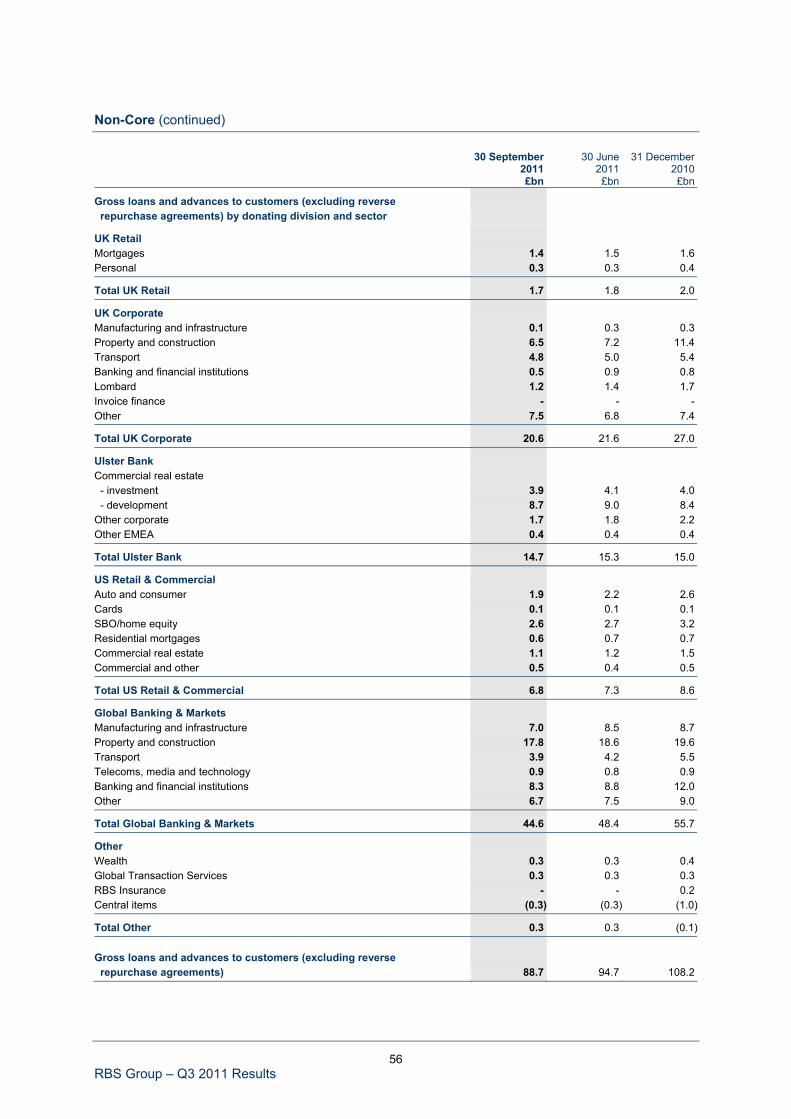
56 RBS Group – Q3 2011 Results
Non-Core (continued)
30 September
2011 30 June
2011 31 December
2010 £bn £bn £bn
Gross loans and advances to customers (excluding reverse repurchase agreements) by donating division and sector
UK Retail Mortgages 1.4 1.5 1.6 Personal 0.3 0.3 0.4
Total UK Retail 1.7 1.8 2.0
UK Corporate Manufacturing and infrastructure 0.1 0.3 0.3 Property and construction 6.5 7.2 11.4 Transport 4.8 5.0 5.4 Banking and financial institutions 0.5 0.9 0.8 Lombard 1.2 1.4 1.7 Invoice finance - - - Other 7.5 6.8 7.4
Total UK Corporate 20.6 21.6 27.0
Ulster Bank Commercial real estate - investment 3.9 4.1 4.0 - development 8.7 9.0 8.4 Other corporate 1.7 1.8 2.2 Other EMEA 0.4 0.4 0.4
Total Ulster Bank 14.7 15.3 15.0
US Retail & Commercial Auto and consumer 1.9 2.2 2.6 Cards 0.1 0.1 0.1 SBO/home equity 2.6 2.7 3.2 Residential mortgages 0.6 0.7 0.7 Commercial real estate 1.1 1.2 1.5 Commercial and other 0.5 0.4 0.5
Total US Retail & Commercial 6.8 7.3 8.6
Global Banking & Markets Manufacturing and infrastructure 7.0 8.5 8.7 Property and construction 17.8 18.6 19.6 Transport 3.9 4.2 5.5 Telecoms, media and technology 0.9 0.8 0.9 Banking and financial institutions 8.3 8.8 12.0 Other 6.7 7.5 9.0
Total Global Banking & Markets 44.6 48.4 55.7
Other Wealth 0.3 0.3 0.4 Global Transaction Services 0.3 0.3 0.3 RBS Insurance - - 0.2 Central items (0.3) (0.3) (1.0)
Total Other 0.3 0.3 (0.1) Gross loans and advances to customers (excluding reverse repurchase agreements) 88.7 94.7 108.2

57 RBS Group – Q3 2011 Results
Non-Core (continued) Key points Non-Core continues to deliver in a challenging and uncertain environment with further reductions in Q3 2011 in third party assets, risk weighted assets, impairment charges and headcount. The division remains on track to reduce third party assets to £96 billion by the end of 2011 and continues to focus upon reducing required levels of capital and funding. Income in Q3 2011 was significantly lower than Q2 2011 reflecting equity-related gains in Q2 not repeated in Q3, lower underlying revenue in line with balance sheet reduction, a one-off charge in relation to de-risking the portfolio and fair value write-downs reflecting market conditions. Despite ongoing difficulties in the commercial real estate sector and Ireland in particular, Q3 2011 impairment losses decreased by £729 million compared with Q2 2011. Q3 2011 compared with Q2 2011 • Non-Core continued to reduce the size of the balance sheet with third party assets declining by
£8 billion to £105 billion. This reduction was principally driven by run-off of £4 billion anddisposals of £3 billion. At the end of the quarter £1 billion of deals were signed but notcompleted, compared with £2 billion at the end of Q2 2011.
• Risk-weighted assets fell by £7 billion in Q3 2011. The reduction principally reflected continuedasset sales, run-off and impairments partially offset by foreign exchange movements. Specificportfolio de-risking also contributed towards the decline in the quarter.
• Non-Core operating loss was £997 million in the third quarter, compared with £858 million inQ2 2011. Net interest income fell by £121 million reflecting a lower balance sheet, increasedterm funding and liquidity costs and the non-repeat of some recoveries in Q2 2011. The declinein non-interest income reflected the non-repeat of circa £500 million of valuation gains recordedin Q2 2011, and losses in trading income due to widening credit spreads on monoline andsecurities positions.
• Impairments fell by £729 million from Q2 2011, reflecting substantial provisioning in relation todevelopment land values in Ireland during Q2 2011 not repeated in Q3 2011.
• Non-Core headcount continues to decline in line with disposal activity. Headcount reductions inQ3 2011 predominantly relate to Asia, Non-Core Insurance and RBS Sempra Commodities JV.
Q3 2011 compared with Q3 2010 • Third party assets declined by £49 billion (32%) principally reflecting disposals (£29 billion) and
run-off (£21 billion).
• Risk-weighted assets were £49 billion lower, driven principally by significant disposal activitycombined with run-off.
• Market uncertainty resulted in higher losses on trading activities in Q3 2011 compared withQ3 2010, which included disposal gains on super senior assets and valuation gains in relation tomonolines. In line with ongoing disposal and run-off activity, both net interest income andinsurance premium income continue to decline.
• Expenses and headcount continued to fall reflecting disposal activity principally in exit countries,RBS Sempra Commodities JV and Non-Core Insurance.

58 RBS Group – Q3 2011 Results
Condensed consolidated income statement for the period ended 30 September 2011 Quarter ended Nine months ended
30 September
2011 30 June
2011 30 September
2010 30 September
2011 30 September
2010 £m £m £m £m £m
Interest receivable 5,371 5,404 5,584 16,176 17,164 Interest payable (2,294) (2,177) (2,173) (6,571) (6,535)
Net interest income 3,077 3,227 3,411 9,605 10,629
Fees and commissions receivable 1,452 1,700 2,037 4,794 6,141 Fees and commissions payable (304) (323) (611) (887) (1,762)Income from trading activities 957 1,147 277 2,939 4,153 Gain on redemption of own debt 1 255 - 256 553 Other operating income (excluding insurance premium income) 2,384 1,142 (317) 3,917 476 Insurance net premium income 1,036 1,090 1,289 3,275 3,856
Non-interest income 5,526 5,011 2,675 14,294 13,417
Total income 8,603 8,238 6,086 23,899 24,046
Staff costs (2,076) (2,210) (2,423) (6,685) (7,477)Premises and equipment (604) (602) (611) (1,777) (1,693)Other administrative expenses (962) (1,752) (914) (3,635) (2,947)Depreciation and amortisation (485) (453) (603) (1,362) (1,604)
Operating expenses (4,127) (5,017) (4,551) (13,459) (13,721)
Profit before other operating charges and impairment losses 4,476 3,221 1,535 10,440 10,325 Insurance net claims (734) (793) (1,142) (2,439) (3,601)Impairment losses (1,738) (3,106) (1,953) (6,791) (7,115)
Operating profit/(loss) before tax 2,004 (678) (1,560) 1,210 (391)Tax (charge)/credit (791) (222) 295 (1,436) (637)
Profit/(loss) from continuing operations 1,213 (900) (1,265) (226) (1,028)Profit/(loss) from discontinued operations, net of tax 6 21 18 37 (688)
Profit/(loss) for the period 1,219 (879) (1,247) (189) (1,716)Non-controlling interests 7 (18) 101 (10) 703 Preference share and other dividends - - - - (124)
Profit/(loss) attributable to ordinary and B shareholders 1,226 (897) (1,146) (199) (1,137) Basic earnings/(loss) per ordinary and B share from continuing operations 1.1p (0.8p) (1.1p) (0.2p) (0.5p)
Diluted earnings/(loss) per ordinary and B share from continuing operations 1.1p (0.8p) (1.1p) (0.2p) (0.5p)
Basic (loss)/earnings per ordinary and B share from discontinued operations - - - - -
Diluted (loss)/earnings per ordinary and B share from discontinued operations - - - - -
In the income statement above, one-off and other items as shown on page 16 are included in the appropriate caption. A reconciliation between the income statement above and the managed view income statement on page 10 is given in Appendix 1 to this announcement.
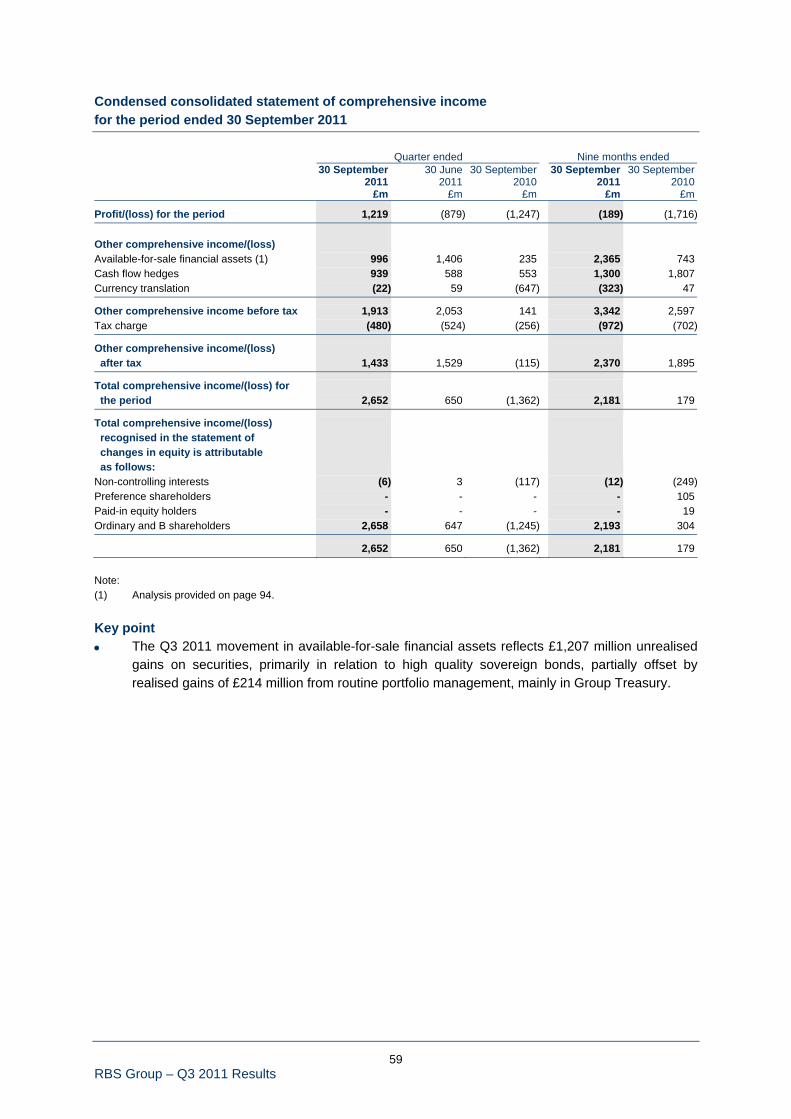
59 RBS Group – Q3 2011 Results
Condensed consolidated statement of comprehensive income for the period ended 30 September 2011 Quarter ended Nine months ended
30 September
2011 30 June
2011 30 September
2010 30 September
2011 30 September
2010 £m £m £m £m £m
Profit/(loss) for the period 1,219 (879) (1,247) (189) (1,716) Other comprehensive income/(loss) Available-for-sale financial assets (1) 996 1,406 235 2,365 743 Cash flow hedges 939 588 553 1,300 1,807 Currency translation (22) 59 (647) (323) 47
Other comprehensive income before tax 1,913 2,053 141 3,342 2,597 Tax charge (480) (524) (256) (972) (702)
Other comprehensive income/(loss) after tax 1,433 1,529 (115) 2,370 1,895
Total comprehensive income/(loss) for the period 2,652 650 (1,362) 2,181 179
Total comprehensive income/(loss) recognised in the statement of changes in equity is attributable as follows: Non-controlling interests (6) 3 (117) (12) (249)Preference shareholders - - - - 105 Paid-in equity holders - - - - 19 Ordinary and B shareholders 2,658 647 (1,245) 2,193 304
2,652 650 (1,362) 2,181 179 Note: (1) Analysis provided on page 94. Key point • The Q3 2011 movement in available-for-sale financial assets reflects £1,207 million unrealised
gains on securities, primarily in relation to high quality sovereign bonds, partially offset byrealised gains of £214 million from routine portfolio management, mainly in Group Treasury.

60 RBS Group – Q3 2011 Results
Condensed consolidated balance sheet at 30 September 2011
30 September
2011 30 June
2011 31 December
2010 £m £m £m
Assets Cash and balances at central banks 78,445 64,351 57,014 Net loans and advances to banks 52,602 53,133 57,911 Reverse repurchase agreements and stock borrowing 48,127 41,973 42,607 Loans and advances to banks 100,729 95,106 100,518 Net loans and advances to customers 485,573 489,572 502,748 Reverse repurchase agreements and stock borrowing 54,132 56,162 52,512 Loans and advances to customers 539,705 545,734 555,260 Debt securities 229,657 243,645 217,480 Equity shares 14,888 24,951 22,198 Settlement balances 21,526 24,566 11,605 Derivatives 572,344 394,872 427,077 Intangible assets 14,744 14,592 14,448 Property, plant and equipment 17,060 17,357 16,543 Deferred tax 4,988 6,245 6,373 Prepayments, accrued income and other assets 10,598 11,143 12,576 Assets of disposal groups 3,044 3,407 12,484
Total assets 1,607,728 1,445,969 1,453,576 Liabilities Bank deposits 78,370 71,573 66,051 Repurchase agreements and stock lending 36,227 35,381 32,739 Deposits by banks 114,597 106,954 98,790 Customer deposits 433,660 428,703 428,599 Repurchase agreements and stock lending 95,691 88,822 82,094 Customer accounts 529,351 517,525 510,693 Debt securities in issue 194,511 213,797 218,372 Settlement balances 17,983 22,905 10,991 Short positions 48,495 56,106 43,118 Derivatives 561,790 387,809 423,967 Accruals, deferred income and other liabilities 22,938 24,065 23,089 Retirement benefit liabilities 1,855 2,239 2,288 Deferred tax 1,913 2,092 2,142 Insurance liabilities 6,628 6,687 6,794 Subordinated liabilities 26,275 26,311 27,053 Liabilities of disposal groups 2,516 3,237 9,428
Total liabilities 1,528,852 1,369,727 1,376,725 Equity Non-controlling interests 1,433 1,498 1,719 Owners’ equity* Called up share capital 15,318 15,317 15,125 Reserves 62,125 59,427 60,007
Total equity 78,876 76,242 76,851
Total liabilities and equity 1,607,728 1,445,969 1,453,576 * Owners’ equity attributable to: Ordinary and B shareholders 72,699 70,000 70,388 Other equity owners 4,744 4,744 4,744
77,443 74,744 75,132
61 RBS Group – Q3 2011 Results
Commentary on condensed consolidated balance sheet Total assets of £1,607.7 billion at 30 September 2011 were up £161.8 billion, 11%, compared with 30 June 2011. This was principally driven by an increase in the mark-to-market value of derivatives within Global Banking & Markets, together with higher cash and balances at central banks in stressed global financial markets. This increase was partly offset by the continuing planned disposal of Non-Core assets. Cash and balances at central banks increased £14.1 billion, 22%, to £78.4 billion principally due to the placing of short-term cash surpluses. Loans and advances to banks increased £5.6 billion, 6%, to £100.7 billion. Within this, reverse repurchase agreements and stock borrowing (‘reverse repos’) were up £6.2 billion, 15%, to £48.1 billion with bank placings declining £0.6 billion, 1%, to £52.6 billion. Loans and advances to customers declined £6.0 billion, 1%, to £539.7 billion. Within this, reverse repurchase agreements were down £2.0 billion, 4%, to £54.1 billion. Customer lending decreased by £4.0 billion, 1%, to £485.6 billion, or £4.0 billion to £506.2 billion before impairments. This reflected planned reductions in Non-Core of £5.4 billion, along with declines in UK Corporate, £0.8 billion, UK Retail, £0.3 billion and Ulster Bank, £0.3 billion, together with the effect of exchange rate and other movements, £0.4 billion. These were partially offset by growth in Global Banking & Markets, £2.2 billion, Global Transaction Services, £0.5 billion, Wealth, £0.3 billion and US Retail & Commercial, £0.2 billion. Debt securities were down £14.0 billion, 6%, to £229.7 billion, driven mainly by a reduction in holdings of government and financial institution bonds within Global Banking & Markets and Group Treasury. Equity shares decreased £10.1 billion, 40%, to £14.9 billion reflecting primarily the closure of positions to reduce the Groups’ level of unsecured funding requirements to mitigate the potential impact of unfavourable market conditions. Settlement balances declined £3.0 billion, 12%, to £21.5 billion as a result of decreased customer activity. Movements in the value of derivative assets up, £177.5 billion, 45%, to £572.3 billion, and liabilities, up £174.0 billion, 45% to £561.8 billion, primarily reflect increases in interest rate contracts as a result of a significant downwards shift in interest rates across all major currencies, together with increases in the mark-to-market value of credit derivatives as a result of widening credit spreads and rising credit default swap prices. Further contributing to the increase was the net effect of currency movements, with sterling weakening against the US dollar but strengthening against the euro. Deposits by banks increased £7.6 billion, 7%, to £114.6 billion, with higher repurchase agreements and stock lending (‘repos’), up £0.8 billion, 2%, to £36.2 billion and inter-bank deposits up £6.8 billion, 9%, to £78.4 billion.

62 RBS Group – Q3 2011 Results
Commentary on condensed consolidated balance sheet (continued) Customer accounts were up £11.8 billion, 2%, to £529.4 billion. Within this, repos increased £6.9 billion, 8%, to £95.7 billion. Excluding repos, customer deposits were up £4.9 billion, 1%, at £433.7 billion, reflecting growth in Global Banking & Markets, £4.1 billion, UK Retail, £2.7 billion, US Retail & Commercial, £0.4 billion and Wealth, £0.1 billion, together with exchange and other movements, £0.6 billion. This was partly offset by decreases in Global Transaction Services, £1.5 billion, UK Corporate, £0.7 billion, Non-Core, £0.7 billion and Ulster Bank, £0.1 billion. Debt securities in issue declined £19.3 billion, 9%, to £194.5 billion as a result of reduced issuance by Global Banking & Markets and Group Treasury. Settlement balances declined £4.9 billion, 21%, to £18.0 billion and short positions were down £7.6 billion, 14%, to £48.5 billion due to decreased customer activity. Owner’s equity increased by £2.7 billion, 4%, to £77.4 billion, driven by the attributable profit for the period of £1.2 billion and increases in available-for-sale reserves, £0.7 billion and cash flow hedging reserves, £0.7 billion.

63 RBS Group – Q3 2011 Results
Average balance sheet
Quarter ended Nine months ended
30 September
201130 June
2011 30 September
2011 30 September
2010 % % % %
Average yields, spreads and margins of the banking business Gross yield on interest-earning assets of banking business 3.21 3.28 3.27 3.27 Cost of interest-bearing liabilities of banking business (1.69) (1.60) (1.62) (1.45)
Interest spread of banking business 1.52 1.68 1.65 1.82 Benefit from interest-free funds 0.32 0.29 0.29 0.18
Net interest margin of banking business 1.84 1.97 1.94 2.00 Average interest rates The Group's base rate 0.50 0.50 0.50 0.50 London inter-bank three month offered rates - Sterling 0.87 0.82 0.83 0.69 - Eurodollar 0.30 0.26 0.29 0.36 - Euro 1.51 1.36 1.30 0.68

64 RBS Group – Q3 2011 Results
Average balance sheet (continued) Quarter ended Quarter ended 30 September 2011 30 June 2011 Average Average balance Interest Rate balance Interest Rate £m £m % £m £m %
Assets Loans and advances to banks 72,461 154 0.84 67,191 164 0.98 Loans and advances to customers 469,910 4,506 3.80 470,593 4,545 3.87 Debt securities 121,585 713 2.33 123,888 705 2.28
Interest-earning assets - banking business 663,956 5,373 3.21 661,672 5,414 3.28
Trading business 281,267 284,378 Non-interest earning assets 653,592 557,649
Total assets 1,598,815 1,503,699
Memo: Funded assets 1,087,227 1,089,400
Liabilities Deposits by banks 64,198 245 1.51 65,119 245 1.51 Customer accounts 338,469 921 1.08 336,317 857 1.02 Debt securities in issue 161,703 944 2.32 171,709 897 2.10 Subordinated liabilities 23,000 134 2.31 23,320 148 2.55 Internal funding of trading business (48,161) 55 (0.45) (51,609) 22 (0.17)
Interest-bearing liabilities - banking business 539,209 2,299 1.69 544,856 2,169 1.60
Trading business 314,626 314,099 Non-interest-bearing liabilities - demand deposits 66,496 64,811 - other liabilities 602,235 505,585 Owners’ equity 76,249 74,348
Total liabilities and owners’ equity 1,598,815 1,503,699
Notes: (1) Interest receivable and interest payable on trading assets and liabilities are included in income from trading activities. (2) Interest receivable has been increased by nil (Q2 2011 - £6 million) and interest payable has been decreased by
£1 million (Q2 2011 - nil) to exclude the RFS Holdings minority interest. Related interest-earning assets and interest-bearing liabilities have also been adjusted.
(3) Interest receivable has been increased by £2 million (Q2 2011 - £2 million) and interest payable has been increased by£47 million (Q2 2011 - £34 million) to record interest on financial assets and liabilities designated as at fair value throughprofit or loss. Related interest-earning assets and interest-bearing liabilities have also been adjusted.
(4) Interest receivable has been increased by nil (Q2 2011 - £2 million) and interest payable has been decreased by£41 million (Q2 2011 - £42 million) in respect of non-recurring adjustments.

65 RBS Group – Q3 2011 Results
Average balance sheet (continued) Nine months ended Nine months ended 30 September 2011 30 September 2010 Average Average balance Interest Rate balance Interest Rate £m £m % £m £m %
Assets Loans and advances to banks 67,916 490 0.96 49,686 425 1.14 Loans and advances to customers 471,551 13,644 3.87 517,209 14,086 3.64 Debt securities 121,949 2,056 2.25 132,589 2,604 2.63
Interest-earning assets - banking business 661,416 16,190 3.27 699,484 17,115 3.27
Trading business 281,601 276,338 Non-interest earning assets 573,261 725,760
Total assets 1,516,278 1,701,582
Memo: Funded assets 1,081,562 1,197,599
Liabilities Deposits by banks 65,323 749 1.53 84,955 1,043 1.64 Customer accounts 334,890 2,609 1.04 344,223 2,795 1.09 Debt securities in issue 169,622 2,687 2.12 198,051 2,426 1.64 Subordinated liabilities 23,795 452 2.54 29,860 529 2.37 Internal funding of trading business (50,581) 85 (0.22) (43,349) (151) 0.47
Interest-bearing liabilities - banking business 543,049 6,582 1.62 613,740 6,642 1.45
Trading business 310,184 295,847 Non-interest-bearing liabilities - demand deposits 65,011 48,119 - other liabilities 523,038 666,459 Owners’ equity 74,996 77,417
Total liabilities and owners’ equity 1,516,278 1,701,582 Notes: (1) Interest receivable and interest payable on trading assets and liabilities are included in income from trading activities. (2) Interest-earning assets and interest-bearing liabilities for 2010 exclude the Retail bancassurance long-term assets and
liabilities, attributable to policyholders, in view of their distinct nature. As a result, net interest income has beenincreased by £4 million for the nine months ended 30 September 2010.
(3) Interest receivable has been increased by £5 million (nine months ended 30 September 2010 - £9 million decrease) andinterest payable has been decreased by £1 million (nine months ended 30 September 2010 - £2 million) to exclude theRFS Holdings minority interest. Related interest-earning assets and interest-bearing liabilities have also been adjusted.
(4) Interest receivable has been increased by £7 million for nine months ended 30 September 2011 (nine months ended30 September 2010 - £46 million) and interest payable has been increased by £110 million (nine months ended30 September 2010 - £15 million) to record interest on financial assets and liabilities designated as at fair value throughprofit or loss. Related interest-earning assets and interest-bearing liabilities have also been adjusted.
(5) Interest receivable has been increased by £2 million (nine months ended 30 September 2010 - £90 million decrease)and interest payable has been decreased by £98 million (nine months ended 30 September 2010 - £94 million increase)in respect of non-recurring adjustments.

66 RBS Group – Q3 2011 Results
Condensed consolidated statement of changes in equity for the period ended 30 September 2011 Quarter ended Nine months ended
30 September
2011 30 June
2011 30 September
2010 30 September
2011 30 September
2010 £m £m £m £m £m
Called-up share capital At beginning of period 15,317 15,156 15,029 15,125 14,630 Ordinary shares issued 1 161 1 193 402 Preference shares redeemed - - - - (2)
At end of period 15,318 15,317 15,030 15,318 15,030 Paid-in equity At beginning of period 431 431 431 431 565 Securities redeemed - - - - (132)Transfer to retained earnings - - - - (2)
At end of period 431 431 431 431 431 Share premium account At beginning of period 23,923 23,922 23,858 23,922 23,523 Ordinary shares issued - 1 - 1 217 Redemption of preference shares classified as debt - - - - 118
At end of period 23,923 23,923 23,858 23,923 23,858 Merger reserve At beginning of period 13,222 13,272 13,272 13,272 25,522 Transfer to retained earnings - (50) - (50) (12,250)
At end of period 13,222 13,222 13,272 13,222 13,272 Available-for-sale reserve At beginning of period (1,026) (2,063) (1,459) (2,037) (1,755)Unrealised gains 1,207 781 680 2,150 1,327 Realised (gains)/losses (1) (214) 626 (408) 215 (535)Tax (259) (370) (55) (620) (263)Recycled to profit or loss on disposal of businesses (2) - - - - (16)
At end of period (292) (1,026) (1,242) (292) (1,242) Cash flow hedging reserve At beginning of period 113 (314) (235) (140) (252)Amount recognised in equity 1,203 811 387 2,028 329 Amount transferred from equity to earnings (264) (223) 121 (728) 138 Tax (254) (161) (154) (362) (154)Recycled to profit or loss on disposal of businesses (3) - - - - 58
At end of period 798 113 119 798 119
For the notes to this table refer to page 68.

67 RBS Group – Q3 2011 Results
Condensed consolidated statement of changes in equity for the period ended 30 September 2011 (continued) Quarter ended Nine months ended
30 September
2011 30 June
2011 30 September
2010 30 September
2011 30 September
2010 £m £m £m £m £m
Foreign exchange reserve At beginning of period 4,834 4,754 5,755 5,138 4,528 Retranslation of net assets (31) 189 (778) (271) 997 Foreign currency gains/(losses) on hedges of net assets 10 (116) 157 (30) (452)Tax 34 7 (43) 10 29 Recycled to profit or loss on disposal of businesses - - (6) - (17)
At end of period 4,847 4,834 5,085 4,847 5,085 Capital redemption reserve At beginning of period 198 198 172 198 170 Preference shares redeemed - - - - 2
At end of period 198 198 172 198 172 Contingent capital reserve At beginning and end of period (1,208) (1,208) (1,208) (1,208) (1,208) Retained earnings At beginning of period 19,726 20,713 22,003 21,239 12,134 Profit/(loss) attributable to ordinary and B shareholders and other equity owners - continuing operations 1,225 (899) (1,148) (204) (985) - discontinued operations 1 2 2 5 (28)Equity preference dividends paid - - - - (105)Paid-in equity dividends paid, net of tax - - - - (19)Transfer from paid-in equity - gross - - - - 2 - tax - - - - (1)Equity owners gain on withdrawal of non-controlling interest - gross - - - - 40 - tax - - - - (11)Redemption of equity preference shares - - - - (2,968)Gain on redemption of equity preference shares - - - - 609 Redemption of preference shares classified as debt - - - - (118)Transfer from merger reserve - 50 - 50 12,250 Shares issued under employee share schemes (2) (166) (2) (209) (11)Share-based payments - gross 35 29 42 102 103 - tax (8) (3) 7 (6) 12
At end of period 20,977 19,726 20,904 20,977 20,904

68 RBS Group – Q3 2011 Results
Condensed consolidated statement of changes in equity for the period ended 30 September 2011 (continued) Quarter ended Nine months ended
30 September
2011 30 June
2011 30 September
2010 30 September
2011 30 September
2010 £m £m £m £m £m
Own shares held At beginning of period (786) (785) (816) (808) (121)Shares disposed/(purchased) 13 (6) (7) 19 (711)Shares issued under employee share schemes 2 5 2 18 11
At end of period (771) (786) (821) (771) (821)
Owners’ equity at end of period 77,443 74,744 75,600 77,443 75,600 Non-controlling interests At beginning of period 1,498 1,710 2,492 1,719 16,895 Currency translation adjustments and other movements (1) (14) (20) (22) (481)(Loss)/profit attributable to non-controlling interests - continuing operations (12) (1) (117) (22) (43) - discontinued operations 5 19 16 32 (660)Dividends paid - (39) (46) (39) (4,217)Movements in available-for-sale securities - unrealised (losses)/gains - (1) (76) - (54) - realised losses 3 - 39 36 - tax (1) - 4 - 5 - recycled to profit or loss on disposal of discontinued operations (4) - - - - (7)Movements in cash flow hedging reserves - amounts recognised in equity - - 66 - (99) - tax - - (14) - 33 - recycled to profit or loss on disposal of discontinued operations (5) - - (15) - 1,021 Equity raised - - - - 501 Equity withdrawn and disposals (59) (176) (549) (235) (11,110)Transfer to retained earnings - - - - (40)
At end of period 1,433 1,498 1,780 1,433 1,780
Total equity at end of period 78,876 76,242 77,380 78,876 77,380 Total comprehensive income/(loss) recognised in the statement of changes in equity is attributable as follows: Non-controlling interests (6) 3 (117) (12) (249)Preference shareholders - - - - 105 Paid-in equity holders - - - - 19 Ordinary and B shareholders 2,658 647 (1,245) 2,193 304
2,652 650 (1,362) 2,181 179 Notes: (1) Includes an impairment loss of £733 million in respect of the Group’s holding of Greek government bonds, together with
£109 million of related interest rate hedge adjustments, in the quarter ended 30 June 2011. (2) Net of tax (quarter ended 30 September 2010 - nil; nine months ended 30 September 2010 - £6 million credit). (3) Net of tax (quarter ended 30 September 2010 - nil; nine months ended 30 September 2010 - £20 million charge). (4) Net of tax (quarter ended 30 September 2010 - nil; nine months ended 30 September 2010 - £2 million credit). (5) Net of tax (quarter ended 30 September 2010 - £6 million credit; nine months ended 30 September 2010 - £340 million
charge).

69 RBS Group – Q3 2011 Results
Notes 1. Basis of preparation Having reviewed the Group’s forecasts, projections and other relevant evidence, the directors have a reasonable expectation that the Group will continue in operational existence for the foreseeable future. Accordingly, the Interim Management Statement for the period ended 30 September 2011 has been prepared on a going concern basis. 2. Accounting policies The annual accounts are prepared in accordance with International Financial Reporting Standards issued by the International Accounting Standards Board (IASB) and interpretations issued by the International Financial Reporting Interpretations Committee (IFRIC) of the IASB as adopted by the European Union (EU) (together IFRS). There have been no significant changes to the Group’s principal accounting policies as set out on pages 275 to 283 of the 2010 Annual Report and Accounts. Recent developments in IFRS In May 2011, the IASB issued six new or revised standards: IFRS 10 Consolidated Financial Statements which replaces SIC-12 Consolidation - Special Purpose Entities and the consolidation elements of the existing IAS 27 Consolidated and Separate Financial Statements. The new standard adopts a single definition of control: a reporting entity controls another entity when the reporting entity has the power to direct the activities of that other entity to generate returns for the reporting entity. IAS 27 Separate Financial Statements which comprises those parts of the existing IAS 27 that dealt with separate financial statements. IFRS 11 Joint Arrangements which supersedes IAS 31 Interests in Joint Ventures. IFRS 11 distinguishes between joint operations and joint ventures. Joint operations are accounted for by the investor recognising its assets and liabilities including its share of any assets held and liabilities incurred jointly and its share of revenues and costs. Joint ventures are accounted for in the investor’s consolidated accounts using the equity method. IAS 28 Investments in Associates and Joint Ventures covers joint ventures as well as associates; both must be accounted for using the equity method. The mechanics of the equity method are unchanged. IFRS 12 Disclosure of Interests in Other Entities covers disclosures for entities reporting under IFRS 10 and IFRS 11 replacing those in IAS 28 and IAS 27. Entities are required to disclose information that helps financial statement readers evaluate the nature, risks and financial effects associated with an entity’s interests in subsidiaries, in associates and joint arrangements and in unconsolidated structured entities. IFRS 13 Fair Value Measurement which sets out a single IFRS framework for defining and measuring fair value and requiring disclosures about fair value measurements. These standards are effective for annual periods beginning on or after 1 January 2013. Earlier application is permitted. The Group is reviewing the standards to determine their effect on the Group’s financial reporting.
70 RBS Group – Q3 2011 Results
Notes (continued) 2. Accounting policies (continued) Recent developments in IFRS (continued) In June 2011, the IASB issued amendments to two standards: Amendments to IAS 1 Presentation of Items of Other Comprehensive Income that require items that will never be recognised in profit or loss to be presented separately in other comprehensive income from those that are subject to subsequent reclassification. Amendments IAS 19 Employee Benefits - these require the immediate recognition of all actuarial gains and losses eliminating the ‘corridor approach’; interest cost to be calculated on the net pension liability or asset at the appropriate corporate bond rate; and all past service costs to be recognised immediately when a scheme is curtailed or amended. These amendments are effective for annual periods beginning on or after 1 January 2013. Earlier application is permitted. The Group is reviewing the amendments to determine their effect on the Group’s financial reporting.

71 RBS Group – Q3 2011 Results
Notes (continued) 3. Analysis of income, expenses and impairment losses Quarter ended Nine months ended
30 September
2011 30 June
2011 30 September
2010 30 September
2011 30 September
2010 £m £m £m £m £m
Loans and advances to customers 4,505 4,535 4,683 13,633 14,134 Loans and advances to banks 154 164 153 490 424 Debt securities 712 705 748 2,053 2,606
Interest receivable 5,371 5,404 5,584 16,176 17,164
Customer accounts 919 853 961 2,603 2,795 Deposits by banks 248 249 330 756 1,045 Debt securities in issue 897 863 733 2,577 2,411 Subordinated liabilities 175 190 175 550 435 Internal funding of trading businesses 55 22 (26) 85 (151)
Interest payable 2,294 2,177 2,173 6,571 6,535
Net interest income 3,077 3,227 3,411 9,605 10,629
Fees and commissions receivable 1,452 1,700 2,037 4,794 6,141 Fees and commissions payable - banking (204) (238) (493) (623) (1,500) - insurance related (100) (85) (118) (264) (262)
Net fees and commissions 1,148 1,377 1,426 3,907 4,379
Foreign exchange 441 375 442 1,019 1,274 Interest rate 33 2 866 684 2,027 Credit 366 562 (1,250) 680 (42)Other 117 208 219 556 894
Income from trading activities 957 1,147 277 2,939 4,153
Gain on redemption of own debt 1 255 - 256 553
Operating lease and other rental income 327 350 338 999 1,025 Changes in fair value of own debt 1,887 228 (528) 1,821 (223)Changes in the fair value of securities and other financial assets and liabilities (148) 224 54 144 (97)Changes in the fair value of investment properties (22) (27) (4) (74) (112)Profit on sale of securities 274 193 352 703 506 Profit on sale of property, plant and equipment 5 11 9 27 21 (Loss)/profit on sale of subsidiaries and associates (39) 55 (260) (13) (618)Life business (losses)/profits (8) (3) 49 (13) 61 Dividend income 14 18 17 47 58 Share of profits less losses of associated entities 5 8 8 20 56 Other income 89 85 (352) 256 (201)
Other operating income 2,384 1,142 (317) 3,917 476 Refer to Appendix 1 for a reconciliation between the managed and statutory bases for key line items.

72 RBS Group – Q3 2011 Results
Notes (continued) 3. Analysis of income, expenses and impairment losses (continued) Quarter ended Nine months ended
30 September
2011 30 June
2011 30 September
2010 30 September
2011 30 September
2010 £m £m £m £m £m
Non-interest income (excluding insurance net premium income) 4,490 3,921 1,386 11,019 9,561 Insurance net premium income 1,036 1,090 1,289 3,275 3,856
Total non-interest income 5,526 5,011 2,675 14,294 13,417
Total income 8,603 8,238 6,086 23,899 24,046 Staff costs - wages, salaries and other staff costs 1,798 1,923 2,100 5,780 6,473 - bonus tax 5 11 15 27 84 - social security costs 145 168 153 505 505 - pension costs 128 108 155 373 415
Total staff costs 2,076 2,210 2,423 6,685 7,477 Premises and equipment 604 602 611 1,777 1,693 Other (including Payment Protection Insurance costs) 962 1,752 914 3,635 2,947
Administrative expenses 3,642 4,564 3,948 12,097 12,117 Depreciation and amortisation 485 453 603 1,362 1,604
Operating expenses 4,127 5,017 4,551 13,459 13,721 General insurance 734 793 1,092 2,439 3,547 Bancassurance - - 50 - 54
Insurance net claims 734 793 1,142 2,439 3,601 Loan impairment losses 1,452 2,237 1,908 5,587 6,989 Securities impairment losses - sovereign debt impairment and related interest rate hedge adjustments 202 842 - 1,044 - - other 84 27 45 160 126
Impairment losses 1,738 3,106 1,953 6,791 7,115 Refer to Appendix 1 for a reconciliation between the managed and statutory bases for key line items.

73 RBS Group – Q3 2011 Results
Notes (continued) 4. Loan impairment provisions Operating profit/(loss) is stated after charging loan impairment losses of £1,452 million (Q2 2011 - £2,237 million; Q3 2010 - £1,908 million). The balance sheet loan impairment provisions decreased in the quarter ended 30 September 2011 from £20,759 million to £20,723 million and the movements thereon were: Quarter ended
30 September 2011 30 June 2011 30 September 2010
Core Non- Core Total Core
Non- Core RFS MI Total Core
Non- Core Total
£m £m £m £m £m £m £m £m £m £m
At beginning of period 8,752 12,007 20,759 8,416 10,842 - 19,258 7,633 8,533 16,166 Transfers to disposal groups - - - - 9 - 9 - - - Intra-group transfers - - - - - - - (351) 351 - Currency translation and other adjustments (90) (285) (375) 33 145 - 178 116 175 291 Disposals - - - - - 11 11 - - - Amounts written-off (593) (497) (1,090) (504) (474) - (978) (416) (329) (745)Recoveries of amounts previously written-off 39 55 94 41 126 - 167 80 85 165 Charge to income statement - continued 817 635 1,452 810 1,427 - 2,237 779 1,129 1,908 - discontinued - - - - - (11) (11) Unwind of discount (52) (65) (117) (44) (68) - (112) (50) (65) (115)
At end of period 8,873 11,850 20,723 8,752 12,007 - 20,759 7,791 9,879 17,670
Nine months ended
30 September 2011 30 September 2010
Core Non- Core RFS MI Total Core
Non- Core RFS MI Total
£m £m £m £m £m £m £m £m
At beginning of period 7,866 10,316 - 18,182 6,921 8,252 2,110 17,283 Transfers to disposal groups - - - - - (67) - (67)Intra-group transfers 177 (177) - - (351) 351 - - Currency translation and other adjustments (1) (45) - (46) (163) 294 - 131 Disposals - - 11 11 - (17) (2,149) (2,166)Amounts written-off (1,611) (1,409) - (3,020) (1,479) (3,047) - (4,526)Recoveries of amounts previously written-off 119 261 - 380 184 131 - 315 Charge to income statement - continued 2,479 3,108 - 5,587 2,825 4,164 - 6,989 - discontinued - - (11) (11) - - 39 39 Unwind of discount (156) (204) - (360) (146) (182) - (328)
At end of period 8,873 11,850 - 20,723 7,791 9,879 - 17,670
Provisions at 30 September 2011 include £126 million (30 June 2011 - £132 million; 30 September 2010 - £127 million) in respect of loans and advances to banks. The table above excludes impairments relating to securities.

74 RBS Group – Q3 2011 Results
Notes (continued) 5. Tax The actual tax (charge)/credit differs from the expected tax (charge)/credit computed by applying the standard UK corporation tax rate of 26.5% (2010 - 28%) as follows:
Quarter ended Nine months ended
30 September
2011 30 June
2011 30 September
2010 30 September
2011 30 September
2010 £m £m £m £m £m
Profit/(loss) before tax 2,004 (678) (1,560) 1,210 (391)
Tax (charge)/credit based on the standard UK corporation tax rate of 26.5% (2010 - 28%) (531) 179 437 (321) 109 Sovereign debt impairment and related interest rate hedge adjustments where no deferred tax asset recognised (42) (219) - (261) - Other losses in period where no deferred tax asset recognised (61) (66) 1 (293) (354)Foreign profits taxed at other rates (71) (100) (48) (371) (386)UK tax rate change - deferred tax impact (50) - (90) (137) (90)Unrecognised timing differences (10) (15) (7) (20) (7)Items not allowed for tax - losses on strategic disposals and write- downs (4) (7) (37) (14) (182) - other disallowable items (50) (70) (50) (160) (133)Non-taxable items - gain on sale of Global Merchant Services - - - 12 - - gain on redemption of own debt - - - - 12 - other non-taxable items 16 9 37 37 101 Taxable foreign exchange movements 2 (2) (5) 2 2 Losses brought forward and utilised 2 13 (1) 31 10 Adjustments in respect of prior periods 8 56 58 59 281
Actual tax (charge)/credit (791) (222) 295 (1,436) (637)
The high tax charge in the first nine months of 2011 reflects profits in high tax regimes (principally US) and losses in low tax regimes (principally Ireland), losses in overseas subsidiaries for which a deferred tax asset has not been recognised (principally Ireland and the Netherlands) and the effect of the two reductions of 1% in the rate of UK corporation tax enacted in March 2011 and July 2011 on the net deferred tax balance. The combined effect of the tax losses in Ireland and the Netherlands (including the sovereign debt impairment and related interest rate hedge adjustments) in the nine months ended 30 September 2011 for which no deferred tax asset has been recognised and the two 1% changes in the standard rate of UK corporation tax account for £855 million (77%) of the difference between the actual tax charge and the tax credit derived from applying the standard UK Corporation Tax rate to the results for the period.

75 RBS Group – Q3 2011 Results
Notes (continued) 5. Tax (continued) The Group has recognised a deferred tax asset at 30 September 2011 of £4,988 million (30 June 2011 - £6,245 million; 31 December - £6,373 million), of which £3,014 million (30 June 2011 - £3,880 million; 31 December 2010 - £3,849 million) relates to carried forward trading losses in the UK. Under UK tax legislation, these UK losses can be carried forward indefinitely to be utilised against profits arising in the future. The deferred tax asset balance has reduced over the period primarily as a result of the utilisation of tax losses brought forward and the impact of the reductions in the rate of UK corporation tax. The Group has considered the carrying value of this asset as at 30 September 2011 and concluded that it is recoverable based on future profit projections. 6. (Loss)/profit attributable to non-controlling interests Quarter ended Nine months ended
30 September
2011 30 June
2011 30 September
2010 30 September
2011 30 September
2010 £m £m £m £m £m
Trust preferred securities - - - - 10 RBS Sempra Commodities JV (8) 4 26 (13) 46 ABN AMRO - RFS Holdings minority interest 3 14 (131) 27 (775) - other - - (2) - (1)RBS Life Holdings - - 6 - 17 Other (2) - - (4) -
(Loss)/profit attributable to non-controlling interests (7) 18 (101) 10 (703)

76 RBS Group – Q3 2011 Results
Notes (continued) 7. Earnings per ordinary and B share Earnings per ordinary and B share have been calculated based on the following: Quarter ended Nine months ended
30 September
2011 30 June
2011 30 September
2010 30 September
2011 30 September
2010 £m £m £m £m £m
Earnings Profit/(loss) from continuing operations attributable to ordinary and B shareholders 1,225 (899) (1,148) (204) (1,109)Gain on redemption of preference shares and paid-in equity - - - - 610
Adjusted profit/(loss) from continuing operations attributable to ordinary and B shareholders 1,225 (899) (1,148) (204) (499)
Profit/(loss) from discontinued operations attributable to ordinary and B shareholders 1 2 2 5 (28)
Ordinary shares in issue during the period (millions) 57,541 56,973 56,164 57,107 56,271 B shares in issue during the period (millions) 51,000 51,000 51,000 51,000 51,000
Weighted average number of ordinary and B shares in issue during the period (millions) 108,541 107,973 107,164 108,107 107,271 Effect of dilutive share options and convertible securities 891 - - 893 -
Diluted weighted average number of ordinary and B shares in issue during the period 109,432 107,973 107,164 109,000 107,271
Basic earnings/(loss) per ordinary and B share from continuing operations 1.1p (0.8p) (1.1p) (0.2p) (0.5p)Fair value of own debt (1.7p) (0.2p) 0.6p (1.6p) 0.3p Asset Protection Scheme credit default swap - fair value changes - 0.1p 0.6p 0.5p 0.6p Payment Protection Insurance costs - 0.6p - 0.6p - Sovereign debt impairment and related interest rate hedge adjustments 0.2p 0.8p - 1.0p - Amortisation of purchased intangible assets - - 0.1p 0.1p 0.2p Integration and restructuring costs 0.3p - 0.2p 0.4p 0.5p Gain on redemption of own debt - (0.2p) - (0.2p) (1.0p)Strategic disposals - - - - 0.3p Bonus tax - - - - 0.1p Adjusted earnings per ordinary and B share from continuing operations (0.1p) 0.3p 0.4p 0.6p 0.5p Loss from Non-Core attributable to ordinary and B shareholders 0.1p 0.4p 0.7p 0.7p 1.5p
Core adjusted earnings per ordinary and B share from continuing operations - 0.7p 1.1p 1.3p 2.0p Core impairment losses 0.1p 0.3p 0.5p 0.7p 1.0p
Pre-impairment Core adjusted earnings per ordinary and B share 0.1p 1.0p 1.6p 2.0p 3.0p
Memo: Core adjusted earnings per ordinary and B share from continuing operations assuming normalised tax rate of 26.5% (2010 - 28.0%) 0.9p 1.1p 1.2p 3.4p 3.7p
Diluted earnings/(loss) per ordinary and B share from continuing operations 1.1p (0.8p) (1.1p) (0.2p) (0.5p)

77 RBS Group – Q3 2011 Results
Notes (continued) 8. Segmental analysis There have been no significant changes in the Group’s divisions as set out on page 377 of the 2010 Report and Accounts. Analysis of divisional operating profit/(loss) The following tables provide an analysis of the divisional profit/(loss) for the quarters ended 30 September 2011, 30 June 2011 and 30 September 2010 and the nine months ended 30 September 2011 and 30 September 2010 by main income statement captions. The divisional income statements on pages 23 to 57 reflect certain presentational reallocations as described in the notes below. These do not affect the overall operating profit/(loss).
Net interest income
Non- interest income
Total income
Operating expenses
Insurance net claims
Impairment
losses Operating
profit/(loss)Quarter ended 30 September 2011 £m £m £m £m £m £m £m UK Retail 1,074 292 1,366 (672) - (195) 499 UK Corporate 621 327 948 (419) - (228) 301 Wealth 178 118 296 (221) - (4) 71 Global Transaction Services 276 300 576 (336) - (45) 195 Ulster Bank 185 60 245 (137) - (327) (219)US Retail & Commercial 483 257 740 (541) - (84) 115 Global Banking & Markets (1) 161 938 1,099 (1,019) - 32 112 RBS Insurance (2) 84 949 1,033 (215) (695) - 123 Central items (94) 103 9 62 (1) (3) 67
Core 2,968 3,344 6,312 (3,498) (696) (854) 1,264 Non-Core (3) 110 (64) 46 (323) (38) (682) (997)
3,078 3,280 6,358 (3,821) (734) (1,536) 267 Reconciling items Fair value of own debt (4) - 2,357 2,357 - - - 2,357 Asset Protection Scheme credit default swap - fair value changes (5) - (60) (60) - - - (60)Sovereign debt impairment and related interest rate hedge adjustments - - - - - (202) (202)Amortisation of purchased intangible assets - - - (69) - - (69)Integration and restructuring costs - - - (233) - - (233)Gain on redemption of own debt - 1 1 - - - 1 Strategic disposals - (49) (49) - - - (49)Bonus tax - - - (5) - - (5)RFS Holdings minority interest (1) (3) (4) 1 - - (3)
Total statutory 3,077 5,526 8,603 (4,127) (734) (1,738) 2,004 (1) Reallocation of £13 million between net interest income and non-interest income in respect of funding costs of rental
assets, £10 million and to record interest on financial assets and liabilities designated as at fair value through profit or loss, £3 million.
(2) Total income includes £72 million investment income of which £49 million is included in net interest income and £23 million in non-interest income. Reallocation of £35 million between non-interest income and net interest income in respect of instalment income.
(3) Reallocation of £54 million between net interest income and non-interest income in respect of funding costs of rental assets, £53 million and to record interest on financial assets and liabilities designated as at fair value through profit or loss, £1 million.
(4) Comprises £470 million gain included in ‘Income from trading activities’ and £1,887 million gain included in ‘Other operating income’ on a statutory basis.
(5) Included in ‘Income from trading activities’ on a statutory basis.
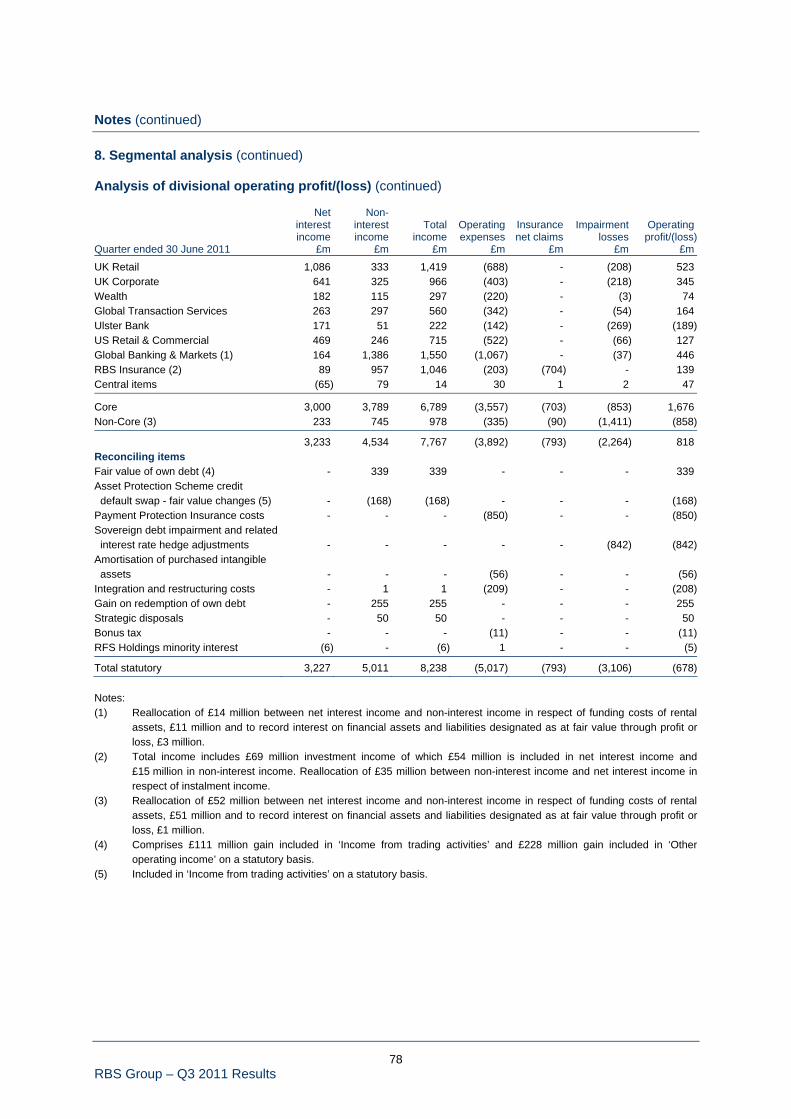
78 RBS Group – Q3 2011 Results
Notes (continued) 8. Segmental analysis (continued) Analysis of divisional operating profit/(loss) (continued)
Net interest income
Non- interest income
Total income
Operating expenses
Insurance net claims
Impairment
losses Operating
profit/(loss)Quarter ended 30 June 2011 £m £m £m £m £m £m £m
UK Retail 1,086 333 1,419 (688) - (208) 523 UK Corporate 641 325 966 (403) - (218) 345 Wealth 182 115 297 (220) - (3) 74 Global Transaction Services 263 297 560 (342) - (54) 164 Ulster Bank 171 51 222 (142) - (269) (189)US Retail & Commercial 469 246 715 (522) - (66) 127 Global Banking & Markets (1) 164 1,386 1,550 (1,067) - (37) 446 RBS Insurance (2) 89 957 1,046 (203) (704) - 139 Central items (65) 79 14 30 1 2 47
Core 3,000 3,789 6,789 (3,557) (703) (853) 1,676 Non-Core (3) 233 745 978 (335) (90) (1,411) (858)
3,233 4,534 7,767 (3,892) (793) (2,264) 818 Reconciling items Fair value of own debt (4) - 339 339 - - - 339 Asset Protection Scheme credit default swap - fair value changes (5) - (168) (168) - - - (168)Payment Protection Insurance costs - - - (850) - - (850)Sovereign debt impairment and related interest rate hedge adjustments - - - - - (842) (842)Amortisation of purchased intangible assets - - - (56) - - (56)Integration and restructuring costs - 1 1 (209) - - (208)Gain on redemption of own debt - 255 255 - - - 255 Strategic disposals - 50 50 - - - 50 Bonus tax - - - (11) - - (11)RFS Holdings minority interest (6) - (6) 1 - - (5)
Total statutory 3,227 5,011 8,238 (5,017) (793) (3,106) (678) Notes: (1) Reallocation of £14 million between net interest income and non-interest income in respect of funding costs of rental
assets, £11 million and to record interest on financial assets and liabilities designated as at fair value through profit or loss, £3 million.
(2) Total income includes £69 million investment income of which £54 million is included in net interest income and £15 million in non-interest income. Reallocation of £35 million between non-interest income and net interest income in respect of instalment income.
(3) Reallocation of £52 million between net interest income and non-interest income in respect of funding costs of rental assets, £51 million and to record interest on financial assets and liabilities designated as at fair value through profit or loss, £1 million.
(4) Comprises £111 million gain included in ‘Income from trading activities’ and £228 million gain included in ‘Other operating income’ on a statutory basis.
(5) Included in ‘Income from trading activities’ on a statutory basis.

79 RBS Group – Q3 2011 Results
Notes (continued) 8. Segmental analysis (continued) Analysis of divisional operating profit/(loss) (continued)
Net interest income
Non- interest income
Total income
Operating expenses
Insurance net claims
Impairment
losses Operating
profit/(loss)Quarter ended 30 September 2010 £m £m £m £m £m £m £m
UK Retail (1) 1,056 377 1,433 (734) (50) (251) 398 UK Corporate 662 324 986 (406) - (158) 422 Wealth 156 108 264 (189) - (1) 74 Global Transaction Services 257 411 668 (356) - (3) 309 Ulster Bank 192 52 244 (134) - (286) (176)US Retail & Commercial 480 271 751 (553) - (125) 73 Global Banking & Markets (2) 310 1,244 1,554 (1,005) - 40 589 RBS Insurance (3) 94 1,030 1,124 (215) (942) - (33)Central items (158) 181 23 57 (6) 2 76
Core 3,049 3,998 7,047 (3,535) (998) (782) 1,732 Non-Core (4) 355 515 870 (561) (144) (1,171) (1,006)
3,404 4,513 7,917 (4,096) (1,142) (1,953) 726 Reconciling items Fair value of own debt (5) - (858) (858) - - - (858)Asset Protection Scheme credit default swap - fair value changes (6) - (825) (825) - - - (825)Amortisation of purchased intangible assets - - - (123) - - (123)Integration and restructuring costs - - - (311) - - (311)Strategic disposals - 27 27 - - - 27 Bonus tax - - - (15) - - (15)RFS Holdings minority interest 7 (182) (175) (6) - - (181)
Total statutory 3,411 2,675 6,086 (4,551) (1,142) (1,953) (1,560) Notes: (1) Reallocation of netting of bancassurance claims of £50 million from non-interest income. (2) Reallocation of £7 million between net interest income and non-interest income in respect of funding costs of rental
assets, £9 million and to record interest on financial assets and liabilities designated as at fair value through profit or loss, £2 million.
(3) Total income includes £75 million of investment income of which £55 million is included in net interest income and £20 million in non-interest income. Reallocation of £39 million between non-interest income and net interest income in respect of instalment income.
(4) Reallocation of £83 million between net interest income and non-interest income in respect of funding costs of rental assets, £78 million and to record interest on financial assets and liabilities designated as at fair value through profit or loss, £5 million.
(5) Comprises £330 million loss included in ‘Income and trading activities’ and £528 million loss included on ‘Other operating income’ on a statutory basis.
(6) Included in ‘Income from trading activities’ on a statutory basis.

80 RBS Group – Q3 2011 Results
Notes (continued) 8. Segmental analysis (continued) Analysis of divisional operating profit/(loss) (continued)
Net interest income
Non- interest income
Total income
Operating expenses
Insurance net claims
Impairment
losses Operating
profit/(loss)Nine months ended 30 September 2011 £m £m £m £m £m £m £m
UK Retail 3,236 929 4,165 (2,038) - (597) 1,530 UK Corporate 1,951 984 2,935 (1,245) - (551) 1,139 Wealth 527 347 874 (637) - (12) 225 Global Transaction Services 799 879 1,678 (1,013) - (119) 546 Ulster Bank 525 162 687 (415) - (1,057) (785)US Retail & Commercial 1,403 746 2,149 (1,567) - (260) 322 Global Banking & Markets (1) 506 4,523 5,029 (3,392) - 19 1,656 RBS Insurance (2) 261 2,888 3,149 (637) (2,183) - 329 Central items (188) 170 (18) 91 - (2) 71
Core 9,020 11,628 20,648 (10,853) (2,183) (2,579) 5,033 Non-Core (3) 593 917 1,510 (981) (256) (3,168) (2,895)
9,613 12,545 22,158 (11,834) (2,439) (5,747) 2,138 Reconciling items Fair value of own debt (4) - 2,216 2,216 - - - 2,216 Asset Protection Scheme credit default swap - fair value changes (5) - (697) (697) - - - (697)Payment Protection Insurance costs - - - (850) - - (850)Sovereign debt impairment and related interest rate hedge adjustments - - - - - (1,044) (1,044)Amortisation of purchased intangible assets - - - (169) - - (169)Integration and restructuring costs (2) (3) (5) (581) - - (586)Gain on redemption of own debt - 256 256 - - - 256 Strategic disposals - (22) (22) - - - (22)Bonus tax - - - (27) - - (27)RFS Holdings minority interest (6) (1) (7) 2 - - (5)
Total statutory 9,605 14,294 23,899 (13,459) (2,439) (6,791) 1,210 Notes: (1) Reallocation of £39 million between net interest income and non-interest income in respect of funding costs of rental
assets, £30 million and to record interest on financial assets and liabilities designated as at fair value through profit or loss, £9 million.
(2) Total income includes £205 million investment income of which £156 million is included in net interest income and £49 million in non-interest income. Reallocation of £105 million between non-interest income and net interest income in respect of instalment income.
(3) Reallocation of £159 million between net interest income and non-interest income in respect of funding costs of rental assets, £155 million and to record interest on financial assets and liabilities designated as at fair value through profit or loss, £4 million.
(4) Comprises £395 million gain included in ‘Income from trading activities’ and £1,821 million gain included in ‘Other operating income’ on a statutory basis.
(5) Included in ‘Income from trading activities’ on a statutory basis.

81 RBS Group – Q3 2011 Results
Notes (continued) 8. Segmental analysis (continued) Analysis of divisional operating profit/(loss) (continued)
Net interest income
Non- interest income
Total income
Operating expenses
Insurance net claims
Impairment
losses Operating
profit/(loss)Nine months ended 30 September 2010 £m £m £m £m £m £m £m
UK Retail (1) 2,990 1,020 4,010 (2,204) (54) (938) 814 UK Corporate 1,919 993 2,912 (1,240) - (542) 1,130 Wealth 449 336 785 (556) - (12) 217 Global Transaction Services 711 1,212 1,923 (1,096) - (6) 821 Ulster Bank 574 158 732 (437) - (785) (490)US Retail & Commercial 1,450 798 2,248 (1,594) - (412) 242 Global Banking & Markets (2) 1,001 5,324 6,325 (3,332) - (156) 2,837 RBS Insurance (3) 285 3,119 3,404 (656) (3,034) - (286)Central items (82) 303 221 261 (21) 1 462
Core 9,297 13,263 22,560 (10,854) (3,109) (2,850) 5,747 Non-Core (4) 1,325 1,318 2,643 (1,775) (492) (4,265) (3,889)
10,622 14,581 25,203 (12,629) (3,601) (7,115) 1,858 Reconciling items Fair value of own debt (5) - (408) (408) - - - (408)Asset Protection Scheme credit default swap - fair value changes (6) - (825) (825) - - - (825)Amortisation of purchased intangible assets - - - (273) - - (273)Integration and restructuring costs - - - (733) - - (733)Gain on redemption of own debt - 553 553 - - - 553 Strategic disposals - (331) (331) - - - (331)Bonus tax - - - (84) - - (84)RFS Holdings minority interest 7 (153) (146) (2) - - (148)
Total statutory 10,629 13,417 24,046 (13,721) (3,601) (7,115) (391)
Notes: (1) Reallocation of netting of bancassurance claims of £54 million from non-interest income. (2) Reallocation of £30 million between net interest income and non-interest income in respect of funding costs of rental
assets, £26 million and to record interest on financial assets and liabilities designated as at fair value through profit or loss, £4 million.
(3) Total income includes £200 million investment income of which £164 million is included in net interest income and £36 million in non-interest income. Reallocation of £121 million between non-interest income and net interest income in respect of instalment income.
(4) Reallocation of £215 million between net interest income and non-interest income in respect of funding assets, £226 million and to record interest on financial assets and liabilities designated as at fair value through profit or loss, £11 million.
(5) Comprises £185 million loss included in ‘Income from trading activities’ and £223 million loss included in ‘Other operating income’, on a statutory basis.
(6) Included in ‘Income from trading activities’ on a statutory basis.

82 RBS Group – Q3 2011 Results
Notes (continued) 9. Discontinued operations and assets and liabilities of disposal groups Profit/(loss) from discontinued operations, net of tax
Quarter ended Nine months ended
30 September
2011 30 June
2011 30 September
2010 30 September
2011 30 September
2010 £m £m £m £m £m
Discontinued operations Total income 10 9 (8) 27 1,427 Operating expenses (3) - 19 (4) (801)Insurance net claims - - 2 - (161)Impairment recoveries/(losses) - 11 - 11 (39)
Profit before tax 7 20 13 34 426 Gain on disposal before recycling of reserves - - - - 57 Recycled reserves - - - - (1,076)
Operating profit/(loss) before tax 7 20 13 34 (593)Tax on profit/(loss) (3) (4) (1) (10) (89)
Profit/(loss) after tax 4 16 12 24 (682)Businesses acquired exclusively with a view to disposal Profit/(loss) after tax 2 5 6 13 (6)
Profit/(loss) from discontinued operations, net of tax 6 21 18 37 (688)
Discontinued operations reflect the results of RFS Holdings attributable to the State of the Netherlands and Santander following the legal separation of ABN AMRO Bank N.V. on 1 April 2010.
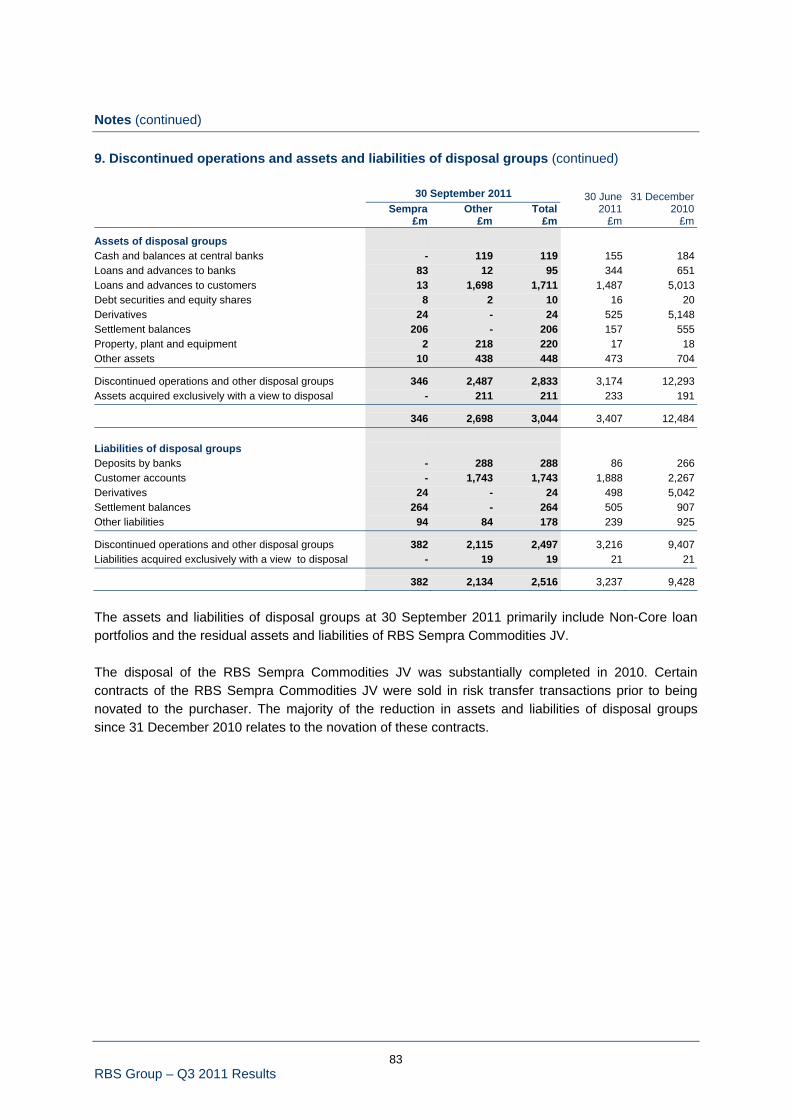
83 RBS Group – Q3 2011 Results
Notes (continued) 9. Discontinued operations and assets and liabilities of disposal groups (continued) 30 September 2011 Sempra Other Total £m £m £m
30 June 2011
£m
31 December 2010
£m
Assets of disposal groups Cash and balances at central banks - 119 119 155 184 Loans and advances to banks 83 12 95 344 651 Loans and advances to customers 13 1,698 1,711 1,487 5,013 Debt securities and equity shares 8 2 10 16 20 Derivatives 24 - 24 525 5,148 Settlement balances 206 - 206 157 555 Property, plant and equipment 2 218 220 17 18 Other assets 10 438 448 473 704
Discontinued operations and other disposal groups 346 2,487 2,833 3,174 12,293 Assets acquired exclusively with a view to disposal - 211 211 233 191
346 2,698 3,044 3,407 12,484 Liabilities of disposal groups Deposits by banks - 288 288 86 266 Customer accounts - 1,743 1,743 1,888 2,267 Derivatives 24 - 24 498 5,042 Settlement balances 264 - 264 505 907 Other liabilities 94 84 178 239 925
Discontinued operations and other disposal groups 382 2,115 2,497 3,216 9,407 Liabilities acquired exclusively with a view to disposal - 19 19 21 21
382 2,134 2,516 3,237 9,428
The assets and liabilities of disposal groups at 30 September 2011 primarily include Non-Core loan portfolios and the residual assets and liabilities of RBS Sempra Commodities JV. The disposal of the RBS Sempra Commodities JV was substantially completed in 2010. Certain contracts of the RBS Sempra Commodities JV were sold in risk transfer transactions prior to being novated to the purchaser. The majority of the reduction in assets and liabilities of disposal groups since 31 December 2010 relates to the novation of these contracts.

84 RBS Group – Q3 2011 Results
Notes (continued) 10. Financial instruments Classification The following tables analyse the Group’s financial assets and liabilities in accordance with the categories of financial instruments in IAS 39 with assets and liabilities outside the scope of IAS 39 shown separately.
HFT (1) DFV (2) AFS (3) LAR (4)
Other financial
instruments (amortised
cost)Finance
leases
Non financial
assets/ liabilities Total
30 September 2011 £m £m £m £m £m £m £m £m
Assets Cash and balances at central banks - - - 78,445 78,445 Loans and advances to banks - reverse repos 40,181 - - 7,946 48,127 - other 20,423 - - 32,179 52,602 Loans and advances to customers - reverse repos 41,692 - - 12,440 54,132 - other 24,608 1,040 - 450,193 9,732 485,573 Debt securities 112,568 162 110,401 6,526 229,657 Equity shares 12,044 834 2,010 - 14,888 Settlement balances - - - 21,526 21,526 Derivatives (5) 572,344 572,344 Intangible assets 14,744 14,744 Property, plant and equipment 17,060 17,060 Deferred tax 4,988 4,988 Prepayments, accrued income and other assets - - - 1,394 9,204 10,598 Assets of disposal groups 3,044 3,044
823,860 2,036 112,411 610,649 9,732 49,040 1,607,728 Liabilities Deposits by banks - repos 24,583 - 11,644 36,227 - other 34,754 - 43,616 78,370 Customer accounts - repos 67,447 - 28,244 95,691 - other 14,459 5,836 413,365 433,660 Debt securities in issue 10,754 37,910 145,847 194,511 Settlement balances - - 17,983 17,983 Short positions 48,495 - 48,495 Derivatives (5) 561,790 561,790 Accruals, deferred income and other liabilities - - 1,629 471 20,838 22,938 Retirement benefit liabilities - 1,855 1,855 Deferred tax - 1,913 1,913 Insurance liabilities - 6,628 6,628 Subordinated liabilities - 934 25,341 26,275 Liabilities of disposal groups 2,516 2,516
762,282 44,680 687,669 471 33,750 1,528,852
Equity 78,876
1,607,728 For the notes to this table refer to page 86.
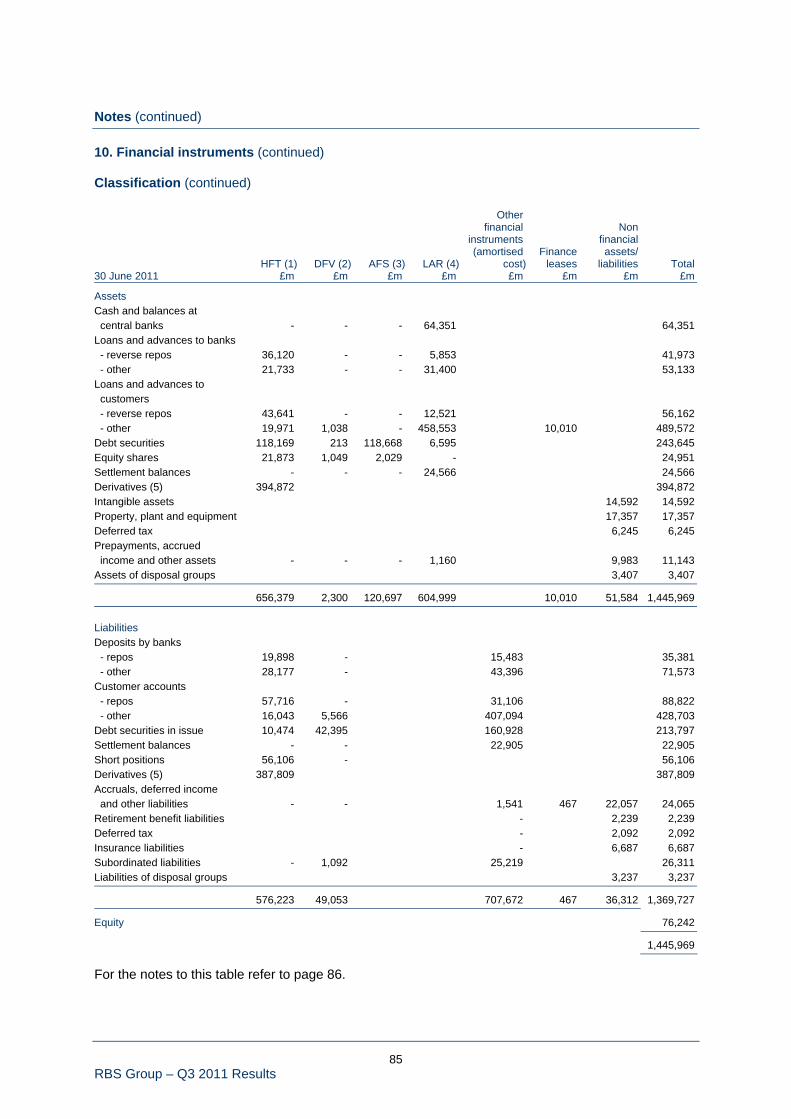
85 RBS Group – Q3 2011 Results
Notes (continued) 10. Financial instruments (continued) Classification (continued)
HFT (1) DFV (2) AFS (3) LAR (4)
Otherfinancial
instruments(amortised
cost)Finance
leases
Non financial assets/
liabilities Total30 June 2011 £m £m £m £m £m £m £m £m
Assets Cash and balances at central banks - - - 64,351 64,351Loans and advances to banks - reverse repos 36,120 - - 5,853 41,973 - other 21,733 - - 31,400 53,133Loans and advances to customers - reverse repos 43,641 - - 12,521 56,162 - other 19,971 1,038 - 458,553 10,010 489,572Debt securities 118,169 213 118,668 6,595 243,645Equity shares 21,873 1,049 2,029 - 24,951Settlement balances - - - 24,566 24,566Derivatives (5) 394,872 394,872Intangible assets 14,592 14,592Property, plant and equipment 17,357 17,357Deferred tax 6,245 6,245Prepayments, accrued income and other assets - - - 1,160 9,983 11,143Assets of disposal groups 3,407 3,407
656,379 2,300 120,697 604,999 10,010 51,584 1,445,969 Liabilities Deposits by banks - repos 19,898 - 15,483 35,381 - other 28,177 - 43,396 71,573Customer accounts - repos 57,716 - 31,106 88,822 - other 16,043 5,566 407,094 428,703Debt securities in issue 10,474 42,395 160,928 213,797Settlement balances - - 22,905 22,905Short positions 56,106 - 56,106Derivatives (5) 387,809 387,809Accruals, deferred income and other liabilities - - 1,541 467 22,057 24,065Retirement benefit liabilities - 2,239 2,239Deferred tax - 2,092 2,092Insurance liabilities - 6,687 6,687Subordinated liabilities - 1,092 25,219 26,311Liabilities of disposal groups 3,237 3,237
576,223 49,053 707,672 467 36,312 1,369,727
Equity 76,242
1,445,969 For the notes to this table refer to page 86.

86 RBS Group – Q3 2011 Results
Notes (continued) 10. Financial instruments (continued) Classification (continued)
HFT (1) DFV (2) AFS (3) LAR (4)
Other financial
instruments (amortised
cost)Finance
leases
Non financial assets/
liabilities Total31 December 2010 £m £m £m £m £m £m £m £m
Assets Cash and balances at central banks - - - 57,014 57,014Loans and advances to banks - reverse repos 38,215 - - 4,392 42,607 - other 26,082 - - 31,829 57,911Loans and advances to customers - reverse repos 41,110 - - 11,402 52,512 - other 19,903 1,100 - 471,308 10,437 502,748Debt securities 98,869 402 111,130 7,079 217,480Equity shares 19,186 1,013 1,999 - 22,198Settlement balances - - - 11,605 11,605Derivatives (5) 427,077 427,077Intangible assets 14,448 14,448Property, plant and equipment 16,543 16,543Deferred tax 6,373 6,373Prepayments, accrued income and other assets - - - 1,306 11,270 12,576Assets of disposal groups 12,484 12,484
670,442 2,515 113,129 595,935 10,437 61,118 1,453,576
Liabilities Deposits by banks - repos 20,585 - 12,154 32,739 - other 28,216 - 37,835 66,051Customer accounts - repos 53,031 - 29,063 82,094 - other 14,357 4,824 409,418 428,599Debt securities in issue 7,730 43,488 167,154 218,372Settlement balances - - 10,991 10,991Short positions 43,118 - 43,118Derivatives (5) 423,967 423,967Accruals, deferred income and other liabilities - - 1,793 458 20,838 23,089Retirement benefit liabilities - 2,288 2,288Deferred tax - 2,142 2,142Insurance liabilities - 6,794 6,794Subordinated liabilities - 1,129 25,924 27,053Liabilities of disposal groups 9,428 9,428
591,004 49,441 694,332 458 41,490 1,376,725
Equity 76,851
1,453,576
Notes: (1) Held-for-trading. (2) Designated as at fair value. (3) Available-for-sale. (4) Loans and receivables. (5) Held-for-trading derivatives include hedging derivatives.

87 RBS Group – Q3 2011 Results
Notes (continued) 10. Financial instruments (continued) Financial instruments carried at fair value Refer to Note 12 Financial instruments - valuation of the Group’s 2010 Annual Report and Accounts for valuation techniques. Certain aspects relating to the valuation of financial instruments carried at fair value are discussed below. Valuation reserves When valuing financial instruments in the trading book, adjustments are made to mid-market valuations to cover bid-offer spread, liquidity and credit risk. The table below shows the valuation reserves and adjustments.
30 September 2011
30 June 2011
31 December 2010
£m £m £m
Credit valuation adjustments (CVA) Monoline insurers 2,827 2,321 2,443 Credit derivative product companies (CDPCs) 1,233 532 490 Other counterparties 2,222 1,719 1,714
6,282 4,572 4,647 Bid-offer, liquidity and other reserves 2,712 2,572 2,797
8,994 7,144 7,444
CVA represent an estimate of the adjustment to fair value that a market participant would make to incorporate the credit risk inherent in counterparty derivative exposures. Key points 30 September 2011 compared with 30 June 2011 • CVA increased overall by 37% in Q3 2011 reflecting wider credit spreads, which impacted the
exposures and CVA.
• The increase in monoline CVA was primarily attributable to lower prices of the underlyingreference instruments, strengthening of the US dollar against sterling and wider credit spreadsfor all monoline insurers.
• The CDPC CVA has significantly increased and was driven by an increase in the exposure andincreased CVA relating to certain CDPCs.
• The CVA held against other counterparties increased by 29% over the quarter predominantlydue to wider credit spreads.

88 RBS Group – Q3 2011 Results
Notes (continued) 10. Financial instruments (continued) Valuation reserves (continued) Key points (continued) 30 September 2011 compared with 31 December 2010
• CVA increased overall by 35% over the period reflecting wider credit spreads, which impactedthe exposures and CVA.
• The monoline CVA increased due to a significant deterioration in all monoline credit spreadsduring the year (the H1 2011 improvements in credit spreads were subsequently reversed inQ3).
• The CDPC CVA increased as prices of the underlying reference assets declined. Accordingly,gross exposure to CDPC and CVA increased. CVA increased by a greater proportion thanexposure reflecting increased coverage of certain CDPCs.
• The CVA held against other counterparties increased by 30% over the period predominantlydue to wider credit spreads.
Own credit
Cumulative pre-tax own credit adjustment (1)
Debt securities
in issue £m
Subordinated liabilities
£m Total (2)
£m Derivatives
£m Total
£m
30 September 2011 3,993 657 4,650 700 5,350 30 June 2011 1,933 377 2,310 434 2,744 31 December 2010 2,091 325 2,416 534 2,950 Carrying values of underlying liabilities £bn £bn £bn
30 September 2011 48.7 0.9 49.6 30 June 2011 52.9 1.1 54.0 31 December 2010 51.2 1.1 52.3
Notes: (1) The own credit adjustment for fair value does not alter cash flows, is not used for performance management and is
disregarded for regulatory capital reporting and will reverse over time as the liabilities mature. (2) The reserve movement between periods will not equate to the reported profit or loss for own credit. The balance sheet
reserves are stated by conversion of underlying currency balances at spot rates for each period whereas the incomestatement includes intra-period foreign exchange sell-offs.
Key point • The Group’s credit spread increased by between 115 and 218 basis points for different tenors
issuance in Q3 2011, resulting in a substantial reduction in the value of liabilities. • RBS uses credit default swap spreads to determine the impact of RBS's own credit quality on
the fair value of derivative liabilities. At 30 September 2011, cumulative adjustments of£700 million (31 December 2010 - £534 million) were recorded against derivative liabilities. Theimpact of these adjustments in both periods was more than offset by the impact ofCVA, reflecting counterparty creditworthiness, recorded against derivative assets.
• At 30 September 2011, the post-tax cumulative own credit adjustment for regulatory capitalpurposes was £2,931 million (30 June 2011 - £1,112 million; 31 December 2010 - £1,182million) - refer to page 99.
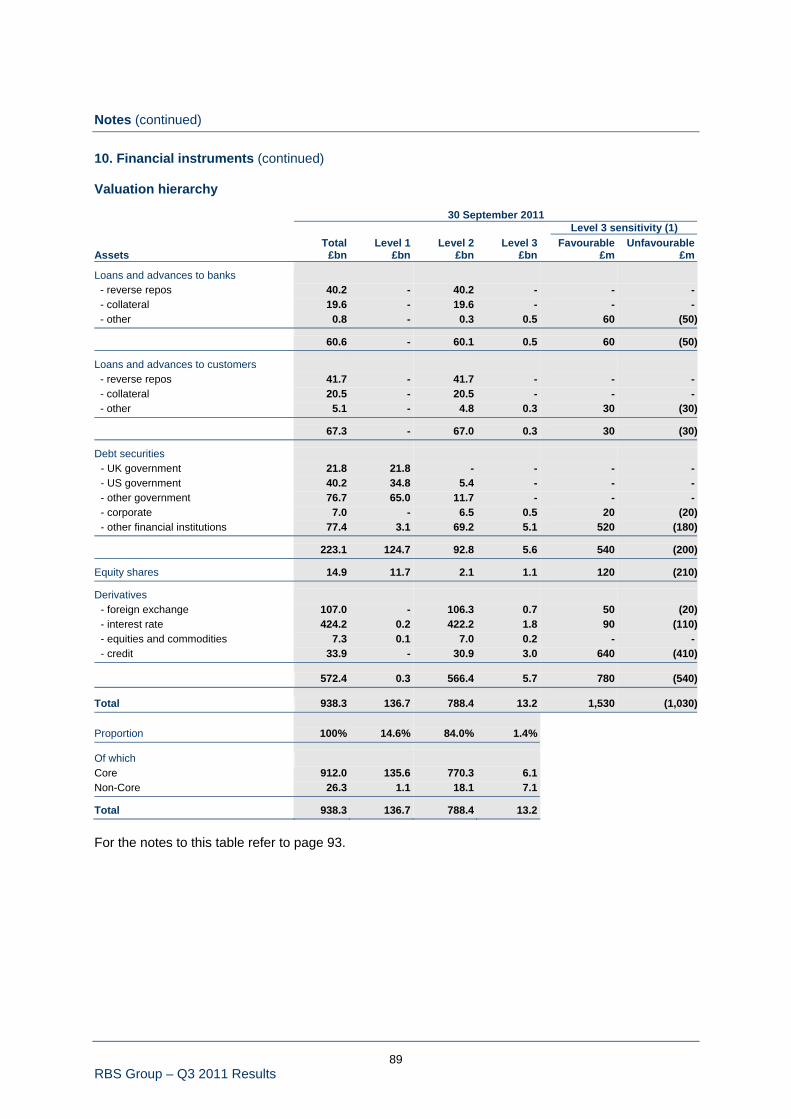
89 RBS Group – Q3 2011 Results
Notes (continued) 10. Financial instruments (continued) Valuation hierarchy 30 September 2011 Level 3 sensitivity (1) Total Level 1 Level 2 Level 3 Favourable Unfavourable Assets £bn £bn £bn £bn £m £m
Loans and advances to banks - reverse repos 40.2 - 40.2 - - - - collateral 19.6 - 19.6 - - - - other 0.8 - 0.3 0.5 60 (50)
60.6 - 60.1 0.5 60 (50)
Loans and advances to customers - reverse repos 41.7 - 41.7 - - - - collateral 20.5 - 20.5 - - - - other 5.1 - 4.8 0.3 30 (30)
67.3 - 67.0 0.3 30 (30)
Debt securities - UK government 21.8 21.8 - - - - - US government 40.2 34.8 5.4 - - - - other government 76.7 65.0 11.7 - - - - corporate 7.0 - 6.5 0.5 20 (20) - other financial institutions 77.4 3.1 69.2 5.1 520 (180)
223.1 124.7 92.8 5.6 540 (200)
Equity shares 14.9 11.7 2.1 1.1 120 (210)
Derivatives - foreign exchange 107.0 - 106.3 0.7 50 (20) - interest rate 424.2 0.2 422.2 1.8 90 (110) - equities and commodities 7.3 0.1 7.0 0.2 - - - credit 33.9 - 30.9 3.0 640 (410)
572.4 0.3 566.4 5.7 780 (540)
Total 938.3 136.7 788.4 13.2 1,530 (1,030) Proportion 100% 14.6% 84.0% 1.4%
Of which Core 912.0 135.6 770.3 6.1 Non-Core 26.3 1.1 18.1 7.1
Total 938.3 136.7 788.4 13.2 For the notes to this table refer to page 93.

90 RBS Group – Q3 2011 Results
Notes (continued) 10. Financial instruments (continued) Valuation hierarchy (continued) 31 December 2010 Total Level 1 Level 2 Level 3 Assets £bn £bn £bn £bn
Loans and advances to banks - reverse repos 38.2 - 38.2 - - collateral 25.1 - 25.1 - - other 1.0 - 0.6 0.4
64.3 - 63.9 0.4
Loans and advances to customers - reverse repos 41.1 - 41.1 - - collateral 14.4 - 14.4 - - other 6.6 - 6.2 0.4
62.1 - 61.7 0.4
Debt securities - UK government 13.5 13.5 - - - US government 38.0 31.0 7.0 - - other government 75.9 62.3 13.6 - - corporate 7.7 - 6.5 1.2 - other financial institutions 75.3 3.5 64.8 7.0
210.4 110.3 91.9 8.2
Equity shares 22.2 18.4 2.8 1.0
Derivatives - foreign exchange 83.3 - 83.2 0.1 - interest rate 311.7 1.7 308.3 1.7 - equities and commodities 5.2 0.1 4.9 0.2 - credit - APS (2) 0.6 - - 0.6 - credit - other 26.3 - 23.2 3.1
427.1 1.8 419.6 5.7
Total 786.1 130.5 639.9 15.7 Proportion 100% 16.6% 81.4% 2.0% Of which Core 754.2 129.4 617.6 7.2 Non-Core 31.9 1.1 22.3 8.5
Total 786.1 130.5 639.9 15.7
For the notes to this table refer to page 93.

91 RBS Group – Q3 2011 Results
Notes (continued) 10. Financial instruments (continued) Valuation hierarchy (continued) The following tables detail AFS assets included within total assets on pages 89 and 90. 30 September 2011 Level 3 sensitivity (1) Total Level 1 Level 2 Level 3 Favourable Unfavourable Assets £bn £bn £bn £bn £m £m Debt securities - UK government 13.3 13.3 - - - - - US government 20.0 16.9 3.1 - - - - other government 29.0 24.2 4.8 - - - - corporate 2.3 - 2.1 0.2 10 (10) - other financial institutions 45.8 0.7 42.0 3.1 270 (40)
110.4 55.1 52.0 3.3 280 (50)Equity shares 2.0 0.3 1.3 0.4 70 (80)
Total 112.4 55.4 53.3 3.7 350 (130)
Of which Core 103.5 55.0 47.7 0.8 Non-Core 8.9 0.4 5.6 2.9
Total 112.4 55.4 53.3 3.7 31 December 2010 Total Level 1 Level 2 Level 3 Assets £bn £bn £bn £bn
Debt securities - UK government 8.4 8.4 - - - US government 22.2 17.8 4.4 - - other government 32.9 26.5 6.4 - - corporate 1.5 - 1.4 0.1 - other financial institutions 46.1 0.4 41.4 4.3
111.1 53.1 53.6 4.4 Equity shares 2.0 0.3 1.4 0.3
Total 113.1 53.4 55.0 4.7 Of which Core 103.0 52.8 49.2 1.0 Non-Core 10.1 0.6 5.8 3.7
Total 113.1 53.4 55.0 4.7
For the notes to this table refer to page 93.

92 RBS Group – Q3 2011 Results
Notes (continued) 10. Financial instruments (continued) Valuation hierarchy (continued) 30 September 2011 Level 3 sensitivity (1) Total Level 1 Level 2 Level 3 Favourable UnfavourableLiabilities £bn £bn £bn £bn £m £m
Deposits by banks - repos 24.6 - 24.6 - - - - collateral 32.4 - 32.4 - - - - other 2.3 - 2.3 - - -
59.3 - 59.3 - - -
Customer accounts - repos 67.4 - 67.4 - - - - collateral 10.2 - 10.2 - - - - other 10.1 - 10.1 - 20 (20)
87.7 - 87.7 - 20 (20)
Debt securities in issue 48.7 - 46.1 2.6 100 (110)
Short positions 48.5 37.7 10.0 0.8 130 (20)
Derivatives - foreign exchange 112.2 - 111.9 0.3 20 (20) - interest rate 407.8 0.3 406.7 0.8 40 (40) - equities and commodities 10.2 0.1 9.7 0.4 10 (10) - credit - APS (2) 0.1 - - 0.1 480 (390) - credit - other 31.5 - 30.9 0.6 50 (40)
561.8 0.4 559.2 2.2 600 (500)
Subordinated liabilities 0.9 - 0.9 - - -
Total 806.9 38.1 763.2 5.6 850 (650) Proportion 100% 4.7% 94.6% 0.7%
Of which Core 798.7 38.1 756.0 4.6 Non-Core 8.2 - 7.2 1.0
Total 806.9 38.1 763.2 5.6 For the notes to this table refer to page 93.

93 RBS Group – Q3 2011 Results
Notes (continued) 10. Financial instruments (continued) Valuation hierarchy (continued) 31 December 2010 Total Level 1 Level 2 Level 3 Liabilities £bn £bn £bn £bn
Deposits by banks - repos 20.6 - 20.6 - - collateral 26.6 - 26.6 - - other 1.6 - 1.6 -
48.8 - 48.8 -
Customer accounts - repos 53.0 - 53.0 - - collateral 10.4 - 10.4 - - other 8.8 - 8.7 0.1
72.2 - 72.1 0.1
Debt securities in issue 51.2 - 49.0 2.2
Short positions 43.1 35.0 7.3 0.8
Derivatives - foreign exchange 89.4 0.1 89.3 - - interest rate 299.2 0.2 298.0 1.0 - equities and commodities 10.1 0.1 9.6 0.4 - credit - other 25.3 - 25.0 0.3
424.0 0.4 421.9 1.7
Subordinated liabilities 1.1 - 1.1 -
Total 640.4 35.4 600.2 4.8 Proportion 100% 5.5% 93.7% 0.8% Of which Core 626.1 35.4 586.9 3.8 Non-Core 14.3 - 13.3 1.0
Total 640.4 35.4 600.2 4.8 Notes: (1) Sensitivity represents the favourable and unfavourable effect respectively on the income statement or the statement of
comprehensive income due to reasonably possible changes to valuations using reasonably possible alternative inputs to the Group’s valuation techniques or models. The level 3 sensitivities are calculated at a sub-portfolio level and hence these aggregated figures do not reflect the correlation between some of the sensitivities.
(2) Asset Protection Scheme.

94 RBS Group – Q3 2011 Results
Notes (continued) 11. Available-for-sale financial assets The Q3 2011 movement in available-for-sale financial assets reflects £1,207 million unrealised gains on securities, primarily high quality sovereign bonds, partially offset by realised gains of £214 million from routine portfolio management, mainly in Group Treasury.
Quarter ended Nine months ended
30 September
2011 30 June
201130 September
2010 30 September
2011 30 September
2010 Available-for-sale reserve £m £m £m £m £m
At beginning of period (1,026) (2,063) (1,459) (2,037) (1,755)Unrealised gains 1,207 781 680 2,150 1,327 Realised (gains)/losses (214) 626 (408) 215 (535)Tax (259) (370) (55) (620) (263)Recycled to profit or loss on disposal of businesses (1) - - - - (16)
At end of period (292) (1,026) (1,242) (292) (1,242)
Note: (1) Net of tax - £6 million credit.
In Q2 2011, an impairment loss of £733 million was recorded in respect of Greek government bonds, together with £109 million related interest rate hedge adjustments, as a result of the deterioration in Greece’s fiscal position and the announcement of the proposals to restructure Greek government debt. Further losses of £142 million were recorded in Q3 2011, along with £60 million related interest rate hedge adjustments. Ireland, Italy, Portugal and Spain are facing less acute fiscal difficulties and the Group’s sovereign exposures to these countries were not considered impaired at 30 September 2011. 12. Contingent liabilities and commitments
30 September 2011 30 June 2011 31 December 2010
Core Non-Core Total Core
Non- Core Total Core
Non- Core Total
£m £m £m £m £m £m £m £m £m
Contingent liabilities Guarantees and assets pledged as collateral security 24,518 1,417 25,935 27,090 1,703 28,793 28,859 2,242 31,101 Other contingent liabilities 10,916 215 11,131 11,883 296 12,179 11,833 421 12,254
35,434 1,632 37,066 38,973 1,999 40,972 40,692 2,663 43,355
Commitments Undrawn formal standby facilities, credit lines and other commitments to lend 230,369 14,258 244,627 233,795 16,493 250,288 245,425 21,397 266,822 Other commitments 1,163 2,228 3,391 1,141 2,315 3,456 1,560 2,594 4,154
231,532 16,486 248,018 234,936 18,808 253,744 246,985 23,991 270,976
Total contingent liabilities and commitments 266,966 18,118 285,084 273,909 20,807 294,716 287,677 26,654 314,331
Additional contingent liabilities arise in the normal course of the Group’s business. It is not anticipated that any material loss will arise from these transactions.
95 RBS Group – Q3 2011 Results
Notes (continued) 13. Litigation and Investigations developments Except for the developments noted below, there have been no material changes to the litigation or investigations as disclosed in the Interim Results for the six months ended 30 June 2011.
Other securitisation and securities related litigation in the United States On 2 September 2011, the US Federal Housing Finance Agency ("FHFA") as conservator for the Federal National Mortgage Association ("Fannie Mae") and the Federal Home Loan Mortgage Company ("Freddie Mac") filed 17 lawsuits in the United States against a number of international banks and individual defendants, including RBS, certain other Group companies and five individual officers and directors of the Group's subsidiaries.
The lawsuits involve allegations that certain disclosures made in connection with the relevant offering or underwriting of securities contained materially false or misleading statements and/or omissions regarding the underwriting standards pursuant to which the mortgage loans underlying the securities were issued. Group entities are named as defendants in their capacities as issuers and underwriters of securities, not as originators of any underlying mortgage loans. The plaintiffs’ claims against the Group are currently unquantified.
The FHFA primary lawsuit against Group entities relates to approximately US$32 billion of AAA rated RMBS issuance during the period 2005-2008 pursuant to which Group entities acted as sponsor/depositor and/or lead underwriter. The aggregate principal amount has been reduced to approximately US$14 billion outstanding by repayments and recoveries of approximately US$18 billion and losses to date of approximately US$0.2 billion.
FHFA has also filed five lawsuits against each of Ally Financial Group, Countrywide Financial Corporation, JP Morgan, Morgan Stanley and Nomura in relation to some of the offerings where a Group entity acted as underwriter and is named amongst the defendants.
Group entities believe they have a variety of substantial and credible legal and factual defences available to all of the FHFA lawsuits and the Group will defend each of the matters vigorously. Additionally, Group entities potentially have recourse to indemnities from the relevant mortgage originators or sponsors/depositors although the amount and extent of any recovery is uncertain and subject to a number of factors, including the ongoing creditworthiness of the indemnifying party. Given the early stages of these matters the Group cannot predict the outcome of these claims and is unable reliably to estimate the liability, if any, that may arise or its effect on the Group’s consolidated net assets, operating results or cash flows in any particular period.
Independent Commission on Banking Following an interim report published on 11 April 2011, the Independent Commission on Banking (“ICB”) published its final report to the Cabinet Committee on Banking Reform on 12 September 2011 (the “Final Report”). The Final Report makes a number of recommendations, including in relation to (i) the implementation of a ring-fence of retail banking operations, (ii) loss-absorbency (including bail-in) and (iii) competition. The ICB has recommended 2019 as the final deadline for the implementation of its recommendations. The Group will continue to participate in the debate and to consult with the UK Government on the implementation of the recommendations set out in the Final Report, the effects of which could have a negative impact on the Group’s consolidated net assets, operating results or cash flows in any particular period.

96 RBS Group – Q3 2011 Results
Notes (continued) 14. Other developments Proposed transfers of a substantial part of the business activities of RBS N.V. to The Royal Bank of Scotland plc (RBS plc) On 19 April 2011, the Group announced its intention to transfer a substantial part of the business activities of RBS N.V. to RBS plc (the "Proposed Transfers"), subject, amongst other matters, to regulatory and other approvals, further tax and other analysis in respect of the assets and liabilities to be transferred and employee consultation procedures. The Proposed Transfers will streamline the manner in which the GBM and GTS businesses of the Group interact with clients with simplified access to the GBM and GTS product suites. It is expected that the Proposed Transfers will be implemented on a phased basis over a period ending 31 December 2013. The transfer of eligible business carried out in the UK, including certain securities issued by RBS N.V. was completed on 17 October 2011. A large part of the remainder of Proposed Transfers (including the transfers of certain securities issued by RBS N.V.) is expected to have taken place by the end of 2012. Rating agencies RBS and RBS plc's long-term and short-term ratings remained unchanged in the quarter, however in October 2011, both Moody’s and Fitch have taken rating action on RBS and certain subsidiaries. On 7 October 2011, Moody’s Investor Services downgraded the long term ratings of RBS, RBS plc and National Westminster Bank Plc (NatWest), following the conclusion of its review into the systemic support assumptions from the UK government for 14 UK financial institutions. As a result of this review, 12 UK entities, including RBS, were downgraded. RBS was downgraded to A3 from A1 (long-term) and to P-2 from P-1 (short term), RBS plc and NatWest were downgraded to A2 from Aa3 (long-term); their P-1 short-term ratings were affirmed. These ratings all have a negative outlook assigned due to Moody’s opinion that the likelihood of government support will weaken further in the future, however Moody’s affirmed RBS’s underlying Baa2 rating, noting that these downgrades do not reflect a worsening in the credit quality of UK financial institutions. On 11 October 2011, following the reduction of support factored into the ratings of RBS, Moody’s downgraded the ratings of Ulster Bank Ltd and Ulster Bank Ireland Ltd to Baa1 from A2 (long term) and to P-2 from P-1 (short term); Moody’s also placed these ratings on negative outlook following the earlier downgrade of RBS plc. In addition, Moody’s has placed the ratings of RBS N.V. on negative outlook, to match those of RBS plc. On 13 October 2011, Fitch Ratings downgraded RBS and certain subsidiaries, having lowered its ‘Support Rating Floors’ for large UK banks. The ratings of RBS, RBS plc, NatWest, RBS International and RBS N.V. were reduced to A from AA- (long-term) and to F1 from F1+ (short term). The ratings of Citizens Financial Group, Ulster Bank Ltd and Ulster Bank Ireland Ltd were downgraded to A- from A+ (long term). The short term rating of Citizens Financial Group was affirmed at F1 following the downgrade of RBS plc, while the rating of Ulster Bank Ltd was downgraded from F+ to F1. Fitch has assigned all of these ratings a stable outlook. The standalone ratings of RBS Group and RBS plc were unchanged by this action and have recently been upgraded from C/D to C, corresponding to a bbb viability rating.

97 RBS Group – Q3 2011 Results
Notes (continued) 14. Other developments (continued) EU measures to restore confidence in the banking sector The capital package proposed by the European Banking Authority (EBA) and agreed by the European Council on 26 October 2011 requires banks to build up additional capital buffers to reach a level of 9% Core Tier 1 ratio by the end of June 2012, after the removal of the prudential filters on sovereign assets in the available-for-sale portfolio and prudent valuation of sovereign debt in the held-to-maturity and loans and receivables portfolio, reflecting current market prices. The EBA estimated the preliminary impact of this approach based on data as of 30 June 2011. As part of this exercise, the Group was advised that it did not need additional capital. The final total target buffer will be based on 30 September 2011 data, and the results are expected to be published by the EBA in the course of November. 15. Date of approval This announcement was approved by the Board of directors on 3 November 2011. 16. Post balance sheet events There have been no significant events between 30 September 2011 and the date of approval of this announcement which would require a change to or additional disclosure in the announcement.

98 RBS Group – Q3 Interim Results
Risk and balance sheet management Key terms and acronyms used in this section are defined in the glossary of terms. Balance sheet management Capital The Group aims to maintain an appropriate level of capital to meet its business needs and regulatory requirements as capital adequacy and risk management are closely aligned. The Group’s risk asset ratios calculated in accordance with Financial Services Authority (FSA) definitions are set out below.
30 September
2011 30 June
2011 31 December
2010 Risk-weighted assets (RWAs) £bn £bn £bn
Credit risk 346.8 366.1 385.9 Counterparty risk 72.2 66.1 68.1 Market risk 55.0 58.6 80.0 Operational risk 37.9 37.9 37.1
511.9 528.7 571.1 Benefit of Asset Protection Scheme (88.6) (95.2) (105.6)
423.3 433.5 465.5
Risk asset ratio % % %
Core Tier 1 11.3 11.1 10.7 Tier 1 13.8 13.5 12.9 Total 14.7 14.4 14.0
Key points • The Core Tier 1 ratio increased in the quarter, due to a reduction in RWAs.
• Credit risk RWAs decreased by £19.3 billion principally driven by asset run-off, disposals andrestructurings.
• Market risk RWAs decreased by £3.6 billion reflecting de-risking of the Non-Core portfolio and areduction in VaR.
• The reduction in APS RWA benefit mainly reflects the run-off of covered assets.

99 RBS Group – Q3 Interim Results
Risk and balance sheet management (continued) Balance sheet management: Capital (continued) The Group’s capital resources in accordance with FSA definitions were as follows:
30 September
2011 30 June
2011 31 December
2010 Composition of regulatory capital £m £m £m
Tier 1 Ordinary and B shareholders' equity 72,699 70,000 70,388 Non-controlling interests 1,433 1,498 1,719 Adjustments for: - goodwill and other intangible assets - continuing businesses (14,744) (14,592) (14,448) - unrealised losses on available-for-sale (AFS) debt securities 379 1,103 2,061 - reserves arising on revaluation of property and unrealised gains on AFS equities (88) (76) (25) - reallocation of preference shares and innovative securities (548) (548) (548) - other regulatory adjustments* (3,465) (1,014) (1,097)Less excess of expected losses over provisions net of tax (2,127) (2,156) (1,900)Less securitisation positions (2,164) (2,404) (2,321)Less APS first loss (3,545) (3,810) (4,225)
Core Tier 1 capital 47,830 48,001 49,604 Preference shares 5,398 5,372 5,410 Innovative Tier 1 securities 4,644 4,564 4,662 Tax on the excess of expected losses over provisions 767 777 758 Less material holdings (303) (327) (310)
Total Tier 1 capital 58,336 58,387 60,124
Tier 2 Reserves arising on revaluation of property and unrealised gains on AFS equities 88 76 25 Collective impairment provisions 728 715 778 Perpetual subordinated debt 1,837 1,858 1,852 Term subordinated debt 14,999 15,697 16,745 Non-controlling and other interests in Tier 2 capital 11 11 11 Less excess of expected losses over provisions (2,894) (2,933) (2,658)Less securitisation positions (2,164) (2,404) (2,321)Less material holdings (303) (327) (310)Less APS first loss (3,545) (3,810) (4,225)
Total Tier 2 capital 8,757 8,883 9,897
Supervisory deductions Unconsolidated investments - RBS Insurance (4,292) (4,176) (3,962) - other investments (262) (354) (318)Other deductions (311) (419) (452)
Deductions from total capital (4,865) (4,949) (4,732)
Total regulatory capital 62,228 62,321 65,289 * Includes reduction for own liabilities carried at fair value (2,931) (1,112) (1,182)
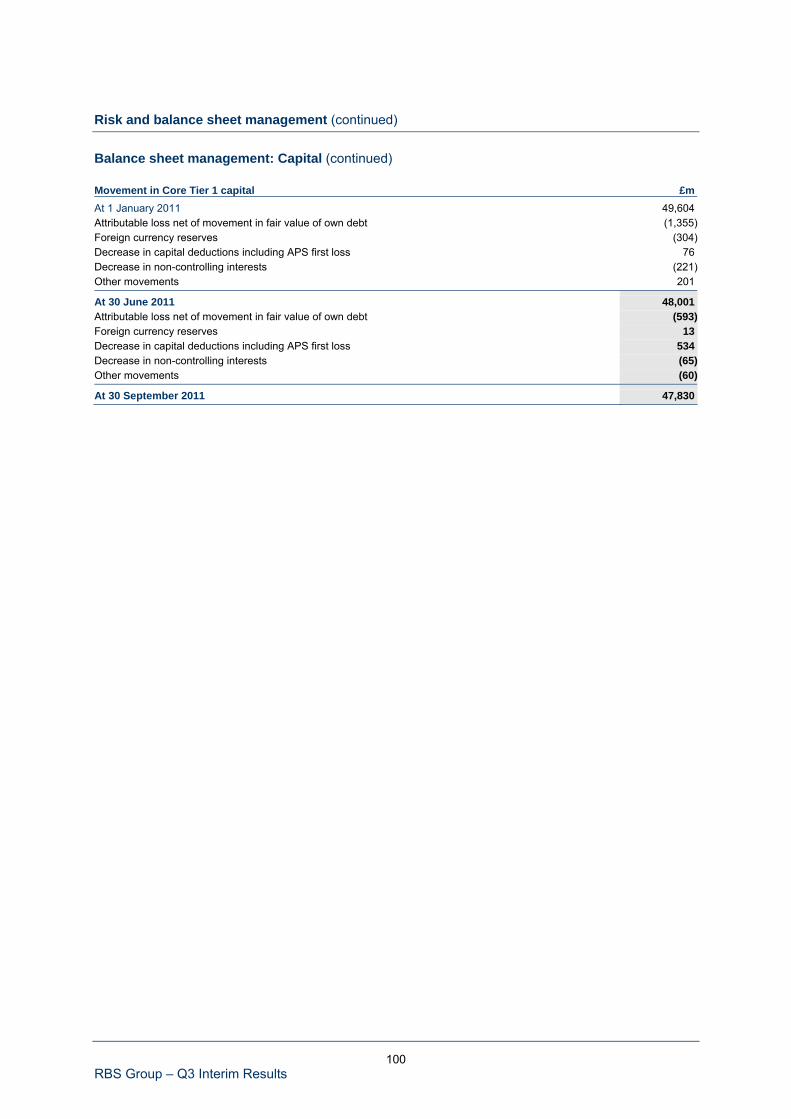
100 RBS Group – Q3 Interim Results
Risk and balance sheet management (continued) Balance sheet management: Capital (continued) Movement in Core Tier 1 capital £m At 1 January 2011 49,604 Attributable loss net of movement in fair value of own debt (1,355)Foreign currency reserves (304)Decrease in capital deductions including APS first loss 76 Decrease in non-controlling interests (221)Other movements 201
At 30 June 2011 48,001 Attributable loss net of movement in fair value of own debt (593)Foreign currency reserves 13 Decrease in capital deductions including APS first loss 534 Decrease in non-controlling interests (65)Other movements (60)
At 30 September 2011 47,830
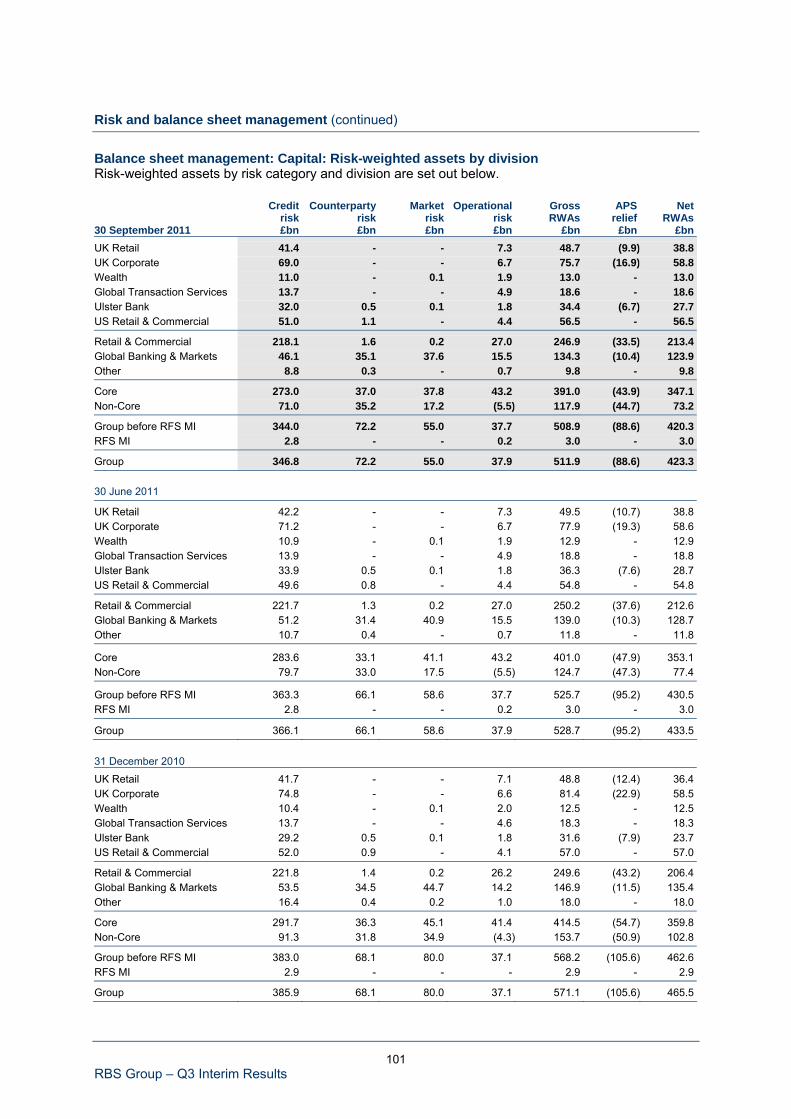
101 RBS Group – Q3 Interim Results
Risk and balance sheet management (continued) Balance sheet management: Capital: Risk-weighted assets by division Risk-weighted assets by risk category and division are set out below.
Credit
risk Counterparty
risk Market
risk Operational
risk Gross RWAs
APS relief
Net RWAs
30 September 2011 £bn £bn £bn £bn £bn £bn £bn UK Retail 41.4 - - 7.3 48.7 (9.9) 38.8 UK Corporate 69.0 - - 6.7 75.7 (16.9) 58.8 Wealth 11.0 - 0.1 1.9 13.0 - 13.0 Global Transaction Services 13.7 - - 4.9 18.6 - 18.6 Ulster Bank 32.0 0.5 0.1 1.8 34.4 (6.7) 27.7 US Retail & Commercial 51.0 1.1 - 4.4 56.5 - 56.5
Retail & Commercial 218.1 1.6 0.2 27.0 246.9 (33.5) 213.4 Global Banking & Markets 46.1 35.1 37.6 15.5 134.3 (10.4) 123.9 Other 8.8 0.3 - 0.7 9.8 - 9.8
Core 273.0 37.0 37.8 43.2 391.0 (43.9) 347.1 Non-Core 71.0 35.2 17.2 (5.5) 117.9 (44.7) 73.2
Group before RFS MI 344.0 72.2 55.0 37.7 508.9 (88.6) 420.3 RFS MI 2.8 - - 0.2 3.0 - 3.0
Group 346.8 72.2 55.0 37.9 511.9 (88.6) 423.3 30 June 2011
UK Retail 42.2 - - 7.3 49.5 (10.7) 38.8 UK Corporate 71.2 - - 6.7 77.9 (19.3) 58.6 Wealth 10.9 - 0.1 1.9 12.9 - 12.9 Global Transaction Services 13.9 - - 4.9 18.8 - 18.8 Ulster Bank 33.9 0.5 0.1 1.8 36.3 (7.6) 28.7 US Retail & Commercial 49.6 0.8 - 4.4 54.8 - 54.8
Retail & Commercial 221.7 1.3 0.2 27.0 250.2 (37.6) 212.6 Global Banking & Markets 51.2 31.4 40.9 15.5 139.0 (10.3) 128.7 Other 10.7 0.4 - 0.7 11.8 - 11.8
Core 283.6 33.1 41.1 43.2 401.0 (47.9) 353.1 Non-Core 79.7 33.0 17.5 (5.5) 124.7 (47.3) 77.4
Group before RFS MI 363.3 66.1 58.6 37.7 525.7 (95.2) 430.5 RFS MI 2.8 - - 0.2 3.0 - 3.0
Group 366.1 66.1 58.6 37.9 528.7 (95.2) 433.5
31 December 2010
UK Retail 41.7 - - 7.1 48.8 (12.4) 36.4 UK Corporate 74.8 - - 6.6 81.4 (22.9) 58.5 Wealth 10.4 - 0.1 2.0 12.5 - 12.5 Global Transaction Services 13.7 - - 4.6 18.3 - 18.3 Ulster Bank 29.2 0.5 0.1 1.8 31.6 (7.9) 23.7 US Retail & Commercial 52.0 0.9 - 4.1 57.0 - 57.0
Retail & Commercial 221.8 1.4 0.2 26.2 249.6 (43.2) 206.4 Global Banking & Markets 53.5 34.5 44.7 14.2 146.9 (11.5) 135.4 Other 16.4 0.4 0.2 1.0 18.0 - 18.0
Core 291.7 36.3 45.1 41.4 414.5 (54.7) 359.8 Non-Core 91.3 31.8 34.9 (4.3) 153.7 (50.9) 102.8
Group before RFS MI 383.0 68.1 80.0 37.1 568.2 (105.6) 462.6 RFS MI 2.9 - - - 2.9 - 2.9
Group 385.9 68.1 80.0 37.1 571.1 (105.6) 465.5

102 RBS Group – Q3 Interim Results
Risk and balance sheet management (continued) Balance sheet management: Capital (continued) CRD 3 and Basel III impacts The estimated impact of CRD 3 rules on the Group’s RWAs post mitigation is an increase of c.£20 billion. This is lower than the initial estimates of £25 billion to £30 billion and reflects mitigation, restructuring and continuing risk reduction. The implementation of the Basel III proposals in 2013 is now estimated to result in an increase in RWAs of £60 billion to £75 billion. This is lower than the previous estimate of £75 billion to £85 billion, due to risk reduction and mitigation in both GBM and Non-Core. The combined impact of CRD 3 and Basel III on the Group’s RWAs is now estimated to be some £20 billion or 20% lower than the previous estimates. Funding and liquidity risk The Group’s balance sheet composition is a function of the broad array of product offerings and diverse markets served by its Core divisions. The structural composition of the balance sheet is augmented as needed through active management of both asset and liability portfolios. The objective of these activities is to optimise liquidity transformation in normal business environments while ensuring adequate coverage of all cash requirements under extreme stress conditions. Diversification of the Group’s funding base is central to its liquidity management strategy. The Group’s businesses have developed large customer franchises based on strong relationship management and high quality service. These customer franchises are strongest in the UK, US and Ireland but extend into Europe and Asia. Customer deposits provide large pools of stable funding to support the majority of the Group’s lending. It is a strategic objective to improve the Group’s loan to deposit ratio to 100%, or better, by 2013. The Group also accesses professional markets funding by way of public and private debt issuances on an unsecured and secured basis. These debt issuance programmes are spread across multiple currencies and maturities to appeal to a broad range of investor types and preferences around the world. This market based funding supplements the Group’s structural liquidity needs and in some cases achieves certain capital objectives.

103 RBS Group – Q3 Interim Results
Risk and balance sheet management (continued) Balance sheet management: Funding and liquidity risk (continued) Funding sources The table below shows the Group’s primary funding sources, excluding repurchase agreements. 30 September 2011 30 June 2011 31 December 2010 £m % £m % £m %
Deposits by banks - central banks 3,568 0.5 4,469 0.6 6,655 0.9 - derivative cash collateral 32,466 4.4 25,524 3.5 28,074 3.8 - other 42,336 5.8 41,580 5.6 31,322 4.3
78,370 10.7 71,573 9.7 66,051 9.0
Debt securities in issue - conduit asset backed commercial paper 11,783 1.6 12,894 1.7 17,320 2.3 - other commercial paper 8,680 1.2 9,475 1.3 8,915 1.2 - certificates of deposits 25,036 3.4 35,305 4.8 37,855 5.1 - medium-term notes (MTNs) 127,719 17.4 132,371 17.9 131,026 17.7 - covered bonds 8,541 1.2 6,972 0.9 4,100 0.6 - securitisations 12,752 1.7 16,780 2.3 19,156 2.6
194,511 26.5 213,797 28.9 218,372 29.5 Subordinated liabilities 26,275 3.6 26,311 3.5 27,053 3.6
Debt securities in issue and subordinated liabilities 220,786 30.1 240,108 32.4 245,425 33.1
Wholesale funding 299,156 40.8 311,681 42.1 311,476 42.1
Customer deposits - cash collateral 10,278 1.4 11,166 1.5 10,433 1.4 - other 423,382 57.8 417,537 56.4 418,166 56.5
Total customer deposits 433,660 59.2 428,703 57.9 428,599 57.9
Total funding 732,816 100.0 740,384 100.0 740,075 100.0
30 September
2011 30 June
2011 31 December
2010 £bn £bn £bn
Short-term wholesale funding 173.8 173.5 157.5 Of which - bank deposits 74.0 67.0 62.5 - other 99.8 106.5 95.0 Short-term wholesale funding excluding derivative collateral 141.3 148.0 129.4 Of which - bank deposits 41.5 41.5 34.4 - other 99.8 106.5 95.0
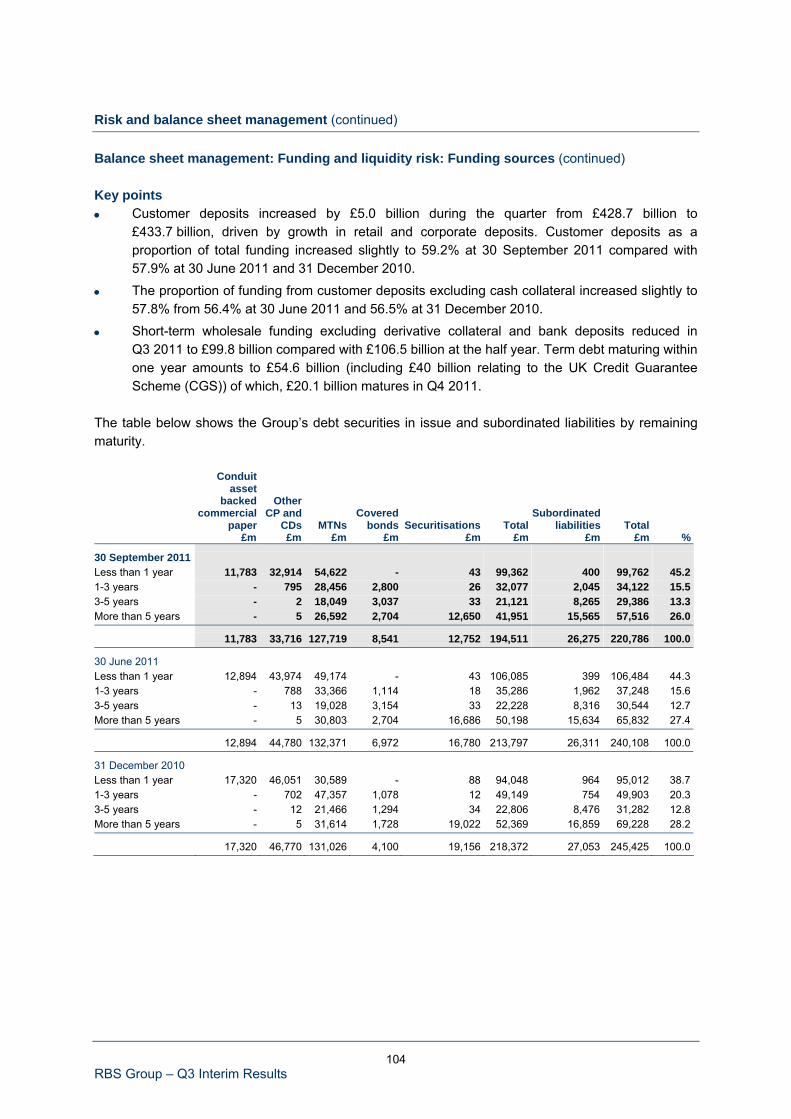
104 RBS Group – Q3 Interim Results
Risk and balance sheet management (continued) Balance sheet management: Funding and liquidity risk: Funding sources (continued) Key points • Customer deposits increased by £5.0 billion during the quarter from £428.7 billion to
£433.7 billion, driven by growth in retail and corporate deposits. Customer deposits as aproportion of total funding increased slightly to 59.2% at 30 September 2011 compared with57.9% at 30 June 2011 and 31 December 2010.
• The proportion of funding from customer deposits excluding cash collateral increased slightly to57.8% from 56.4% at 30 June 2011 and 56.5% at 31 December 2010.
• Short-term wholesale funding excluding derivative collateral and bank deposits reduced inQ3 2011 to £99.8 billion compared with £106.5 billion at the half year. Term debt maturing withinone year amounts to £54.6 billion (including £40 billion relating to the UK Credit GuaranteeScheme (CGS)) of which, £20.1 billion matures in Q4 2011.
The table below shows the Group’s debt securities in issue and subordinated liabilities by remaining maturity.
Conduit asset
backed commercial
paper
Other CP and
CDs MTNs Covered
bonds Securitisations Total Subordinated
liabilities Total £m £m £m £m £m £m £m £m %
30 September 2011 Less than 1 year 11,783 32,914 54,622 - 43 99,362 400 99,762 45.2 1-3 years - 795 28,456 2,800 26 32,077 2,045 34,122 15.5 3-5 years - 2 18,049 3,037 33 21,121 8,265 29,386 13.3 More than 5 years - 5 26,592 2,704 12,650 41,951 15,565 57,516 26.0
11,783 33,716 127,719 8,541 12,752 194,511 26,275 220,786 100.0
30 June 2011 Less than 1 year 12,894 43,974 49,174 - 43 106,085 399 106,484 44.3 1-3 years - 788 33,366 1,114 18 35,286 1,962 37,248 15.6 3-5 years - 13 19,028 3,154 33 22,228 8,316 30,544 12.7 More than 5 years - 5 30,803 2,704 16,686 50,198 15,634 65,832 27.4
12,894 44,780 132,371 6,972 16,780 213,797 26,311 240,108 100.0
31 December 2010 Less than 1 year 17,320 46,051 30,589 - 88 94,048 964 95,012 38.7 1-3 years - 702 47,357 1,078 12 49,149 754 49,903 20.3 3-5 years - 12 21,466 1,294 34 22,806 8,476 31,282 12.8 More than 5 years - 5 31,614 1,728 19,022 52,369 16,859 69,228 28.2
17,320 46,770 131,026 4,100 19,156 218,372 27,053 245,425 100.0

105 RBS Group – Q3 Interim Results
Risk and balance sheet management (continued) Balance sheet management: Funding and liquidity risk: Funding sources (continued) Long-term debt issuances The table below shows debt securities issued by the Group with an original maturity of one year or more. The Group also executes other long-term funding arrangements (predominately term repos) which are not reflected in the following tables.
Quarter ended Nine months ended
30 September
2011 30 June
2011 30 September
2010 30 September
2011 30 September
2010 £m £m £m £m £m
Public - unsecured - 1,808 6,254 5,085 12,112 - secured 1,721 2,211 5,286 6,584 6,316 Private - unsecured 3,255 3,997 6,299 11,503 12,827
Gross issuance 4,976 8,016 17,839 23,172 31,255
The table below shows the original maturity of public long-term debt securities issued in the nine months ended 30 September 2011 and 2010. 2-3 years 3-5years 5-10 years > 10 years Total Nine months ended 30 September 2011 £m £m £m £m £m
MTNs 904 1,407 1,839 935 5,085 Covered bonds - 1,721 2,652 - 4,373 Securitisations - - - 2,211 2,211
904 3,128 4,491 3,146 11,669 % of total 8% 27% 38% 27% 100% Nine months ended 30 September 2010
MTNs 1,445 1,541 6,393 2,733 12,112 Covered bonds - 1,030 1,244 - 2,274 Securitisations - - - 4,042 4,042
1,445 2,571 7,637 6,775 18,428 % of total 8% 14% 41% 37% 100%

106 RBS Group – Q3 Interim Results
Risk and balance sheet management (continued) Balance sheet management: Funding and liquidity risk: Funding sources (continued) Long-term debt issuance (continued) The table below shows the currency breakdown of public and private long-term debt securities issued in the nine months ended 30 September 2011 and 2010.
GBP EUR USD AUD Other Total Nine months ended 30 September 2011 £m £m £m £m £m £m
Public - MTNs - 1,808 2,181 1,096 - 5,085 - covered bonds - 4,373 - - - 4,373 - securitisations 258 1,293 660 - - 2,211 Private 2,193 3,513 2,996 280 2,521 11,503
2,451 10,987 5,837 1,376 2,521 23,172 % of total 11% 47% 25% 6% 11% 100% Nine months ended 30 September 2010
Public - MTNs 1,260 3,969 5,131 1,040 712 12,112 - covered bonds - 2,274 - - - 2,274 - securitisations 663 1,629 1,750 - - 4,042 Private 1,926 7,671 1,683 106 1,441 12,827
3,849 15,543 8,564 1,146 2,153 31,255 % of total 12% 50% 27% 4% 7% 100%
Key points • Despite the difficult economic environment gross term issuances in Q3 2011 were £5.0 billion,
including €2.0 billion of covered bonds issued publicly. The Group has executed £3.5 billion ofsecuritisation transactions in October 2011, and continues to access markets as opportunitiesarise.
• The Group has continued to diversify its funding mix with 47% of issuance denominated ineuros, 25% in US dollars and 28% in other currencies.
• The Group has already met its full year target for long-term debt issuance of £23 billion.

107 RBS Group – Q3 Interim Results
Risk and balance sheet management (continued) Balance sheet management: Funding and liquidity risk (continued) Liquidity portfolio The table below shows the composition of the Group’s liquidity portfolio.
30 September
2011 30 June
2011 31 December
2010 Liquidity portfolio £m £m £m
Cash and balances at central banks 76,833 59,010 53,661 Treasury bills 4,037 8,600 14,529 Central and local government bonds (1) - AAA rated governments and US agencies 29,850 47,999 41,435 - AA- to AA+ rated governments (2) 18,077 1,399 3,744 - governments rated below AA 700 836 1,029 - local government 4,700 4,881 5,672
53,327 55,115 51,880 Unencumbered collateral (3) - AAA rated 24,186 18,335 17,836 - below AAA rated and other high quality assets 11,444 13,493 16,693
35,630 31,828 34,529
Total liquidity portfolio 169,827 154,553 154,599 Notes: (1) Includes FSA eligible government bonds of £36.8 billion at 30 September 2011 (30 June 2011 - £34.5 billion;
31 December 2010 - £34.7 billion). (2) Includes AAA rated US government guaranteed and US government sponsored agencies. The US government was
downgraded from AAA to AA+ by S&P on 5 August 2011 and its debt securities carry a split credit rating; thesesecurities are reflected here.
(3) Includes secured assets eligible for discounting at central banks, comprising loans and advances and debt securities. Key points • The Group’s liquidity portfolio was £169.8 billion, an increase of £15.3 billion from 30 June 2011
and £15.2 billion from 31 December 2010, mainly due to an increase in cash at central banks.The Group strengthened its liquidity portfolio in response to the ongoing stress in globalfinancial markets which worsened during Q3 2011.
• The strategic target of £150 billion is unchanged.
• The liquidity portfolio is actively managed and as such its composition varies over time inaccordance with factors such as changing external market conditions.

108 RBS Group – Q3 Interim Results
Risk and balance sheet management (continued) Balance sheet management: Funding and liquidity risk (continued)
Net stable funding The table below shows the Group’s net stable funding ratio (NSFR) estimated by applying the Basel III guidance issued in December 2010; the Group is aiming to meet the minimum required NSFR of 100% over the longer term. This measure seeks to show the proportion of structural term assets which are funded by stable funding including customer deposits, long-term wholesale funding and equity. The Group’s NSFR will continue to be refined over time in line with regulatory developments.
30 September 2011 30 June 2011 31 December 2010 ASF (1) ASF (1) ASF (1) Weighting £bn £bn £bn £bn £bn £bn %
Equity 79 79 76 76 77 77 100 Wholesale funding > 1 year 125 125 138 138 154 154 100 Wholesale funding < 1 year 174 - 174 - 157 - - Derivatives 562 - 388 - 424 - - Repurchase agreements 132 - 124 - 115 - - Deposits - Retail and SME - more stable 170 153 168 151 172 155 90 - Retail and SME - less stable 25 20 25 20 51 41 80 - Other 239 120 236 118 206 103 50 Other (2) 102 - 117 - 98 - -
Total liabilities and equity 1,608 497 1,446 503 1,454 530
Cash 78 - 64 - 57 - - Inter-bank lending 53 - 53 - 58 - - Debt securities > 1 year - central and local governments AAA to AA- 84 4 87 4 89 4 5 - other eligible bonds 75 15 85 17 75 15 20 - other bonds 17 17 19 19 10 10 100 Debt securities < 1 year 54 - 53 - 43 - - Derivatives 572 - 395 - 427 - - Reverse repurchase agreements 102 - 98 - 95 - - Customer loans and advances > 1 year - residential mortgages 144 94 145 94 145 94 65 - other 176 176 182 182 211 211 100 Customer loans and advances < 1 year - retail loans 20 17 20 17 22 19 85 - other 146 73 143 72 125 63 50 Other (3) 87 87 102 102 97 97 100
Total assets 1,608 483 1,446 507 1,454 513
Undrawn commitments 245 12 250 13 267 13 5
Total assets and undrawn commitments 1,853 495 1,696 520 1,721 526
Net stable funding ratio 100% 97% 101%
Notes: (1) Available stable funding. (2) Deferred tax, insurance liabilities and other liabilities. (3) Prepayments, accrued income, deferred tax and other assets.
Key point • The Group’s net stable funding ratio improved to 100% during Q3 2011 from 97% mainly as a
result of increased deposits and the reduction in GBM and Non-Core assets.

109 RBS Group – Q3 Interim Results
Risk and balance sheet management (continued) Balance sheet management: Funding and liquidity risk (continued) Loan deposit ratio and funding gap The table below shows quarterly trends in the loan to deposit ratio and customer funding gap.
Loan to
deposit ratio (1) Customer
funding gap Group Core Group % % £bn
30 September 2011 112 95 52 30 June 2011 114 96 61 31 March 2011 115 96 66 31 December 2010 117 96 74 30 September 2010 126 101 107 Note: (1) Loans are net of provisions. Key points • The Group’s loan to deposit ratio improved by 500 basis points to 112% in the nine months to
30 September 2011, including a 200 basis points improvement in Q3 2011. The customerfunding gap narrowed by £22 billion in the nine months to 30 September 2011, including a£9 billion reduction in Q3 2011, primarily due to the reduction in Non-Core customer loans andan increase in customer deposits.
• The loan to deposit ratio for the Group’s Core business improved by 100 basis points duringQ3 2011.
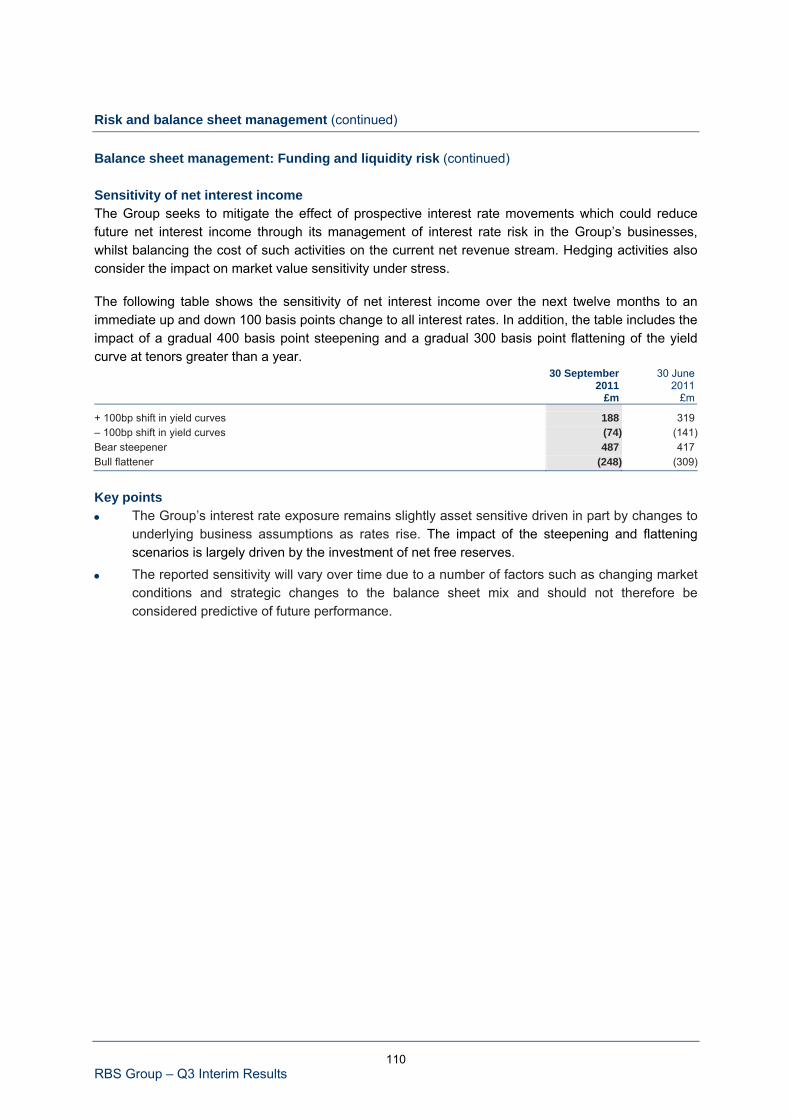
110 RBS Group – Q3 Interim Results
Risk and balance sheet management (continued) Balance sheet management: Funding and liquidity risk (continued) Sensitivity of net interest income The Group seeks to mitigate the effect of prospective interest rate movements which could reduce future net interest income through its management of interest rate risk in the Group’s businesses, whilst balancing the cost of such activities on the current net revenue stream. Hedging activities also consider the impact on market value sensitivity under stress. The following table shows the sensitivity of net interest income over the next twelve months to an immediate up and down 100 basis points change to all interest rates. In addition, the table includes the impact of a gradual 400 basis point steepening and a gradual 300 basis point flattening of the yield curve at tenors greater than a year. 30 September
2011 £m
30 June2011
£m
+ 100bp shift in yield curves 188 319– 100bp shift in yield curves (74) (141)Bear steepener 487 417Bull flattener (248) (309)
Key points • The Group’s interest rate exposure remains slightly asset sensitive driven in part by changes to
underlying business assumptions as rates rise. The impact of the steepening and flatteningscenarios is largely driven by the investment of net free reserves.
• The reported sensitivity will vary over time due to a number of factors such as changing marketconditions and strategic changes to the balance sheet mix and should not therefore beconsidered predictive of future performance.

111 RBS Group – Q3 Interim Results
Risk and balance sheet management (continued) Risk management: Credit risk Credit risk is the risk of financial loss due to the failure of customers or counterparties to meet payment obligations. The quantum and nature of credit risk assumed across the Group’s different businesses varies considerably, while the overall credit risk outcome usually exhibits a high degree of correlation with the macroeconomic environment. Loans and advances to customers by industry and geography The table below shows loans and advances to customers excluding reverse repos and assets of disposal groups. All assets, including loans, of businesses held for disposal are included as one line on the balance sheet, as required by IFRS.
30 September 2011 30 June 2011 31 December 2010
Core Non- Core Total Core
Non- Core Total Core
Non- Core Total
£m £m £m £m £m £m £m £m £m
Central and local government 8,097 1,507 9,604 6,574 1,507 8,081 6,781 1,671 8,452 Finance 48,094 4,884 52,978 47,545 5,038 52,583 46,910 7,651 54,561 Residential mortgages 143,941 5,319 149,260 144,400 5,509 149,909 140,359 6,142 146,501 Personal lending 32,152 2,810 34,962 32,224 3,229 35,453 33,581 3,891 37,472 Property 44,072 40,628 84,700 44,539 42,862 87,401 42,455 47,651 90,106 Construction 7,992 3,062 11,054 8,525 3,070 11,595 8,680 3,352 12,032 Manufacturing 24,816 5,233 30,049 24,068 6,293 30,361 25,797 6,520 32,317 Service industries and business activities - retail, wholesale and repairs 22,207 2,427 24,634 22,123 2,598 24,721 21,974 3,191 25,165 - transport and storage 16,236 6,009 22,245 15,243 6,449 21,692 15,946 8,195 24,141 - health, education and recreation 16,224 1,515 17,739 16,707 1,547 18,254 17,456 1,865 19,321 - hotels and restaurants 7,841 1,358 9,199 8,028 1,452 9,480 8,189 1,492 9,681 - utilities 8,212 1,725 9,937 7,487 2,010 9,497 7,098 2,110 9,208 - other 24,744 4,479 29,223 25,128 4,966 30,094 24,464 5,530 29,994 Agriculture, forestry and fishing 3,767 135 3,902 3,791 123 3,914 3,758 135 3,893 Finance leases and instalment credit 8,404 7,467 15,871 8,353 7,920 16,273 8,321 8,529 16,850 Interest accruals 661 152 813 715 176 891 831 278 1,109
Gross loans 417,460 88,710 506,170 415,450 94,749 510,199 412,600 108,203 520,803 Loan impairment provisions (8,748) (11,849) (20,597) (8,621) (12,006) (20,627) (7,740) (10,315) (18,055)
Net loans 408,712 76,861 485,573 406,829 82,743 489,572 404,860 97,888 502,748
Key point • Gross loans decreased by £4.0 billion in Q3 2011, across most sectors, including £2.7 billion in
property, £0.5 billion in construction, £0.3 billion in manufacturing, £0.3 billion in hotels andrestaurants reflecting run-offs, continued de-risking as well as subdued credit demand.
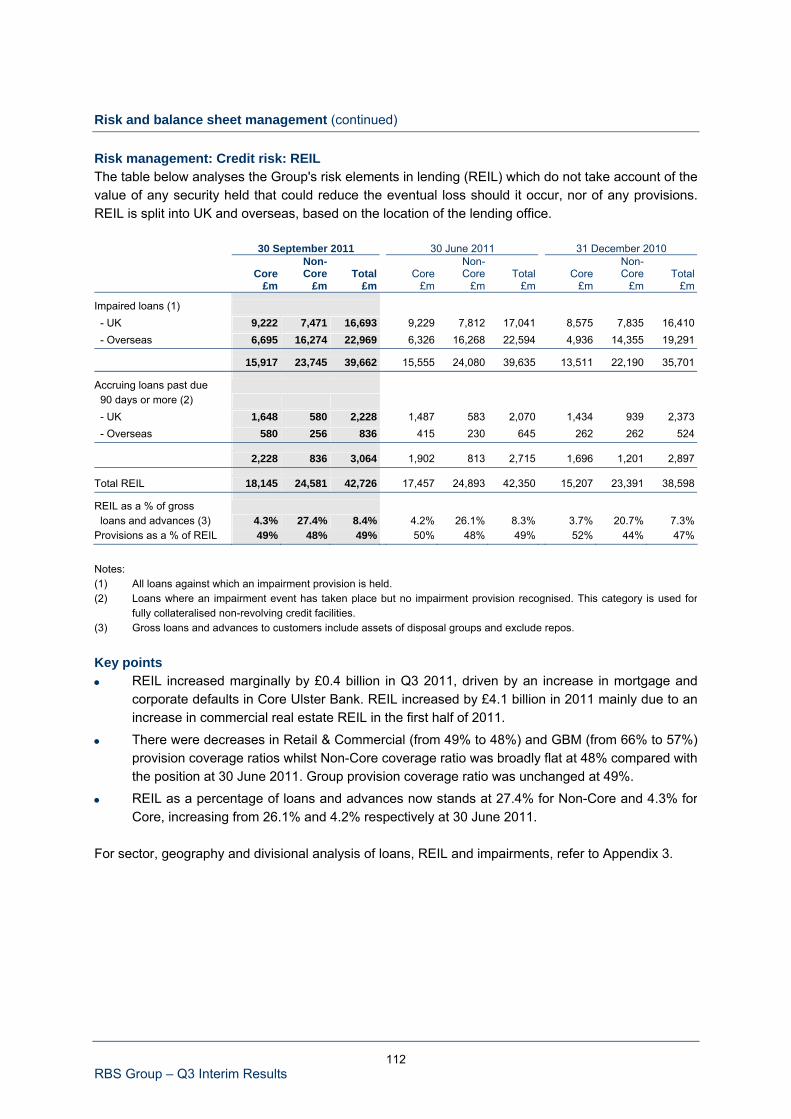
112 RBS Group – Q3 Interim Results
Risk and balance sheet management (continued) Risk management: Credit risk: REIL
The table below analyses the Group's risk elements in lending (REIL) which do not take account of the value of any security held that could reduce the eventual loss should it occur, nor of any provisions. REIL is split into UK and overseas, based on the location of the lending office.
30 September 2011 30 June 2011 31 December 2010
Core Non- Core Total Core
Non- Core Total Core
Non- Core Total
£m £m £m £m £m £m £m £m £m
Impaired loans (1) - UK 9,222 7,471 16,693 9,229 7,812 17,041 8,575 7,835 16,410 - Overseas 6,695 16,274 22,969 6,326 16,268 22,594 4,936 14,355 19,291
15,917 23,745 39,662 15,555 24,080 39,635 13,511 22,190 35,701
Accruing loans past due 90 days or more (2) - UK 1,648 580 2,228 1,487 583 2,070 1,434 939 2,373 - Overseas 580 256 836 415 230 645 262 262 524
2,228 836 3,064 1,902 813 2,715 1,696 1,201 2,897
Total REIL 18,145 24,581 42,726 17,457 24,893 42,350 15,207 23,391 38,598
REIL as a % of gross loans and advances (3) 4.3% 27.4% 8.4% 4.2% 26.1% 8.3% 3.7% 20.7% 7.3% Provisions as a % of REIL 49% 48% 49% 50% 48% 49% 52% 44% 47%
Notes: (1) All loans against which an impairment provision is held. (2) Loans where an impairment event has taken place but no impairment provision recognised. This category is used for
fully collateralised non-revolving credit facilities. (3) Gross loans and advances to customers include assets of disposal groups and exclude repos. Key points • REIL increased marginally by £0.4 billion in Q3 2011, driven by an increase in mortgage and
corporate defaults in Core Ulster Bank. REIL increased by £4.1 billion in 2011 mainly due to anincrease in commercial real estate REIL in the first half of 2011.
• There were decreases in Retail & Commercial (from 49% to 48%) and GBM (from 66% to 57%)provision coverage ratios whilst Non-Core coverage ratio was broadly flat at 48% compared withthe position at 30 June 2011. Group provision coverage ratio was unchanged at 49%.
• REIL as a percentage of loans and advances now stands at 27.4% for Non-Core and 4.3% forCore, increasing from 26.1% and 4.2% respectively at 30 June 2011.
For sector, geography and divisional analysis of loans, REIL and impairments, refer to Appendix 3.

113 RBS Group – Q3 Interim Results
Risk and balance sheet management (continued) Risk management: Credit risk: REIL (continued) The table below details the movement in REIL for the nine months ended 30 September 2011. Impaired loans Other loans (1) REIL
Core Non- Core Total Core
Non- Core Total Core
Non- Core Total
£m £m £m £m £m £m £m £m £m
At 1 January 2011 13,511 22,190 35,701 1,696 1,201 2,897 15,207 23,391 38,598 Intra-group transfers 300 (300) - 81 (81) - 381 (381) - Currency translation and other adjustments 165 462 627 14 12 26 179 474 653 Additions 4,249 5,383 9,632 1,362 577 1,939 5,611 5,960 11,571 Transfers 403 284 687 (245) (225) (470) 158 59 217 Disposals, repayments and restructurings (2,055) (3,027) (5,082) (1,006) (671) (1,677) (3,061) (3,698) (6,759)Amounts written-off (1,018) (912) (1,930) - - - (1,018) (912) (1,930)
At 30 June 2011 15,555 24,080 39,635 1,902 813 2,715 17,457 24,893 42,350 Currency translation and other adjustments (165) (629) (794) (19) (15) (34) (184) (644) (828)Additions 2,012 1,527 3,539 781 250 1,031 2,793 1,777 4,570 Transfers (3) 28 25 28 (10) 18 25 18 43 Disposals, repayments and restructurings (889) (764) (1,653) (464) (202) (666) (1,353) (966) (2,319)Amounts written-off (593) (497) (1,090) - - - (593) (497) (1,090)
At 30 September 2011 15,917 23,745 39,662 2,228 836 3,064 18,145 24,581 42,726 Impaired loans Other loans (1) REIL
Core Non- Core Total Core
Non- Core Total Core
Non- Core Total
£m £m £m £m £m £m £m £m £m
At 1 January 2011 13,511 22,190 35,701 1,696 1,201 2,897 15,207 23,391 38,598 Intra-group transfers 300 (300) - 81 (81) - 381 (381) - Currency translation and other adjustments - (167) (167) (5) (3) (8) (5) (170) (175)Additions 6,261 6,910 13,171 2,143 827 2,970 8,404 7,737 16,141 Transfers 400 312 712 (217) (235) (452) 183 77 260 Disposals, repayments and restructurings (2,944) (3,791) (6,735) (1,470) (873) (2,343) (4,414) (4,664) (9,078)Amounts written-off (1,611) (1,409) (3,020) - - - (1,611) (1,409) (3,020)
At 30 September 2011 15,917 23,745 39,662 2,228 836 3,064 18,145 24,581 42,726 Note: (1) Accruing loans past due 90 days or more (also see page 112). Key point • Disposals and restructurings include £1,685 million of transfers to the performing book in the
nine months ended September 2011 including £120 million in Q3 2011.

114 RBS Group – Q3 Interim Results
Risk and balance sheet management (continued) Risk management: Credit risk: Impairment provisions Movement in loan impairment provisions The following tables show the movement in impairment provisions for loans and advances to banks and customers.
Quarter ended 30 September 2011 30 June 2011 30 September 2010
Core Non- Core Total Core
Non- Core RFS MI Total Core
Non- Core Total
£m £m £m £m £m £m £m £m £m £m
At beginning of period 8,752 12,007 20,759 8,416 10,842 - 19,258 7,633 8,533 16,166 Transfers to disposal groups - - - - 9 - 9 - - - Intra-group transfers - - - - - - - (351) 351 - Currency translation and other adjustments (90) (285) (375) 33 145 - 178 116 175 291 Disposals - - - - - 11 11 - - - Amounts written-off (593) (497) (1,090) (504) (474) - (978) (416) (329) (745)Recoveries of amounts previously written-off 39 55 94 41 126 - 167 80 85 165 Charge to income statement - continued 817 635 1,452 810 1,427 - 2,237 779 1,129 1,908 - discontinued - - - - - (11) (11) - - - Unwind of discount (52) (65) (117) (44) (68) - (112) (50) (65) (115)
At end of period 8,873 11,850 20,723 8,752 12,007 - 20,759 7,791 9,879 17,670
Nine months ended
30 September 2011 30 September 2010
Core Non- Core RFS MI Total Core
Non- Core RFS MI Total
£m £m £m £m £m £m £m £m
At beginning of period 7,866 10,316 - 18,182 6,921 8,252 2,110 17,283 Transfers to disposal groups - - - - - (67) - (67)Intra-group transfers 177 (177) - - (351) 351 - - Currency translation and other adjustments (1) (45) - (46) (163) 294 - 131 Disposals - - 11 11 - (17) (2,149) (2,166)Amounts written-off (1,611) (1,409) - (3,020) (1,479) (3,047) - (4,526)Recoveries of amounts previously written-off 119 261 - 380 184 131 - 315 Charge to income statement - continued 2,479 3,108 - 5,587 2,825 4,164 - 6,989 - discontinued - - (11) (11) - - 39 39 Unwind of discount (156) (204) - (360) (146) (182) - (328)
At end of period 8,873 11,850 - 20,723 7,791 9,879 - 17,670

115 RBS Group – Q3 Interim Results
Risk and balance sheet management (continued) Risk management: Credit risk: Impairment provisions (continued) Movement in loan impairment provisions (continued) Key points • Overall the Q3 2011 impairment charge of £1.5 billion was £0.8 billion or 35% lower than the
Q2 2011 charge as the latter reflected the impact of the re-assessment of Ulster Bank’s Non-Core development land collateral values.
• The year-to-date charge for 2011 of £5.6 billion was £1.5 billion lower than 2010, withreductions in both Core (£0.3 billion) and Non-Core (£1.1 billion).
• The Group impairment charge as a percentage of loans and advances was 20 basis pointslower at 1.5% in 2011 compared with 2010.
• The loan impairment provision was broadly unchanged at £20.7 billion. The following table analyses impairment provisions in respect of loans and advances to banks and customers.
30 September 2011 30 June 2011 31 December 2010
Core Non- Core Total Core
Non- Core Total Core
Non- Core Total
£m £m £m £m £m £m £m £m £m
Latent loss 1,516 751 2,267 1,568 786 2,354 1,653 997 2,650 Collectively assessed 4,675 1,114 5,789 4,510 1,100 5,610 4,139 1,157 5,296 Individually assessed 2,557 9,984 12,541 2,543 10,120 12,663 1,948 8,161 10,109
Customer loans 8,748 11,849 20,597 8,621 12,006 20,627 7,740 10,315 18,055 Bank loans 125 1 126 131 1 132 126 1 127
Total provisions 8,873 11,850 20,723 8,752 12,007 20,759 7,866 10,316 18,182 % of loans (1) 2.1% 13.2% 4.1% 2.1% 12.6% 4.0% 1.9% 9.1% 3.4% Note: (1) Customer provisions as a percentage of gross loans and advances to customers including assets of disposal groups
and excluding reverse repos.

116 RBS Group – Q3 Interim Results
Risk and balance sheet management (continued) Risk management: Credit risk: Impairment charge The following table analyses the impairment charge for loans and securities. Quarter ended
30 September 2011 30 June 2011 30 September 2010
Core Non- Core Total Core
Non- Core Total Core
Non- Core Total
£m £m £m £m £m £m £m £m £m
Latent loss (33) (27) (60) (16) (172) (188) 132 (92) 40 Collectively assessed 548 141 689 465 126 591 450 298 748 Individually assessed 302 521 823 361 1,473 1,834 197 923 1,120
Customer loans 817 635 1,452 810 1,427 2,237 779 1,129 1,908 Securities - sovereign debt impairment and related interest rate hedge adjustments 202 - 202 842 - 842 - - - Securities - other 37 47 84 43 (16) 27 3 42 45
Charge to income statement 1,056 682 1,738 1,695 1,411 3,106 782 1,171 1,953 Charge relating to customer loans as a % of gross customer loans (1) 0.8% 2.8% 1.1% 0.8% 6.0% 1.8% 0.7% 3.9% 1.4%
Nine months ended
30 September 2011 30 September 2010 Core Non-Core Total Core Non-Core Total £m £m £m £m £m £m
Latent loss (165) (190) (355) 63 (68) (5)Collectively assessed 1,597 403 2,000 1,699 642 2,341 Individually assessed 1,047 2,895 3,942 1,063 3,590 4,653
Customer loans 2,479 3,108 5,587 2,825 4,164 6,989 Securities - sovereign debt impairment and related interest rate hedge adjustments 1,044 - 1,044 - - - Securities - other 100 60 160 25 101 126
Charge to income statement 3,623 3,168 6,791 2,850 4,265 7,115 Charge relating to customer loans as a % of gross customer loans (1) 0.8% 4.6% 1.5% 0.9% 4.7% 1.7% Note: (1) Customer loan impairment charge as a percentage of gross loans and advances to customers including assets of
disposal groups and excluding reverse repos.

117 RBS Group – Q3 Interim Results
Risk and balance sheet management (continued) Risk management: Credit risk: Impairment charge (continued) Key points • The £60 million latent loss release in Q3 2011 reflects improving trends in US Retail &
Commercial performing book metrics (Core and Non-Core).
• Collectively assessed impairments increased primarily within US Retail & Commercial’s homeequity and corporate portfolios as well as in Ulster Bank, the latter driven by deterioratingmortgage credit metrics.
• The £1.0 billion decrease in individually assessed impairments in Q3 2011 principally reflectshigher impairments booked in Q2 2011 relating to Ulster Bank’s development land portfolio inNon-Core.
• Sovereign debt impairments in Q3 2011 reflect further declines in the market value of AFSGreek sovereign bonds.
Debt securities The table below analyses debt securities by issuer and measurement classification. The categorisation of debt securities has been revised to include asset-backed securities (ABS) by class of issuer. The main changes are to US Central and local government which now includes US federal agencies and Financial institutions which now includes US government sponsored agencies and securitisation entities. 2010 data are presented on the revised basis.
Central and local government
UK US Other Banks
Other financial
institutions Corporate Total Of which
ABS £m £m £m £m £m £m £m £m
30 September 2011 Held-for-trading (HFT) 8,434 20,120 47,621 4,216 27,511 4,666 112,568 24,123 Designated as at fair value 1 - 140 4 7 10 162 1 Available-for-sale 13,328 20,032 28,976 17,268 28,463 2,334 110,401 41,091 Loans and receivables 10 - - 274 5,764 478 6,526 5,447
21,773 40,152 76,737 21,762 61,745 7,488 229,657 70,662
Of which US agencies - 5,311 - - 27,931 - 33,242 30,272 Short positions (HFT) (2,896) (12,763) (21,484) (2,043) (4,437) (1,680) (45,303) (895) Available-for-sale Gross unrealised gains 1,090 1,240 1,331 310 1,117 81 5,169 1,242 Gross unrealised losses - - (989) (1,039) (2,371) (24) (4,423) (3,114)

118 RBS Group – Q3 Interim Results
Risk and balance sheet management (continued) Risk management: Credit risk: Debt securities (continued)
Central and local government
UK US Other Banks
Other financial
institutions Corporate Total Of which
ABS 31 December 2010 £m £m £m £m £m £m £m £m
Held-for-trading 5,097 15,648 42,828 5,486 23,711 6,099 98,869 21,988 Designated as at fair value 1 117 262 4 8 10 402 119 Available-for-sale 8,377 22,244 32,865 16,982 29,148 1,514 111,130 42,515 Loans and receivables 11 - - 1 6,686 381 7,079 6,203
13,486 38,009 75,955 22,473 59,553 8,004 217,480 70,825
Of which US agencies - 6,811 - - 21,686 - 28,497 25,375 Short positions (HFT) (4,200) (10,943) (18,913) (1,844) (3,356) (1,761) (41,017) (1,335) Available-for-sale Gross unrealised gains 349 525 700 143 827 51 2,595 1,057 Gross unrealised losses (10) (2) (618) (786) (2,626) (55) (4,097) (3,396)
Key points • Held-for-trading bonds increased by £13.7 billion of which £12.6 billion relates to government
bonds (principally G10).
• Whilst the Group’s AFS portfolio decreased by £0.7 billion, UK government bonds increased by£5.0 billion, principally in the Group’s liquidity portfolio.
The table below analyses debt securities by issuer and external ratings; ratings are based on the lowest of S&P, Moody’s and Fitch.
Central and local government
UK US Other Banks
Other financial
institutions Corporate Total Of which
ABS 30 September 2011 £m £m £m £m £m £m £m
% of total £m
AAA 21,773 27 43,712 9,363 14,120 553 89,548 39 18,771 AA to AA+ - 40,094 4,247 4,279 31,785 661 81,066 35 35,954 A to AA- - 9 25,043 5,087 4,783 1,894 36,816 16 5,670 BBB- to A- - - 2,460 2,032 3,873 2,104 10,469 5 4,431 Non-investment grade - - 1,242 709 5,242 1,778 8,971 4 4,619 Unrated - 22 33 292 1,942 498 2,787 1 1,217
21,773 40,152 76,737 21,762 61,745 7,488 229,657 100 70,662 31 December 2010
AAA 13,486 38,009 44,123 10,704 39,388 878 146,588 67 51,235 AA to AA+ - - 18,025 3,511 6,023 616 28,175 13 6,335 A to AA- - - 9,138 4,926 2,656 1,155 17,875 8 3,244 BBB- to A- - - 2,845 1,324 3,412 2,005 9,586 5 3,385 Non-investment grade - - 1,770 1,528 5,522 2,425 11,245 5 4,923 Unrated - - 54 480 2,552 925 4,011 2 1,703
13,486 38,009 75,955 22,473 59,553 8,004 217,480 100 70,825

119 RBS Group – Q3 Interim Results
Risk and balance sheet management (continued) Risk management: Credit risk: Debt securities (continued) Key points • The decrease in AAA rated debt securities relates to the downgrading of US government and
agencies to AA+ by S&P in August 2011.
• The proportion of debt securities rated A to AA- increased to 16%, principally reflecting theJapanese government downgrade in January 2011.
• Non-investment grade and unrated debt securities now account for 5% of the debt securitiesportfolio down from 7% at the start of the year.
Asset-backed securities
RMBS (1)
Government sponsored
or similar (2) Prime Non-
conforming Sub-
prime
MBS covered
bond CMBS (3) CDOs (4) CLOs (5)Other
ABS (6) Total 30 September 2011 £m £m £m £m £m £m £m £m £m £m
AAA 4,391 4,152 1,509 144 3,462 893 194 2,198 1,828 18,771 AA to AA+ 31,037 117 111 97 1,162 839 125 1,496 970 35,954 A to AA- 137 603 124 175 1,680 1,326 166 569 890 5,670 BBB- to A- - 147 295 59 1,553 383 92 601 1,301 4,431 Non-investment grade - 768 676 486 - 327 1,516 170 676 4,619 Unrated - 146 47 213 - 67 134 331 279 1,217
35,565 5,933 2,762 1,174 7,857 3,835 2,227 5,365 5,944 70,662 Of which in Non-Core - 269 463 276 - 1,158 1,953 4,698 1,976 10,793 31 December 2010
AAA 28,835 4,355 1,754 317 7,107 2,789 444 2,490 3,144 51,235 AA to AA+ 1,529 147 144 116 357 392 567 1,786 1,297 6,335 A to AA- - 67 60 212 408 973 296 343 885 3,244 BBB- to A- - 82 316 39 - 500 203 527 1,718 3,385 Non-investment grade - 900 809 458 - 296 1,863 332 265 4,923 Unrated - 196 52 76 - - 85 596 698 1,703
30,364 5,747 3,135 1,218 7,872 4,950 3,458 6,074 8,007 70,825
Notes: (1) Residential mortgage-backed securities. (2) Includes US agency and Dutch government guaranteed securities. (3) Commercial mortgage-backed securities. (4) Collateralised debt obligations. (5) Collateralised loan obligations. (6) Other ABS includes £1.4 billion (31 December 2010 - £1.9 billion) of covered bonds. For analyses of ABS by geography and measurement classification, refer to Appendix 3.

120 RBS Group – Q3 Interim Results
Risk and balance sheet management (continued)
Risk management: Credit risk: Available-for-sale debt securities and reserves The table below analyses available-for-sale (AFS) debt securities by issuer and related AFS reserves, gross and net of tax, for countries exceeding £0.5 billion, together with the total in aggregate of those individually less than £0.5 billion.
30 September 2011 31 December 2010
Central and local
government Banks
Other financial
institutions Corporate Total Of which
ABS
AFS reserves
(gross)
Central and local
government Banks
Other financial
institutions Corporate Total Of which
ABS
AFS reserves
(gross) £m £m £m £m £m £m £m £m £m £m £m £m £m £m US 20,032 394 16,710 169 37,305 19,907 523 22,244 704 15,973 65 38,986 20,872 (304) UK 13,328 4,053 996 891 19,268 3,830 589 8,377 4,297 1,662 438 14,774 4,002 158 Germany 11,084 1,518 109 99 12,810 1,083 416 10,648 1,291 386 219 12,544 1,360 (39) Netherlands 2,749 1,357 6,163 201 10,470 6,892 (8) 3,469 984 6,238 264 10,955 6,773 (164) Spain 81 5,131 1,632 8 6,852 6,724 (1,408) 88 5,264 1,657 9 7,018 6,773 (1,277) France 4,605 988 561 247 6,401 639 52 5,912 774 630 71 7,387 575 19 Japan 3,575 - - 6 3,581 - 1 4,354 - 80 2 4,436 - - Australia - 1,834 262 289 2,385 495 (17) - 1,659 320 93 2,072 486 (33) MDBs (1) - - 1,112 - 1,112 - 37 - - 912 - 912 - 30 Italy 852 168 55 6 1,081 221 (215) 906 198 54 15 1,173 243 (115) Singapore 732 180 20 - 932 - - 649 189 20 - 858 - - Belgium 771 39 - 3 813 34 (91) 763 39 - 1 803 34 (53) India 627 176 - - 803 - (6) 548 139 - - 687 - 2 Hong Kong 641 - - - 641 - - 905 8 - - 913 - - Denmark 433 183 - - 616 - - 629 172 - - 801 - 2 Austria 296 61 105 140 602 156 (40) 274 67 4 131 476 51 (26) Sweden 39 379 141 26 585 250 1 30 288 131 15 464 269 1 Switzerland 323 228 - 7 558 - 1 657 148 - 8 813 - 11 Greece 532 - - - 532 - - 895 - - - 895 - (694) Republic of Ireland 115 176 1 91 383 151 (83) 104 435 62 88 689 177 (99) South Korea 138 - 86 - 224 86 - 261 - 429 - 690 429 (1) < £0.5bn 1,383 403 510 151 2,447 623 (142) 1,773 326 590 95 2,784 471 (123)
62,336 17,268 28,463 2,334 110,401 41,091 (390) 63,486 16,982 29,148 1,514 111,130 42,515 (2,705)
Tax on AFS reserves 11 644
AFS reserves net of tax (379) (2,061) (1) Represents multilateral development banks and other supranational organisations.

121 RBS Group – Q3 2011 Results
Risk and balance sheet management (continued) Risk management: Credit risk: Derivatives The Group's derivative assets by internal grading scale and residual maturity are analysed below. Master netting arrangements in respect of mark-to-market (mtm) positions and collateral shown below do not result in a net presentation in the Group’s balance sheet under IFRS. 30 September 2011
0-3 months
3-6 months
6-12 months
1-5 years
Over 5 years Total
30 June 2011 Total
31 December 2010 Total Asset
quality Probability of default range £m £m £m £m £m £m £m £m
AQ1 0% - 0.034% 41,121 13,820 19,858 137,585 304,713 517,097 357,031 408,489AQ2 0.034% - 0.048% 591 116 347 2,016 4,195 7,265 5,600 2,659AQ3 0.048% - 0.095% 2,618 525 939 3,609 6,832 14,523 10,908 3,317AQ4 0.095% - 0.381% 1,135 399 828 3,373 4,670 10,405 6,624 3,391AQ5 0.381% - 1.076% 4,469 173 341 2,707 6,019 13,709 6,933 4,860AQ6 1.076% - 2.153% 282 65 78 929 1,117 2,471 3,595 1,070AQ7 2.153% - 6.089% 327 134 93 670 2,144 3,368 2,072 857AQ8 6.089% - 17.222% 3 11 30 160 970 1,174 654 403AQ9 17.222% - 100% 10 12 19 402 697 1,140 486 450AQ10 100% 26 11 48 713 394 1,192 969 1,581
50,582 15,266 22,581 152,164 331,751 572,344 394,872 427,077Counterparty mtm netting (473,256) (323,455) (330,397)Cash collateral held against derivative exposures (38,202) (27,500) (31,096)
Net exposure 60,886 43,917 65,584 At 30 September 2011, the Group also held collateral in the form of securities of £5.5 billion (30 June 2011 - £4.2 billion; 31 December 2010 - £2.9 billion) against derivative positions.
The table below analyses the fair value of the Group’s derivatives by type of contract.
30 September 2011 30 June 2011 31 December 2010 Assets Liabilities Assets Liabilities Assets Liabilities Contract type £m £m £m £m £m £m
Interest rate contracts 424,130 407,814 283,966 269,638 311,731 299,209 Exchange rate contracts 107,024 112,184 72,682 78,095 83,253 89,375 Credit derivatives 33,884 31,574 32,507 30,877 26,872 25,344 Equity and commodity contracts 7,306 10,218 5,717 9,199 5,221 10,039
572,344 561,790 394,872 387,809 427,077 423,967
Key points 30 September 2011 compared with 30 June 2011 • Net exposure, after taking account of position and collateral netting arrangements, increased
significantly (up 39%) due to higher derivative fair values (see below) primarily reflecting economic uncertainty and the eurozone crisis.
• Continued reductions in interest rates and the depreciation of sterling against the US dollar resulted in an increase in fair values of interest rate contracts. This was partially offset by theeffect of the appreciation of sterling against the euro. All major five and ten year interest rate indices (sterling, euro, and the US dollar), moved down, decreasing by approximately 74 to 84 and 90 to 116 basis points respectively.

122 RBS Group – Q3 2011 Results
Risk and balance sheet management (continued) Risk management: Credit risk: Derivatives (continued) Key points (continued) 30 September 2011 compared with 30 June 2011 (continued) • Exchange rate contracts increased due to increased volume, trading fluctuations and the
depreciation of sterling against the US dollar, as the majority of exchange rate contracts are US dollar denominated.
• Credit derivative fair values increased due to widening credit spreads. 30 September 2011 compared with 31 December 2010 • Net exposure, after taking account of position and collateral netting arrangements, reduced by
7%, despite an increase in derivative carrying values primarily due to increased use of netting arrangements.
• Interest rate contracts increased due to continued reductions in interest rate yields. This waspartially offset by the effect of marginal appreciation of sterling against the US dollar and theeuro.
• Exchange rate contracts increased due to trading fluctuations and movements in forward ratesand volume.
• Credit derivative fair values increased due to widening credit spreads.

123 RBS Group – Q3 2011 Results
Risk and balance sheet management (continued) Risk management: Credit risk: Derivatives (continued) The Group’s exposures to monolines and CDPCs by credit rating are summarised below, ratings are based on the lower of S&P and Moody’s. All of these exposures are held within Non-Core. Exposures to monoline insurers
Notional: protected
assets
Fair value: reference
protected assets
Gross exposure
Credit valuation
adjustment (CVA) Hedges
Net exposure
£m £m £m £m £m £m
30 September 2011 A to AA- 5,411 4,735 676 259 - 417 Non-investment grade 7,098 3,684 3,414 2,568 70 776
12,509 8,419 4,090 2,827 70 1,193
Of which: CMBS 3,954 1,879 2,075 1,599 CDOs 988 156 832 619 CLOs 4,806 4,348 458 183 Other ABS 2,275 1,758 517 309 Other 486 278 208 117
12,509 8,419 4,090 2,827
30 June 2011 A to AA- 5,547 4,936 611 166 - 445 Non-investment grade 7,079 4,047 3,032 2,155 68 809
12,626 8,983 3,643 2,321 68 1,254
Of which: CMBS 3,853 2,131 1,722 1,285 CDOs 1,086 230 856 596 CLOs 4,946 4,561 385 107 Other ABS 2,241 1,739 502 250 Other 500 322 178 83
12,626 8,983 3,643 2,321
31 December 2010 A to AA- 6,336 5,503 833 272 - 561 Non-investment grade 8,555 5,365 3,190 2,171 71 948
14,891 10,868 4,023 2,443 71 1,509
Of which: CMBS 4,149 2,424 1,725 1,253 CDOs 1,133 256 877 593 CLOs 6,724 6,121 603 210 Other ABS 2,393 1,779 614 294 Other 492 288 204 93
14,891 10,868 4,023 2,443

124 RBS Group – Q3 2011 Results
Risk and balance sheet management (continued) Risk management: Credit risk: Derivatives (continued) Exposure to monoline insurers (continued) Key points 30 September 2011 compared with 30 June 2011 • The gross exposure, principally to monolines, increased reflecting the effect of credit spread on
the underlying reference instruments and strengthening of the US dollar against sterling.
• The increased CVA reflected the increase in exposure and the widened credit spreads ofmonoline insurers.
30 September 2011 compared with 31 December 2010 • The increase in monoline CVA on a year-to-date basis was primarily attributable to wider
monoline credit spreads. Exposure to CPDCs
Notional: protected
assets
Fair value: reference protected
assets Gross
exposure
Credit valuation
adjustment Net
exposure £m £m £m £m £m
30 September 2011 AAA 211 209 2 - 2 A to AA- 640 614 26 15 11 Non-investment grade 19,294 17,507 1,787 902 885 Unrated 3,985 3,552 433 316 117
24,130 21,882 2,248 1,233 1,015
30 June 2011 AAA 205 205 - - - A to AA- 622 607 15 4 11 Non-investment grade 19,724 18,759 965 427 538 Unrated 3,927 3,712 215 101 114
24,478 23,283 1,195 532 663
31 December 2010 AAA 213 212 1 - 1 A to AA- 644 629 15 4 11 Non-investment grade 20,066 19,050 1,016 401 615 Unrated 4,165 3,953 212 85 127
25,088 23,844 1,244 490 754

125 RBS Group – Q3 2011 Results
Risk and balance sheet management (continued) Risk management: Credit risk: Derivatives (continued) Exposure to CPDCs (continued) Key points 30 September 2011 compared with 30 June 2011 • The increase in gross exposure to CDPCs was mainly driven by wider credit spreads of the
underlying reference loans and bonds coupled with the increase in the relative value of seniortranches.
• CVA as a percentage of gross exposures increased from 45% to 55% principally reflectinghigher CVA on certain CDPCs due to increased risks in the portfolio.
30 September 2011 compared with 31 December 2010 • The year-to-date increase in the gross exposure to CDPCs mainly in Q3 2011, resulted from
wider credit spreads of the underlying reference loans and bonds coupled with the increase inthe relative value of senior tranches.
• CVA as a percentage of gross exposures increased from 39% to 55%, as noted above.
126 RBS Group – Q3 2011 Results
Risk and balance sheet management (continued) Risk management: Credit risk: Country risk Background All country exposures are covered by the Group's country risk framework. This framework includes active management of portfolios either when these have been identified as exhibiting signs of stress, using the Group's country risk watch list process, or when it is otherwise considered appropriate. Granular portfolio reviews are undertaken to align country risk profiles to the Group’s country risk appetite in light of evolving economic and political developments. Accordingly, limit controls are tailored to the level of risk associated with each country. Ongoing concern surrounding the most vulnerable eurozone economies has intensified the Group’s vigilance and controls. This involves frequent, comprehensive and detailed reviews of exposures to each of these countries, including increased prudence in counterparty monitoring which has led to several divestments and exposure reductions. In addition to Greece, Portugal and Ireland, the Group has recently brought Italy and Spain under tighter controls, and country limits are being set in response to these countries’ uncertain outlook. Country events in North Africa and the Middle East, a tsunami plus nuclear disaster in Japan, and developments in the eurozone have placed crisis management on the daily agenda for country risk this year. Following on from sovereign related stress tests and a series of broad thematic reviews, a Group wide response plan has been prepared to position the Group against potential increased stress in the eurozone. The plan covers themes such as sovereign debt restructuring, various eurozone breakup scenarios and a re-examination of prospective financial sector support given ongoing public finance and political pressures. The following tables show the Group’s exposure to countries at 30 September 2011, where the on-balance sheet exposure to counterparties incorporated in the country exceeded £1 billion and where the country had an external rating of A+ or below from S&P, Moody’s or Fitch, as well as selected other eurozone countries. The numbers are stated before taking into account the impact of mitigating action, such as collateral, insurance or guarantees that may have been taken to reduce or eliminate exposure to country risk events. Shipping related exposures are not included due to their multinational nature. The following apply to the tables on pages 128 to 140: Lending comprises loans and advances, gross of impairment provisions, to: central banks, including cash balances; other banks and financial institutions, incorporating overdraft and other short-term facilities; corporations, in large part loans and leases; and individuals, comprising mortgages, personal loans and credit card balances. Risk elements in lending (REIL) are included within lending and comprise impaired loans and loans where an impairment event has taken place.

127 RBS Group – Q3 2011 Results
Risk and balance sheet management (continued) Risk management: Credit risk: Country risk (continued) Background (continued) Debt securities comprise securities classified as available-for-sale (AFS), loans and receivables (LAR), held-for-trading (HFT) and designated as at fair value through profit or loss (DFV). All debt securities other than LAR securities are carried at fair value; LAR debt securities are carried at amortised cost less impairment. HFT debt securities are presented net of short positions per country. Impairment losses and exchange differences relating to AFS debt securities, together with interest are recognised in the income statement; other changes in the fair value of AFS securities are reported within AFS reserves. Derivatives comprise the marked-to-market (mtm) value of such contracts after the effect of enforceable netting agreements, but gross of collateral. Repos comprise the marked-to-market value of counterparty exposure arising from repo transactions net of collateral. Off balance sheet amounts comprise the sum of contingent liabilities, including guarantees, and committed undrawn facilities. Credit default swaps (CDS): Under a CDS contract the buyer is protected in the event of the default of the reference entity by the seller. Fair value or mtm value of CDS represents the carrying value on the balance sheet. The mtm value of CDSs is included within derivatives against the counterparty of the credit derivative, as opposed to the reference entity.

128 RBS Group – Q3 2011 Results
Risk and balance sheet management (continued) Risk management: Credit risk: Country risk (continued) Summary Lending
Of which
Central and local
government Central banks
Other banks
Other financial
institutions Corporate Personal Total
lending Core Non-Core Debt
securities
Derivatives (gross of collateral)
and repos
Contingent liabilities and commitments
30 September 2011 £m £m £m £m £m £m £m £m £m £m £m £m
Eurozone: Ireland 54 2,235 49 542 19,574 19,606 42,060 31,549 10,511 900 2,354 3,340 Spain 10 3 554 90 6,599 380 7,636 3,505 4,131 6,497 2,521 1,990 Italy - 76 420 472 2,057 25 3,050 1,437 1,613 1,180 2,331 3,168 Greece 7 10 1 32 381 14 445 325 120 707 335 71 Portugal 43 - 57 - 579 5 684 333 351 139 443 356 Other - Germany - 15,483 1,473 334 7,099 166 24,555 18,832 5,723 17,434 15,769 7,752 - Netherlands 2,257 7,393 642 1,896 5,540 21 17,749 15,003 2,746 11,729 11,290 14,536 - France 503 56 1,998 695 4,354 79 7,685 5,218 2,467 11,125 9,777 11,303 - Luxembourg - 27 92 1,087 2,448 3 3,657 2,060 1,597 162 3,663 2,172 - Belgium 226 13 384 399 800 20 1,842 1,273 569 920 2,818 1,435 Rest of eurozone 120 - 61 115 1,511 26 1,833 1,494 339 1,152 1,919 1,362 Other selected countries
India - 164 1,382 94 3,295 150 5,085 4,670 415 1,867 194 1,492 China 23 170 2,226 6 746 55 3,226 3,033 193 444 762 1,365 South Korea - 39 1,024 3 636 1 1,703 1,693 10 1,106 589 365 Turkey 231 27 294 55 1,187 15 1,809 1,330 479 386 83 498 Russia - 20 986 44 852 69 1,971 1,851 120 107 93 620 Brazil - - 1,035 - 273 4 1,312 1,201 111 659 25 172 Romania 30 174 22 15 473 410 1,124 13 1,111 302 10 161 Mexico - - 207 - 993 1 1,201 819 382 27 127 359 Indonesia 77 31 288 23 311 110 840 720 120 139 365 133 Poland 37 - - 10 635 5 687 639 48 294 60 709 For definitions refer to pages 126 and 127.
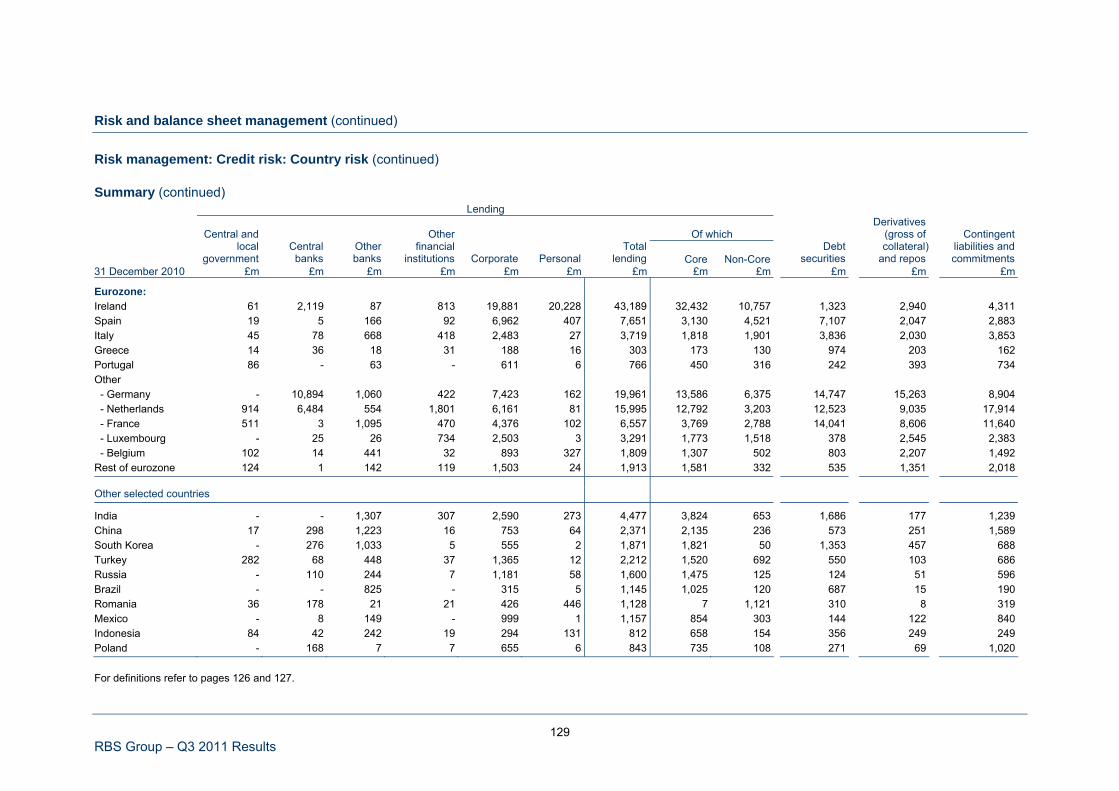
129 RBS Group – Q3 2011 Results
Risk and balance sheet management (continued) Risk management: Credit risk: Country risk (continued) Summary (continued) Lending
Of which
Central and local
government Central banks
Other banks
Other financial
institutions Corporate Personal Total
lending Core Non-Core Debt
securities
Derivatives (gross of collateral)
and repos
Contingent liabilities and commitments
31 December 2010 £m £m £m £m £m £m £m £m £m £m £m £m
Eurozone: Ireland 61 2,119 87 813 19,881 20,228 43,189 32,432 10,757 1,323 2,940 4,311 Spain 19 5 166 92 6,962 407 7,651 3,130 4,521 7,107 2,047 2,883 Italy 45 78 668 418 2,483 27 3,719 1,818 1,901 3,836 2,030 3,853 Greece 14 36 18 31 188 16 303 173 130 974 203 162 Portugal 86 - 63 - 611 6 766 450 316 242 393 734 Other - Germany - 10,894 1,060 422 7,423 162 19,961 13,586 6,375 14,747 15,263 8,904 - Netherlands 914 6,484 554 1,801 6,161 81 15,995 12,792 3,203 12,523 9,035 17,914 - France 511 3 1,095 470 4,376 102 6,557 3,769 2,788 14,041 8,606 11,640 - Luxembourg - 25 26 734 2,503 3 3,291 1,773 1,518 378 2,545 2,383 - Belgium 102 14 441 32 893 327 1,809 1,307 502 803 2,207 1,492 Rest of eurozone 124 1 142 119 1,503 24 1,913 1,581 332 535 1,351 2,018 Other selected countries
India - - 1,307 307 2,590 273 4,477 3,824 653 1,686 177 1,239 China 17 298 1,223 16 753 64 2,371 2,135 236 573 251 1,589 South Korea - 276 1,033 5 555 2 1,871 1,821 50 1,353 457 688 Turkey 282 68 448 37 1,365 12 2,212 1,520 692 550 103 686 Russia - 110 244 7 1,181 58 1,600 1,475 125 124 51 596 Brazil - - 825 - 315 5 1,145 1,025 120 687 15 190 Romania 36 178 21 21 426 446 1,128 7 1,121 310 8 319 Mexico - 8 149 - 999 1 1,157 854 303 144 122 840 Indonesia 84 42 242 19 294 131 812 658 154 356 249 249 Poland - 168 7 7 655 6 843 735 108 271 69 1,020
For definitions refer to pages 126 and 127.

130 RBS Group – Q3 2011 Results
Risk and balance sheet management (continued) Risk management: Credit risk: Country risk (continued) External risk environment So far 2011 has seen heightened country risks, which have intensified in the past quarter. However, trends have been divergent. Conditions have deteriorated among vulnerable eurozone countries facing growth impediments and higher public debt burdens, with market risks rising sharply in the past quarter. Many emerging markets have continued to enjoy relative stability, seeing net inflows of capital and lower spreads despite the impact of higher risk aversion in Q3 2011. In the US, notwithstanding a sovereign downgrade from a rating agency, a deal was secured to increase the sovereign debt ceiling, and yields on government debt remain low. Europe has been at the centre of rising global risks, owing to a combination of slower growth among some of its major economies and a further deepening of the ongoing sovereign crisis which has in turn, increasingly harmed financial sector health. Risks in Greece have risen as a deeper than expected contraction in GDP has adversely affected the fiscal adjustment programme and hit debt sustainability. Some private sector creditors have proposed a burden sharing agreement to reduce debt repayments somewhat, but market prices of sovereign debt have implied investor expectations of a broader debt restructuring and concerns over contagion have risen sharply. Despite the announcement of significant new support proposals by eurozone leaders in July, investor worries over risks to their implementation rose and market conditions worsened markedly through Q3 2011 as a result. Risk aversion towards Spanish and Italian assets picked up and despite a policy response by both countries, yields remained elevated, prompting the European Central Bank (ECB) to intervene to support their bonds in secondary markets for the first time. Contagion affected bank stocks and asset prices. At the International Monetary Fund (IMF) annual meetings in September, eurozone leaders agreed to enhance anti-crisis measures. Some steps, including boosting the resources of the European Financial Stability Facility and a proposed 50% voluntary haircut by private sector investors holding Greek debt, were taken at two key summits in October, but implementation risks remain high. Within a week of the summit, Greece proposed a referendum on its commitments under the deal, resulting in renewed concerns over the possibility of a more comprehensive restructuring. Meanwhile, Portugal’s new government has continued to remain on track with implementation of the European Union - International Monetary Fund (EU-IMF) deal agreed in May after a sharp deterioration in sovereign liquidity. Ireland’s performance under its EU-IMF programme has been good and the announcement of a bank restructuring deal without defaults on senior debt obligations has helped improve market confidence. This was reflected in a compression in bond spreads in Q3 2011. Emerging markets have meanwhile continued to perform relatively well. In Asia, despite growth slowing, China and India have continued to post strong overall expansion, while generally large external savings levels have reinforced balance of payments stability. In China specifically, measures to curb house price growth have proven effective, though concerns over bank asset quality linked to rapid lending growth in 2009 have risen. In Emerging Europe, Russia has seen some contagion into asset markets from weaker commodity prospects and a challenging investment climate, but the sovereign balance sheet remains quite robust. Foreign exchange exposures remain a risk factor in a number of Eastern European economies. Elsewhere, Turkey’s economy cooled in Q3 2011, helping to narrow the current account deficit sharply, though external vulnerabilities remain.
131 RBS Group – Q3 2011 Results
Risk and balance sheet management (continued) Risk management: Credit risk: Country risk (continued) External risk environment (continued) The Middle East and North Africa has been characterised by political instability in a number of the relatively lower income countries. Excluding Bahrain, pressures for change have been more contained in the Gulf Cooperation Council countries. Latin America continues to be characterised by relative stability owing to balance sheet repair by a number of countries following crises in previous decades. Capital inflows have contributed to currency appreciation, but overheating pressures have so far proven contained, including in Brazil where credit growth has slowed from high levels. Overall, the outlook for the rest of the year remains challenging, with risks likely to remain elevated but divergent. Much will depend on the success of EU efforts to contain contagion from the sovereign crisis and whether growth headwinds in larger advanced economies persist. Emerging market balance sheet risks remain lower, despite ongoing structural and political constraints, but these economies will continue to be affected by events elsewhere through financial markets and trade channels.
Key points • Currency movements had a significant impact on exposures in the third quarter as sterling fell by
2.8% against the US dollar and rose by 5.0% against the euro. However, they had less impact onexposures year-to-date as sterling rose by only 0.6% against the US dollar and 0.2% against the euro over the first three quarters of 2011.
• Total exposure to over half of the countries shown in the table decreased over the nine monthssince 31 December 2010, driven partly by clients’ debt reduction efforts and partly by a restrictive stance on the part of the Group. Reductions were seen particularly in off-balance sheet exposuresand in lending. Exposures generally increased in (collateralised) derivatives and repos.
• India – Continued strong economic growth led total exposure to grow by £1.1 billion so far this year, largely due to increases in lending to corporate clients (£0.7 billion) and in debt securities (£0.2 billion).
• China – Lending to Chinese banks increased by £1.0 billion to £2.4 billion in 2011. This reflects increased activity with the top tier banks, partially driven by on-shore regulatory needs, and an increase in trade finance activity. These credit facilities support trade within the Asia-Pacific region as well as a number of key UK clients with trade finance requirements in China.
• South Korea – Total exposure deceased by £0.6 billion, largely due to reductions in debt securities reflecting a hedge against a derivatives position which decreased over the course of the year and a reduction in off-balance exposures reflecting the expiration of a large medium-term guarantee and the Group’s cautious stance given the current global economic downturn.
• Eurozone – Portfolio composition and trends in a number of vulnerable eurozone countries are discussed in more detail below. Here, most peripheral eurozone exposure decreased, withderivatives and repos being the only component that still saw some gross increases in the thirdquarter. The CDS positions referencing sovereign debt are generally collateralised and are with large international banks or large international asset management companies outside the countryof the referenced sovereign.
• In the rest of the eurozone, exposure in the first nine months of 2011 increased mainly in lending to central banks (in Germany and the Netherlands, largely deposits of excess liquidity), togovernments (the Netherlands) and to banks, particularly in the first half of the year (France andthe Netherlands), as well as in derivatives and repos (the Netherlands, France and Luxembourg).

132 RBS Group – Q3 2011 Results
Risk and balance sheet management (continued) Risk management: Credit risk: Country risk: Ireland
HFT debt securities
Lending REIL Impairment provisions
AFS and LAR debt
securities AFS
reserves
Long Short Total debt securities
Derivatives (gross of collateral)
and repos
Contingent liabilities and commitments
Issuer £m £m £m £m £m £m £m £m £m £m
30 September 2011 Central and local government 54 - - 115 (40) 30 30 115 20 1 Central banks 2,235 - - - - - - - 1 - Other banks 49 - - 176 (44) 67 - 243 901 52 Other financial institutions 542 - - 57 - 250 52 255 1,024 691 Corporate 19,574 10,195 5,667 148 1 139 - 287 407 2,061 Personal 19,606 2,210 954 - - - - - 1 535
42,060 12,405 6,621 496 (83) 486 82 900 2,354 3,340 31 December 2010
Central and local government 61 - - 104 (45) 93 88 109 20 1 Central banks 2,119 - - - - 7 - 7 126 - Other banks 87 - - 435 (51) 96 45 486 1,523 83 Other financial institutions 813 - - 291 (1) 205 - 496 837 1,050 Corporate 19,881 8,291 4,072 91 (2) 140 6 225 434 2,633 Personal 20,228 1,638 534 - - - - - - 544
43,189 9,929 4,606 921 (99) 541 139 1,323 2,940 4,311
Fair values of CDS referencing sovereign exposures were:
30 September
2011 31 December
2010 Fair value £m £m
Bought protection 511 360 Sold protection 523 387
For definitions refer to pages 126 and 127.

133 RBS Group – Q3 2011 Results
Risk and balance sheet management (continued) Risk management: Credit risk: Country risk: Ireland (continued) Key points ● The Group has significant exposure to Ireland, largely through Ulster Bank. The portfolio is
predominantly personal lending of £19.6 billion (largely mortgages) and corporate lending of £19.6 billion. In addition, the Group has lending and derivatives exposure to the Central Bank of Ireland, financial institutions and large international clients with funding units based in Ireland.
● Total Group exposure (including off-balance sheet) declined by £3.1 billion to less than £50 billionfrom December 2010 to September 2011. Ulster Bank currently represents 87% of the Group’s total Irish exposure.
Central and local government and central bank ● Exposure to the government is modest at £0.2 billion. ● Exposure to the central bank fluctuates, driven by reserve requirements and by placings of excess
liquidity as part of the Group’s assets and liabilities management. At 30 September 2011, exposure was £2.2 billion.
Financial institutions ● Interbank lending, which is provided to the largest, systemically important Irish banks, is
approximately £50 million. ● Derivatives and repos exposure in GBM to banks and other financial institutions increased by
£0.8 billion over the year to date. Transactions are typically collateralised. Corporations ● Corporate lending exposure decreased by approximately £0.3 billion in the nine months ended
30 September 2011. Exposure in this area is highest in the property sector £12.5 billion, which also experienced the biggest reduction, £160 million, in the same period. Risk elements in lending of £10.2 billion and impairment provisions of £5.7 billion, up since December 2010 by £1.9 billionand £1.6 billion respectively, are further discussed in the Ulster Bank section.
Personal ● The Ulster Bank retail portfolio mainly consists of mortgages (approximately 92%), with the
remainder comprising other personal lending and credit card exposure (see also page 142). Non-Core ● Of the total Irish exposure, £11.5 billion is designated Non-Core, £10.0 billion of which is related to
commercial real estate.

134 RBS Group – Q3 2011 Results
Risk and balance sheet management (continued) Risk management: Credit risk: Country risk: Spain
HFT debt securities
Lending REIL Impairment provisions
AFS and LAR debt
securities AFS
reserves
Long Short Total debt securities
Derivatives (gross of collateral)
and repos
Contingent liabilities and commitments
Issuer £m £m £m £m £m £m £m £m £m £m
30 September 2011 Central and local government 10 - - 81 (9) 864 1,271 (326) 40 30 Central banks 3 - - - - - - - - - Other banks 554 - - 5,131 (820) 137 178 5,090 1,904 40 Other financial institutions 90 - - 1,694 (579) 71 55 1,710 32 228 Corporate 6,599 1,438 690 8 - 18 3 23 545 1,635 Personal 380 1 - - - - - - - 57
7,636 1,439 690 6,914 (1,408) 1,090 1,507 6,497 2,521 1,990 31 December 2010
Central and local government 19 - - 88 (7) 1,172 1,248 12 53 1 Central banks 5 - - - - - - - - - Other banks 166 - - 5,264 (834) 147 118 5,293 1,482 41 Other financial institutions 92 - - 1,724 (474) 34 7 1,751 22 285 Corporate 6,962 1,871 572 9 38 50 8 51 490 2,494 Personal 407 1 - - - - - - - 62
7,651 1,872 572 7,085 (1,277) 1,403 1,381 7,107 2,047 2,883
Fair values of CDS referencing sovereign exposures were:
30 September
2011 31 December
2010 Fair value £m £m
Bought protection 562 436 Sold protection 547 435
For definitions refer to pages 126 and 127.
135 RBS Group – Q3 2011 Results
Risk and balance sheet management (continued) Risk management: Credit risk: Country risk: Spain (continued) Key points ● The Group’s exposure to Spain consists primarily of lending to major investment grade
corporations and a large covered bond portfolio.
● Total (on and off-balance sheet) exposure decreased by £1.0 billion in the nine months ended 30 September 2011 to £18.6 billion, the majority of which consists of exposure to the property, natural resource and banking sectors.
Central and local government and central bank ● The Group’s exposure to the government is negative owing to a net short position in held-for-
trading debt securities. Financial institutions ● A sizeable covered bond portfolio of £6.8 billion is the Group’s largest exposure to Spanish banks
and other financial institutions. Stress analysis on the AFS debt securities indicates that thisexposure is unlikely to suffer material credit losses.
● A further £1.9 billion of the Group’s exposure to financial institutions consists of fully collateralised derivatives exposure to the top banks and a few of the largest regional banks. Lending to banks of almost £0.6 billion consists mainly of short-term money market lines with the top two international Spanish banks.
Corporations ● Total exposure to corporate clients declined by £1.2 billion in the nine months ended
30 September 2011, driven by reductions in exposure to corporations in the property and telecom, media and technology sectors. REIL relates to commercial real estate lending and decreasedreflecting disposals and restructurings; however provision increased due to declining collateralvalues.
Non-Core ● Of the total Spanish exposure, £4.9 billion is in Non-Core, the majority of which is related to either
real estate or project finance. Current Spanish property market conditions present significantdisposal challenges. Despite this, Non-Core continues to seek divestment opportunities across the portfolio.

136 RBS Group – Q3 2011 Results
Risk and balance sheet management (continued) Risk management: Credit risk: Country risk: Italy
HFT debt securities
Lending REIL Impairment provisions
AFS and LAR debt
securities AFS
reserves Long Short Total debt securities
Derivatives (gross of collateral)
and repos
Contingent liabilities and commitments
Issuer £m £m £m £m £m £m £m £m £m £m
30 September 2011 Central and local government - - - 852 (191) 5,076 5,634 294 103 - Central banks 76 - - - - - - - - - Other banks 420 - - 168 (16) 88 5 251 1,143 26 Other financial institutions 472 - - 538 (8) 49 81 506 672 957 Corporate 2,057 451 139 68 - 61 - 129 413 2,172 Personal 25 - - - - - - - - 13
3,050 451 139 1,626 (215) 5,274 5,720 1,180 2,331 3,168 31 December 2010
Central and local government 45 - - 906 (99) 5,113 3,175 2,844 71 6 Central banks 78 - - - - - - - - - Other banks 668 - - 198 (11) 67 16 249 782 161 Other financial institutions 418 - - 646 (5) 49 - 695 759 1,217 Corporate 2,483 314 141 20 - 36 8 48 418 2,456 Personal 27 - - - - - - - - 13
3,719 314 141 1,770 (115) 5,265 3,199 3,836 2,030 3,853
Fair values of CDS referencing sovereign exposures were:
30 September
2011 31 December
2010 Fair value £m £m
Bought protection 1,815 641 Sold protection 1,691 551
For definitions refer to pages 126 and 127.
137 RBS Group – Q3 2011 Results
Risk and balance sheet management (continued) Risk management: Credit risk: Country risk: Italy (continued) Key points ● The Group is an active market maker in Italian government bonds, resulting in substantial long
positions in held-for-trading securities against approximately equal short positions.
● The Group maintains relationships with government entities, banks, other financial institutions and large corporate clients, in the case of the latter predominantly with subsidiaries of multinationals.Since the start of 2011 the Group has taken steps to reduce and mitigate its risks throughincreased collateral requirements, additional security and strategic exits where appropriate, in linewith its evolving appetite for Italian risk. Total exposure to entities incorporated in Italy declined by £3.7 billion in the nine months ended 30 September 2011, to £9.7 billion, much of which was lending to corporate clients, banks and other financial institutions.
Central and local government and central bank ● Total exposure to the government including net debt securities positions was significantly reduced
by £2.6 billion to £0.4 billion. Financial institutions ● The majority of the Group’s exposure to Italian financial institutions is concentrated on the two
largest, systemically important groups and consists of collateralised derivatives and, to a lesser extent, short-term interbank lending.
Corporations ● Since 31 December 2010, total exposure has declined by approximately £0.6 billion, driven in part
by reductions in lending to the property industry. However, the Group has maintained lending facilities to the manufacturing and natural resource sectors.
Non-Core ● Of the total Italian exposure, £1.8 billion is in Non-Core, the majority of which is related to real
estate or project finance. The key risk in the portfolio is the availability of refinancing options forcurrent clients.

138 RBS Group – Q3 2011 Results
Risk and balance sheet management (continued) Risk management: Credit risk: Country risk: Greece
HFT debt securities
Lending REIL Impairment provisions
AFS and LAR debt
securities AFS
reserves
Long Short Total debt securities
Derivatives (gross of collateral)
and repos
Contingent liabilities and commitments
Issuer £m £m £m £m £m £m £m £m £m £m
30 September 2011 Central and local government 7 - - 532 - 180 7 705 - - Central banks 10 - - - - - - - - - Other banks 1 - - - - - - - 299 1 Other financial institutions 32 - - - - - - - 2 - Corporate 381 335 249 - - 2 - 2 34 60 Personal 14 - - - - - - - - 10
445 335 249 532 - 182 7 707 335 71 31 December 2010
Central and local government 14 - - 895 (694) 118 39 974 7 7 Central banks 36 - - - - - - - - - Other banks 18 - - - - - - - 167 1 Other financial institutions 31 - - - - - - - 3 3 Corporate 188 48 48 - - - - - 26 141 Personal 16 - - - - - - - - 10
303 48 48 895 (694) 118 39 974 203 162
Fair values of CDS referencing sovereign exposures were:
30 September
2011 31 December
2010 Fair value £m £m
Bought protection 1,832 854 Sold protection 1,720 871
For definitions refer to pages 126 and 127.

139 RBS Group – Q3 2011 Results
Risk and balance sheet management (continued) Risk management: Credit risk: Country risk: Greece (continued) Key points ● Given the continued economic distress in Greece, the Group is actively managing its exposure to
this country. ● Much of the exposure is collateralised or guaranteed. As a result, the Group has reduced its
effective exposure to Greece in line with the de-risking strategy that has been in place since early 2010.
Central and local government and central bank ● As a result of the continued deterioration in Greece’s fiscal position, coupled with the potential for
the restructuring of Greek sovereign debt, the Group recognised an impairment charge in respect of available-for-sale Greek government bonds in H1 2011. These bonds continue to represent a significant proportion of the total Greek portfolio.
Financial institutions ● Exposure to Greek banks remains under close scrutiny and is actively managed. Lending
exposures to banks are very small. ● The gross derivatives exposure to banks increased by slightly over £0.1 billion in the third quarter
but is largely collateralised; the remainder consists for the most part of transactions conducted with Greek subsidiaries of non-Greek banks.
Corporations ● At the start of the year, a number of defaulted clients re-incorporated in Greece causing a £0.2
billion increase in lending as well as increases in the risk elements in lending and in impairmentprovisions.
● The ongoing deterioration in Greek sovereign credit quality led to some further increase in provisions and to a rigorous review of Greek corporate exposure.
● Accordingly, and allowing for the effect described above, the Group’s total corporate exposure is declining. The focus is now on short-term trade facilities to the domestic subsidiaries ofinternational clients, increasingly supported by parental guarantees.
Non-Core ● Of the total Greek exposure, £0.2 billion is in Non-Core.

140 RBS Group – Q3 2011 Results
Risk and balance sheet management (continued) Risk management: Credit risk: Country risk: Portugal
HFT debt securities
Lending REIL Impairment provisions
AFS and LAR debt
securities AFS
reserves Long Short Total debt securities
Derivatives (gross of collateral)
and repos
Contingent liabilities and commitments
Issuer £m £m £m £m £m £m £m £m £m £m
30 September 2011 Central and local government 43 - - 66 (53) 70 152 (16) 19 - Central banks - - - - - - - - - - Other banks 57 - - 91 (37) 14 11 94 338 - Other financial institutions - - - 5 - 13 - 18 12 - Corporate 579 27 27 43 - - - 43 74 348 Personal 5 - - - - - - - - 8
684 27 27 205 (90) 97 163 139 443 356 31 December 2010
Central and local government 86 - - 92 (26) 68 122 38 29 211 Central banks - - - - - - - - - - Other banks 63 - - 106 (24) 46 2 150 307 2 Other financial institutions - - - 47 - 7 - 54 7 1 Corporate 611 27 21 - 1 - - - 50 512 Personal 6 - - - - - - - - 8
766 27 21 245 (49) 121 124 242 393 734
Fair values of CDS referencing sovereign exposures were:
30 September
2011 31 December
2010 Fair value £m £m
Bought protection 1,053 471 Sold protection 1,041 460
For definitions refer to pages 126 and 127.

141 RBS Group – Q3 2011 Results
Risk and balance sheet management (continued) Risk management: Credit risk: Country risk: Portugal (continued) Key points ● Following the closure of its local branch in early 2011, the Group has modest exposure overall.
The portfolio is focused on corporate lending and derivatives trading with the largest localbanks.
Central and local government and central bank ● In the first nine months of 2011, the sovereign risk position was reduced, largely the result of
decreases in contingent exposures to three public sector entities in addition to bond sales and maturities. Overall, the exposure shrank to less than £50 million in the nine months.
Financial institutions ● As the Portuguese economy deteriorated, the Group reduced its exposure in all areas.
● Approximately 90% of remaining counterparty exposures are focused on the top four systemically important financial groups. Exposures generally consist of collateralised trading products and short-term treasury lines.
Corporations ● The Group’s exposure is concentrated on large highly creditworthy clients. The largest exposure is
to corporations active in the energy and transport sectors.
● Trade finance exposure was nearly halved in the third quarter to £50 million. Non-Core ● Of the total Portuguese exposure, £0.6 billion is in Non-Core, 87% of which is related to project
finance.

142 RBS Group – Q3 2011 Results
Risk and balance sheet management (continued) Risk management: Credit risk: Ulster Bank Group (Core and Non-Core) Overview Ulster Bank Group accounts for 9.8% of the Group’s total gross customer loans (30 June 2011 - 10.2%; 31 December 2010 - 9.9%) and 8.5% of the Group’s Core gross customer loans (30 June 2011 - 8.8%; 31 December 2010 - 8.9%). The Q3 2011 impairment charge was £608 million (Q3 2010 - £962 million) with commercial real estate and mortgage sectors accounting for £314 million (52%) and £126 million (21%) of the total Q3 2011 impairment charge respectively. The impairment charge in Q3 2011 was driven by a combination of new defaulting customers and deteriorating security values. Provisions as a percentage of REIL has increased from 51.4% at 30 June 2011 to 51.6% at 30 September 2011 (30 September 2010 - 39%). The impairment charge of £608 million for Q3 2011 was £638 million lower than the £1,246 million impairment charge for Q2 2011. Non-Core was the main driver for this reduction with its impairment charge £696 million lower in Q3 2011 compared with Q2 2011 due to a slower rate of deterioration in security values and a decrease in the value of loans defaulting in the quarter. The Core portfolio quarterly impairment charge increased by £58 million to £327 million (Q2 2011- £269 million), with the mortgage portfolio accounting for £48 million of the increase. Impairments remain elevated as high unemployment coupled with higher taxation and less liquidity in the economy continues to depress the property market and domestic spending. Core The Q3 2011 impairment charge was £327 million (Q3 2010 - £286 million) with the mortgage sector accounting for £126 million (39%) of the total Q3 2011 impairment charge. These impairment losses reflect the difficult economic climate in Ireland with elevated default levels across both mortgage and other corporate portfolios. Ulster Bank Group is assisting customers in this difficult environment. Mortgage forbearance policies which are deployed through the 'Flex' initiative are aimed at assisting customers in financial difficulty. Non-Core The Q3 2011 impairment charge was £281 million (Q3 2010 - £676 million) with the commercial real estate sector accounting for £236 million (84%) of the total Q3 2011 charge. The impairment charge decreased from £977 million in Q2 2011 to £281 million in Q3 2011, primarily reflecting a slower rate of deterioration in security values and a reduction in the value of loans defaulting.

143 RBS Group – Q3 2011 Results
Risk and balance sheet management (continued) Risk management: Credit risk: Ulster Bank Group (Core and Non-Core) (continued) Loans, REIL and impairments by sector
Gross
loans (1) REIL Provisions
REIL as a % of
gross loans
Provisions as a % of
REIL
Provisions as a % of
gross loans
Q3 Impairment
charge
Q3Amounts
written-off30 September 2011 £m £m £m % % % £m £m
Core Mortgages 20,692 2,138 852 10.3 40 4.1 126 -Personal unsecured 1,557 201 182 12.9 91 11.7 12 4Commercial real estate - investment 4,241 1,163 373 27.4 32 8.8 58 - - development 923 261 135 28.3 52 14.6 20 -Other corporate 8,133 1,793 1,025 22.0 57 12.6 111 37
35,546 5,556 2,567 15.6 46 7.2 327 41
Non-Core Commercial real estate - investment 3,937 2,684 1,247 68.2 47 31.7 74 1 - development 8,703 7,687 4,342 88.3 57 49.9 162 1Other corporate 1,670 1,176 674 70.4 57 40.4 45 9
14,310 11,547 6,263 80.7 54 43.8 281 11
Ulster Bank Group Mortgages 20,692 2,138 852 10.3 40 4.1 126 -Personal unsecured 1,557 201 182 12.9 91 11.7 12 4Commercial real estate - investment 8,178 3,847 1,620 47.0 42 19.8 132 1 - development 9,626 7,948 4,477 82.6 56 46.5 182 1Other corporate 9,803 2,969 1,699 30.3 57 17.3 156 46
49,856 17,103 8,830 34.3 52 17.7 608 52 Note: (1) Funded customer loans.
144 RBS Group – Q3 2011 Results
Risk and balance sheet management (continued) Risk management: Credit risk: Ulster Bank Group (Core and Non-Core) (continued) Loans, REIL and impairments by sector (continued)
Gross loans REIL Provisions
REIL as a % of
gross loans
Provisions as a % of
REIL
Provisions as a % of
gross loans
H1 Impairment
charge
H1 Amounts
written-off 30 June 2011 £m £m £m % % % £m £m
Core Mortgages 21,778 2,014 769 9.2 38 3.5 311 4 Personal unsecured 1,605 201 181 12.5 90 11.3 33 15 Commercial real estate - investment 4,338 838 331 19.3 40 7.6 115 - - development 955 241 120 25.2 50 12.6 48 - Other corporate 8,699 1,822 1,000 20.9 55 11.5 223 2
37,375 5,116 2,401 13.7 47 6.4 730 21
Non-Core Commercial real estate - investment 4,076 2,662 1,231 65.3 46 30.2 384 - - development 9,002 7,847 4,367 87.2 56 48.5 1,313 - Other corporate 1,811 1,226 661 67.7 54 36.5 113 2
14,889 11,735 6,259 78.8 53 42.0 1,810 2
Ulster Bank Group Mortgages 21,778 2,014 769 9.2 38 3.5 311 4 Personal unsecured 1,605 201 181 12.5 90 11.3 33 15 Commercial real estate - investment 8,414 3,500 1,562 41.6 45 18.6 499 - - development 9,957 8,088 4,487 81.2 56 45.1 1,361 - Other corporate 10,510 3,048 1,661 29.0 55 15.8 336 4
52,264 16,851 8,660 32.2 51 16.6 2,540 23

145 RBS Group – Q3 2011 Results
Risk and balance sheet management (continued) Risk management: Credit risk: Ulster Bank Group (Core and Non-Core) (continued) Loans, REIL and impairments by sector (continued)
Gross loans REIL Provisions
REIL as a % of
gross loans
Provisions as a % of
REIL
Provisions as a % of
gross loans
Q4 Impairment
charge
Q4 Amounts
written-off 31 December 2010 £m £m £m % % % £m £m
Core Mortgages 21,162 1,566 439 7.4 28 2.1 159 3 Personal unsecured 1,282 185 158 14.4 85 12.3 13 6 Commercial real estate - investment 4,284 598 332 14.0 56 7.7 79 - - development 1,090 65 37 6.0 57 3.4 (10) - Other corporate 9,039 1,205 667 13.3 55 7.4 135 1
36,857 3,619 1,633 9.8 45 4.4 376 10
Non-Core Commercial real estate - investment 3,854 2,391 1,000 62.0 42 25.9 206 - - development 8,760 6,341 2,783 72.4 44 31.8 596 - Other corporate 1,970 1,310 561 66.5 43 28.5 (19) -
14,584 10,042 4,344 68.9 43 29.8 783 -
Ulster Bank Group Mortgages 21,162 1,566 439 7.4 28 2.1 159 3 Personal unsecured 1,282 185 158 14.4 85 12.3 13 6 Commercial real estate - investment 8,138 2,989 1,332 36.7 45 16.4 285 - - development 9,850 6,406 2,820 65.0 44 28.6 586 - Other corporate 11,009 2,515 1,228 22.8 49 11.2 116 1
51,441 13,661 5,977 26.6 44 11.6 1,159 10 Key points • The REIL increase of £252 million in Q3 2011 reflects continuing difficult conditions in both the
commercial and residential sectors in the Republic of Ireland partially offset by currencymovements. Of the REIL at 30 September 2011, 68% was in Non-Core (30 June 2011 - 70%).
• The majority of Non-Core commercial real estate development portfolio (88%) is REIL with a57% provision coverage.
• REIL mortgages represented 10.3% of gross lending at 30 September 2011 compared with9.2% at 30 June 2011 and 7.4% at 31 December 2010.
146 RBS Group – Q3 2011 Results
Risk and balance sheet management (continued) Risk management: Credit risk: Ulster Bank Group (Core and Non-Core) (continued) Residential mortgages The table below shows how the continued decrease in property values has affected the distribution of residential mortgages by loan-to-value (LTV) (indexed). LTV is based upon gross loan amounts and, whilst including defaulted loans, does not take account of provisions made.
30 September
2011 30 June
2011 31 December
2010 By average LTV (1) % % %
<= 50% 33.7 35.1 35.9 > 50% and <= 70% 12.5 13.0 13.5 > 70% and <= 90% 12.4 13.0 13.5 > 90% 41.4 38.9 37.1
Total portfolio average LTV 77.6 74.5 71.2
Average LTV on new originations during the period 66.7 65.0 75.9 Note: (1) LTV averages calculated by transaction volume. Key points • The residential mortgage portfolio across Ulster Bank Group totalled £20.7 billion at
30 September 2011 with 89% in the Republic of Ireland and 11% in Northern Ireland. Atconstant exchange rates, the portfolio remained at similar levels to 31 December 2010(c.£21.2 billon) with little growth due to low new business volumes.
• Repossession levels remain low at 134 cases in the nine months ended 30 September 2011, ofwhich 111 were in the Republic of Ireland, primarily due to voluntary surrender or abandonmentof the property.
147 RBS Group – Q3 2011 Results
Risk and balance sheet management (continued) Risk management: Credit risk: Ulster Bank Group (Core and Non-Core) (continued) Commercial real estate The commercial real estate lending portfolio in Ulster Bank Group reduced during the quarter to £17.8 billion, primarily due to exchange rate movements. The Non-Core portion of the portfolio totalled £12.6 billion (71% of the portfolio). Of the total Ulster Bank Group commercial real estate portfolio, the geographic split remains similar to last quarter with, 62% relating to the Republic of Ireland, 26% to Northern Ireland and 12% to the rest of the UK. Development Investment Commercial Residential Commercial Residential Total Exposure by geography £m £m £m £m £m
30 September 2011 Ireland (ROI & NI) 2,674 6,479 5,225 1,174 15,552 UK (excluding Northern Ireland) 97 357 1,659 108 2,221 RoW - 19 8 4 31
2,771 6,855 6,892 1,286 17,804 30 June 2011 Ireland (ROI & NI) 2,762 6,701 5,378 1,210 16,051 UK (excluding Northern Ireland) 104 358 1,702 112 2,276 RoW 4 28 8 4 44
2,870 7,087 7,088 1,326 18,371 31 December 2010 Ireland (ROI & NI) 2,785 6,578 5,072 1,098 15,533 UK (excluding Northern Ireland) 110 359 1,831 115 2,415 RoW - 18 22 - 40
2,895 6,955 6,925 1,213 17,988
Note: (1) The above table does not include rate risk management or contingent obligations. Key point • Commercial real estate remains the primary driver of the increase in the defaulted loan book for
Ulster Bank. The outlook for the sector remains uncertain with the possibility of further declinesin values. Proactive management of the portfolio has resulted in further transfers of stressedcustomers to the specialised management of Global Restructuring Group.

148 RBS Group – Q3 2011 Results
Risk and balance sheet management (continued) Market risk Market risk arises from changes in interest rates, foreign currency, credit spread, equity prices and risk related factors such as market volatilities. The Group manages market risk centrally within its trading and non-trading portfolios through a comprehensive market risk management framework. This framework includes limits based on, but not limited to, value-at-risk (VaR), stress testing, position and sensitivity analyses. For a description of the Group’s basis of measurement and methodology limitations, refer to the 2010 Annual Report and Accounts, Market risk, page 193. Daily distribution of GBM trading revenues
Nine months ended 30 September 2011
1 2 13 3
14
9
1513 14
18 17
24
19
15
11
5 42 1 2 2 1 1
0
5
10
15
20
25
30
(40) >
< (35)
(35) >
< (30)
(30) >
< (25)
(25) >
< (20)
(20) >
< (15)
(15) >
< (10)
(10) >
< (5)
(5) >
< 0
0 > <
5
5 > <
10
10 > <
15
15 > <
20
20 > <
25
25 > <
30
30 > <
35
35 > <
40
40 > <
45
45 > <
50
50 > <
55
55 > <
60
60 > <
65
65 > <
70
70 > <
75
75 > <
80
80 > <
85
85 > <
90
90 > <
95
95 > <
100
GBP £m
Num
ber o
f tra
ding
day
s
Nine months ended 30 September 2010
1 1 2 3 4
9 10
14
2119
32
15 1411
9
4 35
2 13 2 1 1 2
0
5
10
15
20
25
30
35
(40) >
< (35)
(35) >
< (30)
(30) >
< (25)
(25) >
< (20)
(20) >
< (15)
(15) >
< (10)
(10) >
< (5)
(5) >
< 0
0 > <
5
5 > <
10
10 > <
15
15 > <
20
20 > <
25
25 > <
30
30 > <
35
35 > <
40
40 > <
45
45 > <
50
50 > <
55
55 > <
60
60 > <
65
65 > <
70
70 > <
75
75 > <
80
80 > <
85
85 > <
90
90 > <
95
95 > <
100
GBP £m
Num
ber o
f tra
ding
day
s
Note: (1) The effect of any month end adjustments, not attributable to a specific daily market move, is spread evenly over the days
in the month in question.

149 RBS Group – Q3 2011 Results
Risk and balance sheet management (continued) Market risk (continued) Key points Nine months ended 30 September 2011 compared with nine months ended 30 September 2010 • GBM traded revenue decreased during 2011 due to the ongoing European sovereign debt crisis
and heightened concerns about growth expectations for the world economy.
• The average daily revenue earned from Core trading activities in 2011 was £22 million,compared with £29 million in 2010. The standard deviation of these daily revenues was£21 million, unchanged period on period.
• The number of days with negative revenue increased from 11 days in 2010 to 24 days in 2011due to market and economic conditions referred to above.
• The most frequent result is daily revenue in the range of £25 million to £30 million with 24occurrences in 2011, compared with 32 occurrences in 2010.
The table below details VaR for the Group’s trading portfolio, segregated by type of market risk exposure, and between Core and Non-Core, Counterparty Exposure Management (CEM) and Core excluding CEM.
Quarter ended 30 September 2011 30 June 2011
Average Period end Maximum Minimum Average Period end Maximum Minimum Trading VaR £m £m £m £m £m £m £m £m
Interest rate 51.3 73.0 73.1 33.1 39.4 36.8 75.7 27.5 Credit spread 56.2 69.8 69.8 47.4 73.2 64.6 95.0 60.0 Currency 8.7 6.5 12.5 6.1 9.4 9.3 14.2 5.2 Equity 7.9 7.7 13.1 4.6 10.4 12.0 17.3 5.2 Commodity 0.9 3.6 3.6 0.1 0.2 0.3 1.6 - Diversification (54.3) (61.0)
Total 78.3 106.3 114.2 59.7 78.7 62.0 117.9 60.8 Core 58.3 83.1 91.0 41.7 60.2 42.5 86.0 42.5 Core CEM 34.4 38.0 45.2 23.5 26.5 23.2 33.2 21.9 Core excluding CEM 44.3 62.2 71.4 35.3 57.1 39.4 78.4 39.2
Non-Core 40.4 38.7 53.0 33.2 69.3 51.4 110.1 47.5
Key points Q3 2011 compared with Q2 2011 • The Group’s total trading VaR and interest rate VaR were significantly higher at the end of
Q3 2011 than at end Q2 2011. This was largely driven by hedge positions for a large and successful UK gilt syndication in which RBS participated.
• Average credit spread VaR and Non-Core trading VaR was considerably lower in Q3 2011 thanin Q2 2011. Non-Core VaR decreased substantially during Q2 primarily due to a significant de-risking of the portfolios in line with the overall business strategy. The VaR continued to decline as the period of high volatility relating to the 2008/2009 credit crisis dropped out of the VaRcalculations.

150 RBS Group – Q3 2011 Results
Risk and balance sheet management (continued) Market risk (continued) Key points (continued) • The credit spread period end VaR was slightly higher in Q3 2011 than in Q2 2011. This was
largely due to the recent volatility in the European sovereign peripheral time series entering theVaR window.
• The CEM trading VaR increased in Q3 2011 due to the implementation of an enhanceddiscounting methodology for cross-currency trades.
Nine months ended 30 September 2011 30 September 2010
Average Period end Maximum Minimum Average Period end Maximum Minimum Trading VaR £m £m £m £m £m £m £m £m
Interest rate 50.3 73.0 79.2 27.5 47.7 74.3 74.3 32.5 Credit spread 87.4 69.8 151.1 47.4 177.1 190.8 243.2 113.0 Currency 10.1 6.5 18.0 5.2 18.9 16.7 28.0 9.3 Equity 9.8 7.7 17.3 4.6 9.3 5.4 17.9 2.7 Commodity 0.4 3.6 3.6 - 10.1 13.8 15.8 3.2 Diversification (54.3) (119.2)
Total 104.1 106.3 181.3 59.7 173.3 181.8 252.1 103.0 Core 75.3 83.1 133.9 41.7 105.1 115.0 153.4 58.9 Core CEM 33.6 38.0 47.6 21.9 55.1 73.0 82.4 30.3 Core excluding CEM 62.9 62.2 106.2 35.3 83.2 78.4 108.7 53.6
Non-Core 74.2 38.7 128.6 33.2 105.7 101.8 169.4 63.2
Key point Nine months ended 30 September 2011 compared with nine months ended 30 September 2010 • The Group’s market risk profile in 2010 was equally split across Non-Core and Core divisions
with a concentrated exposure to the credit spread risk factor. In line with the business strategyto wind down the Group’s interest in Sempra and other Non-Core activities, the trading portfolio has now been re-balanced such that the Non-Core exposure has been significantly reduced and the trading portfolio is less concentrated in the credit risk factor.

151 RBS Group – Q3 2011 Results
Risk and balance sheet management (continued) Market risk (continued) The table below details VaR for the Group’s non-trading portfolio, excluding the structured portfolio (SCP) and loans and receivables (LAR), segregated by type of market risk exposure and between Core and Non-Core.
Quarter ended 30 September 2011 30 June 2011
Average Period end Maximum Minimum Average Period end Maximum Minimum Non-trading VaR £m £m £m £m £m £m £m £m
Interest rate 9.6 10.3 11.1 8.2 8.3 8.3 9.2 5.7 Credit spread 16.0 14.8 18.0 14.1 19.1 18.0 24.2 16.1 Currency 3.0 4.1 5.9 1.1 1.7 3.3 3.3 0.2 Equity 1.9 1.8 2.0 1.6 2.2 2.0 2.4 2.0 Diversification (13.5) (13.1)
Total 17.6 17.5 18.9 15.7 18.7 18.5 22.5 16.7 Core 17.4 18.6 20.1 15.2 18.5 19.4 24.6 15.7 Non-Core 3.9 3.7 4.3 3.2 3.7 4.3 4.3 2.8
Key point Q3 2011 compared with Q2 2011 • The maximum credit spread VaR was lower in Q3 2011 than in Q2 2011. This was primarily due
to the increased market volatility experienced during the 2008/2009 credit crisis, dropping out of the two year time series used by the VaR model. This volatility was particularly pronounced inrespect of credit spreads and had a marked impact on historic credit spread VaR.
Nine months ended 30 September 2011 30 September 2010 (1)
Average Period end Maximum Minimum Average Period end Maximum Minimum Non-trading VaR £m £m £m £m £m £m £m £m
Interest rate 8.6 10.3 11.1 5.7 8.9 4.4 20.5 4.4 Credit spread 19.6 14.8 39.3 14.1 37.1 19.4 101.2 19.4 Currency 1.8 4.1 5.9 0.1 2.1 2.0 7.6 0.3 Equity 2.2 1.8 3.1 1.6 0.6 0.4 3.5 0.2 Diversification (13.5) (6.8)
Total 20.9 17.5 41.6 13.4 35.8 19.4 98.0 19.4 Core 20.4 18.6 38.9 13.5 35.5 19.3 98.1 19.3 Non-Core 3.4 3.7 4.3 2.2 0.8 0.3 3.6 0.2
Note: (1) Revised to exclude LAR portfolios. Key point Nine months ended 30 September 2011 compared with nine months ended 30 September 2010 • The maximum credit spread VaR was considerably lower in 2011 than in the same period in
2010. This was due to a change in the time series used for the Dutch RMBS portfolio in RBS N.V. where more relevant and granular market data had become available and provided abetter reflection of the risk in the portfolio. The VaR decreased through the period as the volatile market data continued to drop out of the 500 day time series used in the VaR calculation.
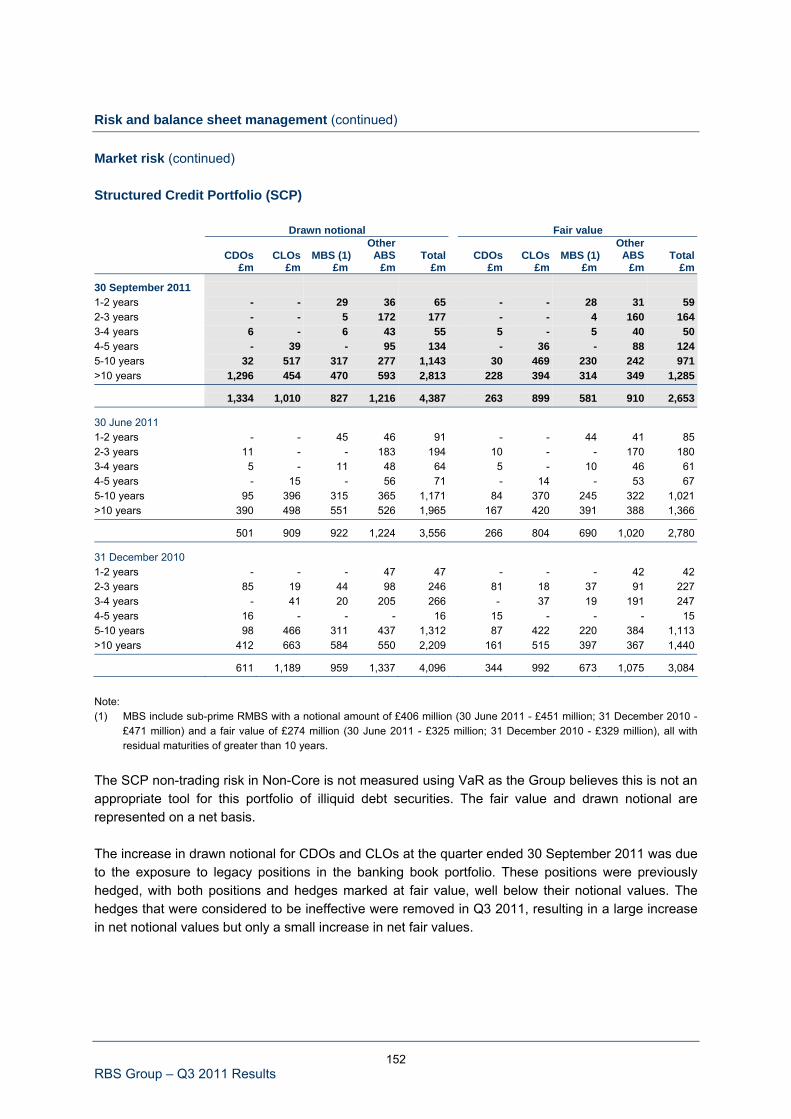
152 RBS Group – Q3 2011 Results
Risk and balance sheet management (continued) Market risk (continued) Structured Credit Portfolio (SCP) Drawn notional Fair value
CDOs CLOs MBS (1)Other ABS Total CDOs CLOs MBS (1)
Other ABS Total
£m £m £m £m £m £m £m £m £m £m
30 September 2011 1-2 years - - 29 36 65 - - 28 31 59 2-3 years - - 5 172 177 - - 4 160 164 3-4 years 6 - 6 43 55 5 - 5 40 50 4-5 years - 39 - 95 134 - 36 - 88 124 5-10 years 32 517 317 277 1,143 30 469 230 242 971 >10 years 1,296 454 470 593 2,813 228 394 314 349 1,285
1,334 1,010 827 1,216 4,387 263 899 581 910 2,653
30 June 2011 1-2 years - - 45 46 91 - - 44 41 85 2-3 years 11 - - 183 194 10 - - 170 180 3-4 years 5 - 11 48 64 5 - 10 46 61 4-5 years - 15 - 56 71 - 14 - 53 67 5-10 years 95 396 315 365 1,171 84 370 245 322 1,021 >10 years 390 498 551 526 1,965 167 420 391 388 1,366
501 909 922 1,224 3,556 266 804 690 1,020 2,780
31 December 2010 1-2 years - - - 47 47 - - - 42 42 2-3 years 85 19 44 98 246 81 18 37 91 227 3-4 years - 41 20 205 266 - 37 19 191 247 4-5 years 16 - - - 16 15 - - - 15 5-10 years 98 466 311 437 1,312 87 422 220 384 1,113 >10 years 412 663 584 550 2,209 161 515 397 367 1,440
611 1,189 959 1,337 4,096 344 992 673 1,075 3,084
Note: (1) MBS include sub-prime RMBS with a notional amount of £406 million (30 June 2011 - £451 million; 31 December 2010 -
£471 million) and a fair value of £274 million (30 June 2011 - £325 million; 31 December 2010 - £329 million), all with residual maturities of greater than 10 years.
The SCP non-trading risk in Non-Core is not measured using VaR as the Group believes this is not an appropriate tool for this portfolio of illiquid debt securities. The fair value and drawn notional are represented on a net basis. The increase in drawn notional for CDOs and CLOs at the quarter ended 30 September 2011 was due to the exposure to legacy positions in the banking book portfolio. These positions were previously hedged, with both positions and hedges marked at fair value, well below their notional values. The hedges that were considered to be ineffective were removed in Q3 2011, resulting in a large increase in net notional values but only a small increase in net fair values.
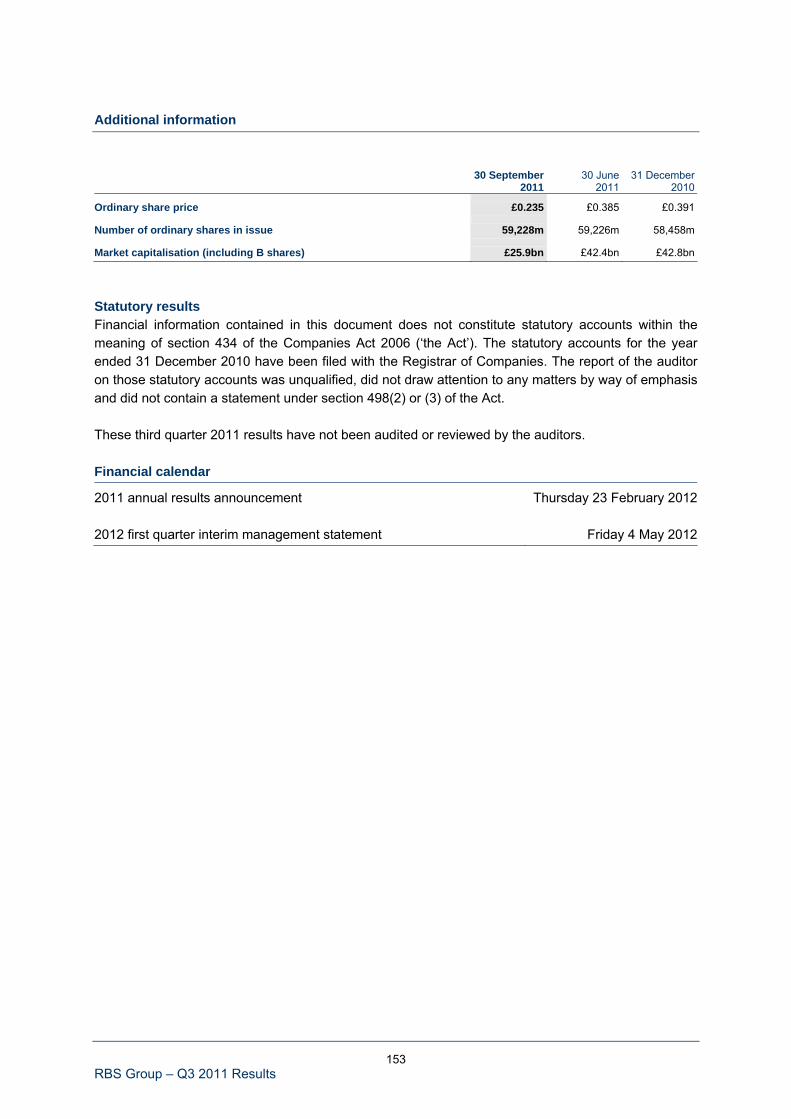
153 RBS Group – Q3 2011 Results
Additional information
30 September
2011 30 June
2011 31 December
2010
Ordinary share price £0.235 £0.385 £0.391
Number of ordinary shares in issue 59,228m 59,226m 58,458m
Market capitalisation (including B shares) £25.9bn £42.4bn £42.8bn
Statutory results Financial information contained in this document does not constitute statutory accounts within the meaning of section 434 of the Companies Act 2006 (‘the Act’). The statutory accounts for the year ended 31 December 2010 have been filed with the Registrar of Companies. The report of the auditor on those statutory accounts was unqualified, did not draw attention to any matters by way of emphasis and did not contain a statement under section 498(2) or (3) of the Act. These third quarter 2011 results have not been audited or reviewed by the auditors. Financial calendar
2011 annual results announcement Thursday 23 February 2012 2012 first quarter interim management statement Friday 4 May 2012

RBS Group – Q3 2011 Results
Appendix 1
Income statement reconciliations
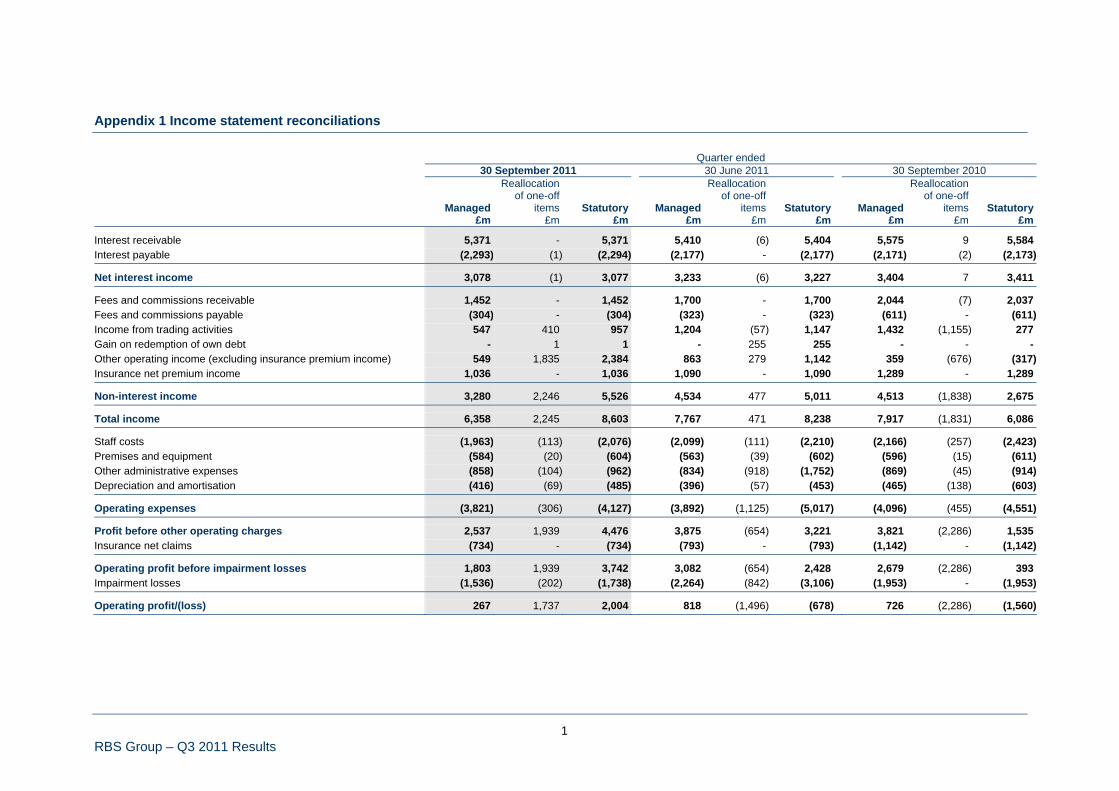
RBS Group – Q3 2011 Results
1
Appendix 1 Income statement reconciliations Quarter ended
30 September 2011 30 June 2011 30 September 2010
Managed
Reallocation of one-off
items Statutory Managed
Reallocation of one-off
items Statutory Managed
Reallocation of one-off
items Statutory £m £m £m £m £m £m £m £m £m
Interest receivable 5,371 - 5,371 5,410 (6) 5,404 5,575 9 5,584 Interest payable (2,293) (1) (2,294) (2,177) - (2,177) (2,171) (2) (2,173)
Net interest income 3,078 (1) 3,077 3,233 (6) 3,227 3,404 7 3,411
Fees and commissions receivable 1,452 - 1,452 1,700 - 1,700 2,044 (7) 2,037 Fees and commissions payable (304) - (304) (323) - (323) (611) - (611) Income from trading activities 547 410 957 1,204 (57) 1,147 1,432 (1,155) 277 Gain on redemption of own debt - 1 1 - 255 255 - - - Other operating income (excluding insurance premium income) 549 1,835 2,384 863 279 1,142 359 (676) (317) Insurance net premium income 1,036 - 1,036 1,090 - 1,090 1,289 - 1,289
Non-interest income 3,280 2,246 5,526 4,534 477 5,011 4,513 (1,838) 2,675
Total income 6,358 2,245 8,603 7,767 471 8,238 7,917 (1,831) 6,086
Staff costs (1,963) (113) (2,076) (2,099) (111) (2,210) (2,166) (257) (2,423) Premises and equipment (584) (20) (604) (563) (39) (602) (596) (15) (611) Other administrative expenses (858) (104) (962) (834) (918) (1,752) (869) (45) (914) Depreciation and amortisation (416) (69) (485) (396) (57) (453) (465) (138) (603)
Operating expenses (3,821) (306) (4,127) (3,892) (1,125) (5,017) (4,096) (455) (4,551)
Profit before other operating charges 2,537 1,939 4,476 3,875 (654) 3,221 3,821 (2,286) 1,535 Insurance net claims (734) - (734) (793) - (793) (1,142) - (1,142)
Operating profit before impairment losses 1,803 1,939 3,742 3,082 (654) 2,428 2,679 (2,286) 393 Impairment losses (1,536) (202) (1,738) (2,264) (842) (3,106) (1,953) - (1,953)
Operating profit/(loss) 267 1,737 2,004 818 (1,496) (678) 726 (2,286) (1,560)
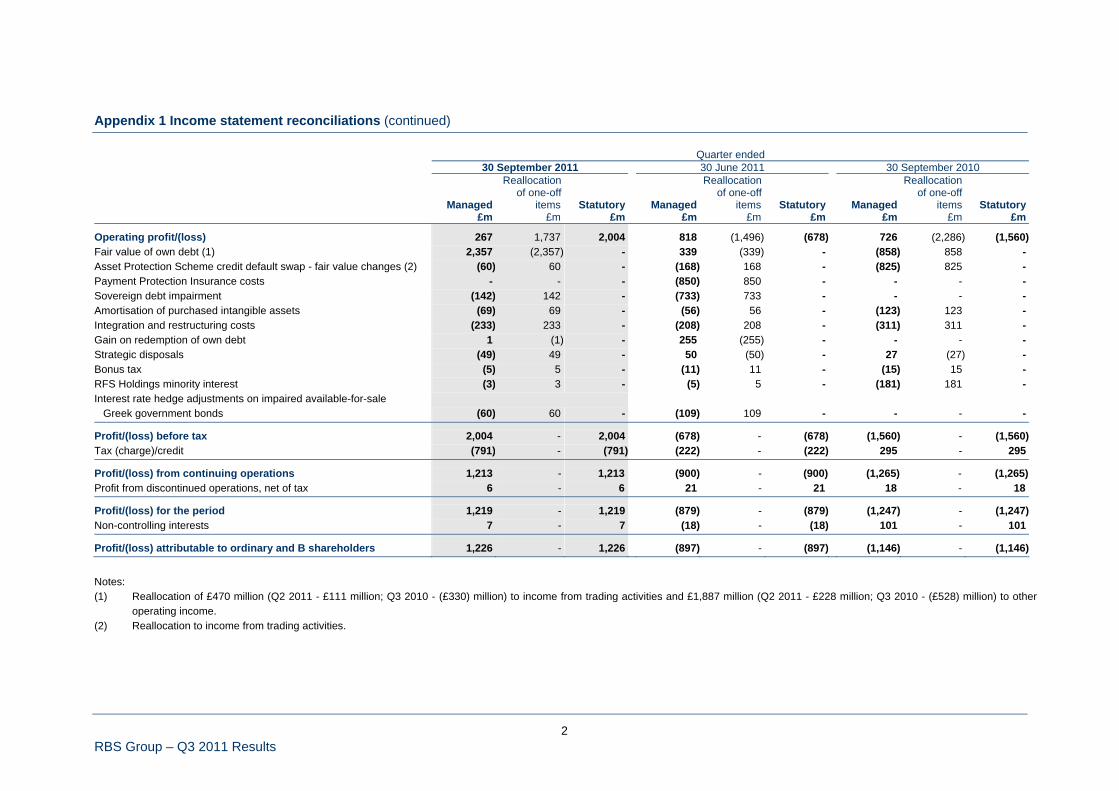
RBS Group – Q3 2011 Results
2
Appendix 1 Income statement reconciliations (continued) Quarter ended 30 September 2011 30 June 2011 30 September 2010
Managed
Reallocation of one-off
items Statutory Managed
Reallocation of one-off
items Statutory Managed
Reallocation of one-off
items Statutory £m £m £m £m £m £m £m £m £m
Operating profit/(loss) 267 1,737 2,004 818 (1,496) (678) 726 (2,286) (1,560) Fair value of own debt (1) 2,357 (2,357) - 339 (339) - (858) 858 - Asset Protection Scheme credit default swap - fair value changes (2) (60) 60 - (168) 168 - (825) 825 - Payment Protection Insurance costs - - - (850) 850 - - - - Sovereign debt impairment (142) 142 - (733) 733 - - - - Amortisation of purchased intangible assets (69) 69 - (56) 56 - (123) 123 - Integration and restructuring costs (233) 233 - (208) 208 - (311) 311 - Gain on redemption of own debt 1 (1) - 255 (255) - - - - Strategic disposals (49) 49 - 50 (50) - 27 (27) - Bonus tax (5) 5 - (11) 11 - (15) 15 - RFS Holdings minority interest (3) 3 - (5) 5 - (181) 181 - Interest rate hedge adjustments on impaired available-for-sale Greek government bonds (60) 60 - (109) 109 - - - -
Profit/(loss) before tax 2,004 - 2,004 (678) - (678) (1,560) - (1,560) Tax (charge)/credit (791) - (791) (222) - (222) 295 - 295
Profit/(loss) from continuing operations 1,213 - 1,213 (900) - (900) (1,265) - (1,265) Profit from discontinued operations, net of tax 6 - 6 21 - 21 18 - 18
Profit/(loss) for the period 1,219 - 1,219 (879) - (879) (1,247) - (1,247) Non-controlling interests 7 - 7 (18) - (18) 101 - 101
Profit/(loss) attributable to ordinary and B shareholders 1,226 - 1,226 (897) - (897) (1,146) - (1,146) Notes: (1) Reallocation of £470 million (Q2 2011 - £111 million; Q3 2010 - (£330) million) to income from trading activities and £1,887 million (Q2 2011 - £228 million; Q3 2010 - (£528) million) to other
operating income. (2) Reallocation to income from trading activities.

RBS Group – Q3 2011 Results
3
Appendix 1 Income statement reconciliations (continued)
Nine months ended 30 September 2011 30 September 2010
Managed
Reallocation of one-off
items Statutory Managed
Reallocation of one-off
items Statutory £m £m £m £m £m £m
Interest receivable 16,183 (7) 16,176 17,155 9 17,164 Interest payable (6,570) (1) (6,571) (6,533) (2) (6,535)
Net interest income 9,613 (8) 9,605 10,622 7 10,629
Fees and commissions receivable 4,794 - 4,794 6,141 - 6,141 Fees and commissions payable (887) - (887) (1,762) - (1,762) Income from trading activities 3,241 (302) 2,939 5,159 (1,006) 4,153 Gain on redemption of own debt - 256 256 - 553 553 Other operating income (excluding insurance premium income) 2,122 1,795 3,917 1,187 (711) 476 Insurance net premium income 3,275 - 3,275 3,856 - 3,856
Non-interest income 12,545 1,749 14,294 14,581 (1,164) 13,417
Total income 22,158 1,741 23,899 25,203 (1,157) 24,046
Staff costs (6,382) (303) (6,685) (6,897) (580) (7,477) Premises and equipment (1,703) (74) (1,777) (1,640) (53) (1,693) Other administrative expenses (2,557) (1,078) (3,635) (2,778) (169) (2,947) Depreciation and amortisation (1,192) (170) (1,362) (1,314) (290) (1,604)
Operating expenses (11,834) (1,625) (13,459) (12,629) (1,092) (13,721)
Profit before other operating charges 10,324 116 10,440 12,574 (2,249) 10,325 Insurance net claims (2,439) - (2,439) (3,601) - (3,601)
Operating profit before impairment losses 7,885 116 8,001 8,973 (2,249) 6,724 Impairment losses (5,747) (1,044) (6,791) (7,115) - (7,115)
Operating profit/(loss) 2,138 (928) 1,210 1,858 (2,249) (391)
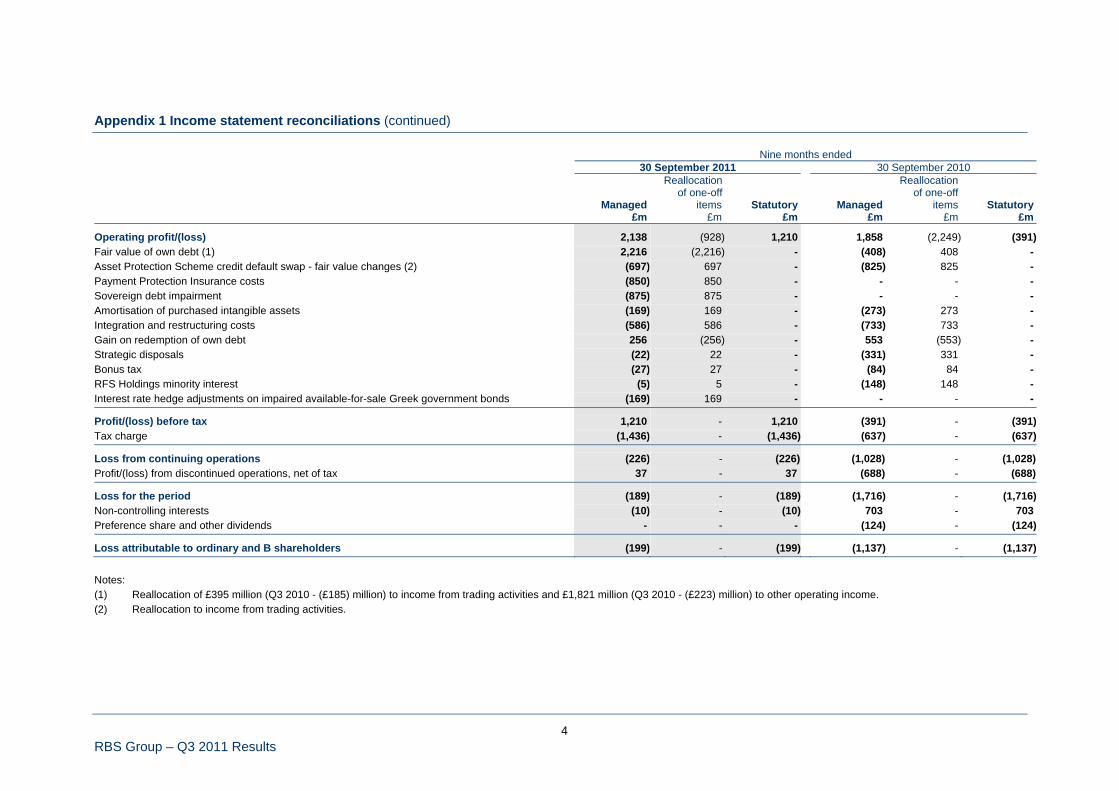
RBS Group – Q3 2011 Results
4
Appendix 1 Income statement reconciliations (continued) Nine months ended 30 September 2011 30 September 2010
Managed
Reallocation of one-off
items Statutory Managed
Reallocation of one-off
items Statutory £m £m £m £m £m £m
Operating profit/(loss) 2,138 (928) 1,210 1,858 (2,249) (391) Fair value of own debt (1) 2,216 (2,216) - (408) 408 - Asset Protection Scheme credit default swap - fair value changes (2) (697) 697 - (825) 825 - Payment Protection Insurance costs (850) 850 - - - - Sovereign debt impairment (875) 875 - - - - Amortisation of purchased intangible assets (169) 169 - (273) 273 - Integration and restructuring costs (586) 586 - (733) 733 - Gain on redemption of own debt 256 (256) - 553 (553) - Strategic disposals (22) 22 - (331) 331 - Bonus tax (27) 27 - (84) 84 - RFS Holdings minority interest (5) 5 - (148) 148 - Interest rate hedge adjustments on impaired available-for-sale Greek government bonds (169) 169 - - - -
Profit/(loss) before tax 1,210 - 1,210 (391) - (391) Tax charge (1,436) - (1,436) (637) - (637)
Loss from continuing operations (226) - (226) (1,028) - (1,028) Profit/(loss) from discontinued operations, net of tax 37 - 37 (688) - (688)
Loss for the period (189) - (189) (1,716) - (1,716) Non-controlling interests (10) - (10) 703 - 703 Preference share and other dividends - - - (124) - (124)
Loss attributable to ordinary and B shareholders (199) - (199) (1,137) - (1,137)
Notes: (1) Reallocation of £395 million (Q3 2010 - (£185) million) to income from trading activities and £1,821 million (Q3 2010 - (£223) million) to other operating income. (2) Reallocation to income from trading activities.


RBS Group – Q3 2011 Results
Appendix 2
Businesses outlined for disposal

RBS Group – Q3 2011 Results
1
Appendix 2 Businesses outlined for disposal To comply with EC State Aid requirements the Group agreed to make a series of divestments by the end of 2013: the disposal of RBS Insurance, Global Merchant Services and its interest in RBS Sempra Commodities JV. The Group also agreed to dispose of its RBS England and Wales and NatWest Scotland branch-based businesses, along with certain SME and corporate activities across the UK (‘UK branch-based businesses’). The disposals of Global Merchant Services and RBS Sempra Commodities JV businesses have now effectively been completed. The sale of the Group's UK branch-based businesses to Santander UK plc continues to make good progress. Due to the complex nature of the process required to separate the divesting branches and associated assets, and the desire to minimise customer disruption, the transaction is now expected to substantially complete in the fourth quarter of 2012, subject to regulatory approvals and other conditions. The disposal of RBS Insurance, by way of public flotation or a trade sale, is targeted for the second half of 2012, subject to market conditions. External advisors were appointed during Q4 2010 and the process of separation is proceeding on plan. In the meantime, the business continues to be managed and reported as a separate core division. The table below shows total income and operating profit of RBS Insurance and the UK branch-based businesses.
Total income Operating profit/(loss)
before impairments Operating profit/(loss)
YTD
Q3 2011 FY 2010 YTD
Q3 2011 FY 2010 YTD
Q3 2011 FY 2010 £m £m £m £m £m £m
RBS Insurance (1) 3,149 4,369 329 (295) 329 (295)UK branch-based businesses (2) 695 902 365 439 226 160
Total 3,844 5,271 694 144 555 (135)
The table below shows the estimated risk-weighted assets, total assets and capital of the businesses identified for disposal.
RWAs Total assets Capital
30 September
2011 31 December
2010 30 September
2011 31 December
2010 30 September
2011 31 December
2010 £bn £bn £bn £bn £bn £bn
RBS Insurance (1) n/m n/m 12.8 12.4 4.3 4.0 UK branch-based businesses (2) 10.6 13.2 19.1 19.9 0.9 1.2
Total 10.6 13.2 31.9 32.3 5.2 5.2
Notes: (1) As reported in the results for the period ended 30 September 2011 and Annual Results for the year ended 31 December
2010 and excluding non-core business. Estimated capital includes approximately £0.9 billion of goodwill. (2) Estimated notional equity based on 8.5% of RWAs.

RBS Group – Q3 2011 Results
2
Appendix 2 Businesses outlined for disposal (continued) Further information on the UK branch-based businesses by division is shown in the tables below: Division Total
UK
Retail UK
Corporate YTD
Q3 2011 FY 2010 £m £m £m £m
Income statement Net interest income 222 290 512 656 Non-interest income 69 114 183 246
Total income 291 404 695 902
Direct expenses - staff (57) (63) (120) (176) - other (70) (50) (120) (144)Indirect expenses (55) (35) (90) (143)
(182) (148) (330) (463)
Operating profit before impairment losses 109 256 365 439 Impairment losses (63) (76) (139) (279)
Operating profit 46 180 226 160 Analysis of income by product Loans and advances 98 250 348 445 Deposits 79 117 196 261 Mortgages 102 - 102 120 Other 12 37 49 76
Total income 291 404 695 902 Net interest margin 4.62% 2.67% 3.26% 3.24% Employee numbers (full time equivalents rounded to the nearest hundred) 2,900 1,500 4,400 4,400
Division Total
UK
Retail UK
Corporate
Global Banking
& Markets 30 September
2011 31 December
2010 £bn £bn £bn £bn £bn
Capital and balance sheet Total third party assets 6.6 12.4 - 19.0 19.9 Loans and advances to customers (gross) 6.9 12.9 - 19.8 20.7 Customer deposits 8.9 14.7 - 23.6 24.0 Derivative assets - - 0.6 0.6 n/a Derivative liabilities - - 0.1 0.1 n/a Risk elements in lending 0.5 1.1 - 1.6 1.7 Loan:deposit ratio 78% 88% - 84% 86% Risk-weighted assets 3.3 7.3 - 10.6 13.2


RBS Group – Q3 2011 Results
Appendix 3
Additional risk management disclosures

1 RBS Group – Q3 2011 Results
Appendix 3 Additional risk management disclosures Loans and advances to customers by industry and geography The following tables analyse loans and advances to customers (excluding reverse repos and assets of disposal groups), by industry and geography (by location of office). Refer to Risk management: Credit risk for the Group summary.
30 September 2011 30 June 2011 31 December 2010
Core Non- Core Total Core
Non- Core Total Core
Non- Core Total
£m £m £m £m £m £m £m £m £m
UK Central and local government 7,680 83 7,763 5,945 91 6,036 5,728 173 5,901 Finance 29,754 3,795 33,549 28,657 3,734 32,391 27,995 6,023 34,018 Residential mortgages 104,040 1,497 105,537 103,689 1,570 105,259 99,928 1,665 101,593 Personal lending 21,930 295 22,225 22,205 358 22,563 23,035 585 23,620 Property 36,106 25,953 62,059 36,584 27,182 63,766 34,970 30,492 65,462 Construction 6,203 2,245 8,448 6,839 2,104 8,943 7,041 2,310 9,351 Manufacturing 11,123 867 11,990 10,155 1,447 11,602 12,300 1,510 13,810 Service industries and business activities - retail, wholesale and repairs 12,325 1,553 13,878 12,255 1,615 13,870 12,554 1,853 14,407 - transport and storage 8,835 3,664 12,499 7,905 3,844 11,749 8,105 5,015 13,120 - health, education and recreation 11,894 742 12,636 12,678 835 13,513 13,502 1,039 14,541 - hotels and restaurants 6,264 684 6,948 6,399 775 7,174 6,558 808 7,366 - utilities 3,788 715 4,503 3,418 908 4,326 3,101 1,035 4,136 - other 13,952 2,154 16,106 13,555 2,199 15,754 14,445 1,991 16,436 Agriculture, forestry and fishing 2,963 73 3,036 2,955 55 3,010 2,872 67 2,939 Finance leases and instalment credit 5,524 6,925 12,449 5,578 7,161 12,739 5,589 7,785 13,374 Interest accruals 352 1 353 365 21 386 415 98 513
282,733 51,246 333,979 279,182 53,899 333,081 278,138 62,449 340,587
Europe Central and local government 209 805 1,014 397 862 1,259 365 1,017 1,382 Finance 2,654 644 3,298 2,642 719 3,361 2,642 1,019 3,661 Residential mortgages 19,109 590 19,699 20,224 640 20,864 19,473 621 20,094 Personal lending 2,126 526 2,652 2,234 572 2,806 2,270 600 2,870 Property 5,359 12,255 17,614 5,483 12,790 18,273 5,139 12,636 17,775 Construction 1,279 754 2,033 1,163 864 2,027 1,014 873 1,887 Manufacturing 4,807 3,872 8,679 5,669 4,253 9,922 5,853 4,181 10,034 Service industries and business activities - retail, wholesale and repairs 3,559 721 4,280 4,058 767 4,825 4,126 999 5,125 - transport and storage 5,281 1,093 6,374 5,330 970 6,300 5,625 1,369 6,994 - health, education and recreation 1,334 339 1,673 1,373 445 1,818 1,442 496 1,938 - hotels and restaurants 1,029 560 1,589 1,065 597 1,662 1,055 535 1,590 - utilities 1,852 598 2,450 1,536 654 2,190 1,412 623 2,035 - other 3,554 1,634 5,188 4,807 1,850 6,657 3,877 2,050 5,927 Agriculture, forestry and fishing 760 62 822 789 68 857 849 68 917 Finance leases and instalment credit 259 515 774 264 620 884 370 744 1,114 Interest accruals 105 98 203 135 98 233 143 101 244
53,276 25,066 78,342 57,169 26,769 83,938 55,655 27,932 83,587
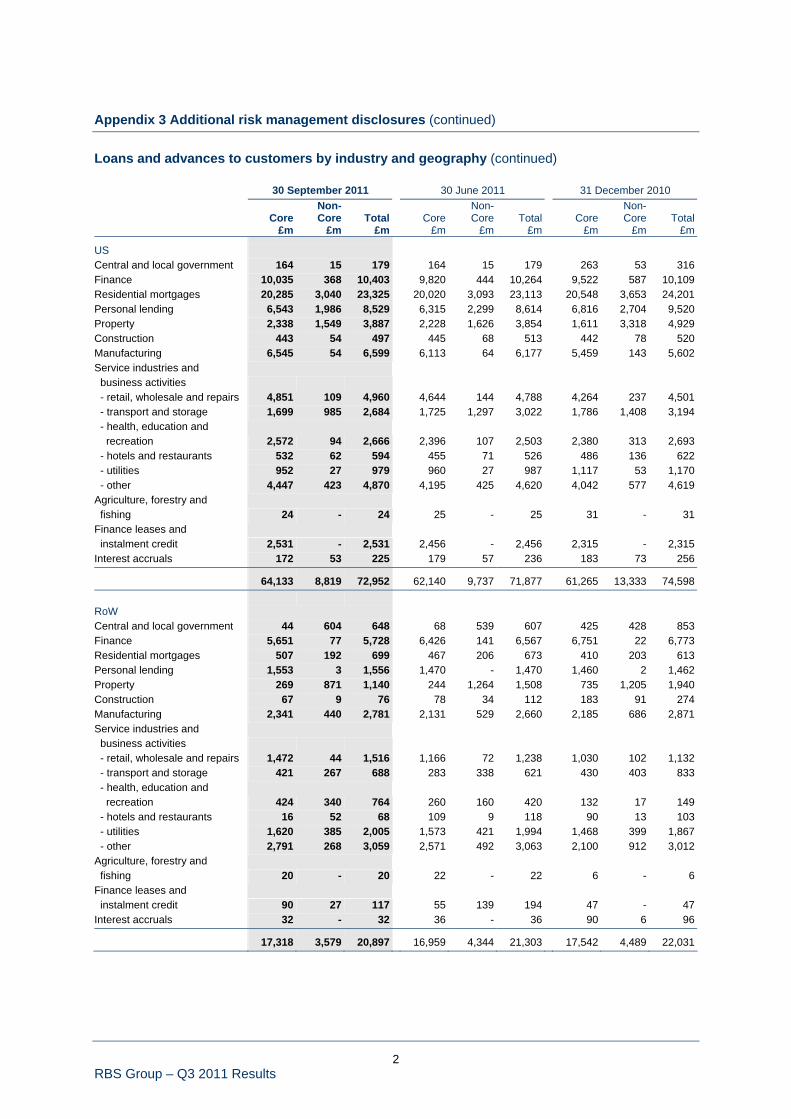
2 RBS Group – Q3 2011 Results
Appendix 3 Additional risk management disclosures (continued) Loans and advances to customers by industry and geography (continued) 30 September 2011 30 June 2011 31 December 2010
Core Non- Core Total Core
Non- Core Total Core
Non- Core Total
£m £m £m £m £m £m £m £m £m
US Central and local government 164 15 179 164 15 179 263 53 316 Finance 10,035 368 10,403 9,820 444 10,264 9,522 587 10,109 Residential mortgages 20,285 3,040 23,325 20,020 3,093 23,113 20,548 3,653 24,201 Personal lending 6,543 1,986 8,529 6,315 2,299 8,614 6,816 2,704 9,520 Property 2,338 1,549 3,887 2,228 1,626 3,854 1,611 3,318 4,929 Construction 443 54 497 445 68 513 442 78 520 Manufacturing 6,545 54 6,599 6,113 64 6,177 5,459 143 5,602 Service industries and business activities - retail, wholesale and repairs 4,851 109 4,960 4,644 144 4,788 4,264 237 4,501 - transport and storage 1,699 985 2,684 1,725 1,297 3,022 1,786 1,408 3,194 - health, education and recreation 2,572 94 2,666 2,396 107 2,503 2,380 313 2,693 - hotels and restaurants 532 62 594 455 71 526 486 136 622 - utilities 952 27 979 960 27 987 1,117 53 1,170 - other 4,447 423 4,870 4,195 425 4,620 4,042 577 4,619 Agriculture, forestry and fishing 24 - 24 25 - 25 31 - 31 Finance leases and instalment credit 2,531 - 2,531 2,456 - 2,456 2,315 - 2,315 Interest accruals 172 53 225 179 57 236 183 73 256
64,133 8,819 72,952 62,140 9,737 71,877 61,265 13,333 74,598 RoW Central and local government 44 604 648 68 539 607 425 428 853 Finance 5,651 77 5,728 6,426 141 6,567 6,751 22 6,773 Residential mortgages 507 192 699 467 206 673 410 203 613 Personal lending 1,553 3 1,556 1,470 - 1,470 1,460 2 1,462 Property 269 871 1,140 244 1,264 1,508 735 1,205 1,940 Construction 67 9 76 78 34 112 183 91 274 Manufacturing 2,341 440 2,781 2,131 529 2,660 2,185 686 2,871 Service industries and business activities - retail, wholesale and repairs 1,472 44 1,516 1,166 72 1,238 1,030 102 1,132 - transport and storage 421 267 688 283 338 621 430 403 833 - health, education and recreation 424 340 764 260 160 420 132 17 149 - hotels and restaurants 16 52 68 109 9 118 90 13 103 - utilities 1,620 385 2,005 1,573 421 1,994 1,468 399 1,867 - other 2,791 268 3,059 2,571 492 3,063 2,100 912 3,012 Agriculture, forestry and fishing 20 - 20 22 - 22 6 - 6 Finance leases and instalment credit 90 27 117 55 139 194 47 - 47 Interest accruals 32 - 32 36 - 36 90 6 96
17,318 3,579 20,897 16,959 4,344 21,303 17,542 4,489 22,031

3 RBS Group – Q3 2011 Results
Appendix 3 Additional risk management disclosures (continued) Loans, REIL and impairments by industry and geography The following tables analyse loans and advances to banks and customers (excluding reverse repos and assets of disposal groups) and related REIL, provisions, impairments and write-offs by industry and geography (by location of office), for the Group, Core and Non-Core.
30 September 2011
Gross loans
£m REIL
£m Provisions
£m
REIL as a %
of gross loans
%
Provisions as a %
of REIL %
Provisions as a %
of gross loans
%
YTD
Impairment charge
£m
YTD
Amounts written-off
£m
Group Central and local government 9,604 76 - 0.8 - - - - Finance - banks 52,727 149 126 0.3 85 0.2 - - - other 52,978 979 670 1.8 68 1.3 4 62 Residential mortgages 149,260 5,313 1,420 3.6 27 1.0 949 392 Personal lending 34,962 3,256 2,622 9.3 81 7.5 535 806 Property 84,700 22,354 8,831 26.4 40 10.4 2,936 731 Construction 11,054 1,753 740 15.9 42 6.7 32 168 Manufacturing 30,049 1,106 489 3.7 44 1.6 105 158 Service industries and business activities - retail, wholesale and repairs 24,634 1,094 555 4.4 51 2.3 135 93 - transport and storage 22,245 544 141 2.4 26 0.6 53 35 - health, education and recreation 17,739 1,197 401 6.7 34 2.3 176 72 - hotels and restaurants 9,199 1,574 701 17.1 45 7.6 266 54 - utilities 9,937 80 22 0.8 28 0.2 1 2 - other 29,223 2,239 1,162 7.7 52 4.0 690 311 Agriculture, forestry and fishing 3,902 151 59 3.9 39 1.5 (21) 11 Finance leases and instalment credit 15,871 861 517 5.4 60 3.3 81 125 Interest accruals 813 - - - - - - - Latent - - 2,267 - - - (355) -
558,897 42,726 20,723 7.6 49 3.7 5,587 3,020 of which: UK - residential mortgages 105,537 2,292 424 2.2 18 0.4 152 14 - personal lending 22,225 2,913 2,368 13.1 81 10.7 510 666 - property 62,059 8,373 2,799 13.5 33 4.5 1,063 421 - other 177,452 5,343 3,387 3.0 63 1.9 436 650 Europe - residential mortgages 19,699 2,248 722 11.4 32 3.7 445 7 - personal lending 2,652 210 178 7.9 85 6.7 (68) 20 - property 17,614 13,165 5,753 74.7 44 32.7 1,809 189 - other 51,977 5,188 3,146 10.0 61 6.1 938 195 US - residential mortgages 23,325 749 265 3.2 35 1.1 352 371 - personal lending 8,529 131 75 1.5 57 0.9 93 116 - property 3,887 377 119 9.7 32 3.1 (10) 87 - other 38,275 633 946 1.7 149 2.5 (175) 111 RoW - residential mortgages 699 24 9 3.4 38 1.3 - - - personal lending 1,556 2 1 0.1 50 0.1 - 4 - property 1,140 439 160 38.5 36 14.0 74 34 - other 22,271 639 371 2.9 58 1.7 (32) 135
558,897 42,726 20,723 7.6 49 3.7 5,587 3,020

4 RBS Group – Q3 2011 Results
Appendix 3 Additional risk management disclosures (continued) Loans, REIL and impairments by industry and geography (continued)
30 June 2011
Gross loans
£m REIL
£m Provisions
£m
REIL as a %
of gross loans
%
Provisions as a %of REIL
%
Provisions as a %
of gross loans
%
H1
Impairment charge
£m
H1
Amounts written-off
£m
Group Central and local government 8,081 - - - - - - - Finance - banks 53,264 155 133 0.3 86 0.2 - - - other 52,583 1,088 677 2.1 62 1.3 15 52 Residential mortgages 149,909 5,127 1,284 3.4 25 0.9 670 274 Personal lending 35,453 3,279 2,628 9.2 80 7.4 303 573 Property 87,401 21,953 8,911 25.1 41 10.2 2,395 415 Construction 11,595 1,757 694 15.2 39 6.0 (73) 118 Manufacturing 30,361 1,274 562 4.2 44 1.9 85 30 Service industries and business activities - retail, wholesale and repairs 24,721 1,074 536 4.3 50 2.2 80 66 - transport and storage 21,692 527 148 2.4 28 0.7 49 22 - health, education and recreation 18,254 1,202 413 6.6 34 2.3 146 37 - hotels and restaurants 9,480 1,611 663 17.0 41 7.0 195 43 - utilities 9,497 89 25 0.9 28 0.3 1 - - other 30,094 2,173 1,138 7.2 52 3.8 523 205 Agriculture, forestry and fishing 3,914 152 62 3.9 41 1.6 (27) 3 Finance leases and instalment credit 16,273 889 531 5.5 60 3.3 68 92 Interest accruals 891 - - - - - - - Latent - - 2,354 - - - (295) -
563,463 42,350 20,759 7.5 49 3.7 4,135 1,930 of which: UK - residential mortgages 105,259 2,222 407 2.1 18 0.4 124 12 - personal lending 22,563 2,927 2,395 13.0 82 10.6 336 461 - property 63,766 8,227 2,847 12.9 35 4.5 830 162 - other 178,726 5,735 3,424 3.2 60 1.9 239 439 Europe - residential mortgages 20,864 2,140 654 10.3 31 3.1 337 2 - personal lending 2,806 216 178 7.7 82 6.3 (80) 27 - property 18,273 13,018 5,826 71.2 45 31.9 1,570 170 - other 50,711 5,004 3,106 9.9 62 6.1 637 48 US - residential mortgages 23,113 740 214 3.2 29 0.9 209 260 - personal lending 8,614 134 53 1.6 40 0.6 47 82 - property 3,854 360 97 9.3 27 2.5 (46) 63 - other 36,908 610 1,053 1.7 173 2.9 (82) 40 RoW - residential mortgages 673 25 9 3.7 36 1.3 - - - personal lending 1,470 2 2 0.1 100 0.1 - 3 - property 1,508 348 141 23.1 41 9.4 41 20 - other 24,355 642 353 2.6 55 1.4 (27) 141
563,463 42,350 20,759 7.5 49 3.7 4,135 1,930

5 RBS Group – Q3 2011 Results
Appendix 3 Additional risk management disclosures (continued) Loans, REIL and impairments by industry and geography (continued)
31 December 2010
Gross loans
£m REIL
£m Provisions
£m
REIL as a %
of gross loans
%
Provisions as a % of REIL
%
Provisions as a %
of gross loans
%
FY
Impairment charge
£m
FY
Amounts written-off
£m
Group Central and local government 8,452 - - - - - - - Finance - banks 58,036 145 127 0.2 88 0.2 (13) 12 - other 54,561 1,129 595 2.1 53 1.1 198 141 Residential mortgages 146,501 4,276 877 2.9 21 0.6 1,014 669 Personal lending 37,472 3,544 2,894 9.5 82 7.7 1,370 1,577 Property 90,106 19,584 6,736 21.7 34 7.5 4,682 1,009 Construction 12,032 2,464 875 20.5 36 7.3 530 146 Manufacturing 32,317 1,199 503 3.7 42 1.6 (92) 1,547 Service industries and business activities - retail, wholesale and repairs 25,165 1,157 572 4.6 49 2.3 334 161 - transport and storage 24,141 248 118 1.0 48 0.5 87 39 - health, education and recreation 19,321 1,055 319 5.5 30 1.7 159 199 - hotels and restaurants 9,681 1,269 504 13.1 40 5.2 321 106 - utilities 9,208 91 23 1.0 25 0.2 14 7 - other 29,994 1,438 749 4.8 52 2.5 378 310 Agriculture, forestry and fishing 3,893 152 86 3.9 57 2.2 31 6 Finance leases and instalment credit 16,850 847 554 5.0 65 3.3 252 113 Interest accruals 1,109 - - - - - - - Latent - - 2,650 - - - (121) -
578,839 38,598 18,182 6.7 47 3.1 9,144 6,042 of which: UK - residential mortgages 101,593 2,062 314 2.0 15 0.3 169 17 - personal lending 23,620 3,083 2,518 13.1 82 10.7 1,046 1,153 - property 65,462 7,986 2,219 12.2 28 3.4 1,546 397 - other 191,934 5,652 3,580 2.9 63 1.9 1,197 704 Europe - residential mortgages 20,094 1,551 301 7.7 19 1.5 221 6 - personal lending 2,870 401 316 14.0 79 11.0 66 24 - property 17,775 10,534 4,199 59.3 40 23.6 2,828 210 - other 53,380 3,950 2,454 7.4 62 4.6 763 1,423 US - residential mortgages 24,201 640 253 2.6 40 1.0 615 645 - personal lending 9,520 55 55 0.6 100 0.6 160 271 - property 4,929 765 202 15.5 26 4.1 321 220 - other 36,780 870 1,133 2.4 130 3.1 (76) 524 RoW - residential mortgages 613 23 9 3.8 39 1.5 9 1 - personal lending 1,462 5 5 0.3 100 0.3 98 129 - property 1,940 299 116 15.4 39 6.0 (13) 182 - other 22,666 722 508 3.2 70 2.2 194 136
578,839 38,598 18,182 6.7 47 3.1 9,144 6,042

6 RBS Group – Q3 2011 Results
Appendix 3 Additional risk management disclosures (continued) Loans, REIL and impairments by industry and geography (continued)
30 September 2011
Gross loans
£m REIL
£m Provisions
£m
REIL as a %
of gross loans
%
Provisions as a % of REIL
%
Provisions as a %
of gross loans
%
YTD Impairment
charge £m
YTD
Amounts written-off
£m
Core Central and local government 8,097 - - - - - - - Finance - banks 52,018 138 125 0.3 91 0.2 - - - other 48,094 715 518 1.5 72 1.1 130 22 Residential mortgages 143,941 4,835 1,139 3.4 24 0.8 641 169 Personal lending 32,152 2,957 2,359 9.2 80 7.3 514 718 Property 44,072 4,314 1,035 9.8 24 2.3 293 122 Construction 7,992 741 259 9.3 35 3.2 136 122 Manufacturing 24,816 447 238 1.8 53 1.0 48 89 Service industries and business activities - retail, wholesale and repairs 22,207 685 328 3.1 48 1.5 126 68 - transport and storage 16,236 277 49 1.7 18 0.3 29 23 - health, education and recreation 16,224 633 188 3.9 30 1.2 89 39 - hotels and restaurants 7,841 982 359 12.5 37 4.6 150 29 - utilities 8,212 18 1 0.2 6 - (1) - - other 24,744 1,126 614 4.6 55 2.5 490 154 Agriculture, forestry and fishing 3,767 93 31 2.5 33 0.8 (22) 4 Finance leases and instalment credit 8,404 184 114 2.2 62 1.4 21 52 Interest accruals 661 - - - - - - - Latent - - 1,516 - - - (165) -
469,478 18,145 8,873 3.9 49 1.9 2,479 1,611 of which: UK - residential mortgages 104,040 2,236 413 2.1 18 0.4 146 13 - personal lending 21,930 2,716 2,185 12.4 80 10.0 498 658 - property 36,106 2,950 636 8.2 22 1.8 167 81 - other 153,683 2,968 1,811 1.9 61 1.2 379 421 Europe - residential mortgages 19,109 2,074 588 10.9 28 3.1 331 3 - personal lending 2,126 143 124 6.7 87 5.8 (15) 14 - property 5,359 1,193 320 22.3 27 6.0 89 1 - other 40,020 2,566 1,783 6.4 69 4.5 714 126 US - residential mortgages 20,285 502 129 2.5 26 0.6 164 153 - personal lending 6,543 96 49 1.5 51 0.7 31 42 - property 2,338 108 30 4.6 28 1.3 13 30 - other 36,016 329 583 0.9 177 1.6 (20) 52 RoW - residential mortgages 507 23 9 4.5 39 1.8 - - - personal lending 1,553 2 1 0.1 50 0.1 - 4 - property 269 63 49 23.4 78 18.2 24 10 - other 19,594 176 163 0.9 93 0.8 (42) 3
469,478 18,145 8,873 3.9 49 1.9 2,479 1,611

7 RBS Group – Q3 2011 Results
Appendix 3 Additional risk management disclosures (continued) Loans, REIL and impairments by industry and geography (continued)
30 June 2011
Gross loans
£m REIL
£m Provisions
£m
REIL as a %
of gross loans
%
Provisions as a %of REIL
%
Provisions as a %
of gross loans
%
H1
Impairment charge
£m
H1
Amounts written-off
£m
Core Central and local government 6,574 - - - - - - - Finance - banks 52,619 145 132 0.3 91 0.3 - - - other 47,545 777 531 1.6 68 1.1 130 18 Residential mortgages 144,400 4,629 1,000 3.2 22 0.7 422 118 Personal lending 32,224 2,968 2,380 9.2 80 7.4 320 502 Property 44,539 3,749 943 8.4 25 2.1 124 59 Construction 8,525 812 271 9.5 33 3.2 100 84 Manufacturing 24,068 546 259 2.3 47 1.1 21 22 Service industries and business activities - retail, wholesale and repairs 22,123 667 315 3.0 47 1.4 92 48 - transport and storage 15,243 247 45 1.6 18 0.3 23 19 - health, education and recreation 16,707 576 177 3.4 31 1.1 53 14 - hotels and restaurants 8,028 976 345 12.2 35 4.3 112 19 - utilities 7,487 20 - 0.3 - - (1) - - other 25,128 1,070 638 4.3 60 2.5 407 72 Agriculture, forestry and fishing 3,791 81 24 2.1 30 0.6 (29) 3 Finance leases and instalment credit 8,353 194 124 2.3 64 1.5 20 40 Interest accruals 715 - - - - - - - Latent - - 1,568 - - - (132) -
468,069 17,457 8,752 3.7 50 1.9 1,662 1,018 of which: UK - residential mortgages 103,689 2,168 397 2.1 18 0.4 119 11 - personal lending 22,205 2,723 2,210 12.3 81 10.0 326 458 - property 36,584 2,747 586 7.5 21 1.6 77 42 - other 153,718 3,078 1,814 2.0 59 1.2 231 293 Europe - residential mortgages 20,224 1,956 514 9.7 26 2.5 224 2 - personal lending 2,234 146 125 6.5 86 5.6 (23) 12 - property 5,483 826 281 15.1 34 5.1 37 - - other 37,702 2,576 1,829 6.8 71 4.9 568 15 US - residential mortgages 20,020 481 80 2.4 17 0.4 79 105 - personal lending 6,315 97 43 1.5 44 0.7 17 29 - property 2,228 127 38 5.7 30 1.7 10 17 - other 34,157 304 638 0.9 210 1.9 29 28 RoW - residential mortgages 467 24 9 5.1 38 1.9 - - - personal lending 1,470 2 2 0.1 100 0.1 - 3 - property 244 49 38 20.1 78 15.6 - - - other 21,329 153 148 0.7 97 0.7 (32) 3
468,069 17,457 8,752 3.7 50 1.9 1,662 1,018
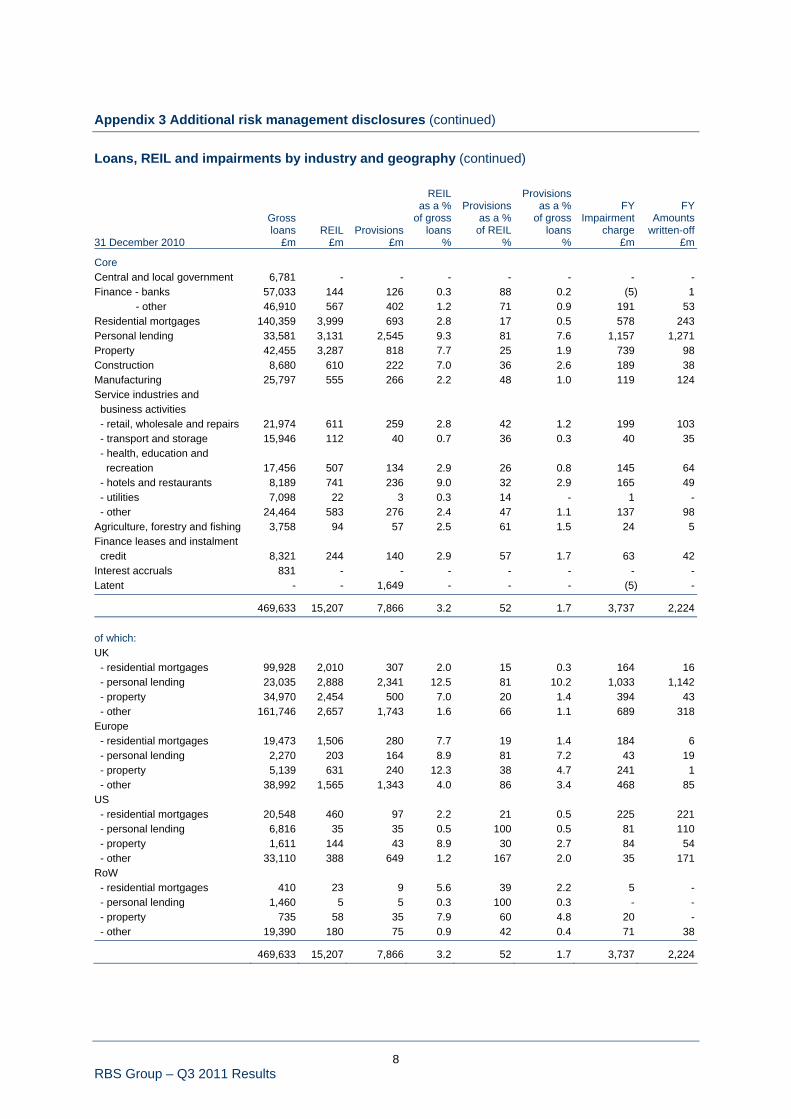
8 RBS Group – Q3 2011 Results
Appendix 3 Additional risk management disclosures (continued) Loans, REIL and impairments by industry and geography (continued)
31 December 2010
Gross loans
£m REIL
£m Provisions
£m
REIL as a %
of gross loans
%
Provisions as a %of REIL
%
Provisions as a %
of gross loans
%
FY Impairment
charge £m
FY
Amounts written-off
£m
Core Central and local government 6,781 - - - - - - - Finance - banks 57,033 144 126 0.3 88 0.2 (5) 1 - other 46,910 567 402 1.2 71 0.9 191 53 Residential mortgages 140,359 3,999 693 2.8 17 0.5 578 243 Personal lending 33,581 3,131 2,545 9.3 81 7.6 1,157 1,271 Property 42,455 3,287 818 7.7 25 1.9 739 98 Construction 8,680 610 222 7.0 36 2.6 189 38 Manufacturing 25,797 555 266 2.2 48 1.0 119 124 Service industries and business activities - retail, wholesale and repairs 21,974 611 259 2.8 42 1.2 199 103 - transport and storage 15,946 112 40 0.7 36 0.3 40 35 - health, education and recreation 17,456 507 134 2.9 26 0.8 145 64 - hotels and restaurants 8,189 741 236 9.0 32 2.9 165 49 - utilities 7,098 22 3 0.3 14 - 1 - - other 24,464 583 276 2.4 47 1.1 137 98 Agriculture, forestry and fishing 3,758 94 57 2.5 61 1.5 24 5 Finance leases and instalment credit 8,321 244 140 2.9 57 1.7 63 42 Interest accruals 831 - - - - - - - Latent - - 1,649 - - - (5) -
469,633 15,207 7,866 3.2 52 1.7 3,737 2,224 of which: UK - residential mortgages 99,928 2,010 307 2.0 15 0.3 164 16 - personal lending 23,035 2,888 2,341 12.5 81 10.2 1,033 1,142 - property 34,970 2,454 500 7.0 20 1.4 394 43 - other 161,746 2,657 1,743 1.6 66 1.1 689 318 Europe - residential mortgages 19,473 1,506 280 7.7 19 1.4 184 6 - personal lending 2,270 203 164 8.9 81 7.2 43 19 - property 5,139 631 240 12.3 38 4.7 241 1 - other 38,992 1,565 1,343 4.0 86 3.4 468 85 US - residential mortgages 20,548 460 97 2.2 21 0.5 225 221 - personal lending 6,816 35 35 0.5 100 0.5 81 110 - property 1,611 144 43 8.9 30 2.7 84 54 - other 33,110 388 649 1.2 167 2.0 35 171 RoW - residential mortgages 410 23 9 5.6 39 2.2 5 - - personal lending 1,460 5 5 0.3 100 0.3 - - - property 735 58 35 7.9 60 4.8 20 - - other 19,390 180 75 0.9 42 0.4 71 38
469,633 15,207 7,866 3.2 52 1.7 3,737 2,224

9 RBS Group – Q3 2011 Results
Appendix 3 Additional risk management disclosures (continued) Loans, REIL and impairments by industry and geography (continued)
30 September 2011
Gross loans
£m REIL
£m Provisions
£m
REIL as a %
of gross loans
%
Provisions as a % of REIL
%
Provisions as a %
of gross loans
%
YTD Impairment
charge £m
YTD
Amounts written-off
£m
Non-Core Central and local government 1,507 76 - 5.0 - - - - Finance - banks 709 11 1 1.6 9 0.1 - - - other 4,884 264 152 5.4 58 3.1 (126) 40 Residential mortgages 5,319 478 281 9.0 59 5.3 308 223 Personal lending 2,810 299 263 10.6 88 9.4 21 88 Property 40,628 18,040 7,796 44.4 43 19.2 2,643 609 Construction 3,062 1,012 481 33.1 48 15.7 (104) 46 Manufacturing 5,233 659 251 12.6 38 4.8 57 69 Service industries and business activities - retail, wholesale and repairs 2,427 409 227 16.9 56 9.4 9 25 - transport and storage 6,009 267 92 4.4 34 1.5 24 12 - health, education and recreation 1,515 564 213 37.2 38 14.1 87 33 - hotels and restaurants 1,358 592 342 43.6 58 25.2 116 25 - utilities 1,725 62 21 3.6 34 1.2 2 2 - other 4,479 1,113 548 24.8 49 12.2 200 157 Agriculture, forestry and fishing 135 58 28 43.0 48 20.7 1 7 Finance leases and instalment credit 7,467 677 403 9.1 60 5.4 60 73 Interest accruals 152 - - - - - - - Latent - - 751 - - - (190) -
89,419 24,581 11,850 27.5 48 13.3 3,108 1,409 of which: UK - residential mortgages 1,497 56 11 3.7 20 0.7 6 1 - personal lending 295 197 183 66.8 93 62.0 12 8 - property 25,953 5,423 2,163 20.9 40 8.3 896 340 - other 23,769 2,375 1,576 10.0 66 6.6 57 229 Europe - residential mortgages 590 174 134 29.5 77 22.7 114 4 - personal lending 526 67 54 12.7 81 10.3 (53) 6 - property 12,255 11,972 5,433 97.7 45 44.3 1,720 188 - other 11,957 2,622 1,363 21.9 52 11.4 224 69 US - residential mortgages 3,040 247 136 8.1 55 4.5 188 218 - personal lending 1,986 35 26 1.8 74 1.3 62 74 - property 1,549 269 89 17.4 33 5.7 (23) 57 - other 2,259 304 363 13.5 119 16.1 (155) 59 RoW - residential mortgages 192 1 - 0.5 - - - - - personal lending 3 - - - - - - - - property 871 376 111 43.2 30 12.7 50 24 - other 2,677 463 208 17.3 45 7.8 10 132
89,419 24,581 11,850 27.5 48 13.3 3,108 1,409

10 RBS Group – Q3 2011 Results
Appendix 3 Additional risk management disclosures (continued) Loans, REIL and impairments by industry and geography (continued)
30 June 2011
Gross loans
£m REIL
£m Provisions
£m
REIL as a %
of gross loans
%
Provisions as a %of REIL
%
Provisions as a %
of gross loans
%
H1
Impairment charge
£m
H1 Amounts
written-off £m
Non-Core Central and local government 1,507 - - - - - - - Finance - banks 645 10 1 1.6 10 0.2 - - - other 5,038 311 146 6.2 47 2.9 (115) 34 Residential mortgages 5,509 498 284 9.0 57 5.2 248 156 Personal lending 3,229 311 248 9.6 80 7.7 (17) 71 Property 42,862 18,204 7,968 42.5 44 18.6 2,271 356 Construction 3,070 945 423 30.8 45 13.8 (173) 34 Manufacturing 6,293 728 303 11.6 42 4.8 64 8 Service industries and business activities - retail, wholesale and repairs 2,598 407 221 15.7 54 8.5 (12) 18 - transport and storage 6,449 280 103 4.3 37 1.6 26 3 - health, education and recreation 1,547 626 236 40.5 38 15.3 93 23 - hotels and restaurants 1,452 635 318 43.7 50 21.9 83 24 - utilities 2,010 69 25 3.4 36 1.2 2 - - other 4,966 1,103 500 22.2 45 10.1 116 133 Agriculture, forestry and fishing 123 71 38 57.7 54 30.9 2 - Finance leases and instalment credit 7,920 695 407 8.8 59 5.1 48 52 Interest accruals 176 - - - - - - - Latent - - 786 - - - (163) -
95,394 24,893 12,007 26.1 48 12.6 2,473 912 of which: UK - residential mortgages 1,570 54 10 3.4 19 0.6 5 1 - personal lending 358 204 185 57.0 91 51.7 10 3 - property 27,182 5,480 2,261 20.2 41 8.3 753 120 - other 25,008 2,657 1,610 10.6 61 6.4 8 146 Europe - residential mortgages 640 184 140 28.8 76 21.9 113 - - personal lending 572 70 53 12.2 76 9.3 (57) 15 - property 12,790 12,192 5,545 95.3 45 43.4 1,533 170 - other 13,009 2,428 1,277 18.7 53 9.8 69 33 US - residential mortgages 3,093 259 134 8.4 52 4.3 130 155 - personal lending 2,299 37 10 1.6 27 0.4 30 53 - property 1,626 233 59 14.3 25 3.6 (56) 46 - other 2,751 306 415 11.1 136 15.1 (111) 12 RoW - residential mortgages 206 1 - 0.5 - - - - - personal lending - - - - - - - - - property 1,264 299 103 23.7 34 8.1 41 20 - other 3,026 489 205 16.2 42 6.8 5 138
95,394 24,893 12,007 26.1 48 12.6 2,473 912
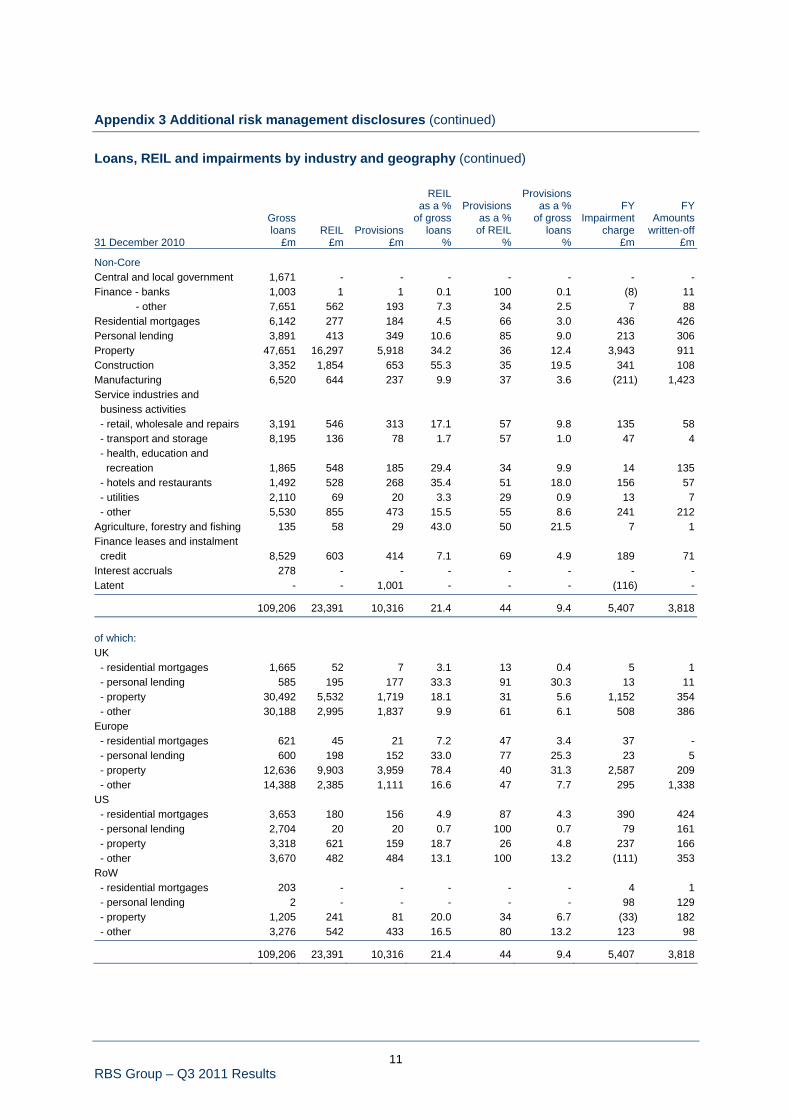
11 RBS Group – Q3 2011 Results
Appendix 3 Additional risk management disclosures (continued) Loans, REIL and impairments by industry and geography (continued)
31 December 2010
Gross loans
£m REIL
£m Provisions
£m
REIL as a %
of gross loans
%
Provisions as a %of REIL
%
Provisions as a %
of gross loans
%
FY
Impairment charge
£m
FY
Amounts written-off
£m
Non-Core Central and local government 1,671 - - - - - - - Finance - banks 1,003 1 1 0.1 100 0.1 (8) 11 - other 7,651 562 193 7.3 34 2.5 7 88 Residential mortgages 6,142 277 184 4.5 66 3.0 436 426 Personal lending 3,891 413 349 10.6 85 9.0 213 306 Property 47,651 16,297 5,918 34.2 36 12.4 3,943 911 Construction 3,352 1,854 653 55.3 35 19.5 341 108 Manufacturing 6,520 644 237 9.9 37 3.6 (211) 1,423 Service industries and business activities - retail, wholesale and repairs 3,191 546 313 17.1 57 9.8 135 58 - transport and storage 8,195 136 78 1.7 57 1.0 47 4 - health, education and recreation 1,865 548 185 29.4 34 9.9 14 135 - hotels and restaurants 1,492 528 268 35.4 51 18.0 156 57 - utilities 2,110 69 20 3.3 29 0.9 13 7 - other 5,530 855 473 15.5 55 8.6 241 212 Agriculture, forestry and fishing 135 58 29 43.0 50 21.5 7 1 Finance leases and instalment credit 8,529 603 414 7.1 69 4.9 189 71 Interest accruals 278 - - - - - - - Latent - - 1,001 - - - (116) -
109,206 23,391 10,316 21.4 44 9.4 5,407 3,818 of which: UK - residential mortgages 1,665 52 7 3.1 13 0.4 5 1 - personal lending 585 195 177 33.3 91 30.3 13 11 - property 30,492 5,532 1,719 18.1 31 5.6 1,152 354 - other 30,188 2,995 1,837 9.9 61 6.1 508 386 Europe - residential mortgages 621 45 21 7.2 47 3.4 37 - - personal lending 600 198 152 33.0 77 25.3 23 5 - property 12,636 9,903 3,959 78.4 40 31.3 2,587 209 - other 14,388 2,385 1,111 16.6 47 7.7 295 1,338 US - residential mortgages 3,653 180 156 4.9 87 4.3 390 424 - personal lending 2,704 20 20 0.7 100 0.7 79 161 - property 3,318 621 159 18.7 26 4.8 237 166 - other 3,670 482 484 13.1 100 13.2 (111) 353 RoW - residential mortgages 203 - - - - - 4 1 - personal lending 2 - - - - - 98 129 - property 1,205 241 81 20.0 34 6.7 (33) 182 - other 3,276 542 433 16.5 80 13.2 123 98
109,206 23,391 10,316 21.4 44 9.4 5,407 3,818

12 RBS Group – Q3 2011 Results
Appendix 3 Additional risk management disclosures (continued) Loans, REIL and impairments by division The following tables analyse loans and advances to banks and customers (excluding reverse repos and assets of disposal groups) and related REIL, provisions, impairments, write-offs and coverage ratios by division.
Gross loans REIL Provisions
REIL as a %
of gross loans
Provisions as a %
of REIL
YTD Impairment
charge
YTD Amounts
written-off 30 September 2011 £m £m £m % % £m £m
UK Retail 110,520 4,651 2,661 4.2 57 597 658 UK Corporate 110,047 4,904 1,961 4.5 40 549 498 Wealth 19,363 198 71 1.0 36 13 8 Global Transaction Services 23,252 240 201 1.0 84 119 66 Ulster Bank 38,337 5,556 2,567 14.5 46 1,057 63 US Retail & Commercial 49,663 955 469 1.9 49 193 267
Retail & Commercial 351,182 16,504 7,930 4.7 48 2,528 1,560 Global Banking & Markets 109,821 1,641 943 1.5 57 (49) 51 RBS Insurance and other 8,475 - - - - - -
Core 469,478 18,145 8,873 3.9 49 2,479 1,611 Non-Core 89,419 24,581 11,850 27.5 48 3,108 1,409
558,897 42,726 20,723 7.6 49 5,587 3,020 30 June 2011
UK Retail 110,770 4,622 2,672 4.2 58 402 457 UK Corporate 110,893 4,761 1,902 4.3 40 322 332 Wealth 19,626 185 69 0.9 37 8 6 Global Transaction Services 23,074 309 216 1.3 70 74 11 Ulster Bank 39,450 5,116 2,401 13.0 47 730 21 US Retail & Commercial 48,020 929 484 1.9 52 139 170
Retail & Commercial 351,833 15,922 7,744 4.5 49 1,675 997 Global Banking & Markets 112,310 1,535 1,008 1.4 66 (13) 21 RBS Insurance and other 3,926 - - - - - -
Core 468,069 17,457 8,752 3.7 50 1,662 1,018 Non-Core 95,394 24,893 12,007 26.1 48 2,473 912
563,463 42,350 20,759 7.5 49 4,135 1,930 31 December 2010
UK Retail 108,813 4,620 2,741 4.2 59 1,160 1,135 UK Corporate 111,744 3,967 1,732 3.6 44 761 349 Wealth 18,350 223 66 1.2 30 18 9 Global Transaction Services 17,484 146 147 0.8 101 8 49 Ulster Bank 39,786 3,619 1,633 9.1 45 1,161 48 US Retail & Commercial 48,661 913 505 1.9 55 483 547
Retail & Commercial 344,838 13,488 6,824 3.9 51 3,591 2,137 Global Banking & Markets 122,054 1,719 1,042 1.4 61 146 87 RBS Insurance and other 2,741 - - - - - -
Core 469,633 15,207 7,866 3.2 52 3,737 2,224 Non-Core 109,206 23,391 10,316 21.4 44 5,407 3,818
578,839 38,598 18,182 6.7 47 9,144 6,042
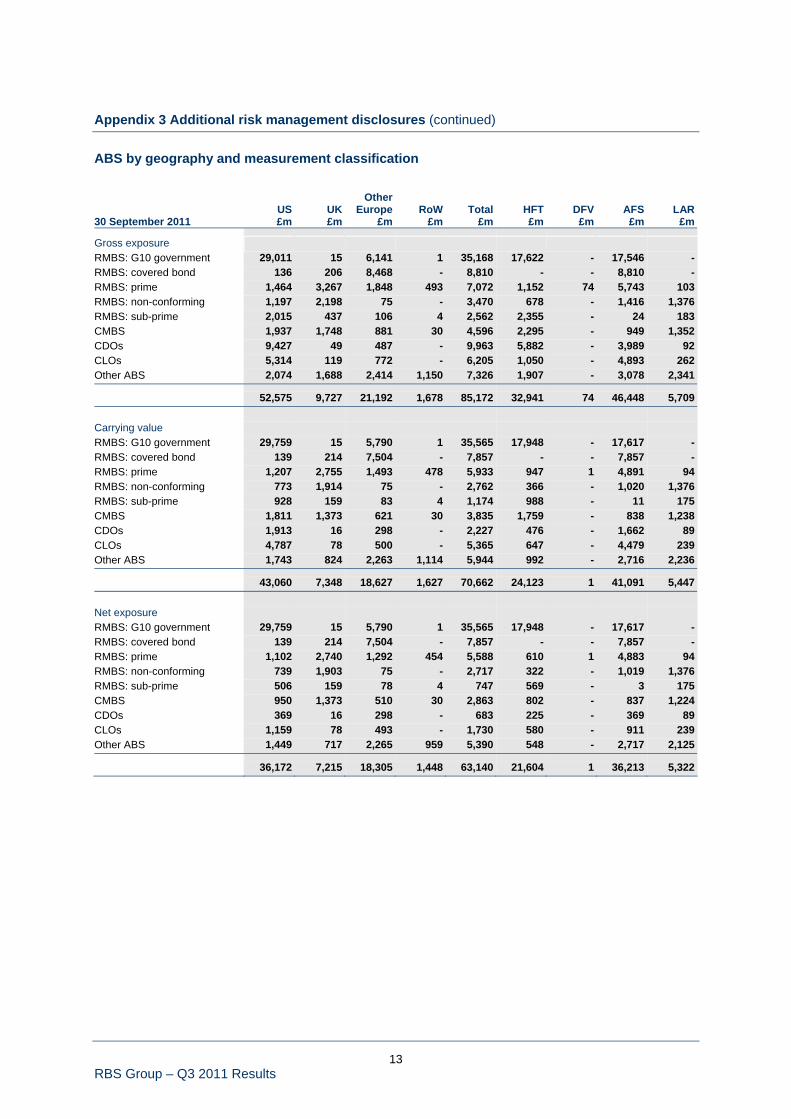
13 RBS Group – Q3 2011 Results
Appendix 3 Additional risk management disclosures (continued) ABS by geography and measurement classification
US UK Other
Europe RoW Total HFT DFV AFS LAR 30 September 2011 £m £m £m £m £m £m £m £m £m
Gross exposure RMBS: G10 government 29,011 15 6,141 1 35,168 17,622 - 17,546 - RMBS: covered bond 136 206 8,468 - 8,810 - - 8,810 - RMBS: prime 1,464 3,267 1,848 493 7,072 1,152 74 5,743 103 RMBS: non-conforming 1,197 2,198 75 - 3,470 678 - 1,416 1,376 RMBS: sub-prime 2,015 437 106 4 2,562 2,355 - 24 183 CMBS 1,937 1,748 881 30 4,596 2,295 - 949 1,352 CDOs 9,427 49 487 - 9,963 5,882 - 3,989 92 CLOs 5,314 119 772 - 6,205 1,050 - 4,893 262 Other ABS 2,074 1,688 2,414 1,150 7,326 1,907 - 3,078 2,341
52,575 9,727 21,192 1,678 85,172 32,941 74 46,448 5,709 Carrying value RMBS: G10 government 29,759 15 5,790 1 35,565 17,948 - 17,617 - RMBS: covered bond 139 214 7,504 - 7,857 - - 7,857 - RMBS: prime 1,207 2,755 1,493 478 5,933 947 1 4,891 94 RMBS: non-conforming 773 1,914 75 - 2,762 366 - 1,020 1,376 RMBS: sub-prime 928 159 83 4 1,174 988 - 11 175 CMBS 1,811 1,373 621 30 3,835 1,759 - 838 1,238 CDOs 1,913 16 298 - 2,227 476 - 1,662 89 CLOs 4,787 78 500 - 5,365 647 - 4,479 239 Other ABS 1,743 824 2,263 1,114 5,944 992 - 2,716 2,236
43,060 7,348 18,627 1,627 70,662 24,123 1 41,091 5,447 Net exposure RMBS: G10 government 29,759 15 5,790 1 35,565 17,948 - 17,617 - RMBS: covered bond 139 214 7,504 - 7,857 - - 7,857 - RMBS: prime 1,102 2,740 1,292 454 5,588 610 1 4,883 94 RMBS: non-conforming 739 1,903 75 - 2,717 322 - 1,019 1,376 RMBS: sub-prime 506 159 78 4 747 569 - 3 175 CMBS 950 1,373 510 30 2,863 802 - 837 1,224 CDOs 369 16 298 - 683 225 - 369 89 CLOs 1,159 78 493 - 1,730 580 - 911 239 Other ABS 1,449 717 2,265 959 5,390 548 - 2,717 2,125
36,172 7,215 18,305 1,448 63,140 21,604 1 36,213 5,322

14 RBS Group – Q3 2011 Results
Appendix 3 Additional risk management disclosures (continued) ABS by geography and measurement classification (continued)
US UK Other
Europe RoW Total HFT DFV AFS LAR 31 December 2010 £m £m £m £m £m £m £m £m £m
Gross exposure RMBS: G10 government 24,207 16 6,422 - 30,645 13,840 - 16,805 - RMBS: covered bond 138 208 8,525 - 8,871 - - 8,871 - RMBS: prime 1,784 3,385 1,118 192 6,479 1,605 1 4,749 124 RMBS: non-conforming 1,249 2,107 92 - 3,448 708 - 1,313 1,427 RMBS: sub-prime 792 365 139 221 1,517 819 - 496 202 CMBS 3,086 1,451 912 45 5,494 2,646 120 1,409 1,319 CDOs 12,156 128 453 - 12,737 7,951 - 4,687 99 CLOs 6,038 134 879 9 7,060 1,062 - 5,572 426 Other ABS 3,104 1,144 2,871 1,705 8,824 1,533 - 4,523 2,768
52,554 8,938 21,411 2,172 85,075 30,164 121 48,425 6,365 Carrying value RMBS: G10 government 24,390 16 5,958 - 30,364 13,765 - 16,599 - RMBS: covered bond 142 208 7,522 - 7,872 - - 7,872 - RMBS: prime 1,624 3,000 931 192 5,747 1,384 1 4,249 113 RMBS: non-conforming 1,084 1,959 92 - 3,135 605 - 1,102 1,428 RMBS: sub-prime 638 255 120 205 1,218 681 - 344 193 CMBS 2,936 1,338 638 38 4,950 2,262 118 1,281 1,289 CDOs 3,135 69 254 - 3,458 1,341 - 2,021 96 CLOs 5,334 102 635 3 6,074 691 - 4,958 425 Other ABS 2,780 945 2,615 1,667 8,007 1,259 - 4,089 2,659
42,063 7,892 18,765 2,105 70,825 21,988 119 42,515 6,203 Net exposure RMBS: G10 government 24,390 16 5,958 - 30,364 13,765 - 16,599 - RMBS: covered bond 142 208 7,522 - 7,872 - - 7,872 - RMBS: prime 1,523 2,948 596 192 5,259 897 1 4,248 113 RMBS: non-conforming 1,081 1,959 92 - 3,132 602 - 1,102 1,428 RMBS: sub-prime 289 253 112 176 830 305 - 332 193 CMBS 1,823 1,336 458 38 3,655 1,188 10 1,230 1,227 CDOs 1,085 39 245 - 1,369 743 - 530 96 CLOs 1,387 102 629 1 2,119 673 - 1,021 425 Other ABS 2,293 748 2,609 1,659 7,309 690 - 4,081 2,538
34,013 7,609 18,221 2,066 61,909 18,863 11 37,015 6,020


RBS Group – Q3 2011 Results
Appendix 4
Asset Protection Scheme

1 RBS Group – Q3 2011 Results
Appendix 4 Asset Protection Scheme Covered assets roll forward The table below shows the movement in covered assets.
Covered amount
£bn
At 31 December 2010 194.7 Disposals (2.9)Maturities, amortisation and early repayments (24.3)Effect of foreign currency movements and other adjustments 0.2
At 30 June 2011 167.7 Disposals (1.2)Maturities, amortisation and early repayments (8.9)Effect of foreign currency movements and other adjustments (1.8)
At 30 September 2011 155.8 Key points • The covered amount has reduced by £126 billion since the Scheme inception (December 2008)
from £282 billion to £156 billion and by £39 billion in the nine months ended 30 September2011.
• The Group continues to take advantage of market conditions and execute sales from a numberof its portfolios.
Credit impairments and write-downs The table below analyses the credit impairment provision (adjusted for write-offs) and adjustments to par value (including available-for-sale reserves) relating to the covered assets.
30 September
2011 30 June
2011 31 December
2010 £m £m £m
Loans and advances 20,407 19,777 18,033 Debt securities 11,079 10,785 11,747 Derivatives 3,023 2,125 2,043
34,509 32,687 31,823
By division: UK Retail 3,202 3,124 2,964 UK Corporate 2,102 1,838 1,382 Ulster Bank 1,231 1,190 804
Retail & Commercial 6,535 6,152 5,150 Global Banking & Markets 1,526 1,420 1,496
Core 8,061 7,572 6,646 Non-Core 26,448 25,115 25,177
34,509 32,687 31,823
Key point • Cumulative credit impairments and write-downs increased by £1.8 billion in the quarter to
£34.5 billion.
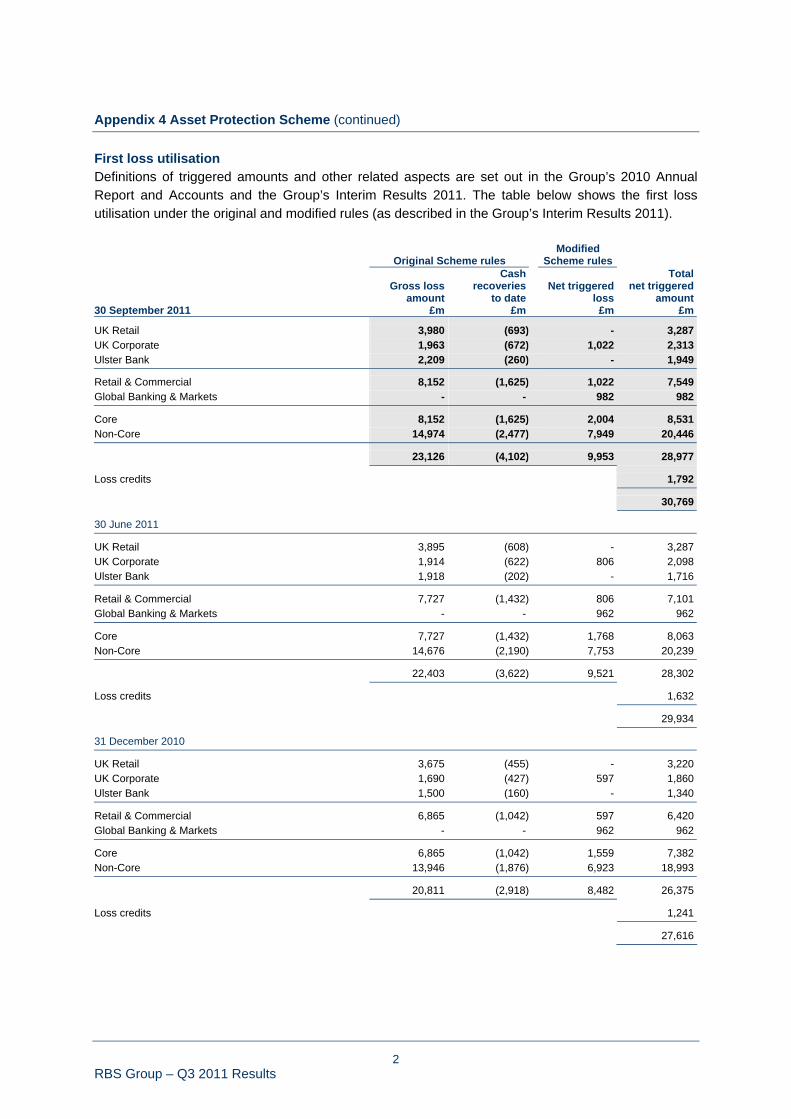
2 RBS Group – Q3 2011 Results
Appendix 4 Asset Protection Scheme (continued) First loss utilisation Definitions of triggered amounts and other related aspects are set out in the Group’s 2010 Annual Report and Accounts and the Group’s Interim Results 2011. The table below shows the first loss utilisation under the original and modified rules (as described in the Group’s Interim Results 2011).
Original Scheme rules Modified
Scheme rules
Gross loss
amount
Cash recoveries
to date Net triggered
loss
Total net triggered
amount 30 September 2011 £m £m £m £m
UK Retail 3,980 (693) - 3,287 UK Corporate 1,963 (672) 1,022 2,313 Ulster Bank 2,209 (260) - 1,949
Retail & Commercial 8,152 (1,625) 1,022 7,549 Global Banking & Markets - - 982 982
Core 8,152 (1,625) 2,004 8,531 Non-Core 14,974 (2,477) 7,949 20,446
23,126 (4,102) 9,953 28,977
Loss credits 1,792
30,769
30 June 2011
UK Retail 3,895 (608) - 3,287 UK Corporate 1,914 (622) 806 2,098 Ulster Bank 1,918 (202) - 1,716
Retail & Commercial 7,727 (1,432) 806 7,101 Global Banking & Markets - - 962 962
Core 7,727 (1,432) 1,768 8,063 Non-Core 14,676 (2,190) 7,753 20,239
22,403 (3,622) 9,521 28,302
Loss credits 1,632
29,934
31 December 2010
UK Retail 3,675 (455) - 3,220 UK Corporate 1,690 (427) 597 1,860 Ulster Bank 1,500 (160) - 1,340
Retail & Commercial 6,865 (1,042) 597 6,420 Global Banking & Markets - - 962 962
Core 6,865 (1,042) 1,559 7,382 Non-Core 13,946 (1,876) 6,923 18,993
20,811 (2,918) 8,482 26,375
Loss credits 1,241
27,616

3 RBS Group – Q3 2011 Results
Appendix 4 Asset Protection Scheme (continued) First loss utilisation (continued) Key points • The cumulative first loss is £30.8 billion. However, the Group does not expect to claim under the
Scheme, which has a first loss of £60 billion.
• In Q3 2011 the Group received loss credits of £0.2 billion in relation to disposals.
• The Group now expects an average recovery rate of approximately 40% across all portfolios,reflecting a slight deterioration in credit metrics, including impairments.
Risk-weighted assets The table below analyses by division, risk-weighted assets (RWAs) covered by APS.
30 September
2011 30 June
2011 31 December
2010 £bn £bn £bn
UK Retail 9.9 10.7 12.4 UK Corporate 16.9 19.3 22.9 Ulster Bank 6.7 7.6 7.9
Retail & Commercial 33.5 37.6 43.2 Global Banking & Markets 10.4 10.3 11.5
Core 43.9 47.9 54.7 Non-Core 44.7 47.3 50.9
APS RWAs 88.6 95.2 105.6 Key point • The decrease of £6.6 billion in RWAs covered by the Scheme reflects pool movements, assets
moving into default and changes in risk parameters.

1 RBS Group – Q3 2011 Results
Glossary of terms Alt-A (Alternative A-paper) are mortgage loans with a higher credit quality than sub-prime loans but with features that disqualify the borrower from a traditional prime loan. Alt-A lending characteristics include limited documentation; high loan-to-value ratio; secured on non-owner occupied properties; and debt-to-income ratio above normal limits. Arrears are the aggregate of contractual payments due on a debt that have not been met by the borrower. A loan or other financial asset is said to be 'in arrears' when payments have not been made. Asset-backed commercial paper (ABCP) - a form of asset-backed security generally issued by a commercial paper conduit. Asset-backed securities (ABS) are securities that represent interests in specific portfolios of assets. They are issued by a special purpose entity following a securitisation. The underlying portfolios commonly comprise residential or commercial mortgages but can include any class of asset that yields predictable cash flows. Payments on the securities depend primarily on the cash flows generated by the assets in the underlying pool and other rights designed to assure timely payment, such as guarantees or other credit enhancements. Collateralised bond obligations, collateralised debt obligations, collateralised loan obligations, commercial mortgage backed securities and residential mortgage backed securities are all types of ABS. Asset Protection Scheme credit default swap - in 2009, the Group became party to the Asset Protection Scheme under which it purchased credit protection over a portfolio of specified assets and exposures (covered assets) from Her Majesty’s Treasury acting on behalf of the UK Government. The contract is accounted for as a derivative financial instrument. It is recognised at fair value and included in Derivatives on the balance sheet. Changes in its fair value are recognised in profit or loss within Income from trading activities. Assets under management are assets managed by the Group on behalf of clients. Certificate of deposit (CD) - CDs are bearer negotiable instruments acknowledging the receipt of a fixed term deposit at a specified interest rate. Collateralised bond obligations (CBOs) are asset-backed securities for which the underlying asset portfolios are bonds, some of which may be sub-investment grade. Collateralised debt obligations (CDOs) are asset-backed securities for which the underlying asset portfolios are debt obligations: either bonds (collateralised bond obligations) or loans (collateralised loan obligations) or both. The credit exposure underlying synthetic CDOs derives from credit default swaps. The CDOs issued by an individual vehicle are usually divided in different tranches: senior tranches (rated AAA), mezzanine tranches (AA to BB), and equity tranches (unrated). Losses are borne first by the equity securities, next by the junior securities, and finally by the senior securities; junior tranches offer higher coupons (interest payments) to compensate for their increased risk. Collateralised loan obligations (CLOs) are asset-backed securities for which the underlying asset portfolios are loans, often leveraged loans.

2 RBS Group – Q3 2011 Results
Glossary of terms (continued) Collectively assessed loan impairment provisions - impairment loss provisions in respect of impaired loans, such as credit cards or personal loans, that are below individual assessment thresholds. Such provisions are established on a portfolio basis, taking account of the level of arrears, security, past loss experience, credit scores and defaults based on portfolio trends. Commercial mortgage backed securities (CMBS) are asset-backed securities for which the underlying asset portfolios are loans secured on commercial real estate. Commercial paper (CP) comprises unsecured obligations issued by a corporate or a bank directly or secured obligations (asset-backed CP), often issued through a commercial paper conduit, to fund working capital. Maturities typically range from 2 to 270 days. However, the depth and reliability of some CP markets means that issuers can repeatedly roll over CP issuance and effectively achieve longer term funding. Commercial paper is issued in a wide range of denominations and can be either discounted or interest-bearing. Commercial real estate - freehold and leasehold properties used for business activities. Commercial real estate includes office buildings, industrial property, medical centres, hotels, retail stores, shopping centres, agricultural land and buildings, warehouses, garages etc. Contractual maturity is the date in the terms of a financial instrument on which the last payment or receipt under the contract is due for settlement. Core Tier 1 capital - called-up share capital and eligible reserves plus equity non-controlling interests, less intangible assets and other regulatory deductions. Core Tier 1 capital ratio - core Tier 1 capital as a percentage of risk-weighted assets. Cost:income ratio - operating expenses as a percentage of total income. Covered mortgage bonds are debt securities backed by a portfolio of mortgages that is segregated from the issuer's other assets solely for the benefit of the holders of the covered bonds Credit default swap (CDS) is a contract where the protection seller receives premium or interest-related payments in return for contracting to make payments to the protection buyer upon a defined credit event in relation to a reference financial asset or portfolio of financial assets. Credit events usually include bankruptcy, payment default and rating downgrades. Credit derivative product company (CDPC) is a special purpose entity that sells credit protection under credit default swaps or certain approved forms of insurance policies. Sometimes they can also buy credit protection. CDPCs are similar to monoline insurers. However, unlike monoline insurers, they are not regulated as insurers.

3 RBS Group – Q3 2011 Results
Glossary of terms (continued) Credit derivatives are contractual agreements that provide protection against a credit event on one or more reference entities or financial assets. The nature of a credit event is established by the protection buyer and protection seller at the inception of a transaction, and such events include bankruptcy, insolvency or failure to meet payment obligations when due. The buyer of the credit derivative pays a periodic fee in return for a payment by the protection seller upon the occurrence, if any, of a credit event. Credit derivatives include credit default swaps, total return swaps and credit swap options. Credit risk assets - loans and advances (including overdraft facilities), instalment credit, finance lease receivables and other traded instruments across all customer types. Credit risk spread - is the difference between the coupon on a debt instrument and the benchmark or the risk-free interest rate for the instrument's maturity structure. It is the premium over the risk-free rate required by the market for the credit quality of an individual debt instrument. Credit valuation adjustments - are adjustments to the fair values of derivative assets to reflect the creditworthiness of the counterparty. Currency swap - an arrangement in which two parties exchange specific principal amounts of different currencies at inception and subsequently interest payments on the principal amounts. Often, one party will pay a fixed interest rate, while the other will pay a floating rate (though there are also fixed-fixed and floating-floating arrangements). At the maturity of the swap, the principal amounts are usually re-exchanged. Customer accounts - comprise money deposited with the Group by counterparties other than banks and classified as liabilities. They include demand, savings and time deposits; securities sold under repurchase agreements; and other short-term deposits. Deposits received from banks are classified as deposits by banks. Debt restructuring - see Renegotiated loans. Debt securities are transferable instruments creating or acknowledging indebtedness. They include debentures, bonds, certificates of deposit, notes and commercial paper. The holder of a debt security is typically entitled to the payment of principal and interest, together with other contractual rights under the terms of the issue, such as the right to receive certain information. Debt securities are generally issued for a fixed term and redeemable by the issuer at the end of that term. Debt securities can be secured or unsecured. Debt securities in issue comprise unsubordinated debt securities issued by the Group. They include commercial paper, certificates of deposit, bonds and medium-term notes. Deferred tax asset - income taxes recoverable in future periods as a result of deductible temporary differences - temporary differences between the accounting and tax base of an asset or liability that will result in tax deductible amounts in future periods - and the carry-forward of tax losses and unused tax credits.

4 RBS Group – Q3 2011 Results
Glossary of terms (continued) Deferred tax liability - income taxes payable in future periods as a result of taxable temporary differences (temporary differences between the accounting and tax base of an asset or liability that will result in taxable amounts in future periods). Defined benefit obligation - the present value of expected future payments required to settle the obligations of a defined benefit plan resulting from employee service. Defined benefit plan - pension or other post-retirement benefit plan other than a defined contribution plan. Delinquency - a debt or other financial obligation is considered delinquent when one or more contractual payments are overdue. Delinquency is usually defined in terms of days past due. Delinquent and in arrears are synonymous. Deposits by banks - comprise money deposited with the Group by banks and recorded as liabilities. They include money-market deposits, securities sold under repurchase agreements, federal funds purchased and other short term deposits. Deposits received from customers are recorded as customer accounts. Derivative - a contract or agreement whose value changes with movements in an underlying index such as interest rates, foreign exchange rates, share prices or indices and which requires no initial investment or an initial investment that is smaller than would be required for other types of contracts with a similar response to market factors. The principal types of derivatives are: swaps, forwards, futures and options. Discontinued operation - is a component of the Group that either has been disposed of or is classified as held for sale. A discontinued operation is either: a separate major line of business or geographical area of operations or part of a single co-ordinated plan to dispose of a separate major line of business or geographical area of operations; or a subsidiary acquired exclusively with a view to resale. Exposure at default (EAD) - an estimate of the expected level of utilisation of a credit facility at the time of a borrower's default. The EAD may be higher than the current utilisation (e.g. in the case where further drawings may be made under a revolving credit facility prior to default) but will not typically exceed the total facility limit. Fannie Mae (Federal National Mortgage Association) - is a US Government Sponsored Enterprise. It buys mortgages, principally issued by banks, on the secondary market, pools them, and sells them as residential mortgage-backed securities to investors on the open market. Its obligations are not explicitly guaranteed by the full faith and credit of the US Government. Federal Agencies - US federal agencies are independent bodies established by the US Government for specific purposes such as the management of natural resources, financial oversight or national security. A number of agencies, including Ginnie Mae, issue or guarantee publicly traded debt securities. Federal Home Loan Mortgage Corporation - see Freddie Mac. Federal National Mortgage Association - see Fannie Mae.

5 RBS Group – Q3 2011 Results
Glossary of terms (continued) First/second lien - a lien is a charge such as a mortgage held by one party, over property owned by a second party, as security for payment of some debt, obligation, or duty owed by that second party. The holder of a first lien takes precedence over all other encumbrances on that property i.e. second and subsequent liens. Forbearance - is the term generally applied to an agreement, principally in relation to secured loans with retail customers experiencing temporary financial difficulty, to a payment moratorium, to reduced repayments or to roll up arrears. Forbearance loans are a subset of Renegotiated loans. Freddie Mac (Federal Home Loan Mortgage Corporation) - is a US Government Sponsored Enterprise. It buys mortgages, principally issued by thrifts, on the secondary market, pools them, and sells them as residential mortgage-backed securities to investors on the open market. Its obligations are not explicitly guaranteed by the full faith and credit of the US Government. G10 - the Group of Ten comprises the eleven industrial countries (Belgium, Canada, France, Germany, Italy, Japan, the Netherlands, Sweden, Switzerland, the United Kingdom and the United States) that have agreed to participate in the IMF's General Arrangements to Borrow. Government Sponsored Enterprises (GSEs) - are a group of financial services corporations created by the US Congress. Their function is to improve the efficiency of capital markets and to overcome statutory and other market imperfections which otherwise prevent funds from moving easily from suppliers of funds to areas of high loan demand. They include Fannie Mae and Freddie Mac. Gross yield - is the interest rate earned on average interest-earning assets i.e. interest income divided by average interest-earning assets. Guaranteed mortgages - are mortgages that are guaranteed by a government or government agency. In the US, government loan guarantee programmes are offered by the Federal Housing Administration, the Department of Veterans Affairs and the Department of Agriculture's Rural Housing Service. In the Netherlands, the Gemeentegarantie programme is run partly by the central government and partly by the municipalities. Home equity loan - is a type of loan in which the borrower uses the equity in their home as collateral. A home equity loan creates a charge against the borrower's house. Impaired loans - comprise all loans for which an impairment provision has been established; for collectively assessed loans, impairment loss provisions are not allocated to individual loans and the entire portfolio is included in impaired loans. Impairment allowance - see Loan impairment provisions. Impairment losses - for impaired financial assets measured at amortised cost, impairment losses - the difference between carrying value and the present value of estimated future cash flows discounted at the asset's original effective interest rate - are recognised in profit or loss and the carrying amount of the financial asset reduced by establishing a provision (allowance). For impaired available-for-sale financial assets, the cumulative loss that had been recognised directly in equity is removed from equity and recognised in profit or loss as an impairment loss.

6 RBS Group – Q3 2011 Results
Glossary of terms (continued) Individually assessed loan impairment provisions - impairment loss provisions for individually significant impaired loans assessed on a case-by-case basis, taking into account the financial condition of the counterparty and any guarantor and the realisable value of any collateral held. International Accounting Standards Board (IASB) - is the independent standard-setting body of the IFRS Foundation. Its members are responsible for the development and publication of International Financial Reporting Standards (IFRSs) and for approving Interpretations of IFRSs as developed by the IFRS Interpretations Committee (IFRIC). Interest spread - is the difference between the gross yield and the interest rate paid on average interest-bearing liabilities. Investment grade - generally represents a risk profile similar to a rating of BBB-/Baa3 or better, as defined by independent rating agencies. Latent loss provisions - loan impairment provisions held against impairments in the performing loan portfolio that have been incurred as a result of events occurring before the balance sheet date but which have not been identified as impaired at the balance sheet date. The Group has developed methodologies to estimate latent loss provisions that reflect historical loss experience (adjusted for current economic and credit conditions) and the period between an impairment occurring and a loan being identified and reported as impaired. Loan impairment provisions - are established to recognise incurred impairment losses on a portfolio of loans classified as loans and receivables and carried at amortised cost. It has three components: individually assessed loan impairment provisions, collectively assessed loan impairment provisions and latent loss provisions. Loan-to-value ratio - the amount of a secured loan as a percentage of the appraised value of the security e.g. the outstanding amount of a mortgage loan as a percentage of the property's value. Loss given default (LGD) - the economic loss that may occur in the event of default i.e. the actual loss - that part of the exposure that is not expected to be recovered - plus any costs of recovery. Master netting agreement - is an agreement between two counterparties that have multiple derivative contracts with each other that provides for the net settlement of all contracts through a single payment, in a single currency, in the event of default on, or termination of, any one contract. Medium term notes (MTNs) - are debt securities usually with a maturity of five to ten years, but the term may be less than one year or as long as 50 years. They can be issued on a fixed or floating coupon basis or with an exotic coupon; with a fixed maturity date (non-callable) or with embedded call or put options or early repayment triggers. MTNs are most generally issued as senior, unsecured debt. Monoline insurers - are entities that specialise in providing credit protection against the notional and interest cash flows due to the holders of debt instruments in the event of default. This protection is typically in the form of derivatives such as credit default swaps.

7 RBS Group – Q3 2011 Results
Glossary of terms (continued) Mortgage-backed securities (MBS) - are asset-backed securities for which the underlying asset portfolios are loans secured on property. See Residential mortgage backed securities and Commercial mortgage backed securities. Net interest income - is the difference between interest receivable on financial assets classified as loans and receivables or available-for-sale and interest payable on financial liabilities carried at amortised cost. Net interest margin - is net interest income as a percentage of average interest-earning assets. Net principal exposure - is the carrying value of a financial asset after taking account of credit protection purchased but excluding the effect of any counterparty credit valuation adjustment to that protection. Non-conforming mortgages - mortgage loans that do not meet the requirements for sale to US Government agencies or US Government sponsored enterprises. These requirements include limits on loan-to-value ratios, loan terms, loan amounts, borrower creditworthiness and other requirements. Option - an option is a contract that gives the holder the right but not the obligation to buy (or sell) a specified amount of the underlying physical or financial commodity, at a specific price, at an agreed date or over an agreed period. Options can be exchange-traded or traded over-the-counter. Past due - a financial asset such as a loan is past due when the counterparty has failed to make a payment when contractually due. Potential problem loans - are loans other than impaired loans, accruing loans which are contractually overdue 90 days or more as to principal or interest and troubled debt restructurings where known information about possible credit problems of the borrower causes management to have serious doubts about the borrower's ability to meet the loan's repayment terms. Prime - prime mortgage loans generally have low default risk and are made to borrowers with good credit records and a monthly income that is at least three to four times greater than their monthly housing expense (mortgage payments plus taxes and other debt payments). These borrowers provide full documentation and generally have reliable payment histories. Probability of default (PD) - the likelihood that a customer will fail to make full and timely repayment of credit obligations over a one year time horizon. Renegotiated loans - loans are generally renegotiated either as part of the ongoing banking relationship with a creditworthy customer or in response to a borrower's financial difficulties. In the latter case, renegotiation encompasses not only revisions to the terms of a loan such as a maturity extension, a payment moratorium, a concessionary rate of interest but also the restructuring of all or part of the exposure including debt forgiveness or a debt for equity swap. Loans renegotiated as part of the ongoing banking relationship with a creditworthy customer, are treated as new loans. Repurchase agreement (Repo) - see Sale and repurchase agreements.
8 RBS Group – Q3 2011 Results
Glossary of terms (continued) Residential mortgage backed securities (RMBS) - are asset-backed securities for which the underlying asset portfolios are residential mortgages. Retail loans - are loans made to individuals rather than institutions. The loans may be for car purchases, home purchases, medical care, home repair, holidays and other consumer uses. Reverse repurchase agreement (Reverse repo) - see Sale and repurchase agreements. Risk asset ratio (RAR) - total regulatory capital as a percentage of risk-weighted assets. Risk elements in lending (REIL) - comprise impaired loans, accruing loans which are contractually overdue 90 days or more as to principal or interest and troubled debt restructurings. Risk-weighted assets - assets adjusted for their associated risks using weightings established in accordance with the Basel Capital Accord as implemented by the FSA. Certain assets are not weighted but deducted from capital. Sale and repurchase agreements - in a sale and repurchase agreement one party, the seller, sells a financial asset to another party, the buyer, at the same time the seller agrees to reacquire, and the buyer to resell, the asset at a later date. From the seller's perspective such agreements are repurchase agreements (repos) and from the buyer's reverse repurchase agreements (reverse repos). Securitisation - is a process by which assets or cash flows are transformed into transferable securities. The underlying assets or cash flows are transferred by the originator or an intermediary, typically an investment bank, to a special purpose entity which issues securities to investors. Asset securitisations involve issuing debt securities (asset-backed securities) that are backed by the cash flows of income-generating assets (ranging from credit card receivables to residential mortgage loans). Liability securitisations typically involve issuing bonds that assume the risk of a potential insurance liability (ranging from a catastrophic natural event to an unexpected claims level on a certain product type). Special purpose entity (SPE) - is an entity created by a sponsor, typically a major bank, finance company, investment bank or insurance company. An SPE can take the form of a corporation, trust, partnership, corporation or a limited liability company. Its operations are typically limited for example in a securitisation to the acquisition and financing of specific assets or liabilities. Structured credit portfolio (SCP) - the SCP is a portfolio of certain of the Group’s illiquid assets - principally CDO super senior positions, negative basis trades and monoline exposures - held within Non-Core division. Structured notes - are securities that pay a return linked to the value or level of a specified asset or index. Structured notes can be linked to equities, interest rates, funds, commodities and foreign currency.

9 RBS Group – Q3 2011 Results
Glossary of terms (continued) Subordinated liabilities - are liabilities which, in the event of insolvency or liquidation of the issuer, are subordinated to the claims of depositors and other creditors of the issuer. Sub-prime - sub-prime mortgage loans are designed for customers with one or more high risk characteristics, such as: unreliable or poor payment histories; loan-to-value ratio of greater than 80%; high debt-to-income ratio; the loan is not secured on the borrower's primary residence; or a history of delinquencies or late payments on the loan. Super senior CDO - is the most senior class of instrument issued by a CDO vehicle. They benefit from the subordination of all other instruments, including AAA rated securities, issued by the CDO vehicle. Tangible Net Asset Value (TNAV) - Owners’ equity attributable to ordinary and B shareholders less intangible assets, divided by number of ordinary and B shares in issue. Tier 1 capital - core Tier 1 capital plus other Tier 1 securities in issue, less material holdings in financial companies. Tier 1 capital ratio - Tier 1 capital as a percentage of risk-weighted assets. Tier 2 capital - qualifying subordinated debt and other Tier 2 securities in issue, eligible collective impairment allowances, unrealised available-for-sale equity gains and revaluation reserves less certain regulatory deductions. US Federal Agencies – see Federal Agencies Value-at-risk (VaR) - is a technique that produces estimates of the potential change in the market value of a portfolio over a specified time horizon at given confidence levels. Write down - a reduction in the carrying value of an asset to record a decline in its fair value or value in use.