in a drosophila melanogaster - home | genetics · of drosophila melanogaster j. a. ... ( ehrlich...
TRANSCRIPT
GENE FLOW ANI) SELECTION IN A NATURAL POPULATION OF DROSOPHILA MELANOGASTER
J. A. McKENZIEI
Department of Population Biology, Research School of Biological Sciences, Australian National University, Canberra, Australia
Manuscript received September 23, 1974
ABSTRACT
A marked genetic differentiation to the presence of alcohol in the environ- ment has been shown to occur between inside cellar and adjacent outside sections of a vineyard population of D. nelanogaster (MCKENZIE and PARSONS 1974). Estimates of migration during the vintage period suggest considerable movement OGCUPS from outside into the cellar and that the mast tolerant genotypes are the most successful migrants. A quantitative model of this system suggests that the selection intensity may not be a limiting factor in main- taining the differentiation. It also suggests that gene flow must be restricted between sections of the population at all but vintage periods if this differenti- ation is to persist.
HERE has been considerable discussion concerning the relative importance Tand interaction of gene flow and selection in determining genetic differentia- tion. Gene flow has been considered by some authorities as a critical factor in maintaining continuity between populations (MAYR 1963) ; others have thought it far less relevant ( EHRLICH and RAVEN 1969; ENDLER 1973).
The degree to which genetic differentation occurs across an environmental gradient may be related to the relative magnitude of selection and gene flow in different areas of the gradient (JAIN and BRADSHAW 1966). At the microenviron- mental level the maintenance of a genetic polymorphism in a heterogeneous en- vironment can also be considered in terms of gene flow and selection (LEVENE 1953; DEAKIN 1966).
The effect of gene flow is potentially greatest where there are relatively few populations in a cline (ENDLER 1973). The maximum effect of gene flow thus occurs in the extreme case of a two-population system since the effect cannot be diminished by the introduction of genes from other areas (PARSONS 1963). For such a two-population system the maintenance of clines and of polymorphism in a heterogeneous environment is synonomous. Thus, both are determined by the relative fitness of genotypes in each population and the extent of gene exchange between populations. Consequently, such a simple system may be useful in pro- viding a more general model, for, while clines have been reported for a number of characters (see ENDLER 1973 for references), information on the effect of gene flow and selection in these cases is limited. Indeed, the amount of gene exchange
Present address: Department of Genetics, La Trobe University, Bundmra, Victoria 3083 Australia
Genetics 80: W 6 1 June, 1975.

350 J. A. MCKENZIE
that may occur between sections of a natural population is a matter of some con- jecture (GLEAVES 1973).
One obvious limitation to the usefulness of such a two-population system is the difficulty of defining an observable component of environmental heterogeneity that is of direct relevance to the populations considered. Without a clearly defined environmental gradient, or discontinuity, it is virtually impossible to explain the relcvance 4 changes in gene frequency. This limitation has been over- come in plant populations where the microenvironment can be adequately spe- cified (BRADSHAW 1972). This paper deals with a similar situation in a popula- tion of Drosophila melanogaster.
A combination of laboratory and field experiments suggest that D. melanogas- ter is more able to utilize an alcohol-associated resource than the sibling species D. simulans (MCKENZIE and PARSONS 1972). Laboratory studies with adults have shown D. melanogaster to be more tolerant to the presence of alcohol in the environment than D. simulans. The percentage of larvae that emerge as adults after development on aclohol-supplemented media is also greater for D. melan- ogaster, while gravid females of this species show similar preference for ovi- position sites in both standard and alcohol-impregnated media. D. simulans, however, demonstrates a marked preference for the former sites (MCKENZIE and PARSONS 1972). Within a population at the “Chateau Tahbilk” vineyard in Vic- toria adults of both species occur outside the cellar, but only D. melanogaster is found within it and larvae and pupae of this species may be collected in the seep- age from the wine casks. The outside adult distribution of the species is also affected during vintage by the presence of alcohol fumes from the fermentation area above the cellar. D. melanogaster is more common nearer the fermentation area at this time (see MCKENZIE 1974 for discussion and a ground plan of the vineyard). The excess of females repeatedly found in the cellar and near the fermentation area during vintage is explained by an increased mortality of males in these areas ( MCKENZIE 19 74).
A marked microdifferentiation for tolerance to the presence of alcohol has occurred between the cellar and outside sections of the D. melanogaster popu- lation. Thus, larvae from strains derived from the cellar were more tolerant to the presence of alcohol in the environment than those of strains from outside the cellar (MCKENZIE and PARSONS 1974). Furthermore, there was evidence of gene flow between the sub-sections of the population. Therefore, this situation is use- ful in analyzing the factors affecting the extent of differentiation in the presence of gene flow and dynamics of such a system.
METHODS
Population Structure at “Chateau Tahbilk”
The population of D. melanogaster outside, but adjacent to, the cellar undergoes marked numerical fluctuations. During the winter months few flies can be collected outside the cellar by hand or by banana bait trapping (see MCKENZIE and PARSONS 1972; MCKENZIE 1974 for trapping procedure); indeed it is difficult to obtain more than 50 flies in monthly samples of 5 hours duration during non-vintage periods, although numbers do increase in the months just

GENE FLOW AND SELECTION 35 1
prior to vintage. During vintage them is a rapid numerical increase in the population, and for a similar sampling period more than 500 flies can be readily collected in each sample. Similar changes are observed in the cellar. During the non-vintage period the cellar population i s greater than that outside the cellar, while the reverse is true during vintage, although the values are more similar at this time (Table 1). Samples which produced no adults from either area are not included. The outside numbers are based on a trapping grid up to 60 meters from the fermen- tation area ( MCKENZIE 1974). Movement of D. melanogaster appears to be directed toward the cellar during vintage, but is apparently random at other times (MCKENZIE 1974). Any mass movement into the cellar from outside is, therefore, most likely to occur during vintage. Pre- liminary studies have shown this to be so and hence any attempt to measure the extent of gene flow should be restricted to this period.
Pre-vintage Releases and Collections A demonstration of movement of flies into the cellar from the outside section of the popula-
tion does not necessarily provide evidence of gene flow. It must be shown that migrants con- tribute to the cellar gene pool. Estimates of the amount of migration and of the genetic effect of migrants on the cellar population are most conveniently made if the stages of the life cycle (adults, larvae and pupae) scored in the cellar have a different phenotype from that of the migrants. For a numerical estimate of migration to be made it is also necessary that individuals with a marker phenotype survive during the experimental period. For these reasons control releases into the cellar population were made in the pre-vintage period. This allowed the cellar population to be marked with a line carrying the single recessive mutant, orange (oT) . The release line was derived by crossing a homozygous laboratory marker stock to a recently derived heterogeneous cellar stock from “Chateau Tahbilk”. F, individuals of this cross carrying the marker phenotype were then crossed to the heterogeneous “Tahbilk” stock. This procedure was repeated for at least 2 cycles before the release of the marker was made.
Three such releases were made, involving 2500 (release 1, December 1973), 4000 (release 2, February 1974) and 4000 (release 3, March 1974) flies. Approximately equal numbers of each sex were released. Because of the low numbers of flies in the cellar at the times of release, the introduction ensured that a t least 95% of the cellar population was homozygous for the marker immediately after release.
Subsequent sampling in the cellar was by hand trapping and by banana bait. These methods provide similar sample ratios (MCKENZIE 1974) and, as there was no significant difference in the proportion of the orange phenotype collected by either method, the data presented are based on pooled values.
Vintage Release and Collection A fourth release of 1500 marker flies of each sex was made into the cellar population one
week after the commencement of the vintage period (release 4, April 1074). At t h i s time the out- side population was beginning to increase rapidly. The release is again assumed to have marked
TABLE 1
Paired comparison t-tests (after angular transformation) and m a n proportions of Drosophila melanogaster collected inside and outside the cellar during vintage and non-vintage
periods (based on monthly collections from January 1972 to April 1974, with a single vintage sample being taken each year)
Vinta Non-vintage tzz Inside outs;% tx Inside Outside
8 0.22 0.78 8.13* 0.79 0.21 7.11*** 0 0.33 0.67 3.70 0.87 0.13 8.30***
Number of collections 3 23 *P<O.@ *** P < 0.001
352
4
J. A. MCKENZIE
Rz
I ; \ I
I I I I I
50 100
Time (days after release)
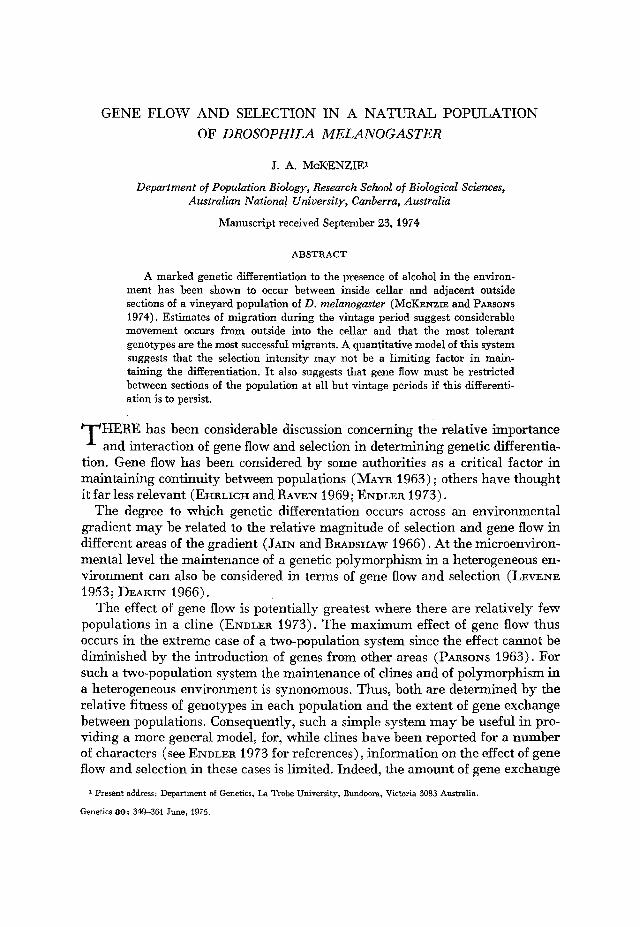
FIGURE 1 .-The proportion of orange homozygotes in collections made after releases in De- cember 1973 ( R I ) , February 1974 ( R 2 ) , March 1974 (RJ and April 1974 ( R 4 ) . The time scale is from the first release.
95% of the cellar population, as population numbers were still relatively small at this time and the proportion of orange homozygotes was relatively high both prior to and at the first collec- tion subsequent to the release (Figures 1 and 2).
After the release at 1000 hours, collections were made by hand trapping individual flies in food vials at the specified sample times for periods each lasting 30 minutes. The first collections were made at 1200 and 1600 hours of the release day. Subsequent collections were made daily at 0900 and 1600 hours for the remainder of the collection period. In all, 9 collections were made. The samples were made without replacement.
Outside the cellar, collections were made 1 meter from the fermentation area (MCKENZIE 1974) by hand trapping €or 30 minutes. Times of collection were at 1630 hours on the day of the 4th release and thereafter daily at 0930 and 1630 hours. After the fiial collection 1500 marker flies ot each sex were released at the same site outside the cellar and the population was again sampled for 30 minutes. Absolute population size for this period was then estimated from the number of marked animals in the total collected. It should be noted that because of the directed movement of flies toward the cellar a t this time (MCKENZIE 1974) the population numbers at the site outside the cellar may be continuously changing and, therefore, the absolute population size estimate will only be approximate for even a restricted sample period. However, relative changes in the total number of animals collected during each fixed 3@minute sample period are thought to reflect changes in the absolute population (SOUTHWOOD 1966). For this reason, total population size estimates for each sample period were made by comparing the numbers of

G E N E FLOW A N D SELECTION 353
U
0 10 20 30 40 50 0 20 40 60 a0 100
(dayl ight hours)
Time
(octuol hours)
00
c 0
0 3 P 0 0
.- L -
a E a 0 .c
o x Z -0 e
c
r O io t! ?
5
; c
.- c
Ly
0
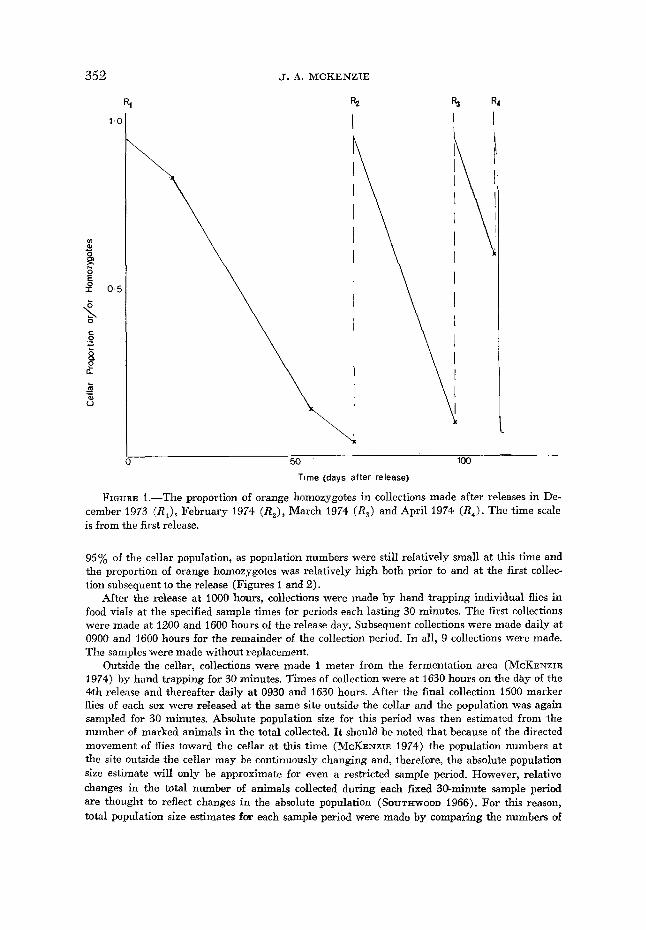
FIGURE 2.-The proportion of orange homozygotes in collections made after the release the vintage period of 1974 (RJ. Time is in hours (actual W or daylight A) after the release. The estimates of population size in the transition zone outside the cellar are plotted (solid line) against the daylight hour scale.
animals collected in each period and relating these to the absolute population size estimate obtained above.
RESULTS
The proportion of orange homozygotes in the population steadily decreases with time after the various releases, but during the non-vintage releases ( R I - R 3 ) this occurs more gradually (Figure 1). The decrease in these control experi- ments is considered to be largely due to the lower fitness of the orange homozy- gote and the heterozygote relative to the wild-type homozygote. The genotypes of wild-phenotype males were ascertained by crossing with homozygous orange females, while the genotype of the wild-phenotype female and that of the male she had mated with was estimated from their progeny or by crossing the progeny to orange homozygotes. Because of the problem of multiple insemination, some female data were inconclusive; but these procedures showed a deficiency of het-
354 J. A. MCKENZIE
erozygotes (P<0.05) relative to Hardy-Weinberg expectations and an increased mating performance by wild-type homozygotes (P<O.OOi ) . The proportion of orange homozygotes obtained for adults, larvae and pupae of a given sample was similar, showing that the released genotype can breed and persist in the cellar environment for a considerable time.
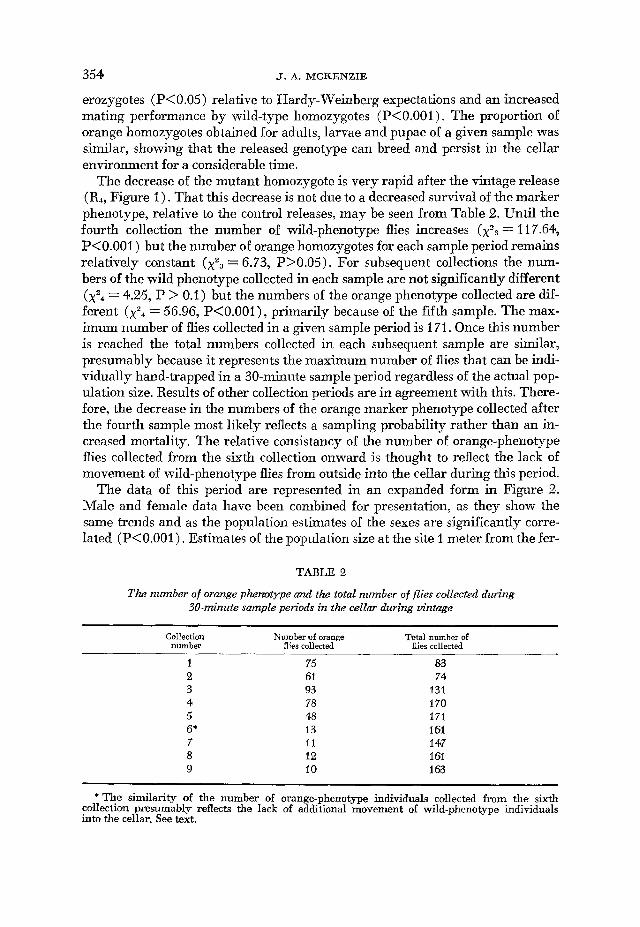
The decrease of the mutant homozygote is very rapid after the vintage release (R4, Figure 1). That this decrease is not due to a decreased survival of the marker phenotype, relative to the control releases, may be seen from Table 2. Until the fourth collection the number of wild-phenotype flies increases (x23 = 117.64, P<O.OOl ) but the number of orange homozygotes for each sample period remains relatively constant (x23 = 6.73, P>0.05). For subsequent collections the num- bers of the wild phenotype collected in each sample are not significantly different (xZ4 = 4.25, P > 0.1) but the numbers of the orange phenotype collected are dif- ferent ( x Z 4 = 56.96, P<O.OOl), primarily because of the fifth sample. The max- imum number of flies collected in a given sample period is 171. Once this number is reached the total numbers collected in each subsequent sample are similar, presumably because it represents the maximum number of flies that can be indi- vidually hand-trapped in a 30-minute sample period regardless of the actual pop- ulation size. Results of other collection periods are in agreement with this. There- fore, the decrease in the numbers of the orange marker phenotype collected after the fourth sample most likely reflects a sampling probability rather than an in- creased mortality. The relative consistancy of the number of orange-phenotype flies collected from the sixth collection onward is thought to reflect the lack of movement of wild-phenotype flies from outside into the cellar during this period.
The data of this period are represented in an expanded form in Figure 2. Male and female data have been combined for presentation, as they show the same trends and as the population estimates of the sexes are significantly corre- lated ( P < O . O O l ) . Estimates of the population size at the site 1 meter from the fer-
TABLE 2
The number of orange phenotype and the total number of flies collected during 30-minute sample periods in the celtar during vintage
Collection Number of orange Total number of number flies collected flies collected
I 2 3 4 5 6* 7 8 9
75 61 93 78 48 13 11 12 10
83 74
131 170 171 161 147 161 163
~~ ~~
*The similarity of the number of orange-phenotype individuals collected from the sixth collection presumably reflects the lack d additional movement d wild-phenotype individuals into the cellar. See text.
GENE FLOW AND SELECTION 355
mentation area are also provided in Figure 2, with male and female data being combined for the reasons presented above. This site represents a transition zone between the inside and the outside of the cellar so that the population estimates for the site are considerably below those of the entire outside population. There appears to be a direct relationship between the increase of the population in this transition zone and the decrease in the proportion of the marker phenotype in the cellar up to 30 daylight hours after the cellar release (Figure 2). Prior to the next collection (0900) the outside site was sprayed with insecticide by the vine- yard staff. This resulted in a depression of population numbers. Further spraying occurred prior to the 1630 collection of the same day and was continued after the sample was taken. No further decrease in the proportion of the orange phenotype within the cellar was observed during this period.
These results imply that the rate of movement of wild-phenotype individuals into the cellar is related to the population size in the area directly outside the cellar. Given the directed movement of D. melanogaster at this time ( MCKENZIE 1974), this result is not surprising.
Some comment is necessary on the final increase in the population outside the cellar, since this does not produce a corresponding increase within the cellar (Figure 2). The increase occurs between an evening and a morning collection. The concordance of the decrease of orange homozygotes for either time scale (i.e., daylight or actual hours in Figure 2) suggests that there is no significant movement of D. melanogaster outside daylight hours. As insecticide was applied after the evening collection, the increase of the population in the transition zone is most likely to have occurred in the few hours of daylight before the morning sample by movement of flies from surrounding unsprayed areas. Therefore, it is improbable that there was sufficient time for this increase to influence cellar numbers before the final sample.
An evaluation of the amount of migration that occurs can be gained from esti- mates of the number of wild-phenotype adults in the cellar population. At the time of release the population was estimated at approximately 200 from the pro- portions of orange and wild-phenotype adults collected, while at the conclusion of sampling the comparable estimate was 62,000.
Larval samples also provide an indication of the effect of migration. Because of the rapid mating of the species after eclosion, any female moving into the cellar is likely to be fertilized and capable of immediate oviposition. The contribution of migrant individuals during the sample period can be estimated from the change in frequency of the marker phenotype in adults emerging from larvae collected in the cellar at the time of release and 120 hours later, by which time eggs ovi- posited by migrants, or by females mated by migrants, will have begun to hatch.
The frequencies of orange homozygotes emerging from larval samples are given in Table 3. Data for pupal samples are also provided. The proportion of the marker phenotype decreases in the larvae, while there is an increase in the pupae. The decrease of the proportion of the marker phenotype in the larvae demon- strates the rapid effect migrants have on the cellar population, as any contribu- tion derived solely from the orange homozygotes of the fourth cellar release has

356 J. A. MCKENZIE
TABLE 3
The number of adults emerging from larvae and pupae collecfed in fhe cellar czt the time of relertse (R,) and in the final sample 120 hours later
The percentage of the orange phenotype in the emerging individuals is also giwn.
Larvae Number Percent orange Number Percent orange
Release Final Release Final ___.__
Release Final Release Final ._____
8 47 91 36.1 21.9 26 15 15.3 33.3 0 48 102 39.6 20.6 26 31 11.5 19.4
Combined sexes 95 193 37.9 21.2 52 46 13.5 23.9
been overshadowed. The temperature in the cellar during the sampling period was consistently near 21 “C. Hence, any eggs oviposited by females of the fourth cellar release or by migrant females would not have reached the pupal stage of development in the time available between the two samples. Therefore, their con- tribution would not influence the proportion of the orange phenotype in the pupal stage. The increase observed is due to the subsequent development of the larval phenotype of the first sample period.
Larvae and pupae were each sampled for 30 minutes at both collection times. The number of larvae collected is much larger in the final sample, while the number of pupae remains essentially the same (Table 3) . This again suggests that migrant individuals make a rapid contribution to the gene pool of the cellar population. However, as the phenotypes of the pupae collected in the final sample may be explained by the development of larvae available at the time of the orig- inal sample, it appears that any interaction caused by increased larval numbers is small. This suggests that the cellar’s alcohol-associated resources were not be- ing totally utilized by the original population. particularly as the availability of pupation sites is not limiting. The influx of migrants allows for a potentially more efficient exploitation of these resources. This is especially significant over the vintage period, when the amount of potential resource available is increased by spillage and seepage during transfer of the recently fermented wine to the storage casks in the cellar.
As the experimental period is approximately 1/Sth of the entire vintage pe- riod, it is reasonable to conclude that the pre-vintage cellar population will be completely “swamped” by migrants from outside during vintage if the rate of influx remains constant. Indeed, the proportion of orange homozygotes was less than 1% in samples of larvae, pupae and adults made 3 weeks after the final collection of the experimental period. It is therefore necessary to consider how the differentiation between inside and outside sections of the population (Mc- KENZIE and PARSONS 1974+) is maintained in the presence of such gene flow.
A MODEL SYSTEM
MCKENZIE and PARSONS (1 974) found that tolerance to alcohol in the environ- ment involved both additive and dominant genetic components. The mechanism could not be explained by a simple 1 locus-2 allele system and, in addition, the

GENE FLOW AND SELECTION 35 7
CELLAR
99AICOhol
1=42.1*6.1
Percentage of adults emerging
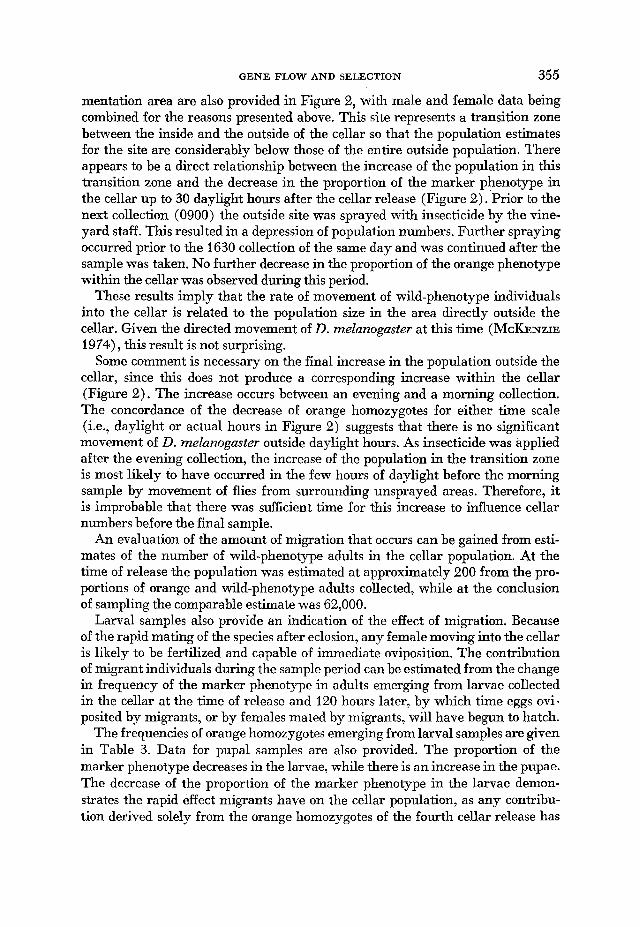
FIGURE 3.-Distribution of the percentage of adults emerging from 2 replicates of 25 larvae each on 0% and 9% alcohol-supplemented media for strains of D. mehogaster derived from inside and outside the cellar at “Chateau Tahbilk.” Each unit on the ordinate represents the mean for one strain. Values are pooled for 10 strains from each of the months of May 1972 and February to April 1973. Standard deviations are given after angular transformation (derived from the data of M~KENZIE and PARSONS 1974).
distribution of adults emerging from larvae on 9% alcohol media (Figure 3) indicates a polygenic component.
If it is assumed that the alcohol tolerance system is controlled by a polygenic mechanism, a model can be framed to incorporate a shift in the distribution with the mean of the outside section of the population to a distribution with the mean tolerance of the cellar section. The model further assumes that the cellar section of the population is “swamped” by migration from outside during vintage and that gene exchange is then excluded between the sections of the population.
Given that R = hZnS, where R is the response to selection, h2% is the narrow- sense heritability and S is the selection differential (FALCONER 1960), it is possi- ble to estimate S on the assumption that both heritability and response remain constant over generations (see LEE and PARSONS 1968). Since the patterns of
358 J. A. MCKENZIE
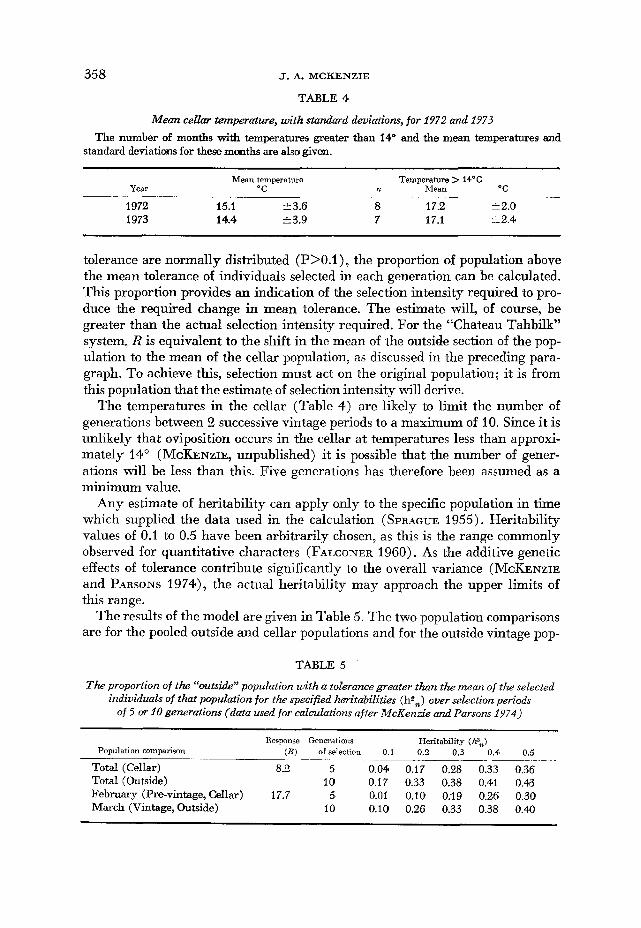
TABLE 4
Mean celku temperature, with standard deviations, for 1972 and 2973 The number af months with temperatures greater than 14” and the mean temperatures and
standard deviations for these m t h s are also given.
Mean temperature Temperature > 14OC Year “C n Mean O C
1972 15.1 23.6 8 17.2 i 2.0 1973 14.4 zk3.9 7 17.1 12.4
tolerance are normally distributed (P>O.l ) , the proportion of population above the mean tolerance of individuals selected in each generation can be calculated. This proportion provides an indication of the selection intensity required to pro- duce the required change in mean tolerance. The estimate will, of course, be greater than the actual selection intensity required. For the “Chateau Tahbilk” system, R is equivalent to the shift in the mean of the outside section of the pop- ulation to the mean of the cellar population, as discussed in the preceding para- graph. To achieve this, selection must act on the original population; it is from this population that the estimate OI selection intensity will derive.
The temperatures in the cellar (Table 4) are likely to limit the number of generations between 2 successive vintage periods to a maximum of 10. Since i t is unlikely that oviposition occurs in the cellar at temperatures less than approxi- mately 14” (MCKENZIE, unpublished) it is possible that the number of gener- ations will be less than this. Five generations has therefore been assumed as a minimum value.
Any estimate of heritability can apply only to the specific population in time which supplied the data used in the calculation (SPRAGUE 1955). Heritability values of 0.1 to 0.5 have been arbitrarily chosen, as this is the range commonly observed for quantitative characters (FALCONER 1960). As the additive genetic effects of tolerance contribute significantly to the overall variance (MCKENZIE and PARSONS 1974), the actual heritability may approach the upper limits of this range.
The results of the model are given in Table 5 . The two population comparisons are for the pooled outside and cellar populations and for the outside vintage pop-
TABLE 5
The proportion of the “outside” population with a tolerance greater than the mean of the selected individuals of that population for the specified heritabilities (hs,) over selection periods
of 5 or 10 generations (data used for calculations after McKenzie and Parsons 2974)
Response Generations Heritability (P,) Population comparison ( R ) of selection 0.1 0.2 0.3 0.4 0.5 ~ _ _ _ _ _
Total (Cellar) 8.2 5 0.04 0.17 0.28 0.33 0.36 Total (Outside) 10 0.17 0.33 0.38 0.41 0.43 February (Pre-vintage, Cellar) 17.7 5 0.01 0.10 0.19 0.26 0.30 March (Vintage, Outside) IO 0.10 0.26 0.33 0.38 0.40

G E N E FLOW A N D SELECTION 359
ulation (March) to the pre-vintage (February) cellar population. The latter comparison is one in which selection has the maximum time to act. To produce the shift in mean required ( R ) does not demand particularly stringent selection intensities at any heritability greater than 0.2. Therefore, the observed differen- tiation will be maintained if the cellar population is “swamped” during vintage and left in isolation until the subsequent vintage. Gene flow into the cellar must be restricted at other times. In addition, gene flow from the cellar must also be limited, since the difference between genotypes in a non-alcohol-associated environment appears to be small (Figure 3) and there is no significant difference between the cellar and non-cellar sections of the population for the 0% alcohol comparison ( MCKENZIE and PARSONS 19 74).
DISCUSSION
During the vintage period alcohol-associated resources become more readily available both within and in the vicinity of the cellar. If the environment is to be most effectively exploited, migrants to these areas must be able to utilize these resources. The present model of the cycle of gene flow, isolation and selection allows for effective utilization but does not explain how differentiation is main- tained between the sections of the population during the vintage period itself (MCKENZIE and PARSONS 1974). For this to occur it is clear that selection must act on individuals that move into the cellar. Experimental verification of this is currently being investigated, but in other situations different genotypes have been shown to possess different dispersal and migration potential (SAKAI et al. 1958; KREBS et al. 1973), and it would appear that preferential migration may also occur in the case under consideration. Under these circumstances the probability of differentiation is enhanced because more tolerant individuals will have a greater probability of reaching the cellar. However, in this case the intensity of selection will be significant. In terms of the model, the shift in the mean (R) must effectively occur over 1 generation. Even allowing for a heritability of 0.5, the proportion of the outside population with a tolerance greater than that of the mean of the selected individuals will be 0.04 for the Total (Cellar) : Total (Outside) comparison of Table 5 . For the February (Cellar) : March (Outside) comparison this proportion is 0.004. Clearly, for lower heritabilities the intensity of selection will be even more acute.
The potential for selection certainly exists both outside and inside the cellar during vintage, since a high male mortality is observed near the fermentation area at this time (MCKENZIE 1974). After the vintage period the selection pres- sures in the cellar are sufficient to maintain the differentiation, though it seems likely that the migrants reaching the cellar during the vintage period are geno- typically most capable of utilizing the aclohol-associated resource.
There is some evidence that gene flow may occur from the cellar during the spring (MCKENZIE 1974). As the outside population adjacent to the cellar is low at this time, any resistant genotypes undergoing migration could contribute to the subsequent population increase, which would lead to a de-diff erentiating effect.

360 J. A. MCKENZIE
SLATKIN (1973) has suggested that drastic changes in gene frequency will only occur at a barrier to dispersal when almost all individuals attempting to cross the barrier are prevented from doing so. The present results are in agree- ment with this; continual gene flow would lead to continuity between both sec- tions of the population, more particularly because the differences between the viabilities of the genotypes in the outside environment are not large. MCKENZIE and PARSONS (1974) have suggested that the more resistant genotypes must be at a disadvantage in the outside environment for cliff erentiation to be maintained. The smaller this disadvantage the greater the restriction on gene flow from the cellar must be. This effect is likely to be localized. While individuals of Drosoph- ila are certainly capable of considerable dispersive movement (YERINGTON and WARNER 1961), the majority of any population show restricted movement (DORZHANSKY and W R I G H T 1943; RICIXARDSON 1969; WALLACE 1970). This appears also to apply to the “Chateau Tahbilk” population, particularly during non-vintage periods (MCKENZIE 1974). During vintage it is likely that the out- side population is increased by recruits transported with grapes from the fields which are not in the immediate vicinity of the cellar. Significantly, the level of tolerance of thc outside population is lowest at this time (MCKENZIE and PAR- SONS 1974). Such a recruitment of individuals also enhances the chances of dif- fermtiatior! being maintained.
Before any model system is applied to a natural system it is essential that a detailed knowledge of the environment and of the functions of natural selection and gene flow in that system is available (ENDLER 1973). Considerable gene flow does occur at “Chateau Tahbilk” between the cellar and outside selections of the populatioE. but differentation is still maintained. However, mass move- ment appears only likely to occur during a restricted period when an increased alcohol-associated resource is available. The balance between selection pressure ar?d gene flow must be critical in the determination of differentiation between sections of a population. The importance of either component will vary in differ- ent systems, and ultimately the relative fitness of different genotypes in different environments will be an important factor in determining the relevance of gene flow.
I should like to thank PROF. P. A. PARSONS for his encouragement during all stages of the work and PROF. B. JOHN and DR. G. HEWITT for their helpful advice and, with DRS. J. DEARN and D. SHAW, for critically reading the manuscript. The comments of DR. R. H. RICHARDSON and an anonymous referee have also been most useful. Financial assistance was provided by an Australian Research Grants Committee grant to PROF. PARSONS.
LITERATURE CITED
BRADSHAW, A. D., 1972 Biol 5 : 25-47.
DEAKIN, M. A. B., 19%
DOBZHANSKY, TH. and S. WRIGHT, 1943
Some of the evolutionary consequences of being a plant. Evolutionary
Sufficient conditions for genetic polymo~rphism. Am. Naturalist 100: 690-692.
Genetics of natural populations. X. Dispersion rates in Drosophila pseudoobscura. Genetics 28 : 304-340.
GENE FLOW AND SELECTION 361
EHRLICH, P. R. and P. H. RAVEN, 1969 ENDLER, J. A., 1973 FALCONER, D. S., 1960 GLEAVES, J. T., 1973 JAIN, S. K. and A. D. BRAUSHAW, 1966 Evolutionary divergence among adjacent plant popula-
KREBS, C. J., M. S. GAINES, B. L. KELLER, J. H. MYERS and R. H. TAMARIN, 1973 Poplatior1
LEE, B. T. 0. and P. A. PARSONS, 1968 Selection, prediction and response. Biol. Rev. 43: 139-
LEVENE, H., 1935 Genetic equilibrium when more than one ecological niche is available. Am. Naturalist 87: 331-333.
MCKENZIE, J. A., 1974 The distribution of vineyard populations of Drosophila melanogaster and Drosophila simulans during vintage and non-vintage periods. Oecologia 15: 1-16.
MCKENZIE, J. A. and P. A. PARSONS, 1972 Alcohol tolerance: an ecological parameter in the relative success of Drosophila melanogaster and Drosophila simulans. Oecologia 10 : 373- 388. -, 1974 Microdifferentiation in a natural population of Drosophila melanogaster to alcohol in the environment. Genetics 77: 385-394.
Animal Species and Euolution. Harvard University Belknap Press, Cambridge.
Differentiation of populations. Science 165: 1228-1232.
Gene flow and population differentiation. Science 179: 243-250. introduction to Quantitatiue Genetics. Oliver and Boyd, Edinburgh.
Gene flow mediated by wind-borne pollen. Heredity 31: 355-366.
tions. I. The evidence and its theoretical analysis. Heredity 21 : 44)7&41.
cycles in small rodents. Science 179: 35-41.
174.
MAYR, E., 1963 PARSONS, P. A., 1963 RICHARDSON, R. H., 1969 Migration, and enzyme polymorphisms in natural populations of
Drosophila. Japan J. Genet. 44 Suppl. 1: 172-179. SAKAI, K. I., T. NARISE, Y. HIRAIZUMI and S. Y. IYAMA, 1958 Studies on competition in plants
and animals. IX. Experimental studies on migration in Drosophila melanogaster. Evolution 12: 93-101.
Gene flow and selection in a cline. Genetics 75: 733-756.
Migration as a factor in natural selection. Genetics 33: 184-206.
SLATKIN, M., 1973 SOUTHWOOD, T. R. E., 1966 Ecologiczl Methods. Methuen, London. SPRAGUE, G. F., 1955
WALLACE, B., 1970
Problems in the estimation and utilization of genetic variability. Cold Spring Harbor Symp. Quant. Biol. 20: 87-92.
Observations on the microdispersion of Drosophila melunogaster. pp. 381- 399. In: Essays in Evolution and Genetics in Honor of Theodosius Dobzhnsky. Edited by M. K. HECHT and W. C. STEERE. Appleton-Century-Crofts, New York.
Flight distances of Drosophila determined with radioactive phosphorus. J. Econ. Entomology 54: 425-428.
Corresponding editor: R. W. ALLARD
YERRINGTON, A. P. and R. NI. WARNER, 1961