in vitro studies of bone-cement interface and · pdf fileand related work on cemented...
TRANSCRIPT

IN VITRO STUDIES OF BONE-CEMENT INTERFACE
AND RELATED WORK ON CEMENTED
ACETABULAR REPLACEMENT
GIANLUCA TOZZI
The thesis is submitted in fulfilment of the requirements for the award of the degree of
Doctor of Philosophy
Of the
University of Portsmouth
This research was conducted in the Mechanical Behaviour of Materials Laboratory, in the School of Engineering at the University of Portsmouth. The part concerning the bone analogous material characterisation was carried out in collaboration with Siegen University, Germany, within an ARC project funded by the British Council and DAAD (ARC1354). The research was funded by the Faculty of Technology of the University of Portsmouth. The bone cement was donated by DePuy CMW, UK and Stryker, UK.
29 May 2012

2
Abstract
The lasting integrity of the bond between bone cement and bone defines the long-term
stability of cemented acetabular replacements. Although several studies have been carried
out on bone-cement interface at continuum level, micromechanics of the interface has been
studied only recently for tensile and shear loading cases. Furthermore, the mechanical and
microstructural behaviour of this interface is complex due to the variation in morphology and
properties that can arise from a range of factors. In this work in vitro studies of the bone-
cement interfacial behaviour under selected loading conditions were carried out using a
range of experimental techniques.
Damage development in cemented acetabular reconstructs was studied under a combined
physiological loading block representative of routine activities in a saline environment. A
custom-made environmental chamber was developed to allow testing of acetabular
reconstructs in a wet condition for the first time and damage was monitored and detected by
scanning at selected loading intervals using micro-focus computed tomography (µCT).
Preliminary results showed that, as in dry cases, debonding at the bone-cement interface
defined the failure of the cement fixation. However, the combination of mechanical loading
and saline environment seems to affect the damage initiation site, drastically reducing the
survival lives of the reconstructs.
Interfacial behaviour of the bone-cement interface was studied under tensile, shear and
mixed-mode loading conditions. Bone-cement coupons were first mechanically tested and
then µCT imaged. The influence of the loading angle, the extent of the cement penetration
and the failure mechanisms with regard to the loading mode on the interfacial behaviour

3
were examined. Both mechanical testing and post failure morphologies seem to suggest an
effect of the loading angle on the failure mechanism of the interface. The micromechanical
performance of bone-cement interface under compression was also examined. The samples
were tested in step-wise compression using a custom-made micromechanical loading stage
within the µCT chamber, and the damage evolution with load was monitored. Results
showed that load transfer in bone-cement interface occurred mainly in the bone-cement
contact region, resulting in progressively developed deformation due to trabeculae bending
and buckling.
Compressive and fatigue behaviour of bovine cancellous bone and selected open-cell metallic
foams were studied also, and their suitability as bone analogous materials for cemented
biomechanical testing was investigated. Whilst the morphological parameters of the foams
and the bone appear to be closer, the mechanical properties vary significantly between the
foams and the bone. However, despite the apparent differences in their respective
properties, the general deformation behaviour is similar across the bone and the foams.
Multi-step fatigue tests were carried out to study the deformation behaviour under
increasing compressive cyclic stresses. Optical and scanning electron microscopy (SEM) were
used to characterise the microstructure of foams and bone prior to and post mechanical
testing. The results showed that residual strain accumulation is the predominant driving
force leading to failure of foams and bones. Although foams and bone fail by the same
mechanism of cyclic creep, the deformation behaviour at the transient region of each step
was different for both materials. Preliminary results of foam-cement interface performance
under mixed-mode loading conditions are also presented.

4
Contents
Abstract ....................................................................................................................................... 2
Declaration .................................................................................................................................. 7
List of figures ............................................................................................................................... 8
List of tables .............................................................................................................................. 13
Acknowledgments ..................................................................................................................... 14
Dedication ................................................................................................................................. 15
Chapter 1 ................................................................................................................................... 16
1. Introduction ....................................................................................................................... 17
Chapter 2 ................................................................................................................................... 21
2.1. Bone and bones ................................................................................................................. 22
2.1.1. The human skeleton ............................................................................................... 22
2.1.2. Bone morphology ................................................................................................... 22
2.1.3. Bone microstructure ............................................................................................... 24
2.1.4. Mechanical properties of cancellous bone ............................................................. 30
2.1.5. Limitations in determining the mechanical properties of bone ............................. 35
2.1.6. Post-yield and fatigue behaviour of cancellous bone ............................................ 36
2.2. The human hip joint ........................................................................................................... 40
2.2.1. Anatomy and kinematics ........................................................................................ 40
2.2.2. Joint loading and gait analysis ................................................................................ 43
2.2.2. Pathological problems of the hip ............................................................................ 46
2.3. Total hip replacements ...................................................................................................... 48
2.3.1. Background ............................................................................................................. 48
2.3.2. Failure scenarios ..................................................................................................... 51
2.3.3. Aseptic loosening .................................................................................................... 53
2.4. Bone-cement fixation ........................................................................................................ 56
2.4.1. Bone cement properties ......................................................................................... 56
2.4.2. Histology of the bone-cement interface ................................................................ 59
2.4.3. Properties of the bone-cement interface ............................................................... 61
2.4.4. The bone-cement fixation in acetabular reconstructs ........................................... 67
2.5. Micro-focus computed imaging and relative applications ................................................ 74
2.5.1. Background ............................................................................................................. 74

5
2.5.2. Basic principles........................................................................................................ 76
2.5.3. Imaging and determination of morphometrical parameters of trabecular bone .. 78
2.5.4. Image guided failure assessment (IGFA) ................................................................ 83
Chapter 3 ................................................................................................................................... 86
3.1. Introduction ....................................................................................................................... 87
3.2. Methods ............................................................................................................................. 88
3.2.1. Specimen preparation ............................................................................................ 88
3.2.2. Environmental chamber design and implementation ............................................ 89
3.2.3. μCT system .............................................................................................................. 90
3.2.4. Experimental procedures........................................................................................ 91
3.3. Results ................................................................................................................................ 94
3.4. Discussion .......................................................................................................................... 96
3.5. Conclusions ........................................................................................................................ 98
Chapter 4 ................................................................................................................................... 99
4.1. Introduction ..................................................................................................................... 100
4.2. Methods ........................................................................................................................... 102
4.2.1. Specimen preparation .......................................................................................... 102
4.2.2. Loading stage (LS) system ..................................................................................... 103
4.3. Bone-cement interface under mixed-mode loading conditions ..................................... 104
4.3.1. Experimental procedures...................................................................................... 104
4.3.2. Results ................................................................................................................... 106
4.4.3. Discussion ............................................................................................................. 108
4.4. Micromechanical compressive behaviour of bone-cement interface ............................ 110
4.4.1. Image-guided failure assessment (IGFA) .............................................................. 110
4.4.2. Cement penetration and bone morphology ......................................................... 111
4.4.3. Results ................................................................................................................... 113
4.4.4. Discussion ............................................................................................................. 116
4.5. Conclusions ...................................................................................................................... 119
Chapter 5 ................................................................................................................................. 121
5.1. Introduction ..................................................................................................................... 122
5.2. Materials and specimen................................................................................................... 123

6
5.3. Compressive behaviour of cancellous bone and open-cell metallic foams .................... 124
5.3.1. Material characterisation ..................................................................................... 124
5.3.2. Mechanical testing ................................................................................................ 126
5.3.3. Results ................................................................................................................... 128
5.3.4. Discussion ............................................................................................................. 131
5.4. Compressive fatigue behaviour of cancellous bone and bone analogous materials under
multi-step loading conditions ................................................................................................. 135
5.4.1. Mechanical testing and SEM analysis ................................................................... 135
5.4.2. Results ................................................................................................................... 137
5.4.3. Discussion ............................................................................................................. 144
5.5. Foam-cement interface under mixed-mode loading conditions: a preliminary study ... 146
5.5.1. Experimental procedures...................................................................................... 146
5.5.2. Results and discussion .......................................................................................... 148
5.6. Conclusions ...................................................................................................................... 152
Chapter 6 ................................................................................................................................. 154
6.1. Discussion ........................................................................................................................ 155
6.2. Conclusions ...................................................................................................................... 159
6.3. Future work ...................................................................................................................... 162
6.3.1. Fixation endurance testing of acetabular reconstructs ........................................ 162
6.3.2. Bone-cement interface mechanics ....................................................................... 163
6.3.3. Bone analogous materials characterisation ......................................................... 163
Chapter 7 ................................................................................................................................. 164
7. References ....................................................................................................................... 165
Chapter 8 ................................................................................................................................. 193
8. Contributions to publications produced during the course of this work ........................ 194
8.1. Journal papers .......................................................................................................... 194
8.2. Conference papers ................................................................................................... 195

7
Declaration
Whilst registered as a candidate for the above degree, I have not been registered for any
other research award. The results and conclusions embodied in this thesis are the work of
the named candidate and have not been submitted for any other academic award. Most of
the results presented in this thesis have already been published.
Signed:
Date:

8
List of figures Figure 2. 1: A human adult skeleton: frontal view
(http://www.daviddarling.info/encyclopedia/S/skeleton.html). ............................................. 23
Figure 2. 2: Schematic representation of a human femur (Varini, 2007). ................................ 24
Figure 2. 3: Trabecular and cortical bone distribution in the proximal femur
(http://www.ilsb.tuwien.ac.at/~daxner/ictam-projekt/my-femur-section-small.jpg ). .......... 26
Figure 2. 4: A schematic of a long bone shaft portion, showing details of cortical bone
structure (Cowin, 2001). ........................................................................................................... 27
Figure 2. 5: Three-dimensional trabecular bone architecture of a lumbar spine bone biopsy
(Nazarian & Muller, 2004). ........................................................................................................ 29
Figure 2. 6: Natural human hip joint (http://www.corbisimages.com/stock-photo/rights-
managed/42-17799773/human-hip-and-pelvic-bones). .......................................................... 40
Figure 2. 7: Acetabulum, showing the cup-shaped cavity (A), and its articulation with the
femur (B) (http://medical-dictionary.thefreedictionary.com/acetabulum). ........................... 41
Figure 2. 8: Planes of section. Sagittal, coronal and transverse planes (http://medical-
dictionary.thefreedictionary.com/plane). ................................................................................ 43
Figure 2. 9: The gait cycle and contact force in normal walking (Bergmann et al., 2001). ...... 44
Figure 2. 10: Schematic cemented acetabular replacement in a total hip replacement
(Stolk et al., 2004). .................................................................................................................... 49
Figure 2. 11: DeLee & Charnley zones identification and distribution relative to the anterior-
posterior schematic view of THR (Dumbleton & Manley, 2004). ............................................. 54
Figure 2. 12: Equation describing the polymerisation reaction. Mono-methyl-methacrylate
molecules are forming into polymer chains (Huiskes, 1979).................................................... 57
Figure 2. 13: Temperature-time curve of the polymerisation process (Huiskes, 1979). .......... 58
Figure 2. 14: Histology of the bone-cement bond. (A) - cement, (B) - fibrous tissue, (C) - dead
cancellous bone and (D) - new lamellar bone deposited on dead bone and closing the
trabecular space, (E) - fatty marrow with normal appearance (Charnley, 1964). .................... 59
Figure 2. 15: Failure type classification of bone-cement interface specimens (Miller et al.,
2007). ........................................................................................................................................ 65
Figure 2. 16: The composite sawbone specimen under in vitro fatigue test (Heaton-Adegbile
et al., 2006). .............................................................................................................................. 68
Figure 2. 17: The Portsmouth four-station hip simulator with a specimen loaded in one of the
test cells (Zant et al., 2008). ...................................................................................................... 69
Figure 2. 18: Schematic of the Portsmouth hip simulator with the coordinate system (Zant
et al., 2008). .............................................................................................................................. 70
Figure 2. 19: Comparison of the hip contact forces as demand signal (line) and response of
the machine (symbol) for normal walking (a), ascending stairs (b), and descending stairs (c)
(Zant et al., 2008). ..................................................................................................................... 71

9
Figure 2. 20: Debonding at the bone-cement interface of a sample tested under descending
stairs loading condition. (a) A CT scan image showing clear demarcation at the bone-cement
interface; (b) almost complete separation of the bone-cement interface (Tong et al., 2008). 72
Figure 2. 21: A simple environmental chamber with SBF (Wang, 2009). ................................. 74
Figure 2. 22: The different trabecular structure of: (a) bovine proximal tibial, (b) human
proximal tibial, (c) human femoral neck and (d) human vertebral trabecular bone (Keaveny et
al., 2001). ................................................................................................................................... 78
Figure 2. 23: Histogram of a typical 16-bit 3D CT image of bovine trabecular bone. The left
peak represents background voxels, whereas the right peak represents bone voxels (Kim et
al., 2007). ................................................................................................................................... 80
Figure 2. 24: IGFA of representative open-cell aluminium foam (a) and whale bone core (b)
(Nazarian & Muller, 2004). ........................................................................................................ 84
Figure 2. 25: IGFA of local failure: (a) rod-like element undergoing large local strain; and (b)
although inter-nodal strain can be small, large deformation can occur (Nazarian & Muller,
2004). ........................................................................................................................................ 85
Figure 3. 1: The acetabular reconstruct implant used in this study. ........................................ 88
Figure 3. 2: The new environmental chamber with its five modular components (a-f) and
assembled (f). ............................................................................................................................ 89
Figure 3. 3: The prototype environmental chamber installed on the hip simulator. ............... 90
Figure 3. 4: The XT H 225 µCT system description (www.nikonmetrology.com). .................... 91
Figure 3. 5: Schematic representation of the experimental setup. The sample was first fixed
onto the base plate (a), the chamber was then assembled around the specimen (b), into
which a saline solution (0.9% NaCl) was filled (c). The solution was kept at 37°C and circulated
during testing (Tozzi et al., 2012). ............................................................................................. 92
Figure 3. 6: The combined loading block built from the four physiological activities as an
hourly loading block that was used in the current testing (Wang et al., 2009). ...................... 93
Figure 3. 7: µCT sectional reconstructions recorded at selected loading intervals for (a) right
and (b) left implanted hips. The images are shown with the DeLee & Charnley zones
identified. For both samples, the bone-cement interface appeared to be intact prior to
testing. Interfacial debonding between the bone and the cement seemed to initiate in zone I
in the superior quadrant, as indicated by the arrows (Tozzi et al., 2012). ............................... 95
Figure 3. 8: µCT images from a mid-section for (a) an implanted hip tested under normal
walking in dry conditions (Zant, 2006), where debonding developed near the dome region
(DeLee & Charnley zone II) at about 2,000,000 cycles; (b) an implanted hip tested in wet
conditions (current), where a demarcation may be observed in DeLee & Charnley zone I at
just 100,000 cycles, as indicated by the arrows (Tozzi et al., 2012). ........................................ 97

10
Figure 4. 1: The bone-cement interface sample used in this study (all dimensions are in mm).
................................................................................................................................................. 102
Figure 4. 2: (a) The custom-made micro-mechanical loading stage (LS) within the µCT
chamber; (b) a schematic of the LS, which was used to apply the load in stepped compression
(Tozzi et al., 2012b). ................................................................................................................ 103
Figure 4. 3: (a) Schematic of the loading arrangement for tensile (0°), shear (90°) and mixed
mode (22.5°, 45°, 67.5°) loading conditions. (b) The opening and the sliding displacements as
measured using a clip gauge and a video extensometer, respectively (Wang et al., 2010). . 104
Figure 4. 4: (a) Normalised apparent interfacial strength as a function of the loading angle. (b)
Normalised apparent interfacial strength as a function of normalised cement penetration.106
Figure 4. 5: Morphologies of some of the failed bone-cement interface samples tested under
tensile (0°), mixed mode (22.5°, 45°, 67.5°) and shear (90°), examined using micro-CT
scanning. Note bone and cement are marked accordingly (bone-red; cement-blue) (Wang et
al., 2010). ................................................................................................................................. 107
Figure 4. 6: The average cement penetration over the volume was estimated by (a)
measuring firstly the penetration depths (marked “x”) at a regular interval (0.5mm) from a
reference line AB on a frontal cross section (Maher and McCormack, 1999), where W is the
width of the sample; (b) repeating the measurement across the thickness (S) of the specimen
at the same interval (0.5mm) on all the frontal cross sections. A volume average was then
obtained from all the measurements (Tozzi et al., 2012b). ................................................... 112
Figure 4. 7: 3D reconstructions of the five bone-cement interface samples tested (BC01-
BC05) and selected sub-volumes (rectangles), where the progressive micro-damage was
monitored: (a) Unloaded; (b) at the ultimate stress; (c) failure state and (d) details of the local
damage (mostly trabeculae buckling) in the bone-cement contact region, as indicated by the
arrows (Tozzi et al., 2012b). .................................................................................................... 114
Figure 4. 8: Correlations between (a) cement penetration and bone-cement contact area; (b)
interfacial strength and cancellous bone volume fraction (BV/TV); (c) cement penetration and
BV/TV and (d) interfacial strength and cement penetration. The correlations range from very
good (r2 = 0.94 for (a)) to poor (r2 = 0.18 for (d)) (Tozzi et al., 2012b). .................................. 115
Figure 4. 9: The stress-displacement curves obtained from the compressive testing of the five
samples. The dots (red=unloaded, yellow=ultimate strength, dark blue=failure) on the
experimental curves indicate the positions at which the samples were imaged under a fixed
displacement. The discontinuities are due to the stress relaxation in the samples under a
constant displacement (Tozzi et al., 2012b). .......................................................................... 116
Figure 4. 10: a) The percentage of energy dissipated from the bone in BC-PI (Bone-Cement
Partially Interdigitated) and BC-FI (Bone-Cement Fully Interdigitated) regions. b)-e) The
predicted progressive development of yielded elements from the FE model under a
compressive displacement of: b) 0.05mm; c) 0.1mm; d) 0.2mm and e) 0.3mm. Yielding
appears to initiate mainly in the Bone and partially interdigitated (BC-PI) regions, developing

11
across the fully interdigitated (BC-FI) region. Red: Bone; blue: Cement (Tozzi et al., 2012b).
................................................................................................................................................. 117
Figure 4. 11: (a) CT image of a typical bone-cement interface sub-volume (Fig. 4.7a, BC01). (b)
The local predicted minimum principal strain distribution of the same sub-volume from the
FE model and (c) the damage sustained at the failure state during the experiment (Fig. 4.7c,
BC01). The high local compressive strain predicted (b) may explain the local buckling damage
(c), as indicated by the arrows (Tozzi et al., 2012b). .............................................................. 118
Figure 5. 1: (a) The open-cell production process and (b) the cylindrical foam specimen used
in this study. ............................................................................................................................ 123
Figure 5. 2: 3D µCT reconstructions of (a) bovine trabecular bone; (b) 45ppi AlSi7Mg foam;
(c) 30ppi AlSi7Mg foam and (d) 30ppi CuSn12Ni2 foam (Guillen et al., 2011). ...................... 125
Figure 5. 3: Schematic of the experimental setup. The sample was embedded into the
endcaps using acrylic resin. Strains were measured using an extensometer attached to the
end-caps (Guillen et al., 2011). ............................................................................................... 127
Figure 5. 4: Mechanical responses as measured of (a) bovine trabecular bone; (b) 45ppi
AlSi7Mg; (c) 30ppi AlSi7Mg and (d) 30ppi CuSn12Ni2 foam (Guillen et al., 2011). ................ 129
Figure 5. 5: SEM micrographs of (a) bovine trabecular bone; (b) 45ppi AlSi7Mg; (c) 30ppi
AlSi7Mg and (d) 30ppi CuSn12Ni2 foam (Guillen et al., 2011). .............................................. 130
Figure 5. 6: A schematic representation of a multi-step compressive fatigue test (Guillen et
al., 2011b)................................................................................................................................ 135
Figure 5. 7: Mechanical behaviour of 30ppi AlSi7Mg: (a) Monotonic compression test curve,
(b) max/min strain of the short multi-step test, (c) hysteresis loops of the short multi-step
test (Guillen et al., 2011b). ...................................................................................................... 138
Figure 5. 8: Mechanical behaviour of 30ppi CuSn12Ni2: (a) Monotonic compression test
curve, (b) max/min strain of the short multi-step test, (c) hysteresis loops of the short multi-
step test (Guillen et al., 2011b). .............................................................................................. 140
Figure 5. 9: Mechanical behaviour of trabecular bone: (a) monotonic compression test curve
(b) max/min strain of the short multi-step test, (c) hysteresis loops of the short multi-step
test (Guillen et al., 2011b). ...................................................................................................... 141
Figure 5. 10: Strain development from a multi-step fatigue test of (a) 45ppi AlSi7Mg and (b)
trabecular bone (Guillen et al., 2011b). .................................................................................. 142
Figure 5. 11: Failure analysis of the samples using SEM (failure mode 1: buckling, 2: rupture,
3: splitting): (a) 30ppi AlSi7Mg, (b) 45ppi AlSi7Mg, (c) 30ppi CuSn12Ni2 foam and (d)
trabecular bone (Guillen et al., 2011b). .................................................................................. 143
Figure 5. 12: The foam-cement interface samples used in this study. .................................. 147
Figure 5. 13: The stress-displacement responses of the three foam-cement and bone-cement
composites tested under mixed-mode loading conditions at angles of (a) 0°, (b) 22.5°, (c) 45°,
(d) 67.5° and (e) 90°. ............................................................................................................... 149
Figure 5. 14: The apparent interfacial strength as a function of the loading angle. ............. 150

12
Figure 5. 15: (a) Optical and (b) SEM image of a failed foam-cement interface tested at 0°.
................................................................................................................................................. 151
Figure 5. 16: Optical (a) and SEM (b) of a failed foam-cement interface sample tested at 90°.
................................................................................................................................................. 152
Figure 6. 1: Bone-cement interface transition from macro to micro level. ........................... 156
Figure 6. 2: (a) Local stress distributions at the bone-cement interface at peak hip contact
force during normal walking; (b) the plane strain pelvic bone (P) and 3D pelvic bone (3P)
models (Tong et al., 2008). ..................................................................................................... 157

13
List of tables Table 2. 1: Mechanical properties of cancellous bone tested under tension and compression
from selected sources. .............................................................................................................. 31
Table 2. 2: Values of elastic modulus of cancellous bone tissues from selected sources. ....... 32
Table 2. 3: Mechanical properties of selected cement brands (Lewis, 1997). ......................... 58
Table 2. 4: Order, amounts, weighing containers, purities and formula weights of reagents for
preparing 1000ml of SBF (Kokubo & Takadama, 2006). ........................................................... 73
Table 2. 5: Selected morphological parameters reported in literature for (1) healthy, (2)
osteoporotic and (3) bovine trabecular bone. .......................................................................... 82
Table 5. 1: A summary of the morphometry results from all the tests performed on the three
foams and bone (Guillen et al., 2011). .................................................................................... 128
Table 5. 2: The mechanical properties obtained from testing of the three foams and bone
(Guillen et al., 2011). ............................................................................................................... 129
Table 5. 3: Comparison of monotonic (see Table 5.2 in Paragraph 5.3) and multi-step fatigue
test results (Guillen et al., 2011b). .......................................................................................... 139

14
Acknowledgments
I wish to express my profound debt to my first supervisor and Director of Studies, Prof Jie
Tong for the enthusiastic support and guidance provided throughout my period of study and
the encouragement for personal development.
Special thanks are due to all the members of the Mechanical Behaviour of Materials (MBM)
group of the University of Portsmouth, and in particular, Mr Colin Lupton for all his help
during the experimental phases and otherwise, as well as Dr Qinghang Zhang and Dr Philip
Heaton-Adegbile for always kind and productive cooperation.
I would also like to thank Prof Hans-Jurgen Christ and Mr Teodolito Guillen for excellent
assistance during my research stage at the University of Siegen (Germany) and fruitful
collaboration.
Finally I would like to express my gratitude to all my friends and the wonderful people who
always believed in me and strongly contributed to shape the person who I am now.
The research project was fully funded by the University of Portsmouth. The work carried out
in collaboration with the University of Siegen was funded by the British Council.
A special mention goes to Alki for her constant help, support and encouragement during this
adventure. You have changed my life in many ways, thank you from the bottom of my heart!

15
Dedication
To my family

16
Chapter 1
Introduction

17
1. Introduction
With the increase in life expectancy and a growing number of younger active patients
receiving joint replacement treatment, there is an urgent need to revisit cemented total hip
replacements (THR) procedures in order to improve the survival lives of cement fixation
beyond 10 to 20 years, so that the need for revision surgeries can be drastically reduced. In
the UK, according to the National Joint Registry (NJR Annual Report 2011, UK), of the 68,907
primary hip replacement procedures undertaken in 2010, 36% were cemented THRs.
Aseptic loosening has been identified as the most common symptom of long-term instability
leading to gross migration of the implants and failure of THRs (Stocks et al., 1995; Thanner et
al., 1999). Many theories have been proposed to explain the loosening process (Huiskes et
al., 1993), although its multifactorial etiology is generally accepted now, where both
biological and mechanical events are involved in the failure of the fixation (Huiskes et al.,
1993; Sundfeldt et al., 2006).
Although late loosening of cemented acetabular cups has been reported to be three times
that of femoral components 20 years after operation (Shulte et al., 1993), few studies have
been reported with regard to the failure of acetabular fixation under long-term physiological
loading conditions (Heaton-Adegbile et al., 2006; Zant et al., 2007, 2008; Tong et al., 2008;
Wang et al., 2009). All the previous in vitro studies, however, have been conducted in dry
conditions, where the effect of environment on the fixation integrity was not considered.
To achieve a good fixation in cemented implants, the mechanical interlock between the bone
cement and the cancellous bone is considered of vital importance (Krause et al., 1982;
Bugbee et al., 1992; Majkowski et al., 1993; Mann et al., 1997), and cementing techniques

18
such as pressurization were found useful in increasing the mechanical interlocking and
stability of the interface (Oates et al., 1995; Flivik et al., 2005).
Numerous experimental studies have been carried out on bone-cement interfacial strength
under tensile (Mann et al., 1997), shear (Mann et al., 1999), mixed mode (Mann et al., 2001)
and creep-fatigue (Kim et al., 2004) loading conditions. Recently, the micromechanical
behaviour of bone-cement interface was investigated under tension (Mann et al., 2008),
tension-compression (Miller et al., 2009), shear fatigue (Mann et al., 2009) and multi-axial
(Miller et al., 2011) loading conditions. However, the local deformation and damage
development at the interface were only captured on the exterior surfaces of the samples
hence the analysis was limited to a 2D investigation, whilst internal volume responses could
not be interrogated.
Biomechanical testing of orthopaedic implants in cadaver bones has provided valuable
information on pre-clinical assessment of implant performance. However, the method is
limited by the availability of cadaveric tissues. Furthermore, the reproducibility of such test
results is generally poor, because of the large variation in the mechanical properties of
cancellous bones due to a number of variables such as anatomic site, disease state and age
(Goldstein, 1987; Linde, 1994; Keaveny & Hayes, 1993; Keaveny et al., 2001; Gibson, 2005).
For this reason it is desirable, in orthopaedic related research, to employ bone substitutes in
mechanical characterisation and testing in order to remove some of the variables in cadaver
tissues; and, furthermore, to simulate a range of cancellous bones properties by controlling
the morphological parameters in bone analogue materials.

19
The aim of this work is to provide a better understanding of how the bone-cement interfacial
behaviour from a macro level (acetabular reconstructs) to a micro level (bone-cement
interface coupons) is related to environmental (i.e. wet conditions, temperature), structural
(i.e. depth of cement penetration, contact area, bone volume fraction) and operational (i.e.
loading condition) parameters. Open-cell metallic foams suitability, as cancellous bone
substitutes for cemented biomechanical characterisation of the interface, is also explored.
This aim was realised through the following objectives:
The fatigue behaviour of the bone-cement fixation in acetabular replacements under
physiological loading conditions in a saline environment was studied by in vitro
testing on a specially designed hip simulator, through a new experimental protocol.
The bone-cement interfacial behaviour under mixed-mode loading conditions and its
micromechanical compressive response were evaluated experimentally by means of
experimental techniques, including µCT examination and image-guided failure
assessment (IGFA).
Selected metallic open-cell foams were mechanically and morphologically
characterised under uniaxial and cyclic loading conditions, and the results compared
with those obtained from bovine cancellous bone. Preliminary testing of foam-
cement interface was carried out under mixed-mode loading conditions.
Chapter 2 provides some background knowledge to the present work and a review of the
relevant literatures. Chapter 3 presents the results of fatigue testing on the hip simulator
with a new environmental chamber to study the long-term mechanical response of
cemented acetabular reconstructs under a combined loading block in a wet environment. In
Chapter 4 the mechanical performance of the bone-cement interface under mixed-mode

20
loading conditions and its compressive micromechanical behaviour are reported. Chapter 5
presents the mechanical and morphometrical characterisation of open-cell metallic foams to
determine their suitability as cancellous bone substitutes for cemented biomechanical
applications. Furthermore, foam-cement interface coupons were prepared and a preliminary
determination of their mechanical performance under mixed-mode loading conditions is
given. Chapter 6 presents a final discussion, the main conclusions and suggests some ideas
for future studies.

21
Chapter 2
Literature Review

22
2.1. Bone and bones
2.1.1. The human skeleton
The skeletal tissues, such as cartilage and bone, are highly specialised type of connective
tissues which have a primary role of supporting structure (Cowin, 2001; Williams, 1995). The
main constituent of the skeleton is bone (Fig. 2.1), which is different from the other
connective tissues (i.e. cartilage, ligaments and tendons) due to the high mineralization of
the extra cellular matrix. Thus, the main characteristics of this type of human tissue are
rigidity and hardness that ensure the necessary stiffness of the skeleton to maintain the
shape of the body, to transmit muscular forces through the body during movement, to
protect the soft tissues of the cranial, thoracic and pelvic cavities and to supply the
framework for the bone marrow.
2.1.2. Bone morphology
According to their shape, bones can be divided into different families (Williams, 1995):
Long bones, such as femur, tibia, humerus;
Short bones, such as carpus, tarsus;
Flat bones, such as cranial vault, scapulae;
Irregular bones, any bones not easily assigned to one of the former groups.
A typical example of the macroscopic morphology of bone can be observed in long bones. As
shown in Fig. 2.2, they consist of a cylindrical shaft (or diaphysis) and two wider and rounder
ends, also called epiphyses. Conical regions, or the metaphyses, connect the diaphysis with
the epiphyses. Most long bones have the ends wider than their central part, with the joints
covered by articular cartilage.

23
Figure 2. 1: A human adult skeleton: frontal view (http://www.daviddarling.info/encyclopedia/S/skeleton.html).

24
Figure 2. 2: Schematic representation of a human femur (Varini, 2007).
2.1.3. Bone microstructure
Bone composition
Bone consists of approxiately 65% mineral and 35% organic matrix, cells and water. Bone
mineral, usually presented in the form of small crystals, is placed between the collagen
fibers. Bone mineral is mainly impure hydroxyapatite, Ca6(PO4)6(OH)2, containing carbonate,
citrate, fluoride and strontium. The organic matrix consists of 90% collagen and about 10%

25
non collagenous proteins. From a mechanical point of view the bone matrix is comparable to
a composite material: the organic component is responsible for providing the toughness,
while the inorganic component provides the stiffness (Cowin, 2001).
Woven and lamellar bone
Mammalian bone is divided into two main groups: woven and lamellar. In a developing
embryo, the bone tissue is of woven type. It is a matrix of interwoven coarse collagen fibres,
containing osteocytes distributed in an approximate random way. Woven bone can be seen
as a provisional material, eventually resorbed and replaced by lamellar bone. Adult bone is
mainly composed of lamellar bone, which is built up of 3μm to 7μm thick unit layers
(lamellae) containing collagen fibres distributed forming a parallel pattern with each other
(Cowin, 2001).
Cortical and trabecular bone
Adult bone is composed of two basic structures (Cowin, 2001), called cortical (or compact)
and trabecular (or cancellous) bone (Fig. 2.3). Cortical bone is a solid and compact material,
with the exception of microscopic canals (Haversian canals). Approximately 80% of the
skeletal mass in the adult skeleton is composed by cortical bone. It forms the outer wall of all
bones, and is mainly responsible for the supportive and protective functions of the skeleton.
The remaining 20% of the bone mass is trabecular bone, which is found in the internal parts
of the skeleton and appears as a lattice of plates and rods, called trabeculae. A typical
thickness for the trabeculae can range from 100μm to 350μm. Trabecular bone is more
compliant and weaker than cortical bone due to its porous structure. Its mechanical
properties are more varied compared to those of cortical bone due to its microstructure

26
irregularity. However, trabecular bone has very important roles where it 1) stiffens the
structure by connecting the outer shell of cortical bone; 2) supports the cortex layer and
distributes loads; and 3) protects the cortical bones from instability (buckling).
Figure 2. 3: Trabecular and cortical bone distribution in the proximal femur (http://www.ilsb.tuwien.ac.at/~daxner/ictam-projekt/my-femur-section-small.jpg ).
Bone is limited to appositional growth by the non-expandable nature of its mineralized bone
tissue (Cowin, 2001), for this reason all bone activities occur at the surfaces. Bone tissue has
two principal surfaces: periosteal and endosteal. The periosteum covers the external bone
surface, and is composed of a sheet of fibrous connective tissue and an inner layer of
undifferentiated cells, with the potential to form bone during growth and fracture healing.

27
The periosteum is absent in regions where tendons or ligaments are attached to the bone, on
bone ends covered with articular cartilage, in subscapular areas and in the neck of the femur.
The endosteum is a thin cellular layer of bone surface cells (osteoclasts, osteoblasts, and
bone lining cells), that covers the marrow cavity of the diaphysis and the cavities of cortical
and trabecular bone.
Cortical bone
The main structural unit of cortical bone is the osteon or Haversian system (Fig. 2.4).
Figure 2. 4: A schematic of a long bone shaft portion, showing details of cortical bone structure (Cowin, 2001).
A typical osteon is a cylinder about 200μm in diameter, consisting of a central canal
(Haversian canal) surrounded by about 20-30 concentric lamellae. The cortical bone presents

28
several layers of osteons in the shaft of long bones. In the gaps between osteons interstitial
lamellae appear as angular fragments of previous concentric and circumferential lamellae.
Blood flows through the Haversian canals where lymphatics vessels and nerves are running.
Transverse canals, also called Volkmann canals, have the function to interconnect the
Haversian canals allowing the communication between periosteum and bone marrow. The
outer border of each osteon is surrounded by a cement line, which is a thick layer of
mineralized matrix with dimensions ranging from 1μm to 2μm, deficient in collagen fibres.
Throughout the bone, small cavities (lacunae) containing entrapped bone cells (osteocytes)
are visible. Microscopic tubular canals (canaliculi) connect the lacunae to each other and to
the Harversian canals (Cowin, 2001).
Trabecular bone
Trabecular bone is characterised by the absence of Haversian systems, and consists of an
array of interconnected rods and plates (trabeculae). The trabeculae are in general of a
thickness less than 0.2mm and are variable in shape (Fig. 2.5). The trabecular tissue is formed
by a mosaic of angular segments of parallel sheets of lamellae, preferentially aligned with the
orientation of the trabeculae. The angular grouping of lamellae are called trabecular packet
and define the structural unit of trabecular bone. As with cortical bone, cement lines hold the
trabecular packets together (Ohman, 2011).

29
Figure 2. 5: Three-dimensional trabecular bone architecture of a lumbar spine bone biopsy (Nazarian & Muller, 2004).
There are great differences in the apparent density of trabecular bone in different locations
in the human skeleton, and this is the main reason why it is possible to find trabecular bone
with very different characteristics. Moreover the orientation of the trabeculae is related to
the anatomical site and aligned to the loading regime experienced locally. Hence there is a
clear dependence between the mechanical properties of trabecular bone and the trabecular
orientation (Ohman et al., 2007). The trabecular structure is mainly oriented along the
primary loading direction, clearly defined as main trabecular direction (MTD). However, in a
joint, the loading direction varies during routine activities and may be affected by local
anatomy, muscle forces and subject-specific gait, resulting in complex trabecular structures.

30
2.1.4. Mechanical properties of cancellous bone
According to the main aim of this thesis and the materials used in the experimental work, the
principal emphasis will be placed on the trabecular bone properties. The reported
mechanical properties of cancellous bone exhibit a high degree of variation due to many
factors such as anatomical site, age and disease state, not to mention its viscoelastic and
anisotropic nature. The measured values of strength and modulus also depend on the
experimental arrangements used for testing (i.e. direction of loading and strain rate of
testing), as reviewed by Keaveny & Hayes (1993) and Keaveny et al. (2001).
Cancellous bone also exhibits strength asymmetry (difference in compressive and tensile
strength), with a lower strength in tension compared with compression, and still lower in
shear (Keaveny et al., 2001). Some reported values for elastic modulus and strength of
cancellous bone tested under tension and compression are shown in Table 2.1.
Ford & Keaveny (1996) measured the shear failure properties of bovine tibial trabecular
bone, where specimens were loaded to failure in torsion longitudinally or transversely
relative to the primary trabecular orientation (MTD). The difference in ultimate stress for
longitudinal (6.35(±2.00)MPa) and transverse (4.92(±1.48)MPa) is a clear indication of the
typical cancellous structure anisotropy.

31
Table 2. 1: Mechanical properties of cancellous bone tested under tension and compression from selected sources.
The properties of cancellous bone can be defined at the apparent level or at the tissue level.
The apparent level considers bone as a continuum with the average properties of a
representative bone volume. This definition was introduced by Harrigan et al. (1988) for a
cube with a minimum of five trabecular lengths, which equates to approximately 5mm. The
properties of the individual trabeculae are defined at tissue level.
Although the tissue-level elastic properties of trabecular bone have been reported in
numerous studies (Cowin, 2001), there remain substantial discrepancies in these data and

32
there are almost no data available for tissue-level failure properties. Nanoindentation
technique is extensively used in materials science for probing the mechanical properties of
thin films, small volumes and small microstructural features. Since many of these features of
interest in bone are several micrometres or more in dimension, nanoindentation provides a
direct and accurate determination of the elastic properties at tissue level (Rho et al., 1997).
Another approach to direct mechanical testing at the tissue level is to use finite element
models built from micro-computed tomography (µCT) scans, together with specimen-specific
experimental data at the apparent level to calibrate ‘‘effective’’ elastic properties of the
tissue (Van Rietbergen et al., 1995). Table 2.2 shows some reported values of the tissue
properties obtained utilising different investigation methods.
Table 2. 2: Values of elastic modulus of cancellous bone tissues from selected sources.

33
Due to the degree of variation in the mechanical properties of cancellous bone, many
attempts have been made to describe the strength and modulus of bone as a function of
apparent density (or bone volume fraction). Cancellous bone exhibits an open cellular
structure. For cellular materials, mechanical properties are strongly related to apparent
density. For compressive behaviour, a number of equations have been proposed in literature
to describe the correlation between the mechanical behaviour of bone and bone density
(Carter & Hayes, 1977; Anderson et al., 1992; Hodgskinson & Currey, 1992; Linde et al., 1992;
Li & Aspden, 1997; Kopperdahl & Keaveny, 1998; Ciarelli et al., 2000; Keaveny et al., 2001;
Morgan, et al., 2003; Kaneko et al., 2004). Carter & Hayes (1977) tested human and bovine
specimens of cortical and cancellous bone, and showed a quadratic relationship between the
compressive strength and the apparent density; and a cubic relationship between the
apparent modulus and the density. Hodgskinson & Currey (1992) tested bovine, horse and
human cancellous bone cubes so that a range of bone densities was considered. They
reported a relationship that was closer to quadratic, with an exponent of density ranging
from 1.57 to 2.47. According to Cowin (2001), bone volume fraction accounted for 92% of the
variation in measured Young’s modulus, 88% of the variation of shear modulus and 76%
variation in Poisson’s ratio. Keaveny et al. (2001) reported power law regressions between
the ultimate compressive stress and the apparent density of human trabecular bone
specimens, from a range of anatomic sites, with values of r2 up to 0.93. However a recent
literature review (Helgason et al., 2008) found that, although normalised according to density
measurement unit and loading rate, the equations reported in literature still showed
considerable scatters and it was difficult to draw any definitive conclusions.

34
An alternative approach, for generalisation of the apparent level mechanical properties of
bone, based on cellular theory, is to create a model of an idealised structure of cancellous
bone. The repetitive structure, based on unit cells, is used to represent the structure of bone.
Structural analysis (which can be in 2D or 3D) is then performed on this idealised structure to
derive theoretical relationships between bone volume fraction and mechanical properties
(Kowalczyk, 2003; Gibson & Ashby, 1997; Zhu et al., 1997). These idealised versions of bone
structure can be combined with finite element analysis (FEA) to isolate and examine the
effect of microstructure on the continuum properties. The structure of the unit cell is of vital
importance in the determination of the mechanical properties. Kim & Al-Hassani (2002)
examined the effect on the mechanical properties of strut taper in an analytical cellular
model of vertebral bone, showing how the strut taper model exhibited mechanical
properties in the order of 1.8-2.2 times higher than those with uniform struts. This study
highlights one of the disadvantages of using only idealised models to simulate the complex
architecture of cancellous bone.
Due to the irregularity in native trabecular bones, synthetic cellular materials are often used
as cancellous bone substitutes for in vitro biomechanical testing due to their uniformity,
consistency in properties and availability. A set of materials with known consistent and
controllable mechanical properties, within the range of properties of cancellous bone, can
provide valuable alternatives to cadaver bones as test substrates (Szivek et al., 1995). Three
dimensional cellular solids are often known as foams. The foam properties generally depend
on the bulk material. Rigid polyurethane and aluminum foams have been reported to exhibit
similar mechanical (Szivek et al., 1995; Nazarian & Muller, 2004; Thompson et al., 2003) and
morphological (Johnson & Keller, 2007) properties to those of cancellous bones.

35
Metallic foams have been favoured for orthopaedic research and testing purposes for their
open-celled, interconnected structure with essentially homogeneous but adjustable
densities. The properties of the metallic foams depend on the bulk metal properties and the
relative density of the foam, the distribution of the material within the foam and the
architecture of the foam (Gibson & Ashby, 1997; Gibson, 2005). Open-cell metal foams
exhibit a combination of high interconnecting porosity, high deformability and high specific
stiffness (Krupp et al., 2006). These characteristics make them excellent candidates for light-
weight designs that combine functional and structural properties (Antsiferov et al., 2005).
Mechanical behaviour of metallic foams have been investigated in numerous studies
(Andrews et al., 1999; Evans et al., 1998; Prakash et al., 1995; Weber et al., 1994), although a
testing protocol had not been available until recently (DIN 50134, 2008). This protocol allows
a more consistent approach in the measurement of the mechanical properties, and
particularly the elastic modulus. Open-cell aluminum foams have been used to determine
the accuracy of a time-lapsed µCT imaging technique for bone and cellular solids (Nazarian &
Muller, 2004; Nazarian et al., 2005). However, the main goals of these studies were other
than exploring these materials as cancellous bone substitutes. This will be further discussed
in Chapter 5.
2.1.5. Limitations in determining the mechanical properties of bone
The structure and properties of bones vary with many factors such as age, sex, disease and
species. This, together with experimental errors, accounts for the large variation in the
measured values of strength and modulus of bones (Keaveny et al., 2001). Experimentally,
the preparation of samples can affect the measured properties of bone also. Preparation of
specimens can damage individual trabeculae leading to an underestimation of modulus;

36
similarly chemicals and storage can also have a deleterious effect on the properties of bone
(Cowin, 2001). A common testing procedure to determine the bone compressive properties
involves the use of platens, where the bone is sandwiched between two parallel plates and
compressed at a set strain rate until failure occurs. End artefacts such as non-uniform
deformation of the bone surface or friction between the sample and the platens are primary
sources of errors in the measured properties. Keaveny et al. (1994, 1997) showed that the
end effects can result in 20-40% errors in the determined values of modulus, and suggested
that the ends of the specimens should be embedded into a sample holder to reduce the
artefacts. The measured bone properties are also dependant on the specimen geometry
(Linde et al., 1992; Keaveny et al., 1993), strain rate used for testing (Linde et al., 1991) and
the test environment (Keaveny et al., 1997). Keaveny et al. (1997) reported a lower band of
experimental errors in the modulus measured using an extensometer attached to the surface
of the sample. However, the extensometer blades can damage the bone surface, inducing
errors also. An alternative way is to attach the extensometer to the holders or use non-
contact extensometers.
2.1.6. Post-yield and fatigue behaviour of cancellous bone
Post yield behaviour of bones has been determined at both apparent and tissue levels. Hayes
& Carter (1976) tested specimens of bovine cancellous bone under uniaxial compression and
examined the post yield behaviour relative to energy absorption characteristics. These tests
showed an initial linear elastic response until the yield stress is reached, followed by a region
of “strain softening” due to pore collapsing, where the stress-strain curve appears almost
horizontal. In this region, fracture and buckling of the trabeculae are both responsible for the
energy absorption and load dissipation in bone. Gibson & Ashby (1997) reported that at low

37
relative densities (ρ*/ρs < 0.3, where ρ* is the density of the cellular material and ρs the
density of the solid sample from the same material) bending and buckling of trabeculae tend
to dominate the failure of trabeculae, whereas for higher relative densities (ρ*/ρs > 0.3)
trabeculae tend to fail by the formation of plastic hinges in bending and subsequent
microcracks generation. Experiments on specimens of trabecular bone have shown that
when a bone is loaded past its yield point, there is a residual strain when it is unloaded to
zero stress. Reloading repeatedly will result in a reduced modulus. Keaveny et al. (1999)
found that for strains up to 3%, the modulus reduction of vertebral trabecular bone is in the
range of 5.2-91%. These modulus reductions are not immediately related to the change in
bone density (Kopperdahl & Keaveny, 1999), but strongly depend on the applied strain.
Reductions in strength are also associated with loading beyond the yield stress of bone.
At the tissue level, the reductions in modulus and strength as a result of overloading have
been associated with microdamage accumulation in the bone. Microdamage has been shown
to occur preferentially in trabecular bone rather than in cortical bone, and more likely to
appear in the form of microcracks than complete fracture of the trabeculae (Fyhrie &
Shaffler, 1994; Vashishth et al., 2000; Wacthel & Keaveny, 1997). Fyhrie & Shaffler (1994)
reported the compressive failure behaviour of human vertebral cancellous bone subjected to
15% strain. Their study showed that trabeculae orientated horizonatally with respect to the
applied load were the first to fracture, whereas vertically orientated trabeculae appeared to
buckle due to the accumulation of microdamage. It was also suggested that, since
disconnected trabeculae are rapidly resorbed, complete fracture of trabeculae can lead to
the loss of repair potential.

38
It has been proposed that cellular materials follow characteristic cyclic deformation
behaviour (Gibson, 2005; Ohrndorf et al., 2006; Dendorfer et al., 2009; Michel et al., 1993;
Moore & Gibson, 2003), however investigations into the fatigue behaviour of bone are
relatively limited. Michel et al. (1993) examined the fatigue behaviour of bovine trabecular
bone. The stress-strain curves exhibited increasing non-linearity, hysteresis loops and
decreasing secant modulus with time. The number of cycles to failure, defined by a 5%
reduction in secant modulus, was found to correlate with the initial global maximum strain
(r2=0.78). A difference in modulus degradation for low and high cycle fatigue was also
reported, suggesting a possibility that both creep and damage accumulation contribute to
fatigue failure of trabecular bone. Two types of failure were observed from the microscopic
analysis: brittle fracture and buckling. Moore & Gibson (2003) reported the effect of damage
accumulation under cyclic compressive loading conditions on the mechanical behaviour of
bovine trabecular bone. The specimens were loaded to various combinations of normilised
stress (Δσ/E0) and maximum compressive strain (εmax). The reduction in normalised secant
modulus (Esec/E0) and specimen residual strain (εres) increased with the increasing of
maximum compressive strain (with r2=0.66 and r2=0.76 respectively), and a weak correlation
was found between the change in the elastic modulus and the normalised stress used to load
the specimens (i.e. r2=0.34 from Esec/E0 vs Δσ/E0). It was concluded that the effects of
normalised stress and number of cycles on deformation were relatively small, suggesting that
trabecular bone failure is largely strain-based. A comparison between the cyclic compressive
behaviour of bovine and human cancellous bone was reported by Haddock et al. (2004).
Human vertebral samples were tested under cyclic compression and compared against the
literature data for bovine cancellous bone. It was found that, despite the two different

39
origins, bovine and human trabecular bones exhibit consistent qualitative and quantitative
aspects of cyclic behaviour. The results showed, for both types, a progressive loss of secant
modulus and strain accumulation with the number of cycles. These caused failure at load
levels much lower than those required for monotonic failure. More recently Dendorfer et al.
(2009) used optical deformation analysis to provide the deformation and damage
mechanisms of human and bovine cancellous bones under cyclic loading conditions. The
results showed highly nonuniform deformations where damage appeared in form of
increasing residual strains, hysteresis area and a decrease in secant modulus. Damage of
single trabeculae appeared in form of highly localised strains, which were linked to
microcrack initiation and propagation. These findings suggested that cyclic creep plays a vital
role in the deformation of cancellous bones under fatigue loading conditions consistently
with other authors (Michel et al., 1993; Bowman et al., 1998). However, Moore et al. (2004)
seems to believe otherwise, i.e. creep does not contribute to fatigue in trabecular bones.
Due to the complex behaviour of cancellous bone under fatigue loading, analogue bone
materials are often used. Open-cell foams in particular are favoured for their compressive
fatigue behaviour and their morphometric similarity to human bones (Johnson & Keller,
2007; Harte et al., 1999).

40
2.2. The human hip joint
2.2.1. Anatomy and kinematics
The hip joint is a ball and socket joint, with the femoral head articulating within the matching
acetabular socket (Fig. 2.6).
Figure 2. 6: Natural human hip joint (http://www.corbisimages.com/stock-photo/rights-managed/42-17799773/human-hip-and-pelvic-bones).
Although is not an exact spherical ball and socket joint in the meridian section, the mean
deviation from a conchoids shape is quite small. This special shape makes the joint less likely
to sublux compared to a normal ball and socket joint as reported by Menschik (1997). A
smooth cushion of articular cartilage covers the femoral head and the acetabulum, and the
articular cartilage is kept lubricated by a viscous fluid known as the synovial fluid. Its main
function as a fluid medium is to provide nutrition and lubrication within the joint. Since the
cartilage is smooth and slippery, the bones move against each other easily and without pain.
The hip joint capsule is a dense fibrous structure extending from the base intertrochanteric

41
region of the femur to the acetabular rim. Large and strong ligaments, tendons, and muscles
around the joint capsule hold the bones in place helping the joint motions and supporting
stability (Nordin & Frankel, 2001).
The acetabulum is formed at the junction of the ilium, ischium and pubis, as shown in Fig.
2.7.
Figure 2. 7: Acetabulum, showing the cup-shaped cavity (A), and its articulation with the femur (B) (http://medical-dictionary.thefreedictionary.com/acetabulum).
The ilium is a large flat bone providing broad surfaces for muscular attachment, which
extends posteriorly and forms the superior dome of the acetabulum. The ischium joins the
ilium superiorly and the pubis inferiorly, forming the posterior acetabulum. The pubis, which
serves as insertion site of the musculature of the abdominal wall as well as the site of origin
for the adductor muscles of the thigh, forms the anterior acetabulum. The lateral opening of
the acetabulum forms a circular horseshoe with the open end directed inferiorly. The
acetabulum has a deep notch, the acetabular notch, which is continuous with a circular non-

42
articular depression at the bottom of the cavity known as acetabular fossa (Wiesel &
Delahay, 2010). The acetabular fossa contributes to a more uniform articular contact stress
distribution and a consequent decrease in the peak stress, optimising the contact stress
distribution in the hip joint (Daniel et al., 2005). The rest of the acetabulum is formed by a
curved articular surface, the lunate surface, for articulation with the head of the femur.
The femur is the longest, heaviest and strongest bone in the body. As previously shown in
Fig. 2.2 the proximal part of the femur comprises of the femoral head, the neck, the greater
and the lesser trochanters. The femoral head is almost spherical in shape and smooth except
for a depression, the femoral fovea, which serves as the site of attachment of the
ligamentum teres and also houses a blood vessel that supplies blood to the head. The
femoral neck connects the head to the main body of the femur (Wiesel & Delahay, 2001).
Both the trochanters act as muscle attachment sites. The greater trochanter is located
laterally at the junction of the femoral head and neck with the lesser trochanter. The shaft of
the femur is bowed anteriorly with the distal end of the femur forming the medial and lateral
condyles, which articulates with the tibia. Two superior aspects, known as epicondyles for
both the medial and lateral condyles are sites for muscle attachment (Puthumanapully,
2010).
The motion of the hip takes place in all three planes (sagittal, coronal and transverse), as
shown in Fig. 2.8. Flexion-extension occurs through the transverse plane with a range of
movements normally of 0-120° in flexion and 0-20° in extension. Assisted flexion involves
overcoming a significant proportion of the protective tension in the hamstring muscles and
joint capsule, resulting in the generation of an extra 25-30° of flexion. Assisted extension of
the thigh only produces a further 10° of movement. Medial and lateral rotations occur in the

43
sagittal plane about the mechanical axis of the femur through a maximum of 90°. Abduction-
adduction occurs in an anterior-posterior plane, each within a 45° range (Heaton-Adegbile,
2005).
Figure 2. 8: Planes of section. Sagittal, coronal and transverse planes (http://medical-dictionary.thefreedictionary.com/plane).
2.2.2. Joint loading and gait analysis
For a complete understanding of the mechanics of total hip replacements, it is necessary to
understand first of all the mechanical behaviour of the hip bone in static and dynamic
conditions and the stresses generated in the normal acetabulum.
Within the limits of the anatomical boundary conditions, the hip bone has evolved into a very
efficient structure, which is well able to carry large forces. Consisting mainly of low-density
trabecular bone, which by itself is not strong enough to withstand alone such high loads, it is
totally covered by a thin layer of cortical bone. In this way, it resembles a so-called ‘sandwich
44
construction’, used in engineering to combine high strength and low weight (Dalstra &
Huiskes, 1995). The space between the femoral head and the acetabulum, while the joint is
articulated and loaded during walking, is known as hip incongruity (Afoke et al., 1984). The
presence of incongruity, in the anatomical configuration of a normal hip joint, governs both
the extent and the position of the weight-bearing areas in the joint and is partially
responsible for the pressure level and stress distribution across the articular surfaces
(Greenwald & O’Connor, 1971). The bone system consisted of cancellous bone, subchondrial
bone and articular cartilage may allow, in normal conditions, the transition from
incongruence to congruency resulting in a uniform and efficient distribution of the loads in
the joint. Excessive deformation, especially when repetitive, might result in microfractures in
the trabecular bone (Heaton-Adegbile, 2005).
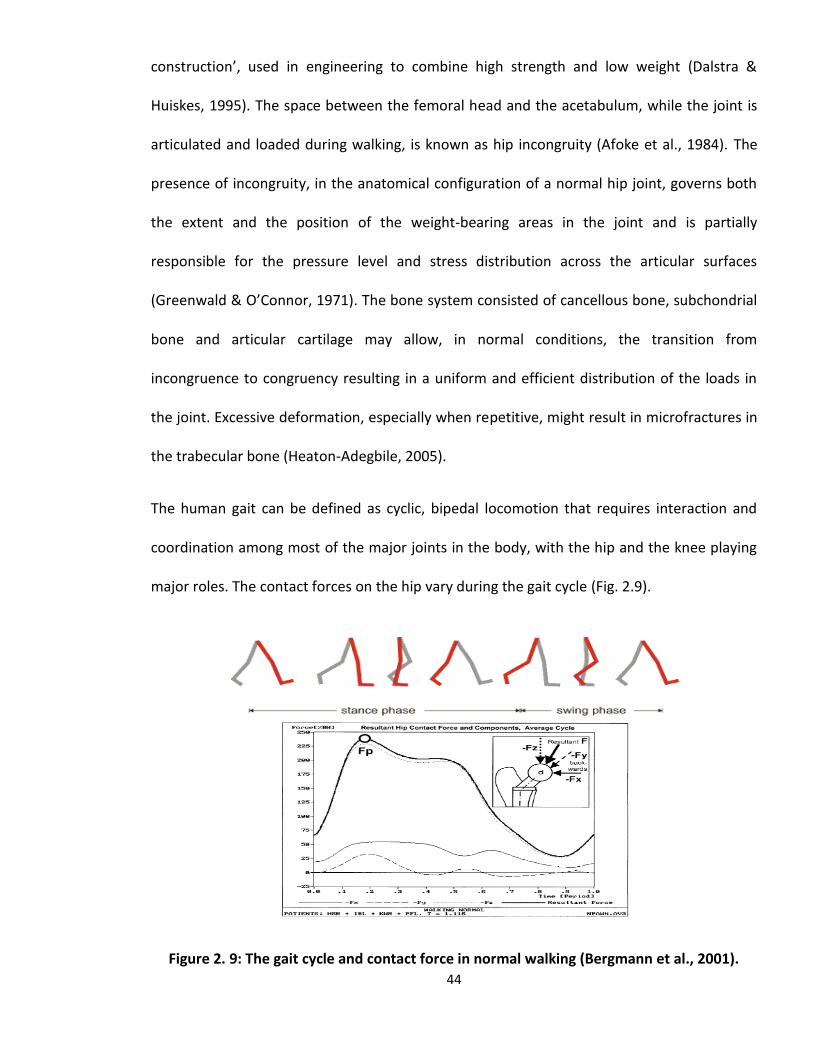
The human gait can be defined as cyclic, bipedal locomotion that requires interaction and
coordination among most of the major joints in the body, with the hip and the knee playing
major roles. The contact forces on the hip vary during the gait cycle (Fig. 2.9).
Figure 2. 9: The gait cycle and contact force in normal walking (Bergmann et al., 2001).

45
Initial contact occurs as the heel makes contact with the ground. The foot is then in flat
contact with the ground supporting almost all the body weight before the heel rises. The toe
then leaves the ground marking the end of the stance phase and entering the swing phase.
During the swing phase the other foot wholly supports the body. The swing phase ends with
heel contact, and the cycle then repeats (Vaughan et al., 1992).
Analysis of gait data relies on the accurate determination of events that occur during walking
such as ‘heel contact’ (the time at which the heel first contacts the walking surface) and ‘toe-
off’ (the time at which the foot is removed from the walking surface). Knowing such events
allows for normalization of gait kinematics and/or kinetics over various periods, i.e. stance
phase, swing phase, or the entire gait cycle (Hansen et al., 2002).
A number of studies have been conducted to examine the human gait under normal and
pathological conditions (Miller & Verstraete, 1996; Kleissen et al., 1998; Hansen et al., 2002;
Capozzo et al., 2005; Takeda et al., 2009) using different experimental techniques and
methodologies. However, the information gathered on the gait is not always easy to
translate in terms of hip joint reaction forces. The most comprehensive studies on the matter
have been carried out by Bergmann and his associates with instrumented hip prostheses
implanted in patients who underwent THR surgery (Bergmann et al., 2001; Heller et al., 2001;
Morlock et al., 2001). Gait analysis was performed on each patient where contact pressure
data and equivalent joint reaction force were evaluated in parallel with joint kinematics
during a variety of daily activities such as normal walking, stair climbing, descending stairs,
and rising from a chair. The highest joint reaction forces were found to be 870%BW during
stumbling, but were generally in the range of 238-260%BW during walking, stair climbing,
and descending stairs. The data also suggested that contact stresses and joint reaction forces

46
correlated well with foot-floor force measurements, although large inter-subject variation in
contact stresses, joint reaction forces and joint kinematics were found. Data from the
instrumented prostheses gave so far the most accurate values of the contact pressure of the
hip joint. However, the procedure is invasive and the data retrieved from the instrumented
prostheses only gave mechanical information relative to the contact site.
2.2.2. Pathological problems of the hip
A hip replacement is usually required when a patient experiences severe pain and disability
accompanied by radiological changes of the hip; and where non-operative treatments have
failed. The main conditions that necessitate a surgery according to the National Joint Registry
(NJR Annual Report 2011, UK) are osteoarthritis, rheumatoid arthritis, avascular necrosis and
fracture of the femur.
Osteoarthritis
Osteoarthritis (OA) is a degenerative joint disease that commonly affects middle aged and
elderly people and is mainly caused by wear and destruction of the hyaline cartilage, which
covers the ends of the bones in proximity of the joints. The incidence of this type of arthritis,
uncommon in patients under 40, increases with age and is observed in 80% of men and 89%
of women after the age of 75. Obesity and joint damage also increase the likelihood of early
development of OA. This pathology can lead to bone on bone contact which may cause
intense pain to the patient resulting in the complete destruction of the joint and
consequently requiring surgery. Surgical treatment is usually necessary when patients are no
longer able to carry out their activities of daily living or employment (Echternach, 1990).

47
Avascular Necrosis
Avascular necrosis (AVN) of the hip occurs when blood flow to the top portion of the femur is
interrupted. The affected portion of the bone consists of head and neck. When it is deprived
of blood, this part of the bone begins to ’die’, breaking down and causing the cartilage on top
of it to collapse. AVN of the femoral head is an increasingly common cause of
musculoskeletal disability. Although patients are initially asymptomatic, AVN of the femoral
head usually progresses into joint destruction, requiring THR, usually before the fifth decade.
In fact, 50% of patients with AVN experience severe joint destruction as a result of
deterioration and undergo a major surgical procedure for treatment within 3 years of
diagnosis. Femoral head collapse usually occurs within 2 years after the development of hip
pain (Aiello, 2011).
Arthritis
Rheumatoid arthritis (RA) is a chronic disease caused by inflammation of the synovium rather
than wear of cartilage as with OA. This condition is characterised by exacerbations and
remissions that can cause deterioration in the function of the joint, joint pain and joint
damage and often affects multiple joints in the body. In women, who are affected two to
three times of men, the peak incidence is usually between the fourth and sixth decades.
Although medical treatment helps to suppress the associated synovitis, motion once lost
from joint destruction is generally not regained. If the patient reaches a point where pain
significantly interferes the activities of daily living and occupational requirements, surgery is
usually necessary, i.e. THR (Echternach, 1990).

48
Osteoporosis and Fracture
Osteoporosis (OP) is the most common of all metabolic bone disorders. It is characterised by
low bone mass and microarchitectural deterioration of bone tissue, with a consequent
increase in bone fragility and susceptibility to fractures. Because of the increasingly aging
population, the number of persons affected by OP is also increasing. Complications related
to osteoporosis can create social and economic burdens (Guglielmi et al., 2011). OP is
generally associated with fractures, more commonly observed in women over the age of 65.
The common fracture sites occur across the neck of the femur and the femoral trochanter.
The blood supply to the bone above the fracture may be interrupted and the femoral head
may then die, resulting in secondary deformity and subsequent arthritis (Wang, 2009).
2.3. Total hip replacements
2.3.1. Background
Over the last decades, total hip arthroplasty (THA) has become one of the most successful
surgical operations. The main reason for a THA is usually related to hip pathologies that
cause pain and loss of functionality in a natural joint. The modern surgical treatment was
introduced by the pioneer Sir John Charnley, who first used a self polymerising acrylic bone
cement to act as a bonding material between the bone and the implant. Charnley also
introduced the concept of ‘low friction arthroplasty’, referred to the successful pairing of
ultra-high molecular weight polyethylene (UHMWP) and metal for the ball-socket
replacement system (Charnley, 1979). The evolution of surgical techniques, implant materials
and implant designs have led to excellent long-term results in older and more inactive
patients, with survival rates reaching 90% or more at 10 years (Varini, 2007). Today, a large

49
variety of solutions are available: from the use of UHMWP for the hemispherical socket,
which is fixed onto the acetabulum, to the metallic or ceramic head mounted using a press-fit
principle onto the metallic femoral stem. There are two main different fixation techniques to
perform a THR currently: cemented implants and cementless implants. Fig. 2.10 shows a
schematic of a cemented THR.
Figure 2. 10: Schematic cemented acetabular replacement in a total hip replacement (Stolk et al., 2004).
The main advantage of cemented hip arthroplasty is the primary stability ensured by the
presence of a cement layer at the interface between the implant and the bone. This stability
can be achieved soon post-operatively resulting in a short recovery period. The main
problem with cemented hip implants is the deterioration of the bone/implant cement
interface due to both mechanical and biological factors (Sundfeldt et al., 2006). Furthermore,
the microcracks generated by mechanical cyclic loading can aggregate in large cracks

50
producing cement debris that may eventually lead to inflammatory reactions of living tissues
(Schmalzried et al., 1992).
Cementless implants are based on a simple principle. Firstly “press-fit” guarantees that both
the stem and the prosthetic cup are firmly anchored to the bone, in the immediate post-
operative period (primary stability), in order to provide necessary time for the bone ingrowth
into the metallic surfaces. This would allow long-term bonding and the mechanical stability of
the prosthesis to the surrounding bony layers (secondary stability). Unfortunately, many
factors can jeopardise the outcome of such an implant. The main complications of
cementless prostheses are related to the incomplete osteointegration process. This may
affect the mechanical stability causing high relative motions between the implant and the
bone. The high interfacial motions further discourage bone ingrowth, and can lead to tissue
inflammatory processes, which often results in fibrous tissue formation leading to implant
gross loosening (Varini, 2007).
Regardless of the fixation technique the main aim of THA is to restore the function of the hip
joint by reproducing the same load transfer and the same stress distributions in the healthy
joint. The forces normally applied to the femur are transmitted via the cancellous bone of the
pelvis to the acetabular subchondral bone (Currey, 1998). The resultant force can be several
times in magnitude of the body weight (Bergmann et al., 2001). A strong and reliable bond at
the interface between the bone and the implant, after THR, needs to transmit those forces
from the prosthesis to the natural bone under in vivo service conditions.

51
2.3.2. Failure scenarios
It has been a matter of debate whether the failure of a THA is triggered by mechanical or
biological events. The roots of a potential failure may have both mechanical and biological
origins; and a failure is always a process and hardly ever an event (Huiskes, 1993). The
combined effects of mechanical and biological elements in the failures of THAs have been
reported by Huiskes (1993; 1993b), who suggested how long-term integrity of THA strongly
depends on the lasting mechanical integrity of the bond between the implant and the bone.
If that bond, regardless of its nature, is progressively damaged or destroyed, the loading
acting on the hip joint would be affected and can produce increased micromotions between
the implant and the bone. This results in inflammatory reactions, progressive interface bone
resorption, fibrous-tissue interposition and eventually clinical loosening (Huiskes, 1993).
Huiskes described the ‘failure scenarios’ based on failure mechanisms, which have become
widely accepted. A short description is given here:
Accumulated damage
The accumulated-damage scenario is based on the gradual accumulation of mechanical
damage in materials and interfaces due to repetitive dynamic loading. The local stress at the
interface or in the cement mantle may exceed the material strength, which leads to initial
cracks that can then gradually grow under the influence of the dynamic loading. This
situation may further produce interface micromotion, leading to bone resorption and
breakdown of the implanted component due to gross loosening. This scenario was described
as the main reason for failures in the cemented THR by Stauffer et al. (1982), and supported
by ex vivo investigations of retrieved samples (Jasty et al., 1991). The likelihood of failures

52
due to accumulated damage may be different for cemented and non cemented THRs, but the
underlying principle is the same.
Particle reaction
This scenario describes the debonding of the bone-implant interface as a result of
macrophages activation at the interface caused by small particles and wear products
produced by the implant during service. These products, such as polyethylene particles from
the acetabular implant at the bearing surface, PMMA cement abraded from the bone-
cement interface or even metal debris migrated into the interface from the periphery of the
acetabulum, can trigger inflammatory responses leading to local bone resorption and
interfacial debonding (Schmalzried et al., 1992). Eventually this process produces relative
interface motions that may lead to gross loosening of the implant.
Stress shielding
The introduction of artificial implants leads to bone remodelling as a result of the new
loading conditions due to the introduction of the implanted components. The hip joint force,
which was formerly carried only by the bone, is now shared between the implant and the
bone depending on the stiffness of the two materials. The stiffer implant takes a higher share
of the total load ‘shielding’ the less rigid bone. This usually induces bone remodelling in the
regions used to experience certain loads and now stress-shielded by the introduction of a
new and stiffer material. This scenario suggests that stress shielding due to bone remodelling
after replacement can lead to bone loss. The degree of the bone loss/stress shielding in the
bone depends on a number of patient-related and implant-related factors, such as age, sex,
medication, time of primary surgery, activity level, weight, bone quality, bone properties,

53
implant stiffness, shape and elastic modulus, interfacial bond characteristics and hip joint
force (Mow & Hayes, 1991). During the revision procedure stress shielding regions can be
easily recognized as massive bony defects.
Destructive wear
The destructive-wear scenario refers to the destruction of the bearing surface of implanted
components due to wear, to a point where mechanical integrity can no longer be manteined
(Saikko, 1993). The small micromotions and implant migration produced in service may
contribute to create a malfunctioning joint coupling leading to the creation of wear and
abrasion.
2.3.3. Aseptic loosening
Aseptic loosening, defined as the late failure of an implant in the absence of infection, is the
most common cause of revision of major arthroplasties and is responsible for more than two-
thirds of hip revisions (Sundfeldt et al., 2006). The loosening process can be captured on
early radiographs as a thin radiolucent line, which later thickens causing consequent bone
loss and resulting in the eventual failure of THR.
DeLee & Charnley (1976) examined the frequency of radiological demarcation of the bone-
cement junction in the acetabulum after total hip replacement in 141 Charnley low-friction
arthroplasty followed for an average of 10.1 years. Standard anterior-posterior radiographs
were used to identify the radiolucent traces at the bone-cement interface. For quantification
purposes, the total area of interest was divided in three zones (Fig. 2.11) which are currently
known as DeLee & Charnley zones. The results showed a demarcation of various degrees in

54
69% of the cases, whilst only 9.2% of the series showed evidence of progressive migration of
the socket.
Aseptic loosening can be the result of inadequate initial fixation, mechanical loss of fixation
over time, or biologic loss of fixation caused by particle-induced osteolysis around the
implant. The causes of particle accumulation vary from implant interface wear, micromotion
occurred in response to corrosion, oxidative reactions, and minor pathogen contaminations
(Abu-Amer et al., 2007).
Figure 2. 11: DeLee & Charnley zones identification and distribution relative to the anterior-posterior schematic view of THR (Dumbleton & Manley, 2004).

55
Jasty et al. (1991) proposed that mechanical factors such as bone cement properties and
mantle thickness; implant-cement and bone-cement interface; or the cementing techniques
for cemented components are primarily responsible for the loosening process. On the other
hand it is believed that biological reactions to the implant materials can lead to fibrous tissue
formation between trabecular bone and cement, being mainly responsible for the loss of
integrity and functionality of the fixation (Schwarz et al., 2000).
Fornasier & Cameron (1976) observed diffusion of tissue fluid between the prosthesis and
the cement in well-fixed THR retrievals. Similarly, Schmalzried et al. (1992) also found that
joint fluid penetrated extensively along the bone-implant interface. The effects of moisture
and cyclic mechanical stresses can also lead to degradation of cement and failures at the
bone-cement and cement-prosthesis interfaces (Fischer et al., 2001; Schmitt et al., 2004).
Furthermore, small PMMA particles and other wear products from polyethylene (PE) cup or
metal debris may be generated at the interfaces by micromotion or cement fracture, opening
a transportation channel and being injected into the hip joint space by the high pressure joint
fluid (Aspenberg et al., 1998). Wear debris activate macrophages, which stimulate
osteoclasts and initiate the consequent bone resorption. For this reason sealing off the
interfaces in cemented or uncemented implants is probably vital for a better outcome of the
THA. However, sealing must be established very early, otherwise an increasing amount of
debris will be pumped into the interface by the joint fluid drastically reducing the contact
between bone and cement, or bone and implant eventually leading to the failure of the
implant (Sundfeldt et al., 2006).
Cement porosities generated during the polymerisation process might be a source of fracture
with the consequent production of cement particles, thus air bubbles should be reduced as

56
much as possible (Lewis, 1997). In this case cementing techniques, such as vacuum mixing,
cement pressurization and cement pre-cooling, can be most influential in reducing the
possibility of cement particles.
More realistically multiple mechanical and biological factors may jointly contribute to the
implant loosening (Huiskes, 1993, Sundfeldt et al., 2006). Although the eventual failure of
THA may appear to be biological, such as bone resorption and deterioration of the bone-
cement interface, the initiation of failure may well be mechanical (Jasty et al., 1991; Huiskes,
1993). For example, stress shielding is a mechanical phenomenon, but its relationship with
bone remodelling is a biological one; inflammatory reactions to particles are biological
processes, but they are influenced by relative motions and wear processes, both mechanical
phenomena.
Although great efforts have been made to understand aseptic loosening, the underlying
mechanisms are still not fully understood. Fundamental studies are required in the design
and analysis of THR, fixation methods, surgical techniques and in vitro testing of implanted
replacements.
2.4. Bone-cement fixation
2.4.1. Bone cement properties
Bone cement is a two-component material. The basic constituents are the powder (initiator
and radio pacifier) and the liquid monomer (polymer and accelerator). The compositions of
various commercial brands are variants within a certain range. An inhibitor or stabilizer
(hydroquinone) is added to the liquid component to ensure that the monomer does not
polymerise spontaneously. BaSO4 or ZrO2 are commonly used as a radio pacifying agent in

57
the powder, but an experimental composition with a methacrylate-type iodide containing
copolymer (ICCP) showed much better integration into the cement matrix (Lewis, 2003). For
operations where an infection is suspected, an antibiotic is added to the powder. This wide-
spectrum antibiotic is either added by the manufacturer or by the surgeon.
After mixture of the two components, the initiator is decomposed by the accelerator in
molecules, so-called radicals that trigger off the polymerisation (Huiskes, 1979). Fig. 2.12
shows the equation of the polymerisation reaction. The characteristics of the polymerisation
process can be defined with reference to a temperature-time curve, as shown in Fig. 2.13
(Huiskes, 1979).
heat .....
|
|
.....
|
|
PMMA MMA
3
2
3
3
2
3
HCOOC
HCC
HC
HCOOC
HCC
HC
Figure 2. 12: Equation describing the polymerisation reaction. Mono-methyl-methacrylate molecules are forming into polymer chains (Huiskes, 1979).
The bone cement mechanical properties can vary with a number of factors such as basic
composition, antibiotic presence, storage temperature and soaking conditions (Lewis, 1997;
2003; Koole et al., 1999; Nottrott et al., 2007).

58
Figure 2. 13: Temperature-time curve of the polymerisation process (Huiskes, 1979).
Table 2.3 shows the range of properties for six commercial formulations of bone cement for
orthopaedic applications (Lewis, 1997).
Table 2. 3: Mechanical properties of selected cement brands (Lewis, 1997).

59
2.4.2. Histology of the bone-cement interface
Charnley (1960, 1964) examined the histology of the bone-cement interface by sectioning of
post-mortem femurs from patients with clinically successful implants. In load bearing regions
new bone tissues, evidence of bone remodelling, formed on the ends of the trabeculae. In
non-load bearing regions, a fibrous tissue layer may develop between the bone and the
cement, as shown in Figure 2.14. In the case of successful replacements, this fibrous layer
was thin and non-continuous. When a thick fibrous tissue layer is visible as lucency on a
radiograph, this represents a main indication of loosening.
Figure 2. 14: Histology of the bone-cement bond. (A) - cement, (B) - fibrous tissue, (C) - dead cancellous bone and (D) - new lamellar bone deposited on dead bone and closing the
trabecular space, (E) - fatty marrow with normal appearance (Charnley, 1964).
The histology of the interface changes with time postoperatively. Vernon-Roberts (1984)
characterised the histology of the bone-cement interface in stable hip prosthesis up to 20
years after implantation from a number of macroscopic and microscopic studies. The stability
was defined by four phases of the tissue reaction:

60
Up to three weeks after implantation a layer of dead bone up to 5mm in thickness
was found in apposition to the cement surface, with the presence of osteoclasts
laying down new bone.
The reparatory phase began at week four, lasting for a minimum of six months up to
two years. Microscopic analysis revealed a thin layer of connective tissue
approximately 1.5mm thick between bone and cement, where active remodelling of
tissue occurred.
Stabilisation occurred between 6 months to 2 years postoperatively, with all necrotic
and repaired bone being replaced by living lamellar bone. The architectural modelling
was by then completed and all the remaining fibrous tissue disappeared.
At a minimum of two years, the prosthesis may be considered stable. Lamellar
trabecular bone appeared in close contact with cement surrounding the prosthesis,
although a thin layer of fibrous tissue was normally present between the bone and
cement surface.
Jasty et al. (1990) examined thirteen post mortem well functioning femoral prostheses that
were obtained at autopsy from patients in whom a cemented total hip replacement had
been implanted from 40 months to 17.5 years. All specimens exhibited an intact bone-
cement interface with interdigitation of the cement into the trabecular bone. Evidence of
extensive intramedullary trabecular bone remodeling was observed in all of the femora that
were retrieved in the time frame of 5 to 17.5 years after operation. In the samples retrieved
at less than 5 years, cement had intruded into trabecular bone. The trabecular pattern in the
proximal metaphysis and in the proximal part of the diaphysis of the specimens, retrieved at
about five to 17.5 years, had been extensively altered and was characterised by thick

61
trabeculae running circumferentially around the cement-mantle and thinner trabeculae
surrounding these thick trabeculae, which gradually merged with the original outer cortex.
The above histological studies indicated that a well functioning prosthesis exhibits an intact
bone-cement interface with direct contact between cement and bone and bone apposition
to the cement surface. However, the histology of the bone-cement interface in a loosened
implant is different. Schmalzried et al. (1992) examined fourteen hemi-pelvic bones with
cemented polyethylene acetabular components obtained at autopsy, with an implantation
time varied from 58 to 210 months. Evidence of bone resorption and membrane formation at
the bone-cement interface was clearly visible, even in the most well-fixed implants, resulting
in the loss of mechanical stability. Histological analysis revealed that progressive bone
resorption, and consequent membrane interposition between bone and cement, is fuelled by
small particles of polyethylene migrating along the bone-cement interface as a result of
macrophage inflammatory response of the tissue to the particulate. It was concluded that
the mechanism of aseptic loosening for cemented acetabular components is biological in
nature and not mechanical. However, the mechanical contribution to the failure of cemented
acetabular replacement has never been reported and this will be addressed in Chapter 3.
2.4.3. Properties of the bone-cement interface
Since bone cement does not have any adhesive qualities, the strength of the bone-cement
interface strongly depends on the mechanical interlock between cement and cancellous
bone. An improved cement interdigitation into the cancellous bone is considered beneficial
to increase the strength of the bone-cement interface fixation, as the greater the penetration
into the trabecular structure (up to 3-5mm), the stronger the mechanical interlock (Krause et
al., 1982; Bugbee et al., 1992; Majkowski et al., 1993; Mann et al., 1997).

62
To achieve a good degree of cement penetration, high cementation pressures are needed
(Juliusson et al., 1995) and adequate preparation of the cancellous bone bed is essential
(Krause et al., 1982). Oates et al. (1995) reported the in vivo effect of cement pressurisation
on the interface strength of sixteen goats that underwent total hip arthroplasty. Pressure
was maintained using a distal plug and a pneumatic gun apparatus in half the animals and
finger packing in the other half. The biomechanical results demonstrated that pressurised
interfaces were stronger than those produced by digital packing; although there was a limit
beyond which increasing pressure had no effect. In addition to pressurisation, cleaning the
surface of bone also aids cement penetration. An accurate lavage before the cement
application removes loose cancellous bone, blood and fat from the surface of the bone,
enhancing the penetration of the cement into the trabecular spaces and improving the
contact between bone and cement (Krause et al., 1982). Krause et al. (1982) reported how
pressurised interfaces with lavage exhibited greater strength than as cut, unpressurised
interfaces. In vitro tensile and shear tests of bone-cement interfaces were carried out to
determine the mechanical strength of the interface with respect to preparation of bone
surface and cementing technique. Tensile strength varied from 2.72(±1.42)MPa for as cut
specimens to 5.30(±2.13)MPa for specimens subjected to high intensity lavage. Same
findings, with lower improvement for high intensity lavage, were obtained for shear strength
ranged from 7.92(±2.54)MPa to 8.50(±4.28)MPa. It was concluded that, although cement
penetration depths above 1-2mm have been shown to increase the cement-bone interface
strength, it seems that an upper penetration limit exists and for penetration depths above
5mm the strength of the interface does not increase significantly.

63
The viscosity of cement changes with time after mixing until the cement cures, in different
modalities depending on the type of cement. The viscosity at time of insertion can influence
the degree of cement penetration. Stone et al. (1996) examined the effect of viscosity on the
push out strength of bone-cement samples. Femora were injected with cement at intervals
of 4.5 minutes and 6.5 minutes (after mixing) respectively to simulate insertion at low and
high viscosity. The results showed that cement injected with lower viscosity exhibited greater
failure strength. However, these tests did not simulate intramedullary bleeding which can
also influence the amount of cement interdigitation (Majkowski et al., 1994). Miller et al.
(2007) included bleeding in their investigation and examined the difference in tensile
strength between low viscosity and standard viscosity cements. The cements were injected
at 3.7 minutes and 4 minutes (after mixing) respectively into human femurs, and in this case
the interface made of standard viscosity cement was 21% stronger than that using the low
viscosity cement. They concluded that low viscosity cement was less effective at displacing
bone marrow resulting in less bone apposition and therefore lower interface strength.
Similar findings were also reported by Race et al. (2006).
Although numerous studies have been carried out on bone-cement interfacial strength, using
experimental (Krause et al., 1982), analytical (Clech et al., 1985) or numerical (Tong et al.,
2007) methods, the most complete studies have been carried out by Mann and his associates
(Janssen et al., 2008; Mann et al., 1997, 1999, 2001; Kim et al., 2004; Mann et al, 2009).
Their work includes mechanical testing of cadaveric bone-cement interface samples under
tensile (Mann et al., 1997), shear (Mann et al., 1999), mixed mode (Mann et al., 2001) and
creep-fatigue (Kim et al., 2004). Much valuable information has been generated from these
well-designed studies, although some of the fundamental aspects of the topic remain to be

64
further explored. For example, what is the role of cement interdigitation in defining the
bone-cement interfacial strength? Several methods have been used to evaluate
interdigitation. The depth of the cement pedicles (Krause et al., 1982) or the quality of
cancellous bone (Askew et al, 1984) was used as a measure of cement penetration. Mann et
al. (1997) used quantitative computed tomography (QCT) to measure interdigitation by a
product of the amount of interdigitation and equivalent mineral density of the interdigitated
bone; whilst Maher & McCormack (1999) used a random undulating parameter to measure
the depths of the cement penetration at a regular interval.
Published works do not appear to suggest a significant correlation between the bone-cement
interfacial strength and the depth of cement penetration (r2=0.22 (Krause et al., 1982)),
although the methods of quantification of cement penetration tend to vary. The quantity of
bone interdigitated with the cement has been used to improve the correlation (Mann et al.,
1997, 1999, 2001; Kim et al., 2004), albeit with only moderate success (r2 ≈0.5 for tensile; r2
≈0.5-0.7 for mixed mode cases). The main failure mechanisms were identified (Mann et al.,
1997, 1999), although not correlated with the loading angle. In general, there is a large
variation in the results between specimens tested under similar loading conditions, possibly
due to the variation in cadaver bone tissues, and the difference in the amount of cement
infiltration. Due to the substantial scatter, the penetration depth alone does not appear to
fully describe the behaviour of the interface. Important indications in this sense are provided
by the type of loading condition to which the interface is subjected. In this sense the results
reported by Mann and associates (1997, 1999, 2001) showed a general increase in apparent
strength with the loading angle from 1.35(±0.65)MPa in tension (0°) to 2.25(±1.49)MPa in
shear (90°), with the only exception for the value of 3.00(±1.70)MPa obtained for samples

65
tested under mixed-mode at 67.5°. It was concluded that the strength of the bone-cement
interface was moderately correlated with the loading angle (r2≈0.6) being greater in shear
than in tension. Wang et al. (2010) obtained similar results that will be discussed in Chapter
4.
At a microstructural level, failure of the bone-cement interface depends by both the type of
interlock and the degree of cement penetration. The penetration of cement into the
trabecular bone forms a composite structure. As such, failure can occur through a number of
mechanisms. Miller et al. (2007) classified the failure of bone-cement interface into six
categories, as shown in Figure 2.15.
Figure 2. 15: Failure type classification of bone-cement interface specimens (Miller et al., 2007).
With the recent development of µCT imaging techniques and the advent of digital correlation
analysis a better understanding of the micromechanical behaviour of the bone-cement
interface has been achieved. Mann and co-workers reported the micromechanical behaviour
of the bone-cement interface under tension-compression (Mann et al., 2008; Miller et al.,
2009), shear fatigue (Mann et al., 2009) and multi-axial (Miller et al., 2011) loading
conditions. The main aim of these studies was to quantify the micromechanics of the bone-

66
cement interface of laboratory-prepared and post-mortem retrieved cemented total hip
replacements when subjected to the selected loading conditions. µCT together with digital
image correlation techniques (DIC) were utilised to determine the relative micromotions and
local deformation at the interface. The results showed that the actual contact interface was
responsible for the majority of motion of bone-cement structures when subjected to tensile
or compressive loading. This interface was more compliant in tension than in compression,
with a fraction of total displacement that was 0.83 (0.19) for tension and 0.64 (0.28) for
compression respectively (Mann et al., 2008). The mechanical response of bone-cement
post-mortem retrieved specimens was characterized by a highly compliant interface in both
tensile and compressive loading directions. The retrievals exhibited a very low tensile
strength (0.21(±0.32)MPa) when compared to laboratory-prepared specimens
(3.00(±1.4)MPa). The relatively weak and compliant interface from the post-mortem
retrievals was explained by the paucity of direct apposition between the cement and bone,
and the lack of bone-cement interlock (Miller et al., 2010). Under shear fatigue the damage
response of the interface was characterized by creep damage that localized to the contact
interface between bone and cement. The overall creep damage was associated with
stiffening of the structure (r2=0.68), and more microcrack damage occurred to the cement
than to the bone with failure that was confined at the contact interface (Mann et al., 2009).
Under non distructive multi-axial loading conditions it was found that the magnitude of
interface micromotions from an externally applied load did not depend on the angle at which
that load is applied (Miller et al., 2011), not entirely consistent with the findings of Mann et
al. (2001). All the above reported studies are limited to 2D analysis of the external surfaces
of the samples. This will be further discussed in Chapter 4.

67
2.4.4. The bone-cement fixation in acetabular reconstructs
Although much efforts have been made towards the understanding of aseptic loosening of
cemented THRs, most studies are related to the femoral components (Maloney et al., 1989;
Topoleski, 1990; Jasty et al., 1991; McCormack & Prendergast, 1996, 1999) and only few
works are reported on acetabular components (Heaton-Adegbile et al., 2006; Zant et al.,
2007, 2008; Tong et al., 2008; Wang et al., 2009), despite that the long term failure rate is
reported to be three times in acetabular components than that in femoral components
(Schulte et al., 1993).
The fixation of acetabular replacements has been studied by Heaton-Adegbile et al. (2006),
Zant et al. (2008), Tong et al. (2008) and Wang et al. (2009). The findings from the above
studies suggested that the interfacial strength of bone-cement interface depends on the
bone-cement interdigitation, which is related to a number of factors including cement
defects (pores, voids and other impurities), bone quality of the patients and surgical factors
(reaming, cleaning, cement viscosity, pressurization).
In vitro fatigue testing of 3D cemented acetabular reconstructs was reported by Heaton-
Adegbile et al. (2006). The damage initiation and evolution in the cement fixation of a
composite sawbone hemi-pelvic specimen were examined by a combination of conventional
fatigue testing and µCT analysis, the latter used for the first time to monitor the fatigue
damage in acetabular reconstructs. Extensive interfacial fracture at the bone-cement
interface was observed in proximity of the dome region, as also confirmed by microscopic
studies post testing. The sawbone specimens were fully fixed to the experimental setup on
the servo-hydraulic testing machine at iliac crest and ischial tuberosity, applying a uniform
pressure (Fig. 2.16). The peak hip contact force during normal walking (Bergmann et al.,

68
2001) was used to load the sample and the body weight set at 70Kg. The load ranged from -
0.2 to -1.6KN at frequency of 5Hz in order to reduce the test duration. The specimens were
CT scanned at regular intervals. No defect was found at 10 million cycles, and the evidence of
initial fractures was detected at 15 million cycles. An extensive demarcation (1-3mm) at the
bone-cement interface was identified at 20 million cycles.
Figure 2. 16: The composite sawbone specimen under in vitro fatigue test (Heaton-Adegbile et al., 2006).
Experimental results from a new hip simulator study were reported by Zant et al. (2008). The
hip simulator (Fig. 2.17) was able to simulate the complex resultant hip contact force, with
varying direction and magnitude at selected load levels ranging from a body weight of 75kg
to 125kg, under typical physiological loading conditions, including normal walking and stair
climbing data from Bergmann et al. (2001).

69
Figure 2. 17: The Portsmouth four-station hip simulator with a specimen loaded in one of the test cells (Zant et al., 2008).
The femoral head attached to a swing arm is able to oscillate about the Z-axis, while the
rotation of the base plate is about the Y-axis. The force vector was transmitted through the
femoral head to the acetabular cup of the reconstruct, as shown in Fig. 2.18.

70
Figure 2. 18: Schematic of the Portsmouth hip simulator with the coordinate system (Zant et al., 2008).
The three-dimensional time-dependent force vector in a cup coordinate system was achieved
by synchronising the magnitude of the force with two rotational displacements associated
with cup and femoral head. The ranges of the motions allowable were ±35°, ±360° and ±60°
for rotations on YZ, XZ and XY planes, respectively. The ranges required for normal walking
(XZ: 88°; XY: 35°), ascending stairs (XZ: 141°; XY: 29°) and descending stairs (XZ: 193°; XY: 44°)
were thus well within the capacity of the apparatus. The machine included four stations
which were individually controlled, allowing different selected load profiles to operate
independently and simultaneously. The stations were carefully designed to hold hemi-pelvic
bones with an implanted acetabular cup. The cup was in articulation with a spherical femoral
head through which the load was transmitted. The hemi-pelvic bone specimen was mounted

71
upside down in order to facilitate lubrication during testing. Fig. 2.19 shows the comparison
of the hip contact force as a command signal and the response of the machine for normal
walking, ascending and descending stairs. The hip simulator seems to reproduce the
physiological loading profiles well, with a relative error of 3.6% for normal walking, 1.5% for
ascending and 6.2% for descending stairs, at peak hip contact force.
Figure 2. 19: Comparison of the hip contact forces as demand signal (line) and response of the machine (symbol) for normal walking (a), ascending stairs (b), and descending stairs (c)
(Zant et al., 2008).
Zant et al. (2008) & Tong et al. (2008) reported some preliminary results obtained from three
bovine acetabular reconstructs tested up to 17 million cycles using a new hip simulator.
Damage was monitored using CT scanning at regular intervals, and the samples were then
sectioned and analysed using conventional microscopy. Debonding at the bone-cement

72
interface was observed in all samples, irrespective of the loading conditions. Local debonding
in the posterior-superior quadrant was revealed in one sample tested under normal walking
for 15 million cycles; while multiple debondings were found at the bone-cement interface for
another sample experienced 17 million cycles under normal walking loading condition.
Extensive debonding at the bone-cement interface was identified by CT scanning in a sample
tested under the most severe condition (Fig. 2.20a), descending stairs, for merely 2.2 million
cycles, where clear demarcation between the cement and the bone can be observed in the
sectioned sample (Fig. 2.20b).
Figure 2. 20: Debonding at the bone-cement interface of a sample tested under descending stairs loading condition. (a) A CT scan image showing clear demarcation at the bone-
cement interface; (b) almost complete separation of the bone-cement interface (Tong et al., 2008).
Wang et al. (2009) reported the effect of a combined load profile representative of patient
routine activities on the endurance of cement fixation. The hip simulator developed by Zant
et al. (2008) was utilised to study the long-term mechanical response of acetabular
reconstructs under the combined loading blocks, as well as stair climbing and normal walking

73
loading conditions. The damage development in the fixation was periodically monitored by
means of a µCT scanner during testing. A body weight of 125kg was adopted to represent an
upper bound load case and to reduce the test duration. All samples were CT scanned prior to
the experiments and at half million cycle intervals throughout the experiments. The results
showed that bone–cement interfacial debonding was identified as the predominant failure
mechanism and that descending stairs was the most damaging loading condition (test
terminated at ~3 million cycles), compared with the combined and the normal walking
loading conditions.
The effect of environment on the survivor rate of a cemented acetabular reconstruct was
attempted for the first time by Wang (2009). A preliminary environmental chamber was used
to accommodate simulated body fluid (SBF) in the hip simulator to carry out pilot fatigue
tests under wet conditions. The SBF was produced based on the formulation reported by
Kokubo & Takadama (2006) and given in Table 2.4. A transparent plastic box was utilised to
provide a sealed space for the specimen immerged in SBF and silicone gel was evenly spread
over the gap between the box bottom and the rotation plate to avoid fluid leaking (Fig. 2.21).
Table 2. 4: Order, amounts, weighing containers, purities and formula weights of reagents for preparing 1000ml of SBF (Kokubo & Takadama, 2006).

74
The fluid was circulated through a pump and the temperature was controlled at 37°C. The
test was carried out for 18,000 cycles under a BW of 125Kg.
Figure 2. 21: A simple environmental chamber with SBF (Wang, 2009).
A full bone-cement interfacial debonding was clearly identified as a continuous demarcation
at the bone-cement interface along the periphery of the acetabulum. Because a gross
interfacial debonding was observed after only 18,000 cycles, no CT investigation was made
hence the location of debonding initiation was not recorded.
2.5. Micro-focus computed imaging and relative applications
2.5.1. Background
Today X-ray computed tomography (CT) finds applications in different fields. Ketchem &
Carlson (2001) divides CT scanners into four categories: conventional with a scale of
resolution ~mm; high-resolution with a scale of resolution ~100µm; ultra-high-resolution
with a scale of resolution ~10µm; micro tomography (µCT) with a scale of resolution ~µm.
Medical CT scanners are generally in the conventional category, but some span the high
resolution range. µCT was pioneered in the late 1980’s and is based on the same basic

75
principles as the common computed tomography (Sasov, 1987; Feldkamp et al., 1989).
Generally speaking, the system consists of a micro-focus tube which generates a cone-beam
of X-rays, a rotating specimen holder on which the object is mounted, and a detector system
which acquires the images. One of the main differences to medical CT is that during the CT
scanning, the source-detector geometry is fixed, while images are taken of the rotating
specimen. Several systems are currently available on the market. µCT systems used for in
vitro imaging of small specimens and for in vivo imaging of laboratory animals (Sasov & Van
Dyck, 1998; Ruegsegger et al., 1996; Sasov & Dewaele, 2002; David et al., 2003) are usually
called Desktop CTs. For the first systems developed, examinations at a pixel size of 30μm
were reported, with cross-sections of about 4mmx4mm (Sasov, 1987b). The first µCT
examinations of bone specimens (trabecular bone cubes, 8mm side) were performed at a
resolution of 50μm/pixel (Kuhn et al., 1990). The main disadvantage of the Desktop systems
is that the cabinets for material testing are small and aimed at hosting samples cut out from
larger objects.
More recently, high resolution industrial µCT systems were put on the market. These
machines are able to combine a spatial resolution that can achieve cubic voxel sizes as small
as 5μm (Ritman, 2004) with a larger chamber volume, allowing testing of a wide range of
materials and dimensions. For in vitro imaging of trabecular bone biopsies, specimens having
an external size of 8-10mm are normally examined, with a nominal spatial resolution of 14 to
30μm/pixel (Thomsen et al., 2005; Nagele et al., 2004; Hildebrand et al., 1999). Bigger
acetabular reconstructs are usually of dimensions in the range of 20-25cm and imaged at
~75µm isotropic resolution (Wang et al., 2009). Furthermore, the large dimensions of the CT
chamber allow the use of specific testing devices for in-situ mechanical characterisation.

76
2.5.2. Basic principles
CT imaging offers a non destructive method of three-dimensional visualisation and
characterisation of an object through the volumetric mapping of its X-ray attenuation (which
is closely related to density). At the fundamental level, CT involves capturing a series of
multiple X-ray views of an object at a range of angular orientations. X-rays are emitted from a
source, pass through the object and the amount of attenuation (through scattering and
absorption) of the X-ray signal is measured by a detector. Attenuation of monoenergetic X-
rays is described by the Beer-Lambert law (ASTM, 2000).
𝐼 = 𝐼0𝑒−µ𝑥 (2.1)
Where:
I0 = the initial X-ray intensity
I = the intensity of the X-ray after it has traversed a thickness of material, x
μ = linear absorption coefficient for the material scanned
When this equation is applied to a non-homogenous material, the equation becomes:
𝐼 = 𝐼0𝑒− µ 𝑠 𝑑𝑠 (2.2)
Where the line integral is taken along the direction of propagation and μ(s) is the linear
absorption coefficient as a function of distance along the ray path. As the attenuation
coefficient is also generally a function of X-ray energy, the complete solution requires
solution of the equation over the range of the effective X-ray spectrum.
µ 𝑠 𝑑𝑠 = − ln(𝐼
𝐼0) (2.3)

77
To reconstruct a three dimensional image, a series of radiographs taken at different angular
orientations is processed so that the local value of attenuation is determined at every point
of the sample volume.
Artefacts and partial volume effects can appear during tomography, obscuring details of
interest and introducing errors for quantitative analysis (Ketcham & Carlson, 2001; Barrett &
Keat, 2004). These errors include:
Beam hardening: As a polychromatic beam passes through an object, the X-rays with lower
energy are more easily attenuated than the higher energy X-rays, for this reason a beam will
preferentially lose the lower end of its spectrum. This increase in mean energy is defined as
beam hardening. This is the most common artefact encountered in CT imaging and causes an
object to appear brighter at its edges than at the centre. Filtration and software can be used
to eliminate the effects of beam hardening.
Aliasing: This appears as streaks in the end images at the corner of objects and is a result of
steep intervals in projections.
Detector saturation/photon starvation: The detector signal needs to be proportional to the
photon flux. If the detector is saturated, or the signal is attenuated too much, then streaks
may appear on the resulting image.
Ring artefacts: These very common artefacts appear as full or partial circles centred on the
rotational axis. They occur in third generation scanners (rotating X-ray tube and detector
assembly) as a result of a shift in output from individual or sets of detectors which cause the
corresponding rays to have anomalous views.

78
Partial volume effect: This is the blurring of material boundaries as a result of the voxels at
the boundaries consisting of an aggregate value of X-ray attenuation of the two materials.
2.5.3. Imaging and determination of morphometrical parameters of trabecular
bone
Trabecular bone can be studied at different hierarchical levels, from the ultrastructure of
collagen and mineral to macroscopic density (Wang et al., 2002; Hoffler et al., 2000; Aerssens
et al., 1997; Ding et al., 2002). The architecture of trabecular bone is studied at the scale of
individual trabeculae, at a resolution in the range from of 20μm to 50μm (Cowin, 2001). The
spatial arrangement of the trabecular structure in trabecular bone is not random, as some
regions are very dense, whereas others have only sparse trabeculae. The mean orientation
and degree of anisotropy are also variables that change between anatomical site and
between subjects (Ohman, 2011). Furthermore, in some regions the trabeculae are coarse
and in others they are fine (Fig. 2.22).
Figure 2. 22: The different trabecular structure of: (a) bovine proximal tibial, (b) human proximal tibial, (c) human femoral neck and (d) human vertebral trabecular bone (Keaveny
et al., 2001).

79
A typical procedure for µCT imaging and quantification of trabecular bone structure consists
of three steps:
Acquisition of the projection data;
Reconstruction;
Segmentation of the images and calculation of the morphometric parameters.
The bone specimen is placed on the rotation stage in the µCT scanner and a series of frontal
images of trabecular bone samples are acquired using selected settings (kV, μA, filtering for
beam hardening minimization, exposure time, rotation step). From the frontal projection
data it is possible to obtain a reconstruction of the cross-section images of the specimen
using dedicated software, which is based on a cone beam algorithm (Feldkamp et al., 1984).
For the calculation of the mophometric parameters, the grey-level image has to be
segmented into a bone and non-bone phase. This process, also called segmentation,
thresholding or binarization, is of vital importance in the assessment of the structural
properties of trabecular bone (Hara et al., 2002). Different segmentation methods are
presented in literature, such as global and local methods (Khun et al., 1990; Muller et al.,
1994; Ding et al., 1999; Hildebrand et al., 1999; Hara et al., 2002; Waarsing et al., 2004; Kim
et al., 2007; Perilli et al., 2007). Global methods are histogram-driven methods, where the
grey-level histogram of an image can be represented as a bimodal curve (Fig. 2.23). A
threshold could then be set in a fixed position between two consecutive peaks, with all the
grey-levels above the threshold value identified as bone and those below the threshold value
non-bone. The value that is used as a threshold is selected either visually, by analysing the
histogram of CT numbers or by forcing the resulting binary data set to have the same volume

80
fraction of the original bone sample as determined experimentally (Ding et al., 1999). Local
threshold methods are defined when a different threshold is used for different regions in the
image and are based on the gradients in the grey values encountered at the bone/non-bone
interface. Examples of this method can be found in the works of Kuhn et al. (1990) and
Waarsing et al. (2004). These methods principally aim at overcoming problems in the
segmentation of images with a limited resolution (i.e. partial volume effect) or low signal-to-
noise ratio (i.e. in-vivo imaging). Once the images are segmented, the morphometric
parameters can be calculated.
Figure 2. 23: Histogram of a typical 16-bit 3D CT image of bovine trabecular bone. The left peak represents background voxels, whereas the right peak represents bone voxels (Kim et
al., 2007).

81
Bone Volume Fraction (BV/TV)
Bone volume fraction (BV/TV) is defined as the sum of all voxels marked as bone divided by
the sum of all voxels (i.e. the total volume of interest). BV/TV is calculated directly from the
image or the volume in examination.
With the development of CT-imaging techniques, it became possible to develop new image
tools that took full advantage of all three dimensions (Hildebrand & Ruegsegger, 1997,
Odgaard, 1997). Such procedures are given by the direct surface and volume determination,
allowing a direct calculation of bone morphological parameters such as bone trabecular
thickness (Tb.Th) and trabecular separation (Tb.Sp).
Trabecular Thickness (Tb.Th)
Model independent thickness (Hildebrand & Ruegsegger, 1997) is based on the estimation of
volume-based local thicknesses, calculated as the diameter of the largest sphere which can
locally be fitted completely inside the structure. From these local thicknesses, a volume-
weighted mean thickness of the structure is calculated.
Trabecular Separation (Tb.Sp)
The Tb.Sp (Hildebrand & Ruegsegger, 1997) is calculated with the same procedure used for
the Tb.Th, but this time the voxels representing non-bone parts are filled with maximal
spheres. The separation is thus the thickness of the cavities.
As well as the mechanical properties, the morphological parameters for cancellous bone can
vary with a number of conditions such as anatomical location, species and desease state as

82
reported by Keaveny et al. (2001). A range of values reported in literature for bovine, human
healthy and osteoporotic bone is shown in Table 2.5.
The same morphological investigations can be performed for all foam materials with the
following modifications:
BV/TV = FV/TV
Tb.Th = Strut diameter
Tb.Sp = Cell spacing
Table 2. 5: Selected morphological parameters reported in literature for (1) healthy, (2) osteoporotic and (3) bovine trabecular bone.

83
2.5.4. Image-guided failure assessment (IGFA)
μCT imaging combined with mechanical testing has been recently used to examine the
damage behaviour of several engineered and biological cellular solids (Nazarian & Muller,
2004; Nazarian et al., 2005; Nagaraja et al., 2005). These techniques are relatively new and
research in this area is quite limited. Nazarian & Muller (2004) were the first to introduce this
particular experimental protocol. They developed a novel micromechanical testing system,
composed of a microcompression device and a material testing and data acquisition system,
to perform step-wise testing of trabecular bone and aluminum foam specimens based on
image-guided failure assessment (IGFA) analysis. The specimen was compressed and imaged
in a time-lapsed fashion, allowing the visual assessment of fracture initiation and progression
not only in the elastic region but also beyond yield in the plastic region (Nazarian & Muller,
2004; Nazarian et al., 2005).
Measurements corresponding to each compression step were stored in 3D image arrays with
isotropic voxel sizes of 34μm, and a three-dimensional Gaussian filter with a filter used to
suppress the noise in the volumes. In the next step, the cellular solid images were segmented
from background using a global thresholding procedure. The 3D images of each compression
step were combined into an animation, since 3D animations of testing experiments
contribute significantly to the understanding of sample failure under load. For this purpose,
the 3D images first had to be aligned with respect to the bottom end-plate fixed during the
experiment. An algorithm was used to find the last plane of this end-plate in each 3D image
enabling an alignment of the images along the perpendicular axis. A subsequent 2D
correlation procedure was used in the first five sample planes in order to perform the
alignment. These aligned images were then visualized under the same conditions

84
(orientation, light settings) and the resulting images were finally turned into an animation
(Nazarian & Muller, 2004; Nazarian et al., 2005).
Fig. 2.24 shows time-lapsed images obtained from the step-wise microcompression of a
representative open-cell aluminum foam (Fig. 2.24a) and a whale trabecular bone cylinder
(Fig. 2.24b), respectively.
Figure 2. 24: IGFA of representative open-cell aluminium foam (a) and whale bone core (b) (Nazarian & Muller, 2004).
For both types of materials localised damage was observed to accumulate and propagate. In
aluminum specimens (Fig. 2.24a) a general trend of buckling was observed within the
structure as a consequence of the imposed strain, where the individual trabeculae tended to
bend and buckle. Failure was observed somewhat differently in whale trabecular bone

85
specimens (Fig. 2.24b). Over the imposed strain range of 20%, the top third of the specimen
crumbled significantly with the individual trabecular elements experienced high levels of
deformation, whereas the lower part of the specimen remained relatively intact. It can be
observed that bone failed in a brittle manner due to the presence of minerals but then
showed ductile post-failure behaviour. It seems that the collagen network within the
trabeculae can keep the mineral phase together over a long range of strain (Nazarian &
Muller, 2004). Additionally, in all time-lapsed images failure progression of individual
elements could be followed in both the aluminum and bone samples, as shown in Fig. 2.25
(Nazarian & Muller, 2004).
Figure 2. 25: IGFA of local failure: (a) rod-like element undergoing large local strain; and (b) although inter-nodal strain can be small, large deformation can occur (Nazarian & Muller,
2004).
The IGFA technique has been so far used for cancellous bone and cellular materials. The first
implementation, to date, of such technique for bone-cement composites will be reported
and discussed in Chapter 4.

86
Chapter 3
Damage evolution in
cemented acetabular
reconstructs

87
3.1. Introduction The main findings discussed in this chapter have been reported in the following paper:
Tozzi, G., Lupton, C., Heaton-Adegbile, P., Tong, J., 2012. Damage evolution in
acetabular reconstructs under physiological testing in a saline environment. J.
Biomech. 45, 405-408.
In this chapter the effects of saline environment on the survival rate of two cemented
acetabular reconstructs were studied, following some preliminary work of Wang (2009). A
new modular environmental chamber was developed and used on the Portsmouth hip
simulator. µCT imaging was carried out at regular intervals of the experiments, to
systematically monitor the damage till gross loosening occurred. The results were compared
with those obtained in dry conditions.

88
3.2. Methods
3.2.1. Specimen preparation
Fresh bovine bones were retrieved from a local abattoir from cows of ages between 12 to 20
months. Prior to implantation, the bones were treated and all fatty tissues were removed to
ensure the cleanliness of the tissues for long duration testing as well as for effective
interdigitation of the cement. Sequential reaming of acetabulum was performed, according
to standard orthopaedic procedures, at a step of 2mm until the desired socket size was
obtained. During the reaming operation the specimen was kept in a stable position by means
of three clamps at the iliac, ischial tuberosity and pubis. Standard cementing technique was
utilised to prepare and apply a mix of CMW1 (DePuy CMW, UK) cement to secure a
polyethylene cup (Charnley Ogee DePuy Int, UK) in the standard position. An average
thickness of the cement mantle was 2-3mm, and the cup size used to suit the size of the
bones was 53/22. Two hemi-pelvic reconstructs (right and left) were used in this study (Fig.
3.1).
Figure 3. 1: The acetabular reconstruct implant used in this study.

89
3.2.2. Environmental chamber design and implementation
A new modular chamber was designed in this study using Pro/Engineer wildfire 4.0 software
(PTC, USA). The basic idea was to develop a fully waterproof chamber, able to be closed
around the specimen already fixed in the optimal desired position on the base rotation plate.
Another important issue was to design the components in order to be assembled and sealed
readily without the use of silicone gel. Figure 3.2 shows the 3D model of the chamber with all
its individual components and assembled. The chamber consists of five components: a
circular base plate (Fig. 3.2a), two hemi-cylindrical parts (Fig. 3.2b-c), and two transparent
top disks (Fig. 3.2d-e). The components, with canals on the edge to accommodate rubber
rings for sealing purpose, are assembled using bolts. Four blind holes in the central part of
the base plate allow the fixation of the sample on the base plate. The base plate of the
chamber is connected with the simulator plate through the four circumferential holes.
Figure 3. 2: The new environmental chamber with its five modular components (a-f) and assembled (f).

90
The modular components of a chamber prototype were then manufactured (Hillcrest
Machinery & Engineering, UK) and installed on the hip simulator for a pilot testing of
acetabular reconstruct under physiological loading conditions in a wet environment (Fig. 3.3).
After some preliminary tests minor modifications were introduced to the original drawings
and a final version of the chamber (n=3) was manufactured and used on the hip simulator.
Figure 3. 3: The prototype environmental chamber installed on the hip simulator.
3.2.3. μCT system
The µCT used in this study is a XT H 225 real-time X-ray inspection system (X-Tek Systems
Ltd), which has both programmable and manual functions. The system has a 225kV X-ray
source, feature recognition down to 4μm and maximum volume measurement of
ø250mm and 600mm height. The XT H 225 has 3 linear axes and 2 rotational axes allowing a
view of the sample at any angle. The software used for CT 3D reconstructions is VG Studio
Max 2.0 (Volume Grapics, GmbH). Fig. 3.4 shows the machine description.

91
Figure 3. 4: The XT H 225 µCT system description (www.nikonmetrology.com).
3.2.4. Experimental procedures
The novel modular environmental chamber was installed on the hip simulator to allow
testing of the implants in wet condition. Prior to testing a three-point fixation was used to
stabilise the samples on the base plate and to achieve an optimal alignment with the femoral
head of the simulator (Fig. 3.5a). The chamber was then assembled around the specimen
(Fig. 3.5b), into which a saline solution (0.9% NaCl) was filled, as shown in Fig.3.5c. The
temperature was kept constantly at 37°C by a control system consisting of heating bar,
temperature sensor, and a central control box. A pump was utilised to inject the saline

92
solution directly onto the top surface of the specimen and to allow fluid circulation during
the test, therefore preventing abnormal high temperatures at the interfaces.
Figure 3. 5: Schematic representation of the experimental setup. The sample was first fixed onto the base plate (a), the chamber was then assembled around the specimen (b), into
which a saline solution (0.9% NaCl) was filled (c). The solution was kept at 37°C and circulated during testing (Tozzi et al., 2012).
A combined loading block (Fig. 3.6) composed of four routine activities (normal walking,
stairs down, standing 2-1-2 legs and stairs up) was adopted by Wang et al. (2009) from the
data of Bergmann et al. (2001). A body weight of 125kg was chosen to represent an upper
bound load case and to reduce the test duration. The resultant force vector was reproduced
with an average frequency of 0.6Hz for a combined block.
The effect of saline environment on the cement fixation was assessed by periodically
removing the sample from the hip simulator, and examining it by means of µCT. The samples
were scanned before testing and at every 100,000 cycles till gross loosening occurred. The
scanner was set to a voltage of 125kV and a current of 25μA. With an isotropic voxel size of
75μm the image acquisition process was performed at a rotational step of 0.19° over 360° for
approximately 90min and 3D reconstruction of the samples was obtained.

93
Figure 3. 6: The combined loading block built from the four physiological activities as an hourly loading block that was used in the current testing (Wang et al., 2009).
Two dimensional projections in transverse, sagittal and coronal planes were extracted from
the 3D data for damage analysis evaluation in the zones described by DeLee & Charnley
(1976).

94
3.3. Results
The µCT scan images prior to testing and during testing (at 100,000 and 200,000 cycles) are
presented in Figure 3.7 ((a) for the right implant, (b) for the left implant), where DeLee &
Charnley zones (DeLee & Charnley, 1976) are also indicated.
Prior to testing, both hips examined showed a bone-cement interface that appeared to be
fixed and intact. At 100,000 cycles, some evidence of demarcation may be observed starting
from the bone-cement interface in the superior quadrant or from DeLee & Charnley zone I
(yellow arrows) for both samples and in particular for the left one, as shown in Fig. 3.7.

95
Figure 3. 7: µCT sectional reconstructions recorded at selected loading intervals for (a) right and (b) left implanted hips. The images are shown with the DeLee & Charnley zones
identified. For both samples, the bone-cement interface appeared to be intact prior to testing. Interfacial debonding between the bone and the cement seemed to initiate in zone
I in the superior quadrant, as indicated by the arrows (Tozzi et al., 2012).
It seemed that debonding started from the edges of the bone-cement interface in the
superior rim of the reconstructs (zone I) and developed towards zone II, although at 200,000
cycles debonding had yet to reach the dome region in either cases. Damage progression from
100,000 to 200,000 cycles seems to be small, although the initiation of debonding may have
started well before 100,000.

96
3.4. Discussion
The results from preliminary testing of acetabular reconstructs in a saline environment and
otherwise under the same combined loading blocks suggest that, although progressive
debonding at the bone-cement interface defines failure in both wet and dry conditions, some
differences may be pointed out. Firstly, reduced survival lives, i.e. about 100,000 to 200,000
cycles, were observed for the two reconstructs tested in wet conditions, as opposed to 3 to 4
million cycles under the same combined load block in dry conditions (Wang et al, 2009).
Secondly, the initiation of the debonding seems to occur in DeLee & Charnley zone I,
consistently with clinical observations (Garcia-Cimbrelo & Munuera, 1992), as opposed to
zone II observed in dry conditions (Zant, 2006). Figure 3.8 illustrates these differences. Given
that the implantations were carried out consistently (despite some differences in the average
cement mantle thickness achieved during implantation), and the mechanical loading
conditions remained the same, the substantial damage from an earlier stage and the change
of the damage initiation pattern may be indicative of the role of environment in promoting
loosening in this type of replacements.
Although the precise failure mechanisms at the bone-cement interface are to be established,
the effects of moisture on the mechanical performance and fatigue behaviour of bone
cements and bone-implant interfaces are known to be of importance. Both storage and
testing environment, such as temperature and moisture, affect the mechanical properties of
bone cement (Baleani et al., 2001; Nottrott et al., 2007). An increased strength and modulus
of bone cement tested under compression in the first period of aging (up to 21 days) in wet
conditions at 37°C was observed (Baleani et al., 2001; Nottrott et al., 2007). However,
according to Nottrott et al. (2007), after only one week of soaking the mechanical properties

97
were found to decrease gradually due to the effect of water uptake, which has a plasticising
effect but also acts as a crazing initiator, implying weakening and possibly affecting the cyclic
stress distribution in the bone-cement-prosthesis complex. The degradation effects of
moisture on adhesives in resin-dentin bonded systems were shown to increase with soaking
time (Hashimoto et al., 2003; Reis et al., 2004). In the present study, a combination of
micromotion generated at the bone-cement interface due to mechanical loading, cement
weakening due to water uptake and moisture infiltration at the interface may have
contributed to the early and progressive debonding of the fixation.
Figure 3. 8: µCT images from a mid-section for (a) an implanted hip tested under normal walking in dry conditions (Zant, 2006), where debonding developed near the dome region (DeLee & Charnley zone II) at about 2,000,000 cycles; (b) an implanted hip tested in wet
conditions (current), where a demarcation may be observed in DeLee & Charnley zone I at just 100,000 cycles, as indicated by the arrows (Tozzi et al., 2012).
Admittedly, this is a preliminary study with limited samples tested. However, the current
results are consistent with the early results of Wang (2009), where debonding from DeLee &
Chernley zone I & III was also observed at a much reduced number of cycles using SBF in a
prototype environmental chamber. Another significant limitation is that the scannings were
carried out on the specimen unloaded, where interface gaps may be closed or partially

98
closed. In addition, small interface gaps, such as those 1 to 2 voxels (75-150µm), would
unlikely to be detected due to partial volume effects in the thresholding procedure.
Biological aspects as well as long-term response of the bone to the loading environment in
vivo were not considered. Factors such as residual fatty tissues or incomplete reaming may
also contribute to the premature failure of an implant, as in the previous experiments (Wang
et al., 2009) as well as in clinical cases, although the same test protocol was followed in both
dry and wet tests.
3.5. Conclusions
Preliminary results from the endurance testing of cemented acetabular reconstructs in a
saline solution seem to indicate that environment, when combined with physiological loading
conditions, plays an important role in reducing the survival rate of cemented acetabular
reconstructs. Although debonding at the bone-cement interface has been found as the
predominant failure mechanism in both wet and dry conditions, damage in wet condition
appears to occur much earlier and from DeLee & Charnley zone I, where the combined action
of mechanical loading and fluid environment seems to be most effective.

99
Chapter 4
Bone-cement interfacial
behaviour

100
4.1. Introduction The main findings discussed in this chapter have been reported in the following papers:
Wang, J.-Y., Tozzi, G., Chen, J., Contal, F., Lupton, C., Tong, J., 2010. Bone–cement
interfacial behaviour under mixed mode loading conditions. J. Mech. Behav. Biomed.
Mater. 3, 392–398.
Tozzi, G., Zhang, Q.-H., Tong, J., 2012b. 3D real-time micromechanical compressive
behaviour of bone-cement interface: Experimental and finite element studies. J.
Biomech. 45, 356-363.
In this chapter, bovine cancellous bones were used to interface with acrylic bone cement and
bone-cement interfacial behaviour was investigated at both apparent and micromechanical
levels using different loading conditions and experimental techniques.
Bone-cement interface coupons were mechanically tested under mixed-mode conditions and
the failed samples were examined using µCT to identify the failure mechanisms associated
with the loading angle. The main motivation of the study was to explore the relationship
between the measurable parameters, such as the fracture strength and the failure mode,
and the operational parameters, such as loading mode and cement penetration, so that the
key parameters that dictate the interfacial behaviour may be identified.
Furthermore, compressive micromechanical behaviour of bone-cement interface specimens
was investigated where the primary goals were: (1) To use a novel custom-made
micromechanical loading stage and time-lapsed µCT imaging to assess the local deformation
and damage development in the bone-cement specimens under selected levels of uniaxial

101
compression; and (2) to evaluate the effects of cement penetration and bone morphology on
the compressive response of the interface.

102
4.2. Methods
4.2.1. Specimen preparation
Bovine trabecular bones were harvested from fresh iliac crest and used to interdigitate with
acrylic bone cement (CMW1, DePuy CMW & Simplex P, Stryker, UK) to create bone-cement
interface samples. The rectangular bone coupons were machined to size using a low speed
diamond saw with constant water irrigation and cleaned to remove fatty tissues. Each
coupon was then placed into the lower half of a custom-made mould and bone-cement
interface strips were prepared by applying a constant pressure to the cement ranging from
finger packing (for the samples tested under mixed-mode conditions) to 60kPa (for the
samples tested under step-wise compression), following a procedure of Graham et al. (2003).
Bone-cement specimens were finally cut from the strips (Fig. 4.1).
Figure 4. 1: The bone-cement interface sample used in this study (all dimensions are in mm).

103
4.2.2. Loading stage (LS) system
A novel custom-made (Deben Ltd, UK) micromechanical loading stage (LS), equipped with a
3kN miniature load cell, was used to load bone-cement interface composites under step-wise
compression (Paragraph 4.4) within the µCT (XT H 225 X-Tek, as described in Chapter 3)
chamber (Fig. 4.2a). The loading stage is a modular system consisting of a carbon fibre
cylinder and a modular actuator with a load cell. Mini modular clamps and platens allow the
stage to be adaptable for different micromechanical testing. The carbon fibre cylinder
structurally supports the actuator and with its low attenuation coefficient provides low
interference effect on the radiographs during the acquisition (Baidya et al., 2001). Data
acquisition software (Deben Microtest V6.0.21) was used for computer control of the LS and
for real-time display and recording of the force-extension curves. A schematic of the LS is
shown in Fig. 4.2b.
Figure 4. 2: (a) The custom-made micromechanical loading stage (LS) within the µCT chamber; (b) a schematic of the LS, which was used to apply the load in stepped
compression (Tozzi et al., 2012b).

104
4.3. Bone-cement interface under mixed-mode loading
conditions
4.3.1. Experimental procedures
A loading device was designed (Fig. 4.3) to allow tensile ( = 0), shear ( =90) and selected
mixed mode ( = 22.5, 45 and 67.5) loads to be applied. The specimens were fixed in
custom grips at the prescribed loading angles and loaded to complete failure under
displacement control at a rate of 0.01mm/sec (ESH 10kN Servo-hydraulic testing machine). The
relative opening displacements were measured using a clip gauge, while the sliding
displacements were measured using a video extensometer (Messphysik). The vector sums of
the total displacements were calculated and used to plot load versus displacement curves. A
servo-hydraulic testing machine was used for the experiments and all tests were conducted
in air at room temperature. A total of 40 samples were tested at 5 selected loading angles
(0, 22.5, 45, 67.5 and 90); 8 tests were carried out at each loading angle. The data were
statistically analysed using ANOVA.
Figure 4. 3: (a) Schematic of the loading arrangement for tensile (0°), shear (90°) and mixed mode (22.5°, 45°, 67.5°) loading conditions. (b) The opening and the sliding displacements
as measured using a clip gauge and a video extensometer, respectively (Wang et al., 2010).

105
Specimens post mechanical testing were examined using microscopy and µCT (XT H 225 X-
Tek, Ltd). The specimens were held vertically by a specifically designed clamp, and the
scanning was performed at a rotational step of 0.19°, voltage of 55kV, current of 145μA and
isotropic voxel size of 14μm. For each frontal and lateral cross-section, a rectangular region
of interest (ROI) containing the cement-bone interface, was defined. The frontal ROI had a
surface area of approximately 10mm × 10mm, whereas the lateral one was of approximately
5mm × 10mm. The CT images were processed using Mimics 13.0 software (Materialise,
Belgium), and reconstructed by thresholding the cement and the bone regions based on CT
grey scale intensity. The 3D reconstructions were utilized to assess the failure modes for the
samples tested.
Failures were classified as one of the four types, following Miller et al. (2007):
Type I: Fracture occurred at the extreme of cement penetration with bone fragments
remaining in the cement half of the sample.
Type II: Fracture occurred at the extreme of cement penetration with bone spicules
remaining in the cement and cement fragments remaining in the bone.
Type III: Failure occurred beyond the extreme of cement penetration, but near the interface
of the bone.
Type IV: Failure occurred at the extreme of cement penetration with cement fragments
remaining in the bone but no bone spicules in the cement.

106
4.3.2. Results
The resultant applied load versus displacement curve for each specimen was recorded. All
load-displacement curves exhibit a similar characteristic response, with an initial linear
behaviour followed by non-linear hardening to reach peak load, then by substantial strain
softening until complete debonding of the interface. A normalised apparent strength was
used as a relative measure of interfacial strength and its relationships with the loading mode
and the normalised cement penetration depth is shown in Fig. 4.4a, b. The average apparent
strength was 4.09(±3.66)MPa in shear compared with 1.48(±0.85)MPa in tension.
Figure 4. 4: (a) Normalised apparent interfacial strength as a function of the loading angle. (b) Normalised apparent interfacial strength as a function of normalised cement
penetration.

107
An average cement penetration was estimated in the present study. The cement penetration
was measured at regular intervals of 0.5mm, from the edge of the specimen, following a
method by Maher & McCormack (1999) and resulted to be 0.51(±0.24)mm. The overall
correlation (r2) between the interfacial strength and the loading angle was found to be 0.77
(ANOVA, p=0.07) (Fig. 4.4a), while a value of 0.16 was obtained for the overall correlation
with the depth of cement penetration (Fig. 4.4b). Interestingly, a correlation of r2=0.76 was
obtained for samples tested under shear loads; while for other loading angles this value is
about r2=0.14.
The morphologies of the failed samples are presented in Fig. 4.5, where the cement half of
the samples was µCT imaged. In the majority of the cases failure was found to be of either
Type I or II for large loading angles, as opposed to Type IV or II for samples at low loading
angles.
Figure 4. 5: Morphologies of some of the failed bone-cement interface samples tested under tensile (0°), mixed mode (22.5°, 45°, 67.5°) and shear (90°), examined using μCT
scanning. Note bone and cement are marked accordingly (bone-red; cement-blue) (Wang et al., 2010).

108
4.4.3. Discussion
There are significant variations between the results from specimens tested under the same
or similar loading conditions, possibly due to multiple factors including the variation of the
bone morphology, the effectiveness in cement penetration as well as local pre-existing
damage at the interface. Nevertheless, some of the general trends may be observed. For
example, despite the fact that the effect of the loading angle was not significant, there is a
good correlation between the apparent interfacial strength and the loading angle (r2=0.77)
(Fig. 4.4a). The results are in broad agreement with those of Mann et al. (1999; 2001) in that
the shear strength of bone-cement interface is greater than its tensile strength; and the
loading angle significance with regards to the failure response was absent (p>0.05 (Mann et
al., 2001)).
For cadaveric bone-cement specimens, the apparent strength in tension was reported to be
1.28±0.79MPa (Mann et al., 1997) compared with 1.48(±0.85)MPa from the present study;
while for shear the present result of 4.09(±3.66)MPa is higher than the cadaveric result
2.25(±1.49)MPa (Mann et al., 1999), although a range of shear strength have been reported
in the literature such as 4-11MPa from (Dohmae et al., 1988), 5-7MPa from (Bugbee et al.,
1992) and 6-15MPa from (Bean et al., 1988).
The average cement penetration for tensile and shear tests in (Mann et al., 1997, 1999) was
1.5mm, while 2.2mm for mixed mode tests (Mann et al., 2001). These values are significantly
higher than the average depth of penetration (0.51mm) achieved in the present study.
Interestingly, however, the measured interfacial strength does not appear to correlate with
the difference in the depth of cement penetration. There may be several reasons for this.
Bone surface preparation techniques can affect the penetration depth, as reported in

109
Majkowski et al. (1993) from a depth of 0.2mm in unprepared bone, 0.6 to 1.4mm for
brushing with surface irrigation to 4.8 to 7.9mm achieved when pressurized lavage. The
effectiveness of cement penetration may be significantly affected also by blood circulation in
vivo, a difference between 0.1 to 4.6mm in the presence of circulation and 0.8 to 8.2mm in
the absence of circulation was reported (Juliusson et al., 1995). Although the penetration
depth increased with the increase of pressure, there was a large variation in the penetration
depths achieved under the same condition (Juliusson et al., 1995), possibly due to the
difference in the bone morphologies of the patients. Some found interfacial shear strength to
be dependent on the depth of cement penetration (MacDonald et al., 1993; Majkowski et al.,
1993). This is consistent with the results obtained in the present study (partial correlation of
r2=0.76), although there seems to be no consensus on the issue (Krause et al., 1982;
MacDonald et al., 1993; Majkowski et al., 1993; Mann et al., 2001).
The amount of bone interdigitated with cement was used to rationalise the variation in the
strength of the interface, an improvement on cement penetration as a correlation parameter
as reported previously (r2=0.025, (Mann et al., 2001)); r2=0.22, (Krause et al., 1982)),
although the correlations are still not strong (r2=0.5-0.7 (Mann et al., 1997, 1999, 2001)). It
seems that neither the depth of the cement penetration, nor the amount of bone
interdigitation, is solely responsible for the interfacial strength attained. Further work is
necessary to identify the most relevant parameter(s) in defining the interfacial strength.
The morphologies of the failed samples are presented in Fig. 4.5, where the cement half of
the samples was µCT imaged. The effect of loading angle on the failure mode may influence
the quantity of the remaining bone in the cement, which seems to increase with the increase
of the loading angle, suggesting more effective “pull-out” of cement pedicles in tension than

110
in shear. In the studies of Mann et al., the highest values in the measured failure strength
were obtained in Type IV mode, as found in the present study, i.e. failure occurred at the
extreme of cement penetration with cement pedicles remaining in the bone, a case which
rarely (<5%) occurred under mixed mode loading in (Mann et al., 2001) and none at all under
tensile or shear in (Mann et al., 1997, 1999). In the current study, however, majority of the
cases failed in either Type I or II at large loading angles, as opposed to Type IV or II for
samples at low loading angles.
Admittedly, the experimental work was carried out using bovine bones in air, conditions
considerably different from those in vivo, where the interface would not only experience
more complex loading conditions but also be exposed to bone remodelling in response to the
introduction of implants and possible degradation of the bone cement. Although bovine
bones have been used in the studies of bone porosity and its influence on the measured
interfacial fracture toughness (Graham et al, 2003), bovine trabecular bones is known to be
slightly denser than human trabecular bones and with more of a plate-like structure as
opposed to a rod-like structure found in human trabeculae. These architectural differences
were not considered in this work, although they might also affect the interfacial behaviour.
4.4. Micromechanical compressive behaviour of bone-cement
interface
4.4.1. Image-guided failure assessment (IGFA)
Step-wise compression testing of bone cement samples (n=5) in combination with time-
lapsed µCT imaging was performed using the novel loading stage (LS) devise previously
described. Modular end platens were used to apply compressive loads. The sample was first

111
glued (Permabond, UK) onto the lower compressive platen, whilst a small preload was
applied through the top platen connected to the actuator ensuring a good end contact.
The specimens underwent µCT analysis prior to testing and a complete data acquisition was
performed. The CT scanner was set to a voltage of 55kV and a current of 145μA. With an
isotropic voxel size of 20μm the image acquisition process was performed at a rotational step
of 0.19° over 360° for 90min approximately and 3D reconstruction of the samples was
obtained.
The samples were step-wise compressed at two selected displacements, corresponding
approximately to the ultimate apparent strength and before the final failure, respectively.
The former was defined as the first point on the load-elongation curve where the slope was
zero (Ciarelli et al., 2000); whilst the latter when the second zero slope was reached. The
slope readings were real-time captured together with the force-extension curve. At each
displacement step the specimen was allowed to relax for about 15mins before CT imaging
and data acquisition procedure were carried out. The 15-min window was deemed sufficient
for the specimen to reach a stable state of stress relaxation, based on trial tests performed.
All tests were carried out under displacement control at a constant cross head speed of
0.01mm/sec.
4.4.2. Cement penetration and bone morphology
The µCT data sets obtained from the five test samples were used to determine the contact
area (CA), cement penetration depth (CP), cancellous bone volume fraction (BV/TV); and to
further assess the step-wise progressive microdamage evolution. The CT scan data of the
specimens in the undeformed stage were imported into Mimics 14.01, where 3D objects

112
were created by thresholding the bone and the cement based on a protocol by Ding et al.
(1999). The 3D cement object was then dilated by two voxels (40μm) and the contact volume
was determined by a Boolean intersection between the cement and the bone. This volume
was then divided by the dilatation thickness, resulting in an estimated contact area (Mann et
al., 2008).
An average cement penetration over the specimen volume was calculated by measuring the
cement penetration depth at a regular interval (0.5mm) from a reference line AB on a frontal
cross section (Maher & McCormack, 1999), then repeating the measurement across the
thickness of the specimen at the same interval (0.5mm) on a series of frontal cross sections
to obtain a volume average, as shown in Fig. 4.6.
Figure 4. 6: The average cement penetration over the volume was estimated by (a) measuring firstly the penetration depths (marked “x”) at a regular interval (0.5mm) from a reference line AB on a frontal cross section (Maher and McCormack, 1999), where W is the
width of the sample; (b) repeating the measurement across the thickness (S) of the specimen at the same interval (0.5mm) on all the frontal cross sections. A volume average
was then obtained from all the measurements (Tozzi et al., 2012b).

113
The calculation of BV/TV for the cancellous bone in the bone-cement samples was carried
out following a procedure reported by Guillen et al. (2011) and explained in detail in Chapter
5. A volume of interest (VOI, 6mm×8mm×5mm) was chosen to contain the interdigitated
bone and part of the adjacent bone for all samples, over which BV/TV was calculated. The
size of the VOI satisfies the continuum requirements of BV/TV calculation (Harrigan et al.,
1988).
The microdamage at the bone-cement interface was recorded and evaluated at each step
during the step-wise compression for all samples.
4.4.3. Results
The microdamage evolution in all five bone-cement interface specimens (BC01-BC05)
showed similar patterns where the predominant deformation was found to initiate in the
bone region, whereas the cement region appeared to be unaffected even towards the final
failure stage. The main load transfer appears to occur in the bone-cement contact region,
resulting in progressive microfailures including bending and buckling of trabeculae adjacent
to the interdigitated region. Fig. 4.7 illustrates some details of the progressive microdamage
during the step-wise compression in representative 3D sub-volumes.
No such deformation was found in the bulk interdigitated region; and there is no evidence of
bone-cement interfacial debonding or cement cracking from the CT images.

114
Figure 4. 7: 3D reconstructions of the five bone-cement interface samples tested (BC01-BC05) and selected sub-volumes (rectangles), where the progressive microdamage was
monitored: (a) Unloaded; (b) at the ultimate stress; (c) failure state and (d) details of the local damage (mostly trabeculae buckling) in the bone-cement contact region, as indicated
by the arrows (Tozzi et al., 2012b).
The contact area (CA) and cement penetration depth (CP) for the five samples were found to
be 225.95(±97.55)mm2 and 3.60(±1.50)mm, respectively. Although a strong correlation was
found between CA and CP (r2=0.94), there is no apparent correlation of CP (and consequently
CA) with the ultimate compressive strength (r2=0.18), as shown in Figs. 4.8a and d.

115
Figure 4. 8: Correlations between (a) cement penetration and bone-cement contact area; (b) interfacial strength and cancellous bone volume fraction (BV/TV); (c) cement penetration and BV/TV and (d) interfacial strength and cement penetration. The
correlations range from very good (r2 = 0.94 for (a)) to poor (r2 = 0.18 for (d)) (Tozzi et al., 2012b).
The BV/TVs were calculated over the selected VOI for all the samples and the mean and
standard deviation were found to be 0.20(±0.03). A moderate correlation (Fig. 4.8b) was
found between the BV/TV and the ultimate strength (r2=0.71); whilst the correlation of
BV/TV with CP is r2=0.65 (Figs. 4.8c). The ultimate apparent compressive strength for the five
samples was estimated at 4.93(±1.10)MPa.
The stress-displacement responses of the five samples tested are shown in Fig. 4.9.

116
Figure 4. 9: The stress-displacement curves obtained from the compressive testing of the five samples. The dots (red=unloaded, yellow=ultimate strength, dark blue=failure) on the
experimental curves indicate the positions at which the samples were imaged under a fixed displacement. The discontinuities are due to the stress relaxation in the samples under a
constant displacement (Tozzi et al., 2012b).
4.4.4. Discussion
Three dimensional full volume visualisation of damage evolution in bone-cement interface
during static compression shows that the bone region sustained most of the deformation
overall. As the load was transferred to the cement mantle, damage in the bone-cement
contact region developed, resulting in progressive failures of the trabeculae mainly due to
buckling (Fig. 4.7). These findings were confirmed with the FE simulations (Figs. 4.10 and
4.11) reported by Tozzi et al. (2012b), and are consistent with the finding of Mann et al.
(2008) that the contact interface was responsible for most micromotions of the bone-cement
interface.

117
Figure 4. 10: a) The percentage of energy dissipated from the bone in BC-PI (Bone-Cement Partially Interdigitated) and BC-FI (Bone-Cement Fully Interdigitated) regions. b)-e) The
predicted progressive development of yielded elements from the FE model under a compressive displacement of: b) 0.05mm; c) 0.1mm; d) 0.2mm and e) 0.3mm. Yielding
appears to initiate mainly in the Bone and partially interdigitated (BC-PI) regions, developing across the fully interdigitated (BC-FI) region. Red: Bone; blue: Cement (Tozzi et
al., 2012b).

118
Figure 4. 11: (a) CT image of a typical bone-cement interface sub-volume (Fig. 4.7a, BC01). (b) The local predicted minimum principal strain distribution of the same sub-volume from the FE model and (c) the damage sustained at the failure state during the experiment (Fig. 4.7c, BC01). The high local compressive strain predicted (b) may explain the local buckling
damage (c), as indicated by the arrows (Tozzi et al., 2012b).
The effect of cement penetration on the bone-cement interfacial behaviour has been a major
interest (Krause et al., 1982; Mann et al., 1997, 2001; Leung, 2008; Waanders et al., 2010).
Interestingly, although the CA correlates with CP, consistently with the report of Waanders et
al. (2010), neither CA nor CP correlates with the apparent interfacial compressive strength
measured in the current study. The pressurisation technique used for the specimen
preparation resulted in an overall CP depth of 3.60(±1.50)mm, a value within the optimal
range of 3–5mm considered for bone-cement interface (Krause et al., 1982; MacDonald et
al., 1993). As opposed to in the cases of tensile and shear (Mann et al., 1997, 2001, 2008),
where moderate correlations between the interfacial strength and cement penetration were
found, the current study shows virtually no correlation between the compressive strength
and cement penetration depth. This is likely due to the difference in the loading mode which
dictates the failure mechanism. In tensile and shear cases, cement pedicles being “pulled-
out” serves as the main failure mechanism, where the role of cement penetration depth may

119
be important; whilst this mechanism is absent from compression as compressive failures are
attributed mainly to trabeculae bulking in the bone and the bone-cement contact regions. In
addition, insufficient load transfer to the bulk interdigitated volume also supports this line of
argument. Furthermore, the bone used in Mann et al was from the medullary cavity of
femurs with substantial cortical bone and some trabecular bone, whilst only trabecular bone
taken from iliac crest was used in the present study. This may also explain some of the
differences in our results and those of Mann et al. (1997, 2001, 2008).
The ultimate strength of cancellous bone is known to be strongly correlated with the
apparent density (or BV/TV) of the bone (Keaveny et al., 2001). The average BV/TV from this
study is 0.20(±0.03) and it has a correlation (r2=0.71) with the ultimate interfacial strength.
This may be explained by the role of the bone and the cement in load sharing as constituents
of the bone-cement composite structure, although the bone appears to carry most of the
loads (Figs. 4.7 & 4.10).
The current study describes the essential response of bone-cement interface under static
compression, a common loading mode experienced in tibial, femoral components of knees
and acetabular components, and reflective of the immediate post-operational state of
cement fixation, where cement cracking due to fatigue loading and bone
cracking/remodeling are absent.
4.5. Conclusions
The results reported in this chapter may be useful in the analysis of bone-cement interface in
joint replacements with and without defects under different loading conditions.

120
The measured interfacial strength does not appear to correlate with the depth of cement
penetration, and the effect of the loading angle seems more consistent in dictating the
failure of the bone-cement interface under mixed mode loading conditions, as confirmed by
both mechanical testing and post failure morphologies.
Time-lapsed µCT imaging and in situ step-wise compression showed that load transfer in
bone-cement interface occurred mainly in the bone cement contact region, resulting in
progressively developed deformation due to trabeculae bending and buckling. Contact area
and cement penetration depth were found to be closely related, although neither correlates
with the measured compressive interfacial strength. A moderate correlation was found
between the BV/TV and the ultimate interfacial strength.

121
Chapter 5
Characterisation of cancellous
bone analogous materials for
biomechanical testing

122
5.1. Introduction
The main results discussed in this chapter were partially obtained at the University of Siegen
(Germany) within a research partnership (British Council-DAAD, ARC1354) with the
Universities of Portsmouth (UK), and reported in the following papers:
Guillen, T., Zhang, Q.-H., Tozzi, G., Ohrndorf, A., Christ, H.-J., Tong, J., 2011.
Compressive behaviour of bovine cancellous bone and bone analogous materials,
microCT characterization and FE prediction. J. Mech. Behav. Biomed. Mater. 4, 1452-
61.
Guillen, T., Ohrndorf, A., Tozzi, G., Tong, J., Christ, H.-J., 2011b. Compressive fatigue
behaviour of bovine cancellous bone and bone analogous materials under multi-step
loading conditions. Adv. Eng. Mat., doi: 10.1002/adem.201180060.
In this chapter, AlSi7Mg and CuSn12Ni2 open-cell foams were characterised using Scanning
Electron Microscopy (SEM) and µCT. Static compression testing together with multiple-step
cyclic tests were carried out to determine whether the foams might be suitable as cancellous
bone mechanical models for biomechanical studies. Mechanical and morphometrical
properties were obtained for the three foams and compared with the corresponding values
obtained from bovine iliac crest cancellous bone.
Some preliminary results, under mixed-mode loading conditions, of foam-cement interface
mechanical testing of the interface are also presented.

123
5.2. Materials and specimen
The open-cell metal foams used in this work were precision-cast, where an open-cell polymer
model was used as a template to create casting moulds into which metallic alloys were cast.
The desired cell size, relative density and geometry were determined by the appropriate
polymer foams. The polymer foams were filled with a mould casting slurry which was then
baked to harden the casting material (Fig. 5.1a).
Figure 5. 1: (a) The open-cell production process and (b) the cylindrical foam specimen used in this study.
The mould materials were then removed to leave the metal foam with the prescribed
morphology of the original polymer foam (Girlich & Franzke, 2001). Open-cell AlSi7Mg foams
(m-pore GmbH) with porosities of 30ppi (pores per inch) and 45ppi were produced, together
with a 30ppi CuSn12Ni2 foam. The foams were obtained in sheets with dimensions of
200x200x10mm3. Specimens from each type were machined to a cylindrical shape with a
diameter of 8mm (Fig. 5.1b). Cancellous bone samples of the same diameter were harvested
from fresh bovine iliac crest, using a milling drill. The iliac crest was chosen to obtain the
bone samples with no preferential orientation in its trabecular network. The bone samples

124
were kept frozen till testing (Linde & Sorensen, 1993); and were thawed and stored in a SBF
solution (Kokubo & Takadama, 2006) for approximately 24h before testing.
The three foam materials were also used to interdigitate with acrylic bone cement to create
foam-cement interface samples. Samples were prepared with the same procedure used for
the bone-cement interface coupons (finger packing) as reported in Chapter 4.
5.3. Compressive behaviour of cancellous bone and open-cell
metallic foams
5.3.1. Material characterisation
Ten cylindrical specimens for each of the three foams and bone were examined prior to
mechanical testing using µCT (XT H 225 X-Tek, Ltd). The scanner settings used for the three
different materials were 55kV-130μA for the trabecular bone, 60kV-140μA for the AlSi7Mg
foams and 90kV-65μA for the CuSn12Ni2 foam, respectively. With an isotropic voxel size of
15μm the image acquisition process was performed at a rotational step of 0.19° over 360°
and 3D reconstruction of the samples was obtained.
The calculation of the morphometric parameters was carried out by importing the CT images
into MicroView v2.1.2 software (GE Healthcare) and using a uniform threshold procedure
(Ding et al., 1999). A circular region of interest (ROI) containing only cancellous bone/foams
(diameter 7.2mm) was defined in order to exclude the surface debris as a result of the
cutting operation. The cylindrical volume of interest (VOI) for each sample was of
approximately 7.2mm diameter by 13mm (height). For each specimen the following
morphometric parameters were determined over the entire VOI, including volume fraction,

125
BV/TV or FV/TV, trabecular thickness (Tb.Th) or strut diameter and trabecular separation
(Tb.Sp) or cell spacing. The reconstructed bone and foams are shown in Fig. 5.2.
Figure 5. 2: 3D µCT reconstructions of (a) bovine trabecular bone; (b) 45ppi AlSi7Mg foam; (c) 30ppi AlSi7Mg foam and (d) 30ppi CuSn12Ni2 foam (Guillen et al., 2011).
In addition, the bone specimens were cleaned with ethanol in an ultrasonic system for
approx 3h, then dehydrated in a desiccator for approximately 24h and finally sputtered with
gold to allow the examination using the SEM (Philips XL 30). SEM was also carried out for

126
AlSi7Mg and CuSn12Ni2 foams. The morphometric parameters were then manually
estimated based on the micrographs.
5.3.2. Mechanical testing
Compression testing was carried out on a MTS 810 servo-hydraulic testing system under
displacement control. The measured mechanical properties were reported to be influenced
by the experimental procedures (Keaveny et al., 1997) and specimen geometry (Linde et al.,
1992; Keaveny et al., 1993). Hence efforts were made to minimise the test variables. Custom
made end-caps were manufactured from hardened steel. The ends of each cylindrical
specimen were then embedded about 3mm into the end-caps with acrylic resin to minimise
the end artifacts (Keaveny et al., 1997). A custom made aligning system was also used to
ensure the alignment of the sample with the loading axis. The length of the cylinders after
fixation was of approximately 13mm, thus achieving an aspect ratio of 1.625:1, within the
range of 1.5 to 2, as recommended by DIN 50134 (2008) for compressive testing of metallic
cellular materials; and not far from the 2:1 suggested by Keaveny et al. (1993) for testing of
bones. Strain measurements were performed using a 15mm gauge-length extensometer
(Sandner EXA R15-5X) attached to the end-caps (Keaveny et al., 1997). The elastic modulus,
yield stress and ultimate strength were determined. The experimental set-up used for the
mechanical testing is shown in Fig. 5.3.

127
Figure 5. 3: Schematic of the experimental setup. The sample was embedded into the endcaps using acrylic resin. Strains were measured using an extensometer attached to the
end-caps (Guillen et al., 2011).
Tests were carried out following the protocol for cellular metals (DIN 50134, 2008).
Preliminary compression tests were performed at a constant strain rate of 0.01/sec on the
three foams (n=5 for each type) and the bone samples (n=5) to estimate the mechanical
properties, including R20, R70 (20% and 70% of the compressive strength, respectively) and
ultimate compressive strength (σult). The tests (n=10 for each material) were then carried
out at an initial strain rate of 0.001/sec under a preload of approximately 2% of the σult until
R70 was reached. The load was then reduced to R20 at a strain rate of 1/sec. Finally the
samples were re-loaded from R20 until failure at a strain rate of 0.1/sec. The ultimate
compressive strength was defined as in Ciarelli et al. (2000) and Li & Aspden (1997). The
protocol was slightly modified for the testing of bones, where R40 was used instead of R70.

128
The elastic modulus was measured directly from the unloading linear stress-strain
relationship between R70 (R40 for the bones) and R20. The yield stress was estimated using the
0.2% offset method (Keaveny et al., 1994).
5.3.3. Results
A summary of the morphological and mechanical properties of bone and foams are
presented in Table 5.1 and 5.2 respectively. The elastic modulus of AlSi7Mg foams is about
30% (30ppi) and 40% (45ppi) that of bone; whilst the elastic modulus of CuSn12Ni2 foam is
about 30% higher than that of bone. Further, the yield stresses of all foams are much lower
than that of the bone (AlSi7Mg foams are only 8-10%; whilst CuSn12Ni2 foam is about 50% of
the yield stress of the bone). The ultimate compressive strengths follow a similar trend (11-
13% for AlSi7Mg, 50% for CuSn12Ni2 of the ultimate compressive strength of the bone).
Table 5. 1: A summary of the morphometry results from all the tests performed on the three foams and bone (Guillen et al., 2011).

129
Table 5. 2: The mechanical properties obtained from testing of the three foams and bone (Guillen et al., 2011).
The stress-strain curves of the four sets of materials are presented in Fig. 5.4. The mechanical
responses of the two AlSi7Mg foams (Figs. 5.4b-c) seem to be similar, with a significant range
of stress hardening (up to 3% strain) following the initial elastic response, then “softening” till
about 10% strain.
Figure 5. 4: Mechanical responses as measured of (a) bovine trabecular bone; (b) 45ppi AlSi7Mg; (c) 30ppi AlSi7Mg and (d) 30ppi CuSn12Ni2 foam (Guillen et al., 2011).

130
CuSn12Ni2 foams (Fig. 5.4d) showed only limited hardening following the elastic response,
whilst no softening was observed in the same strain range (up to 10%) as in the AlSi7Mg
foams. The stress-strain behaviour of the bone is shown in Fig. 5.4 (a), where linear
behaviour was observed at the beginning of the compression. This was followed by a brief
but significant hardening period, then by a prolonged softening with considerable reduction
of stresses due to progressive failure of the trabeculae. For large strains between 9-12%, a
slight increase in the stress may be observed also, due to the densification process of the
trabeculae.
The SEM results were found to be broadly similar to those obtained from the µCT (Table 5.1).
The microstructures of the four samples from the SEM analysis are shown in Fig. 5.5.
Figure 5. 5: SEM micrographs of (a) bovine trabecular bone; (b) 45ppi AlSi7Mg; (c) 30ppi AlSi7Mg and (d) 30ppi CuSn12Ni2 foam (Guillen et al., 2011).

131
5.3.4. Discussion
The bone and foams tested in this study exhibited the usual deformation behaviour observed
in cellular materials (Gibson & Ashby, 1997; Gibson, 2005). The adoption of a compression
test standard for cellular materials (DIN 50134, 2008) and an appropriate gripping
arrangement (Fig. 5.3) have reduced the testing variables, hence more consistent results in
the measured elastic modulus, yield stress and ultimate strength are obtained. Particular
attention was placed on the determination of the elastic modulus. At the initial loading stage
of the test, an increase in stress was observed, which, at first sight, appeared to be elastic.
However, previous works revealed that the stress was only partially reversible, and some
irreversible deformation processes in the cellular structure occurred during this loading stage
(Banhart & Baumeister, 1998). Therefore, the measurement of the elastic modulus was
carried out based on the unloading linear stress-strain relationship between R70 and R20.
The “softening” or reduction of strength observed in the AlSi7Mg foams may be
characteristics of this type of alloys, which are influenced by the manufacturing process. It
was previously observed (Krupp et al., 2006) that in cast AlSi7Mg foams coarse Si and Mg2Si
precipitates were present along the grain boundaries. These precipitates can drastically
reduce the effective properties of cell struts and trigger brittle failure. Another factor that
may affect the deformation behaviour is the homogeneity of the foam. Poor homogeneity
introduces localised deformation by the formation of deformation bands leading to cell
collapsing. With increasing homogeneity the deformation of the foam structure becomes
more uniform due to the more uniform distribution of the stresses. The results of current
compression tests show that the ductility of the AlSi7Mg foam studied in this work is superior
to that used in a previous study (Ohrndorf et al., 2006). A possible reason for this

132
improvement may be the development of advanced casting techniques, which resulted in not
only a more homogeneous foam structure but also better microstructural properties of the
cell struts. Most of the closed-cell metal foams commercially available show some anisotropy
of their mechanical properties as a consequence of cell asymmetry obtained during the
manufacturing processes. For many applications this anisotropy is considered as a
disadvantage and much work is carried out in order to reduce anisotropy and irregularity of
the foam structure. On the other hand, precision casting process might be used to produce
“tailored” anisotropy by suitably defining the precursor material. Another possibility to
produce foam materials with a specific degree of anisotropy is to use an isotropic precursor
material and stretch it prior to embedding with a ceramic mould material. The stretched
shape of the cells will give the metal foam an anisotropy that could be controlled by the
degree of stretching.
In comparison with the AlSi7Mg foams, failure of cell struts in CuSn12Ni2 foam, if any, seems
to be insignificant from the deformation behaviour of the foam. Consequently, an
approximately linear-perfect plastic stress-strain curve was obtained. Similar behaviour was
found in a ductile foam Cu11Zn3.5Si (Ohrndorf et al., 2005), where elastic deformation
behaviour during the loading stage of a compression test (up to 10% strain) was followed by
a pronounced plateau regime up to 70% strain. The ductility of the cell struts, as well as the
homogeneity of the architecture of the foam, may be responsible for the deformation
behaviour of the foam. The high mechanical strength achieved in this bronze foam, as
opposed to those of the two aluminum foams, may be attributed to the bulk material
properties.

133
Detailed studies of cancellous bone at tissue level (van Rietbergen et al., 1995) showed that
the predominant deformation mode in bones is bending, where the trabeculae can be
strained in tension even under apparent compressive loading. Unlike foams, where a general
trend of buckling may be observed, brittle fracture due to the presence of minerals was
observed to be more evident in bones (Nazarian & Muller, 2004), although collagen network
within the trabeculae may keep the mineral phase together even at large strains. These
finding are consistent with some IGFA results for the three foams and cancellous bone,
where the final failure was characterised by predominant buckling in the foam material and a
mixture of bending, buckling and brittle failure in cancellous bone (Guillen et al., 2011c). It
needs to be said that the bone samples were selected from iliac crest where no pronounced
anisotropy exists in the trabecular network, and this permits a direct comparison with the
foams which are essentially isotropic.
There are significantly higher scatters in the data obtained from the bone (±2.5MPa), than
those from AlSi7Mg foams (±0.25MPa for 30ppi; ±0.1MPa for 45ppi) and that of CuSn12Ni2
foam (±0.5MPa). This is not unexpected as mechanical properties of trabecular bone are
affected by density, structural anisotropy, marrow influence and viscoelastic properties
(Nicholson et al., 1997; Carter & Hayes, 1977; Martin et al. 1998), factors that can vary
greatly with site and subject. From a biomechanical characterization point of view,
substitution of bones with appropriate foams may be a reasonable step forward to remove
some of the uncertainties.
Although the morphological parameters of the foams and the bone used here are not too
dissimilar (Table 5.1, Figure 5.2), the apparent mechanical responses differ considerably
between the foams and the bone (Table 5.2). These differences may be explained by the

134
differences in the mechanical properties of the base materials as well as their
microarchitecture details, although it remains a challenge to find foams that represent both
the apparent mechanical properties of trabecular bone and its microarchitecture. However,
FE simulations performed on the three materials (Guillen et al., 2011) showed that,
regardless of the difference in their architectures, the yielded elements appear to be
distributed throughout the whole structure for both bone and foam. This is interesting as
although the global mechanical responses differ considerably between the foams and the
bone, the damage distribution and evolution with load are broadly similar. This finding might
be useful in the use of foams as bone substitute materials for material testing purposes using
scaled models, for example.
Gibson (2005) described a general relationship between the apparent mechanical properties
of cancellous bone and its density; and indicated that low-density trabecular bone may
resemble open-cell foams. The metallic foams used in the present study are in the low-
density range of 177-355kg/m3 for cancellous bones. The 30ppi and 45ppi AlSi7Mg foams
might be related to bones with average densities of 177kg/m3 and 193kg/m3, respectively;
whereas a higher value of 355kg/m3 might be represented by the 30ppi CuSn12Ni2 foam.
The main goal of this study was necessarily limited to the evaluation of the morphological
and mechanical properties of some of the available metallic foams as possible candidates for
cancellous bone substitute materials for mechanical testing purposes. Caution must be
exercised in cases such as assessing pull-out strength of screws though, where local
microstructural properties may dictate the outcome.

135
5.4. Compressive fatigue behaviour of cancellous bone and
bone analogous materials under multi-step loading conditions
5.4.1. Mechanical testing and SEM analysis
The monotonic compression results previously obtained (see Paragraph 5.3) were used to set
up the cyclic tests. Fatigue tests on a MTS 810 servo-hydraulic testing system equipped with
a 2kN load cell were performed, at a frequency of about 1Hz. A preload of 5N was applied to
the samples to ensure good end contact throughout the test, and this preload was
subsequently kept constant as the maximum stress (σmax) in a cyclic test (Fig. 5.6).
The multi-step testing was carried out in two series: short multi-step tests and long multi-
step tests. A total of six samples were used in each test series.
Figure 5. 6: A schematic representation of a multi-step compressive fatigue test (Guillen et al., 2011b).

136
Short multi-step tests
Foams and bones were cyclically tested in compression at a frequency of 1Hz. Each sample
was tested under multiple stress amplitudes in steps by keeping the maximum stress
constant and increasing the minimum stress incrementally. The stress amplitude of each step
was kept constant for a given number of cycles between 300 and 500 cycles. The step
duration for the 30ppi AlSi7Mg and 45ppi AlSi7Mg foams was 300 cycles, whilst the step
duration for the 30ppi CuSn12Ni2 foams and bones was 500 cycles. For all foams, the preload
was kept at 5N while for bone was 10N. For all materials, the first step had a minimum stress
(σmin) of 0.5σult (Fig. 6.9). The value of σmin at the first step was chosen so that the sample
remains essentially elastic. For the subsequent steps the σmin was increased by 0.1MPa per
step for the 30ppi AlSi7Mg and the 45ppi AlSi7Mg; 0.2MPa for 30ppi CuSn12Ni2 and 0.5MPa
for the cancellous bone until failure.
For further analyses the secant modulus (E) was calculated, where E was defined as
Δσ/Δε=(σmax - σmin)/(εmax - εmin). The secant modulus was measured at steps during the test to
monitor the onset and development of fatigue damage. According to some authors (Michel
et al., 1993; Palissery et al., 2004; Dendorfer, 2008; Gibson et al., 2010), fatigue failure for
cellular materials may be defined in terms of specific reduction in the secant modulus. In this
work, failure was considered as a reduction by more than 10% of the secant modulus as
compared to the secant modulus of the first cycle (E0).
Cyclic yield stress (σcy) of samples was obtained and used for setting the long multi-step tests.
Cyclic yield stress was defined as the stress amplitude where irreversible deformation of the
cell-struts took place. The measurement of the cyclic yield stress was obtained by analysing E

137
in each step of the fatigue test and cyclic yield stress was considered as a reduction by more
than 5% of the secant modulus compared to the E0 (Michel et al., 1993; Ganguly et al., 2004).
Long multi-step test
Long multi-step tests were carried out for all materials at four steps of 5,000 cycles and a
frequency of 2Hz. The values for σmin were chosen as: 0.4σcy, 0.6σcy, 0.8σcy, and σcy. The
purpose of this test was to examine the long term cyclic behaviour of the materials. Special
attention was placed on the pseudo-saturation regime (PSR) (Dendorfer, 2008) of the strain
vs cycle curve.
For both short and long multi-step tests the minimum strain (εmin) and the maximum strain
(εmax) were monitored and strain vs cycle curve and hysteresis loops obtained. In addition,
mean strain was also obtained, so that the influence of mean strain as well as strain
amplitude on the evolution of deformation of foams and bones may be assessed.
Failure analysis
Fracture surfaces of the specimens after multi-step tests were analysed using SEM. The
specimens were carefully extracted from the grips post testing. In order to avoid additional
damage, the samples were cold embedded and ground until the deformed cell struts were
found. Prior to the SEM analyses the samples were prepared using the same procedure
reported above (Paragraph 5.3).
5.4.2. Results
Fig. 5.7 shows the monotonic compression and the multi-step fatigue test results of the
30ppi AlSi7Mg foam. With the determination of σy and σult in the compression test (Fig. 5.7a),

138
it was possible to establish an initial stress step for the multi-step fatigue test. The fatigue
test started with a minimum stress of 0.5σult, where linear elastic response was observed
(Fig. 5.7b). Thereafter, the main phases of the cyclic deformation behaviour may be classified
as deformation in the transient region, evolution of the deformation during the pseudo
saturation region (PSR), deformation at the defined failure and catastrophic failure (Michel et
al., 1993; Moore & Gibson, 2001, 2003, 2003b; Ohrndorf et al., 2006).
Figure 5. 7: Mechanical behaviour of 30ppi AlSi7Mg: (a) Monotonic compression test curve, (b) max/min strain of the short multi-step test, (c) hysteresis loops of the short
multi-step test (Guillen et al., 2011b).

139
The cyclic yield stress σcy of 30ppi AlSi7Mg was about 0.9MPa (Fig. 5.7b and c). This value was
slightly higher than the compressive yield stress σy (Fig. 5.7a). Fig. 5.7b shows that after the
transition phase, the mean strain remains mostly constant during each step. However, at the
step with σmin at 0.9MPa a decrease in the mean strain appeared, indicating possibly
irreversible deformation of the struts.
The secant modulus at the first step (σmin=0.5MPa) was E0≈309MPa. E was then measured at
the subsequent steps and found that at σmin=0.9MPa the secant modulus (E1) was reduced by
approx. 5% (Fig. 5.7c). Finally, at a stress near to catastrophic failure (~1.1MPa), the
reduction of E3 was around 20%. At this point, a drastic increase of the compressive mean
strain was measured just prior to the catastrophic collapse of the cell struts. This behaviour
was found to be common for all the metallic foams. For the 45ppi AlSi7Mg foam similar
values of σcy and σfail were obtained (Table 5.3).
Table 5. 3: Comparison of monotonic (see Table 5.2 in Paragraph 5.3) and multi-step fatigue test results (Guillen et al., 2011b).

140
The monotonic compression and the multi-step fatigue test results of the 30ppi CuSn12Ni2
foam are shown in Fig 5.8. The compressive mean strains at σcy were in the range of 0.35 to
0.70, again, close to that for monotonic yield strain (0.6–0.73) (Table 5.3). For the secant
modulus at σcy approximately 3.6MPa was found. This value was selected to set up the long
multi-step tests of the bronze foam samples.
Figure 5. 8: Mechanical behaviour of 30ppi CuSn12Ni2: (a) Monotonic compression test curve, (b) max/min strain of the short multi-step test, (c) hysteresis loops of the short
multi-step test (Guillen et al., 2011b).

141
The behaviour of trabecular bones during monotonic compression and multi-step tests is
shown in Fig. 5.9. As in the foams, it is possible to see an increase of the residual strain during
the fatigue test.
Fig. 5.9b shows that the compressive value of εmin increases at each step, whilst the slope of
εmax stays almost linear until σcy, when the strain rate increased drastically due to the
progressive damage accumulation. Similarly to the foams, hysteresis loops in Fig. 5.9c show
non-linearity and the shift of the loops. Nevertheless, the hysteresis loop shift showed by
bones was continuous along the entire multi-step test. The cyclic yield stress σcy was found to
be between 3 and 5MPa. These values were obtained when E decreased by more than 5%.
Figure 5. 9: Mechanical behaviour of trabecular bone: (a) monotonic compression test curve (b) max/min strain of the short multi-step test, (c) hysteresis loops of the short multi-
step test (Guillen et al., 2011b).

142
Fig. 5.10 shows the long multi-step test results for the 45ppi AlSi7Mg foam and trabecular
bone.
Figure 5. 10: Strain development from a multi-step fatigue test of (a) 45ppi AlSi7Mg and (b) trabecular bone (Guillen et al., 2011b).
The cyclic deformation behaviour of the foam was similar for the long multi-step test to that
of short multi-step test. The values of the mean strain at failure were very similar to those
showed in Table 5.3. The samples were cyclically loaded at steps up to 30,000 cycles. About
5,000 cycles were allowed at the last step (σcy) to record damage accumulation leading to
catastrophic failure.
Bones in the long multi-step test show similar behaviour to that observed in the short multi-
step tests. Damage accumulated continuously during the test, and catastrophic failure was
observed at 30,000 cycles. A comparison of the short and the long multi-step test results
reveals that failure occurs only when a compressive mean strain of 1.7-2% is reached. This
value is similar to the mean failure strain found for the foam samples (Table 5.3).

143
SEM micrographs of the failed samples are shown in Fig. 5.11. White vertical arrows indicate
the loading directions during the fatigue tests.
Figure 5. 11: Failure analysis of the samples using SEM (failure mode 1: buckling, 2: rupture, 3: splitting): (a) 30ppi AlSi7Mg, (b) 45ppi AlSi7Mg, (c) 30ppi CuSn12Ni2 foam and
(d) trabecular bone (Guillen et al., 2011b).
SEM analysis revealed that the main failure mechanism of the foams was buckling (1), caused
by the accumulation of residual strains during the tests. 30ppi AlSi7Mg and 45ppi AlSi7Mg
show additional rupture without buckling (2).
A BSE detector was used to examine bone samples as it is more sensitive in detecting failures
on the surface of the bone compared to the SE detector. BSE micrographs of the tested

144
trabecular bone reveal that the samples failed by a combination of buckling (1), splitting (3)
and brittle failure (2) in some trabeculae (Fig. 5.11d).
5.4.3. Discussion
The short multi-step test showed how the increase of the residual strain, or the accumulated
plastic deformation, was the principal mechanism for material failure. This phenomenon is
also called cyclic creep (Carter, 2005) which results in a shift of the hysteresis loops along the
strain axis. In addition, broadening and increased nonlinearity of the hysteresis loops were
also observed when the mean strain exceeded σcy (Fig. 5.7(c)). It seems that cyclic creep
takes place principally in the transient region of each step and the compressive mean strain
at cyclic yield is very similar to the monotonic yield strain (Table 5.3). The cyclic creep rate is
highest at the beginning of every step. Subsequently, the rate reduces during the pseudo-
saturation phase. This cyclic creep transition phase is short for the steps at stress amplitudes
of 0.5, 0.6 and 0.7 MPa, whilst at 0.9MPa and above saturation is no longer attainable.
For the 30ppi CuSn12Ni2 foam cyclic deformation is also principally due to cyclic creep. The
strain rate in the transitional phase of each step appears to change slower than that in the
AlSi7Mg foams (Fig. 5.8b and c). This may be explained by the more ductile behaviour and
homogeneity of the bronze foam. Fig. 5.8b shows that the cyclic creep at the transition
phases increases for stress closer to σult, although the increment (0.2MPa) was larger than
that for the AlSi7Mg foams (0.1MPa). The mean cyclic strains of the bronze foam are similar
to those obtained for the AlSi7Mg foams.
The compressive residual strain in bones increased with a largely constant rate during the
entire test, as opposed to the foams where transient behaviour occurred primarily at step

145
changes. Unlike in the foams, the cyclic mean strain at yield was in the range of 0.5-0.6, much
lower than the range of the monotonic yield strain (1.27-1.96); although the compressive
mean strain at failure (1.7-2) is close to the monotonic yield strain (1.27-1.96, Table 5.3). It
was noticed also that bone deformation at the steps accumulated continuously until failure.
This seems to suggest that the secant modulus may be used to characterise the damage of
the structure. Based on previous studies (Pattin et al., 1996; Zioupos et al., 1996; Yeni &
Fyhrie, 2002), this behaviour can be explained by the gradual alteration of trabecular bone
stiffness caused by damage accumulation. This may lead to the initiation of microcracks
resulting in catastrophic failure of the bones. Consistent with the previous analysis,
trabecular bone seems to deform by cyclic creep also, but in this case the residual strain
accumulated continuously during the entire test.
The aim of the long multi-step tests was to observe the long term behaviour of the samples
at stress amplitudes below and equal to σcy. In these cases the samples were not tested until
failure, and the attention was placed on the cyclic deformation behaviour of bones and
foams during the long periods under selected stress amplitudes.
The analyses revealed that cyclic creep plays again an important role in the deformation
behaviour of the samples at each step for both foam and bone. The cyclic creep rate
increased when σmin approached σcy. Comparing the results of the short and long multi-step
test of foams and bones, it seems that the compressive mean strains at yield are similar for
both foams and bone, and they are again close to the monotonic yield strain, at least for the
foams. In terms of σcy and σfail, the values are similar between 30ppi CuSn12Ni2 foam and the
bone. Although both foams and bone fail by cyclic creep, the deformation behaviour in the
transient region of each step was different for both materials. Fig. 5.10a shows that εmax of

146
foams decreased abruptly during the transient region of the each step. This behaviour may
be explained by rapidly developing microdamage (possibly collapse) in the cell struts that
occurred during the initial stage of each step. Bones show a gradual decrease of εmax (Fig.
5.10b). The behaviour during the transient regions in the bone suggests that the effect of
microdamage in the trabeculae during the step changing plays a less significant role in the
overall deformation compared to the foams. The damage in bones was found to be
accumulated continously during the fatigue test until failure.
The failure analysis may explain the behaviour of AlSi7Mg foams during the multi-step tests.
These samples showed the largest increment in compressive mean strain during the
transition phase of each step. This may be considered as evidence of a combination of brittle
and buckling failure behaviour of AlSi7Mg foams, as opposed to pure buckling failure in 30ppi
CuSn12Ni2 foam where ductile behaviour seems to prevail. The characteristic failure mode
observed in the bone may be explained by the its complex nature, where characteristics such
as viscoelasticity, irregular cell architecture and a hierarchical structure of the trabeculae are
present, which may lead to a more complex deformation mechanism compared to those in
the foams.
5.5. Foam-cement interface under mixed-mode loading
conditions: a preliminary study
5.5.1. Experimental procedures
The AlSi7Mg (30ppi and 45ppi) and CuSn12Ni2 (30ppi) foam materials were used to
interdigitate with acrylic bone cement (Simplex P, Stryker, UK) to create foam-cement
interface samples. The rectangular foam coupons were machined to size

147
(16mm×10mm×5mm) using a low speed diamond saw with constant mineral oil irrigation to
avoid abnormal high temperatures with consequent local melting of the foams (Fig. 5.12).
Figure 5. 12: The foam-cement interface samples used in this study.
The same mixed-mode experimental setup described in Paragraph 4.3 was used. A total of 30
samples were tested at 5 selected loading angles (0, 22.5, 45, 67.5 and 90); 2 tests were
carried out at each loading angle for each foam material.
SEM analysis and stereoscopic microscopy of the fractured surface were carried out to assess
both failure type and morphology.
The results were then compared with some of those obtained for bone-cement interface
under the same loading conditions, to evaluate the potential suitability of the three foams as
cancellous bone substitutes for cemented biomechanical testing.

148
5.5.2. Results and discussion
Fig. 5.13 shows an overview of the stress-displacement behaviour of the three foams and
bone-cement interface for the five different loading conditions. The initial quasi-elastic
section was followed by bending of the individual cells and struts. Consequently, a general
reduction of the slope is observed until the ultimate stress was reached. The post-yield
softening behaviour is characterised by discontinuities as a result of the progressive buckling
and fracture of the struts at the interface. This behaviour seems more evident under tensile
(0) and mixed-mode until 67.5, and differs from that observed in bone-cement samples,
where the cement pedicles were pulled-out of the bone matrix gradually until a critical stage
was reached when fast fracture occurred. The mixed-mode tests between 0° and 67.5° seem
to suggest that foam material dictates the mechanical response of the foam-cement
interface, with CuSn12Ni2 foams exhibiting the highest strength. Some variations in the
measured ultimate strength were observed, especially for AlSi7Mg. This can be explained by
the variation of cell and strut dimensions as well as slight differences in the dimension of the
samples. Ultimate stresses for both foams and bone tested at the first 3 loading angles (0,
22.5 and 45) did not change significantly. Although the variation in ultimate stresses was
small, the energy absorbed seemed to be reduced by the increment of the shear component,
resulting in a less prolonged softening. At 67.5°, where shear is the main component, an
important increase in the properties was observed for CuSn12Ni2 and bone, whilst only
moderate for the two AlSi7Mg. Fig. 5.13e shows the behaviour of the samples tested at 90°.
The load applied in this case was pure shear and the highest values of strength were
obtained for all samples.

149
Figure 5. 13: The stress-displacement responses of the three foam-cement and bone-cement composites tested under mixed-mode loading conditions at angles of (a) 0°, (b)
22.5°, (c) 45°, (d) 67.5° and (e) 90°.

150
Although the measured strengths differed, there was no clear difference in the behaviour of
the three types of foam-cement interface. Moreover the mechanical response of the 30ppi
AlSi7Mg was found to be higher than that of 30ppi CuSn12Ni2 for shear loading condition,
suggesting that shear may have obscured any difference due to foam material properties.
Linear regression analysis (Fig. 5.14) revealed a positive ascending slope with a general
increment of the stresses towards the 90° load angle, with a similar trend reported for the
bone-cement interface (Wang et al., 2010). A moderate correlation for cancellous bone and
the three foam materials was found with r2 values falling in the range between 0.52 and 0.72.
Due to the small number of samples tested for each loading condition, no statistical analysis
was performed.
Figure 5. 14: The apparent interfacial strength as a function of the loading angle.
0
2
4
6
8
10
12
14
0 20 40 60 80 100
Ult
imat
e St
ren
gth
(M
Pa)
Loading Angle (°)
Bone
45ppi Al
30ppi Cu
30ppi Al

151
The failure types (as defined in Chapter 4) of each failed sample were analysed with optical
stereoscopy and SEM. Two types of failure mode were identified in the current study,
independent of the foam materials. Type III failure was found for the mixed-mode tests at 0°,
22.5°, 45° and 67.5° and type I for the 90° case. In these cases the main failure occurred
completely in the foam material without any apparent damage at the interface and the
distance of the broken cell struts from the interface layer can vary, although does not appear
to be related to the loading angle. Fig. 5.15 shows a 30ppi AlSi7Mg foam-cement sample
after testing at 0°.
Figure 5. 15: (a) Optical and (b) SEM image of a failed foam-cement interface tested at 0°.
The foam-cement samples tested at a loading angle of 90° (shear) showed different failure
(type I) compared to that of the samples under other loading angles. Fig. 5.16 shows that the
shear load was concentrated on one side of the interface, resulting in a “cut-like” failure
adjacent to the loading point, while failure by bending and rupture of the cell struts occurred
in the far side. Despite a small number of sample were tested, these observations seem to
indicate once again the important role of the loading condition, in particular shear (90°), in
the overall behaviour of the foam-cement composites.

152
Figure 5. 16: Optical (a) and SEM (b) of a failed foam-cement interface sample tested at 90°.
5.6. Conclusions
In summary µCT characterisation and compressive mechanical testing of three open-cell
metallic foams and bovine trabecular bone seem to suggest that, despite the apparent
differences in their respective microstructures and mechanical properties, the deformation
behaviour is similar across the bone and the foams.
The multi-step tests were useful in assessing the cyclic deformation behaviour of metallic
foams and bones, reducing the number of samples needed for a cyclic analysis of the
materials. The results showed that the increase of residual strain, or accumulated plastic
deformation, was the principal deformation mechanism. This effect is observed when σcy was
exceeded; thereafter cyclic creep rate accelerated until catastrophic failure occurred. Cyclic
creep plays an important role in cyclic deformation of trabecular bone also, and the residual
strain increased continuously during the entire test. Optical microscopy and SEM revealed
that the foams failed principally due to buckling caused by the accumulation of residual

153
strains during the test; whilst bones failed mainly by a combination of buckling and brittle
fracture.
Bone-cement interface mechanical responses fell within the foam-cement experimental
results for the selected mixed-mode loading conditions. The apparent strength as a function
of the loading angle showed a similar trend with a moderate correlation for all the samples
tested. The preliminary results seem to confirm the importance of loading condition in
dictating interfacial responses under predominantly shear loads.
The results reported in this chapter might be of interest in the exploitation of foams as
substitutes of trabecular bones for further biomechanical studies.

154
Chapter 6
Discussion, conclusions and
future work

155
6.1. Discussion
The main aim of this work was to provide a better understanding on how the bone-cement
interfacial behaviour in THR, with particular regards to the acetabular side of the implant, is
affected by environmental (i.e. wet conditions, temperature), structural (i.e. depth of cement
penetration, contact area, BV/TV) and operational (i.e. loading condition) variables.
The analyses were conducted at different levels of studies and using different investigation
techniques (i.e. hip simulator, μCT, IGFA, SEM), from a macro level (acetabular reconstructs
in wet environment) to a micro-level (bone/foam-cement interface coupons under selected
loading conditions). Prior to employing specific open-cell metallic foams for a biomechanical
characterisation of the interface, their suitability as cancellous bone substitutes was also
explored.
At Portsmouth, a unique hip simulator for fixation endurance testing of cemented acetabular
reconstructs was developed, where realistic physiological loading waveforms (Bergmann et
al., 2001) were realised (Zant et al., 2008). More recently, a combined load profile
representative of patient routine activities was also used to study further the long-term
structural integrity of acetabular fixation (Wang et al., 2009). All previous studies (Tong et al.,
2008; Zant et al., 2008; Wang et al., 2009) showed that bone–cement interfacial debonding
was observed to start from superior-posterior quadrant, and the damage development
became more extensive with the increase of the body weight. Furthermore, the debonding
appeared to start from the dome region of the acetabulum (zone II), developing towards
zones I & III. However, all the previous investigations have been conducted in dry conditions,
where the effect of environment on the fixation integrity was not considered. In this work

156
(Chapter 3) bovine acetabular reconstructs were tested in a controlled wet environment at
37°C, through a new experimental protocol for the first time. The preliminary results have
provided a more balanced failure scenario for damage initiation and evolution of the
reconstructs in both dry and wet conditions. In this sense, although interfacial debonding at
the bone-cement interface was identified as the failure mechanism in wet consistently with
dry experiments, reduced survival lives were observed for the wet case (i.e. about 100,000
compared to 200,000 cycles vs 3-4 million cycles in dry), where debonding seemed to start
from the rim of the acetabulum (zones I) developing towards zone II, a phenomenon
consistent with clinical observation (Garcia-Cimbrelo & Munuera, 1992).
To better understand the failure mechanisms and mechanics of the bone-cement interface, a
more detailed analysis was needed. The scale of investigation was reduced (Fig. 6.1) from the
whole hemi-pelvic acetabular reconstruct (macro), to small bone-cement interface coupons
(micro) tested under selected loading conditions (tensile, compression, mixed-mode, shear),
using different experimental techniques, from servo-hydraulic testing machines to μCT
imaging and image-guided failure assessment (IGFA).
Figure 6. 1: Bone-cement interface transition from macro to micro level.

157
These typical loading conditions were observed in a typical cemented acetabular
replacement, as shown in Fig. 6.2 (Tong et al., 2008).
Figure 6. 2: (a) Local stress distributions at the bone-cement interface at peak hip contact force during normal walking; (b) the plane strain pelvic bone (P) and 3D pelvic bone (3P)
models (Tong et al., 2008).

158
In order to have a direct term of comparison, the interface coupons were prepared and the
results mainly compared with the work of Mann and his associates (Mann et al., 1997, 1999,
2001, 2008, 2009; Miller et al., 2012; Kim et al., 2004). In Chapter 4 an attempt was made to
answer two very important research questions: (1) Is the bone-cement interfacial strength
correlated to measurable parameters such as cement penetration into the cancellous bone
(r2=0.025-0.7 (Krause et al., 1982; Mann et al., 1997, 1999, 2001)) or loading direction
(r2≈0.6; p>0.05 for tensile, mixed-mode and shear (Mann et al., 2001))? (2) What is the main
damage mechanism at the interface under uniaxial compression, which is very important in
acetabular implants? All the results obtained in the present study seem to suggest that,
despite the difference in the loading conditions and the preparation methods, there was
virtually no correlation between the interfacial strength and cement penetration (r2=0.16-
18). However, the interfacial strength was found to correlate quite well with the loading
angle (r2=0.77), despite the overall effect of the loading angle on the failure response was not
significant (ANOVA, p=0.07). With regards to the second question, the damage evolution at
the bone-cement interface under uniaxial compression showed that trabecular bone
sustained most of the load, which was transferred as a result of progressive failure of
trabeculae in the proximity of the interfacial contact region, although there are some
significant scatter in the results (SD=±1.10MPa). There may be several reasons for all these,
but the most important of all might be the general mechanical and morphological anisotropic
behaviour of the cancellous bone used to interdigitate with the bone cement.
The work reported in Chapter 5 aims to overcome the problem related to the trabecular
bone anisotropy by using three open-cell metallic foams as cancellous bone analogous
models for cemented biomechanical studies. Furthermore, materials with known consistent

159
and controllable mechanical properties within the range of properties of cancellous bone
may provide valuable alternatives to cadaver bones as test substrates especially in terms of
availability (Szivek et al., 1995). Three different foams (30ppi, 45ppi AlSi7Mg and 30ppi
CuSn12Ni2) were characterised in the current study under uniaxial and fatigue compression.
The results showed that, despite the CuSn12Ni2 foam exhibited better static mechanical
properties and the AlSi7Mg (45ppi) a closer morphology compared to cancellous bone, the
cyclic behaviour was similar across the materials with accumulated plastic deformation
(cyclic creep) as the principal failure mechanism. Finally, all the three metallic foams were
used to interdigitate with bone cement to create foam-cement interface samples that were
tested under mixed-mode loading conditions. Although only preliminary, the results obtained
seem to confirm the role of the loading angle, in particular shear condition (90°), in dictating
the failure mechanism at the interface. However, further systematic studies are needed to
obtain a more comprehensive understanding of the bone-cement mechanics.
6.2. Conclusions
Failure at the bone-cement interface has been identified as the predominant failure mode in
cemented arthroplasty, where the lasting integrity of the bond between the bone and the
cement decisively defines the long-term stability of the implant. Although observations seem
to suggest that debonding of the bone-cement interface is mainly responsible for the fixation
failure, the contribution and the relative importance of mechanical and biological events on
the implant failure is still a matter for discussion. The micromechanical behaviour of the
interface is complex due to the substantial heterogeneity, anisotropy, variation of the
morphology of the cancellous bone and the loading conditions. As a result, the bone-cement

160
interfacial properties are difficult to determine by means of conventional experimental
techniques; whilst the introduction of bone analogous materials, with controllable
microstructures and adjustable densities, may help to obtain a better understanding of the
bone-cement mechanics providing more consistent results.
In this work, an investigation of the bone-cement interfacial properties has been carried out
using a range of experimental techniques, from structural endurance testing to image-guided
failure assessment (IGFA) using µCT. The following main conclusions may be drawn:
Based on the fixation endurance testing of cemented acetabular reconstructs using the hip
simulator in wet condition under a combined loading block in a saline environment:
Preliminary results seem to indicate that the saline solution, when combined with
physiological loading conditions, plays an important role in reducing the survival lives
of the reconstructs.
Although debonding at the bone-cement interface has been found as the main failure
mechanism in both wet and dry conditions, damage in wet condition seems to appear
after only 200,000 cycles as opposed to 3-4 million cycles under the same combined
loading block in dry conditions (Wang et al., 2009).
The debonding process seems to start and develop from DeLee & Charnley zone I, as
opposed to zone II in dry conditions, where the combined action of mechanical
loading and fluid environment is most effective and more consistent with clinical
observations.
Based on the bone-cement interfacial behaviour under mixed-mode loading conditions and
step-wise micromechanical compression:

161
Bone-cement interfacial strength and cement penetration were not correlated
(r2=0.16). The effect of the loading angle seems to be more consistent in dictating the
failure mechanism of the interface under mixed-mode loading conditions (r2=0.77),
although its overall effect on the failure response is still unclear (ANOVA, p=0.07). The
findings were confirmed by both mechanical testing and post failure characterisation.
The experimental results from time-lapsed µCT imaging and in situ step-wise
compression showed that load transfer in bone-cement interface occurred mainly in
the bone-cement contact region. The damage resulted in progressively developed
microfailures due to trabeculae bending and buckling.
Although contact area and cement penetration depth are closely related (r2=0.94),
neither correlates with the measured compressive interfacial strength. A moderate
correlation was found between the BV/TV and the ultimate strength of the interface
(r2=0.71).
Based on the mechanical and morphometrical characterisation of open-cell metallic foams
under uniaxial compression and multi-step fatigue; including preliminary foam-cement
interface investigation under mixed-mode loading conditions:
µCT characterization and compressive mechanical testing of AlSi7Mg and CuSn12Ni2
open-cell foams and bovine trabecular bone seem to suggest that, despite the
apparent differences in their respective microstructures and mechanical properties,
the general deformation behaviour is similar across the bone and the foams.
The multi-step fatigue results showed that the increase of residual strain, or
accumulated plastic deformation, is the principal deformation mechanism. Cyclic
creep plays an important role in cyclic deformation of foams and trabecular bone, and

162
the residual strain was found to increase during the test. However, the deformation
behaviour at the transient region of each step is different for foams and bone.
Optical microscopy and SEM revealed that the foams failed principally due to buckling
caused by the accumulation of residual strains during the test; whilst bones failed
mainly by a combination of buckling, splitting and brittle fracture.
Bone-cement interface mechanical responses seem to compare well with those of
foam-cement interface for a given mixed-mode loading condition. The apparent
strength correlates with the loading angle (r2=0.52-0.72) for all the samples tested.
The preliminary results seem to confirm that loading condition is more important
than material properties in dictating the interfacial responses under predominantly
shear loading conditions.
6.3. Future work
6.3.1. Fixation endurance testing of acetabular reconstructs
Admittedly, the main findings presented in this work represent a preliminary study on the
effect of wet environment on the fixation of cemented acetabular reconstructs, with only
two samples tested. More samples need to be tested under the same physiological loading
and environmental conditions, to verify the current results and to provide statistical
information. Furthermore, samples prepared with other orthopaedic procedures (i.e.
reaming & drilling of the acetabulum to enhance cement penetration in bone and implant
stability) could be tested using new combined loading blocks with more physiological routine
activities (i.e. introduction of stumbling which can produce a joint reaction force of 870%BW

163
according to Bergmann et al. (2001)). These may provide valuable information for clinical
applications.
6.3.2. Bone-cement interface micromechanics
In recent years the development of new experimental imaging techniques has provided
important tools for the micromechanical investigation of different cellular materials. In the
current study µCT, along with IGFA, was used for the examination of bone-cement interfacial
behaviour under step-wise compression. A micromechanical analysis of the interface under
cyclic and mixed-mode loading conditions may be carried out to fully develop IGFA in more
practical applications. Furthermore, damage progression was only visually assessed so far
without any quantitative information on the relative micromotion and strain levels at the
interface. In this sense techniques such as digital volume correlation (DVC) may be used in
the determination of displacement and strain fields throughout the whole volume of the
interface, overcoming the limitations of two-dimensional surface investigation.
6.3.3. Bone analogous materials characterisation
The same characterisation procedures used in the present study for open-cell foams may be
used for preclinical assessment of commercially available scaffolds for tissue engineering
applications. Detailed mechanical and morphological investigations, using trabecular bone as
a control group, may provide valuable information to the manufacturers for the development
of the next generation of scaffolds.

164
Chapter 7
References

165
7. References
Abu-Amer, Y., Darwech, I., Clohisy, J.C., 2007. Aseptic loosening of total joint replacements:
mechanisms underlying osteolysis and potential therapies. Arthritis Res. Ther. 9, Suppl 1:S6.
Aerssens, J., Boonen, S., Joly, J., Dequeker, J., 1997. Variations in trabecular bone
composition with anatomical site and age: potential implications for bone quality
assessment. J. Endocrinol. 155, 411-21.
Afoke, N.Y., Byers, P.D., Hutton, W.C., 1984. The incongruous hip joint: a loading study. Ann.
Rheum. Dis. 43, 295-301.
Aiello, M.R., 2011. Avascular Necrosis of the Femoral Head. Available at
http://emedicine.medscape.com/article/386808-overview#a01.
Anderson, M.J., Keyak, J.H., Skinner, H.B., 1992. Compressive mechanical properties of
human cancellous bone after gamma irradiation. J Bone Joint Surg. Am. 74, 747-752.
Andrews, E., Sanders, W., Gibson, L.J., 1999. Compressive and tensile behaviour of aluminum
foams. Mat. Sci. Eng. A - Struct. 270 (2), 113-124.
Antsiferov, V.N., Makarov, A.M., Khramtsov, V.D., 2005. High-porosity and alloys in catalytic
processes of gas cleaning. Adv. Eng. Mater. 7, 77-89.Ashby, M.F., 1998. Mechanical
properties of cellular solids. Metall. Trans. A, 14, 1755-1769.
Ashman, R.B., Rho, J.-Y., 1988. Elastic modulus of trabecular bone material. J. Biomech. 21(3),
177-81.

166
Askew, M.J., Steege, J.W., Lewis, J.L., Ranieri, J.R., Wixson, R.L., 1984. Effect of cement
pressure and bone strength on polymethylmethacrylate fixation. J. Orthop. Clin.Res. 1(4),
412–420.
Aspenberg, P., Van der Vis, H., 1998. Fluid pressure may cause periprosthetic osteolysis.
Particles are not the only thing. Acta Orthop. Scand. 69, 1-4.
ASTM, E1441 Standard Guide for Computed Tomography (CT) Imaging, in E1441, ASTM,
Editor. 2000, ASTM International.
Baidya, K.P., Ramakrishna, S., Rahman, M., Ritchie, A., 2001. Quantitative radiographic
analysis of fiber reinforced polymer composites. J. Biomater. Appl. 15(3), 279-89.
Baleani, M., Cristofolini, L., Toni, A., 2001. Temperature and ageing condition effects on the
characterization of acrylic bone cement. Proc. Inst. Mech. Eng. H. 215(1), 113-8.
Banhart, J., Baumeister J., 1998. Deformation characteristics of metal foams. J Mater Sci. 33,
1431-1440.
Barrett, J., Keat, N., 2004. Artifacts in CT: Recognition and Avoidance. Radiographics 24,
1679-91.
Bayraktar, H.H., Morgan, E.F., Niebur, G.L., Morris, G.E., Wong, E.K., Keaveny, T.M., 2004.
Comparison of the elastic and yield properties of human femoral trabecular and cortical bone
tissue. J. Biomech. 37, 27-35.
Bean, D.J., Hollis, J.M., Woo, S.L., Convery, F.R., 1988. Sustained pressurization of
polymethylmethacrylate: a comparison of low- and moderate-viscosity bone cements. J.
Orthop. Res. 6, 580-584.

167
Bergmann, G., Deuretzabacher, G., Heller, M., Graichen, F., Rohlmann, A., Strauss, J., Duda,
G., 2001. Hip forces and gait patterns from routine activities. Journal of Biomechanics 34 (7),
859-72.
Bowman, S.M., Guo, X.E., Cheng, D.W., Keaveny, T.M., Gibson, L.J., Hayes, W.C., McMahon,
T.A., 1998. Creep contributes to the fatigue behavior of bovine trabecular bone. J. Biomech.
120(5), 647-54.
Bugbee, W.D., Barrera, D.L., Lee, A.C., Convery, F.R., 1992. Variations in shear strenght of the
bone-cement interface in the proximal femur. Trans. Orthop. Res. 17, 22.
Busse, B., Hahn, M., Soltau, M., Zustin, J., Puschel, K., Duda, G.N., Amling, M., 2009. Increased
calcium content and inhomogeneity of mineralization render bone toughness in
osteoporosis: Mineralization, morphology and biomechanics of human single trabeculae.
Bone 45, 1034-43.
Capozzo, A., Della Croce, U., Leardini, A., Chiari, L., 2005. Human movement analysis using
stereophotogrammetry. Part 1: theoretical background. Gait and Posture 21, 186-96.
Carter, D.R., Hayes, W.C., 1977. The compressive behavior of bone as a two-phase porous
structure. J Bone Joint Surg. Am. 59, 954-962.
Cendre, E., Mitton, D., Roux, J.P., Arlot, M.E., Duboeuf, F., Burt-Pichat, B., Rumelhart, C., Peix,
G., Meunier, P.J., 1999. High-resolution computed tomography for architectural
characterization of human lumbar cancellous bone: relationships with histomorphometry
and biomechanics. Osteoporosis Int. 10, 353-60.

168
Charnley, J., 1960. Anchorage of the femoral head prosthesis to the shaft of the femur. J.
Bone Joint Surg Br. 42-B, 28-30.
Charnley, J., 1964. The bonding of prostheses to bone by cement. J. Bone Joint Surg. Br. 46,
518-29.
Charnley, J., 1979. Low friction arthroplastv of the hip: theory and practice. Springer-Verlag,
New York, USA.
Ciarelli, T.E., Fyhrie, D.P., Schaffler, M.B., Goldstein, S.A., 2000. Variations in three-
dimensional cancellous bone architecture of the proximal femur in female hip fractures and
in controls. J. Bone Miner. Res. 15, 32–40.
Clech, J.P., Keer, L.M., Lewis, J.L., 1985. A model of tension and compression cracks with
cohesive zone at a bone-cement interface. J. Biomech. Eng. 107, 175-182.
Cowin, S., 2001. Bone Mechanics Handbook. Second edition, CRC Press, Boca Raton, USA.
Currey, J.D., 1998. Mechanical properties of vertebrate hard tissues. Proc. Inst. Mech. Eng.
212, 399-411.
Dalstra, M., Huiskes, R., 1995. Load transfer across the pelvic bone. J. Biomech. 28, 715-24.
Daniel, M., IgliC, A., Kralj-IgliC, V., 2005. The shape of acetabular cartilage optimizes the
contact stress distribution. Journal of Anatomy 207, 85-91.

169
David, V., Laroche, N., Boudignon, B., Lafage-Proust, M.H., Alexandre, C., Ruegsegger, P.,
Vico, L., 2003. Noninvasive in vivo monitoring of bone architecture alterations in hindlimb-
unloaded female rats using novel three-dimensional microcomputed tomography. J. Bone
Miner. Res. 18, 1622- 31.
DeLee, J.G., Charnley, J., 1976. Radiological demarcation of cemented sockets in total hip
replacement. Clinical Orthopaedics 121, 20-32.
Dendorfer, S., 2008. Cyclic deformation and fatigue behaviour in cancellous bone. University
of Paderborn, Germany, Ph.D. Thesis.
Dendorfer, S., Maier, H.J., Hammer, J., 2009. Fatigue damage in cancellous bone: An
experimental approach from continuum to micro scale. J. Mech. Behav. Biomed. Mat. 2(1),
113-9.
DIN 50134 2008. Testing of metallic materials - Compression test of metallic cellular
materials Deutsches Institut Fur Normung E.V., (German National Standard).
Ding, M., Odgaard, A., Hvid, I., 1999. Technical note. Accuracy of cancellous bone volume
fraction measured by micro-CT scanning. J. Biomech. 32, 323-326.
Ding, M., Odgaard, A., Linde, F., Hvid, I., 2002. Age-related variations in the microstructure of
human tibial cancellous bone. J. Orthop. Res. 20, 615-21.
Ding, H., Zhu, Z.A., Dai, K.R., 2009. Evaluation of damage to trabecular bone of the
osteoporotic human acetabulum at small strains using nonlinear micro-finite element
analyses. Chin. Med. J. (Engl) 122, 2041-7.

170
Dohmae, Y., Bechtold, J.E., Sherman, R.E., Puno, R.M., Gustilo, R.B., 1988. Reduction in
cement-bone interface shear strength between primary and revision arthroplasty. Clin.
Orthop. Rel. Res. 236, 214-220.
Dumbleton, J., Manley, M.T., 2004. Hydroxyapatite-Coated Prostheses in Total Hip and Knee
Arthroplasty. JBJS 86, 2526-40.
Echternach, J.L., 1990. Physical therapy of the hip. Churchill Livingstone Inc., UK.
Evans, A.G., Hutchinson, J.W., Ashby, M.F., 1998. Multifunctionality of cellular metal systems.
Prog. Mater. Sci. 43 (3), 171-221.
Fazzalari, N.L., Parkinson, I.H., 1998. Femoral trabecular bone of osteoarthritic and normal
subjects in an age and sex matched group. Osteoarthritis and cartilage 6, 377-82.
Feldkamp, L.A., Davis, L.C., Kress, J.W., 1984. Practical cone-beam algorithm. J. Optic. Soc.
Am. A 1, 612-9.
Feldkamp, L.A., Goldstein, S.A., Parfitt, A.M., Jesion, G., Kleerekoper, M., 1989. The direct
examination of three-dimensional bone architecture in vitro by computed tomography. J.
Bone Miner. Res. 4, 3-11.
Fischer, H., Wirtz, D.C., Weber, M., Neuss, M., Niethard, F.U., Marx, R., 2001. Improvement of
the long-term adhesive strength between metal stem and polymethylmethacrylate bone
cement by a silica/silane interlayer system. J. Biomed. Mater. Res. 57, 413-18.
Flivik, G., Sanfridsson, J., Onnerfalt, R., Kesteris, U., Ryd, L., 2005. Migration of the acetabular
component: Effect of cement pressurization and significance of early radio-lucency. A
randomized 5-year study using radiostereometry. Acta Orthopaedica. 76(2), 159-68.

171
Ford, C.M., Keaveny, T.M., 1996. The dependence of shear failure properties of trabecular
bone on apparent density and trabecular orientation. J. Biomech. 29, 1309-17.
Fornasier, V.L., Cameron, H.U., 1976. The femoral stem/cement interface in total hip
replacement. Clin. Orthop. Rel. Res. 116, 248-52.
Fyhrie, D.P., Schaffler, M.B., 1994. Failure mechanisms in human vertebral cancellous bone.
Bone 15, 105-9.
Ganguly, P., Moore, T.L.A., Gibson, L.J., 2004. A phenomenological model for predicting
fatigue life in bovine trabecular bone. J. Biomech. Eng. Trans. ASME 126(3), 330-9.
Garcia-Cimbrelo, E., Munuera, L., 1992. Early and late loosening of the acetabular cup after
low-friction arthroplasty. J. Bone Joint Surg. 74A, 1119-29.
Garrison, J.G., Slaboch, C.L., Niebur, G.L., 2009. Density and architecture have greater effects
on the toughness of trabecular bone than damage. Bone 44, 924-9.
Gibson, L.J., Ashby, M.F., 1997. Cellular Solids: Structure and Properties. Cambridge
University Press, Cambridge, UK.
Gibson, L.J., 2005. Biomechanics of cellular solids. J Biomech. 38(3), 377-399.
Girlich, D., Franzke, U., 2001. Open pore metal foams for heat exchange in ventilation and
refrigeration. Adv. Eng. Mat. 3 (6), 351-352.
Goldstein, S.A., 1987. The mechanical properties of trabecular bone: dependence on
anatomic location and function. J. Biomech. 20, 1055–61.

172
Graham, J., Ries, M., Pruitt, L., 2003. Effect of bone porosity on the mechanical integrity of
the bone-cement interface. J. Bone and Joint Surg. 85(10), 1901-8.
Greenwald, A.S., O’Connor, J.J., 1971. The transmission of load through the human hip joint.
J. Biomech. 4, 507-28.
Guedes, R.M., Simoes, J.A., Morais, J.L., 2006. Viscoelastic behaviour and failure of bovine
cancellous bone under constant strain rate. J. Biomech. 39, 49-60.
Guillen, T., Zhang, Q.-H., Tozzi, G., Ohrndorf, A., Christ, H.-J., Tong, J., 2011. Compressive
behaviour of bovine cancellous bone and bone analogous materials, microCT
characterization and FE prediction. J. Mech. Behav. Biomed. Mater. 4, 1452-61.
Guillen, T., Ohrndorf, A., Tozzi, G., Tong, J., Christ, H.-J., 2011b. Compressive fatigue
behaviour of bovine cancellous bone and bone analogous materials under multi-step loading
conditions. Adv. Eng. Mat., doi: 10.1002/adem.201180060.
Guillen, T., Tozzi, G., Ohrndorf, A., Tong, J., Christ, H.-J., 2011c. Substituting cancellous bone
with open-cell metal foam in biomechanical testing of cemented hip joints. 7th International
Conference on Porous Metals and Metallic Foams (MetFoam), Busan, Korea.
Guglielmi, G., Muscarella, S., Bazzocchi, A., 2011. Integrated imaging approach to
osteoporosis: state-of-the-art review and update. Radiographics 31, 1343-64.
Haddock, S.M., Yeh, O.C., Mummaneni, P.V., Rosenberg, W.S., Keaveny, T.M., 2004. Similarity
in the fatigue behavior of trabecular bone across site and species. J. Biomech. 37, 181-7.
Hansen, A.H., Childress, D.S., Meier, M.R., 2002. A simple method for determination of gait
events. J. Biomech. 35, 135-138.

173
Hara, T., Tanck, E., Homminga, J., Huiskes, R., 2002. The influence of microcomputed
tomography threshold variations on the assessment of structural and mechanical trabecular
bone properties. Bone 31, 107-9.
Harrigan, T.P., Jasty, M., Mann, R.W., Harris, W.H., 1988. Limitations of the continuum
assumption in cancellous bone. J. Biomech. 21, 269-75.
Harte, A.-M., Fleck, N.A., Ashby, M.F., 1999. Fatigue failure of an open cell and a closed cell
aluminium alloy foam. Acta Metallurgica 47, 2511-24.
Hashimoto, M., Ohno, H., Sano, H., Kaga, M., Oguchi, H., 2003. Degradation patterns of
different adhesives and bonding procedures. J. Biomed. Mater. Res. Part B: Appl. Biomater.
66B, 324-30.
Hayes, W.C., Carter, D., 1976. Postyield behaviour of subchondral trabecular bone. Journal of
Biomedical Materials Research Symposium 7, 537-44.
Heaton-Adegbile, P., 2005. In-Vitro Assessment of Load Transfer and Strain Distribution
Across the Cement-bone and Bone-Implant Interfaces in Artificially Replaced Acetabulum.
University of Portsmouth, UK, Ph.D. Thesis.
Heaton-Adegbile, P., Zant, N.P., Tong, J., 2006. In vitro fatigue behaviour of a cemented
acetabular reconstruction. J. Biomech. 39, 2882-2886.
Helgason, B., Perilli, E., Schileo, E., Taddei, F., Brynjolfsson, S., Viceconti, M., 2008.
Mathematical relationships between bone density and mechanical properties: a literature
review. Clin. Biomech. (Bristol, Avon). 23, 135-146.

174
Heller, M.O., Bergmann, G., Deuretzbacher, G., Durselen, L., Pohl, M., Claes, L., Haas, N.P.,
Duda, G.N., 2001. Musculo-skeletal loading conditions at the hip during walking and stair
climbing. J. Biomech. 34, 883-93.
Hildebrand, T., Ruegsegger, P., 1997. A new method for the model-independent assessment
of thickness in three-dimensional images. J. Microsc. 185, 67-75.
Hildebrand, T., Laib, A., Muller, R., Dequeker, J., Ruegsegger, P., 1999. Direct three-
dimensional morphometric analysis of human cancellous bone: microstructural data from
spine, femur, iliac crest, and calcaneus. J. Bone Miner. Res. 14, 1167-74.
Hing, K.A., 2004. Bone repair in the twenty-first century: biology, chemistry or engineering?.
Philos. Transact. A Math. Phys. Eng. Sci. 362, 2821-50.
Hodgskinson, R., Currey, J.D., 1992. Young modulus, density and material properties in
cancellous bone over a large density range. Journal of Materials Science: Materials in
Medicine, 3(5), 377-381.
Hoffler, C.E., Moore, K.E., Kozloff, K., Zysset, P.K., Brown, M.B., Goldstein, S.A., 2000.
Heterogeneity of bone lamellar-level elastic moduli. Bone 26, 603-9.
Homminga, J., McCreadie, B.R., Ciarelli, T.E., Weinans, H., Goldstein, S.A., Hiuskes, R., 2002.
Cancellous bone mechanical properties from normals and patients with hip fractures differ
on the structure level, not on the bone hard tissue level. Bone 30, 759-64.
Hou, F.J., Lang, S.M., Hoshaw, S.J., Reimann, D.A., Fyhrie, D.P., 1998. Human vertebral body
apparent and hard tissue stiffness. J. Biomech. 31, 1009–1015.

175
Huiskes, R., 1979. Some fundamental aspects of human joint replacement. Analyses of
stresses and heat conduction in bone-prosthesis structures. Acta Orthop. Scand. Suppl. 185,
1-208.
Huiskes, R., 1993. Failed innovation in total hip replacement: Diagnosis and proposals for a
cure. Acta Orthopaedica Scandinavia 64, 699-716.
Huiskes, R., 1993b. Mechanical failure in total hip arthroplasty with cement. Current Orth. 7,
239-247.
Janssen, D., Mann, K.A., Verdonschot, N., 2008. Micro-mechanical modeling of the cement-
bone interface: the effect of friction, morphology and material properties on the
micromechanical response. J. Biomech. 41, 3158-3163.
Jasty, M., Maloney, W.J., Bragdon, C.R., Haire, T., Harris, W.H., 1990. Histomorphological
Studies of the Long-Term Skeletal Responses to Well Fixed Cemented Femoral Components.
J. Bone Joint Surg. Am. 72A, 1220-9.
Jasty, M., Maloney, W.J., Bragdon, C. R., O'Connor, D.O., Haire, T., Harris, W.H., 1991. The
Initiation of failure in cemented femoral components of hip arthroplasties. J. Bone Joint Surg.
Br. 73, 551-8.
Johnson, A.E., Keller, T.S., 2007. Mechanical properties of open-cell foam synthetic thoracic
vertebrae. Journal of Materials Science: Materials in Medicine 19, 1317-23.
Juliusson, R., Flivik, G., Nilsson, J., Ryd, L., Onnerfalt, R., 1995. Circulating blood diminishes
cement penetration into cancellous bone. In vivo studies of 21 arthrotic femoral heads. Acta
Orthop. Scand. 66, 234-238.

176
Kaneko, T.S., Bell, J.S., Pejcic, M.R., Tehranzadeh, J., Keyak, J.H., 2004. Mechanical properties,
density and quantitative CT scan data of trabecular bone with and without metastases. J
Biomech. 37, 523-530.
Kaplan, S.J., Hayes, W.C., Stone, J.L., 1985. Tensile strength of bovine trabecular bone. J.
Biomech. 18, 723-7.
Keaveny, T.M., Hayes, W.C., 1993. A 20-year perspective on the mechanical properties of
trabecular bone. J. Biomech. Eng. 15, 534–42.
Keaveny, T.M., Borchers, R.E., Gibson, L.J., Hayes, W.C., 1993. Trabecular bone modulus and
strength can depend on specimen geometry. J. Biomech. 26, 991–1000.
Keaveny, T.M., Wachtel, E.F., Ford, C.M., Hayes, W.C., 1994. Differences between the tensile
and compressive strengths of bovine tibial trabecular bone depend on modulus. J. Biomech.
27, 1137–1146.
Keaveny, T.M., Pinilla, T.P., Crawford, R.P., Kopperdahl, D.L., Lou, A., 1997. Systematic and
random errors in compression testing of trabecular bone. J. Orthopaed. Res. 15 (1), 101-110.
Keaveny, T.M., Wachtel, E., Kopperdahl, D., 1999. Mechanical behaviour of human trabecular
bone after overloading. J. Orthop. Res. 17, 346-53.
Keaveny, T.M., Morgan, E.F., Niebur, G.L., Yeh, O.C., 2001. Biomechanics of trabecular bone.
Annu Rev Biomed Eng. 3, 307-333.
Ketcham, R., Carlson, W.D., 2001. Acquisition, optimization and interpretation of X-ray
computed tomographic imagery: applications to the geosciences. Computers & Geosciences
27, 381-400.

177
Kim, H.S., Al-Hassani, S.T.S, 2002. A morphological model of vertebral trabecular bone. J.
Biomech. 35, 1101-1114.
Kim, D.G., Miller, M.A., Mann, K.A., 2004. Creep dominates tensile fatigue damage of the
cement-bone interface. J. Orthop. Res. 22, 633-640.
Kim, C.H., Zhang, H., Mikhail, G., Stechow, D., Muller, R., Kim, H.S., Guo, X.E., 2007. Effects of
thresholding techniques on microCT-based finite element models of trabecular bone. J.
Biomech. Eng. 129, 481-6.
Kleissen, R.F.M., Buurke, J.H., Harlaar, J., Zilvold, G., 1998. Electromyography in the
biomechanical analysis of human movement and its clinical application. Gait and Posture 8,
143-58.
Kokubo, T., Takadama, H., 2006. How useful is SBF in predicting in vivo bone bioactivity?
Biomaterials 27, 2907-15.
Koole, L., Kruft, M., Colnot, J., Kuijer, R., Bulstra, S., 1999. Studies on a new, all-polymeric
radiopaque orthopaedic bone cement. Soc. Biomater., p 316.
Kopperdahl, D.L., Keaveny, T.M., 1998. Yield strain behavior of trabecular bone. J. Biomech.
31, 601–8.
Kopperdahl, D.L., Keaveny, T.M., 1999. Biomechanical consequences of an isolated overload
in the vertebral body. Bioengineering Conference, Big Sky, Montana.
Kowalczyk, P., 2003. Elastic properties of cancellous bone derived from finite element models
of parameterized microstructure cells. J. Biomech. 36, 961-972.

178
Krause, W.R., Krug, W., Miller, J., 1982. Strength of the cement-bone interface. Clin. Orthop.
Rel. Res. 163, 290-299.
Krupp, U., Ohrndorf, A., Guillen, T., Christ, H.J., Demiray, S., Becker, W., Hohe, J., 2006.
Isothermal and thermomechanical fatigue behavior of open-cell metal sponges. Adv. Eng.
Mat. 8 (9), 821-827.
Kuhn, J.L., Goldstein, S.A., Feldkamp, L.A., Goulet, R.W., Jesion, G., 1990. Evaluation of a
microcomputed tomography system to study trabecular bone structure. J. Orthop. Res. 8,
833-42.
Ladd, A.J., Kinney, J.H., Haupt, D.L., Goldstein, S.A., 1998. Finite element modeling of
trabecular bone: comparison with mechanical testing and determination of tissue modulus. J.
Orthop. Res. 16, 622–628.
Leung, S.Y., 2008. Modelling the mechanical behaviour of the interface between prosthesis
and bone. PhD Thesis, University of Southampton, UK.
Lewis, G., 1997. Properties of acrylic bone cement: State-of-the-art review. J. Biomed. Mater.
Res. 38, 155–182.
Lewis, G., 2003. Fatigue properties of acrylic bone cements: Review of the literature. J.
Biomed. Mater. Res. 66B, 457-86.
Li, B., Aspden, R.M., 1997. Composition and mechanical properties of cancellous bone from
the femoral head of patients with osteoporosis or osteoarthritis. J Bone Miner. Res. 12, 641-
651.

179
Lim, T.-H., Hong, J.H., 2000. Poroelastic properties of bovine vertebral trabecular bone. J.
Orthop. Res. 18, 671-7.
Linde, F., Hvid, I., 1989. The effect of constraint on the mechanical behaviour of trabecular
bone specimens. J. Biomech. 22, 485–90.
Linde, F., Norgaard, P., Hvid, I., Odgaard, A., Soballe, K., 1991. Mechanical properties of
trabecular bone. Dependency on strain rate. J. Biomech. 24, 803-9.
Linde, F., Hvid, I., Madsen, F., 1992. The effect of specimen geometry on the mechanical
behaviour of trabecular bone specimens. J Biomech. 25, 359-68.
Linde, F., Sorensen, H.C., 1993. The effect of different storage methods on the mechanical
properties of trabecular bone. J. Biomech. 26(10), 1249-52.
Linde, F., 1994. Elastic and viscoelastic properties of trabecular bone by a compression
testing approach. Dan. Med. Bull. 41, 119–38.
MacDonald, W., Swarts, E., Beaver, R., 1993. Penetration and shear strength of cement-bone
interfaces in vivo. Clin. Orthop. Rel. Res. 286, 283-8.
Maher, S.A., McCormack, B.A.O., 1999. Quantification of interdigitation at bone
cement/cancellous bone interfaces in cemented femoral reconstructions. Proc. Instn. Mech.
Engrs. 213, 347-54.
Majkowski, R.S., Miles, A.W., Bannister, G.C., Perkins, J., Taylor, G.J., 1993. Bone surface
preparation in cemented joint replacement. J. Bone Joint Surg. Br. 75, 459-63.

180
Majkowski, R.S., Bannister, G.C., Miles, W., 1994. The effect of bleeding on the cement-bone
interface. Clin. Orthop. Relat. Res. 299, 293-7.
Majumdar, S., Kothari, M., Augat, P., Newitt, D.C., Link, T.M., Lin, J.C., Lang, T., Lu, Y., Genant,
H.K., 1998. High-resolution magnetic resonance imaging: Three dimensional trabecular bone
architecture and biomechanical properties. Bone 22, 445-54.
Maloney, W.J., Murali, J., Burke, D.W., O’Connor, D.O., Zalenski, E.B., Braydon, C., Haris,
W.H., 1989. Biomechanical and histologic investigation of cemented total hip arthroplasties.
Clin. Orthop. Rel. Res., 249,129-40.
Mann, K.A., Ayers, D.C., Werner, F.W., Nicoletta, R.J., Fortino, M.D., 1997. Tensile strength of
the cement-bone interface depends on the amount of bone interdigitated with PMMA
cement. J. Biomech. 30, 339-46.
Mann, K.A., Werner, F.W., Ayers, D.C., 1999. Mechanical strength of the cement-bone
interface is greater in shear than in tension. J. Biomech. 32, 1251-1254.
Mann, K.A., Mocarski, R., Damron, L.A., Allen, M.J., Ayers, D.C., 2001. Mixed-mode failure
response of the cement-bone interface. J. Orthop. Res. 19, 1153-61.
Mann, K.A., Miller, M.A., Clearly, R., Janssen, D., Verdonschot, N., 2008. Experimental
micromechanics of the cement-bone interface. J. Orthop. Res. 26(6), 872-9.
Mann, K.A., Miller, M.A., Race, A., Verdonschot, N., 2009. Shear fatigue micromechanics of
the cement-bone interface: an in vitro study using digital image correlation techniques. J.
Orthop. Res. 27(3), 340-6.

181
Martin, R.B., Burr, D.B., Sharkey, N.A., 1998. Skeletal tissue mechanics. Springer Verlag, New
York, USA.
McCormack, B.A.O., Prendergast, P.J., 1996. An experimental study of damage accumulation
in cemented hip prostheses. Clin. Biomech. 11, 214-9.
McCormack, B.A.O., Prendergast, P.J., 1999. Microdamage accumulation in the cement layer
of hip replacements under flexural loading. Clin. Biomech. 32, 467-75.
Menschik, F., 1997. The hip joint as a conchoids shape. J. Biomech. 30, 971-3.
Michel, M.C., Guo, X.E., Gibson, L.J., McMahon, T., Hayes, W.C., 1993. Compressive fatigue
behavior of bovine trabecular bone. J. Biomech. 26, 453-63.
Miller, C.A., Verstraete, M.C., 1996. Determination of the step duration of gait initiation using
a mechanical energy analysis. J. Biomech. 29, 1195-9.
Miller, M.A., Race, A., Gupta, S., Higham, P., Clarke, M.T., Mann, K.A., 2007. The role of
cement viscocity on cement-bone apposition and strength. J. Arthroplasty 22, 109-16.
Miller, M.A., Eberhardt, A.W., Clearly, R., Verdonschot, N., Mann, K.A., 2009. Micromechanics
of postmortem-retrieved cement-bone interfaces. J. Orthop. Res. 28(2), 170-7.
Miller, M.A., Race, A., Waanders, D., Clearly, R., Janssen, D., Verdonschot, N., Mann, K.A.,
2011. Multi-axial loading micromechanics of the cement-bone interface in post-mortem
retrievals and lab-prepared specimens. J. Mech. Behav. Biomed. Mater. 4, 366-74.
Moore, T.L.A., Gibson, L.J., 2001. Modeling modulus reduction in bovine trabecular bone
damaged in compression. J. Biomech. Eng. Trans. ASME 123(6), 613-22.

182
Moore, T.L.A., Gibson, L.J., 2003. Fatigue of bovine trabecular bone. J. Biomech. Eng. Trans
ASME 125, 761-8.
Moore, T.L.A., Gibson, L.J., 2003b. Fatigue microdamage in bovine trabecular bone. J.
Biomech. Eng. Trans. ASME 125(6), 769-76.
Moore, T.L.A., O'Brien, F.J., Gibson, L.J., 2004. Creep does not contribute to fatigue in bovine
trabecular bone. J. Biomech. Eng. Trans. ASME 126(3), 321-9.
Morgan, E.F., Bayraktar, H.H., Keaveny, T.M., 2003. Trabecular bone modulus–density
relationships depend on anatomic site. J Biomech. 36, 897-904.
Morlock, M., Schneider, E., Bluhm, A., Vollmer, M., Bergmann, G., Muller, V., Honl, M., 2001.
Duration and frequency of every day activities in total hip patients. J. Biomech. 34, 873-81.
Mosekilde, L., Mosekilde, L., Danielsen, C.C., 1987. Biomechanical competence of vertebral
trabecular bone in relation to ash density and age in normal individuals. Bone 8, 79–85.
Mow, V.C., Hayes, W.C., 1991. Basic orthopaedic biomechanics. Raven press, New York, USA.
Muller, R., Hildebrand, T., Ruegsegger, P., 1994. Noninvasive bone biopsy: a new method to
analyse and display the three-dimensional structure of trabecular bone. Phys. Med. Biol. 39,
145-64.
Nagaraja, S., Couse, T.L., Guldberg, R.E., 2005. Trabecular bone microdamage and
microstructural stresses under uniaxial compression. J. Biomech. 38, 707-16.

183
Nagele, E., Kuhn, V., Vogt, H., Link, T.M., Muller, R., Lochmuller, E.M., Eckstein, F., 2004.
Technical considerations for microstructural analysis of human trabecular bone from
specimens excised from various skeletal sites. Calcif. Tissue Int. 75, 15-22.
National Joint Registry (NJR) UK, 2011. Available at
http://www.njrcentre.org.uk/NjrCentre/Portals/0/Documents/NJR%208th%20Annual%20Re
port%202011.pdf
Nazarian, A., Muller, R., 2004. Time-lapsed microstructural imaging of bone failure behavior.
J. Biomech. 37, 55-65.
Nazarian, A., Stauber, M., Muller, R., 2005. Design and implementation of a novel mechanical
testing system for cellular solids. J. Biomed. Mater. Res. B Appl. Biomater. 73B (2), 400-411.
Nicholson, P.H., Cheng. X.G., Lowet, G., Boonen, S., Davie, M.W., Dequeker. J., Van der Perre,
G., 1997. Structural and material mechanical properties of human vertebral cancellous bone.
Med. Eng. Phys., 19(8), 729-737.
Niebur, G.L., Feldstein, M.H., Yuen, J.C., Chen, T.J., Keaveny, T.M., 2000. High-resolution finite
element models with tissue strength asymmetry accurately predict failure of trabecular
bone. J. Biomech. 33, 1575–83.
Nordin, M., Frankel, V.H., 2001. Basic biomechanics of the Musculoskeletal System. Third
edition, Lippincott Williams & Wilkins, Philadelphia, USA.
Nottrott, M., Molster, A.O., Gjerdet, N.R., 2007. Time dependent mechanical properties of
bone cement. An in vitro study over one year. J. Biomed. Mater. Res. Part B: Appl. Biomater.
83B, 416-21.

184
Oates, K.M., Barrera, D.L., Tucker, W.N., Chau, C.C.H., Bugbee, W.D., Convery, F.R., 1995. In
vivo effect of pressurisation of polymethylmethacrylate bone-cement. J. Arthroplasty 10,
373-81.
Odgaard, A., 1997. Three-dimensional methods for quantification of cancellous bone
architecture. Bone 20, 315-28.
Ohman, C., Baleani, M., Perilli, E., Dall'Ara, E., Tassani, S., Baruffaldi, F., Viceconti, M., 2007.
Mechanical testing of cancellous bone from the femoral head: experimental errors due to
off-axis measurements. J Biomech. 40, 2426-33.
Ohman, C., 2011. Human bone: The tissue characteristics determining its mechanical
behaviour. University of Bologna, Italy, Ph.D. Thesis.
Ohrndorf, A., Krupp, U., Christ, H.-J., 2005. Correlation between fracture behaviour and
ductility of the cell strut material in case of metallic foams, 11th International Conference on
Fracture (ICF11), Turin, Italy, 4340-5.
Ohrndorf, A., Krupp, U., Christ, H.J., 2006. Metallic open-cell foams - A promising approach to
fabricating good medical implants. Technol. Health Care 14, 201-208.
Palissery, V., Taylor, M., Browne, M., 2004. Fatigue characterization of a polymer foam to use
as a cancellous bone analog material in the assessment of orthopaedic devices. Journal of
Material Science: Materials in Medicine 15(1), 61-7.
Parfitt, A.M., Mathews, C.H.E., Villanueva, A.R., Kleerekoper, M., 1983. Relationships
between surface, volume, and thickness of iliac trabecular bone in aging and in osteoporosis.
J. Clin. Invest. 72, 1396-1409.

185
Pathumanapully, P.K., 2010. Simulation of tissue differentiation in uncemented hip implants
based on a mechanoregulatory hypothesis. University of Southampton, UK, Ph.D. Thesis.
Pattin, C.A., Caler, W.E., Carter, D.R., 1996. Cyclic mechanical property degradation during
fatigue loading of cortical bone. J. Biomech. 29(1), 69-79.
Perilli, E., Baruffali, F., Visentin, M., Bordini, B., Traina, F., Cappello, A., Viceconti, M., 2007.
MicroCT examination of human bone specimens: effects of polymethylmethacrylate
embedding on structural parameters. J. Microsc. 225, 192-200.
Poumarat, G., Squire, P., 1993. Comparison of mechanical properties of human, bovine bone
and a new processed bone xenograft. Biomaterials 14, 337-40.
Prakash, O., Sang, H., Embury, J.D., 1995. Structure and properties of Al-SiC foam. Mat. Sci.
Eng. A – Struct. 199 (2), 195-203.
Race, A., Miller, M.A., Clarke, M.T., Mann, K.A., Higham, P., 2006. The effect of low-viscosity
cement on mantle morphology and femoral stem micromotion. Acta Orthop. 77, 607-16.
Reis, A., Loguercio, A.D., Carvalho, R.M., Grande, R.H.M., 2004. Durability of resin dentin
interfaces: effects of surface moisture and adhesive solvent component. Dental Materials 20,
669-76.
Renders, G.A.P., Mulder, L., Van Ruijven, L.J., Van Eijden, T.M.G.J., 2007. Porosity of human
mandibular condylar bone. J. Anat. 210, 239-48.
Rho, J.-Y., Tsui, T.Y., Pharr, G.M., 1997. Elastic properties of human cortical and trabecular
lamellar bone measured by nanoindentation. Biomaterials 18, 1325-30.

186
Ritman, E., 2004. Micro-Computed Tomography - Current Status and Developments. Annual
Review of Biomedical Engineering 6, 185-208.
Rohlmann, A., Zlich, H., Bergmann, G., Kolbel, R., 1980. Material properties of femoral
cancellous bone in axial loading. Part I: Time independent properties. Arch. Orthop. Trauma
Surg. 97(2), 95-102.
Ruegsegger, P., Koller, B., Muller, R., 1996. A microtomographic system for the non-
destructive evaluation of bone architecture. Calcif. Tissue Int. 58, 24-9.
Saikko, V.O., 1993. Wear of polyethylene acetabular cups against alumina femoral heads.
Acta Orthop. Scand. 64, 507–12.
Sasov, A., 1987. Microtomography. Part 1: Methods and equipment. J. Microsc. 147, 169-78.
Sasov, A., 1987b. Microtomography. Part 2: Examples of applications. J. Microsc. 147, 179-92.
Sasov, A., Van Dyck, D., 1998. Desktop X-ray microscopy and microtomography. J. Microsc.
191, 151-8.
Sasov, A., Dewaele, D., 2002. High-Resolution in-vivo Micro-CT Scanner for Small Animals.
Developments in X-ray tomography III. Proc. SPIE 4503, 282-90.
Schmalzried, T.P., Jasty, M., Harris, W.H., 1992. Periprosthetic bone loss in total hip
arthroplasty. Polyethylene wear debris and concept of the effective joint space. J. Bone Joint
Surg. Am. 74(6), 849-63.
Schmitt, S., Krzypow, D.J., Rimnac, C.M., 2004. The effect of moisture absorption on the
fatigue crack propagation resistance of acrylic bone cement. Biomed. Technik. 49, 61-65.

187
Schulte, K.R., Callaghan, J.J., Kelley, S.S., Johnston, R.C., 1993. The outcome of Charnley total
hip arthroplasty with cement after a minimum twenty-year follow-up. The result of one
surgeon. J. Bone Joint Surg. Am. 75, 961-975.
Schwarz, E.M., Looney, R.J., O’Keefe, R.J., 2000. Anti-TNF-alpha therapy as a clinical
intervention for periprosthetic osteolysis. Arthritis Res. 2, 165-8.
Silva, M.J., Gibson, L.J., 1997. Modeling the mechanical behaviour of vertebral trabecular
bone: Effects of age-related changes in microstructure. Bone 21, 191-9.
Stauffer, R.N., 1982. Ten-year follow-up study of total hip replacement. J. Bone Joint Surg.
64A, 983–90.
Stocks, G.W., Freeman, M.A., Evans, S.J., 1995. Acetabular cup migration: prediction of
aseptic loosening. J. Bone Joint Surg. Br. 77, 853-861.
Stollk, J., Verdonshot, N., Murphy, B.P., Prendergast, P.J., Huiskes, R., 2004. Finite element
simulation of anisotropic damage accumulation and creep in acrylic bone cement. Eng. Fract.
Mech. 71, 513-28.
Stone, J.L., Beaupre, G.S., Hayes, W.C., 1983. Multiaxial strength characteristics of trabecular
bone. J. Biomech. 16, 743–52.
Stone, J.J.S., Rand, J.A., Chiu, E.K., Grabowski, J.J., An, K.N., 1996. Cement viscosity affects the
bone-cement interface in total hip arthroplasty. J. Orthop. Res. 14, 834-7.
Sundfeldt, M., Carlsson, L.V., Johansson, C.B., Thomsen, P., Gretzer, C., 2006. Aseptic
loosening, not only a question of wear: A review of different theories. Acta Orthopaedica
77(2), 177-197.

188
Swartz, D.E., Wittenberq, R.H., Shea, M., White, A.A., Hayes, W.C., 1991. Physical and
mechanical properties of calf lumbosacral trabecular bone. J. Biomech. 24, 1059-68.
Szivek, J.A., Thompson, J.D., Benjamin, J.B., 1995. Characterization of three formulations of a
synthetic foam as models for a range of human cancellous bone types. J. Appl. Biomater. 6,
125-8.
Takeda, R.T.S., Natorigawa, A., Todoh, M., Yoshinari, S., 2009. Gait posture estimation using
wearable acceleration and gyrosensors. J. Biomech. 42, 2486-94.
Thanner, J., Karrholm, J., Malchau, H., Herberts, P., 1999. Poor outcome of the PCA and
Harris-Galante hip prostheses. Randomized study of 171 arthroplasties with 9-year follow-up.
Acta Orthop. Scand. 70, 155-162.
Thompson, M.S., McCarty, I.D., Lidgren, L., 2003. Compressive and shear properties of
commercially available polyurethane foams. J. Biomech. Eng. Trans ASME 125, 732-4.
Thompson, M.S., Flivik, G., Juliusson, R., Odgaard, A., Ryd, L., 2004. A comparison of
structural and mechanical properties in cancellous bone from the femoral head and
acetabulum. Proc. Inst. Mech. Eng. H 218, 425-9.
Thomsen, J. S., Laib, A., Koller, B., Prohaska, S., Mosekilde, L., Gowin, W., 2005. Stereological
measures of trabecular bone structure: comparison of 3D micro computed tomography with
2D histological sections in human proximal tibial bone biopsies. J. Microsc. 218, 171-9.
Thurner, P.J., Erickson, B., Jungmann, R., Schriock, Z., Weaver, J.C., Fantner, G.E., Schitter, G.,
Morse, D.E., Hansma, P.K., 2007. High-speed photography of compressed human trabecular
bone correlates whitening to microscopic damage. Eng. Fract. Mech. 74, 1928-41.

189
Tong, J., Wong, K.Y., Lupton, C., 2007. Determination of interfacial fracture toughness of
bone-cement interface using sandwich Brazilian disks. Eng. Fract. Mech. 74, 1904-1916.
Tong, J., Zant, N.P., Wang, J-Y., Heaton-Adegbile, P., Hussell, J.G., 2008. Fatigue in cemented
acetabular replacements. Int. J. Fatigue 30(8), 1366-1375.
Topoleski, L.D.T., Duchegne, P., Cucheyne, P., Cuckler, J.M., 1990. A fractographic analysis of
in vivo poly(methylmethacrylate) bone cement failure mechanisms. J. Biomed. Mater. Res.
24, 135-54.
Tozzi, G., Lupton, C., Heaton-Adegbile, P., Tong, J., 2012. Damage evolution in acetabular
reconstructs under physiological testing in a saline environment. J. Biomech. 45, 405-408.
Tozzi, G., Zhang, Q.-H., Tong, J., 2012b. 3D real-time micromechanical compressive behaviour
of bone-cement interface: Experimental and finite element studies. J. Biomech. 45, 356-363.
Turner, C.H., Rho, J.-Y., Takano, Y., Tsui, T.Y., Pharr, G.M., 1999. The elastic properties of
trabecular and cortical bone tissues are similar: results from two microscopic measurement
techniques. J. Biomech. 32, 437–41.
Uchiyama, T., Tanizawa, T., Muramatsu, H., Endo, N., Takahashi, H.E., Hara, T., 1999. Three-
dimensional microstructural analysis of human trabecular bone in relation to its mechanical
properties. Bone 25, 487-91.
Ulrich, D., Hildebrand, T., Van Rietbergen, B., Muller, R., Ruegsegger, P., 1997. The quality of
trabecular bone evaluated with micro-computed tomography, fea and mechanical testing.
Studies in Health Technology and Informatics 40, 97–112.

190
Van Rietbergen, B., Weinans, H., Huiskes, R., Odgaard, A., 1995. A new method to determine
trabecular bone elastic properties and loading using micromechanical finite-element models.
J. Biomech. 28, 69–81.
Varini, E., 2007. Primary stability in cementless total hip replacement: measurement
techniques and aided-surgery. University of Bologna, Italy, Ph.D. Thesis.
Vashishth, D., Koontz, J., Qui, S., Lundin-Cannon, D., Yeni, Y., Schaffler, M., Fyhrie, D.P., 2000.
In vivo diffuse damage in human vertebral trabecular bone. Bone 26, 147-152.
Vaughan, C.L., Davis, B.L., O'Connor, J.C., 1992. The three-dimensional and cyclic nature of
gait. Human Kinetics Publishers, Illinois, USA.
Verhulp, E., Van Rietbergen, B., Muller, R., Huiskes, R., 2008. Indirect determination of
trabecular bone effective tissue failure properties using micro-finite element simulations. J.
Biomech. 41, 1479-85.
Vernon-Roberts, B., 1984. The initial state, in The Bone-Cement Interface. Workshop Report,
American Academy of Orthopaedic Surgery, p. 8-22.
Waanders, D., Janssen, D., Mann, K.A., Verdonschot, N., 2010. The mechanical effects of
different levels of cement penetration at the cement-bone interface. J Biomech. 43(6), 1167-
75.
Waarsing, J.H., Day, J.S., Weinans, H., 2004. An improved segmentation method for in vivo
microCT imaging. J. Bone Miner. Res. 19, 1640-50.
Wachtel, E., Keaveny, T.M., 1997. Dependence of trabecular damage on mechanical strain. J.
Orthop. Res. 15, 781-7.

191
Wang, X., Shen, X., Li, X., Agrawal, C.M., 2002. Age-related changes in the collagen network
and toughness of bone. Bone 31, 1-7.
Wang, J.Y., Heaton-Adegbile, P., New, A., Hussell, J.G., Tong, J., 2009. Damage evolution in
acetabular replacements under long-term physiological loading conditions. J. Biomech. 42,
1061-8.
Wang, J.-Y., 2009. Cemented acetabular replacements - Finite element modelling and in vitro
physiological testing. University of Portsmouth, UK, Ph.D. Thesis.
Wang, J.Y., Tozzi, G., Chen, J., Contal, F., Lupton, C., Tong, J., 2010. Bone–cement interfacial
behaviour under mixed mode loading conditions. J. Mech. Behav. Biomed. Mater. 3, 392–8.
Weber, M., Baumeister, J., Banhart, J., Kunze, H.-D., 1994. Selected mechanical and physical
properties of metal foams. Proceedings of the Powder Metallurgy World Congress (PM94),
Paris, France, 585–588.
Wiesel, S.W., Delahay, J.N., 2010. Essentials of Orthopaedic Surgery. Fourth edition, Springer,
New York, USA.
Williams, P.L., 1995. Gray's anatomy. 38th edition, Churchill Livingstone, London, UK.
Yeni, Y.N., Fyhrie, D.P., 2002. Fatigue damage-fracture mechanics interaction in cortical bone.
Bone 30(3), 509-14.
Zant, N.P., 2006. Fatigue integrity of reconstructed acetabula in total hip replacement.
University of Portsmouth, UK, Ph.D. Thesis.

192
Zant, N.P., Wong, K.Y., Tong, J., 2007. Fatigue failure in cement mantle in a simplified
acetabular replacement model. Int. J. Fatigue 29(7), 1245-52.
Zant, N.P., Heaton-Adegbile, P., Hussell, J.G., Tong, J., 2008. In vitro fatigue failure of
cemented acetabular replacements: a hip simulator study. J. Biomech. Eng. Trans. ASME 130,
021019-1-9.
Zhu, H.X., Knott, J.F., Mills, N.J., 1997. Analysis of the elastic properties of open-cell foams
with tetrakaidecahedral cells. Journal of the Mechanics and Physics of Solids 45, 319-25.
Zioupos, P., Wang, X.T., Currey, J.D., 1996. The accumulation of fatigue microdamage in
human cortical bone of two different ages in vitro. Clin. Biomech. 11(7), 365-75.
Zysset, P.K., Guo, X.E., Hoffler, C.E., Moore, K.E., Goldstein, S.A., 1999. Elastic modulus and
hardness of cortical and trabecular bone lamellae measured by nanoindentation in the
human femur. J. Biomech. 32, 1005–12.

193
Chapter 8
Appendix

194
8. Contributions to publications produced during the course of this
work
8.1. Journal papers
Wang, J.-Y., Tozzi, G., Chen, J., Contal, F., Lupton, C., Tong, J., 2010. Bone–cement interfacial
behaviour under mixed mode loading conditions. J. Mech. Behav. Biomed. Mater. 3, 392–
398.
Guillen, T., Zhang, Q.-H., Tozzi, G., Ohrndorf, A., Christ, H.-J., Tong, J., 2011. Compressive
behaviour of bovine cancellous bone and bone analogous materials, microCT
characterization and FE prediction. J. Mech. Behav. Biomed. Mater. 4, 1452-61.
Guillen, T., Ohrndorf, A., Tozzi, G., Tong, J., Christ, H.-J., 2011. Compressive fatigue behaviour
of bovine cancellous bone and bone analogous materials under multi-step loading
conditions. Adv. Eng. Mat., doi: 10.1002/adem.201180060.
Tozzi, G., Zhang, Q.-H., Tong, J., 2012. 3D real-time micromechanical compressive behaviour
of bone-cement interface: experimental and finite element studies. J. Biomech. 45, 356-363.
Tozzi, G., Lupton, C., Heaton-Adegbile, P., Tong, J., 2012. Damage evolution in acetabular
reconstructs under physiological testing in a saline environment. J. Biomech. 45, 405-408.
Zhang, Q.-H., Tozzi, G., Tong, J., 2012. Micromechanical damage of trabecular bone-cement
interface under selected loading conditions: a finite element study. Computer Methods in
Biomechanics and Biomedical Engineering, revised & resubmitted.
Madi, K., Tozzi, G., Zhang, Q.-H., Tong, J., Cossey, A., Au, A., Hollis, D., Hild, F., 2012.
Computation of full-field displacement in a scaffold implant using Digital Volume Correlation
and Finite Element Analysis. J. Biomech., submitted.

195
8.2. Conference papers
Tozzi, G., Guillen, T., Ohrndorf, A., Christ, H.-J., Tong, J., 2010. Characterization of aluminum
foam as a cancellous bone substitute. 17th European Society of Biomechanics (ESB)
Congress, Edinburgh, Scotland, UK.
Tong, J., Wang, J.-Y., Tozzi, G., Chen, J., Lupton, C., 2010. Bone-cement interfacial behaviour
under mixed mode loading conditions. 17th European Society of Biomechanics (ESB)
Congress, Edinburgh, Scotland, UK.
Tozzi, G., Zhang, Q.-H., Lupton, C., Tong, J., 2011. A 3D real-time micromechanical study of
bone-cement-interface. 23rd International Society of Biomechanics (ISB) Congress, Brussels,
Belgium.
Tozzi, G., Lupton, C., Tong, J., 2011. Damage evolution in acetabular reconstruct under
physiological testing in a biological environment. 23rd International Society of Biomechanics
(ISB) Congress, Brussels, Belgium.
Zhang, Q.-H., Tozzi, G., Tong, J., Guillen, T., Ohrndorf, A., Christ, H.-J., 2011. Post yield
behaviour of bovine trabecular bone and bone analogous materials under compression.
23rd International Society of Biomechanics (ISB) Congress, Brussels, Belgium.
Madi, K., Booker, A., Tozzi, G., Hsu, Y.-H., Lupton, C., Tong, J., Cossey, A., 2011. Viscoelastic
modelling and full-field strain field computation of scaffold implants for cartilage knee
repair. 2nd International Conference on Tissue Engineering (ICTE), Lisbon, Portugal.

196
Guillen, T., Tozzi, G., Ohrndorf, A., Tong, J., Christ, H.-J., 2011. Substituting cancellous bone
with open-cell metal foam in biomechanical testing of cemented hip joints. 7th International
Conference on Porous Metals and Metallic Foams (MetFoam), Busan, Korea.
Tozzi, G., Heaton-Adegbile, P., Tong, J., 2011. Long-term assessment of cement fixation in
acetabular replacements under physiological testing in a biological environment. 24th
International Society for Technology in Arthroplasty Congress (ISTA), Bruges, Belgium.
Tozzi, G., Zhang, Q.-H., Tong, J., 2011. Micromechanical behaviour in bone-cement interface
under compression. 24th International Society for Technology in Arthroplasty Congress
(ISTA), Bruges, Belgium.