in vivo tomographic imaging of red-shifted fluorescent proteins
TRANSCRIPT

In vivo tomographic imaging of red-shifted fluorescent proteins
Nikolaos C. Deliolanis,1,3,5 Thomas Wurdinger,1,2,4 Lisa Pike,2 Bakhos A. Tannous,1,2 Xandra O. Breakefield,1,2 Ralph Weissleder,1,5 and Vasilis Ntziachristos1,3
1Center for Molecular Imaging Research, Department of Radiology, Massachusetts General Hospital, Harvard Medical School, Boston, Massachusetts, USA
2Department of Neurology, Massachusetts General Hospital, Harvard Medical School, Boston, Massachusetts, USA 3Institute for Biological and Medical Imaging, Technische Universität München and Helmholtz Zentrum München,
Munich, Germany 4Neuro-oncology Research Group, Department of Neurosurgery, VU University Medical Center,
Amsterdam, The Netherlands 5Center for Systems Biology, Massachusetts General Hospital, Department of Systems Biology, Harvard Medical
School, Boston, Massachusetts, USA *[email protected]
Abstract: We have developed a spectral inversion method for three-dimensional tomography of far-red and near-infrared fluorescent proteins in animals. The method was developed in particular to address the steep light absorption transition of hemoglobin from the visible to the far-red occurring around 600 nm. Using an orthotopic mouse model of brain tumors expressing the red-shifted fluorescent protein mCherry, we demonstrate significant improvements in imaging accuracy over single-wavelength whole body reconstructions. Furthermore, we show an improvement in sensitivity of at least an order of magnitude over green fluorescent protein (GFP) for whole body imaging. We discuss how additional sensitivity gains are expected with the use of further red-shifted fluorescent proteins and we explain the differences and potential advantages of this approach over two-dimensional planar imaging methods.
©2011 Optical Society of America
OCIS codes: (170.6960) Tomography; (170.3880) Medical and biological imaging.
References and links
1. B. N. G. Giepmans, S. R. Adams, M. H. Ellisman, and R. Y. Tsien, “The fluorescent toolbox for assessing protein location and function,” Science 312(5771), 217–224 (2006).
2. R. Weissleder and M. J. Pittet, “Imaging in the era of molecular oncology,” Nature 452(7187), 580–589 (2008). 3. R. K. Jain, L. L. Munn, and D. Fukumura, “Dissecting tumour pathophysiology using intravital microscopy,”
Nat. Rev. Cancer 2(4), 266–276 (2002). 4. F. Helmchen and W. Denk, “Deep tissue two-photon microscopy,” Nat. Methods 2(12), 932–940 (2005). 5. M. Yang, E. Baranov, P. Jiang, F. X. Sun, X. M. Li, L. N. Li, S. Hasegawa, M. Bouvet, M. Al-Tuwaijri, T.
Chishima, H. Shimada, A. R. Moossa, S. Penman, and R. M. Hoffman, “Whole-body optical imaging of green fluorescent protein-expressing tumors and metastases,” Proc. Natl. Acad. Sci. U.S.A. 97(3), 1206–1211 (2000).
6. H. Kishimoto, T. Kojima, Y. Watanabe, S. Kagawa, T. Fujiwara, F. Uno, F. Teraishi, S. Kyo, H. Mizuguchi, Y. Hashimoto, Y. Urata, N. Tanaka, and T. Fujiwara, “In vivo imaging of lymph node metastasis with telomerase-specific replication-selective adenovirus,” Nat. Med. 12(10), 1213–1219 (2006).
7. V. Ntziachristos and R. Weissleder, “Experimental three-dimensional fluorescence reconstruction of diffuse media by use of a normalized Born approximation,” Opt. Lett. 26(12), 893–895 (2001).
8. N. C. Deliolanis, T. Lasser, D. Hyde, A. Soubret, J. Ripoll, and V. Ntziachristos, “Free-space fluorescence molecular tomography utilizing 360° geometry projections,” Opt. Lett. 32(4), 382–384 (2007).
9. C. Q. Li, G. S. Mitchell, J. Dutta, S. Ahn, R. M. Leahy, and S. R. Cherry, “A three-dimensional multispectral fluorescence optical tomography imaging system for small animals based on a conical mirror design,” Opt. Express 17(9), 7571–7585 (2009).
10. G. Zacharakis, H. Kambara, H. Shih, J. Ripoll, J. Grimm, Y. Saeki, R. Weissleder, and V. Ntziachristos, “Volumetric tomography of fluorescent proteins through small animals in vivo,” Proc. Natl. Acad. Sci. U.S.A. 102(51), 18252–18257 (2005).
#139767 - $15.00 USD Received 16 Dec 2010; revised 1 Mar 2011; accepted 7 Mar 2011; published 16 Mar 2011(C) 2011 OSA 1 April 2011 / Vol. 2, No. 4 / BIOMEDICAL OPTICS EXPRESS 887

11. I. V. Turchin, V. I. Plehanov, A. G. Orlova, V. A. Kamenskiy, M. S. Kleshnin, M. V. Shirmanova, N. M. Shakhova, I. V. Balalaeva, and A. P. Savitskiy, “Fluorescence diffuse tomography of small animals with DsRed2 fluorescent protein,” Laser Phys. 16(5), 741–746 (2006).
12. I. V. Turchin, V. A. Kamensky, V. I. Plehanov, A. G. Orlova, M. S. Kleshnin, I. I. Fiks, M. V. Shirmanova, I. G. Meerovich, L. R. Arslanbaeva, V. V. Jerdeva, and A. P. Savitsky, “Fluorescence diffuse tomography for detection of red fluorescent protein expressed tumors in small animals,” J. Biomed. Opt. 13(4), 041310 (2008).
13. R. E. Campbell, O. Tour, A. E. Palmer, P. A. Steinbach, G. S. Baird, D. A. Zacharias, and R. Y. Tsien, “A monomeric red fluorescent protein,” Proc. Natl. Acad. Sci. U.S.A. 99(12), 7877–7882 (2002).
14. N. C. Shaner, R. E. Campbell, P. A. Steinbach, B. N. G. Giepmans, A. E. Palmer, and R. Y. Tsien, “Improved monomeric red, orange and yellow fluorescent proteins derived from Discosoma sp. red fluorescent protein,” Nat. Biotechnol. 22(12), 1567–1572 (2004).
15. L. Wang, W. C. Jackson, P. A. Steinbach, and R. Y. Tsien, “Evolution of new nonantibody proteins via iterative somatic hypermutation,” Proc. Natl. Acad. Sci. U.S.A. 101(48), 16745–16749 (2004).
16. D. Shcherbo, E. M. Merzlyak, T. V. Chepurnykh, A. F. Fradkov, G. V. Ermakova, E. A. Solovieva, K. A. Lukyanov, E. A. Bogdanova, A. G. Zaraisky, S. Lukyanov, and D. M. Chudakov, “Bright far-red fluorescent protein for whole-body imaging,” Nat. Methods 4(9), 741–746 (2007).
17. D. Shcherbo, C. S. Murphy, G. V. Ermakova, E. A. Solovieva, T. V. Chepurnykh, A. S. Shcheglov, V. V. Verkhusha, V. Z. Pletnev, K. L. Hazelwood, P. M. Roche, S. Lukyanov, A. G. Zaraisky, M. W. Davidson, and D. M. Chudakov, “Far-red fluorescent tags for protein imaging in living tissues,” Biochem. J. 418(3), 567–574 (2009).
18. K. S. Morozova, K. D. Piatkevich, T. J. Gould, J. H. Zhang, J. Bewersdorf, and V. V. Verkhusha, “Far-red fluorescent protein excitable with red lasers for flow cytometry and superresolution STED nanoscopy,” Biophys. J. 99(2), L13–L15 (2010).
19. D. Shcherbo, I. I. Shemiakina II, A. V. Ryabova, K. E. Luker, B. T. Schmidt, E. A. Souslova, T. V. Gorodnicheva, L. Strukova, K. M. Shidlovskiy, O. V. Britanova, A. G. Zaraisky, K. A. Lukyanov, V. B. Loschenov, G. D. Luker, and D. M. Chudakov, “Near-infrared fluorescent proteins,” Nat. Methods 7(10), 827–829 (2010).
20. X. Shu, A. Royant, M. Z. Lin, T. A. Aguilera, V. Lev-Ram, P. A. Steinbach, and R. Y. Tsien, “Mammalian expression of infrared fluorescent proteins engineered from a bacterial phytochrome,” Science 324(5928), 804–807 (2009).
21. N. C. Deliolanis, R. Kasmieh, T. Wurdinger, B. A. Tannous, K. Shah, and V. Ntziachristos, “Performance of the red-shifted fluorescent proteins in deep-tissue molecular imaging applications,” J. Biomed. Opt. 13(4), 044008 (2008).
22. T. Lasser, A. Soubret, J. Ripoll, and V. Ntziachristos, “Surface Reconstruction for free-space 360 degrees fluorescence molecular tomography and the effects of animal motion,” IEEE Trans. Med. Imaging 27(2), 188–194 (2008).
23. M. Potmesil, “Generating octree models of 3d objects from their silhouettes in a sequence of images,” Comput. Vis. Graph. Image Process. 40(1), 1–29 (1987).
24. M. Sena-Esteves, J. C. Tebbets, S. Steffens, T. Crombleholme, and A. W. Flake, “Optimized large-scale production of high titer lentivirus vector pseudotypes,” J. Virol. Methods 122(2), 131–139 (2004).
25. T. Wurdinger, C. Badr, L. Pike, R. de Kleine, R. Weissleder, X. O. Breakefield, and B. A. Tannous, “A secreted luciferase for ex vivo monitoring of in vivo processes,” Nat. Methods 5(2), 171–173 (2008).
26. H. Du, R. C. A. Fuh, J. Z. Li, L. A. Corkan, and J. S. Lindsey, “PhotochemCAD: A computer-aided design and research tool in photochemistry,” Photochem. Photobiol. 68, 141–142 (1998).
27. A. Ishimaru, Wave Propagation and Scattering in Random Media (IEEE Press, 1997). 28. G. Alexandrakis, F. R. Rannou, and A. F. Chatziioannou, “Tomographic bioluminescence imaging by use of a
combined optical-PET (OPET) system: a computer simulation feasibility study,” Phys. Med. Biol. 50(17), 4225–4241 (2005).
29. W. F. Cheong, S. A. Prahl, and A. J. Welch, “A review of the optical properties of biological tissues,” IEEE J. Quantum Electron. 26(12), 2166–2185 (1990).
30. M. J. Niedre, G. M. Turner, and V. Ntziachristos, “Time-resolved imaging of optical coefficients through murine chest cavities,” J. Biomed. Opt. 11(6), 064017 (2006).
31. S. A. Prahl, “Optical Properties Spectra,” (2001), retrieved http://omlc.ogi.edu/spectra/. 32. L. Lüdemann, B. Hamm, and C. Zimmer, “Pharmacokinetic analysis of glioma compartments with dynamic Gd-
DTPA-enhanced magnetic resonance imaging,” Magn. Reson. Imaging 18(10), 1201–1214 (2000). 33. I. Georgakoudi, M. G. Muller, and M. S. Feld, “Intrinsic fluorescence spectroscopy of biological tissue,” in
Fluorescence in Biomedicine, M. A. Mycek and B. Pogue, eds. (Marcel Decker, 2002), pp. 109–142. 34. R. Weissleder and V. Ntziachristos, “Shedding light onto live molecular targets,” Nat. Med. 9(1), 123–128
(2003). 35. B. Brooksby, S. Srinivasan, S. D. Jiang, H. Dehghani, B. W. Pogue, K. D. Paulsen, J. Weaver, C. Kogel, and S.
P. Poplack, “Spectral priors improve near-infrared diffuse tomography more than spatial priors,” Opt. Lett. 30(15), 1968–1970 (2005).
36. A. J. Chaudhari, F. Darvas, J. R. Bading, R. A. Moats, P. S. Conti, D. J. Smith, S. R. Cherry, and R. M. Leahy, “Hyperspectral and multispectral bioluminescence optical tomography for small animal imaging,” Phys. Med. Biol. 50(23), 5421–5441 (2005).
#139767 - $15.00 USD Received 16 Dec 2010; revised 1 Mar 2011; accepted 7 Mar 2011; published 16 Mar 2011(C) 2011 OSA 1 April 2011 / Vol. 2, No. 4 / BIOMEDICAL OPTICS EXPRESS 888

37. A. Corlu, T. Durduran, R. Choe, M. Schweiger, E. M. C. Hillman, S. R. Arridge, and A. G. Yodh, “Uniqueness and wavelength optimization in continuous-wave multispectral diffuse optical tomography,” Opt. Lett. 28(23), 2339–2341 (2003).
1. Introduction
Fluorescent proteins (FPs) have revolutionized biological discovery by allowing visualization of cellular and sub-cellular molecules, structures and processes [1,2]. The ability to image and quantitate such processes at the whole body level would enable functional ‘-omics’ and/or allow the detailed tracking of cell populations over time. As we move to systematically explore the function and regulation of protein networks - either normally functioning ones, alterations in disease or through therapeutic manipulation - it is increasingly important to visualize various events in situ in the appropriate organ and within complex living environments. In this role, the use of mammalian animal models has been invaluable to bridge the divide between in vitro research and the clinical application of therapeutic strategies.
Intravital microscopy [3,4] has paved the way for the utilization of FPs in the understanding of cellular and sub-cellular function in vivo. The use of this technique, however, is significantly limited by the inability to non-invasively visualize activity deeper than a few hundred microns, for example from entire solid tumors, or within organs and systems. Epi-illumination imaging, which uses single projection imaging, has likewise been employed for imaging surface activity at depths of a few millimeters [5,6]. In this approach, the fluorescence intensity has a strong, non-linear dependence on both the depth of the activity and the underlying tissue optical properties. Consequently, this impedes the ability to accurately quantify the underlying fluorescence activity. Fluorescence tomography (FMT) [7], a model-based reconstruction method, has been developed as an alternative, quantitative, three-dimensional imaging technique to overcome the limitations of epi-illumination and to visualize the distribution of fluorescence probes in vivo. Through several technical developments recent systems utilize CCD cameras, which allow high spatial sampling of photon propagating through tissues at multiple projections, i.e. at multiple illumination detection paths [8] and wavelengths [9]. Fluorescence tomography has been previously shown to resolve GFP and dsRed reporter protein expression in-vivo [10–12], however limitations associated with operation in the visible spectrum (<600 nm) were noted, such long acquisition times and thus limitation to single view projections.
The ability to resolve fluorescent reporter proteins operating in the near-infrared could significantly improve the applicability of these imaging techniques in the study of biological function. Seminal ongoing research on FP development has resulted in a variety of adept red-shifted constructs that operate in the far-red (RFPs) [13–19], and recently, in the near-infrared (IFP) [20]. It has been predicted that the signals emitted from RFPs can be detected for several millimeters to centimeters in tissues [21], which would allow visualization through entire small animals, such as mice or rats. This feature is due to a peculiarity in the hemoglobin absorption spectrum that yields a steep drop in the extinction coefficient at wavelengths that are longer than 600-610 nm. As a result, light attenuation in tissues is significantly lower in the far-red and near-infrared (630 – 900 nm) compared to the visible. Yet, the excitation of most RFPs remains in the visible range (<630 nm), where light experiences strong attenuations when traveling through tissue [13,14,16]. This imposes several methodological difficulties on the development of strategies that can accurately illuminate, capture and reconstruct the fluorescence biodistribution of fluorochromes that operate at a highly varying attenuation background.
For this reason, in the present study, we explored a method that can optimally reconstruct the three dimensional distribution of FP activity through the entire volume of a mouse. To achieve optimal performance, the imaging method developed herein incorporates optimum excitation and emission wavelengths, efficient tissue autofluorescence subtraction techniques, and forward light propagation models that work seamlessly at both sides of the steep light
#139767 - $15.00 USD Received 16 Dec 2010; revised 1 Mar 2011; accepted 7 Mar 2011; published 16 Mar 2011(C) 2011 OSA 1 April 2011 / Vol. 2, No. 4 / BIOMEDICAL OPTICS EXPRESS 889

attenuation change, as well as, a multispectral reconstruction scheme that is based on normalized Born (n-Born) ratio and concurrently utilizes four-dimensional data sets (i.e., sources, detectors, angular projections, and emission wavelengths). We show that the forward and inversion components selected are necessary in order to achieve accurate fluorescence biodistribution reconstructions in deep tissue, over conventional FMT methods developed for the near-infrared. This approach, along with the longer light penetration in the red part of the spectrum, allowed the visualization of mCherry-labeled glioblastoma tumors in vivo achieving at least one order of magnitude increased sensitivity compared to volumetric imaging using GFP, with the potential to significantly further improve the sensitivity using novel classes of contrast agents. Herein, we present the major methodological steps, key in vivo results, and major cross-validation findings that showcase the necessity and superior performance achieved with this method, over near-infrared (NIR) optical tomography approaches and discuss the application potential of the approach for non-invasive imaging of RFPs in vivo.
2. Materials and methods
2.1. Tomographic system and data acquisition
The small animal imaging system developed is shown in Fig. 1. It is highly versatile as it can be operated either in epi-illumination or transillumination mode, and can be used to image the animals both in free space (as a non-contact full-angular projection FMT system) [8], or by placing them in a chamber (single projection). The laser sources used in the imaging setup are a tunable Ar-ion laser (Melles Griot, Carlsbad, CA) at 488 and 514 nm (200 mW), a 532 nm 100 mW NdYAG laser (B&W Tek Inc., Newark DE), a 593 70mW nm DPSS laser (Shanghai Dream Lasers, China), a 635 nm 3 mW diode laser (Roithner Lasertechnik GmbH, Vienna, Austria), and 650, 670, and 750 nm 200 mW diode lasers (B&W Tek Inc., Newark DE). No filters to clean up the laser beams were necessary. The lasers were fiber-coupled and guided through a multiport fiber switch (DiCon Fiberoptics, Inc, Richmont CA) into a two-mirror scanhead (XLR8, Nutfield Technology, Inc., Windham, NH). The beam was focused with a telecentric lens at a 0.3 mm spot onto the surface of the animal and scanned in x-y direction. The photon field emerging from the animal surface was imaged from the opposite side with a cooled 70°C CCD camera (Princeton Instruments, Inc. Trenton, NJ) with a Nikkor 50 mm f/1.2 photographic lens (Nikon Corp, Japan). For the image acquisition at various spectral bins, a series of 10 nm bandpass filters (Andover Corp., Salem, NH, and Chroma Technology Corp., Rockingham, VT) were used with central wavelengths at 514, 532, 593, 610, 620, 630, 640, 650, 670, 710, 750, and 800 nm offering a rejection ratio of 6.0 OD at 20 nm away from the center wavelength. For the in vivo tomographic imaging experiments, the mice were suspended by their teeth using a snout clamp (Harvard Apparatus, Holliston, MA), mounted in a step rotating stage (Newport Corporation, Irvine, CA) and imaged in free space (Fig. 1). The system is enclosed in a black box and the temperature remained above 25° C during the free space one hour experiments. For the FP intensity and tissue autofluorescence measurements,
Fig. 1. Schematic of the experimental tomographic system (in free-space configuration).
#139767 - $15.00 USD Received 16 Dec 2010; revised 1 Mar 2011; accepted 7 Mar 2011; published 16 Mar 2011(C) 2011 OSA 1 April 2011 / Vol. 2, No. 4 / BIOMEDICAL OPTICS EXPRESS 890

the mice were placed in a water-tight chamber and slightly compressed in the torso between two parallel glass plates at 1.2 cm. Although not necessary, in these experiments the chamber was filled with matching fluid (Intralipid and ink) to help block the stray light coming from the sides of the mouse; the water temperature was kept ca. at 30° C. In order to keep the mice anesthetized, isoflurane-oxygen gas mixture (1%) was piped through a tube to the mouse snout.
For the acquisition of the complete tomographic data set, the specimen was rotated at Np = 19 different projections and for each projection it was scanned with a rectangular Ns = 3x5 source pattern occupying a 3.8 × 7.6 mm2, thus resulting a sequence of 285 images. This imaging procedure was repeated for every combination of fluorescence filters Nw = 5 (610, 620, 630, 640, 650 nm) and illumination laserlines (593 nm for Ufl and 532 nm for Uau). In addition, it was repeated once with the 635 nm laserline and no filter to record an image Un to be used for the n-Born ratio calculation. Finally, the silhouettes of the object were captured against a white background at 72 different projections to render its 3D surface using a reconstruction algorithm based on a volume carving [22,23]. The whole imaging session lasted approximately 1 h where the camera exposure time (~1 s) was the most time consuming factor. Mice were kept under general anesthesia during placement and imaging with a 1% isoflurane-oxygen mixture.
2.2. Tissue mimicking phantom
A 16 mm diameter cylindrical phantom was produced from a melt prepared from 1% agar in water that was heated up to 95°C. In the cooling phase 1% Intralipid and 1% whole blood were added at 45°C. The phantom was cast in a cylindrical shape enclosing two 1 mm diameter tubes inside the phantom containing 60 and 15 pmol of TexasRed (Sigma-Aldrich).
2.3. Lentivirus vectors and cell lines
Lentivirus vectors encoding GFP (Clontech), or mCherry,(from Dr. R. Tsien, UCSD, CA), all under the control of the CMV promoter were constructed based on the lentivirus cloning vector CSCGW as described previously [24,25]. The viral vector titers (transducing units (TU)/ml) were determined by counting the number of fluorescent positive cells 48 h after infection. U87dEGFR human glioblastoma cells (ATCC) were transduced with 20 TU/cell of LV-GFP or LV-mCherry in order to produce U87dEGFR-GFP and U87dEGFR-mCherry cells. All transduced cells expressed the FPs and were cultured in DMEM supplemented with 10% fetal calf serum and antibiotics.
2.4. Fluorescent protein concentration in cells
We have used an optical method to determine the concentration of FPs in cells by comparing the intensity of the emitted fluorescence with Texas Red fluorochrome of a known concentration. Two identical glass capillary tubes where filled with 0.2 μM of Texas Red and 4 million of mCherry U87 cells that were centrifuged at 2000g for 5 min to form a dense 2 μL pellet and were imaged in the system (section 2.1) using the 593 nm laser and the 620 nm bandpass filter. Taking into account the molar extinction coefficients, the quantum yields and the spectral absorption and emission profiles [14,26] we have determined that the mCherry concentration in the pellet was approximately 18 μM, which accounts for 5 million copies of protein per cell.
2.5. Mouse phantom
A total of 106 U87dEGFR cells expressing the different FPs were placed into small glass capillary tubes of 0.9 mm inner diameter and centrifuged to create dense pellets. The relative brightness of the GPF to the mCherry cells was calculated from fluorescence epiillumination images and was found to be approximately 1/2.5, attributed to different expression levels. This mismatch was taken into account in the following calculations. The capillary tubes were
#139767 - $15.00 USD Received 16 Dec 2010; revised 1 Mar 2011; accepted 7 Mar 2011; published 16 Mar 2011(C) 2011 OSA 1 April 2011 / Vol. 2, No. 4 / BIOMEDICAL OPTICS EXPRESS 891

inserted in the esophagus of a euthanized mouse up to approximately 4 mm above the heart. For these experiments, the mice (n = 2) were placed in the water-tight chamber and slightly compressed in the torso between two parallel glass plates at 1.2 cm. Although not necessary, the chamber was filled with matching fluid (Intralipid and ink) to help blocking the stray light coming from the sides of the mouse. The tube in the esophagus was 8 mm away from the dorsal side and 4 mm from the ventral side, and the mouse was imaged in transillumination twice, once for each direction (dorsal to ventral and ventral to dorsal), in order to have two different location geometries of the tube. The recorded signals were averaged along a region of interest around the illumination point and were normalized for the laser power, filter transmittance, camera integration time, and FP relative brightness.
2.6. U87dEGFR-mCherry brain tumor model
Animal studies were approved by the Massachusetts General Hospital Review Board. For experimental brain tumors, 4-5 week old nude mice (n = 10) were anesthetized with intraperitoneal injection of ketamine (100 mg/kg) and xylazine (5 mg/kg) and then mounted on a stereotaxic frame using a specially made mold to orient the head. The skin was cleaned by scrubbing with 70% ethanol pads, followed by scrubbing with betadine pads. The skull was exposed by a small incision. A small burr hole (<0.5 mm) was made using a high-speed drill at the appropriate stereotaxic coordinates for injection into the brain. Two μL containing 2 x 10⁵ U87dEGFR-mCherry cells were injected into the brain (3 mm lateral and 1.5 mm caudal to bregma; depth 1.5 and 3.5 mm from dura) with a 33 gauge Hamilton syringe. After closing the scalp the mice were placed on a warming pad and returned to cages after full recovery. The mice were imaged 7 days later.
2.7. Autofluorescence subtraction and image pre-processing
Initially, the background noise was subtracted from all images. In order to calibrate the images across the various wavelengths, a tube with the fluorochrome/FP has been placed in the field of view of the camera and was imaged in various wavelengths using the same filter settings as in the tomographic imaging experiments. The pixel values of the fluorescence images are proportional to the relative brightness of the FP, the filter transmittance, and the sensitivity of the camera for each wavelength used; these value were used to scale the raw images. In in vivo experiments, the autofluorescence images auU (excited by a shorter
wavelength 532 nm) were appropriately scaled (by a factor a) and subtracted pixel-by-pixel from the corresponding fluorescence images flU (excited at 593 nm) to yield an
autofluorescence corrected image fl auU aU . For each resulting image, a rectangular pattern
of virtual detectors was obtained and which was projected to the object surface. For the phantom experiment, a 12x11 source pattern over a 13x10 mm2 area was used. For the mice experiments, a narrower 7x11 pattern over a 7x11 mm2 area was used, so as to avoid the high intensity areas at the edge of the mice. Both sources and detectors were virtually projected on the mouse surface as calculated from the silhouettes. The n-Born ratio nBU was calculated for
each source detector pair using Eq. (1) and thus resulting a total of n = 34485 measurements for the phantom, and n = 21945 for the mouse imaging.
2.8. Multispectral forward problem – reconstruction
The volume of interest was discretized in a rectangular equidistant mesh for which the fluorescence concentration would be calculated. The size of the mesh in the cylindrical phantom was Nm = 26 × 17 × 26 = 11492 occupying 22 × 13 × 22 mm3, while for the mouse it was Nm = 21 × 20 × 20 = 8400 occupying 20 × 13.3 × 19 mm3. For every source-detector (s-d) combination, the contribution/weight of each mesh point m to the fluorescence intensity detected at d was calculated by modeling the photon propagation using the n-Born
#139767 - $15.00 USD Received 16 Dec 2010; revised 1 Mar 2011; accepted 7 Mar 2011; published 16 Mar 2011(C) 2011 OSA 1 April 2011 / Vol. 2, No. 4 / BIOMEDICAL OPTICS EXPRESS 892

approximation [7]. The normalized data nBU were connected with the unknown fluorophore
concentration C with the linear equation
( ) ( ) ( )n m n mnBU W C (1)
where, m are the mesh points, n are the measurements, ( )m nW is the m n weight matrix
describing the contribution of each voxel to the signal measured at each detector, which is a function of the optical properties of the object. We used the diffusion approximation in the radiation transfer equation [27], where the diffuse photon density wave in an infinite medium at a distance r from a point source is described in terms of Green’s functions
1
exp aG rr D D
(2)
where D is the diffusion coefficient 1
3 a s
D
, a is the absorption coefficient, and
s is the reduced scattering coefficient. Each element of the weight matrix is calculated from
, , , ,
, ,
e e f fsm a s md a s
sd n nsd a s
G r G rW
G r
(3)
where smr , mdr , and sdr are the distances between source (s), mesh (m), and detector (d)
points respectively, and a and s
are the absorption and scattering coefficients at the
excitation ( e ), fluorescence ( f ), and normalization ( n ) wavelengths. Contrary to the
formulation of the forward model in the NIR application, the Green’s functions modeling the light propagation were calculated: (a) at 593 nm for the source-mesh point pair (Gsm), (b) at either of the spectral bins of the emission for the mesh-detector pair (Gmd), and c) at 635 nm for the source-detector pair Gsd. The values of the optical coefficients used were a combination of those reported in various papers [28–31] and values not available for some wavelengths were projected or interpolated. For the head, 15 to 12 cm1 was used for μs and 0.8 to 0.2 cm1 for μa in the 593 – 650 nm spectral range, and correspondingly for the phantom 13.6 - 12.5 cm1 for μs and 0.3 - 0.09 cm1 for μa.
In the reconstruction of the multispectral data set an extra dimension was added in Eq. (2) for the k spectral regions multispectral measurements:
1 1
2 2
( ) ( )
( ) ( )( )
( ) ( )
k k
n m nnb
n m nnb m
n m nnb
U W
U WC
U W
(4)
The U vector has n k elements, the weight matrix has m n k elements, and the C vector has still m elements. Among the different spectral bands, the elements of the weight matrix share the same optical properties for the source-mesh and the source-detector Greens’ functions, but have different values for the mesh-detector pairs.
The inversion of Eq. (2) is performed simultaneously with all the wavelengths using a random algebraic reconstruction technique (ART) after 50 iterations. ART was implemented in two ways: Firstly, the rows of each wavelength are separated into different classes and the
#139767 - $15.00 USD Received 16 Dec 2010; revised 1 Mar 2011; accepted 7 Mar 2011; published 16 Mar 2011(C) 2011 OSA 1 April 2011 / Vol. 2, No. 4 / BIOMEDICAL OPTICS EXPRESS 893
ART accessed all the rows of each class in random order, before proceeding to the next class. Secondly, all the rows were included in a single class which was accessed in random order. There was no significant difference in the results between the two approaches. Finally, an extra dimension was added to include the different projections, which was accessed in a sequential order outside the two access schemes described before. The total reconstruction time including the surface rendering is approximately 3 mins, in a Core 2 Duo system with 4 GB RAM. A typical multispectral weight matrix calculation and inversion lasted 5-10 mins.
2.9. MR imaging
MRI was performed in a Bruker Pharmascan 4.7T scanner (Brucker Biosciences, Billerica, MA) with the mice (n = 3) being anesthetized with 1% isoflurane-oxygen mixture, and injecting 0.6 μmol/g gadopentetate dimeglumine (Gd-DTPA) contrast agent (Magnevist, Schering, Berlin, Germany) via tail vein injection [32]. A series of axial and coronal T1-weighted and T2-weighted scans where acquired pre- and post-Gd-DTPA tail-vein injection, to verify the high uptake from the tumor. All scan sequences were acquired with 256x256 resolution, 20 slices with a 0.6 mm slice thickness, and a 36x36 mm2 and 25x25 mm2 field of view for the axial and coronal scans, respectively. The number of images averaged (NEX) was 8. T1-weighted scan parameters were TR = 873 ms, TE = 18 ms, and in T2-weighted, TR = 3514 ms and TE = 63 ms. The total imaging time per mouse was 45 minutes.
2.10. Implementation outline
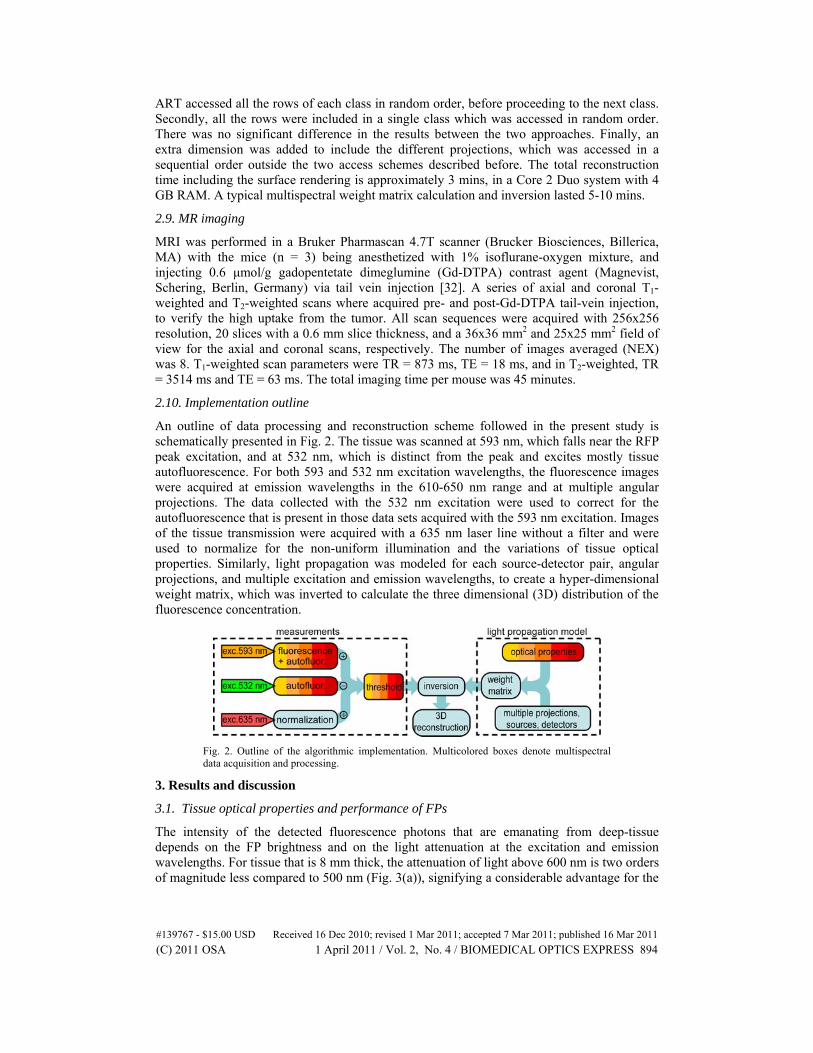
An outline of data processing and reconstruction scheme followed in the present study is schematically presented in Fig. 2. The tissue was scanned at 593 nm, which falls near the RFP peak excitation, and at 532 nm, which is distinct from the peak and excites mostly tissue autofluorescence. For both 593 and 532 nm excitation wavelengths, the fluorescence images were acquired at emission wavelengths in the 610-650 nm range and at multiple angular projections. The data collected with the 532 nm excitation were used to correct for the autofluorescence that is present in those data sets acquired with the 593 nm excitation. Images of the tissue transmission were acquired with a 635 nm laser line without a filter and were used to normalize for the non-uniform illumination and the variations of tissue optical properties. Similarly, light propagation was modeled for each source-detector pair, angular projections, and multiple excitation and emission wavelengths, to create a hyper-dimensional weight matrix, which was inverted to calculate the three dimensional (3D) distribution of the fluorescence concentration.
Fig. 2. Outline of the algorithmic implementation. Multicolored boxes denote multispectral data acquisition and processing.
3. Results and discussion
3.1. Tissue optical properties and performance of FPs
The intensity of the detected fluorescence photons that are emanating from deep-tissue depends on the FP brightness and on the light attenuation at the excitation and emission wavelengths. For tissue that is 8 mm thick, the attenuation of light above 600 nm is two orders of magnitude less compared to 500 nm (Fig. 3(a)), signifying a considerable advantage for the
#139767 - $15.00 USD Received 16 Dec 2010; revised 1 Mar 2011; accepted 7 Mar 2011; published 16 Mar 2011(C) 2011 OSA 1 April 2011 / Vol. 2, No. 4 / BIOMEDICAL OPTICS EXPRESS 894

use of RFPs over GFP (Fig. 3(b)) [21]. In order to experimentally compare the performance of these FPs, 106 human glioblastoma cells stably expressing GFP (U87dEGFR-GFP), the RFP mCherry (U87dEGFR-mCherry), as well as U87dEGFR cells not expressing any FP and serving as controls, were placed (in small capillary tubes) into the esophagus of a euthanized mouse, and the fluorescence was measured in transillumination geometry. The cells in the esophagus were located 8 mm away from the dorsal side and 4 mm from the ventral side, and the mouse was imaged in transillumination twice, once for each direction (dorsal to ventral and ventral to dorsal), in order to have two different location geometries of the cells. The recorded signals are presented in Fig. 3(c) and are normalized for the laser power, filter transmittance, and camera integration time. mCherry exhibited superior performance since the detected intensities were 7-200 times brighter than GFP. Signal intensity, however, was variable and depended on two factors: a) the excitation and emission wavelengths, i.e. the longer the wavelength, the lower the attenuation of signals from the tissue; and b) the location of the fluorescence activity, i.e. when the mCherry-expressing cells were closer to the illumination source the signal became stronger. The latter can be attributed to the higher tissue absorption at the excitation compared to the emission wavelength, and consequently, for a given total tissue thickness (in this case 12 mm), the shorter the excitation path, the brighter the signal. The GFP signal was independent of the location since the optical properties for the excitation and the emission wavelengths are similar (Fig. 3(c)).
Fig. 3. Characteristic fluorescence and autofluorescence emission curves in deep tissue imaging. (a) In vivo relative spectral attenuation of light transmitted through 8 mm thick mouse tissue (upper left torso). Arrows indicate key wavelengths: blue – GFP excitation at 488 nm, green – GFP emission at 514 nm, orange – RFP excitation at 593 nm, and red bars – RFP emission 610-650 nm. The red arrow indicates the laser wavelength used for the calculation of the n-Born ratio. (b) normalized absorption and emission spectra for GFP and mCherry, (c) Normalized fluorescence of 106 U87dEGFR glioblastoma cells expressing FPs from deep tissue in transillumination mode. The orange shaded area indicates the intensity range of mCherry emission. The mCherry RFP emission was significantly higher when cells were closer to the excitation source (orange triangles pointing upward), than when they were closer to the detector (orange triangles pointing downward). GFP emission (cyan square) was essentially independent from the position. Black squares and lines indicate the autofluorescence intensity (control cells) and green squares and triangles show the emission of mCherry when excited at 532 nm. Data were normalized for relative FP brightness. (d) In vivo normalized autofluorescence emission in transillumination of 12 mm thick mouse tissue (upper center torso) when excited at 6 different laser lines ranging from 488 - 750 nm (see color legend). The measurements were normalized for spectral window bandwidth, laser power, exposure time, i.e. units are photon counts.nm1mW1.s1. The continuous lines are spline interpolations.
#139767 - $15.00 USD Received 16 Dec 2010; revised 1 Mar 2011; accepted 7 Mar 2011; published 16 Mar 2011(C) 2011 OSA 1 April 2011 / Vol. 2, No. 4 / BIOMEDICAL OPTICS EXPRESS 895

Additionally, the background autofluorescence of tissue was measured by replacing the FP-expressing cells with the wild type glioblastoma cells. The most striking and unexpected finding was that autofluorescence increased for longer wavelengths (Fig. 3(c)). This finding is in direct contrast to the well-established notion that autofluorescence decreases with longer excitation and emission wavelengths [33,34], but this is valid only for reflectance measurements. These findings were also verified by in vivo measurement of tissue autofluorescence in transillumination geometry, using a series of excitation and emission wavelengths (Fig. 3(d)). The reason that autofluorescence in transillumination geometry increases for longer excitation and emission wavelengths is that tissue absorption is lower at longer wavelengths (Fig. 3(a)). As a result, the propagating autofluorescence photons are more attenuated at shorter rather than at longer wavelengths. It appeared that the autofluorescence spectral profiles excited at 593 and at 532 nm were relatively similar. Finally, the autofluorescence excited at 593 nm (Fig. 3(c), black line) was also similar to the signal obtained for mCherry-expressing cells excited at 532 nm (Fig. 3(c), green line), far from the excitation peak.
3.2. Tissue autofluorescence removal, multispectral normalized Born ratios, and signal reconstruction
We took advantage of the similar autofluorescence profiles at 532 nm and 593 nm in order to subtract the autofluorescence from the raw fluorescence images. As an example, raw transillumination images from a single projection of a mouse’s head containing brain tumor expressing mCherry are presented in Fig. 4. In the fluorescence image depicted in Fig. 4(a), there was increased signal from the left side of the cranium (where the tumor was injected) but there was also additional signal emanating from both sides. The autofluorescence image (Fig. 4(b)) primarily contains this additional signal that was subtracted to produce an autofluorescence corrected image (Fig. 4(c)), in which the signal coming outside the tumor area was eliminated (see Fig. 4 Media 1 for all angular projections).
Fig. 4. Autofluorescence subtraction and normalization of raw transillumination images from a mouse head (dorsal view) with tumor expressing mCherry. – (Media 1) (a) Fluorescence image
flU at 620 nm when excited at 593 nm, (b), Autofluorescence image
auU at 620 nm excited at
532 nm, (c), Correction with autofluorescence subtraction fl au
U aU , (d) Normalization
image of the head of the mouse at 635 nm, (e) n-Born ratio n
U (cyan) overlaid on the
reflectance image of the head (grayscale). (g) Autofluorescence corrected n-Born ration
U
overlaid on the reflectance image. (f) and (h) Density plots of all the uncorrected and corrected measurements, respectively, when each fluorescence pixel value is plotted vs the corresponding normalization pixel value (arbitrary units).
#139767 - $15.00 USD Received 16 Dec 2010; revised 1 Mar 2011; accepted 7 Mar 2011; published 16 Mar 2011(C) 2011 OSA 1 April 2011 / Vol. 2, No. 4 / BIOMEDICAL OPTICS EXPRESS 896
Based on the established normalization scheme for FMT [7], the fluorescence measurements flU should be divided with the corresponding transillumination measurements
nU acquired at the excitation wavelength to correct (or normalize) for the illumination and the
tissue inhomogeneities. However, free space acquisition of the transillumination images nU at
the excitation wavelength (593 nm) is problematic due to the high tissue absorption and the low signal-to-stray-light ratio in the free-space transillumination geometry. It is therefore unsuitable for normalization. We addressed this problem with the acquisition of an additional normalization image nU using a 635 nm diode laser instead. This wavelength falls in the
middle of the fluorescence acquisition range (610-650 nm), and light attenuation from 8mm-thick tissue is 400 times lower than 593 nm (Fig. 3(a)). We had also tested normalization with a 650 nm laser, but the results were not as good as with the 635 nm. The autofluorescence-corrected and normalized images are calculated for all filter set combinations by the formula
0fl au
nBn
U aUU
U
(5)
where the scaling parameter a. Ideally, a should be such that the virtual detector values do not become negative after subtraction. However, the autofluorescence photon spatial distribution as imaged at 532 nm excitation is very similar, but not identical, to the corresponding distribution when excited at 593 nm, mostly due to the mismatch of optical properties of tissue for the excitation path between these wavelengths. In order to accommodate for this difference in autofluorescence spatial distribution, we have empirically defined that when the value of a is such that 20% of the virtual detector values used in the reconstruction become negative then the autofluorescence is efficiently subtracted. The negative values are excluded from the reconstruction. The subtraction affects mostly the data with the lowest n-Born values, that are the less important for the reconstruction of the fluorescence. The autofluorescence excited by 635 nm is insignificant, and therefore it is not necessary to correct the normalization image. The normalized images nBU for 0a and for 1.0a (when 20%
of nBU is negative) are presented in Fig. 4(e) and 4(g), respectively. In the corrected and
normalized image (Fig. 4(c)), the maximum photon intensity is congruent to the anatomical position of the tumor implantation, while autofluorescence has been effectively eliminated. Finally, the distribution plots of the fluorescence intensity flU versus normalization intensity
nU are plotted on a pixel-by-pixel basis for all angular projections in Figs. 4(f) and 4(h), for
0a and 1.0a , respectively (see also video for all angular projections). It can be seen that the original pixel distribution (when 0a ) is unrealistically confined to a small area with high fluorescence values due to the unsubtracted background autofluorescence. However, after subtraction, the intensities are more evenly distributed occupying a larger dynamic range, which increases the diversity of the experimental data set and improves reconstruction.
In order to tomographically reconstruct the fluorescence activity, the examined volume was discretized in a mesh grid of Nm mesh points. For every source-detector (s-d) combination, the contribution/weight of each mesh point m to the fluorescence intensity detected at d was calculated by modeling the photon propagation using the n-Born approximation [7]. Contrary to the almost constant optical properties of tissue in NIR, at which diffuse and fluorescence tomographies have been developed to work, the absorption coefficient changes dramatically in the 590-650 nm region (Fig. 3(a)), thus increasing the diversity of the multispectrally acquired data set. When these changes are incorporated in the forward light propagation model, the ill-posedness of the inverse problem is reduced and the solution is constrained [35–37]. We introduce a 3-wavelength n-Born ratio (Fig. 5(a)) where (a) light propagation from source to meshpoint is modeled using the optical properties of
#139767 - $15.00 USD Received 16 Dec 2010; revised 1 Mar 2011; accepted 7 Mar 2011; published 16 Mar 2011(C) 2011 OSA 1 April 2011 / Vol. 2, No. 4 / BIOMEDICAL OPTICS EXPRESS 897

tissue at 593 nm, (b) light propagation from mesh point to detector using each of the multispectral wavelengths from 610 to 650 nm, and (c) light propagation from source to detector using the ones at 635 nm. The multispectral forward equation was assembled by stacking all single-spectral measurements and weight functions to create a multispectral weight matrix that was inverted to reconstruct the 3D distribution of the fluorescence activity.
Fig. 5. Multispectral fluorescence tomography reconstruction. (a) Schematic of the 3-wavelength n-Born ratio calculation. Here, s, m, and d are the source, mesh, and detector positions, respectively. Gsm, Gmd, and Gsd are the Green’s functions that model the corresponding propagating photon fields between s, m, and d. (b) Drawing of the cross section of the phantom containing 1% Intralipid and 1% whole blood. Small circles indicate the position of the two tubes containing 15 and 60 pmol of Texas Red fluorochrome. (c) A 3D view of the surface of the phantom with the positions of the sources (red crosses) and the detectors (blue circles) as projected on the surface. (d) Selected axial slices of the 3D single- and multi-spectral reconstructions of the fluorescence concentration (arbitrary units) of the two tubes inside the phantom. Black discs indicate the cross section of the phantom. (b) and (d) are on the same scale.
The reconstruction algorithm was tested by imaging a tissue mimicking cylindrical agar phantom containing 1% Intralipid and 1% whole blood. Two tubes of 1 mm diameter, containing 60 and 15 pmol of TexasRed (Sigma-Aldrich), which has similar absorption and emission characteristics to the RFPs, were enclosed inside the phantom (Fig. 5(b)). The actual fluorescence intensity ratio of the straws as measured immediately before their insertion in the phantom was 3.7. In Fig. 5(d), a comparison of the reconstructed fluorescence distribution is presented, using the single-wavelength data sets separately and the combined multispectral data set and inversion. The multispectral reconstruction improved performance over the single-wavelength both in terms of accuracy in localizing the tubes and in quantization. The ratio of the fluorescence between the two tubes ranges between 4.6 and 5.9 (23-59% error) for the single-wavelength reconstructions, compared to 3.4 (8% error) for the multispectral. Finally, with the single spectral reconstructions the sizes (FWHM) of the reconstructed tubes ware ranging between 4.2 and 4.5 mm and 3-3.5 mm for the 60 and 15 pmol respectively, and with the multispectral reconstructions improved to 3 and 2.2 mm respectively.
3.3. Fluorescence tomography of mCherry-expressing brain tumors in mice
To test the performance of the fluorescent protein tomography in vivo, we employed a mouse brain-tumor model in which U87dEGFR human glioblastoma cells expressing mCherry were stereotactically implanted in the left brain hemisphere. Figure 6 depicts the results of the reconstructed fluorescent cells implanted at a depth 3.5 mm from dura. The surface of the head, the geometry of the sources (red) and the virtual detectors, as well as the location of a selected axial plane (slice 3) are depicted in Fig. 6(a). From the comparison of the
#139767 - $15.00 USD Received 16 Dec 2010; revised 1 Mar 2011; accepted 7 Mar 2011; published 16 Mar 2011(C) 2011 OSA 1 April 2011 / Vol. 2, No. 4 / BIOMEDICAL OPTICS EXPRESS 898

reconstructed fluorescence at slice 3 (presented in Fig. 6(c)), it is evident that the multispectral reconstruction improves localization and size accuracy and reduces artifacts. The accuracy of localization and size can be also verified by the fluorescence tomographic and comparative magnetic resonance (MR) images in Fig. 6(d) and 6(e), respectively. Overall, there was excellent congruence in the localization of the tumor activity when compared with MR or thin cryosection slices in all viewing directions. When we did not apply autofluorescence subtraction, the mCherry signal was still reconstructed in the correct place and head similar value, however there were also artifacts in the image. For changes of 10-20% to the scaling parameter a the morphology of the reconstructions and the values practically remained the same; the changes in the peak values were approx. 1-2%. The reason is that autofluorescence subtraction affects mostly the low normalized Born ratio values, which are mostly responsible for the artifacts The high performance of the reconstruction scheme is attributed to use of the autofluorescence subtraction, the multispectral reconstruction, and, above all, to the use of data acquired using 360-degrees angular projections.
Fig. 6. Representative example of intracranial U87dEGFR-mCherry glioblastoma reconstruction. (a) A 3D view of the surface of the mouse’s head, sources (red crosses) and detectors (blue circles) are projected on the surface. The black rectangle indicates the position of the axial slice 3. (b) A fluorescence epi-illumination image of histological section (slice #3) of the brain, blue – reflectance image at 593 nm, magenta – mCherry fluorescence emission at 620 nm when excited at 593 nm. (c) Single- and multi-spectral reconstructions of the mCherry fluorescence at the axial slice #3. (d) A series of axial slices of the mCherry tumor reconstructed fluorescence, and (e) Corresponding post-Gd-DTPA enhanced axial slices from the T1-weighted MRI series. Orange arrows indicate the position of the glioma. Colorbar for (c) and (d) is in arbitrary units. Dashed lines in (c) and (d) are visual guides to indicate the brain area.
4. Conclusions
According to model-based calculations [21], and measurements in this work, switching from GFP to the RFPs and utilizing optimum excitation wavelengths, yields an increase of over two orders of magnitude in the detected fluorescence emanating from deep-tissue. In addition, the recently developed IFP isolated from the bacteriophytochrome Deinococcus Radiodurans [20], is highly suitable for tomograpic imaging, since the excitation and emission peaks (684 and 708 nm) fall in the lower plateau of the tissue absorption. According to a simple simulation (similar to Ref. [21].) of the intensity of the IFP signal emanating from deep tissue, the improvement over RFPs is expected to be another order of magnitude. Regarding the detection limit, the background to which the FP signals are compared, is not the intrinsic noise
#139767 - $15.00 USD Received 16 Dec 2010; revised 1 Mar 2011; accepted 7 Mar 2011; published 16 Mar 2011(C) 2011 OSA 1 April 2011 / Vol. 2, No. 4 / BIOMEDICAL OPTICS EXPRESS 899

of the imaging system, but rather the level of autofluorescence, which eventually becomes the major limiting factor. From this stance, the improvement in switching from GFP to RFPs and IFP in transillumination geometries is compromised, since at longer wavelengths, the autofluorescence increases in addition to the fluorescence (Fig. 3(d)). From the measurements in Fig. 3(c), the signal-to-autofluorescence ratio (SAR) is 5 for GFP and ranges between 1.5 and 30 for mCherry depending on the wavelength and the location of the mCherry cells; according to simulations the SAR of IFP is expected to be equivalent to that of mCherry. The key-solution to increase the performance and to lower the detection limit of FMT is to effectively remove the autofluorescence using spectral subtraction/unmixing, either in the excitation or the emission wavelength domain. Technically, this is much easier to achieve with the RFPs and IFP, since the overall acquisition duration for multispectral data sets in the red and in the infrared part of the spectrum is a 2-3 orders of magnitude faster than the one in the visible. For bigger tumors the SAR would increase proportionally for both GFP and mCherry, affecting the detection limits of both proteins. Detection sensitivity is an important aspect, but accurate tomographic reconstruction is even more important. Free-space multiple-projection data acquisition, which is critical for accurate reconstructions, is practically impossible bellow 600 nm, because the fidelity of the normalization images is compromised by stray light and the highly biased light transmission under the skin.
In summary, we have combined multispectral 360-degrees sampling technologies and efficient autofluorescence subtraction schemes with the use of RFPs and we have demonstrated that the resulting tomographic modality is capable of reconstructing the fluorescence activity of RFPs with high spatial accuracy. We have used this system to image deep-seated brain tumors expressing the RFP mCherry, and found it to be congruent with corresponding MR imaging. Further efforts should be directed toward autofluorescence subtraction/unmixing that would be beneficial for the NIR tomographic imaging as well. The tomographic imaging of RFPs and IFPs in whole-body scale can reveal functional information that is otherwise invisible. Improvements in these techniques will accelerate discoveries associated with functional genomics, stem cell research and systems biology.
Acknowledgments
We thank Claudio Vinegoni, Jason Gaglia, Diane Mathis, and Christophe Benoist for many helpful discussions and Jenny Chan for the MR imaging. The research was supported by the National Institutes of Health grants R01EB004382, P50CA86355, U24CA092782 and a Marie Curie Intra-European Fellowship within the 7th European Community Framework Programme.
#139767 - $15.00 USD Received 16 Dec 2010; revised 1 Mar 2011; accepted 7 Mar 2011; published 16 Mar 2011(C) 2011 OSA 1 April 2011 / Vol. 2, No. 4 / BIOMEDICAL OPTICS EXPRESS 900