incident capacity reduction on four- lane · pdf filesubmitted for presentation and ......
TRANSCRIPT
INCIDENT CAPACITY REDUCTION ON FOUR-LANE FREEWAYS USING REAL WORLD DATA PART 2: MULTILANE CLOSURES
Golnush Masghati AmoliBahar ZarinKaveh Farokhi SadabadiMark Franz
Submitted for Presentation and Publication to: 94th Annual MeetingTransportation Research BoardWashington, D.C., 2015

IntroductionWhy are we concerned about quantifying capacity reductions
during incident?• Incident-induced capacity ≠ physical reduction in roadway space
caused by the incident
• Capacity Reduction during incidents Delay and Queuing.
• 1 minute freeway travel lane closure during peak use ≅ 4 minutes ofdelay after the incident is cleared 4.2 billion hours per year indelays.
• Americans burn more than 2.8 billion gallons of gasoline every yearwhile stuck in incident-related traffic.

Conceptual Framework

Background
Author Year DataMethodology
Incident Capacity Non-incident Capacity
Goolsby, M. 1971 Three-lane Freeway Video Recordings
Queue discharge rate during incident
Max flow during peak hour
Smith, B.L., Qin, L., and R.
Venkatanarayana. 2003 Three-lane Freeway
Detector Data
Min of 10 minutemoving average of
bottleneck discharge flow rate
free flow capacity (Absolute peak)
Knoop, V., Hoogendoorn, S.,
and K. Adams 2008
Two-lane FreewayVideo Recording Average Discharge
Flow
standard lane capacities in Netherland’s
Knoop, V., Hoogendoorn, S.,
and K. Adams 2009 Three-lane Freeway
Detector Datamedian of the
discharge flow rate
queue discharge rate measured under normal
conditions
Lu, C., and L. Elefteriadou. 2013 Two-lane Freeway
Detector Data
moving average of downstream flow
with 10-minute lag
average flow over 10 minutes
before breakdown

Background
Number of Lanes (One Direction)
ShoulderDisablement
ShoulderAccident
One Lane Blocked
Two Lanes Blocked
Three Lanes Blocked
2 0.95 0.81
0.68-0.77
0.35 0.47-0.500.46-0.50
0.000.13-0.14
N/A
3 0.99 0.52
0.83 0.74 0.72
0.49 0.50 0.36 0.37
0.40-0.43
0.17 0.21 0.18 0.23
0.29-0.32
0.00
4 0.99 0.85 0.58 0.25 0.13
5 0.99 0.87 0.65 0.40 0.20
6 0.99 0.89 0.71 0.50 0.26
7 0.99 0.91 0.75 0.57 0.36
8 0.99 0.93 0.78 0.63 0.41
TABLE 1 Comparison of Percent Freeway Capacity Available under Incident Conditions from Different Studies

Objectives1. Develop a new methodology to measure sustainable flow
rates during incidents using real world data.2. Measure Available Capacity Ratio during incidents on four-
lane freeways.3. Compare the estimated values with the ones reported in
HCM.4. Investigate if driver behavior changes with a change in lane
closure pattern.
• More than 80% of US Interstate System mileage is allocated to Four-lane freeways!!!
• No published work on four-lane highways except HCM
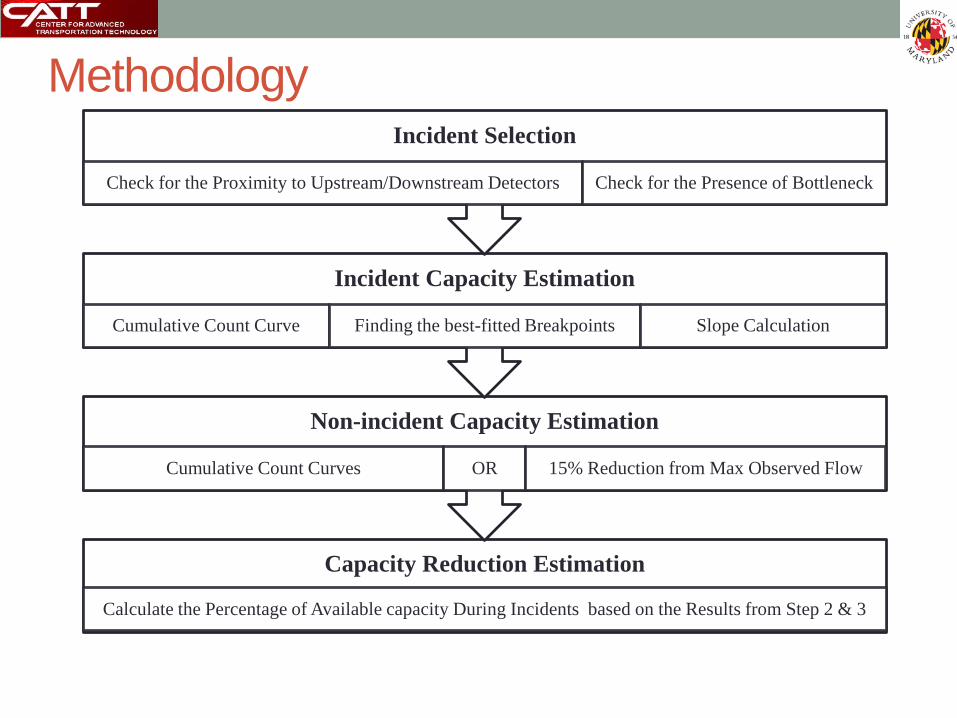
Methodology
Capacity Reduction Estimation
Calculate the Percentage of Available capacity During Incidents based on the Results from Step 2 & 3
Non-incident Capacity Estimation
Cumulative Count Curves OR 15% Reduction from Max Observed Flow
Incident Capacity Estimation
Cumulative Count Curve Finding the best-fitted Breakpoints Slope Calculation
Incident Selection
Check for the Proximity to Upstream/Downstream Detectors Check for the Presence of Bottleneck

Incident Selection• Proximity to Traffic Detectors
• Only incidents within maximum one-mile distance from upstream and downstream detectors (without any on-ramp or off-ramp in between) were considered for analysis.
• Active Bottlenecks• Incidents were checked for the existence of an active bottleneck
formed as a result of lane closures.
UpstreamSpeed < 45 mph
DownstreamSpeed > FFS-10 mph

Incident Capacity EstimationCumulative Counts Concept• To avoid difficulties in dealing with random variations in vehicle
counts, incident capacity was estimated as the slope of the downstream detector’s cumulative counts.

• Smooth out random variations in flow• Challenge???? identify the best-fitted breakpoints
0
20
40
60
80
100
120
140
44000
46000
48000
50000
52000
54000
56000
58000
60000
13:45 14:00 14:15 14:30 14:45 15:00 15:15 15:30 15:45 16:00Ve
hicl
e pe
r min
ute
per z
one
Cum
ulat
ive
coun
ts Cumulative Counts @Downstream DetectorFlow
Incident Capacity EstimationCumulative Counts Concept

• The best-fitted breakpoints on the cumulative counts curve werefound by fitting a Broken Stick Piecewise Regression OptimizationModel to the downstream count data.
• Model input:1. Vehicle cumulative counts yi together with their corresponding time
stamps xi in the form of a set of ordered pair (xi, yi) points, i=1,…,m,2. Desired number of breakpoints p
• Model output1. Coordinates of the best-fitted breakpoints (Xk, fk), k = 1, …, p2. Slopes, bk, of each fitted segment of the piecewise line
Incident Capacity EstimationFitting Breakpoints

• Let p=number of breakpoints (p=1), and ∆Xk,k+1 = Xk+1-Xk time difference between any two consecutive breakpoints,
• While ∆Xk,k+1 >10 minutes• Run the heuristic to fit the PW lines to the cumulative curve;• Increment p;
• End;• Reduce cluster of constant breakpoints (time difference Xk-Xk'<5
min, for all k and k') to a single critical point by taking the average of all cluster points;
Incident Capacity EstimationFitting Breakpoints Algorithm
• Let S= slope of the cumulative curve between any two breakpoints,• For i= 1 to n (total number of segments)
• If ∆Xk,k+1<10 minutes• If both breakpoints are critical points,
• then, report the slope as capacity;• else, disregard it;
• End;• else,
• If there is any breakpoint between two critical points dividing the segment between them to two segment,• If |S1-S2|/S1< 0.10,
• then, report average of S1 and S2 as capacity;• else, report the minimum of S1 and S2 as capacity;
• End;• else, report the slope between two critical points as capacity• End;
• End;• End;
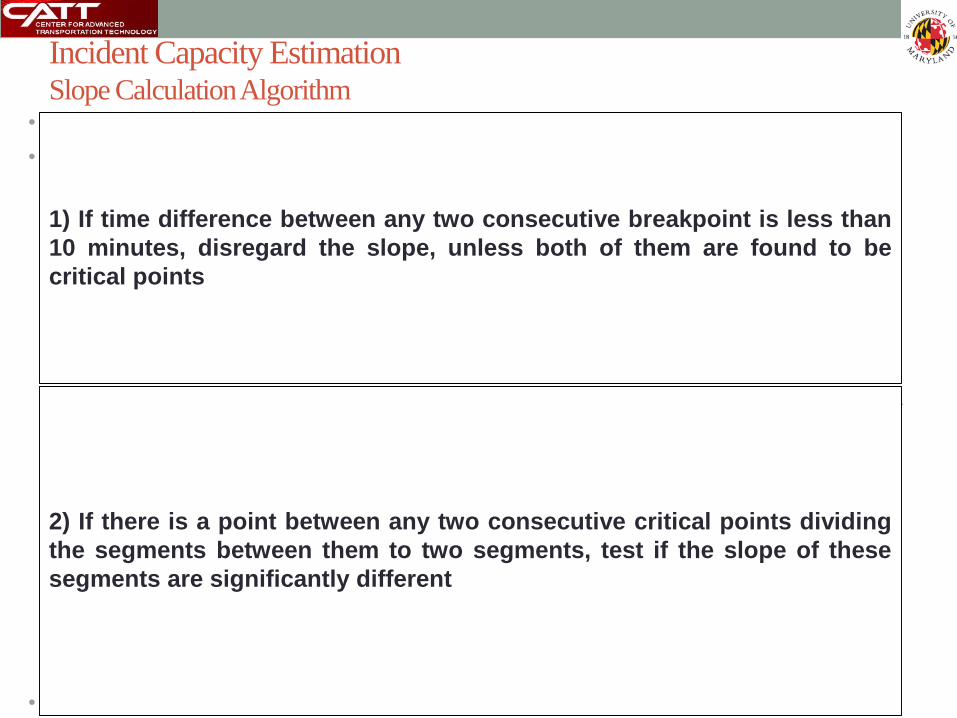
Incident Capacity EstimationSlope Calculation Algorithm
1) If time difference between any two consecutive breakpoint is less than10 minutes, disregard the slope, unless both of them are found to becritical points
2) If there is a point between any two consecutive critical points dividingthe segments between them to two segments, test if the slope of thesesegments are significantly different

Incident Capacity EstimationSlope Calculation Algorithm

Non-Incident Capacity Estimation• Two different approaches:
1. The slope of the cumulative counts curve of the flow at the downstream detector, if bottleneck still existed after the incident was cleared
2. Subtracting 15% from the maximum observed flow at downstream detector over a week before and a week after the incident, otherwise.
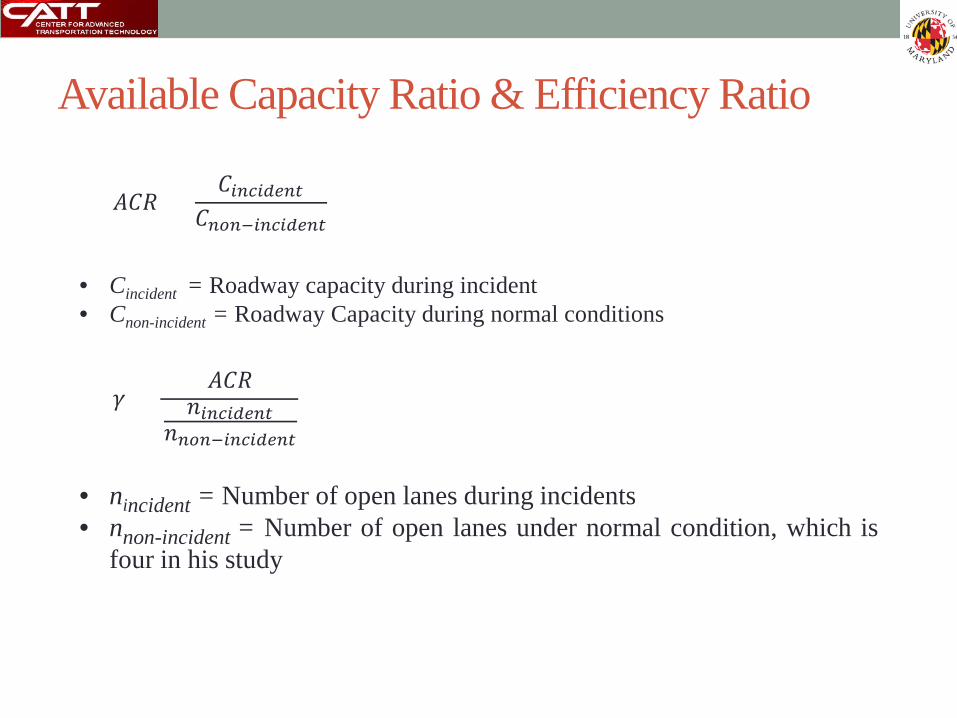
Available Capacity Ratio & Efficiency Ratio
• nincident = Number of open lanes during incidents• nnon-incident = Number of open lanes under normal condition, which is
four in his study
𝐴𝐴𝐴𝐴𝐴𝐴 =𝐴𝐴𝑖𝑖𝑖𝑖𝑖𝑖𝑖𝑖𝑖𝑖𝑖𝑖𝑖𝑖𝑖𝑖
𝐴𝐴𝑖𝑖𝑛𝑛𝑖𝑖−𝑖𝑖𝑖𝑖𝑖𝑖𝑖𝑖𝑖𝑖𝑖𝑖𝑖𝑖𝑖𝑖
𝛾𝛾 =𝐴𝐴𝐴𝐴𝐴𝐴
𝑛𝑛𝑖𝑖𝑖𝑖𝑖𝑖𝑖𝑖𝑖𝑖𝑖𝑖𝑖𝑖𝑖𝑖𝑛𝑛𝑖𝑖𝑛𝑛𝑖𝑖−𝑖𝑖𝑖𝑖𝑖𝑖𝑖𝑖𝑖𝑖𝑖𝑖𝑖𝑖𝑖𝑖
• Cincident = Roadway capacity during incident• Cnon-incident = Roadway Capacity during normal conditions

Data• Incident Data
• Obtained from the Coordinated Highways Action Response Team(CHART) for a period of six years from January 2008 to May 2014.
• Only incidents during peak hours were considered.• Only focused on two of Maryland major four-lane interstate freeways:
Capital Beltway (I-495), and the I-95 corridor between Washington, D.C.and Baltimore.
• In total 32 incidents was selected from five different locations.
• Traffic Data• Downstream detector data was accessed through detector query tools in
RITIS.• Occupancy, speed, and vehicle count data was avilable at one-minute time
intervals on both lane-by-lane and overall zone basis.

Type of Blocking Shoulder Disablement
Shoulder Accident 1 out of 4 2 out of 4 3 out of 4
Mean(Cnon-incident) 1800 vphpl 1800 vphpl 1800 vphpl 1800 vphpl 1950 vphpl
Mean(Cincident) 1550 vphpl 1450 vphpl 1300 vphpl 650 vphpl 350 vphpl
ACR
Mean 0.91 0.88 0.71 0.36 0.17
Std. Dev. 0.046 0.065 0.054 0.057 0.05
HCM (1) 0.99 0.85 0.58 0.25 0.13
Efficiency Ratio 0.91 0.88 0.94 0.72 0.68
Number of Cases 3 7 13 5 4
Target Sample Size 3 6 4 4 4
Z Value -3.012 1.221 8.680 4.315 2.162
Test Result on Null Hypothesis*
Is Rejected Is Accepted Is Rejected Is Rejected Is Rejected
Result
𝑁𝑁 = (𝑍𝑍𝛼𝛼/2 × 𝜎𝜎
𝐸𝐸 )2

0
0.1
0.2
0.3
0.4
0.5
0.6
0.7
0.8
0.9
1
ShoulderDisablement
ShoulderAccident
1 out of 4Blocked
2 out of 4Blocked
3 out of 4Blocked
Available Capacity RatioEfficiency Ratio
Result
Conclusion• Estimated available capacity ratio during incidents were significantly different
from HCM, except for shoulder closure scenarios.
• Capacity reduction during incidents were found to be not only because of the lessnumber of available lanes but also due to a change in driving behavior.
• The efficiency of the road being used during shoulder and one lane closureincident cases is the same at 95% level of confidence which is conflicting withKnoop’s findings.
• The same efficiency factor for two lanes blocked and three lanes blockedscenarios indicates that they both lead to similar impacts on behavior of trafficresult in a smaller relative drop in capacity where two lanes blocked is changed tothree lanes blocked.

Contribution• With the new developed algorithm the challenges in dealing with random
variation in vehicle counts was solved and sustainable discharge flow rates weremeasured using real world traffic data.
• The first study investigating the effect of incidents on four-lane freeways usingreal world data.
• Accurate information on the available road capacity during incident can be used by authorities in their incident management decisions.
• This may include decisions on rerouting the traffic or potentially changing the road closure patterns to provide maximum possible capacity of the roadway under prevailing traffic conditions.
• The reduced capacity estimates can also be used in delay calculations which in turn can be used to inform the travelers about the delay they should anticipate as a result of a particular incident with known number of lanes closed.

Thank You!